1. Introduction
For new or upgraded high head power plants, transient analysis is often an important part of the scope. This analysis gives information regarding maximum pressure in the penstock, minimum pressure in the draft tube and maximum overspeed during load rejection. Also, the system’s response to ramping of load, transient response of the governor and stability can be investigated with appropriate software.
Today’s software covers most of the needs regarding analysis of the dynamic system, but lack of information regarding the turbine in an early stage of a project will necessitate an analytical approach with respect to turbine modeling.
Nielsen [
1,
2] presented a simple analytical model for high head Francis turbines in 1991 and an improved version suitable for reversible pump-turbines in 2010. The model requires a minimum of input data and has proven good accuracy with measured data.
The analytical model has a one-dimensional approach making it challenging to model the highly three dimensional flow through a reversible pump-turbine. These machines have steep flow-speed and torque-speed characteristics, commonly known as S-shaped curves. Vortex formations and backflow regions in the turbine are shown both numerically and experimentally to be the cause of these curves [
3,
4,
5,
6], and when combining these characteristics with a hydraulic system unstable behavior can occur [
7].
Pump-turbine instabilities often occur during start-up in turbine mode and possible off-design operation and several solutions have been proposed to avoid operational problems. Klemm [
8] suggested moving two guide vanes separately at COO II, while Dörfler [
9] introduced a solution by throttling the main inlet valve to introduce an artificial head loss at Bhira. Both solutions avoids operation in the area of hydraulic instability without removing the cause of the problem.
Martin [
10,
11] derived a stability criterion for reversible pump-turbines at runaway by using linearized stability analysis on a system with short conduits and no friction. He showed that the stability was dependent on the slope of the unit torque-unit speed curve and that there was a correlation between the ratio of time constant for the water masses in the penstock and the time constant of the rotating masses. Depending on these parameters the system can experience unstable, limit cycles, neutrally stable or periodic damped oscillations. Inelastic calculations of load rejection with the guide vanes remaining fully opened showed that with a positive slope of the unit torque-unit speed at runaway the machine experienced limit cycle or unstable oscillations at runaway. Machines with negative slope of the unit torque-unit speed and unit flow-unit speed at runaway, but still with S-shaped characteristics, showed damped oscillations around runaway.
The dynamic behavior of reversible pump turbines is still not fully understood even though it has been the subject of several publications. This paper contributes to the discussion with a representation of the transient behavior in reversible pump turbines based on laboratory measurements of the dynamic characteristics, which are reproduced in numerical transient analysis utilizing Nielsen’s turbine model. This comparison demonstrates a good correlation between the results from the experiments and the results from the transient simulations. The measurements were performed by initially running a model pump turbine on low rotational speed. The generator was then disconnected allowing the turbine to go towards runaway while guide vane opening and head remained constant. During this sequence the flow rate, torque, pressure and rotational speed was measured. Results from the experiment are presented and discussed.
2. Experimental Setup
2.1. Test Rig
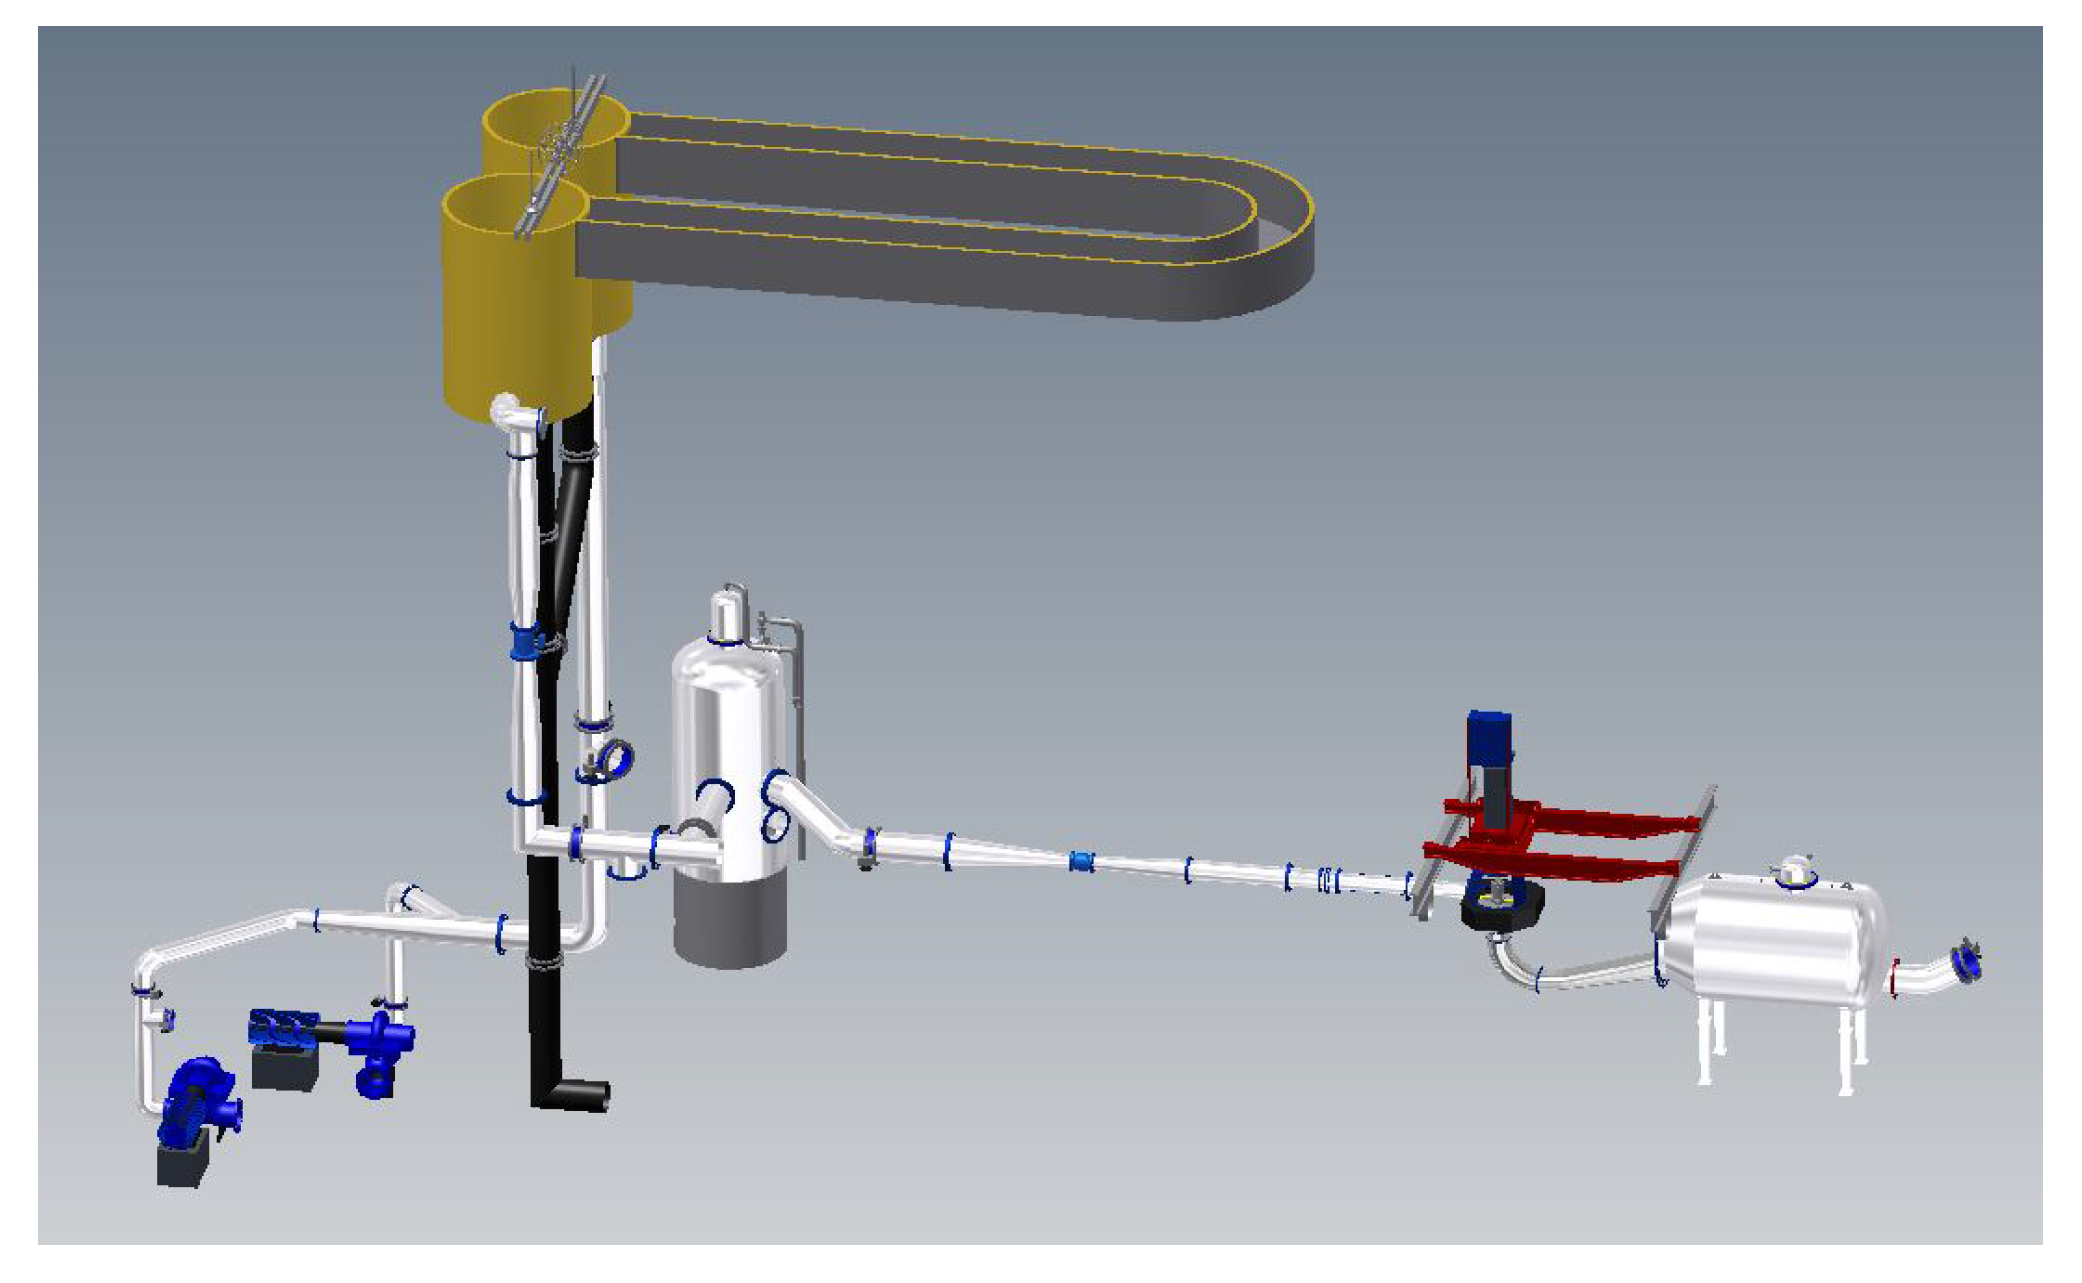
The Francis test rig at the The Waterpower Laboratory at the Norwegian University of Science and Technology (NTNU) has the possiblity to be run in a so called open loop configuration. The laboratory is equipped with two large tanks connected by a weir located upstream the turbine, see
Figure 1. A draft tube tank with an overflow system is installed downstram the turbin. These installations work as an upper and lower reservoir, respectively, with an approximate constant level.
The experiments described in this paper are performed in the open loop system together with a reversible pump-turbine runner installed in an existing Francis turbine rig. The runner is designed by Olimstad [
12] for NTNU with the purpose of investigating stability of pump-turbines.
Table 1 describes the properties of the model turbine.
2.2. Instrumentation
Pressure at the turbine inlet and outlet, rotational speed, torque and flow rate was measured during the experiment. For measuring the pressure at the turbine inlet and outlet, a Fuji Electronics FHCW 36 Ackay transducer was used. The rotational speed was measured with an optical sensor, Jaquet DSR 18200, and the pulse from this instrument was converted to a volt signal with a Jaquet FT 1400 D. A free-floating generator is mounted on the turbine shaft and a level arm connected to a force cell prevents the generator from rotating. The torque is obtained by multiplying the measured force with the length of the arm. The flow rate during steady-state operation was measured with an electromagnetic flow meter of the type Alto SC 100 AS from Krohne.
During the dynamic sequence the change in flow rate was obtained with the pressure-time method. Two absolute pressure transducers, PTX 1400, with a range 0–2.5 bar was mounted upstream the turbine with 3.94 m distance. The change in flow rate at each time step is obtained by integrating the pressure difference,
, between these two transducers with respect to time:
—change in flow rate, []
—cross-sectional area of pipe, []
—length of pipe, [m]
—density of water, []
—time step, [s]
—steady-state friction loss, []
—friction loss coefficient, []
A data acquisition system (NI cDAQ-9172) from National Instruments was used during the measurements. The sample frequency was set to 1613 Hz and the sampling was performed without filtering.
2.3. Test Program
Tests was performed at , , and guide vane opening. Each test were performed by initially running the turbine on low rotational speed. The generator was then disconnected allowing the turbine to go towards runaway speed with the guide vane opening and head remaining constant.
3. Data Processing
3.1. Filtering of Data
A significant amount of noise was registered in the pressure measurements. This is not of relevance for the measurements used for the pressure-time method; however, for presenting the dynamic characteristics with unit properties reduced by net head, the data for pressure at the turbine inlet and outlet had to be filtered. To avoid any issue regarding phase distortion all measurements were run through a filter with the same parameters. A fifth order Butterworth filter with a cut off frequency at 50 Hz was used. FFT-analysis showed that a cut off at 50 Hz would not remove any of the dominating frequencies in the pressure-time measurements as these were located at approximately 0.25 Hz.
3.2. Flow Rate
Deviations from IEC 60041 [
13] for pressure-time measurements was necessary due to constraints in the laboratory, however, as the objective of this experiment was to obtain the shape of the dynamic characteristics the uncertainty of the curves are of secondary importance. The IEC 60041 states that for pressure-time measurements the pressure sensors must be placed at least 10 m apart and the cross sectional area should be constant between the measurement sections. Due to geometrical constraints in the Francis test rig the sensors had to be placed 3.94 m apart and the cross-sectional area in between was not constant. The upstream sensor was mounted at a pipe diameter of 400 mm and was placed directly after a conical pipe. The downstream sensor was placed on a pipe with 350 mm diameter; hence the flow conditions were not optimal. Thus, the value for the effective area, A, in Equation (
1) had to be determined by iteration of the measured data and, due to the flow conditions, this value varied for each measurement. The relative change in flow rate was found by integrating the differential pressure between the two sensors upstream the turbine according to Equation (
1). The friction before and after the dynamic sequence together with the steady-state flow rate were known values. Iteration together with the value for the cross sectional area between the pressure measurement was used to determine the friction during the dynamic sequence.
4. Results
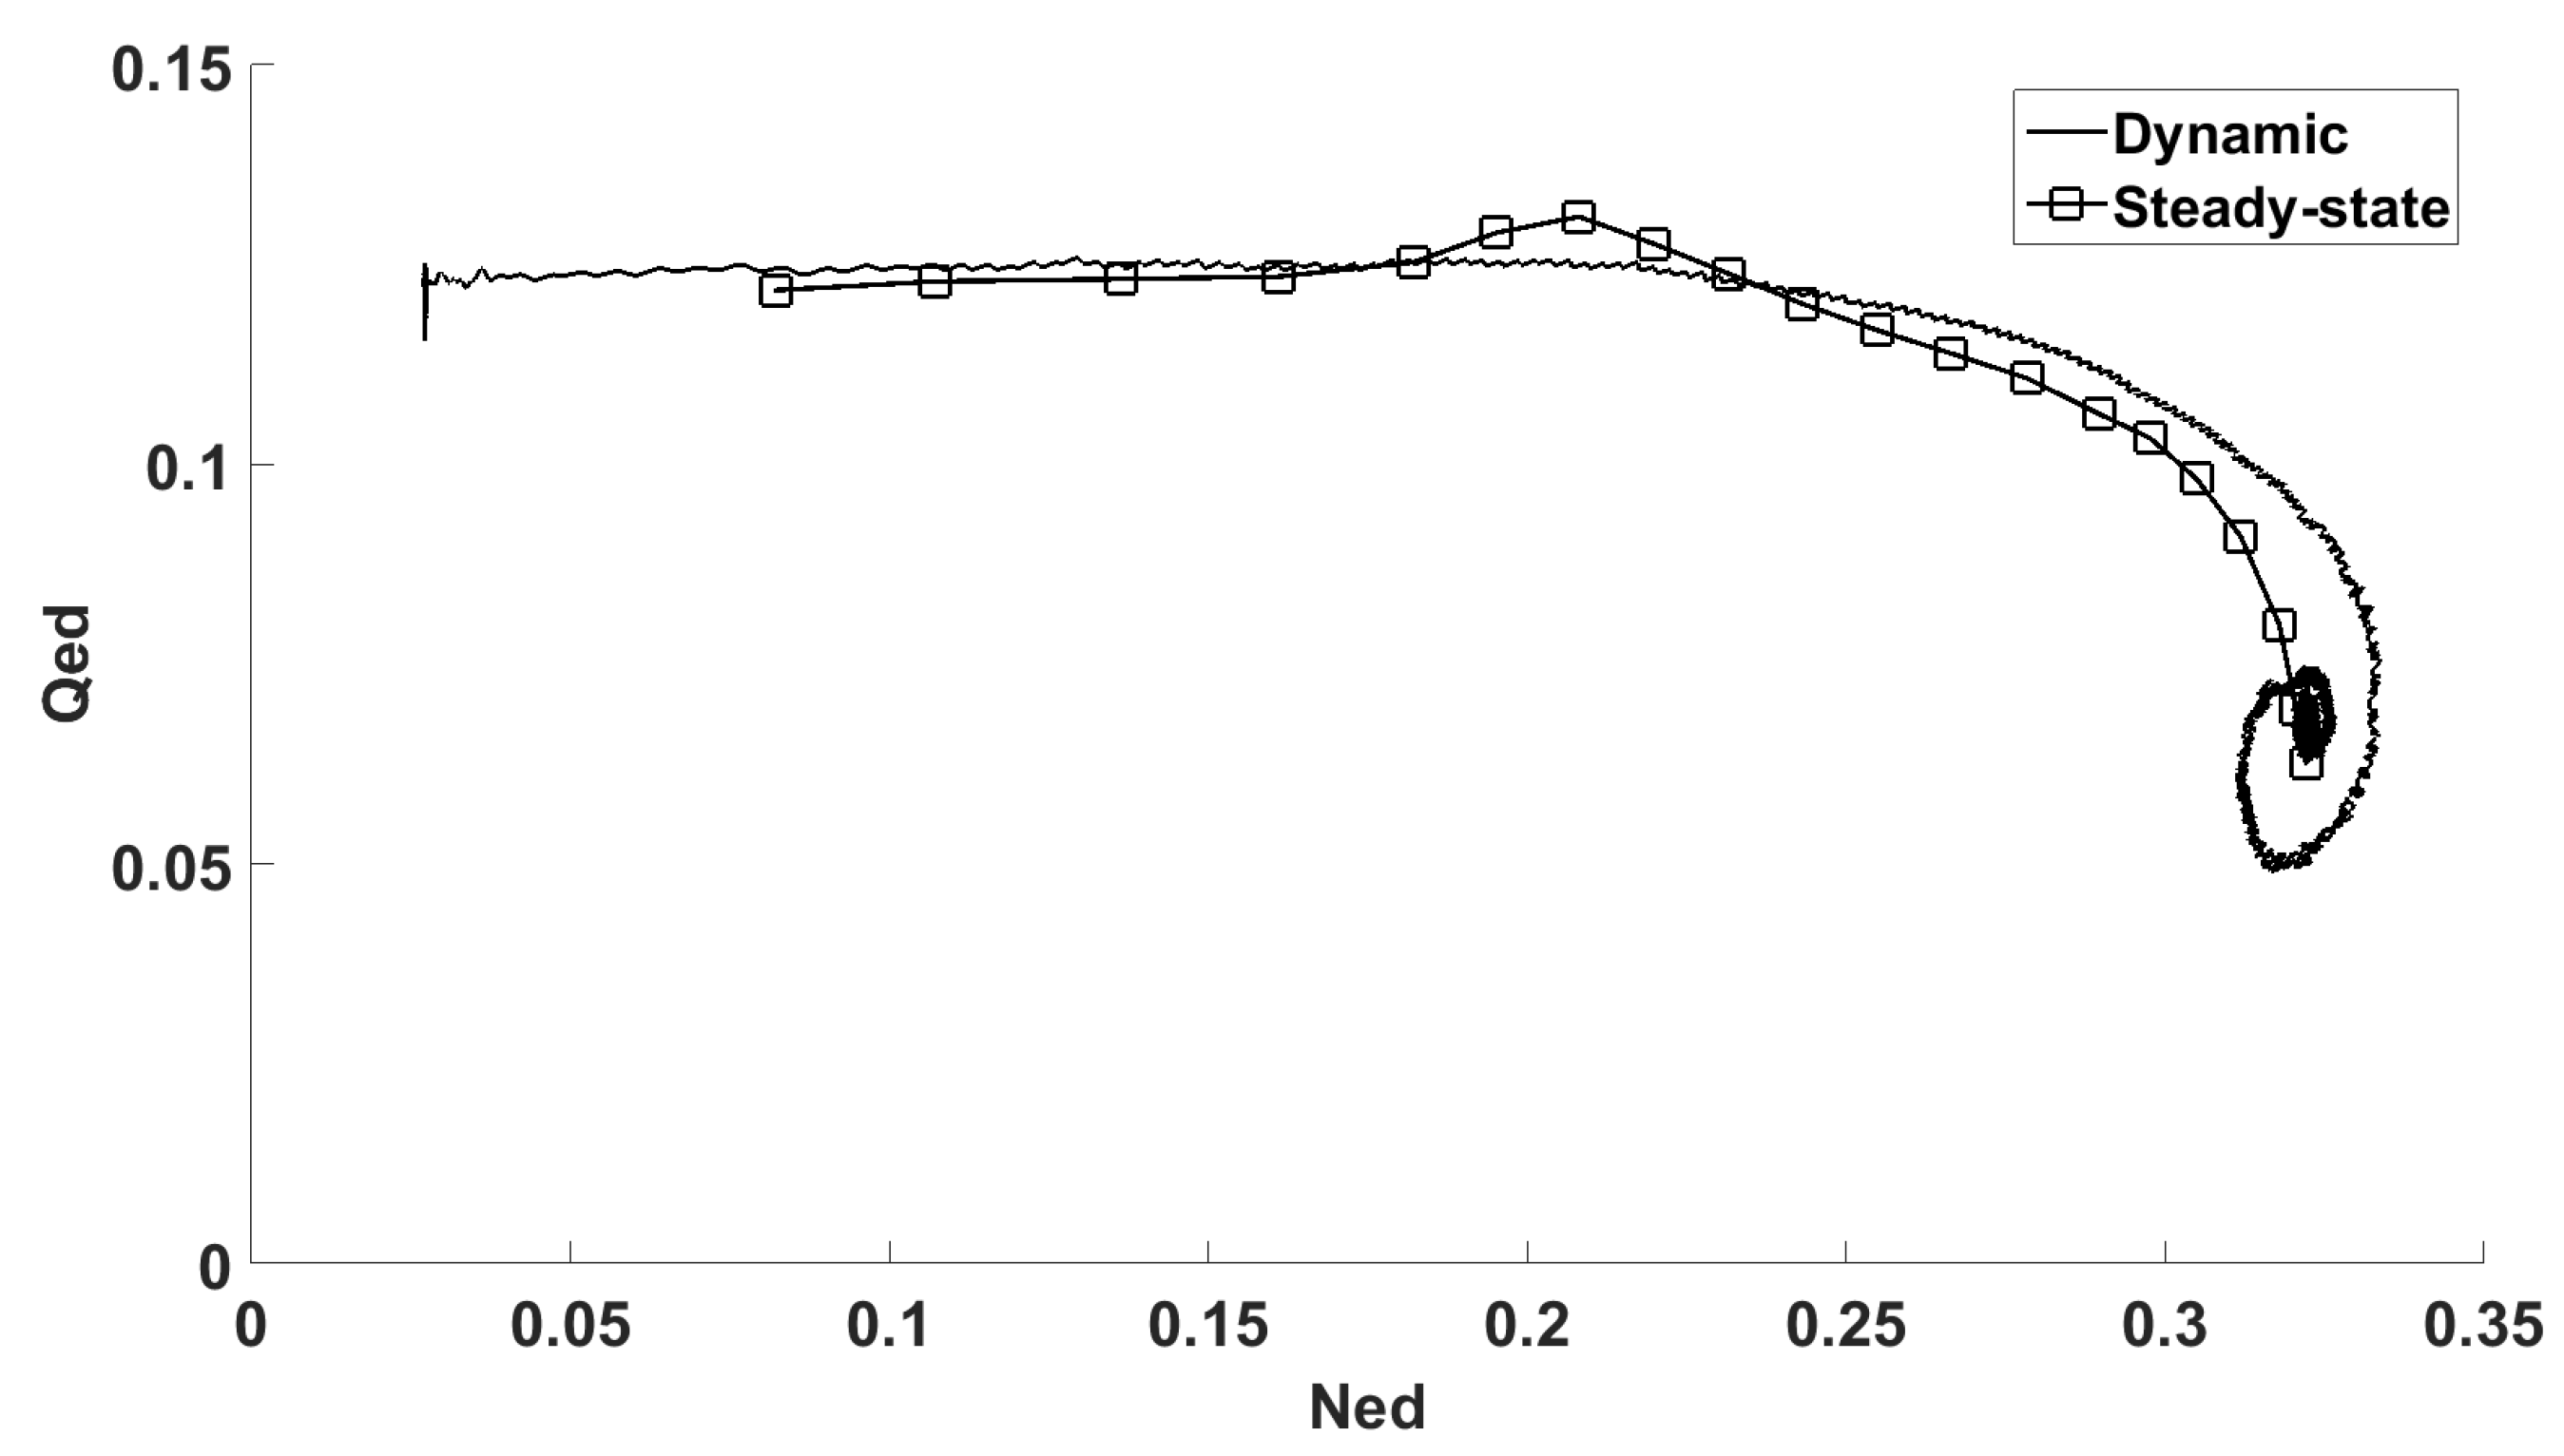
4.1. Dynamic Characteristic
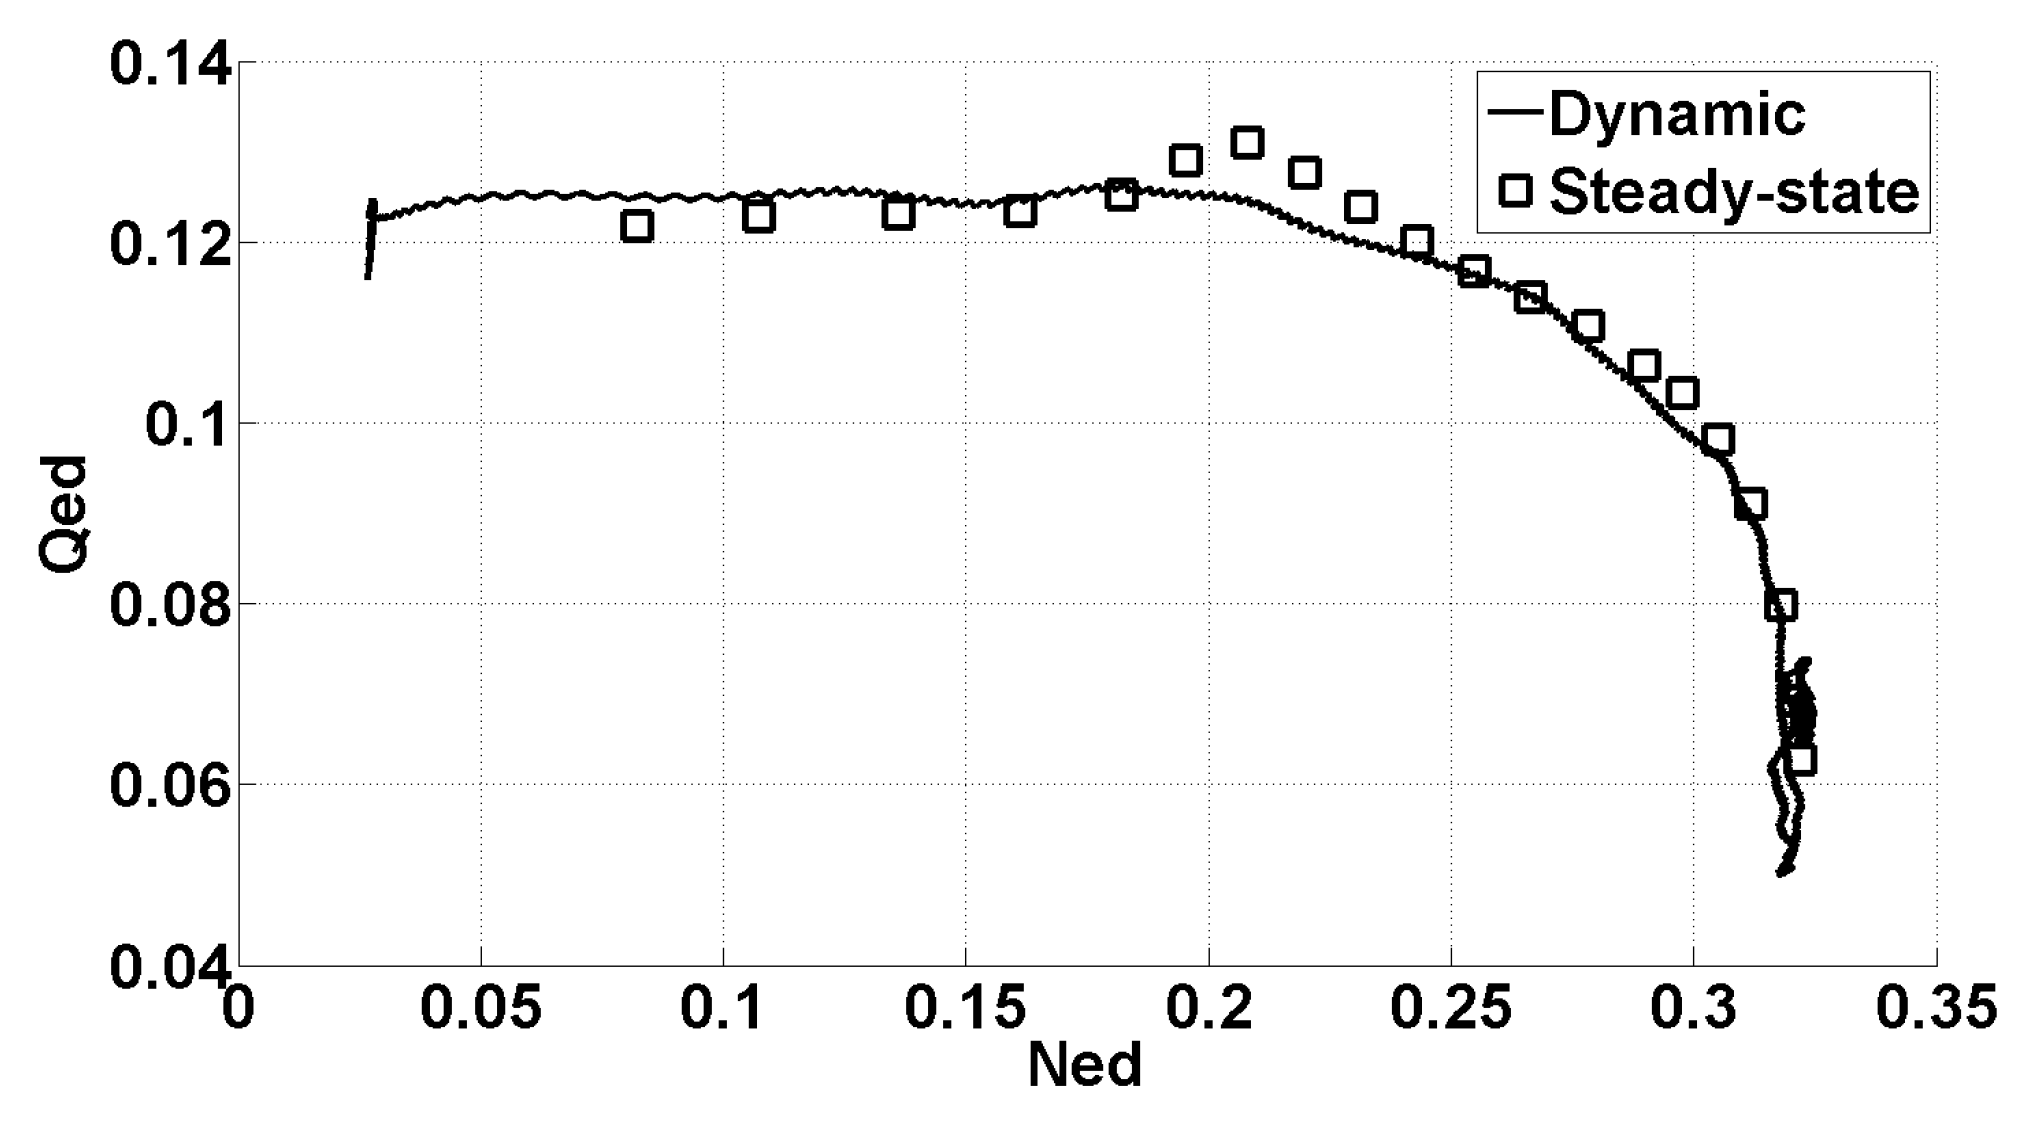
Measured dynamic and steady-state characteristics with reduced values for
guide vane opening are shown in
Figure 2. The values on the y- and x-axis are reduced flow,
, and rotational speed,
, respectively. These parameters are defined by Equations (
3) and (
4).
where
is outlet diameter of the runner, (
m),
H is net head, (
m), and
g is the gravitational constant, (
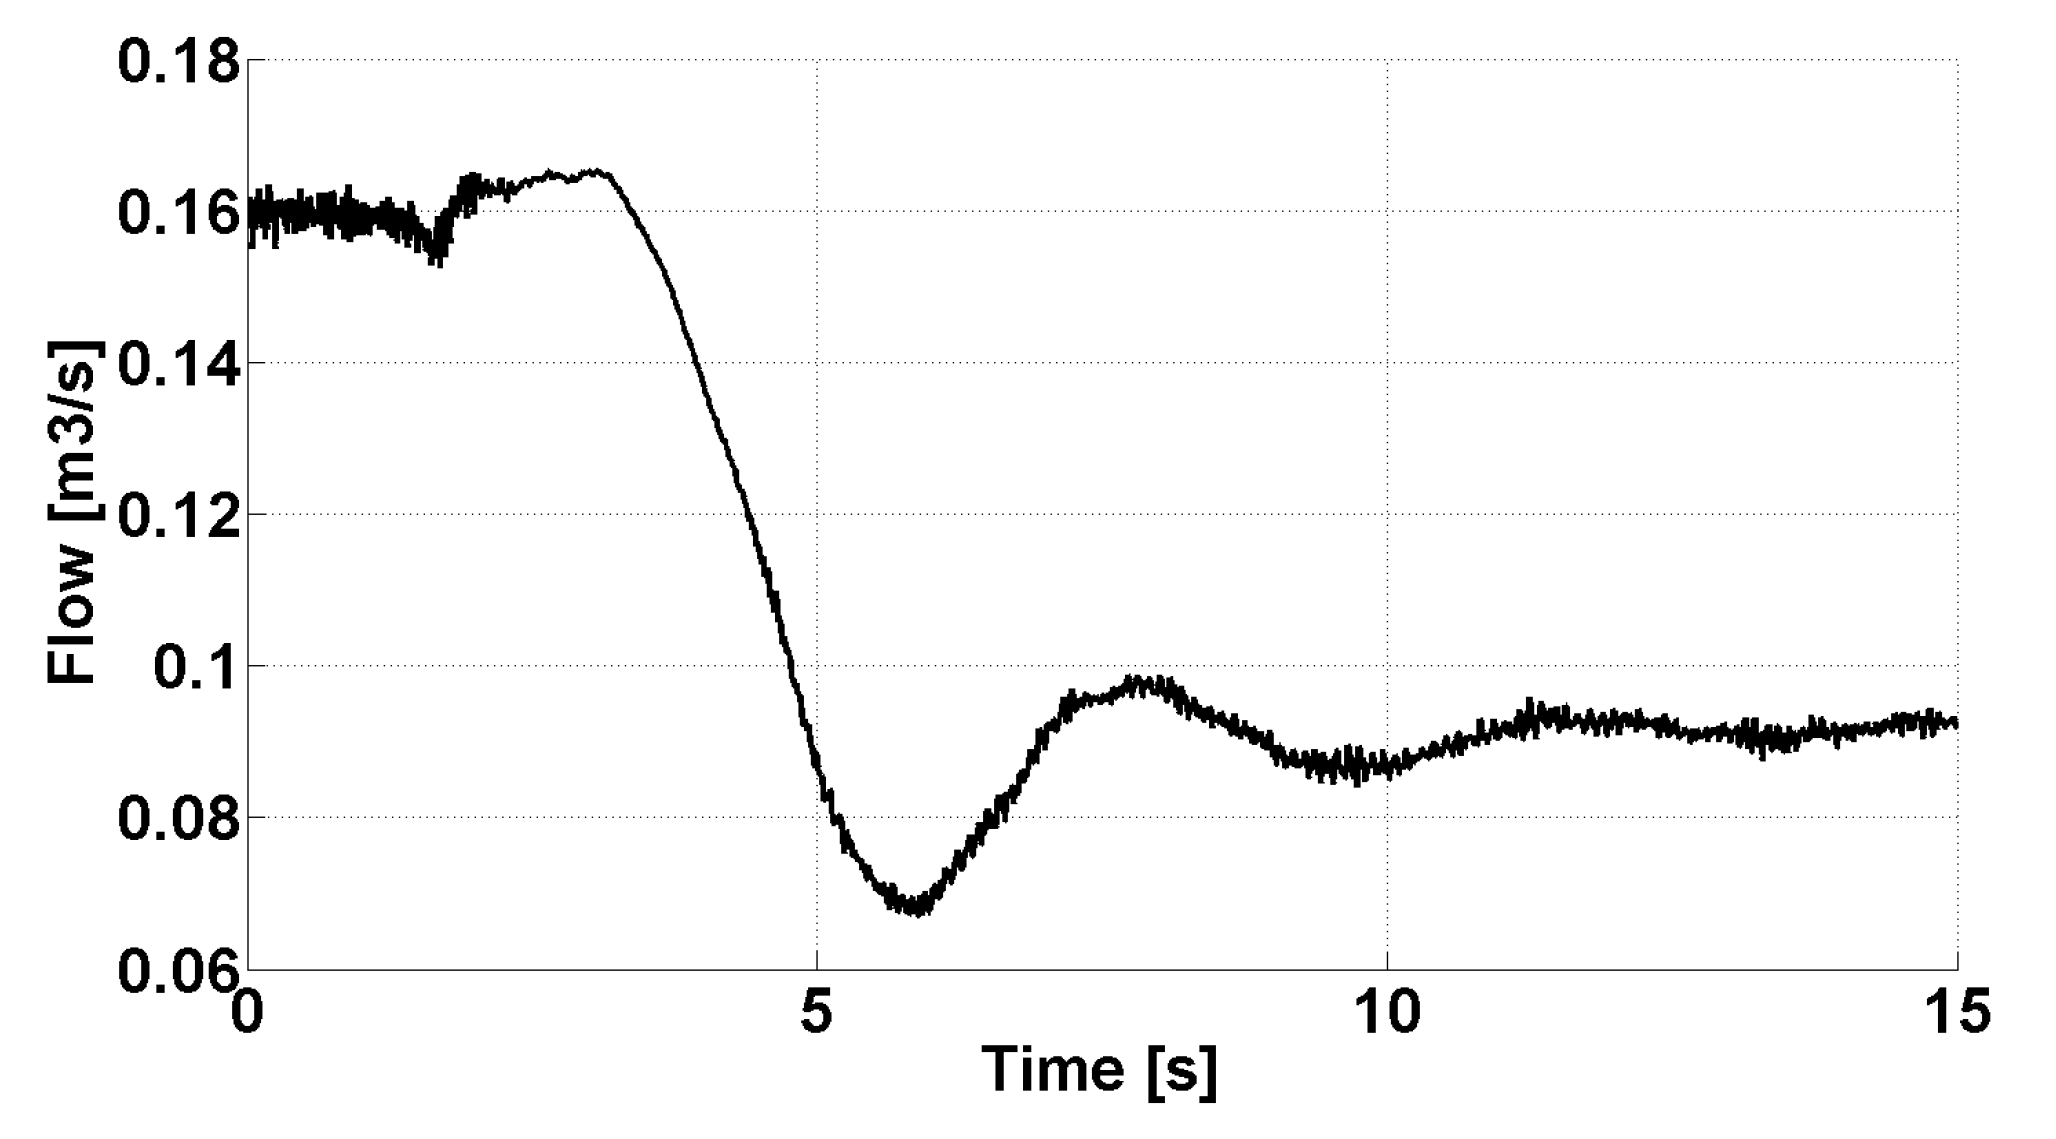
). The change in flow rate over time is shown in
Figure 3 for
guide vane opening.
4.2. Uncertainty
The measured characteristics have a calculated relative uncertainty of 2.61% for the
-value and 0.21% for the
-value [
14]. The main contributors to the uncertainty in
is the iteration of the area between the measurement points for the pressure-time measurement and the uncertainty of the electromagnetic flow meter. The loss is modeled as for steady-state flow, common for this type of measurement, however, it is known to be one of the causes of inaccuracy when using pressure-time method for flow measurements [
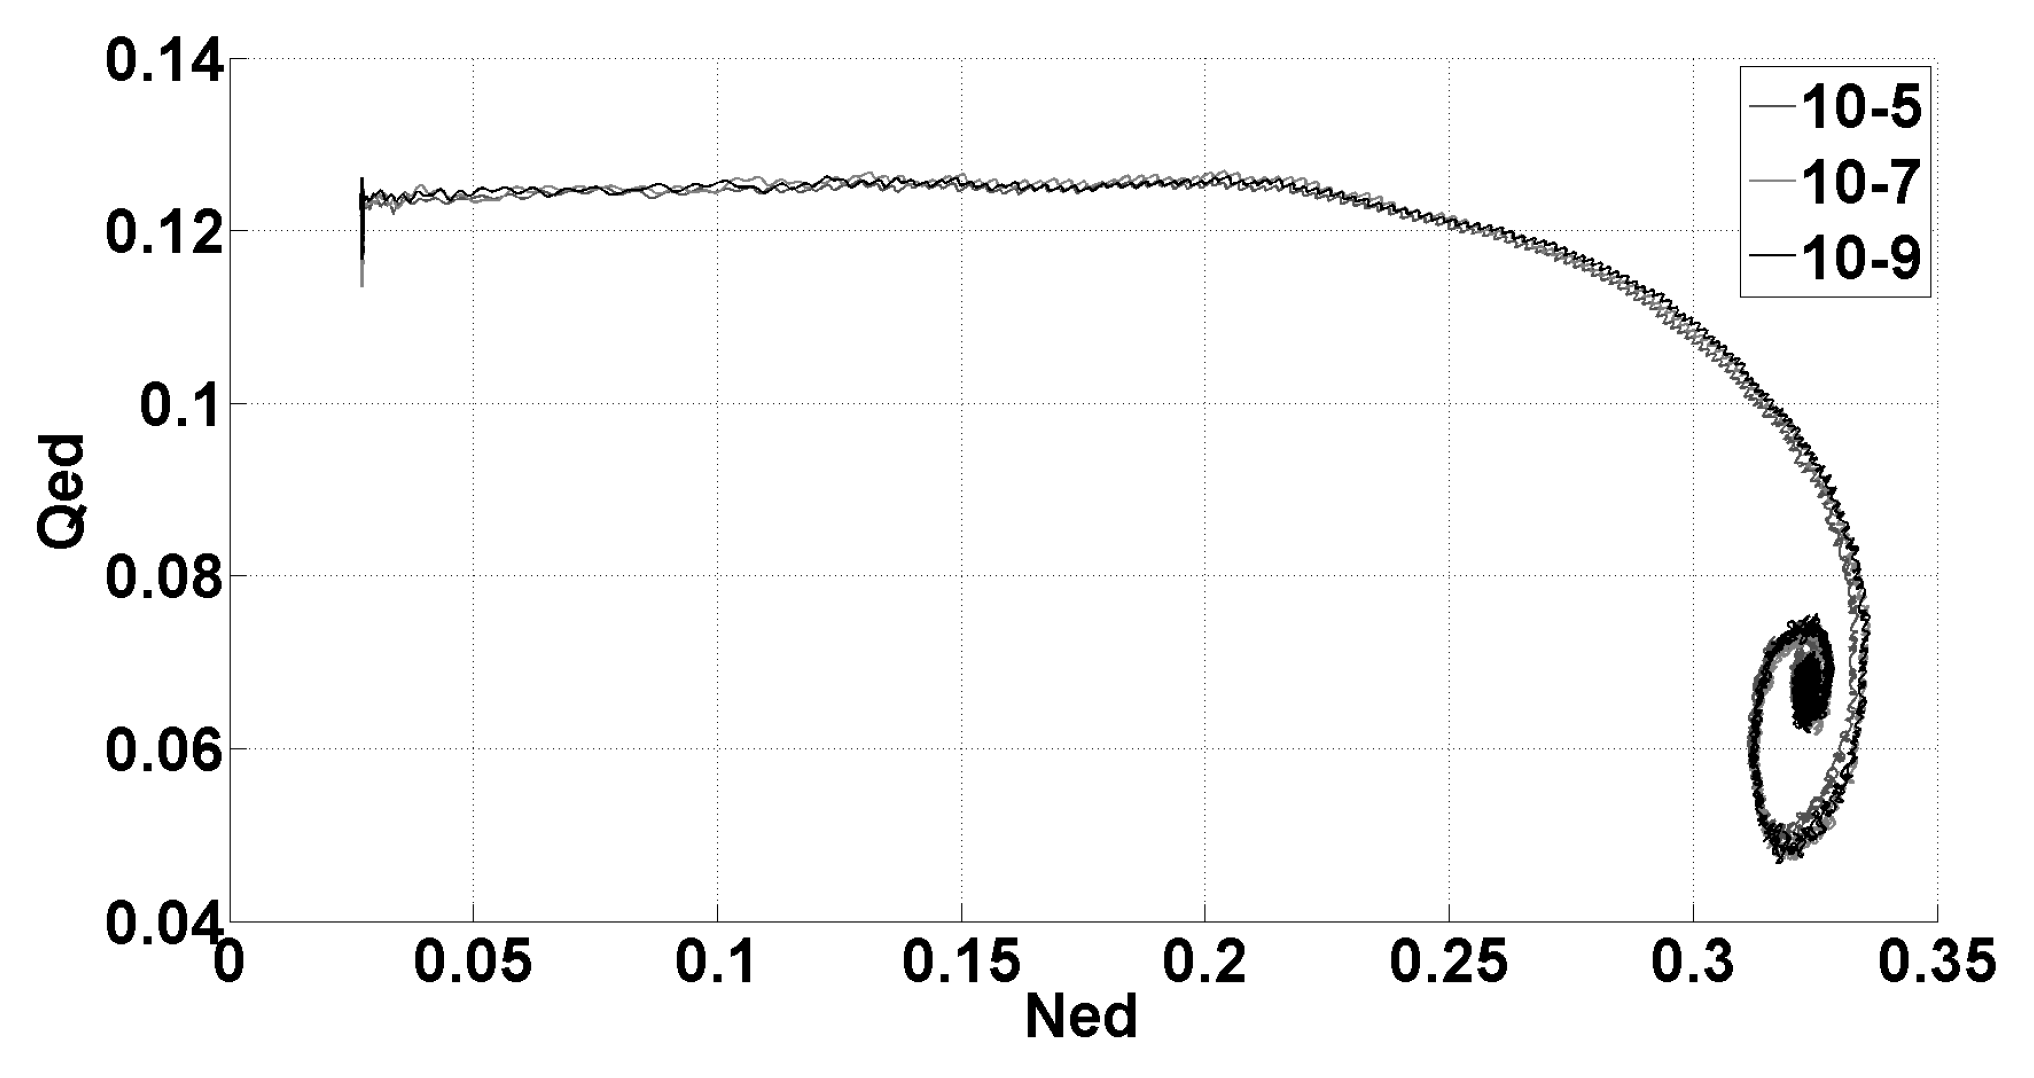
15]. The repeatability of the measurement is good, shown in
Figure 4 where three series at
guide vane opening are plotted. The objective with the experiment was to obtain the shape of the dynamic characteristics and the repeatability indicates that this was achieved with success.
4.3. Discussion
The results from the experiments show that the pressure-time method is well-suited for measuring the relative change in flow during a dynamic sequence. Constraints in the Francis test rig forced deviations from the IEC 60041 standard resulting in a significant uncertainty in the flow rate measurements. However, the repeatability in the measurements showed that the shape of the curves is consistent, thereby fulfilling the main objective of the experiment; obtaining the shape of the curves.
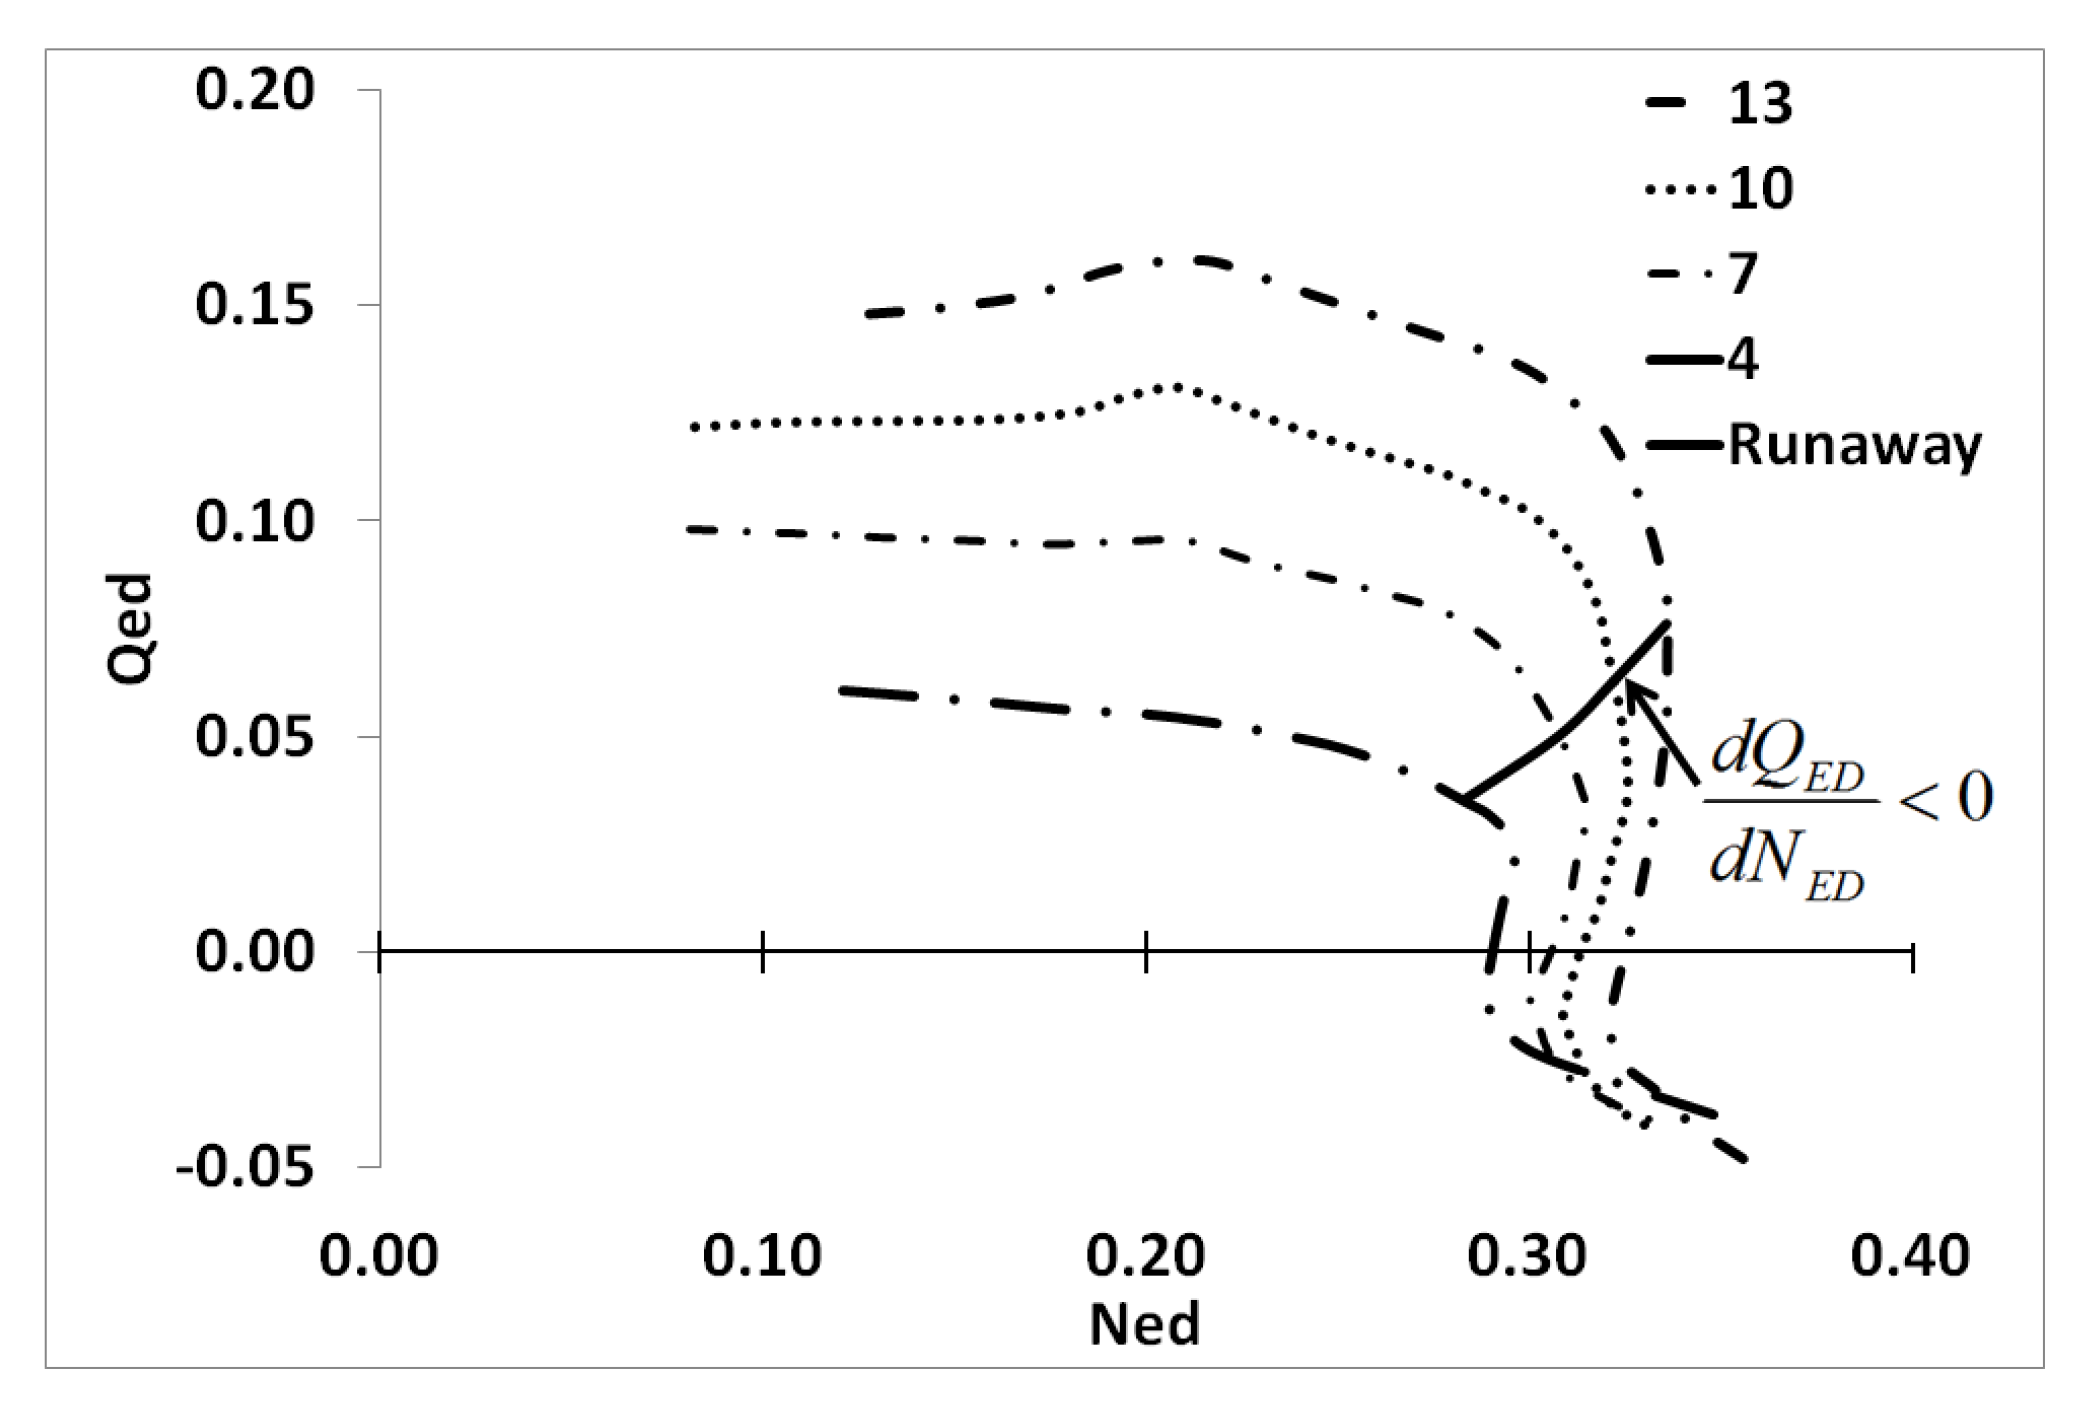
The dynamic characteristics in
Figure 2 show that the combination of machine and hydraulic system is stable. The oscillations, with a period of approximately T = 4 s, are damped and kept within the turbine quadrant. The system regains steady-state operation at runaway after a short period of time. This result corresponds with Martins stability criterion [
10,
11] at runaway, see
Figure 5 and
Figure 6:
Figure 2 show a significant deviation from the measured steady-state characteristic at values higher than
= 0.25. Nielsen performed an similar experiment on a high head Francis turbine in 1990 with corresponding results [
1]; the characteristic starts to deviate from the steady-state at high values of
and ends up with damped oscillations around the runaway point.
A proposed explanation is that the inertia of the water masses inside the turbine, defined as the inlet of the spiral casing to the outlet of the draft tube, is causing the deviation. The effect of the inertia,
I, can be removed by redefining the net head,
, used for calculating the unit properties in Equations (
3) and (
4):
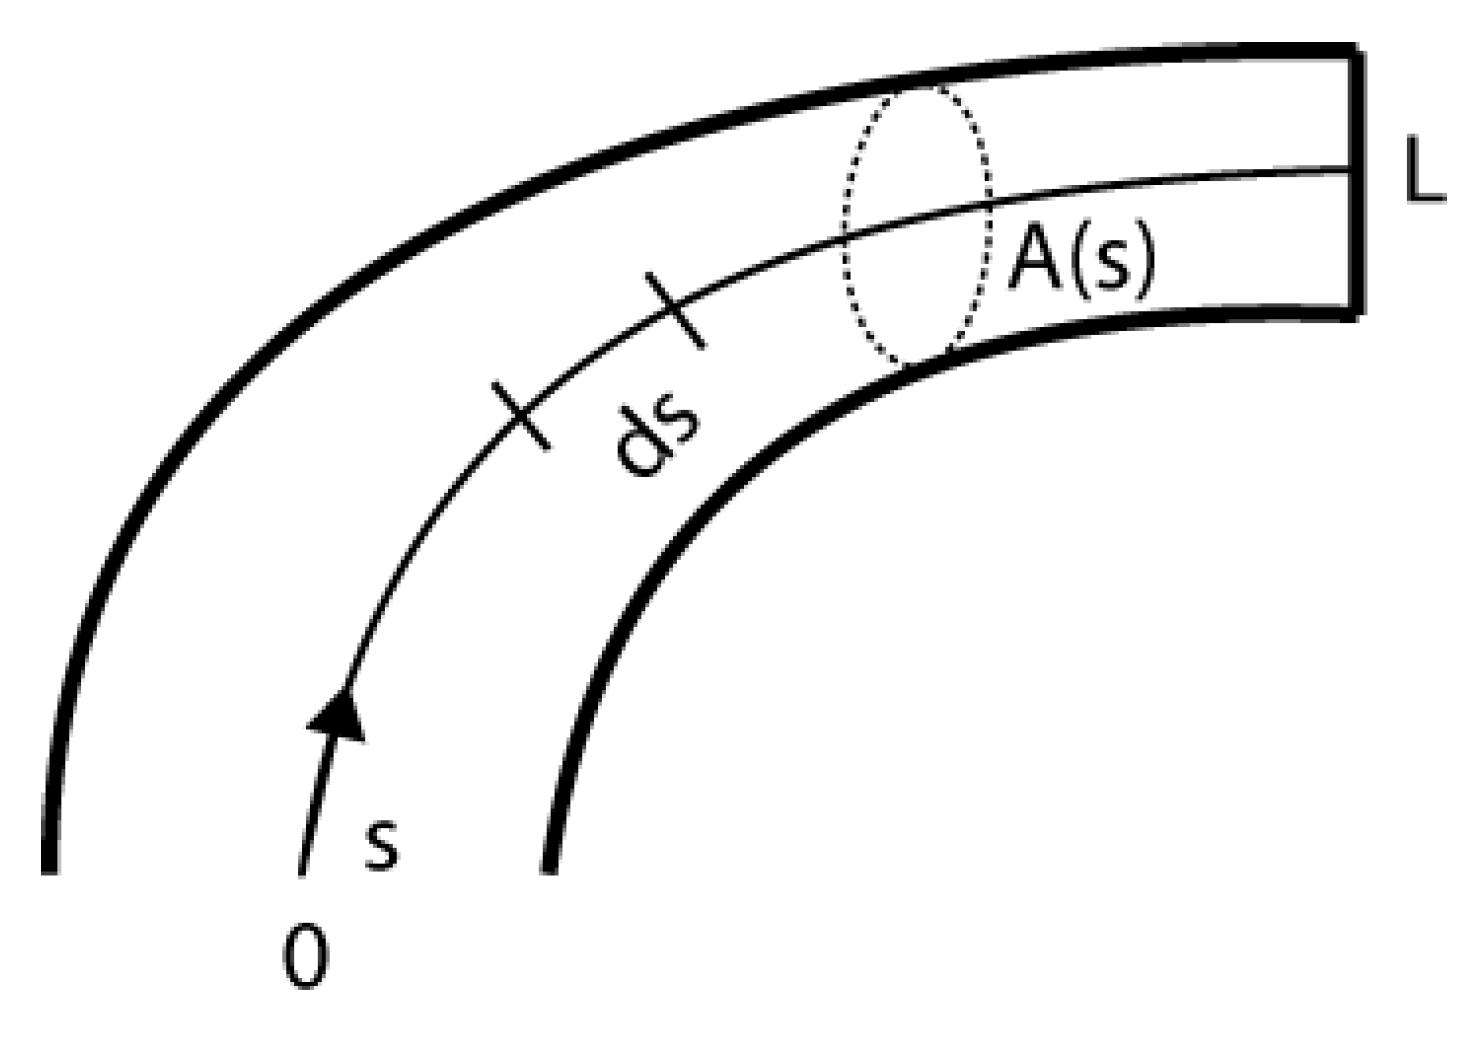
For the runner the inertia is found by integration along a streamline, as shown in
Figure 7 and Equation (
7). The same principle can be applied for the spiral casing and draft tube, but for the these the well-known
can be used with sufficient accuracy.
Calculating the inertia with Equation (
7) is a complex task requiring complete knowledge of the geometry. For this case, measured data is available, hence the value for the inertia is found by iteration to be approximately
.
Figure 8 show the dynamic characteristic with redefined net head together with the measured steady-state characteristics. The majority of the deviation is removed and the turbine follows a steady-state line up and down until the system has regained steady-state operation.
5. Transient Simulations
Transient calculations were performed by using the the method of characteristics [
16] to model the pipe elements and Nielsen’s turbine model [
1] for the representation of the pump-turbine. The turbine model has previously shown good accuracy compared with measured steady-state characteristics [
2]; in addition it also takes into consideration the inertia of the water masses inside the turbine. It is cruicial to model the turbine correct in order to reproduce the physics of the measurements, hence the inclusion of the inertia is important, as shown by Walseth
et al. [
17].
The analytical model is derived from the Euler equation and consists of two equations; the hydraulic and torque equation, here shown on dimensionless form with the parameters reduced on the nominal values:
The inputs to the turbine model are known design parameters, except for the loss factors, , and , that are tuned to obtain best possible fit. The value for the acceleration time for the rotating masses, , and time constant for the water masses in the turbine, , was in this case also adjusted to improve the accuracy between simulations and measurements. With a low value of the turbine will follow a steady-state line and by increasing this value the characteristics goes further to the right compared to the steady-state measurements and the oscillations around runaway becomes more visible. Hence, giving a better fit with the measurements in addition to increasing the period of the oscillations in rotational speed and flow rate. The value for was adjusted to obtain the correct gradient for increase in speed with respect to time, .
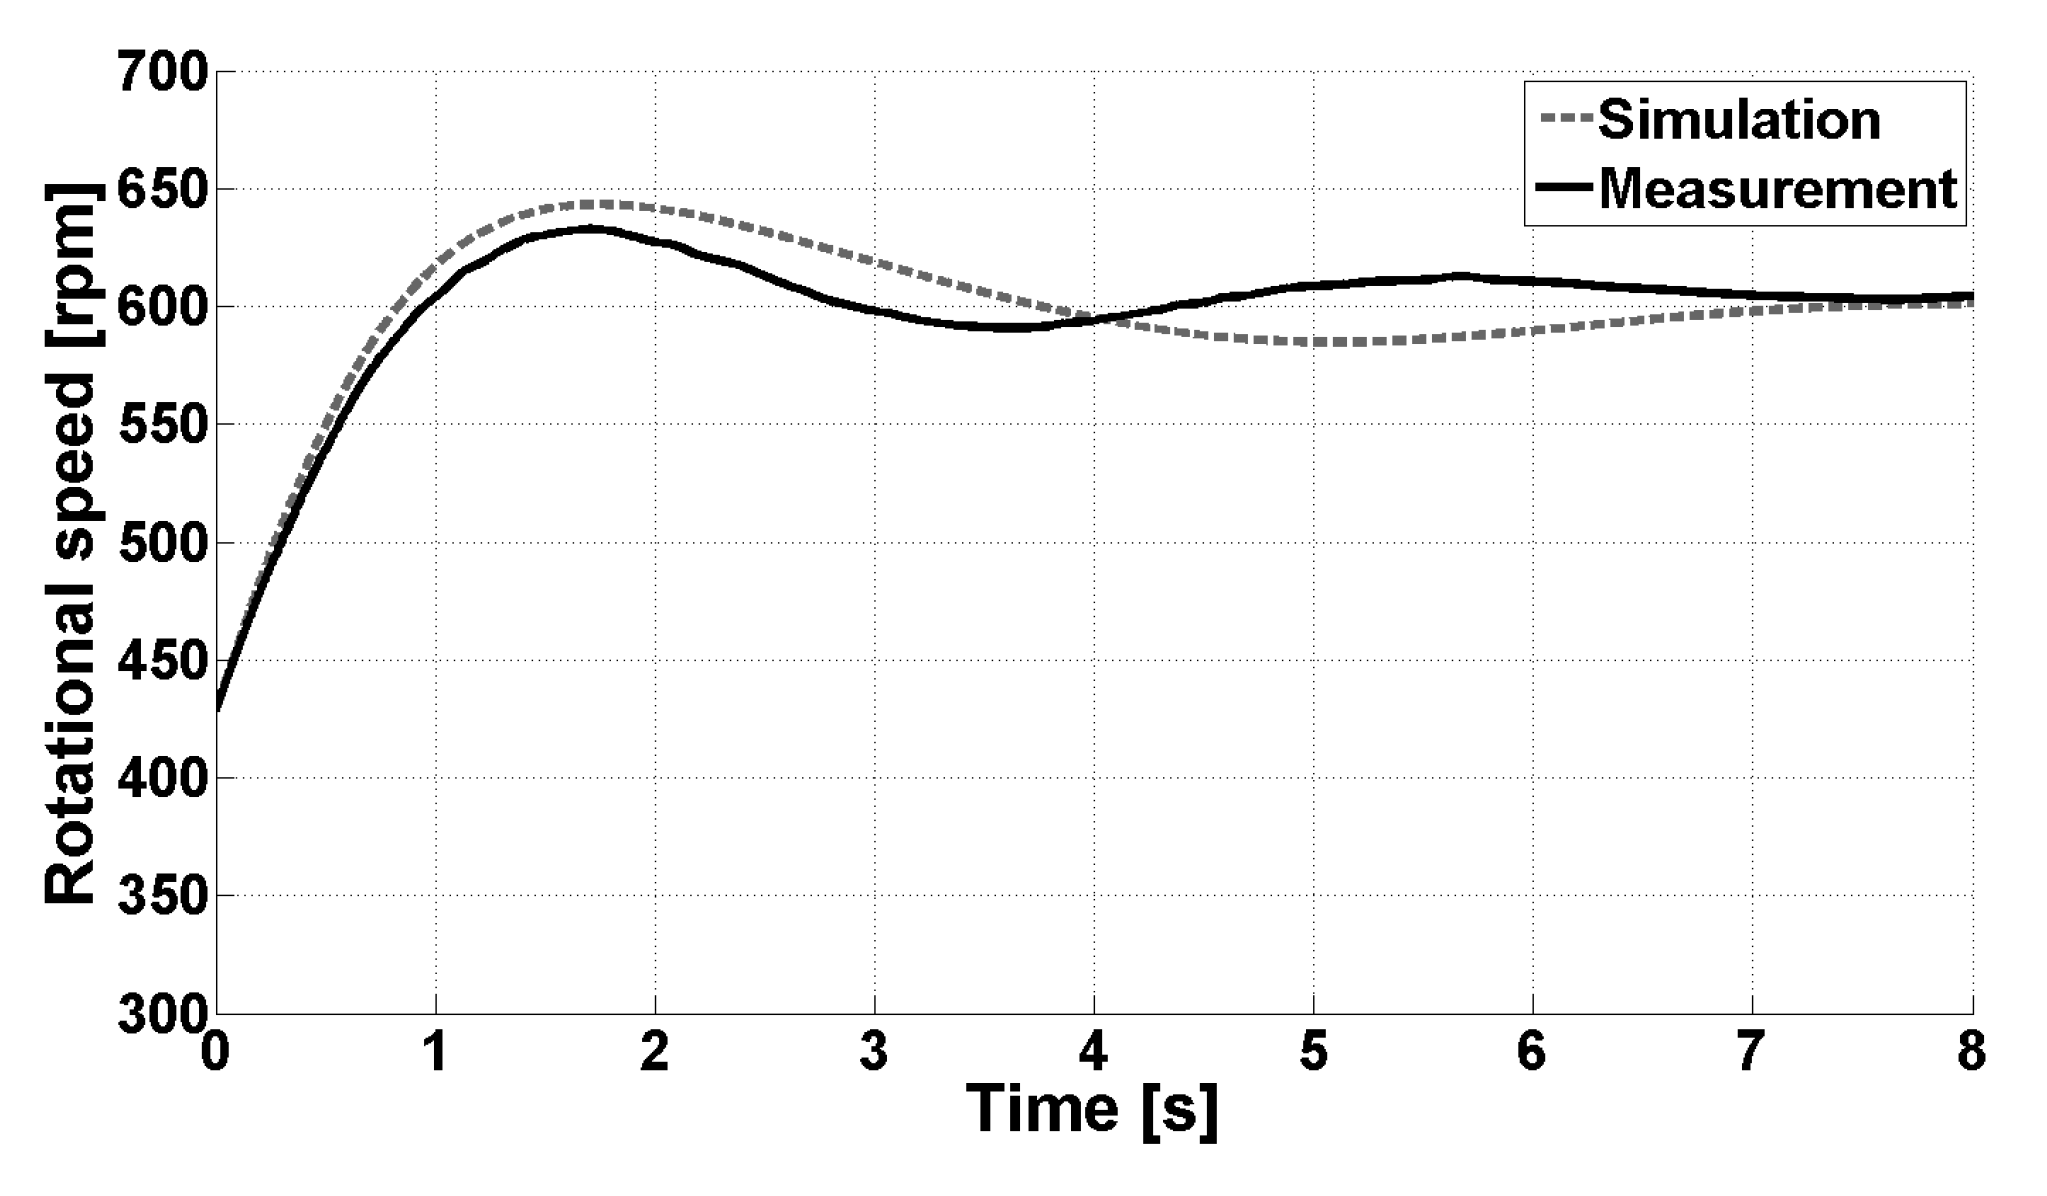
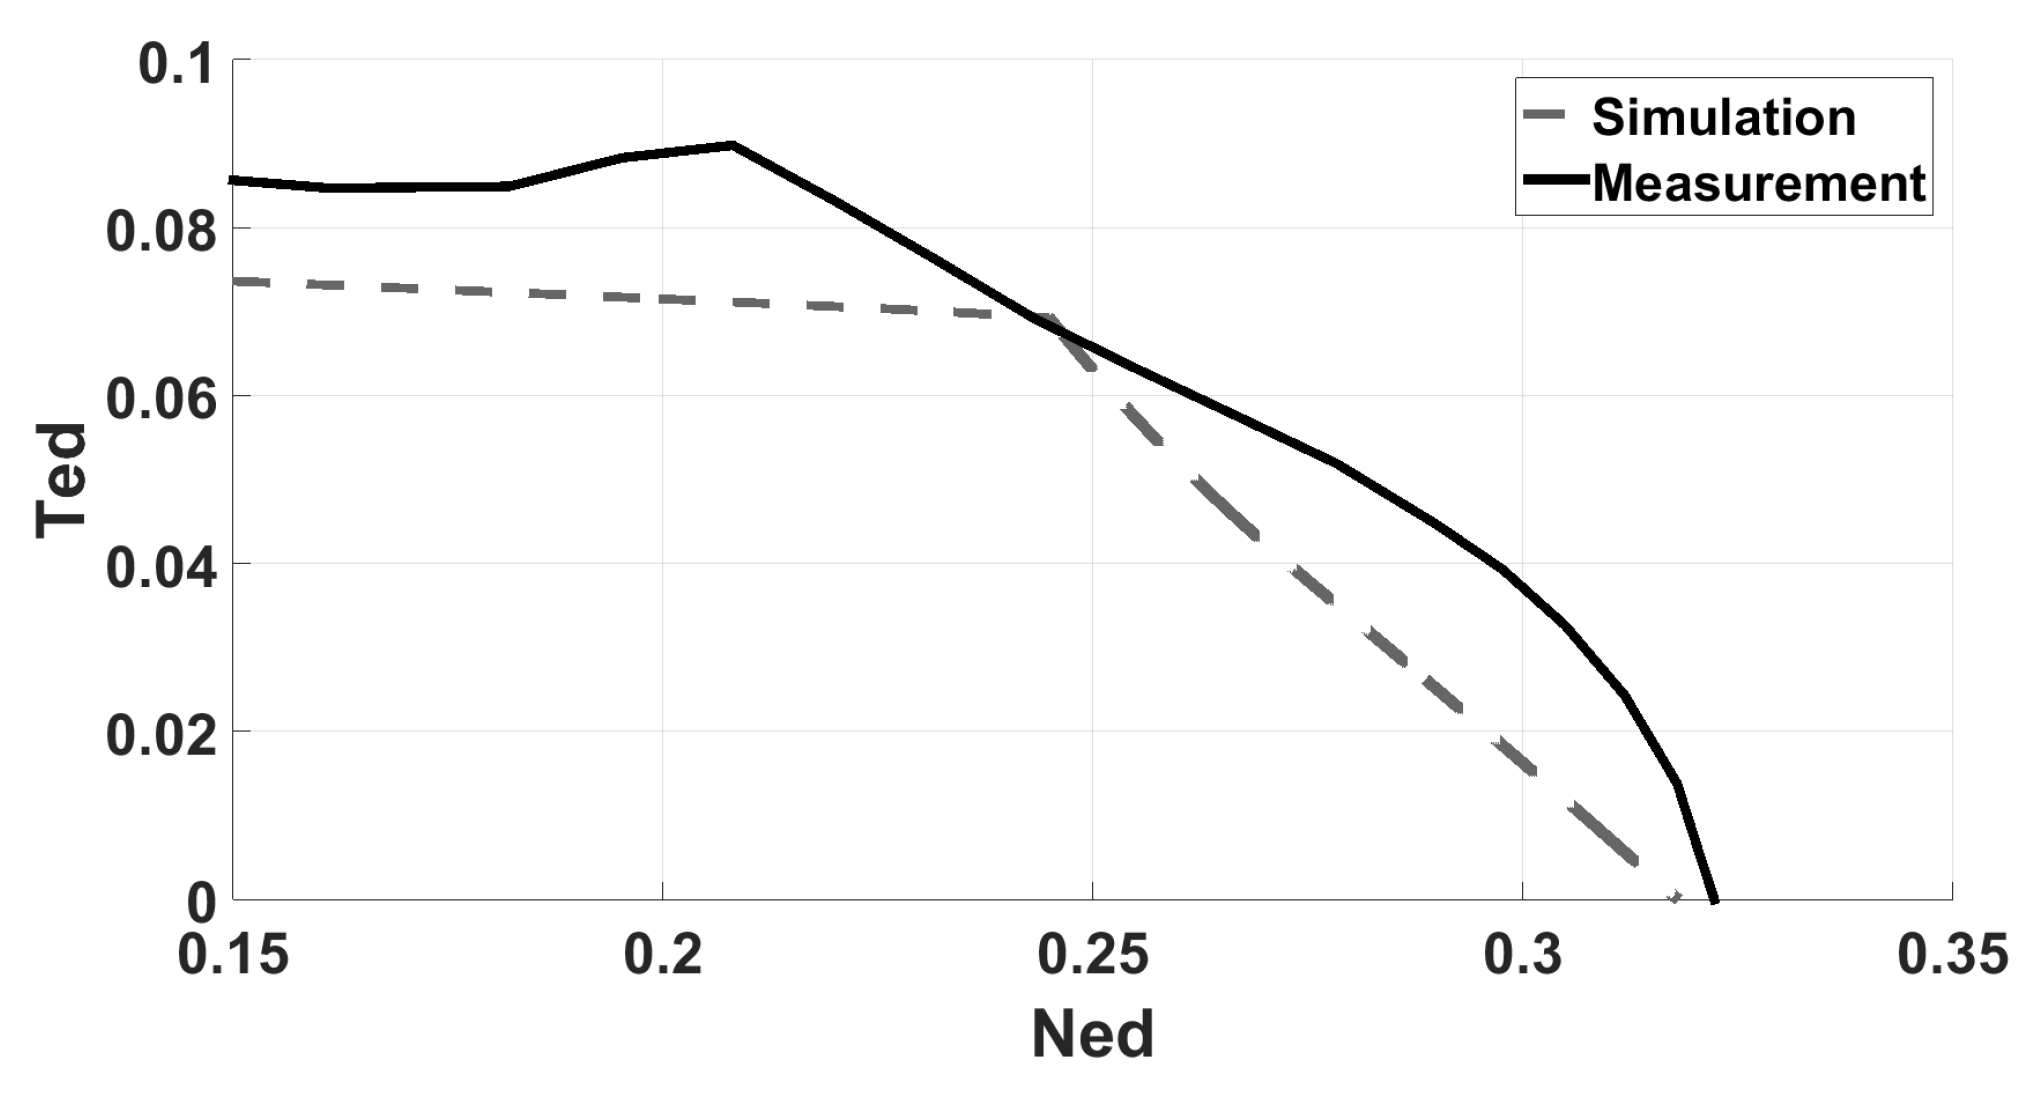
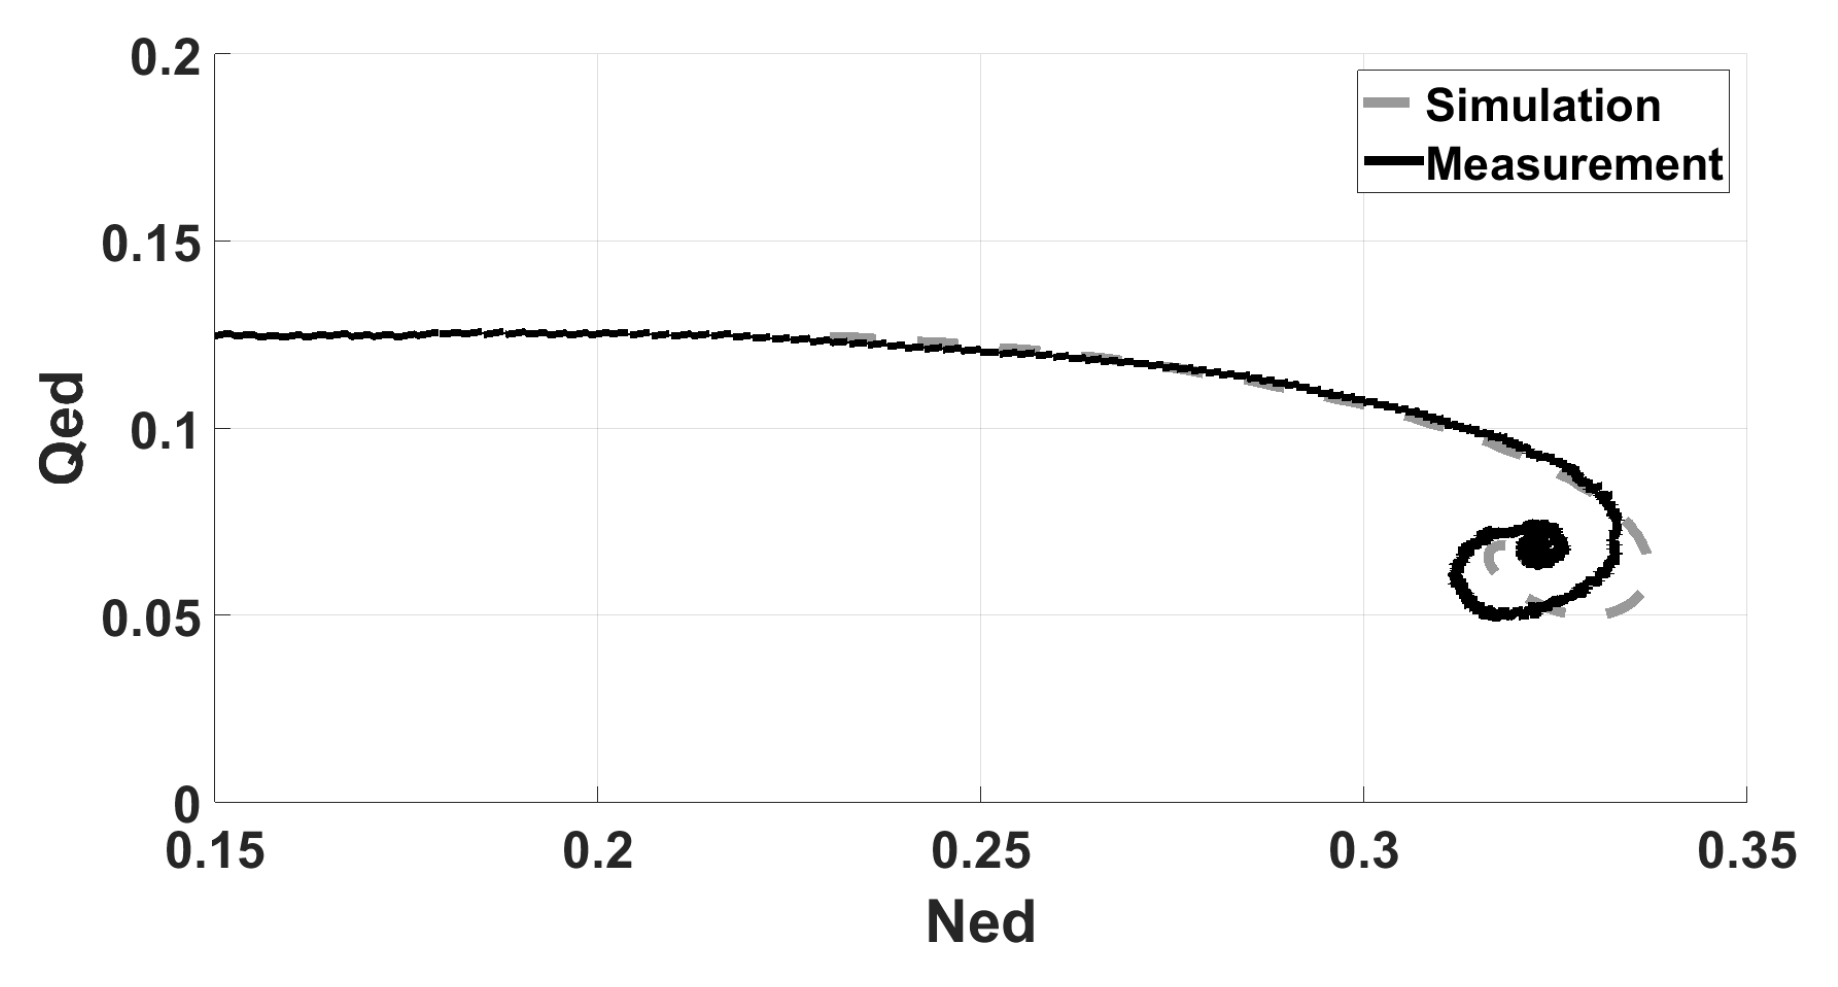
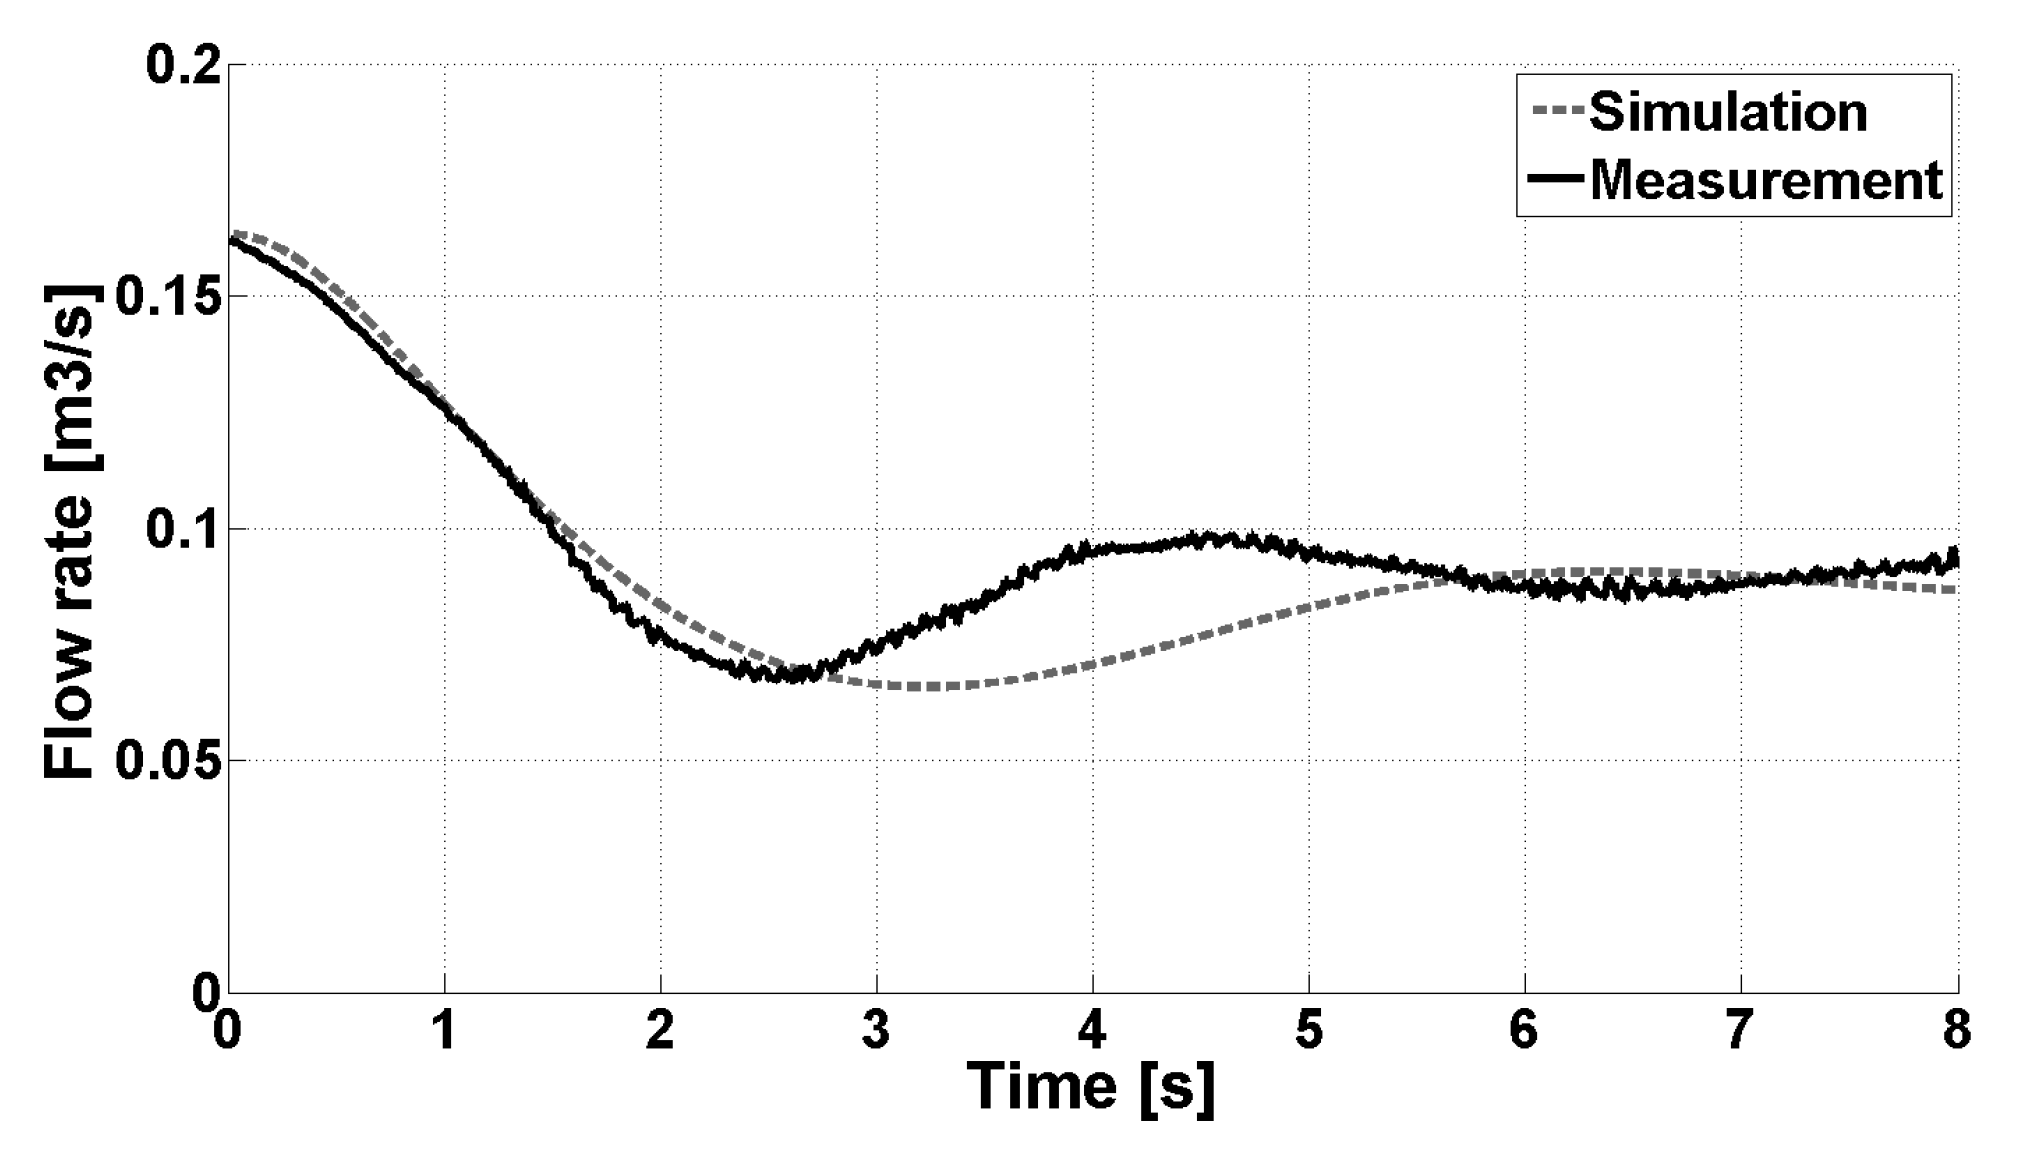
Transient simulations of the dynamic sequence compared with measured data at
guide vane opening is shown in
Figure 9,
Figure 10 and
Figure 11. The simulations are started at nominal speed due to an underestimation of flow rate in the turbine model at lower speed making it difficult to tune the simulations according to the measurements.
The results show that the physics in the dynamic sequence is reproduced with good accuracy. Calculations show that the turbine experience damped oscillations around runaway before regaining steady-state operation, as shown in the measurements, see
Figure 9 where the timescale for the plot is 128 s.
The dampening of the oscillations in the calculations is larger than measured, see
Figure 10 and
Figure 11. This can be explained by looking at the modeling of the turbine.
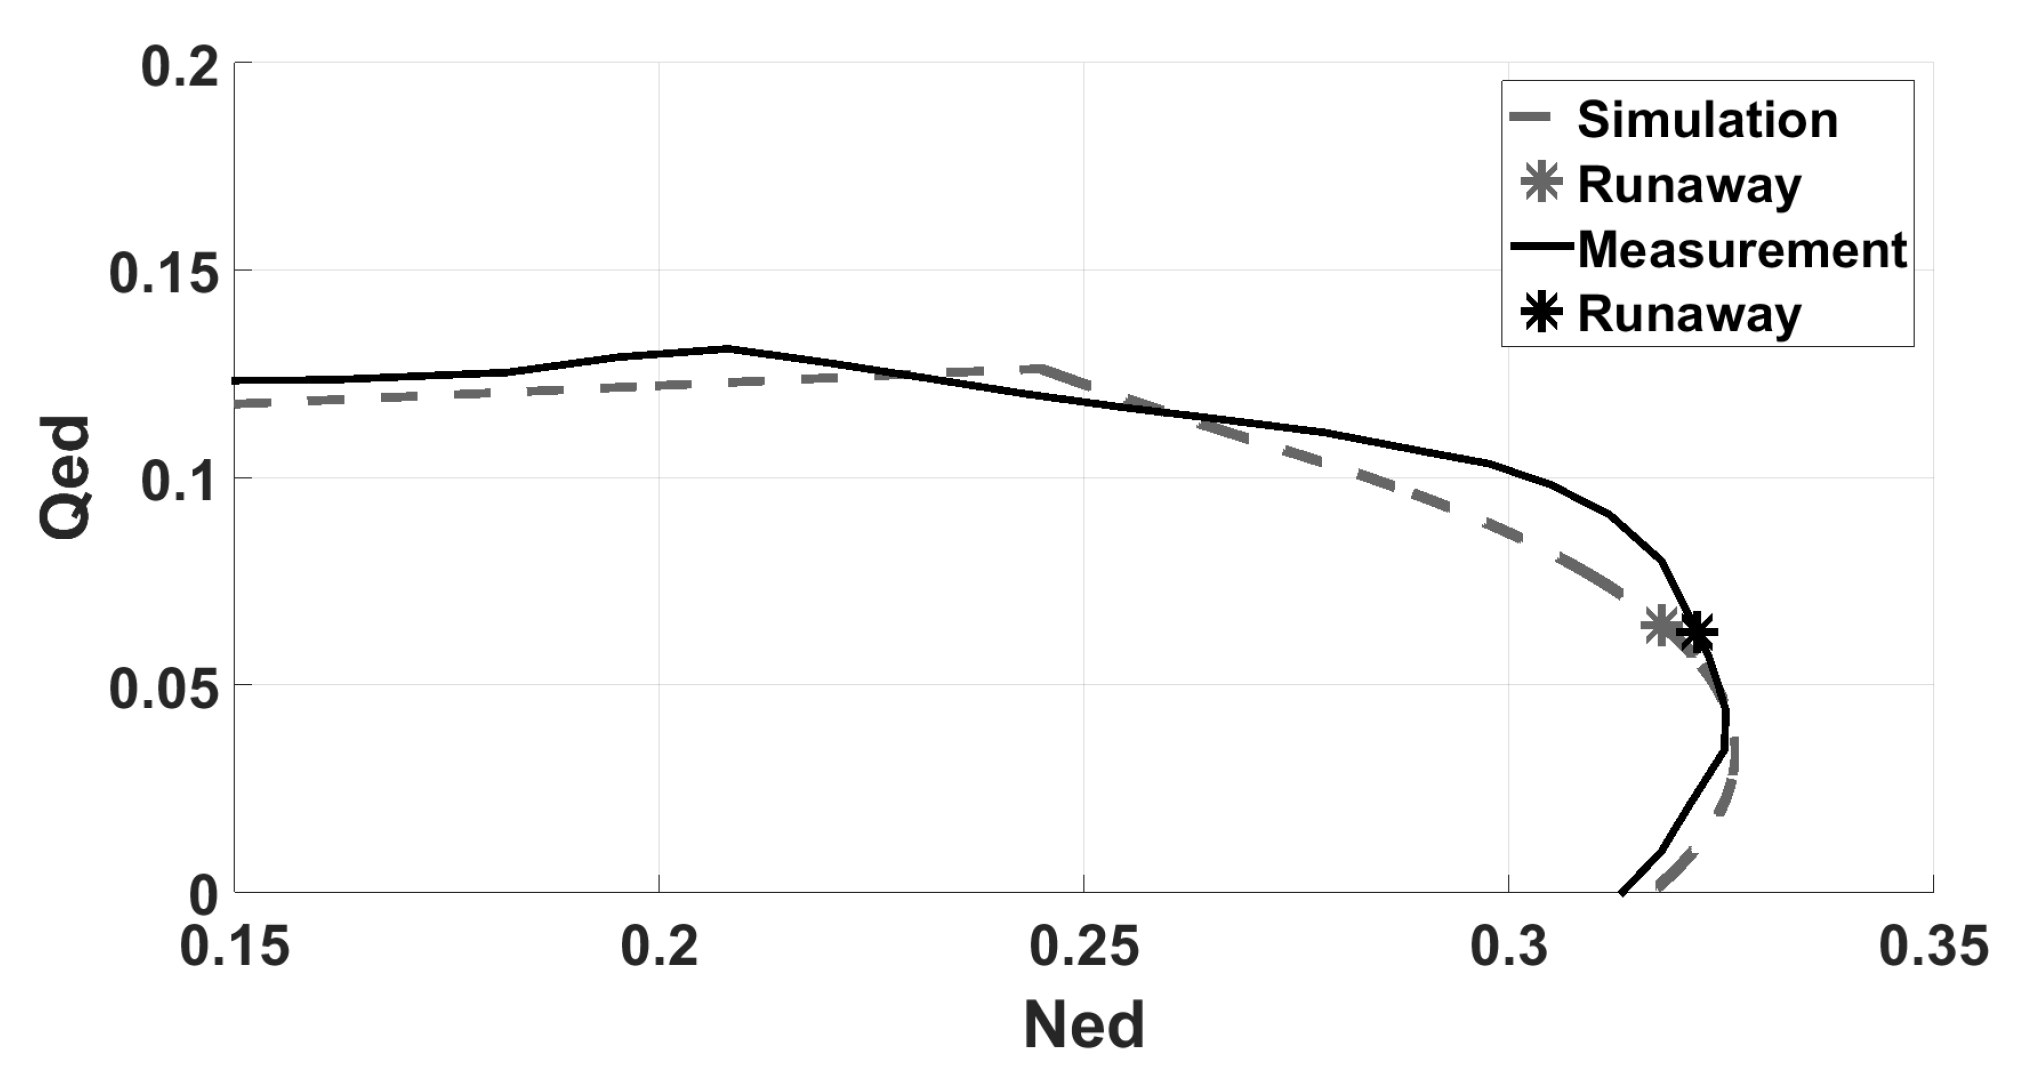
Figure 12 and
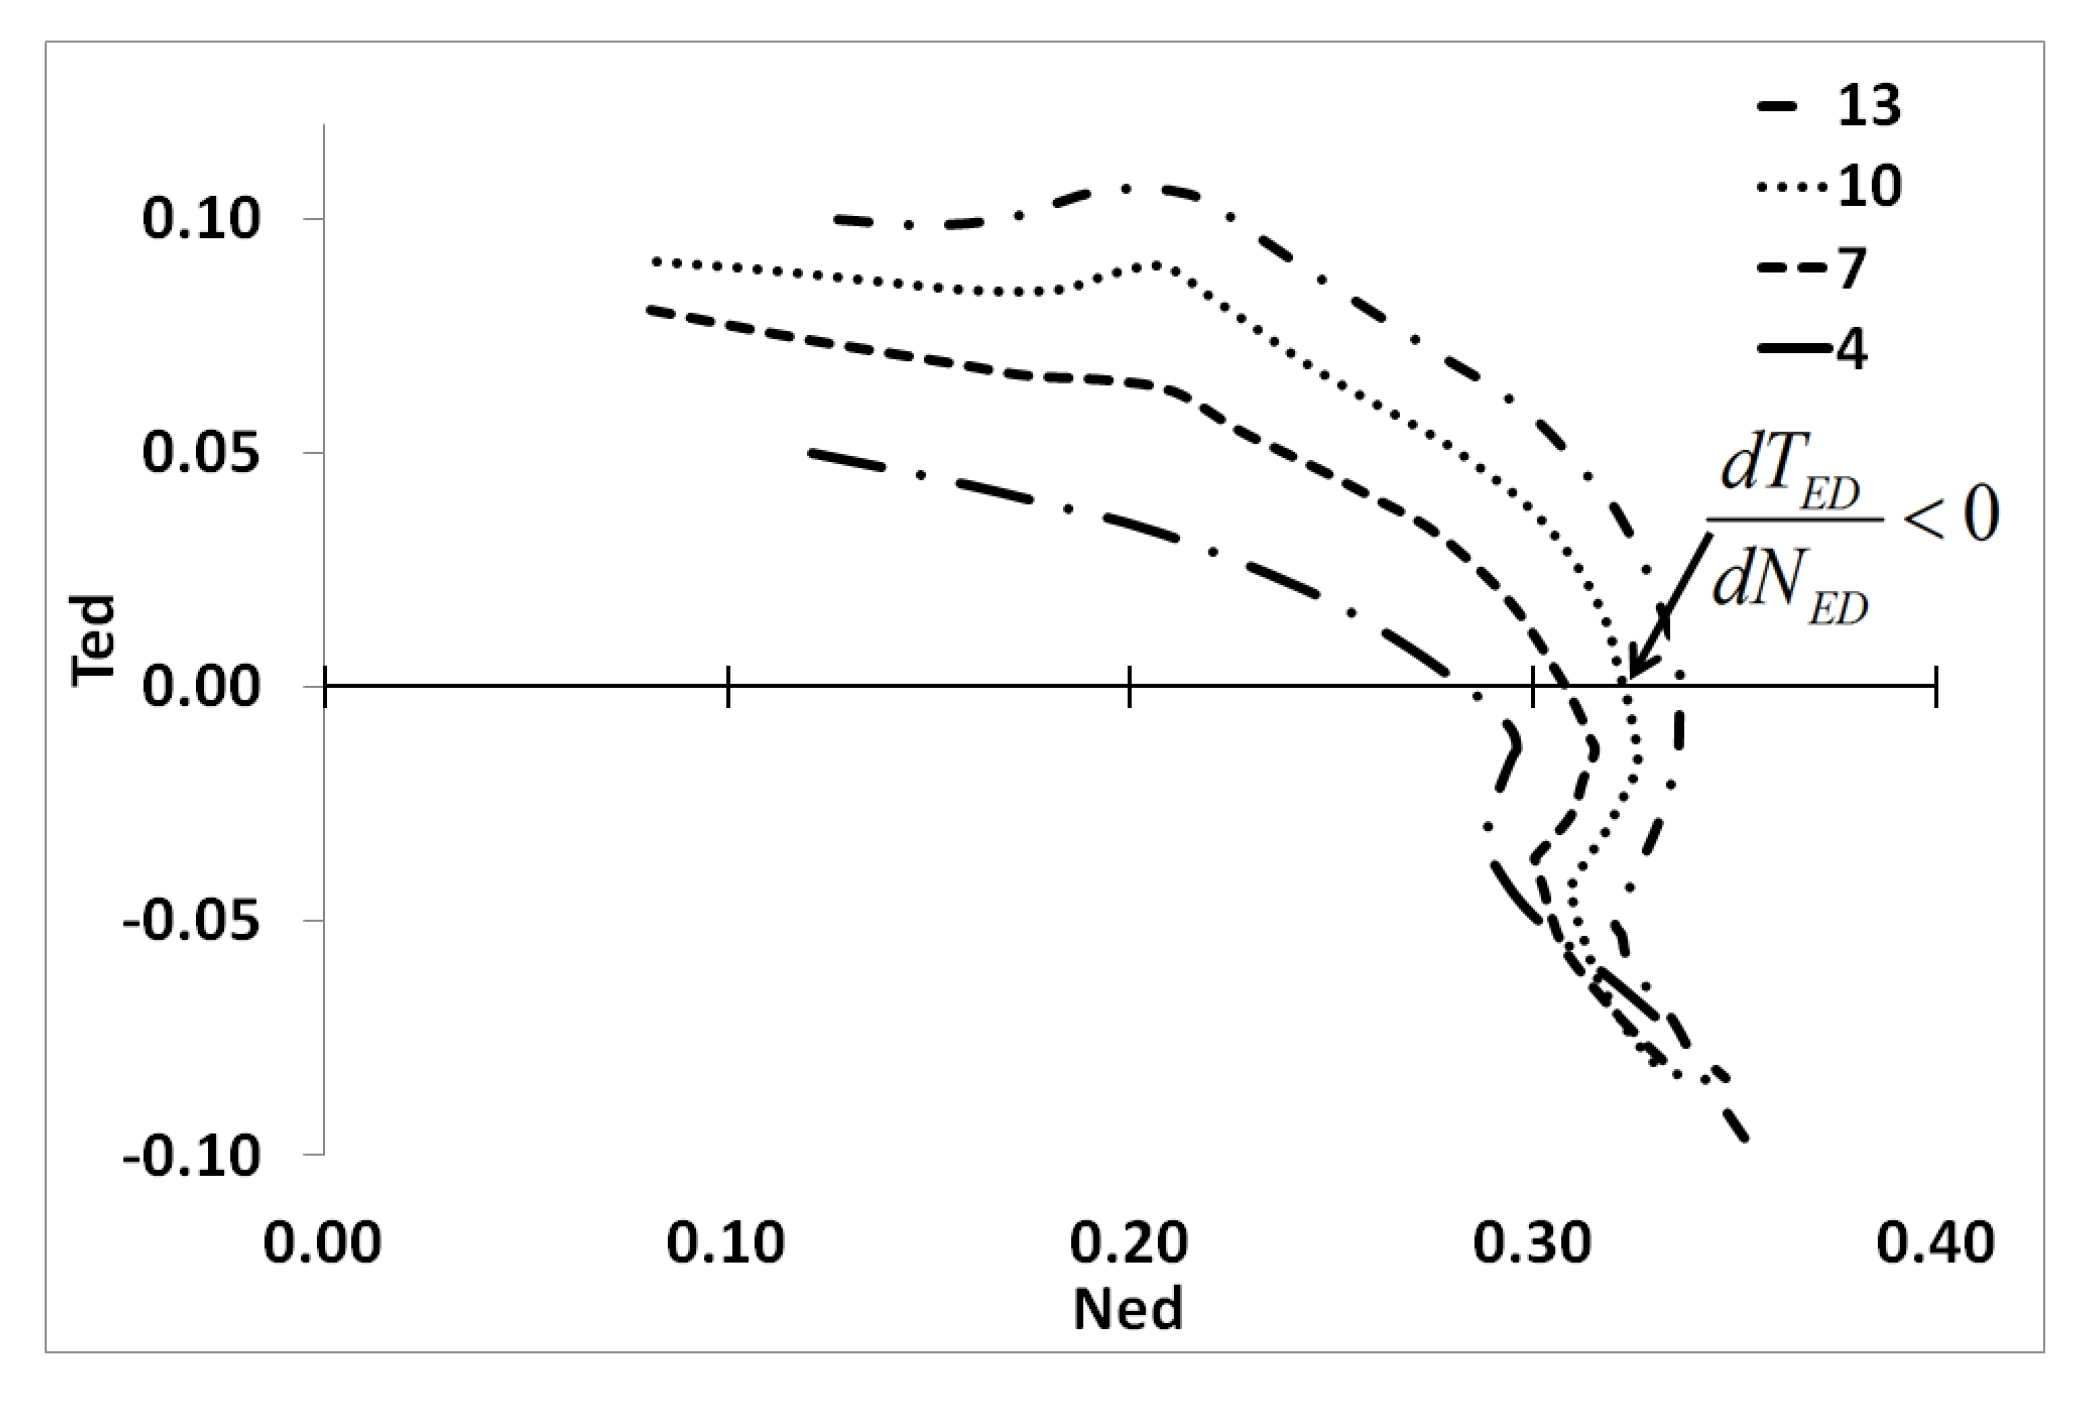
Figure 13 show the measured steady-state characteristics, unit torque-unit speed and unit flow-unit speed, respectively, together with the simulated steady-state characteristics from the turbine model. From
Figure 12 it is clear that the slope of the unit torque-unit speed at runaway
is less steep than measured, and the unit flow-unit speed slope at runaway (marked with stars) have a lower absolute value compared to the measured data. This leads to highly damped oscillations, as also reported by Martin [
11]. The oscillations can be provoked by changing the time constant for the rotational masses to a lower value; however, this will alter the steepness of the
-gradient and increase the maximum transient speed.
6. Conclusions
The measured dynamic characteristics showed behavior according to the stability criterion predicted by Martin. The oscillations were damped and the system regained steady-state operation at runaway after a short period of time. A significant deviation between the dynamic and steady-state characteristics was observed at values above . The same result was obtained for a high head Francis turbine model by Nielsen in 1990 and explained by means of inertia in the water masses inside the turbine. By redefining the net head removing the inertia, the dynamic and steady-state characteristics coincide.
Transient simulations show that it is possible to reproduce the physics in the measurement by using an analytical model for the pump-turbine in the system. The simulations show good accuracy with regards to flow and rotational speed during the sequence. Oscillations with a period of approximately T = 4 s are observed in the measured data. In the simulations, the oscillations have a longer period and show larger dampening than the measured data. This deviation is mainly caused by the modeling of the turbine; the slope of the unit torque-unit speed and unit flow-unit speed are not steep enough and have a lower absolute value than measured. Simulations can only be as accurate as the input data and for the modeling of the turbine there will be deviations. The model used is a a modified high head Francis turbine model and it is not able to reproduce the steepness or S-shape of the characteristics around runaway for the pump-turbine, hence compromises must be made during the tuning of the transient model. In this paper the main focus was to achieve the best possible fit with the measured dynamic sequence. The rotational speed and flow rate at steady-state runaway show a good match to the measured values together with the gradient of the increase in speed, .
Transient calculations of a pump-turbine prototype with the turbine model must be carried out with great caution. The stability criterion given by Martin depends on the gradient of the unit torque-unit speed at runaway. As shown in this paper the analytical model is not able to reproduce the correct steepness of the characteristics around runaway for the model pump-turbine. Hence, adjustments of the model according to the measurements was necessary. This tuning is often not possible with prototypes due to lack of measured data. As an initial calculation in the early stage of a project when no measured data are available the turbine model can be used, however measured data from model tests are recommended for analysis with purpose to reveal instability.
Acknowledgments
This work is financed by Center for Environmental Design of Renewable Energy (CEDREN). Contributions from Rainpower AS and The Waterpower Laboratory at NTNU during the work with this paper have been highly appreciated.
Author Contributions
This paper is part of the ongoing PhD-work of Eve Cathrin Walseth. Torbjørn K. Nielsen and Bjørnar Svingen are the PhD-candidates supervisors. Walseth has performed the experiments and analysis presented in this paper, and has prepared the manuscript. The presented experiment and turbine model is a continuation of Nielsen’s work and he has consulted during the planning and execution of the experiment and during the analysis of the results. Bjørnar Svingen has consulted during the transient analysis, modeling and discussion of measured data, and made editorial corrections.
Conflicts of Interest
The authors declare no conflict of interest.
Abbreviations
| A | Area () |
| Linear coefficient of relative torque on relative flow (-) |
| Inlet height (m) |
| D | Diameter (m) |
| g | Gravitational constant (m/) |
| H | Head (m) |
| h | Reduced head , (-) |
| I | Inertia (/) |
| n | Rotational speed (rpm) |
| p | Pressure (Pa) |
| Q | Flow rate (/s) |
| q | Reduced flow rate, (-) |
| Draft tube loss coefficient (-) |
| Viscous loss coefficient (-) |
| Mechanical loss coefficient (-) |
| r | Radius (m) |
| Time constant rotating masses (s) |
| T | Period of oscillations/Torque (s)/(Nm) |
| Time constant of water masses in penstock (s) |
| Time constant of water masses in the turbine (s) |
| u | Peripheral speed (m/s) |
| α | Guide vane angle (rad) |
| β | Runner blade angle (rad) |
| η | Turbine efficiency (-) |
| Efficiency generator (-) |
| κ | Guide vane opening degree (-) |
| ρ | Density of water (kg/) |
| Ω | Reduced rotational speed, (-) |
| ω | Rotational speed (1/s) |
Sub- and superscript
| dyn | Dynamic |
| net | Net |
| n | Nominal value |
| opt | Best efficiency point |
| r | Rated value |
| 1 | Runner inlet |
| 2 | Runner outlet |
| * | Best efficiency |
References
- Nielsen, T.K. Transient Characteristics of High Head Francis Turbines. Ph.D. Thesis, NTH (The Norwegian University of Science and Technology), Trondheim, Norway, 1990. [Google Scholar]
- Nielsen, T.K.; Olimstad, G. Dynamic Behavior of Reversible Pump—Turbines in Turbine Mode of Operation. In Proceedings of the International Symposium on Transport Phenomenon and Dynamics of Rotating Machinery, Honolulu, HI, USA, 4–7 April 2010.
- Olimstad, G.; Nielsen, T.K.; Boerresen, B. Geometry impact on pump-turbine characteristics. In Proceedings of the 14th International Symposium on Transport Phenomena and Dynamics of Rotating Machinery, Honolulu, HI, USA, 27 February–2 March 2012.
- Staubli, T.; Senn, F.; Sallaberger, M. Instability of Pump-Turbines during Start-up in Turbine Mode. In Proceedings of the Hydro 2008, Ljubljana, Slovenija, 6–8 October 2008.
- Hasmatuchi, V.; Roth, S.; Botero, F.; Avellan, F.; Farhat, M. High-speed flow visualization in a pump-turbine under off-design operating conditions. IOP Conf. Ser. Earth Environ. Sci. 2010, 12, 012059. [Google Scholar] [CrossRef]
- Olimstad, G. Characteristics of Reversible-Pump Turbines. Ph.D. Thesis, The Norwegian University of Science and Technology (NTNU), Trondheim, Norway, 2012. [Google Scholar]
- Staubli, T.; Widmer, C.; Tresch, T.; Sallaberger, M. Starting pump-turbines with unstable characteristics. In Proceedings of the Hydro 2010, Lisbon, Portugal, 27–29 September 2010.
- Klemm, D. Stabilizing the Characteristics of a Pump-turbine in the Range between Turbine Part-Load and Reverse Pumping Operation. Voith Res. Constr. 1982, 28e, 111202–111210. [Google Scholar]
- Dörfler, P.; Engineer, A.J.; Pendse, R.; Huvet, P.; Brahme, M. Stable operation achieved on a single-stage reversible pump-turbine showing instability at no-load. In Proceedings of the 19th Symposium on Hydraulic Machinery and Systems, Singapore, 9–11 September 1998.
- Martin, C. Stability of pump-turbines during transient operation. In Proceedings of the International conference on pressure surges, Hannover, Germany, 22–24 September 1986.
- Martin, C. Instability of pump-turbines with s-shaped characteristics. In Proceedings of the 20th IAHR Symposium on Hydraulic Machinery and Systems, Charlotte, NC, USA, 6–9 August 2000.
- Olimstad, G.; Nielsen, T.K.; Boerresen, B. Design of a Reversible Pump-Turbine with Purpose to Investigate Stability. In Proceedings of the 4th International Meeting on Cavitation and Dynamic Problems in Hydraulic Machinery and Systems, Belgrade, Serbia, 26–28 October 2011.
- (IEC), I.E.C. IEC 60041: Field Acceptance Tests to Determine the Hydraulic Performance of Hydraulic Turbines, Storage Pumps and Pump Turbines; International Electrotechnical Commission: Geneva, Switzerland, 1991. [Google Scholar]
- Wheeler, A.J.; Ganji, A.R. Introduction to Engineering Experimentation; Pearson Education, Inc.: Upper Saddle River, NJ, USA, 2004. [Google Scholar]
- Ramdal, J. Efficiency Measurements in Low Head Hydro Power Plants. PhD Thesis, The Norwegian University of Science and Technology (NTNU), Trondheim, Norway, 2011. [Google Scholar]
- Wylie, E.; Streeter, V. Fluid Transients in Systems; Prentice Hall: Upper Saddle River, NJ, USA, 1993. [Google Scholar]
- Walseth, E.C.; Svingen, B.; Nielsen, T.K. Comprehensive experimental study of instability in a reversible pump-turbine model at no-load operation. In Proceedings of the Hydro 2013, Bilbao, Spain, 29–31 October 2012.
© 2016 by the authors; licensee MDPI, Basel, Switzerland. This article is an open access article distributed under the terms and conditions of the Creative Commons by Attribution (CC-BY) license (http://creativecommons.org/licenses/by/4.0/).


