2.1. Overview of Standards for Evaluating the Thermal Performance of Curtain Walls
The thermal performance of curtain walls can be determined by measurement or calculation in accordance with the standards for windows and doors. Since an international standard for the measurement of the thermal transmittance of curtain-wall systems (U
CW) does not exist, the standards for windows and doors, including ISO 12567-1 [
11], ASTM C1199-09 [
12], AAMA 1503-09 [
13], NFRC 102-2010 [
14], and KS F 2278 [
15], are generally used for this purpose. According to these international or national standards, the thermal transmittance, or the U-value, of a test specimen is measured by means of the calibrated or guarded hot-box method for which the test conditions are similar to the actual indoor and outdoor environments and conditions of windows and doors. These standards are designed to provide both standardized tests, which enable a fair comparison of different products, and specific tests for products for practical application purposes [
11]. The former specifies standardized specimen sizes, and its measurement result is usually issued for the certificates of the window energy rating systems in many countries since it allows consumers to compare the thermal performances of different products under the same conditions, whereby they can subsequently select superior products based on the comparison.
While the measurement offers relatively accurate values, as it involves a performance evaluation for actual specimens, it is too costly and time-consuming to apply for the evaluation of every design alternative at the development stage of new products. For this purpose, a numerical simulation can be preferable because it requires less time and expense. Simulation methods are also accepted by window energy rating schemes for the rating and certification of window products [
16]. For example, the U.S. National Fenestration Rating Council (NFRC) allows for the rating of windows not only by the measurement, but also by the calculation from its approved simulation software [
14]. The window energy rating system in Korea allows not only the measured thermal transmittance according to KS F 2278 [
15], but also the calculated results according to ISO 15099 [
17]. Taking into consideration the time and cost, it has become increasingly popular in both research and industry to evaluate the thermal performance of windows based on the calculation method and the use of reliable standards and simulation programs.
ISO 15099 [
17], ISO 10077-1 [
18], and ISO 10077-2 [
19] are generally used to calculate the thermal transmittances of windows and doors. These standards, originally developed for the evaluation of windows, have also been used for curtain wall systems because of the absence of specific standards for curtain wall systems. However, curtain walls differ from windows in that they have a much larger continuous glazing portion, a configuration and components of a greater complexity, and heat flow at the joints [
5,
7]. Therefore, ISO 12631 [
20] was recently developed to specify a procedure for the calculation of the thermal transmittance of curtain wall systems.
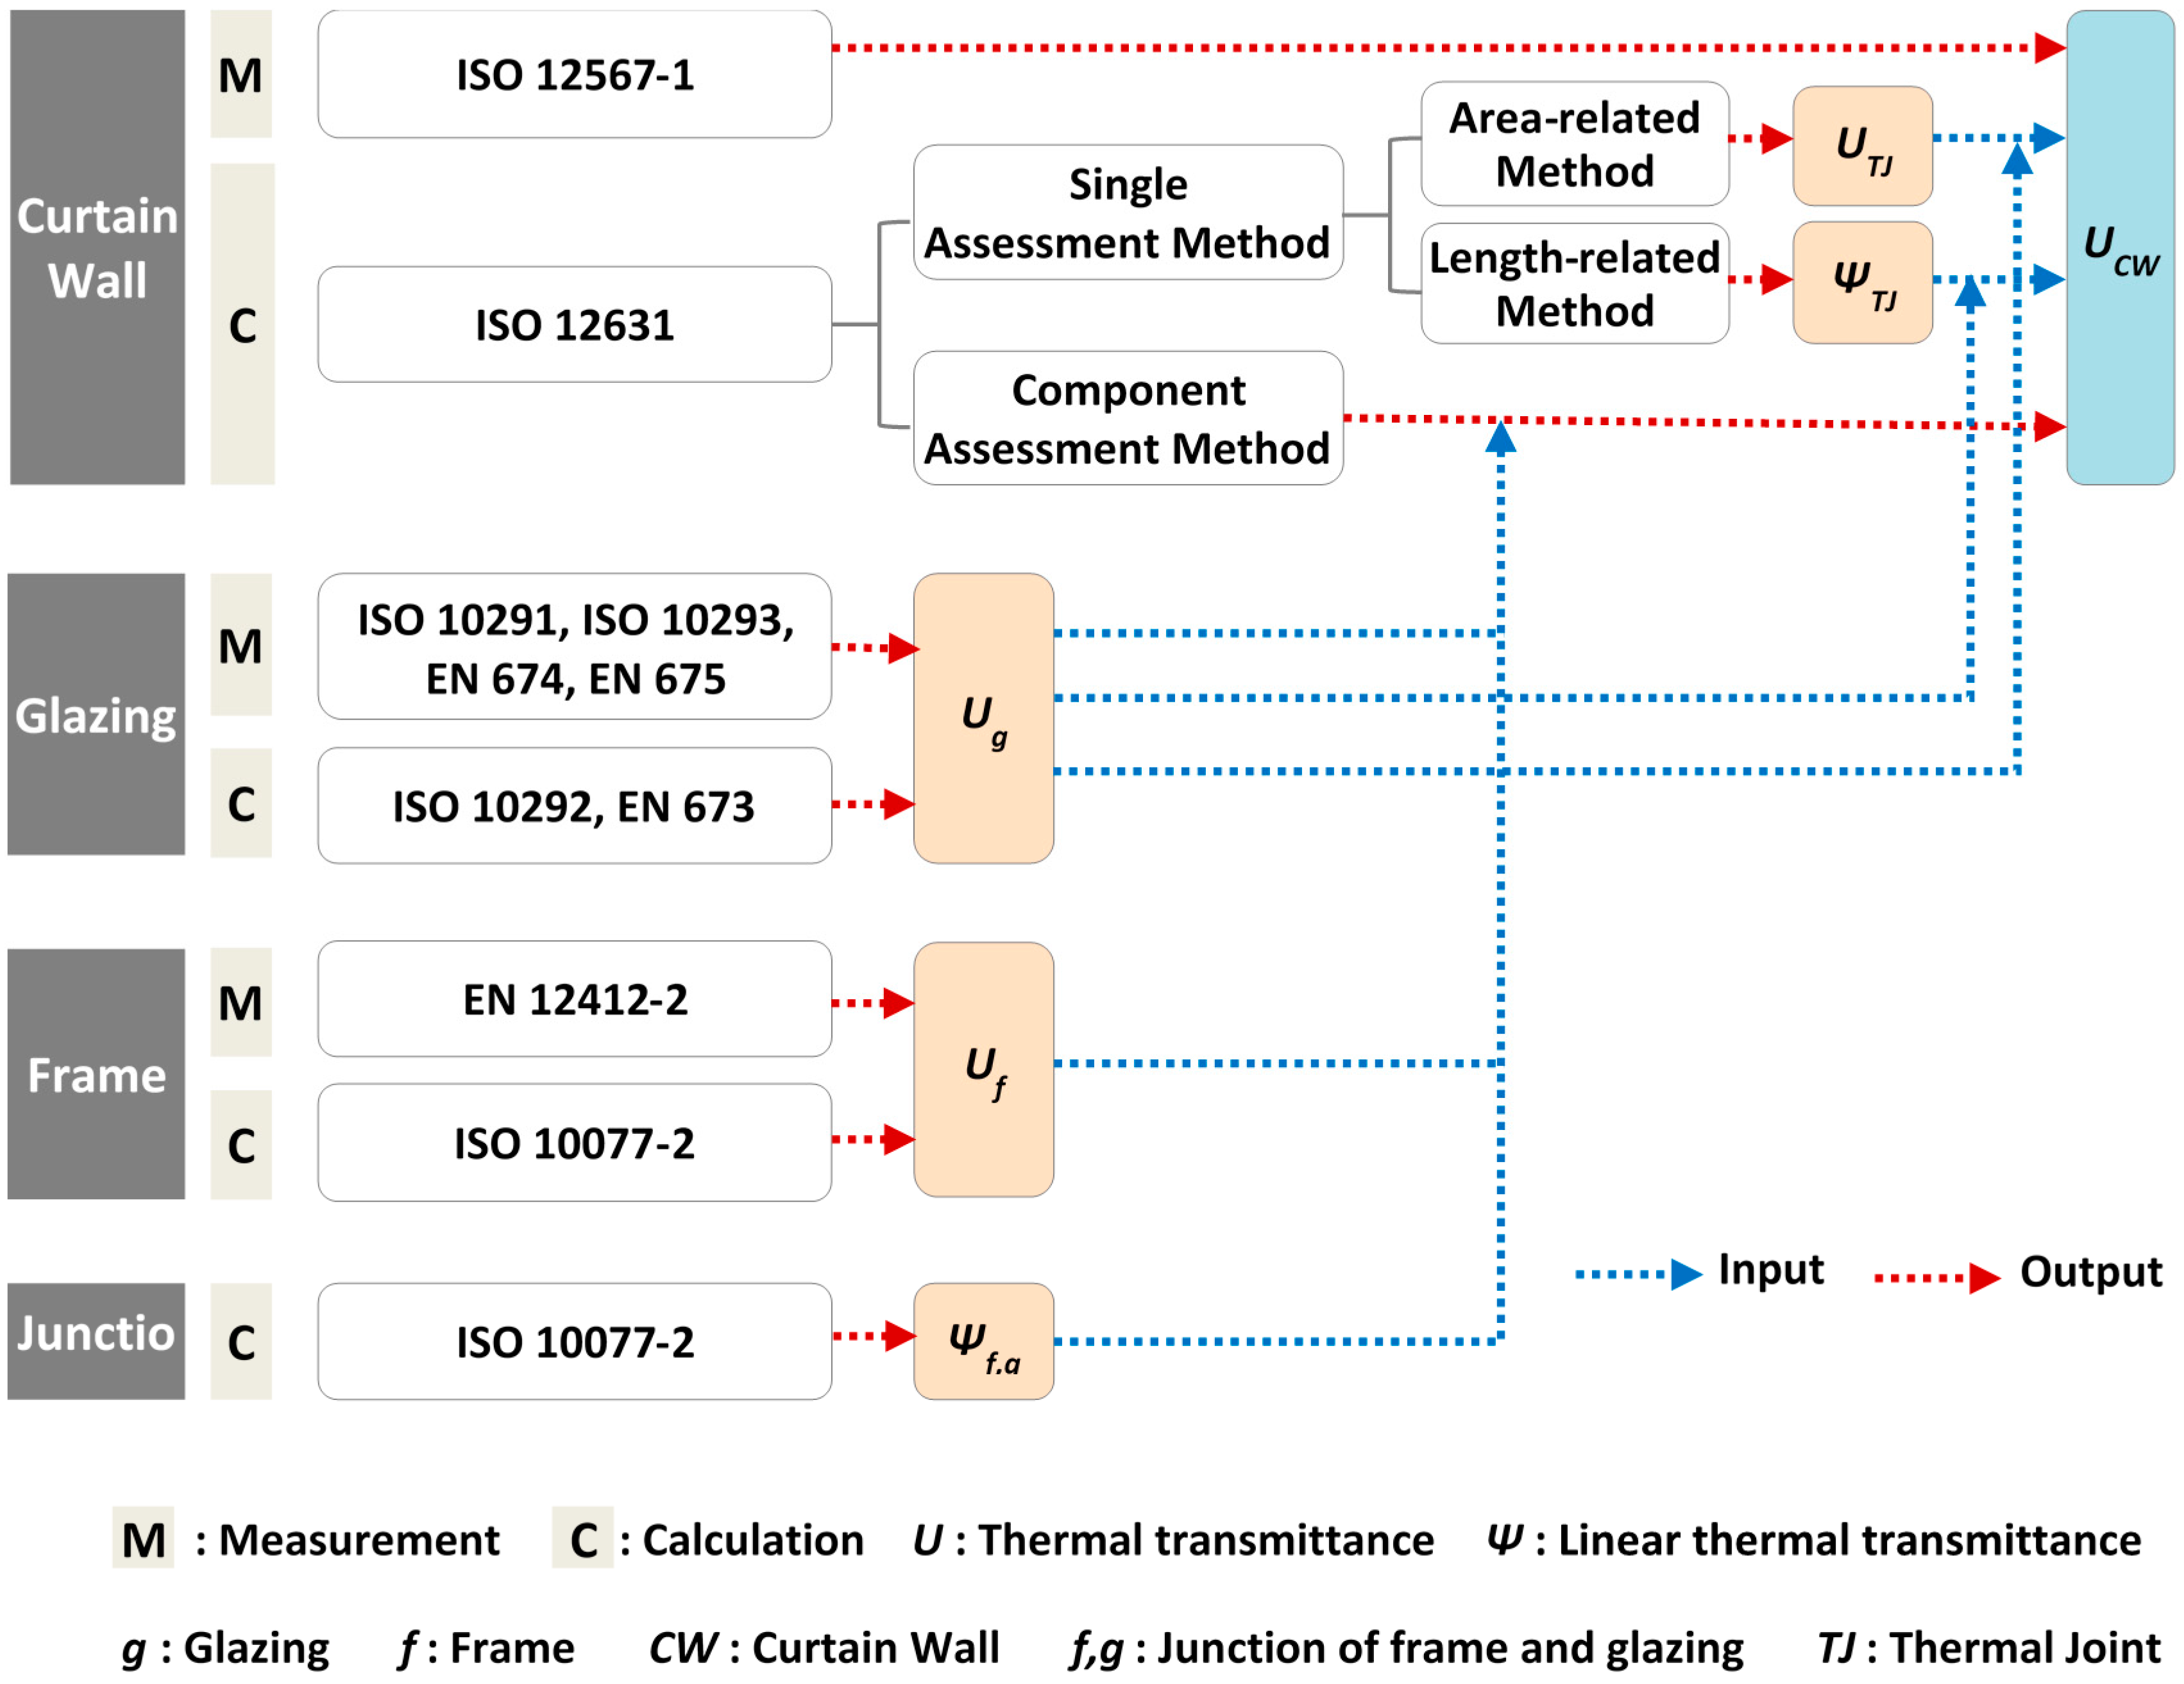
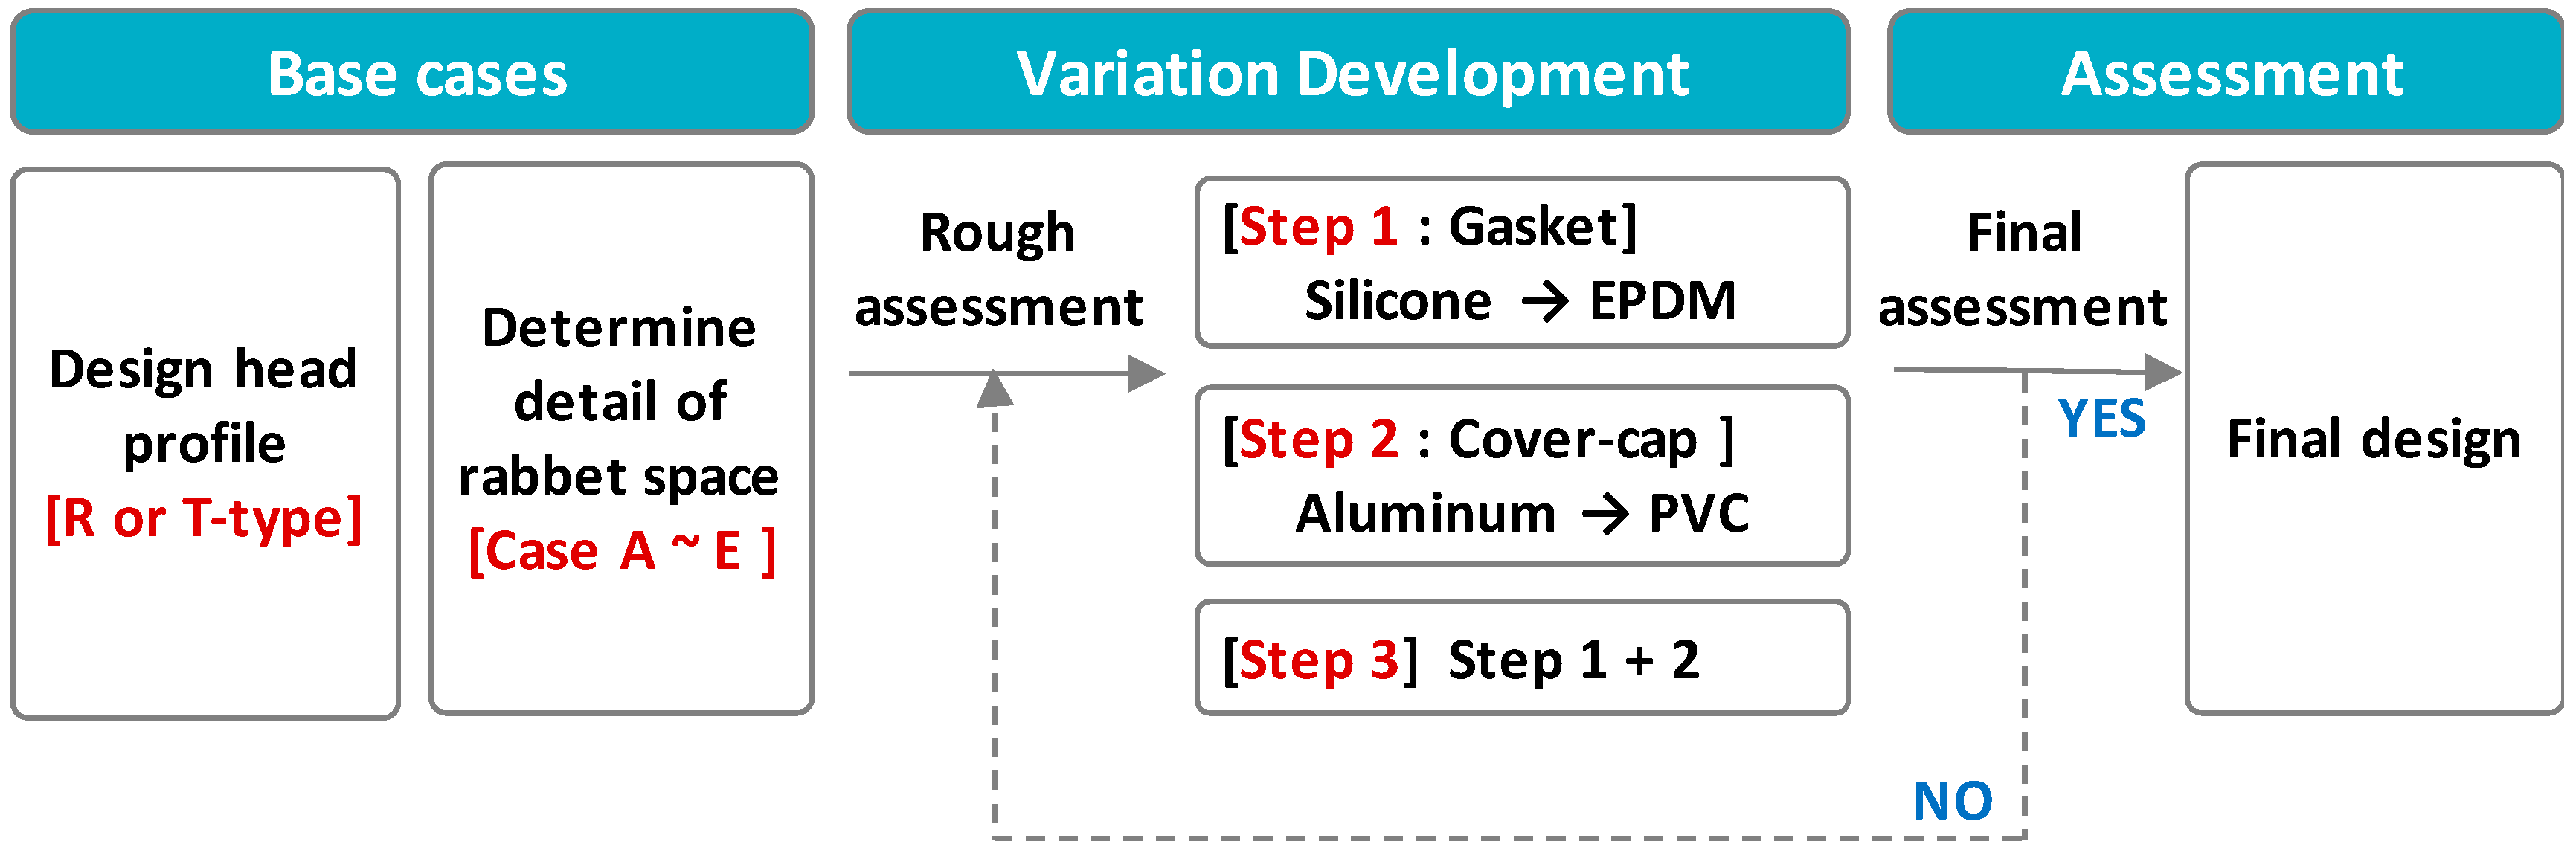
This standard can be used to calculate the thermal transmittance of curtain wall systems by considering the heat transfer through the glazed area, the frame area, and the panel area, as well as the thermal interaction between them. Two different methods were specified to calculate the thermal transmittances in ISO 12631 [
20], as follows: the single assessment method and the component assessment method. In the single assessment method, the overall thermal transmittance of the curtain wall was calculated by area according to a weighting of the U-values of the thermal joints and the filling elements. The additional heat flow rate through the thermal joints was considered in terms of both the area-related thermal joint transmittance and the length-related linear thermal joint transmittance. The component assessment method divides the representative element into areas of different thermal properties. The overall U
CW was calculated by area-weighting the U-values of these elements with additional correction terms; linear thermal transmittance that describes the thermal interaction between these elements. The determining process of the overall U
CW is shown in
Figure 1. The calculated results according to this standard can be used for a comparison of the thermal transmittances of different types of curtain wall systems, or as a part of the input data for calculating building energy consumption.
2.2. Calculation Method and Validation
Since the measurement of the U
CW of multiple design alternatives is too costly and time-consuming in the early stage of development, their performances were evaluated according to the calculation method. Prior to the evaluation of the alternatives, the calculation method was validated by comparing the calculated and measured U
CW values of the test specimens according to ISO 12631 [
20] and KS F 2278 [
15], respectively. ISO 12631 [
20] specifies that testing according to ISO 12567-1 [
11] is an alternative to its calculation method, and KS F 2278 [
15] is generally equivalent to ISO 12567-1 [
11], except for a minor difference of the boundary conditions, as shown in
Table 1.
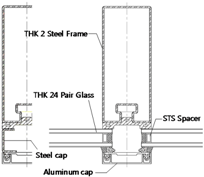
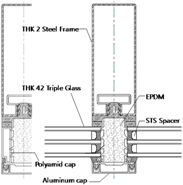
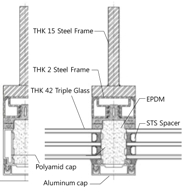
The steel curtain wall can be classified into the roll-formed frame and the welded frame, depending on the manufacturing method [
10]. In this study, two curtain walls with the roll-formed frames and one with the welded frame were selected for the validation, as shown in
Table 2.
The measurements were carried out according to KS F 2278 [
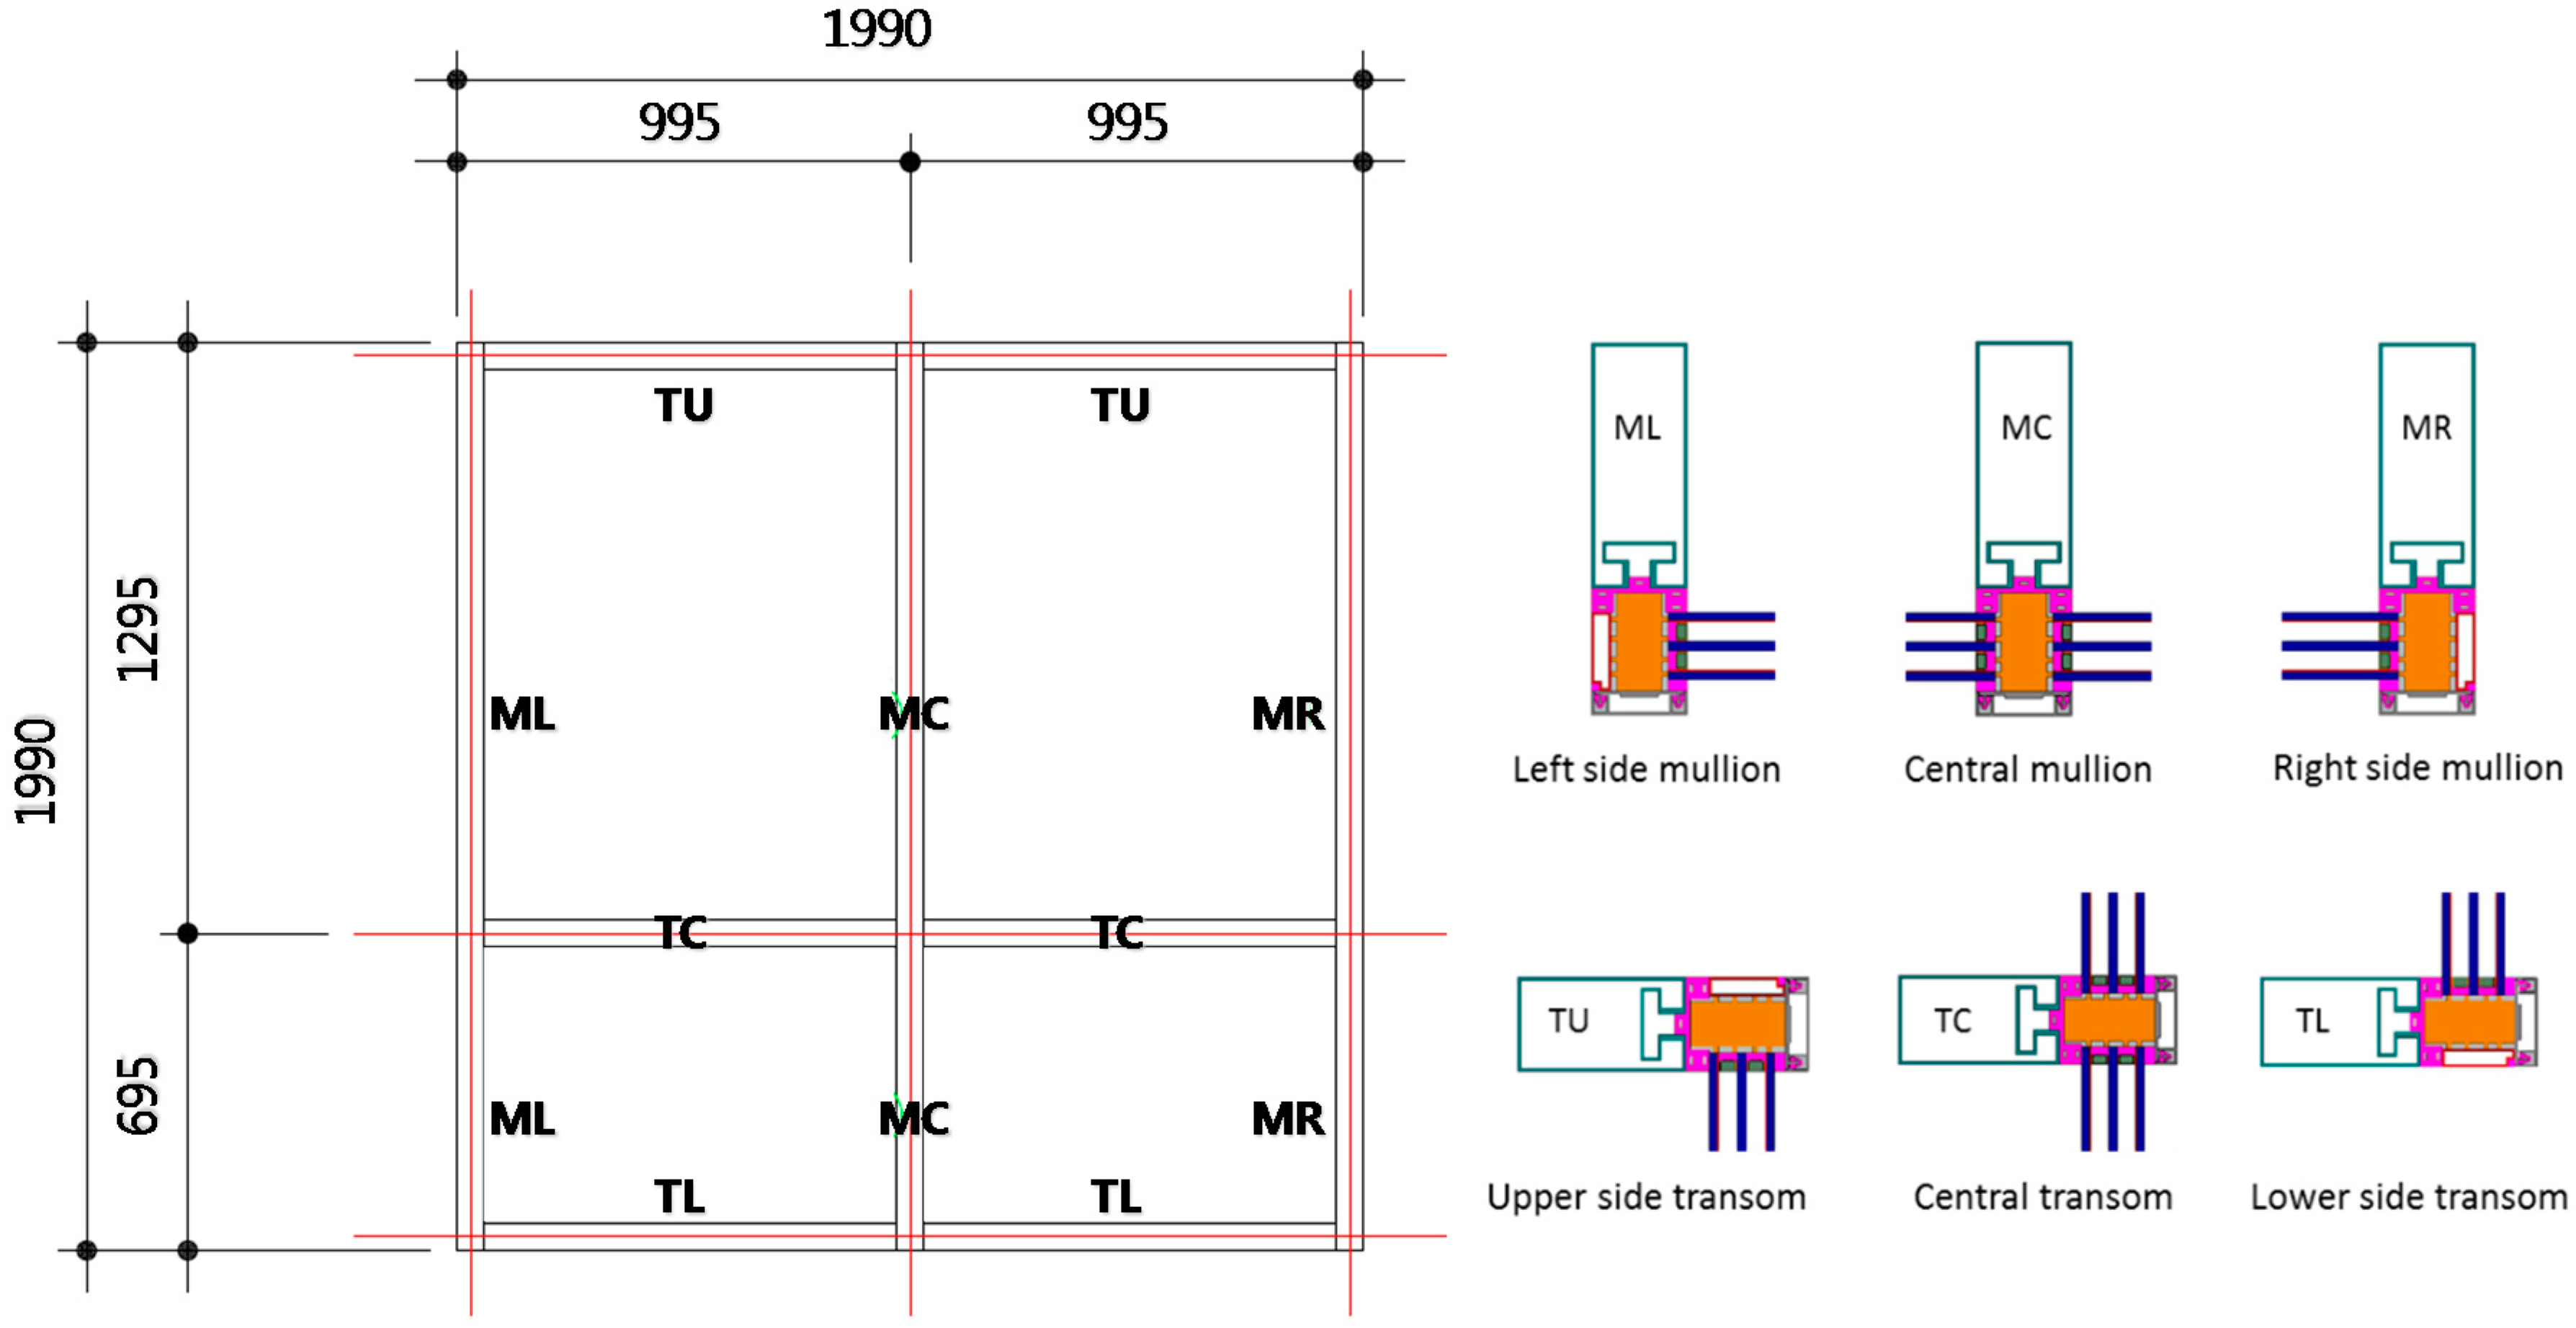
15] in the test facility of the Korea Institute of Civil Engineering and Building Technology, which is accredited by the Korean Laboratory Accreditation Scheme. Considering the hot-box metering area (2000 mm × 2000 mm), the dimensions of the test specimens were set up as 1990 mm × 1990 mm, as shown in
Figure 2. The perimeter joints between the surrounding panel and the specimen were sealed on both sides with caulking material. The tests were performed under steady-state conditions at the temperatures of 20 °C and 0 °C at the indoor and outdoor sides, respectively. The air flow was also adjusted according to the standard, as specified in
Table 1. The surface temperatures of the specimen were measured with T-type thermocouples at the center of nine parts of the specimens.
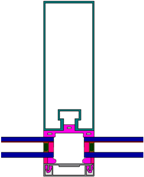
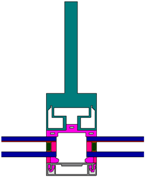
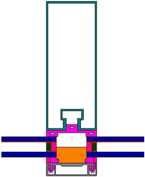
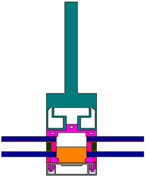
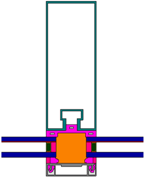
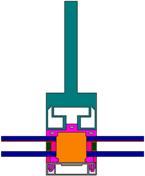
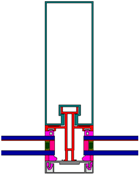
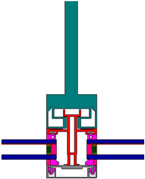
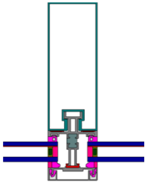
To calculate U
CW by the calculation method, the curtain wall was divided into six cross-sections for modeling in accordance with ISO 12631 [
20], as shown in
Figure 2. The heat flow rates through the glazing, frame, and joints were calculated using Physibel Trisco 12.0 w (Maldegem, Belgium), a three-dimensional, steady-state heat transfer analysis program that conforms to ISO 10211 [
21] and ISO 10077-2 [
19]. In the simulations, the indoor and outdoor temperatures and the air flow conditions were also set up according to KS F 2278 [
15] so that the calculated and measured values could be compared.
Table 3 shows the thermal conductivities of the materials that were used in the numerical simulation, which were obtained from manufacturers or ISO 10077-2 [
19]. First, the U
M, U
T, and U
g were evaluated according to ISO 10077-2 [
19] and ISO 10077-1 [
18]. Second, the U
TJ and Ψ
TJ were evaluated according to ISO 12631 [
20] for the simple-assessment method, and the Ψ
M,g and Ψ
T,g were also evaluated according to ISO 10077-2 [
19] for the component-assessment method. Lastly, the U
CW was calculated according to the area-related single-assessment method, the length-related single-assessment method, and the component-assessment method specified in ISO 12631 [
20].
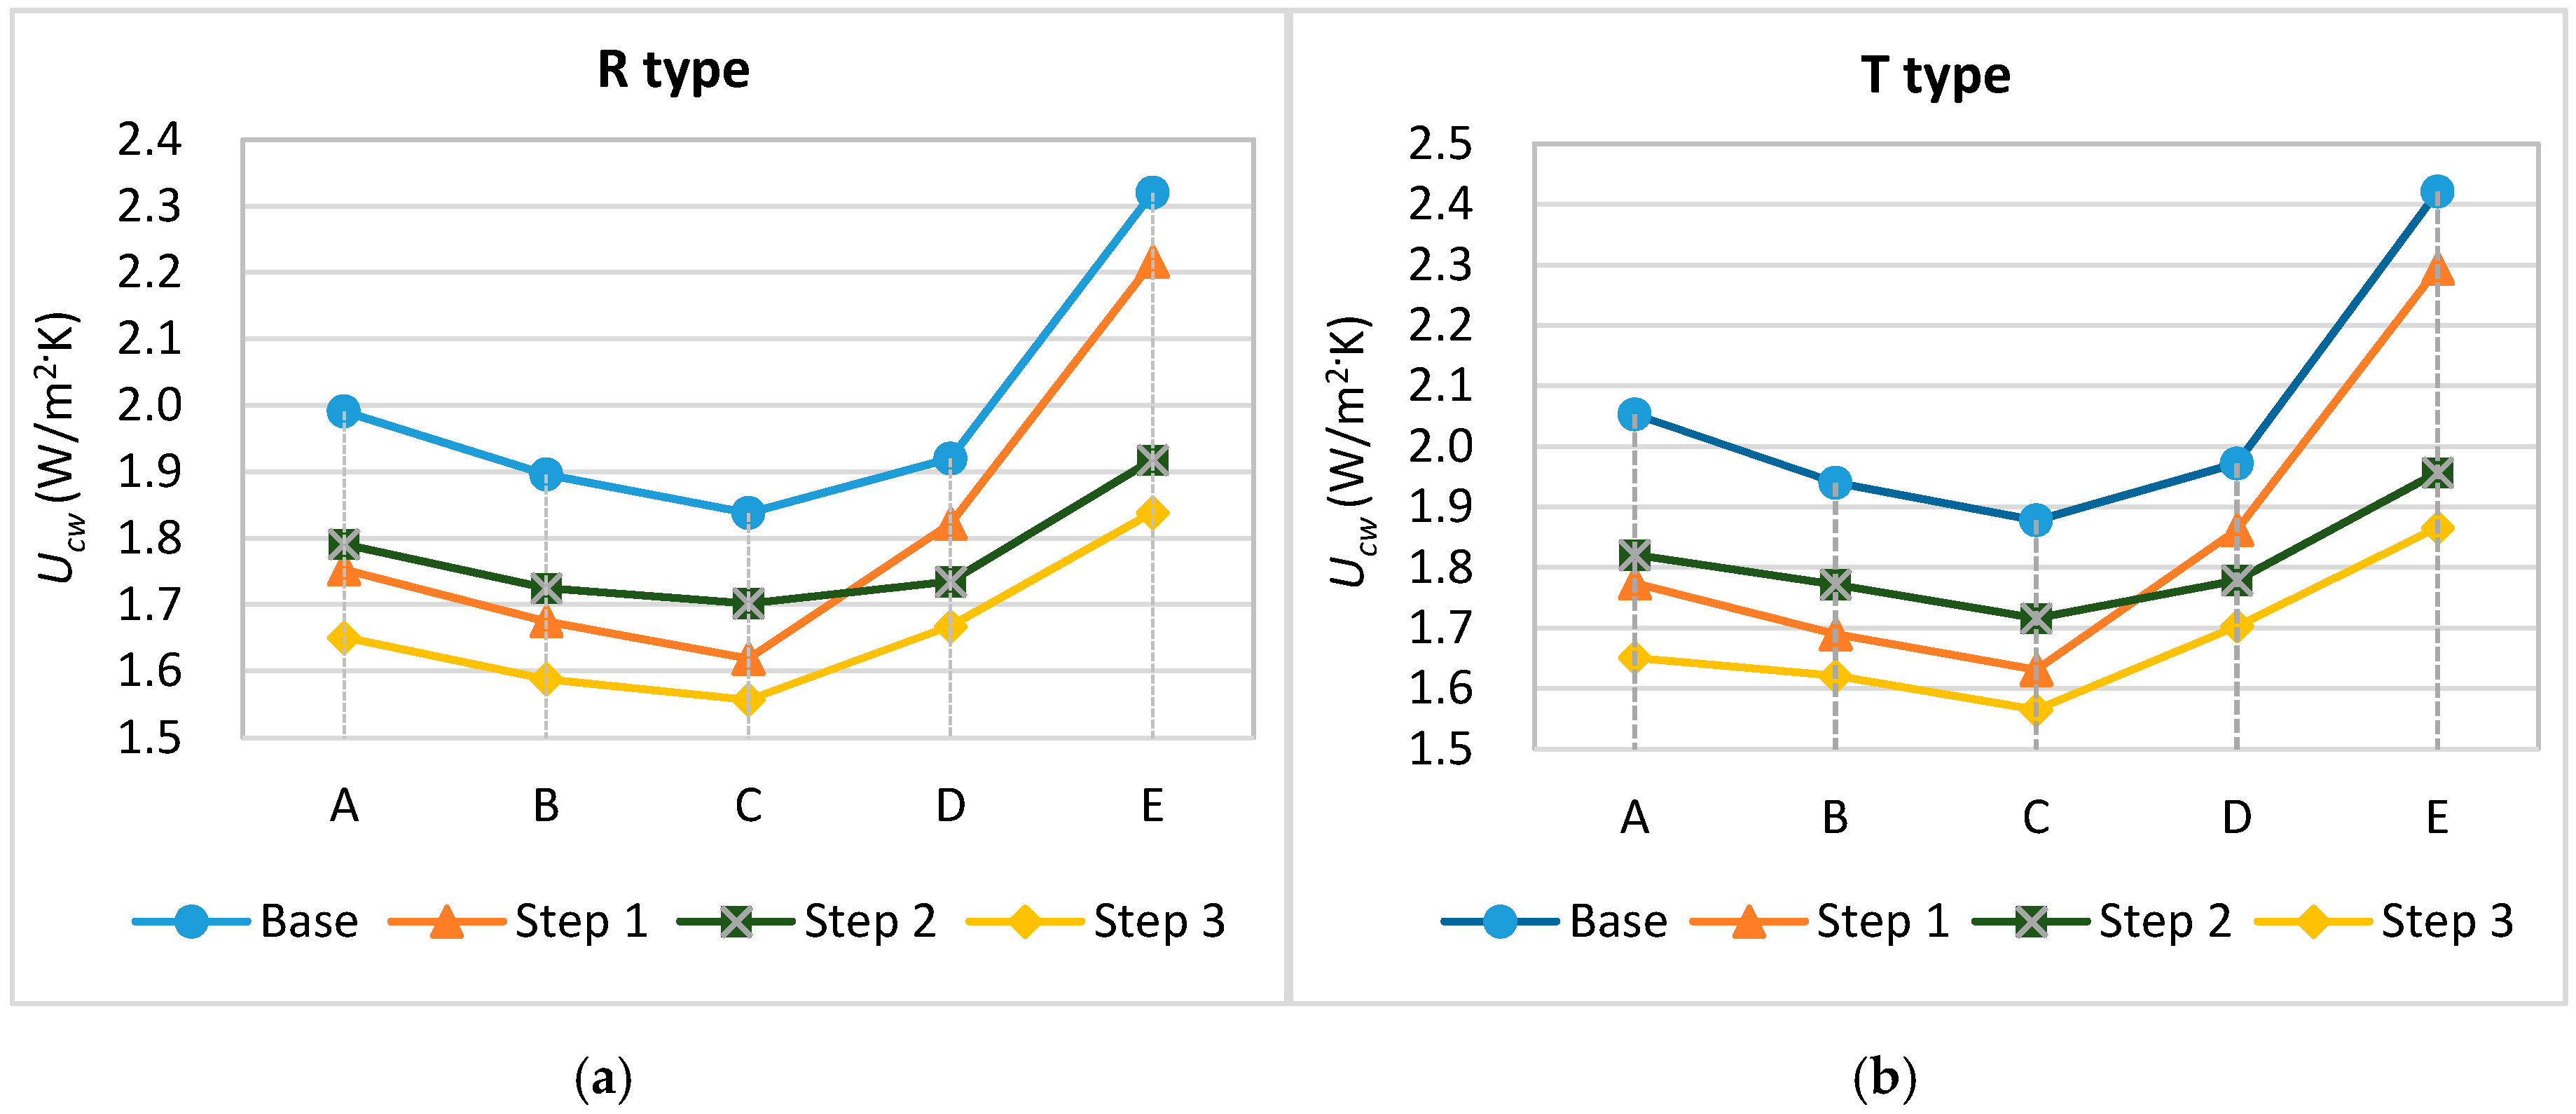
Table 4 shows the comparison of the measured and the calculated U
CW values. The thermal transmittances of specimens 2 and 3 are much lower than that of specimen 1, since they were applied with high thermal performance materials, such as triple low-e coated glazing, ethylene propylene diene monomer (EPDM) filling, and the polyamide cap. There is no significant difference between specimens 2 and 3. There is a sound agreement between the overall measured and calculated values, and the differences range from 0.3% to 3.8%.


