
An Improved Adaptive-Torque-Gain MPPT Control for Direct-Driven PMSG Wind Turbines Considering Wind Farm Turbulences

Abstract
:1. Introduction
2. Conventional MPPT (Maximum Power Point Tracking) Methods
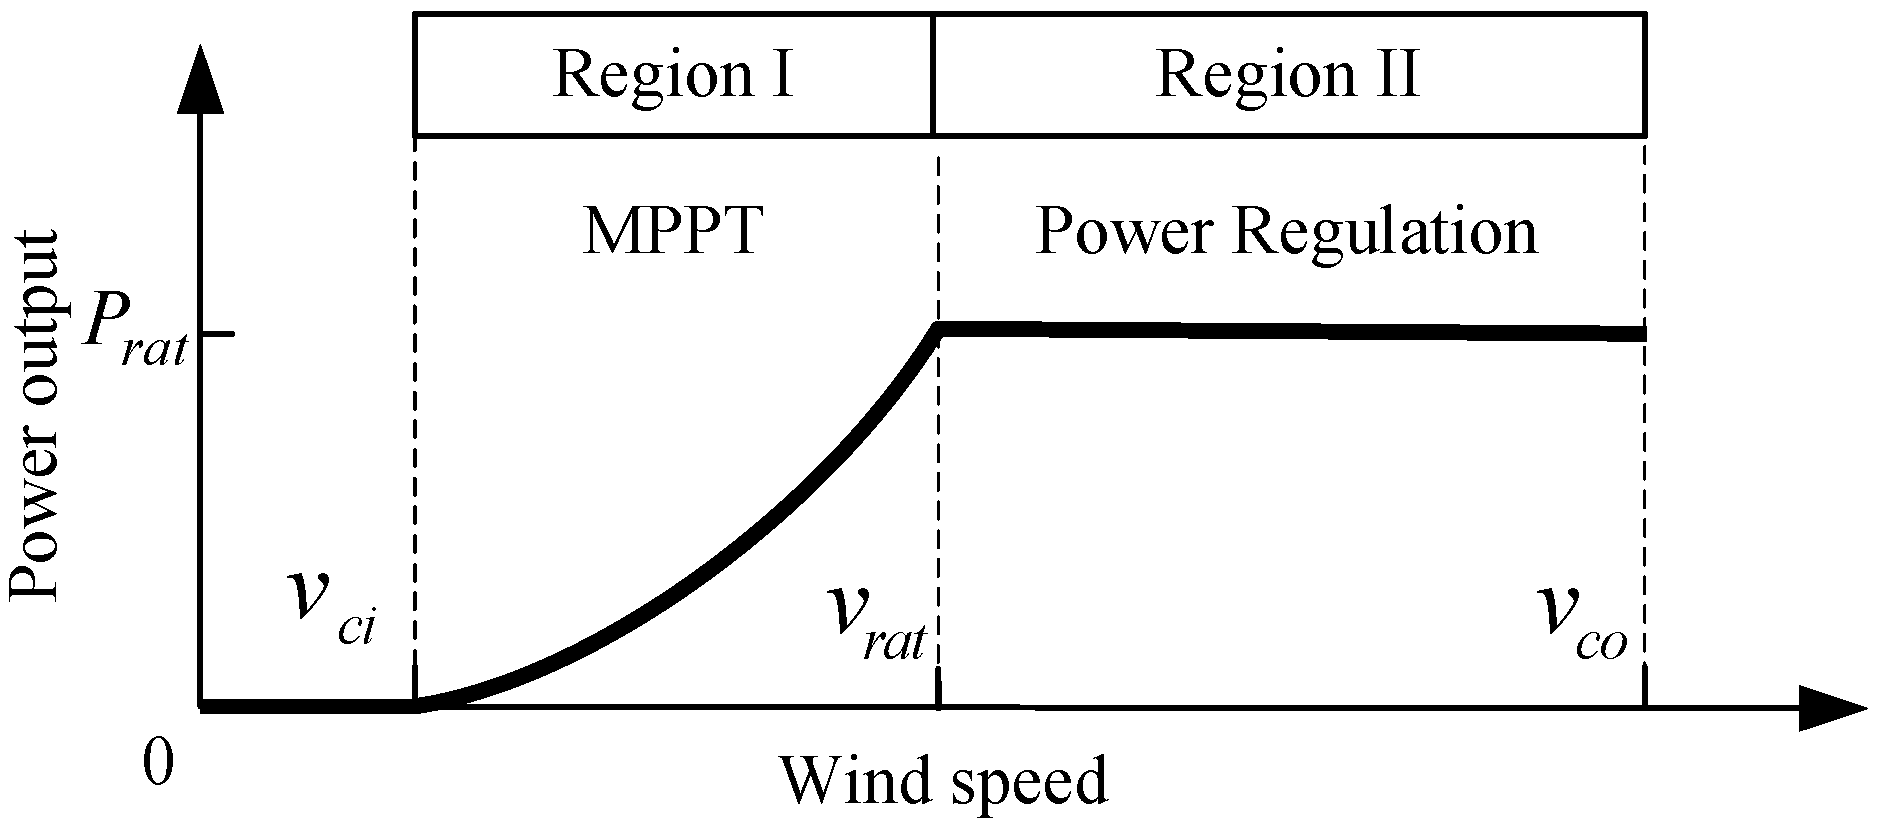
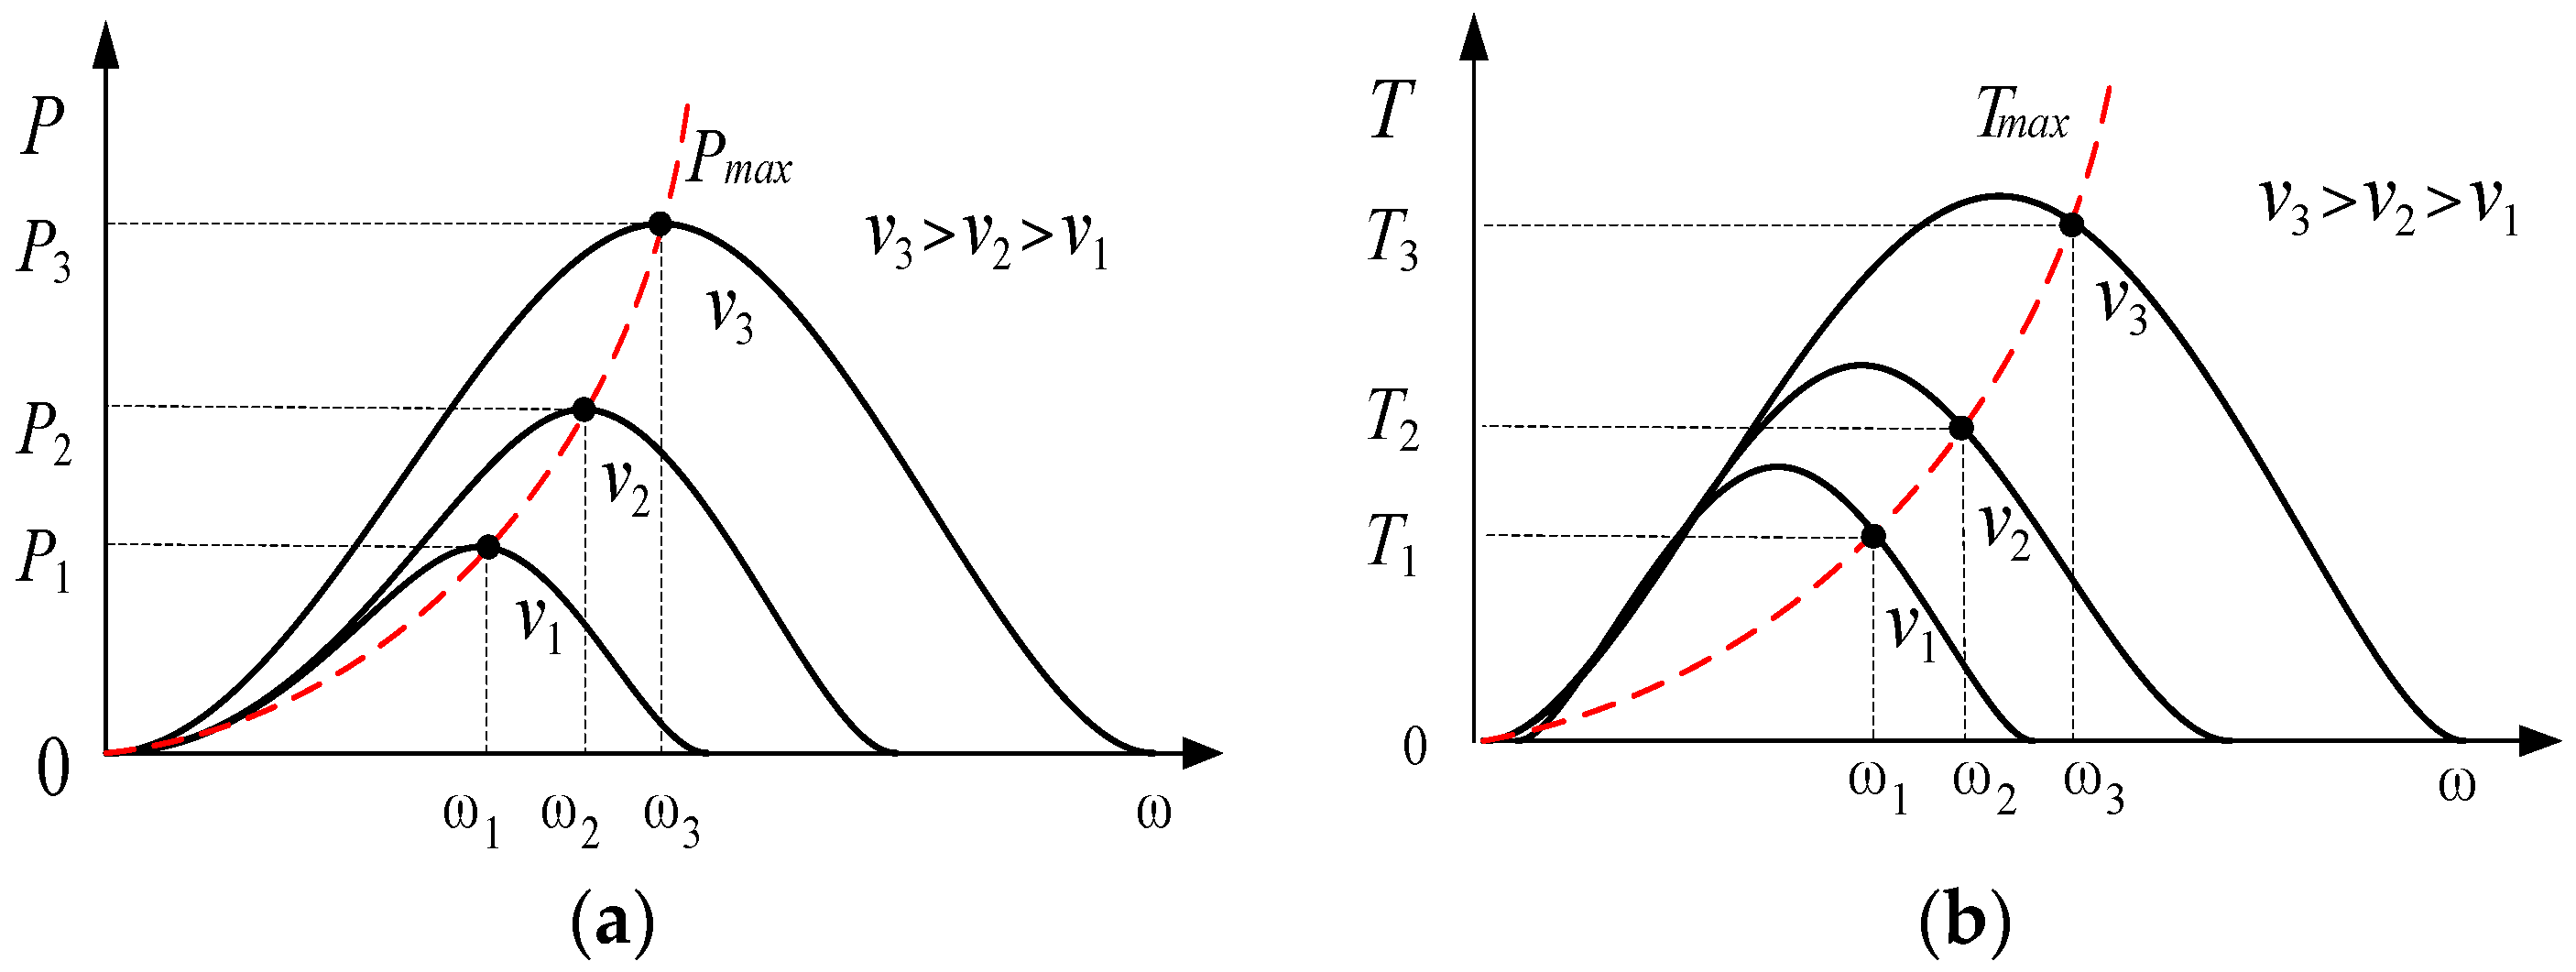
2.1. WECS Models
2.2. MPPT Methods
3. Improved MPPT Method
3.1. Challenges of DTG Control and ATG Control
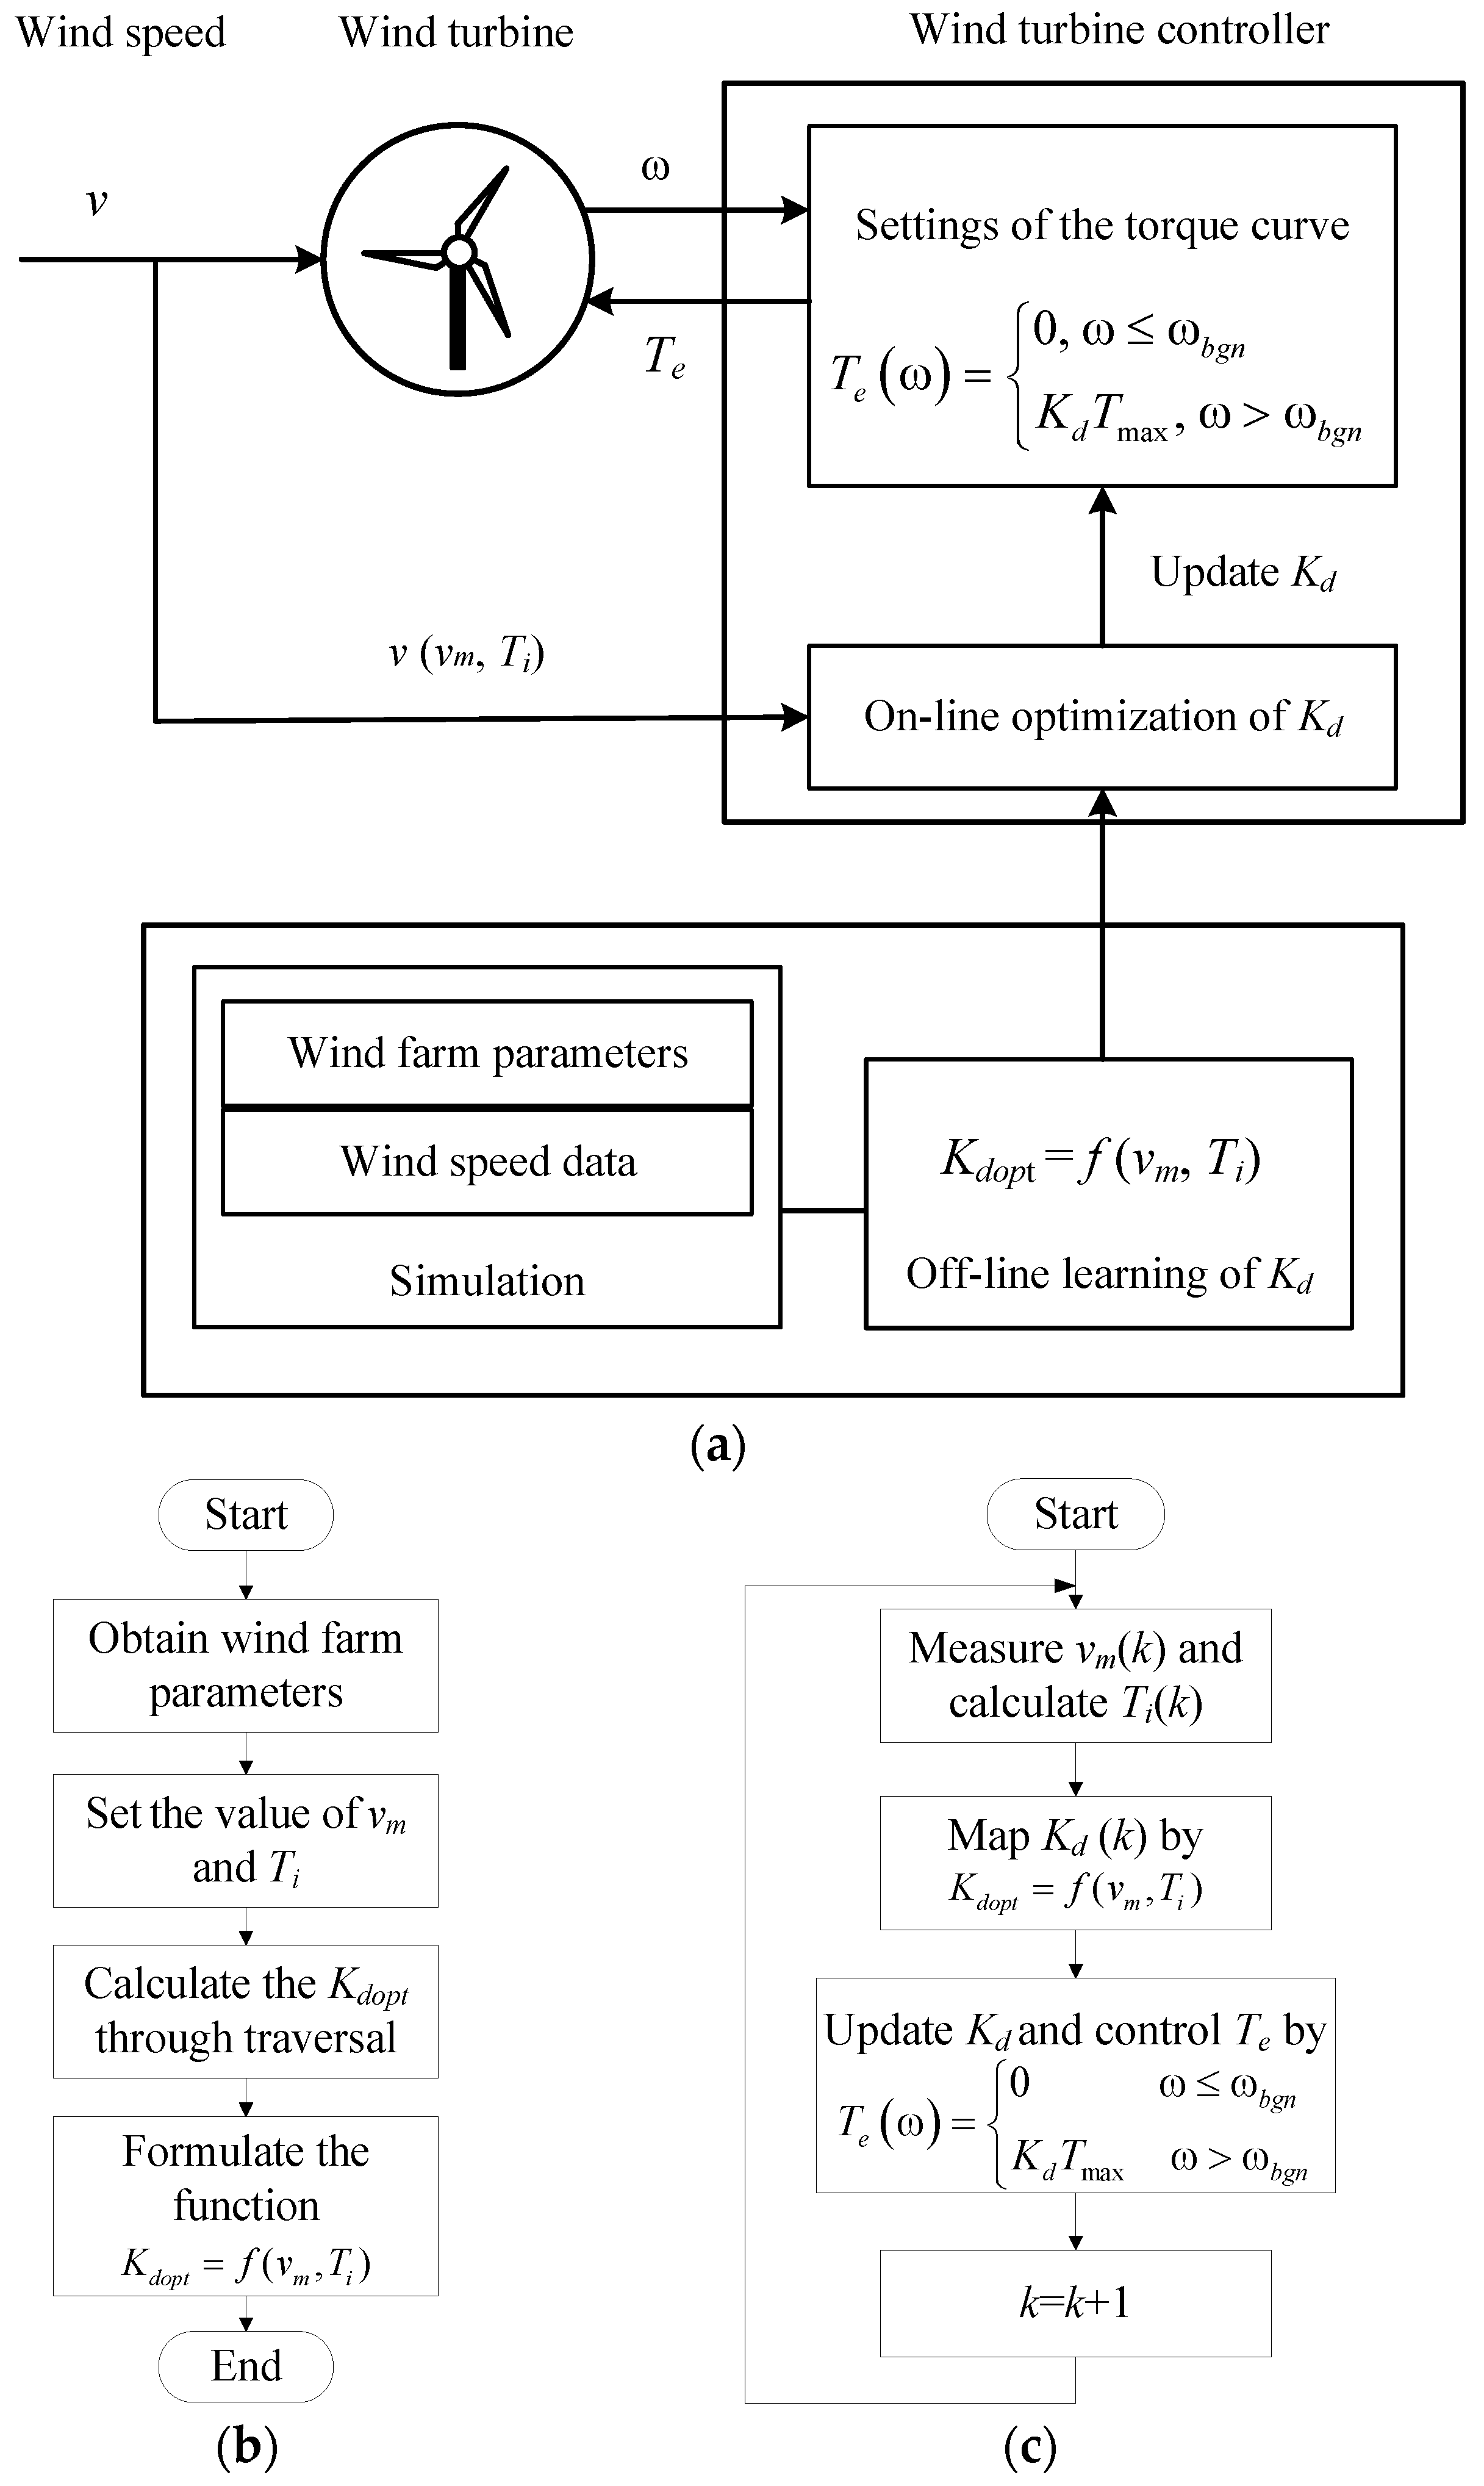
3.2. Improved ATG control
4. Simulation Results
4.1. Off-Line Learning
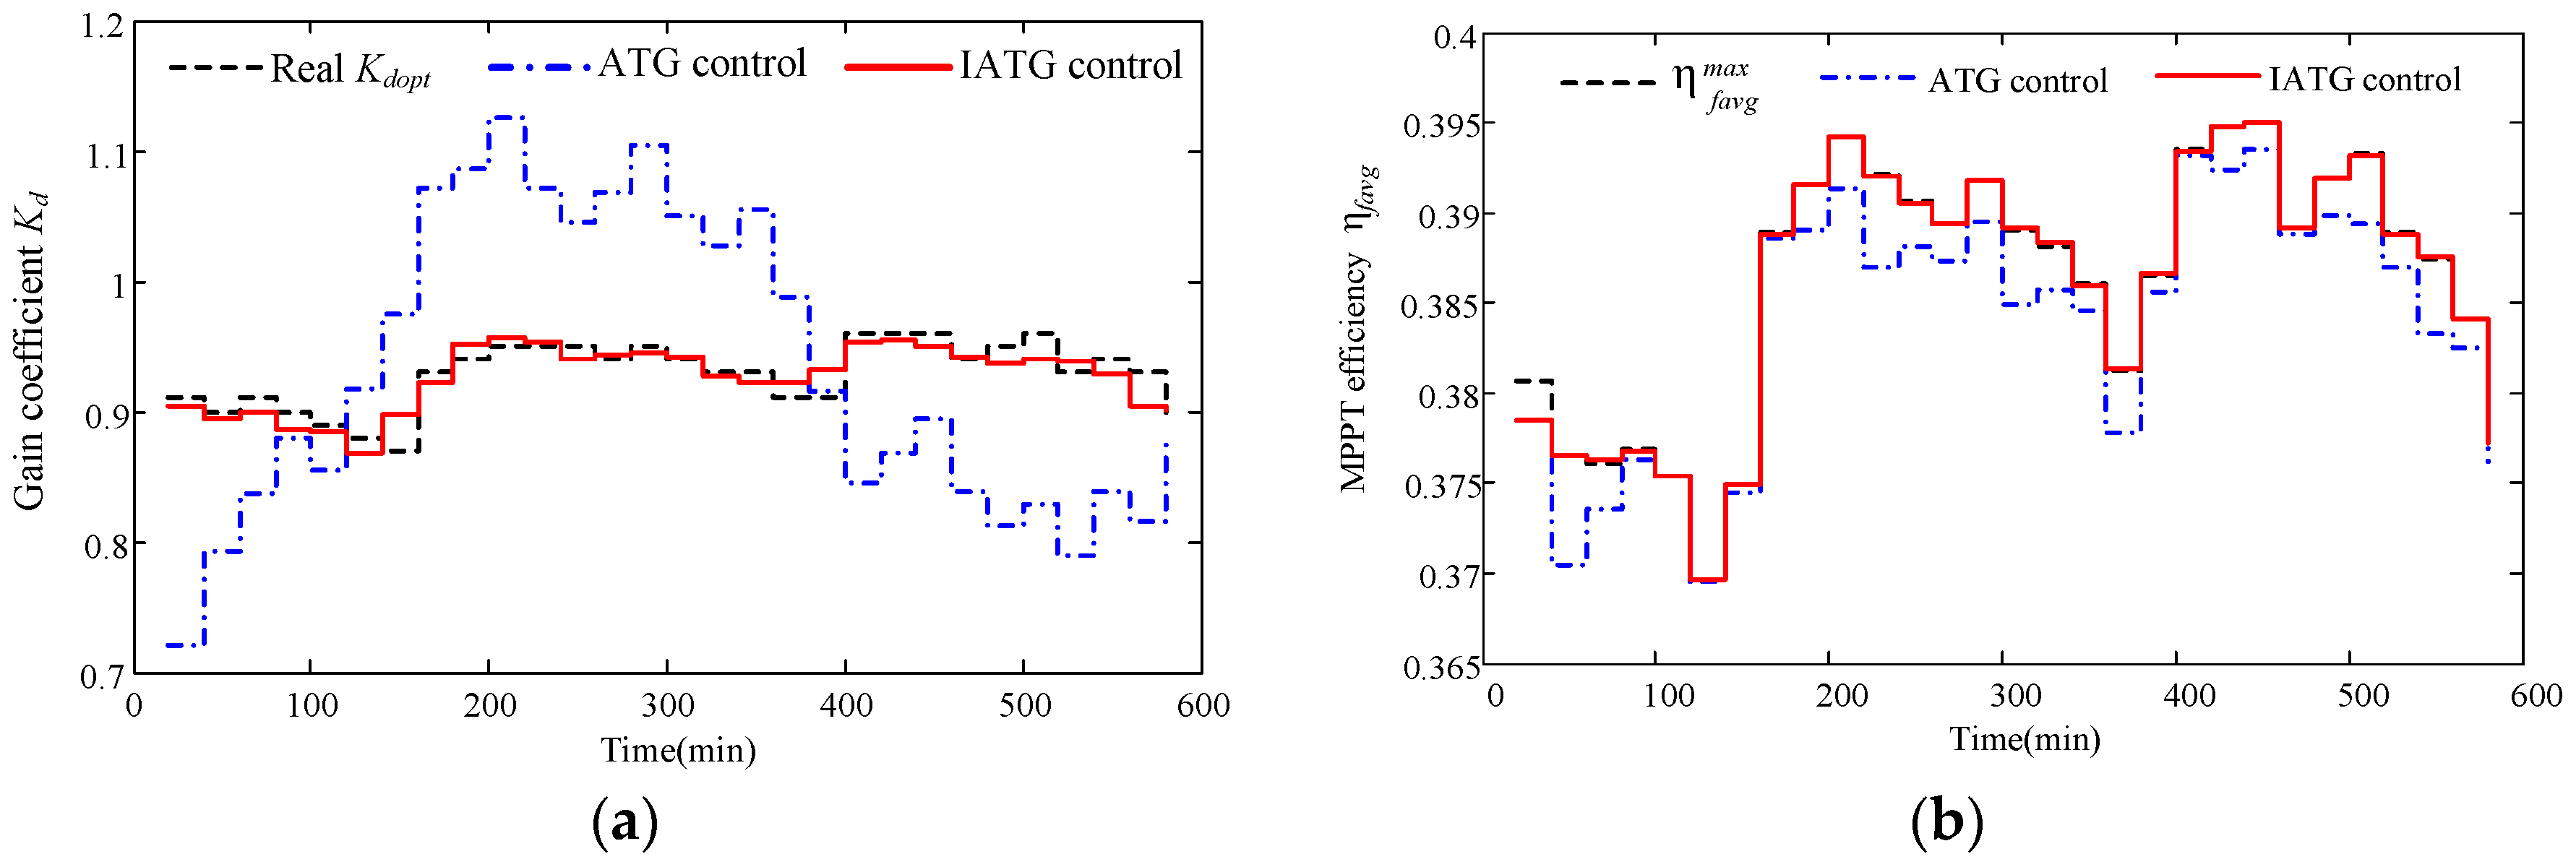
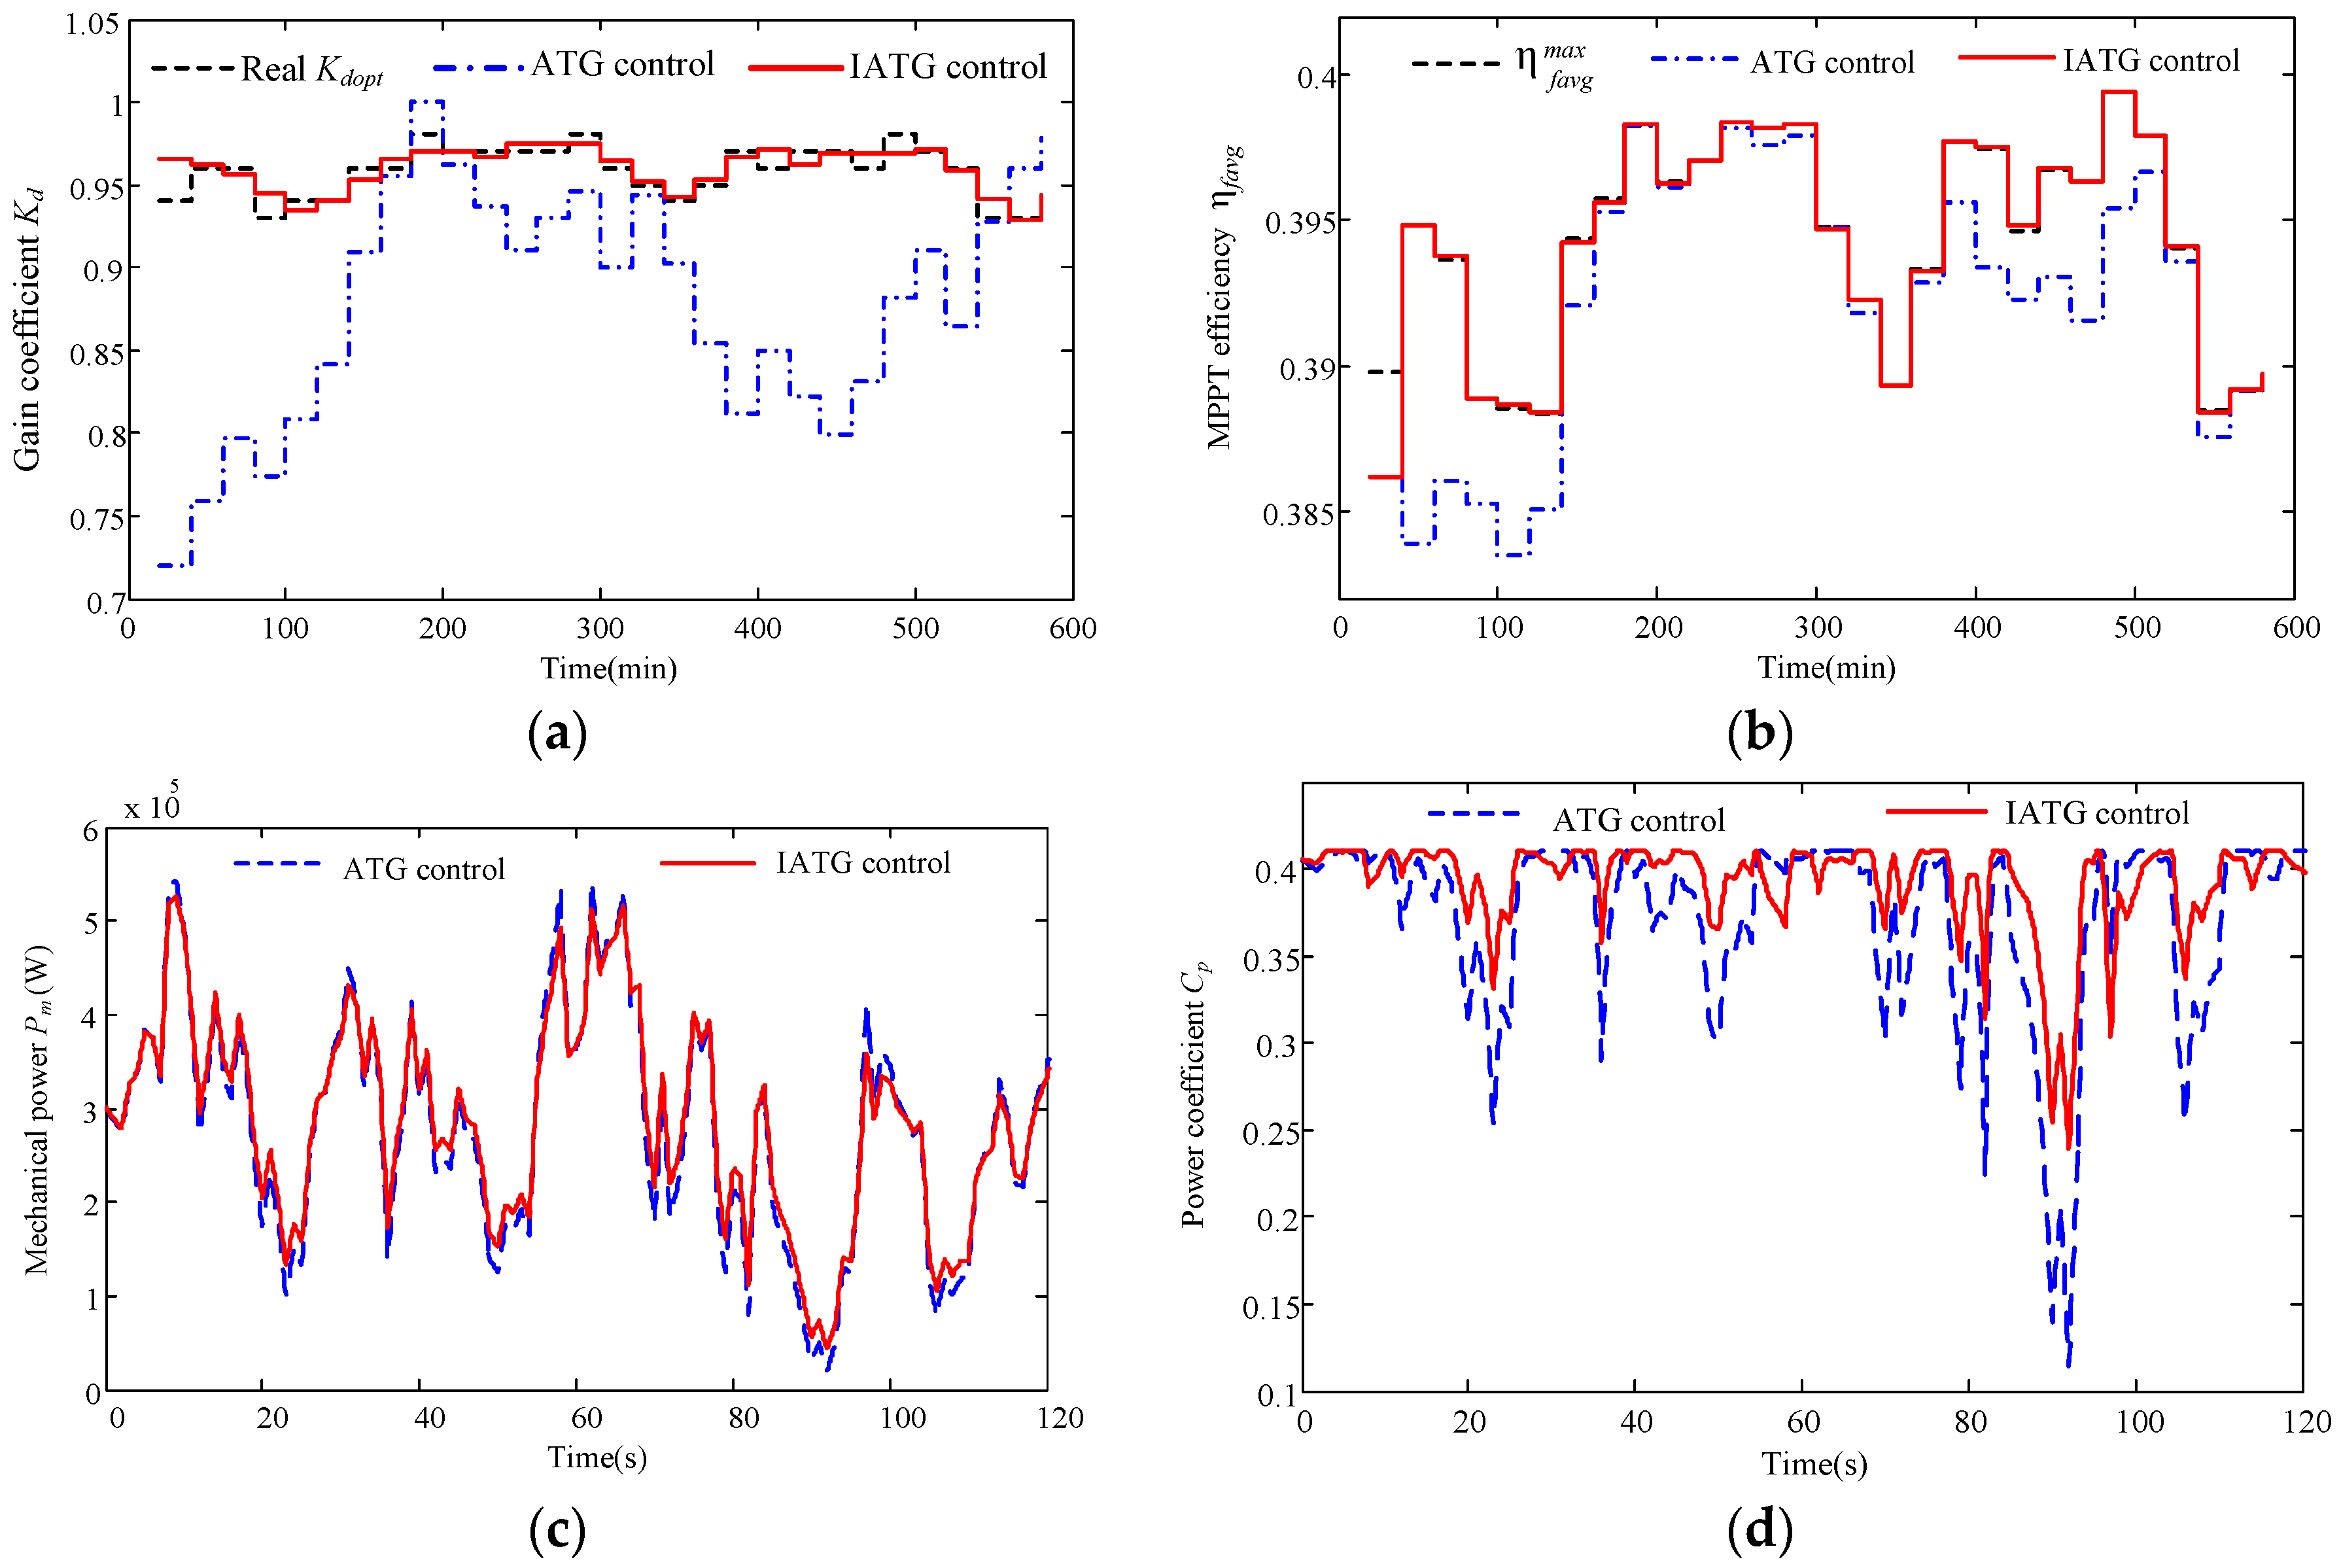
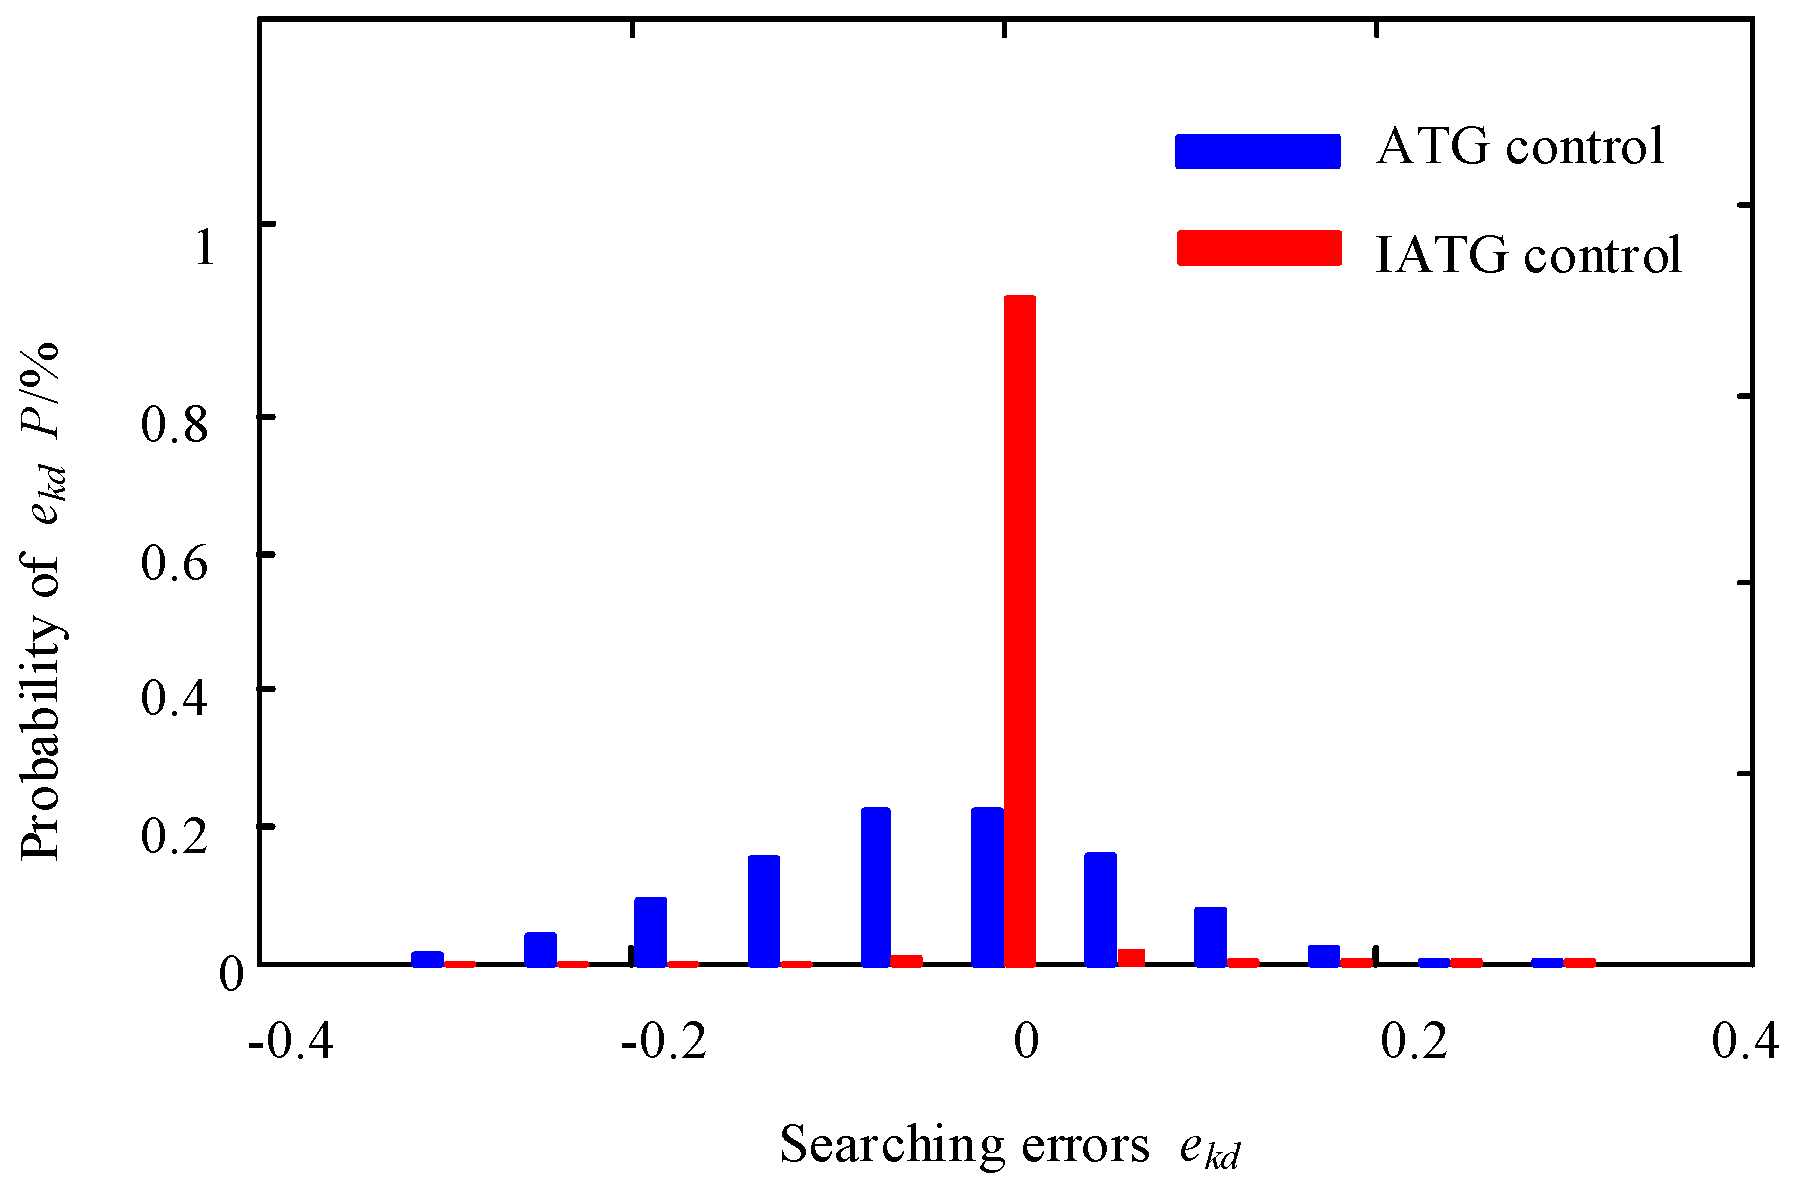
4.2. On-Line Optimization
5. Conclusions
Acknowledgments
Author Contributions
Conflicts of Interest
References
- Cheng, M.; Zhu, Y. The state of the art of wind energy conversion systems and technologies: A review. Energy Convers. Manag. 2014, 88, 332–347. [Google Scholar] [CrossRef]
- Wu, P.; Xia, B.; Zhao, X. The importance of use and end-of-life phases to the life cycle greenhouse gas (GHG) emissions of concrete—A review. Renew. Sustain. Energy Rev. 2014, 37, 360–369. [Google Scholar] [CrossRef]
- Kumar, D.; Chatterjee, K. A review of conventional and advanced MPPT algorithms for wind energy systems. Renew. Sustain. Energy Rev. 2016, 55, 957–970. [Google Scholar] [CrossRef]
- Zhu, Y.; Cheng, M.; Hua, W.; Wang, W. A novel maximum power point tracking control for permanent magnet direct drive wind energy conversion systems. Energies 2012, 5, 1398–1412. [Google Scholar] [CrossRef]
- Yang, Z.Q.; Yin, M.H.; Xu, Y.; Zhang, Z.Y.; Zou, Y.; Dong, Z.Y. A multi-point method considering the maximum power point tracking dynamic process for aerodynamic optimization of variable-speed wind turbine blades. Energies 2016, 9. [Google Scholar] [CrossRef]
- Luo, X.; Niu, S.X. Maximum power point tracking sensorless control of an axial-flux permanent magnet vernier wind power generator. Energies 2016, 9. [Google Scholar] [CrossRef]
- Ou, T.C.; Su, W.F.; Liu, X.Z.; Huang, S.J.; Tai, T.Y. A modified bird-mating optimization with hill-climbing for connection decisions of transformers. Energies 2016, 9. [Google Scholar] [CrossRef]
- Lin, W.M.; Hong, C.M.; Ou, T.C.; Chiu, T.M. Hybrid intelligent control of PMSG wind generation system using pitch angle control with RBFN. Energy Convers. Manag. 2011, 52, 1244–1251. [Google Scholar] [CrossRef]
- Hong, C.M.; Ou, T.C.; Lu, K.H. Development of intelligent MPPT (maximum power point tracking) control for a grid-connected hybrid power generation system. Energy 2013, 50, 270–279. [Google Scholar] [CrossRef]
- Lin, W.M.; Ou, T.C. Unbalanced distribution network fault analysis with hybrid compensation. IET Gener. Transm. Distrib. 2011, 5, 92–100. [Google Scholar] [CrossRef]
- Ou, T.C.; Hong, C.M. Dynamic operation and control of microgrid hybrid power systems. Energy 2014, 66, 314–323. [Google Scholar] [CrossRef]
- Ou, T.C. A novel unsymmetrical faults analysis for microgrid distribution systems. Int. J. Electr. Power Energy Syst. 2012, 43, 1017–1024. [Google Scholar] [CrossRef]
- Ou, T.C. Ground fault current analysis with a direct building algorithm for microgrid distribution. Int. J. Electr. Power Energy Syst. 2013, 53, 867–875. [Google Scholar] [CrossRef]
- Ou, T.C.; Chuang, S.J.; Hong, C.M.; Wu, R.C.; Tsao, T.P.; Chen, C.Y. Self-regulation ground faults model for microgrid distribution. ICIC Express Lett. B Appl. 2015, 6, 1–6. [Google Scholar]
- The Global Wind Energy Council: Global Wind Statistics 2015. Available online: http://www.gwec.net/wp-content/uploads/vip/GWEC-PRstats-2015_LR.pdf (accessed on 9 October 2016).
- Guo, J.; You, S.; Huang, C.; Liu, H.; Chai, J.; Wu, L.; Zhou, D.; Liu, Y.; Glass, J. An ensemble photovoltaic power forecasting model through statistical learning of historical weather dataset. In Proceedings of the 2016 PES General Meeting, Boston, MA, USA, 17–21 July 2016; pp. 1–5.
- Huang, C.; Li, F.; Ding, T.; Jin, Z.; Ma, X. Second-order cone programming-based optimal control strategy for wind energy conversion systems over complete operating regions. IEEE Trans. Sustain. Energy 2015, 6, 263–271. [Google Scholar] [CrossRef]
- Johnson, K.E. Adaptive Torque Control of Variable Speed Wind Turbines; NREL/TP-500-36265; National Renewable Energy Laboratory: Golden, CO, USA, 2004.
- Johnson, K.E.; Pao, L.Y.; Balas, M.J.; Fingersh, L.J. Control of variable-speed wind turbines: Standard and adaptive techniques for maximizing energy capture. IEEE Trans. Control Syst. 2006, 26, 70–81. [Google Scholar] [CrossRef]
- Zhou, D.; Blaabjerg, F.; Franke, T.; Tonnes, M. Comparison of wind power converter reliability with low-speed and medium-speed permanent-magnet synchronous generators. IEEE Trans. Ind. Electron. 2015, 62, 6575–6584. [Google Scholar] [CrossRef]
- Zhao, Y.; Wei, C.; Zhang, Z.; Qiao, W. A review on position/speed sensorless control for permanent-magnet synchronous machine-based wind energy conversion systems. IEEE J. Emerg. Sel. Top. Power Electron. 2013, 1, 203–216. [Google Scholar] [CrossRef]
- Huang, C.; Li, F.; Jin, Z. Maximum power point tracking strategy for large-scale wind generation systems considering wind turbine dynamics. IEEE Trans. Ind. Electron. 2015, 62, 2530–2539. [Google Scholar] [CrossRef]
- Kim, K.H.; Van, T.L.; Lee, D.C.; Song, S.H.; Kim, E.H. Maximum output power tracking control in variable-speed wind turbine systems considering rotor inertial power. IEEE Trans. Ind. Electron. 2013, 60, 3207–3217. [Google Scholar] [CrossRef]
- Tang, C.; Soong, W.L.; Freere, P.; Pathmanathan, M.; Ertugrul, N. Dynamic wind turbine output power reduction under varying wind speed conditions due to inertia. Wind Energy 2013, 16, 561–573. [Google Scholar] [CrossRef]
- Raza, K.S.M.; Goto, H.; Guo, H.J.; Ichinokura, O. A novel algorithm for fast and efficient speed-sensorless maximum power point tracking in wind energy conversion systems. IEEE Trans. Ind. Electron. 2011, 58, 29–36. [Google Scholar]
- Johnson, K.E.; Fingersh, L.J.; Balas, M.J.; Pao, L.Y. Methods for increasing region 2 power capture on a variable-speed wind turbine. J. Sol. Energy Eng. 2004, 126, 1092–1100. [Google Scholar] [CrossRef]
- Xia, Y.; Ahmed, K.H.; Williams, B.W. Wind turbine power coefficient analysis of a new maximum power point tracking technique. IEEE Trans. Ind. Electron. 2013, 60, 1122–1132. [Google Scholar] [CrossRef]
- Xia, Y.; Ahmed, K.H.; Williams, B.W. A new maximum power point tracking technique for permanent magnet synchronous generator based wind energy conversion system. IEEE Trans. Power Electron. 2011, 26, 3609–3620. [Google Scholar] [CrossRef]
- Yin, M.; Zhang, X.; Zou, Y.; Zhou, L. Improved MPPT control of wind turbines based on optimization of tracking range. Power Syst. Technol. 2014, 38, 2180–2185. [Google Scholar]
- Yin, M.; Zhang, X.; Ye, X.; Zou, Y. Improved MPPT control based on the reduction of tracking range. Proc. CSEE 2012, 32, 24–31. [Google Scholar]
- Ma, Z.; Shaltout, M.; Chen, D. An adaptive wind turbine controller considering both the system performance and fatigue loading. J. Dyn. Syst. Meas. Control 2015, 137. [Google Scholar] [CrossRef]
- She, Y.; She, X.; Baran, M.E. Universal tracking control of wind conversion system for purpose of maximum power acquisition under hierarchical control structure. IEEE Trans. Energy Convers. 2011, 26, 766–775. [Google Scholar] [CrossRef]
- Jin, Z.; Huang, C. DFIG voltage control based on dynamically adjusted control gains. J. Power Energy Eng. 2014, 2, 45–58. [Google Scholar] [CrossRef]
- Blaabjerg, F.; Liserre, M.; Ma, K. Power electronics converters for wind turbine systems. IEEE Trans. Ind. Appl. 2011, 48, 281–290. [Google Scholar]
- Chen, Z.; Guerrero, J.M.; Blaabjerg, F. A review of the state of the art of power electronics for wind turbines. IEEE Trans. Power Electron. 2009, 24, 1859–1875. [Google Scholar] [CrossRef]
- Chen, J.; Chen, J.; Gong, C. Constant-bandwidth maximum power point tracking strategy for variable-speed wind turbines and its design details. IEEE Trans. Ind. Electron. 2013, 60, 5050–5058. [Google Scholar] [CrossRef]
- Shokrzadeh, S.; Jozani, M.J.; Bibeau, E. Wind turbine power curve modeling using advanced parametric and nonparametric methods. IEEE Trans. Sustain. Energy 2014, 5, 1262–1269. [Google Scholar] [CrossRef]
- Jin, Z.; Li, F.; Ma, X.; Djouadi, S.M. Semi-definite programming for power output control in wind energy conversion system. IEEE Trans. Sustain. Energy 2014, 5, 466–475. [Google Scholar] [CrossRef]
- Fan, L.; Miao, Z. Modeling and Analysis of Doubly Fed Induction Generator Wind Energy Systems; Elsevier Science & Technology Books; Elsevier: Amsterdam, The Netherlands, 2015. [Google Scholar]
- Bianchi, F.D.; Battista, H.; Mantz, R.J. Wind Turbine Control Systems: Principles, Modeling and Gain Scheduling Design; Springer: New York, NY, USA, 2007. [Google Scholar]
- Nichita, C.; Luca, D.; Dakyo, B.; Ceanga, E. Large band simulation of the wind speed for real time wind turbine simulators. IEEE Trans. Energy Convers. 2002, 17, 523–529. [Google Scholar] [CrossRef]


| MPPT Methods | Tracking Speed | Tracking Reference | Tracking Accuracy |
|---|---|---|---|
| TSR Control | High | ωref = λopt v/R and λopt is assumed to be pre-known | Low |
| HCS Control | Low | Updated on-line and with no prior-knowledge | High |
| PSF Control | High | Pref = kopt ω3 and kopt is assumed to be pre-known | Medium |
| DTG Control | High | Pref = Kdkopt ω3 and Kd is assumed to around 0.8–0.9 | Medium |
| ATG Control | Medium | Pref = Kdkopt ω3 and Kd is updated on-line | High |
| Wind Speed Profile | Pwrong | ηfavg |
|---|---|---|
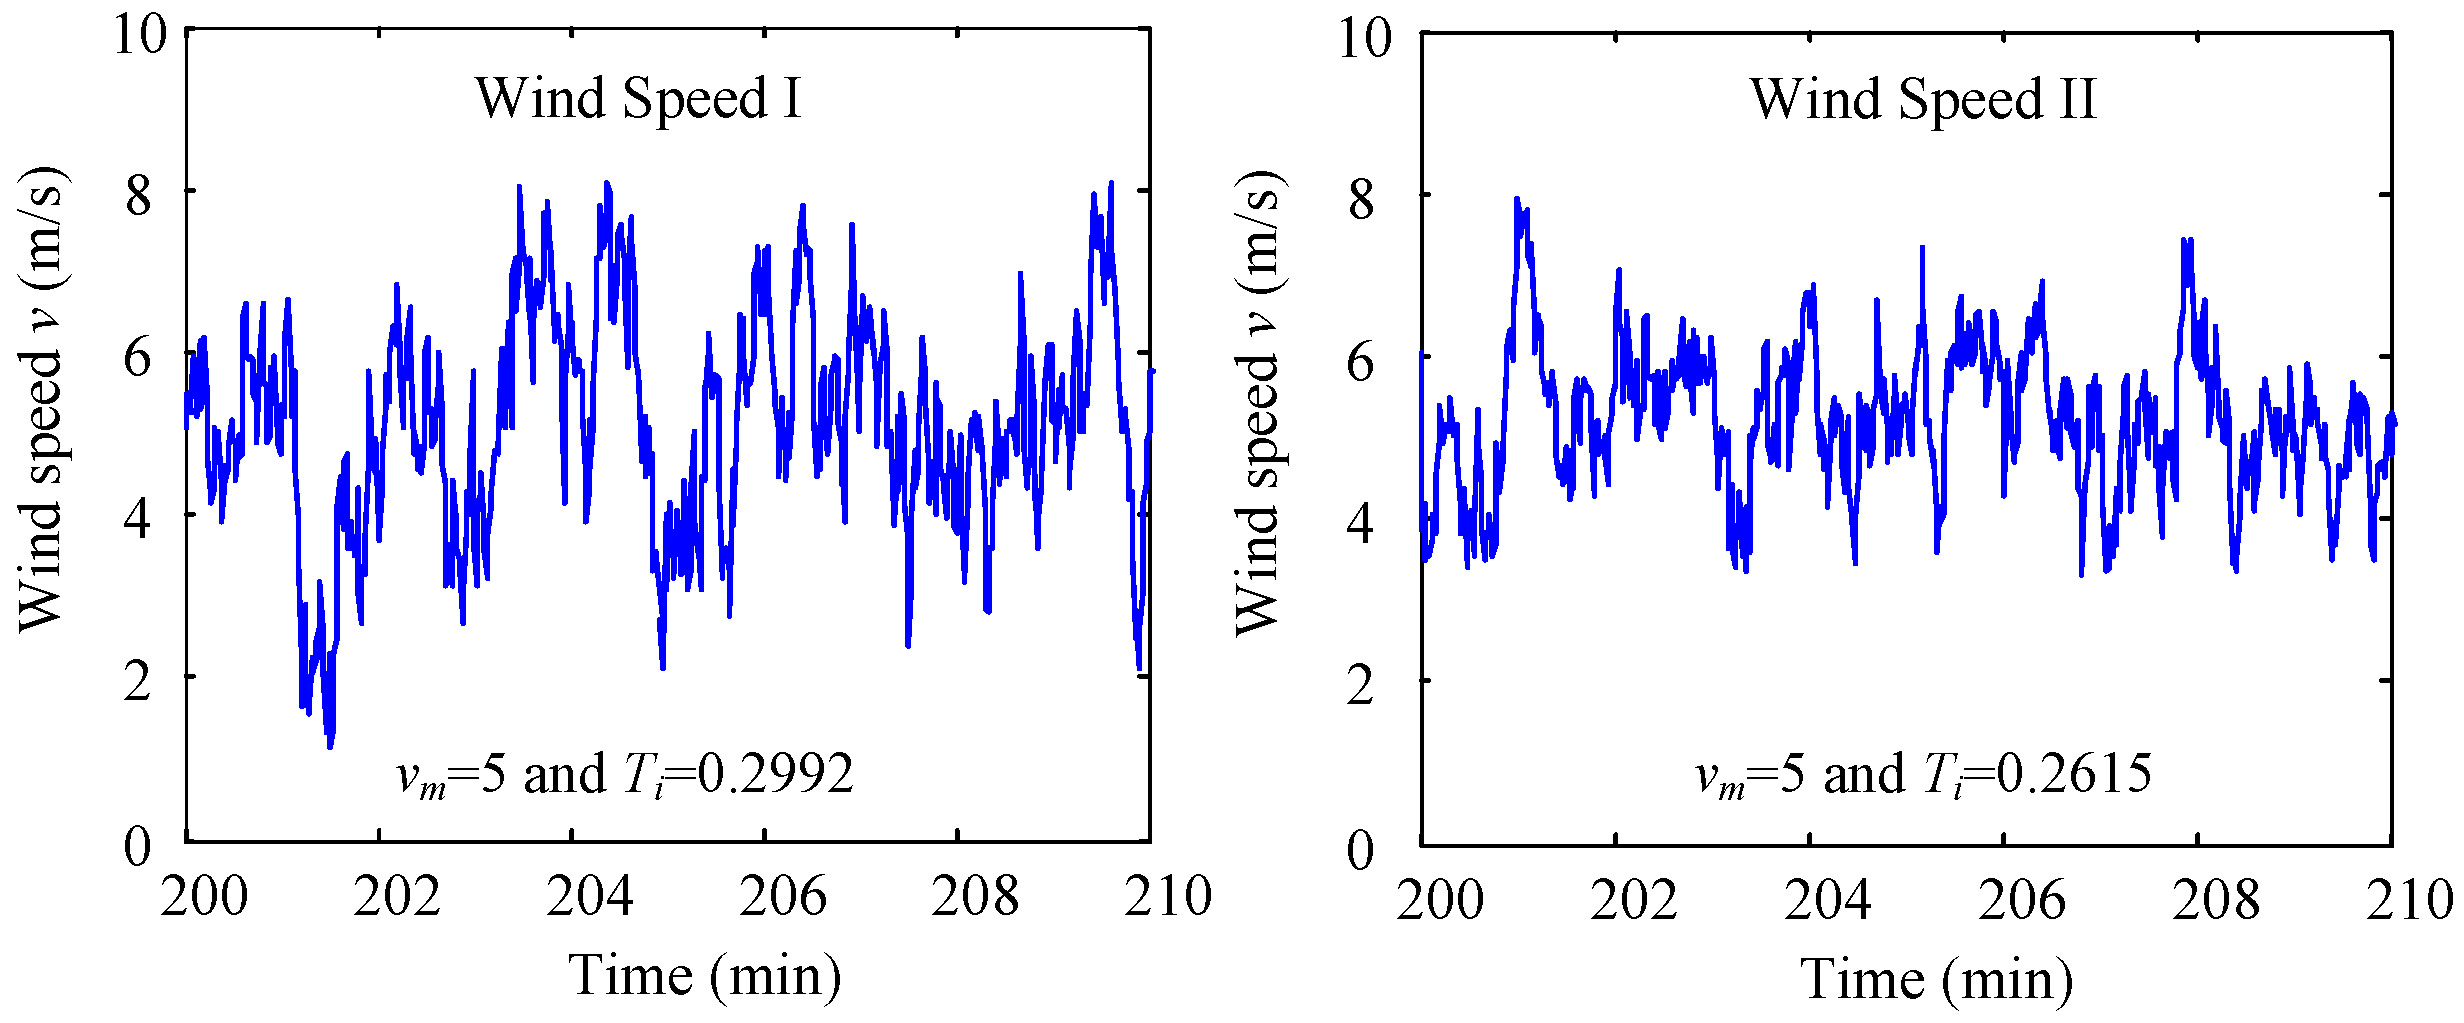
| Wind Speed Ι | 48.28% | 0.3732 |
| Wind Speed II | 41.38% | 0.3860 |
| WECS (Wind Energy Conversion System) Parameters | |
|---|---|
| Air density ρ/(kg/m3) | 1.225 |
| Wind turbine capacity Prat (MW) | 1.0 |
| Wind turbine radius R (m) | 26.335 |
| Wind turbine inertia J/(kg·m2) | 1.1204 × 10⁶ |
| Optimal tip-speed ratio λopt | 8.0 |
| Maximum power coefficient Cpmax | 0.4109 |
| Control Parameters | |
| , , and | |
| Mean Wind Speed | Turbulence Intensity | Average |
|---|---|---|
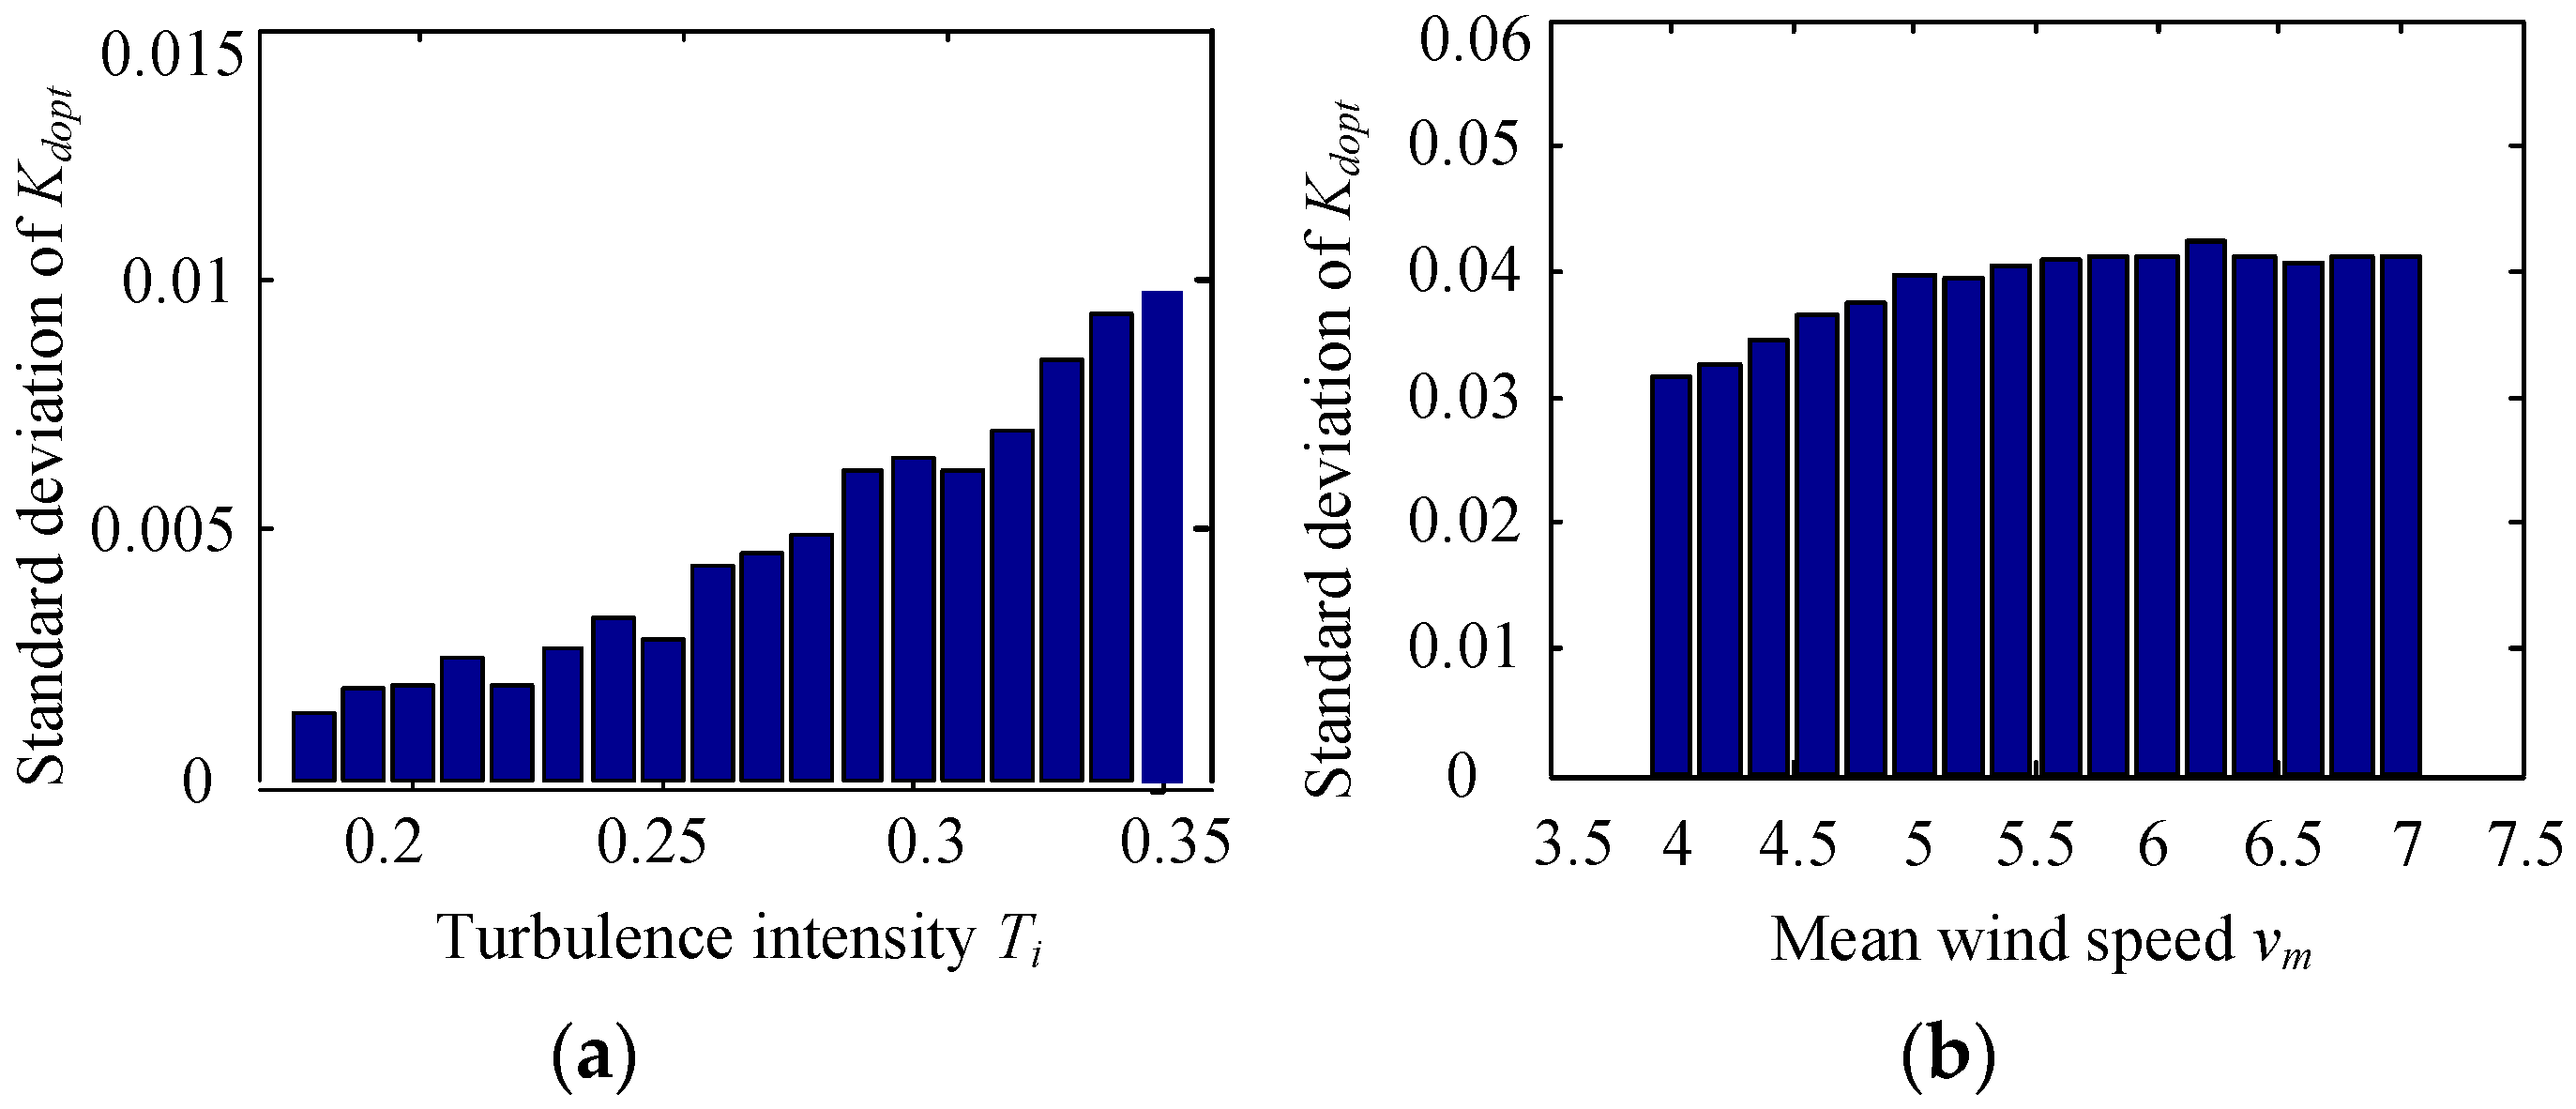
| Fixed | Varying | 0.0389 |
| Varying | Fixed | 0.0047 |
| MPPT Methods | ||
|---|---|---|
| Adaptive torque gain control | 0.0861 | 44.55% |
| Improved adaptive torque gain control | 0.0091 | 32.30% |
| MPPT Algorithms | ||
|---|---|---|
| PSF | 0.3863 | 0.24% |
| DTG | 0.3840 | 0.85% |
| ATG | 0.3851 | 0.57% |
| RTR | 0.3843 | 0.78% |
| IATG | 0.3873 | —— |
| 0.3874 | −0.03% |
© 2016 by the authors; licensee MDPI, Basel, Switzerland. This article is an open access article distributed under the terms and conditions of the Creative Commons Attribution (CC-BY) license (http://creativecommons.org/licenses/by/4.0/).
Share and Cite
Zhang, X.; Huang, C.; Hao, S.; Chen, F.; Zhai, J. An Improved Adaptive-Torque-Gain MPPT Control for Direct-Driven PMSG Wind Turbines Considering Wind Farm Turbulences. Energies 2016, 9, 977. https://doi.org/10.3390/en9110977
Zhang X, Huang C, Hao S, Chen F, Zhai J. An Improved Adaptive-Torque-Gain MPPT Control for Direct-Driven PMSG Wind Turbines Considering Wind Farm Turbulences. Energies. 2016; 9(11):977. https://doi.org/10.3390/en9110977
Chicago/Turabian StyleZhang, Xiaolian, Can Huang, Sipeng Hao, Fan Chen, and Jingjing Zhai. 2016. "An Improved Adaptive-Torque-Gain MPPT Control for Direct-Driven PMSG Wind Turbines Considering Wind Farm Turbulences" Energies 9, no. 11: 977. https://doi.org/10.3390/en9110977
APA StyleZhang, X., Huang, C., Hao, S., Chen, F., & Zhai, J. (2016). An Improved Adaptive-Torque-Gain MPPT Control for Direct-Driven PMSG Wind Turbines Considering Wind Farm Turbulences. Energies, 9(11), 977. https://doi.org/10.3390/en9110977