Review

A Review of Factors Influencing the Cost Development of Electricity Generation Technologies

Wuppertal Institute for Climate, Environment and Energy, Döppersberg 19, 42103 Wuppertal, Germany
Energies 2016, 9(11), 970; https://doi.org/10.3390/en9110970
Submission received: 16 August 2016 / Revised: 7 October 2016 / Accepted: 3 November 2016 / Published: 19 November 2016

Abstract

:
This article reviews the literature on the past cost dynamics of various renewable, fossil fuel and nuclear electricity generation technologies. It identifies 10 different factors which have played key roles in influencing past cost developments according to the literature. These 10 factors are: deployment-induced learning, research, development and demonstration (RD&D)-induced learning, knowledge spillovers from other technologies, upsizing, economies of manufacturing scale, economies of project scale, changes in material and labour costs, changes in fuel costs, regulatory changes, and limits to the availability of suitable sites. The article summarises the relevant literature findings for each of these 10 factors and provides an overview indicating which factors have impacted on which generation technologies. The article also discusses the insights gained from the review for a better understanding of possible future cost developments of electricity generation technologies. Finally, future research needs, which may support a better understanding of past and future cost developments, are identified.

1. Introduction

Access to electricity is widely regarded as a prerequisite for an appropriate standard of living and social integration [1], yet in 2012 more than one billion people still lacked this access [2]. At the same time, electrical appliances continue to grow in importance in the daily lives of billions of people. Consequently, the share of electricity in final energy demand has steadily grown over the past decades [3]. This trend is expected to continue in future decades as climate change mitigation strategies involve replacing fossil fuels with electricity in end-use applications [4,5,6]. Ensuring the sufficient provision of electricity generated by environmentally and socially acceptable means will therefore continue to be an important objective for policymakers around the world. As multiple different generation technologies are available, each with their unique advantages and disadvantages, a key question facing society and policymakers is what combination of technologies should make up the future electricity generation mix.
Various factors play a role in deciding the preferred electricity generation technologies for any given society. While differences in environmental and social impacts undoubtedly play an important role, so do differences in market costs. Market costs are comprised of investment costs (including financing costs), fuel costs, fixed and variable operation and maintenance costs and decommissioning costs. An important objective for policymakers is to minimise or limit the market costs associated with meeting future electricity demand. Today, a large number of electricity and energy system models exist that aim to inform policymakers on the lowest cost solutions for meeting future electricity demand (see for example [7,8]). These models, which are often used to look decades into the future, include assumptions about plausible future technology cost developments. In order to have a good understanding of these, it is important to recognise which factors have influenced technology costs in the past. This literature review aims to provide an exhaustive overview of the available knowledge regarding the key factors that have influenced past cost developments of electricity generation technologies.
It should be noted that aside from the market costs discussed in this article, external costs and system costs are both relevant. The latter includes, for example, transmission costs and balancing costs. System costs (as opposed to market costs) will become increasingly important in future electricity systems in which the share of fluctuating electricity generated from wind turbines and solar photovoltaics (PV) increases considerably [9]; see also Section 3.
The following section, Section 2, introduces all the factors found to influence the market costs of electricity generation technologies. It discusses the role each factor has played in past cost developments for different electricity generation technologies. Section 3 briefly discusses which factors might become more or less relevant in shaping future costs for each type of technology. Finally, Section 4 draws conclusions and addresses future research needs.

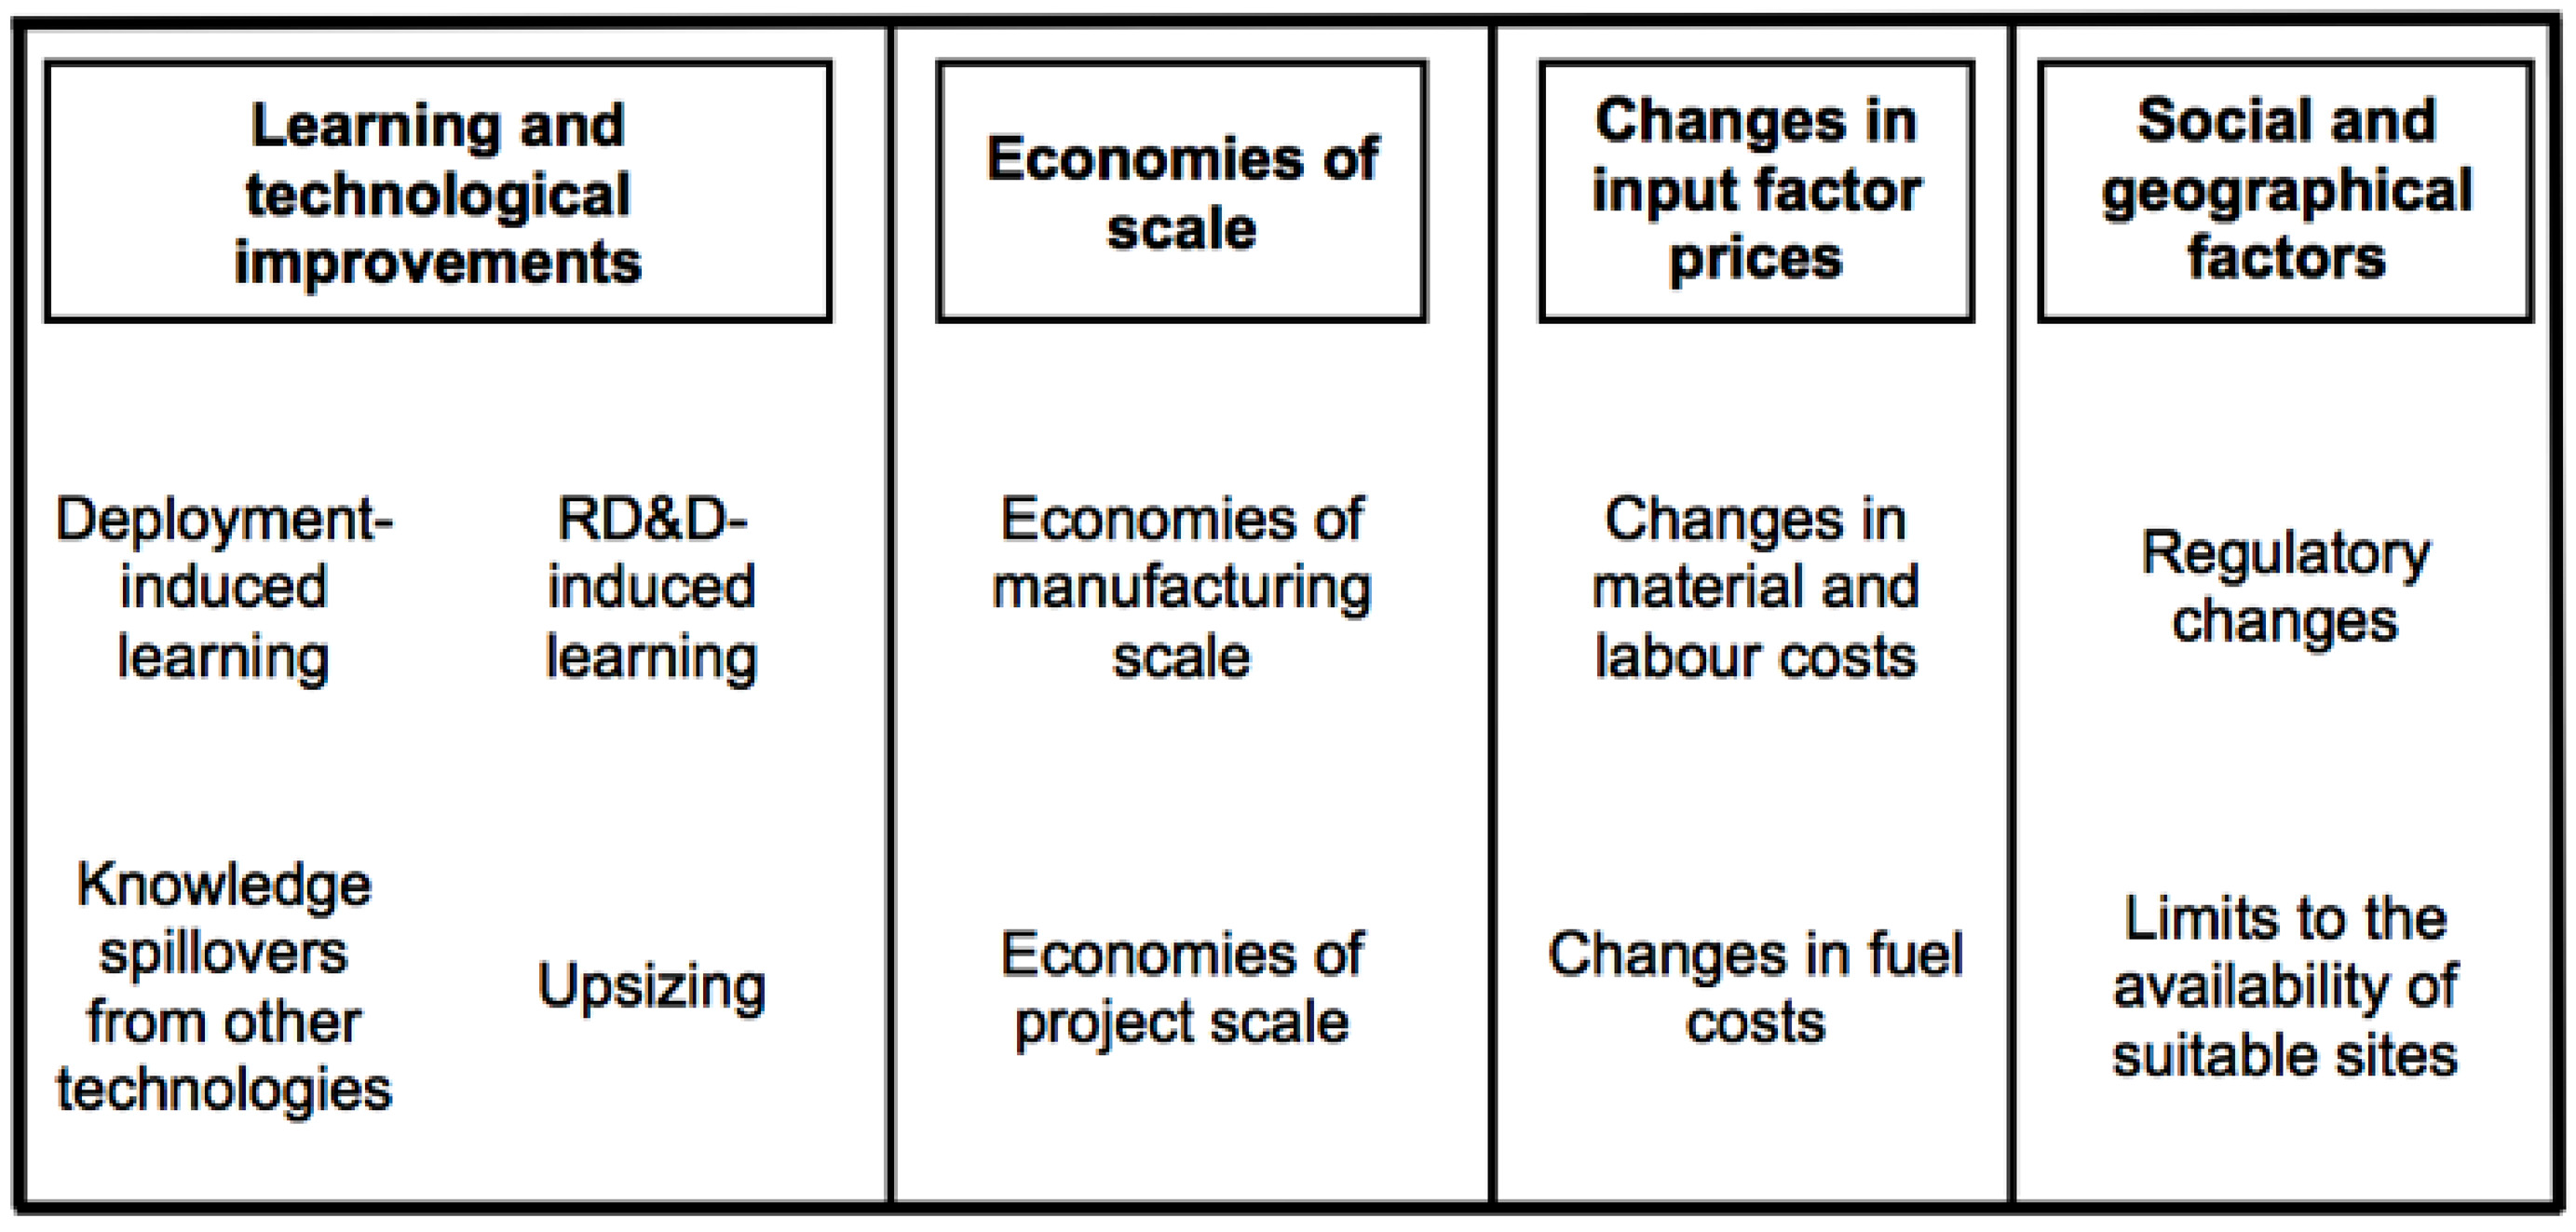
2. Factors Influencing the Market Costs of Electricity Generation Technologies

Based on an extensive literature review, this section discusses the main factors influencing the development of the market costs of electricity generation technologies over time. Over the past few decades, much empirical research has sought to explain past cost changes and to attribute these changes to a number of different factors. Initially, and particularly from the late 1970s onwards, studies focused on explaining observed changes in the costs of large-scale fossil fuel and nuclear power plants, with the available cost data usually going back to the 1960s or 1970s. Since around the year 2000, many studies have focused on renewable energy technologies, especially wind and solar PV, with the available cost data typically ranging back to the 1980s or 1990s. This article focuses on 10 factors identified by the literature review as relevant in influencing electricity generation costs in the past. These 10 factors can be grouped into four categories, as shown in Figure 1.
These 10 factors will be discussed individually in the following subsections, with the final subsection offering a summary. It should be noted that factors influencing costs can either affect a technology’s investment (or capacity) costs or they can affect “only” its generation costs. The latter is typically the case for two of the factors, “changes in fuel costs” and “limits to the availability of suitable sites”. As deployment-induced learning, research, development and demonstration (RD&D)-induced learning, knowledge spillovers and upsizing can also lead to fuel efficiency improvements, generation costs may also be affected by these factors, which are subsumed in the category “learning and technological improvements”. It should also be noted that due to the lack of available literature sources on past cost developments of combined heat and power (CHP) plants, this technology is not included in this study’s discussions.
Market structure is not included as a factor in this study, as no quantitative estimates about the effects of market structure on the costs of specific electricity generation technologies could be found in the literature. This does not necessarily mean that such effects do not exist or are negligible; it probably points to the difficulties of operationalizing this factor in empirical studies. Many authors argue that differences in market structure can affect the actual costs of a technology by, for example, influencing a company’s internal efficiency [10] or the level of innovation within an industry [11]. Specifically, it is sometimes argued that technological learning requires competitive markets [12,13], although this view is not shared universally by the theoretical and empirical literature on the relationship between an industry’s degree of competition and its level of innovation [14,15]. It should be noted that there is no dispute that the market structure and the respective level of competition has an effect on market prices. For some electricity generation technologies, there are strong indications that historic price developments were heavily influenced for several years by companies able to exert market power [16,17].
Similarly, the identified literature does not provide sufficient quantitative information about differences in the effects of policy measures such as carbon pricing or renewable energy support mechanisms on the cost development of specific electricity generation technologies. As these types of policy measures tend to change the rate of deployment of different technologies, they can indirectly lead to technology cost changes by affecting deployment-induced learning. However, quantitative estimates of any additional effects of such policy measures on technology costs could not be identified in the literature and, therefore, are not included in this review, although there is a large strand of literature that discusses the idea that certain forms of environmental regulation may induce technological innovation [18,19]. At the same time, it is sometimes argued in the literature that policies such as feed-in tariffs “may discourage competition among various renewable energy sources and therefore deter innovation” [20].

2.1. Learning and Technological Improvements

Learning and technological improvements have been identified as an important driver for lowering the market costs of electricity generation. Various sources of learning and technological change are discussed in the literature. The respective contributions of these sources to the observed cost reductions of a technology are frequently debated, as it has proved very difficult to empirically separate the contributions made by individual sources. Most notably, there is an ongoing discussion among researchers about the relative importance of deployment-induced learning compared to RD&D-induced learning.

2.1.1. Deployment-Induced Learning

A large volume of empirical research indicates that specific costs fall as experience in terms of production and use of a particular technology increases. Initially, such learning was investigated at individual company level [21] but, progressively, similar observations were made at the industry level. These industry level observations suggest that a significant share of the knowledge gained by individual companies and their customers through experience can eventually be appropriated by other companies and customers (i.e., the spillover effect). Alternatively, or additionally, some learning may take place at the industry level; for example, through exchanges between company representatives within associations or at conferences.
There is the suggestion in the literature that experience gained by deployment can lead to learning via at least three different channels:
  • Learning-by-doing: as more and more units of a technology are produced, managers gain experience with the production process and may learn how to improve it, e.g., by increasing work specialisation or by reducing waste. Workers may become more efficient in their respective tasks as they continuously repeat their individual production steps.
  • Learning-by-using: this can be regarded as the “demand-side counterpart” [22] of learning-by-doing. Users may gain experience by using a technology and learn how to install and operate it more efficiently. The existence of formal user groups who interact with each other can strengthen this kind of learning through networking effects [23].
  • Learning-by-interacting: by informing them about problems related to the use of a technology, users or project developers enable manufacturers to learn from actual on-site experiences of the product. Manufacturers can use this information to improve their respective products [24,25,26]. Furthermore, companies, users, project developers and other stakeholders—such as research institutes and policymakers—can learn from one another through the formal and informal exchange of information [27,28,29].
Some authors (for example de La Tour et al. [30], Gross et al. [27] and Junginger et al. [28]) consider the interaction between users and manufacturers to be part of learning-by-using. This view is not shared here, in order to emphasise the difference between learning that takes place solely on the user side (learning-by-using) and learning that takes place through the interaction between users and manufacturers (learning-by-interacting).
Numerous empirical studies show a strong negative correlation between a technology’s deployment and its cost (or price). Many of these studies derive so called one-factor experience curves. These curves depict the relationship between a technology’s specific costs as the dependent variable and the technology’s experience (using deployment or production as a proxy) as the independent variable. The learning rate shows the rate at which a technology’s cost is found to decrease for each doubling of experience. Other meta-studies [27,31,32] have already looked in detail at observed learning rates for electricity generation technologies, so this article will not focus on this aspect.

2.1.2. Upsizing (Economies of Unit Scale)

The typical unit sizes of many electricity generation technologies have increased over time. This phenomenon can be referred to as upsizing. An increase in size is usually associated with lower manufacturing, installation and/or operating costs per unit of capacity. These economies of unit scale should be distinguished from economies of scale relating to manufacturing or project scale. The latter do not involve changes in the technology itself, which is why they are not included in the category “learning and technological improvements”, but are examined in a separate “economies of scale” category.
For wind turbines, literature findings indicate that initially, until about the early or mid-1990s, the scaling up of wind turbine units led to economies of unit scale, as larger turbines offered scale effects in terms of turbine and tower manufacture, as well as in installation costs, driving down specific investment costs. Economies of unit scale also led to savings in operation and maintenance costs and enabled more wind to be captured, further driving down generation costs [27,33]. According to a model based on real turbine cost data developed by Coulomb and Neuhoff [34], economies of scale in wind turbines when measured in specific capacity costs were positive until rotor diameters reached 34 m, typically corresponding to unit capacities of about 400 kW–500 kW. Observing list prices of wind turbines in Germany between 1991 and 2001, Junginger et al. [33] report that for all turbines of up to about 600 kW, the per kW list prices for larger turbines were consistently smaller than for smaller turbines. However, this relationship did not hold for the bigger turbines: “Since the introduction of the 600 kW turbine in 1995, the trend of decreasing turbine list prices with increasing turbine size seems to be diminishing.”
Madsen et al. [35] find considerable economies of unit scale in their econometric analysis of wind turbines produced in Denmark between 1983 and 1998, a time period in which the vast majority of newly installed wind turbines had a capacity of 600 kW or less. Depending on the regression model specifications, a doubling in unit scale was found to lead to a decrease in specific wind turbine prices of between 7% and 15%.
Beyond a turbine unit threshold of about 500 kW, Coulomb and Neuhoff [34] find diseconomies of unit scale. This is explained by the fact that the larger the wind turbine, the greater the cost effect of the relative increased weight. According to a rule of thumb cited by Coulomb and Neuhoff [34] and Milborrow [36], rotor weights increase by the cube of the rotor diameter, whereas energy yields increase only by the square of the rotor diameter.
In fact, Bolinger and Wiser [37] find turbine upscaling to be the most important individual driver for explaining the observed price increases in turbines sold in the USA between 2001 and 2010, contributing to a cost increase of 230 USD/kW. Ek and Söderholm [38], in their econometric analysis, also find negative scale effects measured as costs per kW: for each doubling in capacity, specific costs increase by 11%. However, the negative scale effects were not found to be statistically significant. The authors use average turbine costs from five European countries over the time period from 1986 to 2002, controlling for cumulative global capacity (intending to capture learning-by-doing effects) and research and development (R&D) stock (intending to capture learning-by-searching effects; see the following subsection).
It should be pointed out that the presence of diseconomies of unit scale, when measured on a per kW basis, does not mean that turbines have become too large. Such a statement requires an assessment that includes all the costs and benefits of installing larger turbines. Specifically, any diseconomies of unit scale in terms of the production and transport costs of larger wind power plants were, and are, likely to be compensated by cost savings in installation and maintenance and the potential for gaining access to better wind conditions, allowing for higher levels of energy production [34,37].
This assumption is supported by empirical analyses of wind power project costs in the USA: per kW costs of wind projects in the USA from 2012 to 2014 were found to be practically identical, irrespective of whether the turbines employed had a capacity of 1–2 MW, 2–3 MW or more than 3 MW [39,40]. In his regression analyses of the price of electricity from wind power projects built in the USA between 1999 and 2006, Berry [41] also found that turbine size was not a relevant variable for explaining price differences, noting that the cost-increasing and cost-decreasing effects of larger turbines may cancel each other out.
Unlike economies of manufacturing and economies of project scale, economies of unit scale are not believed to have played an important role in past cost decreases of electricity generation from PV plants, as solar panels have not seen a considerable change in typical per-unit scale [42]. For concentrating solar power (CSP) plants, there is little information in the literature about possible economy of unit scale effects. Pilkington Solar International [43] states that for CSP power plants in the range of 40–160 MW, specific system costs decline by 12% and levelized electricity costs by about 15% for each doubling in plant size. However, it should be noted that the assumptions behind these calculations are based only on a very limited number of early CSP plants.
A number of econometric studies have tried to shed light on the various factors affecting the cost development of nuclear reactors. The majority of these studies have analysed the nuclear power industry in the USA, not least because cost data for individual nuclear power plants built in the USA have long been publicly available.
From past experience in several countries, it is known that larger nuclear power plants tend to exhibit longer construction times than smaller ones (see for example [44]). As longer construction times lead to higher time-related costs, notably increased interest payments and additional inflation costs, any study investigating the unit scale effect of nuclear power plants should include the time-related costs and should not solely consider overnight costs, as these, by definition, do not include interest payments and other time-related costs.
However, for the US nuclear industry only two studies were found that take the cost effects of longer construction times into account in their econometric analysis. These two studies draw different conclusions regarding the relationship between unit scale and specific costs for nuclear power plants (see also [45]). While Komanoff [46] finds a 10% reduction in costs per kW for each doubling in unit size when taking into account the effects on costs of longer construction times, Cantor and Hewlett [47] arrive at a 9% increase in costs for each doubling of capacity. The latter study thus implies diseconomies of scale, stating that it is possible “that the industry has attempted to build units that are too large to be efficiently managed by the constructors” [47]. Findings on economies of unit scale are also inconclusive when examining analyses that do not take the cost effects of longer construction times into consideration [45,46,47,48,49,50,51].
For the Japanese nuclear power industry, Marshall and Navarro [52] study the relationship between reactor costs and unit size for 34 reactors built in Japan between 1966 and 1987. They find economies of unit scale when using overnight cost data but find no statistically significant relationship between cost and unit size when using cost data that takes into account the effects of construction time on reactor costs.
Escobar Rangel and Lévêque [53] analyse the development of total costs (including time-related costs) for the French nuclear programme, following the publication in 2012 of cost data for each of the nuclear power plants built in France [54]. The regression results from Escobar Rangel and Lévêque [53] indicate diseconomies of scale for the French nuclear power plant programme. However, the authors note that in their regression analysis they are unable to separate the effects of size changes from those of reactor design changes, as larger nuclear power plants in France tend to exhibit significant design changes compared to earlier and smaller reactors and some of these design changes may have been made for other reasons than to enable reactor size increases. Therefore, it cannot be ruled out that the diseconomies of scale discovered are mainly the result of methodological limitations.
For coal power plants, reductions in the costs observed for new plants prior to the 1970s have been “mainly attributed to economies of scale in all power plant components, including the generator, turbine, and boiler” [55]. Joskow and Rose [56] find economies of scale in their evaluation of 411 coal power plants larger than 100 MW in the USA that began operating between 1960 and 1980. The authors control for various characteristics, including learning effects, compliance with environmental regulations and changes in input prices. They find a decrease in specific costs of 12% for each doubling in unit size. Looking only at the 110 supercritical coal power plants in the sample, specific costs were found to decrease more significantly (by between 20% and 27%, depending on the regression model specifications) for each doubling in unit size. The authors note that fully exploiting these scale effects requires moving from subcritical plants to supercritical plants, as the latter become less expensive on a per kW basis at plant sizes of around 500 MW [56]. McCabe [49] likewise found considerable economies of scale in a similar range for 106 supercritical power plants installed in the USA between 1960 and 1980.
However, some authors have pointed towards the apparent limits of exploiting economies of unit scale in coal power plants [56,57]. Supercritical coal power plants, which—according to the literature cited above—exhibit larger potential for economies of unit scale compared to subcritical coal power plants have experienced problems in regard to operating reliability due to their high technological complexity. According to Grubler [58], economies of unit scale consequently failed to lead to substantial reductions in electricity generation costs after the 1960s. There are also demand-side restrictions to building ever larger power plants: investors are reluctant to commit to large-scale power plants at times when future electricity demand is uncertain.

2.1.3. Research, Development and Demonstration (RD&D)-Induced Learning

RD&D activities are widely considered to be another important driver for improving energy technologies and forcing down electricity generation costs. RD&D activities encourage experimentation with a technology’s design, creating opportunities for learning and innovation. Technologies can either profit from RD&D activities specifically aimed at those technologies, or from the spillover effects from basic research or from successful RD&D activities targeting other technologies. This subsection discusses direct learning through RD&D activities, while spillover effects are discussed in the following subsection.
Many scholars suggest that the traditional one-factor experience curve neglects the critical role that RD&D plays in improving technologies over time. According to this view, many of the historic cost reductions observed in energy technologies and attributed to “learning-by-doing” by traditional one-factor experience curves are, in fact, the result of RD&D activities. In the past decade and a half in particular, attempts have been made to quantify the effects of RD&D on past energy technology cost developments based on an extension of the traditional one-factor experience curve to a two-factor or multi-factor experience curve. These two or multi-factor experience curves are derived by statistically capturing not only the effects of technology deployment but also the effects of RD&D expenses (and, in the case of multi-factor experience curves, the effects of additional independent variables) on technology costs. Some authors express the hope that defining both learning-by-doing and learning-by-searching rates for individual technologies will assist policymakers in the optimal allocation of scarce public resources between support for RD&D and market diffusion [59,60].
However, in practice, there are various difficulties in determining the RD&D effects. Firstly, past RD&D expenses for a certain technology can be difficult to identify, especially as RD&D investment levels by private companies are often not made publicly available. (As a consequence, empirical studies typically restrict their analysis to publicly financed RD&D.) Secondly, it can be argued that it is not the RD&D expenses themselves that influence technology costs, but rather the knowledge gained through the RD&D activities. However, it is not possible to precisely establish the time lag between RD&D expenses and the corresponding growth in the knowledge stock. Similarly, it is unclear to what extent the knowledge gained through RD&D should be assumed to depreciate over time. Consequently, it has proved difficult to reliably quantify the effects of RD&D activities on the development of energy technology costs.
Attempts to quantify the effects of RD&D expenses on technology costs have been made primarily in regard to onshore wind power. Table 1 shows literature estimates for the learning-by-searching rate of this technology. Analogous to the learning-by-doing rate, the learning-by-searching rate indicates by how much a technology’s specific costs are expected to reduce as RD&D-based knowledge about the technology is doubled. Learning-by-searching estimates in the literature vary considerably for individual technologies, with the estimates for wind power varying, for example, from between 3% and 32% (see Table 1). Differences in estimates in the literature can be explained inter alia by differences in the geographical domain analysed, the period studied, the operationalisation of knowledge and the nature of the additional independent variables taken into account.
The wide range of learning-by-searching rates found in the literature, combined with the aforementioned difficulty of adequately capturing a technology’s knowledge stock, indicate that these rates should be interpreted with care. Cautious interpretation is also supported by a sensitivity analysis by Söderholm and Sundqvist [20], who analyse onshore wind power cost developments. The authors find that adding a time trend in their regression analysis leads to negative learning-by-searching rates that are no longer statistically significant, as the time trend “tends thus to pick up most of the variation previously ascribed to the R&D-based knowledge stock.” Lindman and Söderholm [61] note the difficulty in quantifying the role of RD&D in wind power cost developments as cumulative RD&D expenses, in addition to other potential independent variables (e.g., the size of wind turbines), increase over time, making it difficult to statistically separate the impacts made by each variable.
De La Tour et al. [30] find that during the period from 1999 to 2011 a model using only global cumulative PV capacity and the price of silicon is better able to explain price developments of PV modules than a model using other explanatory variables, including the knowledge stock. They measure the knowledge stock using the cumulative number of patent families (a set of patents granted in different countries for the same innovation) as a proxy for innovation and use an annual depreciation rate of 10% to account for technology obsolescence. The authors point out that the high correlation between knowledge stock and cumulative capacity leads to a reduction in the accuracy of their model when knowledge is included as an explanatory variable. Similarly, Wiebe and Lutz [62] do not find a statistically significant learning-by-searching rate in their analysis of global price developments of PV modules between 1992 and 2012.
Berthélemy and Escobar Rangel [44] use nuclear-specific patents filed in France and the USA to construct a knowledge stock for each country, applying an annual discount factor of 10%. Based on their regression analysis they conclude that, in the case of nuclear power, more knowledge leads to higher power plants costs. The authors suggest that innovations in nuclear power may make reactors more complex and, consequently, they take longer to build and are more expensive.

2.1.4. Knowledge Spillovers from Other Technologies

Inter-industry knowledge spillovers, i.e., knowledge spillovers from other technologies, clusters of technologies or basic scientific research, are also identified in the literature as potential contributors to improvements and cost reductions for specific power generation technologies [66,67]. Such spillovers are sometimes also referred to as exogenous technological progress. Loiter and Norberg-Bohm [68] provide specific examples of wind technology innovations that originated in other industries; for example, in boat-building or aeronautics. Nemet [42] notes that key innovations in the PV industry originated in the microprocessor industry. Meanwhile, the development of combined cycle gas turbines (CCGT) benefited greatly from technological advances made inter alia in the field of jet aero engines [69,70].
Quantifying inter-industry spillover effects is very difficult, as knowledge is highly heterogeneous and unobservable [57]. Therefore, an attempt is usually made in empirical analysis to capture inter-industry spillover effects by including a simple time trend in regression models. However, in a statistical analysis of a range of technologies (not only electricity generation technologies), Alberth [71] concludes that “experience turns out to be a vastly superior explanatory variable than time in terms of forecasting error”.

2.2. Economies of Scale Effects

Economies of scale describe a situation in which the specific costs of a product decline as the production capacity or project size increases. This is the case, for example, when additional production allows producers to benefit from volume discounts on materials, permits managers and workers to specialize more in their respective tasks and enables R&D and other non-production costs to be spread over a greater number of units [29,63]. Economies of scale can materialise at the level of individual companies or factories (see Section 2.2.1) and also at the level of individual projects, like wind farms, whose economics may benefit from an increase in the number of turbines installed at a certain site (see Section 2.2.2).

2.2.1. Economies of Manufacturing Scale (Mass Production)

Small-scale generation technologies (e.g., solar PV modules and onshore wind turbines) requiring little customised installation tend to exhibit higher one-factor learning rates than large-scale technologies requiring heavily customised, site-specific installation (e.g., coal or nuclear power plants) [27]. It is widely believed that these differences in learning rates are, to a significant extent, due to differences in the degree to which technologies can be standardised and mass produced in factories. Provided there is sufficient demand, the standardisation of a product allows for the upscaling of production plants to produce the same product in larger numbers, which results in economies of manufacturing scale [28]. In contrast, the on-site construction that is prevalent for large scale power plants is usually site-specific and provides little room for economies of manufacturing scale [72].
Some authors point towards the typically high correlation between an industry’s production volume or its plant sizes (i.e., its average output per factory) and its experience measured as cumulative output. They maintain that much of what one-factor experience curves suggest to be learning-by-doing is, in fact, likely to be the result of economies of manufacturing scale [73,74]. Other authors stress the overlap between experience and economies of manufacturing scale, arguing that these two effects—while separate in theory—are very difficult to separate in practice. For example, scaling up production may be associated with substantial technological challenges that can only be overcome by gaining production experience [75,76,77,78].
Attempts to isolate and quantify the effects of economies of manufacturing scale on the specific costs or prices of individual technologies have been made in the past, for example for PV technology. The typical annual output of new PV cell manufacturing plants increased from less than 2 MW in the early 1990s to several 100 MW today, with some new manufacturing plants announced in 2015 exceeding an annual production capacity of 1 GW [29,79,80]. Yu et al. [29] construct a global multi-factor experience curve for PV module prices, taking into account not only experience but also manufacturing scale effects and input price effects. The authors conclude that changes in typical manufacturing plant size accounted for 20% of all price-reducing factors during the period between 1998 and 2006, while learning accounted for 48%. The scale effect was found to be less significant prior to 1998, when it accounted for less than 6% of the total price-reducing effects.
Nemet [42] disaggregates historic PV price reductions into observable technical factors: manufacturing plant size, module efficiency, silicon cost, silicon consumption, wafer size, yield and the share of poly-crystalline vs. mono-crystalline wafers. The author finds that increases in the typical size of PV module production plants accounts for 43% of the price reductions observed between 1980 and 2001. Plant size is identified as the main factor contributing to the observed price decrease, followed by improvements in module efficiency (30%). Watanabe et al. [81] also find economies of manufacturing scale effects to be more important than learning effects in explaining the cost reductions achieved by Japanese solar cell manufacturers between 1976 and 1990.
Conversely, the study by de La Tour et al. [30] finds that, as in the case of using knowledge stock, using the size of manufacturing plants as an explanatory variable does not improve a model explaining PV module price developments between 1999 and 2011. The authors explain this by pointing towards the high correlation between the size of manufacturing plants and the cumulative installed capacity of PV plants.
A limited number of literature sources evaluate whether economies of manufacturing scale have also played a role in reducing the costs of onshore wind power plants. These sources suggest that economies of manufacturing scale have indeed contributed to wind onshore cost reductions. Junginger et al. [33] point out that wind turbine manufacturers offer considerable reductions to specific turbine prices for high volume orders. Specifically, they report a price reduction of about 6% for each doubling of the order volume of a Vestas V47 660 kW wind turbine ordered by various buyers between 1998 and 2002. According to the authors, these large discounts suggest that wind turbine producers benefit considerably from economies of manufacturing scale. However, perhaps due to data limitations (see [63,82]), no studies are available that specifically investigate the relationship between the cost or price reductions of wind turbines and the average output of manufacturing plants.
Economies of scale at manufacturing level do not appear to have played a significant role in influencing the costs of fossil fuel plants in the past, even though some literature sources suggest that standardisation and the ensuing potential for mass production and economies of scale may have played a role in reducing the costs over time of fluidized bed combustion boilers [25,28]. The limited role played by economies of manufacturing scale in large-scale fossil fuel power plants can be explained by the much lower number of identical (or similar) plants required by these technologies, compared to small-scale renewable energy technologies, to achieve a certain level of electricity generation. Building fewer plants offers less possibility to benefit from economies of scale in both manufacturing and installation.
The same is true for nuclear power plants, which are typically even larger than fossil fuel plants. While the potential to take advantage of economies of manufacturing scale is, therefore, expected to be lower than for small-scale renewable technologies, the lack of sufficient standardisation is frequently cited to have prevented nuclear power from realising even this limited potential in some countries [58]. (The lack of standardisation also limits the potential of deployment-induced learning and spillover effects [27].) Over the decades, the design of nuclear reactors has seen continuous change, as manufacturers have attempted to increase economic performance or—often in response to new government regulations—safety levels [27]. According to country level overnight construction cost data from Lovering et al. [83], countries that emphasised reactor design standardisation, such as France and South Korea, experienced less pronounced cost increases or even cost decreases over time. See also Section 2.4.1 on the effects of regulations.
In contrast to the “rather laissez-faire attitude” [84] in the USA, the Japanese and (at least initially, until the 1980s) the French governments made efforts to support reactor design standardisation. This is seen as a key reason for the less pronounced cost escalation during the 1970s and 1980s in the French and Japanese nuclear power programmes compared to that of the USA [53,84,85].

2.2.2. Economies of Project Scale

Economies of scale can be relevant not only at unit level (see Section 2.1.2) and manufacturing level (see previous subsection), but also at individual power plant project level.
Some authors find evidence that the costs per wind turbine can be reduced by installing a higher number of turbines at the same site, as not all types of wind power investment costs vary proportionately according to project size. For example, all turbines at one wind farm can use a common substation and the development and construction costs are shared by a higher number of turbines [86]. Wiser and Bolinger [39,40] find that, for projects constructed in 2012/2013 and in 2014, specific investment costs of onshore wind farms in the USA tend to decline as the project size increases, although this effect is much more prevalent at the lower end of the project size range, i.e., when moving from project sizes of less than 5 MW to project sizes of between 5 and 50 MW. Qiu and Anadon [82] attempt to econometrically explain the differences in wind power electricity generation bidding prices in China's national wind project concession programmes from 2003 to 2007 and include wind farm size as one of their explanatory variables. They find that prices reduce by 6%–9% for each doubling in wind farm size. Anderson [87] uses an econometric model to determine various drivers of the costs of onshore wind power projects installed in the USA from 2001 to 2009 and finds modest economies of project scale. According to his results, doubling a wind power project’s nameplate generating capacity reduces the project’s per-megawatt cost by 1.2%–1.5%.
However, none of these studies [39,40,82,87] take into account the fact that small scale projects may, on average, install smaller individual turbines than medium or large scale projects. These studies, therefore, cannot rule out the possibility that the lower costs of larger wind projects may largely, or partly, be a reflection of cost reductions achieved through economies of unit scale. However, in his regression analyses, Berry [41] takes into account individual turbine size and still finds lower wind energy contract prices for larger wind farms in his sample of wind farms of 20 MW or more built in the USA between 1999 and 2006. For each additional 10 MW of wind farm generating capacity, the price in 2007 was found to be lower by about $0.62 per MWh (or 1.6% of the mean price of $38.5 per MWh).
For PV systems, a reduction in installation prices as system sizes increase is well documented. Economies of project scale allow for the allocation of fixed project and overhead costs across a larger number of installed watts [88]. For example, median prices for non-residential PV systems installed in in the USA in 2014 ranged from 4.2 USD2014/W for systems up to 10 kW to 2.7 USD2014/W for systems larger than 1 MW [88], meaning that very large scale systems are about 36% cheaper than very small ones.
Economies of project scale have also been observed for nuclear power plants. Komanoff [46] finds that nuclear reactors built in the USA as part of multiple reactors at a single site exhibit on average 10% lower investment costs than other reactors. According to the author, the lower costs are due to shared design efforts and common facilities, but also to the better utilisation of learning effects in construction. Similarly, Tolley et al. [45] report lower specific costs of between 5% and 7% when two nuclear reactors are built at the same time and at the same site, compared to building them at different sites and/or at different times. The reasons provided by Tolley et al. for the lower specific costs of twin reactors are the ability to reduce the down-time for both workers and the construction equipment, the cost reduction potentials related to procurement (partly also driven by the potential for economies of scale at the vendors’ factory) and the higher chance of benefiting from on-site learning effects [45].
Likewise, Navarro [84] argues that one reason why the Japanese nuclear power industry was more successful than its US counterpart in containing cost increases during the 1970s and 1980s was due to its reactor siting strategy. The Japanese frequently sited four or more reactors at one site, while in the US typically only one or two (and no more than three) reactors were built at the same site. The country level overnight cost data compiled by Lovering et al. [83] indicates that specific reactor costs in countries that have frequently built reactors in pairs, or larger sets at the same site, such as France and South Korea, tend to be lower than in countries that have mostly built single reactors at one site, such as the USA and Germany.
For coal power plants completed in the USA between 1972 and 1977, Komanoff [46] finds that plants built as part of multiple units at a single site exhibit on average 10% lower investment costs than single units. According to the author, the lower costs result from common plant facilities, shared construction equipment, skill transfer in the design and construction of the plants and a joint environmental review.

2.3. Changes in Input Factor Prices

2.3.1. Changes in Material and Labour Costs

Changes in market prices for labour or for required input materials can also play an important role in a technology’s cost development. Changes in input prices for energy technologies have, in the past, been attributed mainly to developments outside a certain industry (i.e., to exogenous developments), for example to changes in the overall labour market or to additional demand for certain materials from other industries. Geological scarcity or trade restrictions on certain materials may, in the future, also lead to increases in the price of some input materials.
The relevance of input price developments for the costs of energy technologies has received renewed attention since commodity prices underwent a considerable increase during the mid-2000s, remaining relatively high in historical terms for much of the period that followed (until they declined in 2014 and 2015, see [89]). Contrary to what the traditional one-factor and two-factor experience curves suggested, prices for most energy technologies increased for some years following the mid-2000s [27,90]. The price increases for commodities such as steel, cement, copper and fossil fuels (and in some cases also an increase in labour costs) were identified as the main reasons for these unexpected cost increases [91,92,93], underscoring the relevance of input price developments in explaining the past cost developments of energy technologies.
Quantitative estimates of the role of input price variations have been made mainly for wind and PV technologies.
Qiu and Anadon [82] found that the share of domestically-produced components of wind power plants in China is a statistically significant factor in explaining the price of electricity generation from onshore wind turbines built in China between 2003 and 2007. Specifically, doubling the share of domestically-produced components was found to be associated with price reductions of around 20%. (This rate was reduced to around 11% when year dummies were included in the econometric model to capture any additional exogenous technological change or any other changes in the market.) The authors suggest that this relationship is due to the lower labour and material costs in China compared to those in industrialised countries such as the United States and Germany. As the average share of domestically-produced components of the wind turbines installed in China increased over the time period observed, it can be assumed that lower labour and material costs have contributed to the observed decline in wind power prices.
According to an analysis by van der Zwaan et al. [94], the decline in specific costs for offshore wind parks in Europe was consistent with a one-factor learning rate of 3% between 1991 and 2008 when the price fluctuations of steel and copper are corrected for. Without such corrections, no trend in specific costs can be observed, meaning the learning rate is 0%. Correcting for fluctuations in copper and steel prices increases the explanatory power of the experience curve from an R2 of 0.31 to an R2 of 0.49, indicating that experience curve analysis can potentially be improved by properly taking into account input price changes. In their analysis, the authors do not take into account the effects of oil price changes on the specific costs of offshore wind projects in Europe, although BWEA and Garrad Hassan [95] suggest that oil price fluctuations may have a particularly high influence on the development of specific costs of offshore wind projects. This influence arises mainly through a secondary impact: the global oil price affects the level of offshore marine exploration and construction activity which, in turn, has the potential to divert scarce vessel resources from offshore wind when oil prices are high. Voormolen et al. [17] also find that increased commodity prices between 2000 and 2015 led to significant increases in the specific investment costs of European offshore wind farms.
Bolinger and Wiser [37] estimate that higher labour costs led to an increase in average onshore wind turbine costs of 91 USD2010/kW in the USA between 2002 and 2008. This is equal to 15% of the overall observed price increase of 595 USD2010/kW. The rapid global growth of the wind industry during this period is reported to have put strain on the supply of available labour, leading to increases in the wages of sufficiently skilled workers [37,90]. Raw material price changes account for 12%, with steel having the biggest effect. Increases in fossil fuel energy prices account for another 2%, according to the authors (The upscaling of turbines (31%) and currency movements (23%) were found to be the two most important explanatory variables.).
De La Tour et al. [30] find that from 1999 to 2011 a model using global cumulative PV capacity and the price of silicon is better able to explain the price developments of PV modules than a model using only global cumulative PV capacity or any other combination of different explanatory variables. They note that when correcting for the fluctuations in the price of silicon, the PV learning rate is relatively stable at around 21%, even when different time periods are chosen for the learning rate analysis. The authors contrast this finding with a study by Nemet [96], who found substantial variation in the PV learning rate depending on the time period analysed. Specifically, PV learning rates were found to be lower when data from more recent years (especially data from 2004 to 2006) were included in the analysis. However, unlike de La Tour et al. [30], Nemet [96] does not correct for fluctuations in the price of silicon in his analysis.
In their regression analysis of factors influencing PV module prices between 1976 and 2006, Yu et al. [29] also find that changes in the price of silicon play an important role in explaining past PV module price developments. In a similar analysis, Nemet [42] ascribes 12% of the overall module price reductions observed between 1980 and 2001 to a decline in silicon prices. Gan and Li [97] also highlight the impact of silicon prices on PV module costs in their analysis of global price developments of PV modules between 1988 and 2006. In their work, the authors are unable to detect a statistically significant impact on module prices due to the increasing share of modules produced in China.
According to Cohen [98], the significant increase in specific construction costs of nuclear power plants in the US throughout the 1970s and 1980s was, to some extent, the result of an increase in general labour costs. The author finds that in the period from 1976 to 1988 labour costs in nominal terms escalated at an average rate of 18.7% compounded annually and material costs by 7.7%, contributing to an annual increase in nuclear power plant construction costs of 13.6%. (The average annual national inflation rate during this period was 5.7% according to Cohen [98].) Conversely, lower labour costs, due to a combination of the slowdown in the global economy and the focus of new nuclear construction on countries with lower labour costs, are thought to have played a key role in the decrease in nuclear power construction costs during the 1990s and early 2000s [27].

2.3.2. Changes in Fuel Costs

For technologies using fossil fuels, nuclear fuels or biomass, electricity generation costs are obviously sensitive to changes in fuel prices. Since the end of World War II, real world market prices for oil and natural gas have shown an upward trend, while the reverse is true with regards to the price of coal [99,100]. The fuel price sensitivity is especially high for natural gas power plants, as fuel costs make up a relatively large share of these plants’ overall generation costs [101]. Colpier and Cornland [102] find that the cost of generating electricity in newly built natural gas-fired CCGT plants in Europe and North America decreased between 1981 and 1997, mainly as a result of the decline in the price of natural gas during this period (in contrast to the longer term trend). The authors derived a learning rate for CCGT electricity generation of 15% and show that this rate would be only 6% if it were not for the observed decline in natural gas prices.

2.4. Social and Geographical Factors

2.4.1. Regulatory Changes

Regulatory changes, especially those concerning environmental, health or safety standards, can also lead to changes in the cost of electricity generation technologies. Relevant cost impacts of changes in regulations have been reported predominantly for nuclear power plants, coal power plants and wind turbines. While, in principal, both cost increases and cost decreases can stem from regulatory changes, cost increases are typically reported in the literature. This is the case because environmental, health and safety standards tend to become stricter over time, which may force technology suppliers, for example, to invest in additional components, employ more workers or search for alternative plant locations.
One example of stricter environmental regulations is the introduction of measures to price GHG emissions, such as carbon taxes or emissions trading systems. Such measures have been introduced in recent years in some countries and regions of the world, leading to market cost increases for electricity generation from technologies using fossil fuels. However, the effects of such measures on market costs are straightforward and, therefore, will not be discussed in detail here.
It should be noted that there is a close relationship between, on the one hand, changes in public acceptance for certain electricity generation technologies and, on the other hand, regulatory changes affecting these technologies [103,104]. Regulatory changes typically aim to reduce a technology’s external costs, such as the health impacts of fossil fuel power generation or the societal risks of large-scale nuclear accidents, and thus also aim to increase public acceptance for these technologies. This relationship between regulatory changes and external costs also means that while stricter regulatory standards tend to increase the market costs of electricity generation, its social costs do not necessarily increase.
According to an analysis by Komanoff [46], environmental protection costs as a share of total capital costs of new coal power plants in the USA grew from roughly 8% in 1971 to 41% in 1978 and were projected to grow further to 54% by 1988. Consequently, while capital costs not associated with environmental protection measures grew by only 8% between 1971 and 1978 (from about 319 USD1979/kW to 343 USD1979/kW), total capital costs grew by 68% (from 346 USD1979/kW to 583 USD1979/kW). Most of these additional costs for environmental measures were for equipment to control the three major air pollutants produced in coal combustion: particulates, sulphur dioxide and nitrogen oxides. Further costs were reported for additional measures resulting from stricter environmental regulations, including better emissions monitoring, safer disposal of waste ash and lower pollution during the construction phase [46].
Econometric analysis by Joskow and Rose [56] suggests that the specific costs of coal power plants built in the USA between 1960 and 1980 roughly doubled after controlling inter alia for input prices, unit and project scale and learning-by-doing at company and industry level. They find that the installation of scrubbers and cooling towers required to fulfil new environmental regulations explains about 20% of this increase. The authors were unable to measure any additional responses to the new environmental restrictions but suspect that such additional measures are likely to explain some (but not all) of the remaining unexplained cost increase. (The authors suspect that “more general problems of productivity in construction” led to some of the cost increases observed over the analysed period.)
Stricter environmental regulations may impact not only on capital costs but also on operating costs. According to McNerney et al. [105], many utilities operating coal power plants in the USA reacted to the new air emissions standards of the 1960s and 1970s by switching to higher priced low-sulphur coals. In many cases the low-sulphur coal was also more expensive to ship as transport distances increased. On the other hand, rail rates fell throughout the 1980s, possibly in part due to the rail industry’s deregulation throughout the 1970s and early 1980s.
There is strong consensus in the literature that stricter regulatory requirements over time were a key factor in explaining past cost increases observed for nuclear power plants in the USA and other countries [45,106]. Safety regulations and enforcement were continuously tightened from the start of commercial reactor construction in the mid-1960s until at least the late 1980s [27]. Nuclear safety regulations in countries around the world became stricter as public concerns over nuclear safety, waste disposal and proliferation grew, greater knowledge was gained about the risks of radiation and nuclear accidents—such as those at Three Mile Island (USA) in 1979 and Chernobyl (in present-day Ukraine) in 1986—occurred [103]. Stricter safety standards have led to greater technological complexity as well as to higher levels of material and labour inputs and have, consequently, contributed to longer construction times and cost increases [47,103]. In some cases, changes in regulations also required alterations to be made to nuclear power plants already under construction, meaning that some completed tasks needed to be reworked, which created additional costs and managerial complexity [46,47,104].
A review of studies analysing past developments of nuclear power plant construction costs concluded that these costs grew by about 15% annually in the USA during the 1970s and 1980s once important factors other than regulation had been controlled for [45]. However, the authors stress that this increase in costs may, to some extent, also capture the effects of additional factors not captured by the regression models of the various studies. They hypothesise that the nuclear industry may have tried to build large plants before the technology was mature enough to do so cost-effectively. McCabe [49] suggests that a deterioration in construction productivity may be another potential factor. However, he does not explain why construction productivity may have declined.
Due to the close collaboration between the French government, its agencies and the French nuclear industry, there has been relatively little regulatory uncertainty in the nuclear industry in France [58]. However, in the case of France it is also more difficult to find a measure of regulatory activity, as no public nuclear safety authority existed until 2006 [53,58]. Escobar Rangel and Lévêque [53] use two indicators of French nuclear power plants’ performance as a proxy for safety improvements, arguing that such improvements can be expected to lead to more reliable plant operations. They measure the plants’ performance by using the number of automatic shutdowns and the amount of energy that was not supplied by reactors due to unplanned deviations from normal operations. Their regression analysis indicates that higher safety standards are indeed related to higher specific plant costs.
According to Navarro [84], the Japanese “open and shut” process for new power plant construction was an important reason why the cost increases in the construction of nuclear power plants were less pronounced in Japan compared to the USA. This process aimed at resolving all political and procedural conflicts prior to the start of construction through negotiations involving the utility company, government representatives and political organisations representing other interests, such as environmental protection. While this process could be lengthy, once it was closed and construction approval was given, construction typically proceeded without delay.
Navarro [84] also suggests that fundamental differences between the USA and Japan in terms of antitrust laws and their enforcement may, in part, explain why the Japanese nuclear industry was better able than its US counterpart to contain cost increases over time. According to the author, antitrust regulations in Japan allow for contracting, engineering and reactor vendor responsibilities to be “confined to a small number of very large consortia that operate in a spirit of cooperation rather than competition”.
According to Hewlett [107], regulatory changes not only affected construction costs but also the operation and maintenance costs of nuclear power plants. The author finds evidence that the 11% average annual increase observed in real operation and maintenance costs of nuclear power plants in the USA from 1975 to 1987 was primarily the result of increased regulatory requirements.
Several authors describe qualitatively that certain regulatory conditions or changes affect the costs of onshore and offshore wind power plants. Vogel [108] notes that regulations addressing inter alia the noise and hub height of onshore wind turbines limit the potential for the economic optimisation of a plant’s design and siting. Gross et al. [27] report that gaining planning permission for onshore wind turbines in the UK had become increasingly difficult and costly by the early 2000s, as regulatory specifications were tightened to address public concerns about the impacts of wind turbines. In some countries, financial support measures for wind power plants were, or are, tied to the condition that these plants comprise a certain proportion of domestically-produced parts. These so called “local content” rules tend to increase wind power investment costs in the respective countries by reducing the number of qualified turbine suppliers [109].
For CSP power plants, Taylor et al. [110] note that throughout the 1980s regulations in the USA set a limit on the maximum size of CSP power plants, with the limit being much lower than the cost-optimal scale of such plants. The limit was set at 30 MW for facilities that were exempted from being regulated as utilities; otherwise the limit was set at 80 MW. The cost optimal scale of a CSP plant was estimated to be around 200 MW [110]. The same regulations also limited the size of installed circulating fluidized bed (CFB) technology to below 100 MWel until the year 2000. As the technology was already available for above 400 MWel, the regulatory size limit is likely to have prevented power producers from taking advantage of economies of unit scale [25].

2.4.2. Limits to the Availability of Suitable Sites

The characteristics of a site where a power plant is built typically influence the cost of installing that power plant and of generating electricity. If sites with particularly suitable characteristics are rare in a country or region, the increase in the deployment of an electricity generation technology may force investors to choose less suitable sites once the best locations have been used. The need to divert to less suitable locations can be caused not only by the lack of good sites due to natural characteristics, but also by public opposition to the construction of plants at highly suitable sites. Less suitable locations are associated with higher costs for constructing and/or operating the power plant for any given level of technology development. This potential effect on the generating costs over time is believed to be most relevant for renewable energy technologies as their effective operation depends to a great extent on certain climatic or geographical conditions. The associated increases in electricity generation costs may counteract learning-induced cost decreases over time [111,112,113,114].
Many authors argue that the scarcity of suitable sites can particularly affect the cost of onshore wind power generation, as shifting from sites with very good wind conditions to less suitable sites leads to lower load factors and/or the need to install turbines with higher towers and larger rotor diameters [10,72,113,115]. Similarly, for offshore wind power it is argued that sites which are relatively cheap to exploit are typically rare. Therefore, additional deployment will eventually require the use of sites that are increasingly distant from the coastline and in increasingly deep water, leading to higher installation costs [112] as well as higher operation and maintenance costs [116]. An increasing trend in ocean depth and distance to shore of new offshore wind projects has indeed been observed in the past, for example in the UK between 2005 and 2014 [95]. Voormolen et al. [17] find that increasing ocean depth and distance to shore contributed by about one third to the observed increase in investment costs of offshore wind farms in Europe between 2000 and January 2015.
In recent years, onshore wind turbines specifically adapted to less windy sites have been developed and these turbines tend to be more expensive per installed capacity due to their higher towers and bigger rotor diameters. The adapted turbines have helped to prevent average capacity factors of onshore wind turbines from decreasing over time, even in regions where average site conditions can be expected to have deteriorated [117,118]. No literature has been found which attempts to empirically quantify the isolated cost effects of deteriorating site conditions on the installation and/or generating costs of either onshore or offshore wind power plants.
Investment and operating costs of nuclear power plants also depend, to some extent, on site characteristics. Navarro [84] reports that Japanese nuclear power plants rely exclusively on sea water cooling systems, giving them an investment cost advantage over the majority of US nuclear power plants which require cooling towers as they lack access to the sea or other big bodies of water. In France, the most suitable coastal sites for nuclear power plants were the first to be used during the country’s nuclear power plant construction programme. This eventually led to the need for new nuclear power plants to be built either at inland sites, requiring the construction of cooling towers, or at poorer coastal sites, necessitating large earthworks [103]. According to MacKerron [103], this “undoubtedly” had an influence on the capital costs of the country’s new nuclear power plants, but is likely to have contributed no more “than a small proportion to the total escalation in French costs”. Cooling towers are reported to have added an average of between 7% and 8% to the costs of nuclear power plants built in the USA between 1971 and 1978 [46].

2.5. Summary of Cost Factors

Table 2 summarises the findings of the literature review in Section 2.1, Section 2.2, Section 2.3 and Section 2.4 by indicating which factors have influenced which generation technologies. For certain important electricity generation technologies, such as biomass power plants, hydropower plants and geothermal plants, the information in the literature is very limited and, therefore, these technologies are not included. In the table, an arrow pointing downward indicates that there is clear evidence in the literature that a factor has led to cost reductions in the past, while an arrow pointing upward indicates that there is clear evidence that a factor has led to cost increases. Circles imply that the literature has generally found no effects, or only minor effects. Brackets are added in cases where the literature is not entirely conclusive and where the author’s assessment of the direction of cost changes is, therefore, based on limited empirical evidence from the literature. A hyphen indicates that no information, or only insufficient information, is available to assess the effects of that particular factor on the cost of a particular technology.
The table shows that learning and technological improvements, as well as economies of scale, typically contribute to cost reductions, while changes in input factor prices, as well as regulatory changes and limits to the availability of suitable sites, have tended to lead to cost increases. The table provides some indications why solar PV has, in the past, exhibited higher learning rates than other technologies, as many factors have been identified which have led to PV cost decreases—while only one factor has been identified which has led to (temporary) PV cost increases. In contrast, several factors have led to cost increases in the case of nuclear power and the effect of cost decreases through deployment-induced learning has been too limited to compensate for these factors—explaining why the one-factor experience curve has been of little use in explaining past cost developments of nuclear power.

3. Insights Gained in Regard to Future Cost Developments

One intention of this review is to inform energy modellers about those factors which have been shown to be of importance in explaining past cost developments of electricity generation technologies. It stands to reason that these factors will also be the key factors influencing the future (relative) costs of electricity generation technologies. Based on assessments found in the literature, as well as on the author’s own judgement, Table 3 offers a list of how some factors may be expected to become more or less important (compared to the past) in influencing a technology’s future costs.
The table gives, for example, indications that solar PV may sooner or later “lose” economies of manufacturing scale as a key factor leading to continuous cost reductions. This means that the one-factor PV learning rate, which has been remarkably stable for decades, could decline in the future. However, a reliable estimate of how much the rate would decline remains elusive, as there does not appear to be enough certainty in the estimates of how much manufacturing scale has, in the past, contributed to PV cost declines. Nonetheless, energy modellers can use this information, for example to reduce the learning rate of PV over time, or use a lower range of possible future PV learning rates in stochastic modelling once PV market growth slows down or comes to a halt.
In the case of nuclear power, there appears to be the potential for ending cost increases and possibly even initiating cost decreases if a stable or more predictable regulatory environment were to prevail in the future. However, it is difficult to predict whether such a regulatory environment will indeed be realised. Even if it is, it is likely that a relatively large number of new nuclear reactors (ideally very similar in design) would need to be built for deployment-induced learning and economies of manufacturing scale to be achieved to a significant extent. Whether there will be sufficient global demand for this technology in the coming decades is unclear.
For electricity generation technologies that are not yet in commercial use, no empirical analyses of cost developments exist. These technologies are, therefore, not included in the present analysis. However, knowledge about past cost drivers of electricity generation technologies may be used to try to infer information about the likely future cost developments of new electricity generation technologies. For example, MacGillivray et al. [119] assume that marine renewable energy technologies may benefit from economies of project size by mounting multiple units on the same foundation. The authors also recommend that the marine renewable energy industry focuses on economies of manufacturing scale through unit modularity, rather than on economies of unit scale, and that it attempts to take advantage of potential spillover effects from offshore wind energy.
Regarding CCS power plants, some authors suggest that future economies of project scale may be achievable by building larger plants or by clustering several plants, allowing the required CO2 transportation network to be used more effectively [27,120]. On the other hand, Rai et al. [104] compare the regulatory complexity and the related uncertainty of CCS technology to the nuclear industry and warn that the effects of potentially unstable regulatory frameworks may counteract any future cost reductions in CCS technology. Future regulatory frameworks for CCS technology are expected to be complex because they will need to address not only the capturing of CO2 but also its transport and storage. One example of the uncertainty associated with the regulatory framework is the as yet unresolved issue of long-term liabilities associated with how the injected CO2 behaves [104]. Furthermore, CCS coal power plants in particular will be subject to emissions regulations (regarding mercury emissions for example [121]), which may continue to become stricter over time.
Knowledge about past cost drivers of electricity generation technologies may also inform estimates of future cost developments in the related field of energy storage technologies. Small-scale and modular technologies, such as batteries for example, can be expected to benefit to a much greater degree from deployment-induced learning and economies of manufacturing scale than large-scale storage technologies, such as pumped hydro storage or compressed air storage technology. For lead-acid batteries produced in the USA between 1989 and 2012, Matteson and Williams [122] find a strong correlation between experience and price, once material costs are excluded. They deduce a residual (i.e., non-material cost) learning rate of 24% for small lead-acid batteries and a residual learning rate of 19% for large lead-acid batteries. Large-scale storage technologies on the other hand may also be more susceptible to cost increases owing to regulatory changes.
It should be noted again that the market costs focused on in this article are only one element of the overall societal cost of electricity provision. In the coming years and decades, the evolution of system integration costs will become more important in comparing the costs of various electricity generation technologies from a societal perspective [9]. System integration costs include transmission costs and balancing costs and are not part of the definition of market costs used here. System integration costs will become more important as the share of fluctuating renewable energy sources (especially wind and solar PV) in total electricity generation continues to increase around the world. Finding ways to reduce the rise in integration costs as the share of fluctuating renewable energy sources increases will be important in order for countries around the world to fully benefit from the improvements in market costs and the comparatively low external costs of solar and wind technologies.

4. Conclusions

The preceding review of the historical cost developments of various electricity generation technologies has identified 10 factors, all of which have had a considerable influence on past cost developments. The review has highlighted the fact that the cost of the technologies is not only influenced by deployment-induced learning and research and development—the two factors typically at the centre of this discussion. In fact, knowledge spillovers and upsizing, as well as economies of manufacturing and project scale, have also contributed to reductions in the costs of electricity generation technologies over time. At the same time, changes in the price or quality of input factors, as well as regulatory changes, have tended to increase the costs of many generation technologies. The review has shown that each technology is affected by a different combination of factors influencing their market costs.
The insights gained by the review can be used by researchers to make better informed assumptions about the future cost developments of the analysed technologies, as well as of other technologies exhibiting similar characteristics. The insights can also guide policymakers in attempts to create regulatory and market conditions that are as favourable as possible for further cost reductions in electricity generation technologies.
At the same time, the literature review has illustrated the difficulties in determining quantitatively and with certainty the various factors that have influenced past cost developments. Quantification appears to be especially elusive with regards to the roles that RD&D-induced learning, knowledge spillovers and regulatory changes play. Similarly, it has proven difficult to separate the effects that some of the factors have had on the past cost developments of individual technologies, especially regarding the respective roles of deployment-induced learning, RD&D-induced learning, knowledge spillovers, upsizing and economies of manufacturing scale.
It is possible that a clear separation of the effects of these factors is neither possible nor reasonable as they may closely interact with one another. For example, considerable deployment of a technology may not just lead to learning through learning-by-doing, learning-by-using and learning-by-interacting, but is also likely to lead to further consequences: companies and governments are likely to increase their respective RD&D budgets for the technology; engineering experience is gained which may help to solve challenges associated with upsizing the technology; and a growing industry also tends to lead to bigger manufacturing plants, enabling the exploitation of economies of manufacturing scale. These interdependencies may also explain the close correlation between deployment and costs for many technologies, as indicated by experience curve analysis [31,32]—especially once changes in material and labour costs are accounted for. It would be useful if future research were to try to better understand the interrelationships between the various factors that influence technology costs.
Despite the inherent difficulties in determining and quantifying the role played by individual factors on the past cost developments of electricity generation technologies, our knowledge about these factors would certainly benefit from more empirical studies analysing as many of these factors as possible—as opposed to, for example, merely deriving one-factor experience curves. Some factors, such as economies of manufacturing scale and changes in material and labour costs, appear to be important for many technologies and can principally be quantified with some certainty. These factors should definitely be taken into account in future studies, as several studies have recently shown that this is possible and worthwhile [29,42,94].
In-depth case studies on factors influencing costs are currently rare and would ideally complement studies conducting regression analysis. Case studies have the particular potential to improve our understanding of the aforementioned factors that are difficult to quantify and would also potentially provide relevant information about the interdependencies between different factors.
Finally, it is reasonable to expect that the costs of integrating electricity generated from fluctuating renewable energy sources (especially wind and solar) will play an increasingly important role in the coming years and decades in determining the overall costs of electricity supply. It could, therefore, be worthwhile for future research to focus on better understanding the historical and potential future cost developments of technologies such as batteries and fuel cells or of measures aiming to shave or shift demand peaks.

Acknowledgments

The author acknowledges financial support from the Wuppertal Institute for Climate, Environment and Energy within the funding programme ‘Open Access Publishing’.

Conflicts of Interest

The author declares no conflict of interest.

References

  1. Pereira, M.G.; Sena, J.A.; Freitas, M.A.V.; da Silva, N.F. Evaluation of the impact of access to electricity: A comparative analysis of South Africa, China, India and Brazil. Renew. Sustain. Energy Rev. 2011, 15, 1427–1441. [Google Scholar] [CrossRef]
  2. The World Bank World Development Indicators. Available online: http://databank.worldbank.org/data/download/WDI_excel.zip (accessed on 7 November 2016).
  3. Key World Energy Statistics 2015; International Energy Agency: Paris, France, 2015.
  4. World Energy Outlook 2015; IEA/Organisation for Economic Co-operation and Development OECD: Paris, France, 2015.
  5. Lechtenböhmer, S.; Samadi, S. The Power Sector: Pioneer and Workhouse of Decarbonization. In Decarbonization in the European Union: Internal Policies and External Strategies; Dupont, C., Ed.; Palgrave Macmillan: Basingstoke, UK, 2015; pp. 46–69. [Google Scholar]
  6. Teske, S.; Sawyer, S.; Schäfer, O. Energy [r]evolution—A Sustainable World Energy Outlook 2015—100% Renewable Energy for All; Greenpeace: Hamburg, Germany, 2015. [Google Scholar]
  7. Krey, V. Global energy-climate scenarios and models: A review. WIREs Energy Environ. 2014, 3, 363–383. [Google Scholar] [CrossRef]
  8. Pfenninger, S.; Hawkes, A.; Keirstead, J. Energy systems modeling for twenty-first century energy challenges. Renew. Sustain. Energy Rev. 2014, 33, 74–86. [Google Scholar] [CrossRef]
  9. Hirth, L.; Ueckerdt, F.; Edenhofer, O. Integration costs revisited—An economic framework for wind and solar variability. Renew. Energy 2015, 74, 925–939. [Google Scholar] [CrossRef]
  10. Ibenholt, K. Explaining learning curves for wind power. Energy Policy 2002, 30, 1181–1189. [Google Scholar] [CrossRef]
  11. Pan, H.; Köhler, J. Technological change in energy systems: Learning curves, logistic curves and input–output coefficients. Ecol. Econ. 2007, 63, 749–758. [Google Scholar] [CrossRef]
  12. Creating Markets for Energy Technologies; International Energy Agency: Paris, France, 2003.
  13. Wene, C.-O. Energy Technology Learning through Deployment in Competitive Markets. Eng. Econ. 2008, 53, 340–364. [Google Scholar] [CrossRef]
  14. Gilbert, R. Looking for Mr. Schumpeter: Where Are We in the Competition-Innovation Debate? In Innovation Policy and the Economy; Jaffe, A.B., Lerner, J., Stern, S., Eds.; National Bureau of Economic Research, Inc.: Cambridge, MA, USA, 2006; Volume 6, pp. 159–215. [Google Scholar]
  15. Horbach, J. Determinants of environmental innovation—New evidence from German panel data sources. Res. Policy 2008, 37, 163–173. [Google Scholar] [CrossRef]
  16. Arvizu, D.; Balaya, P.; Cabeza, L.F.; Hollands, K.G.T.; Jäger-Waldau, A.; Kondo, M.; Konseibo, C.; Meleshko, V.; Stein, W.; Tamaura, Y.; et al. Direct Solar Energy. In IPCC Special Report on Renewable Energy Sources and Climate Change Mitigation; Edenhofer, O., Pichs-Madruga, R., Sokona, Y., Seyboth, K., Matschoss, P., Kadner, S., Zwickel, T., Eickemeier, P., Hansen, G., Schlömer, S., et al., Eds.; Cambridge University Press: Cambridge, UK; New York, NY, USA, 2011. [Google Scholar]
  17. Voormolen, J.A.; Junginger, H.M.; van Sark, W.G.J.H.M. Unravelling historical cost developments of offshore wind energy in Europe. Energy Policy 2016, 88, 435–444. [Google Scholar] [CrossRef]
  18. Rosenberg, N. The Direction of Technological Change: Inducement Mechanisms and Focusing Devices. Econ. Dev. Cult. Chang. 1969, 18, 1–24. [Google Scholar] [CrossRef]
  19. Clarke, L.; Weyant, J.; Birky, A. On the sources of technological change: Assessing the evidence. Energy Econ. 2006, 28, 579–595. [Google Scholar] [CrossRef]
  20. Söderholm, P.; Sundqvist, T. Empirical challenges in the use of learning curves for assessing the economic prospects of renewable energy technologies. Renew. Energy 2007, 32, 2559–2578. [Google Scholar] [CrossRef]
  21. Wright, T.P. Factors Affecting the Cost of Airplanes. J. Aeronaut. Sci. 1936, 3, 122–128. [Google Scholar] [CrossRef]
  22. Jaffe, A.B.; Newell, R.G.; Stavins, R.N. Technological change and the Environment. In Handbook of Environmental Economics; Environmental Degradation and Institutional Responses; Mäler, K.G., Vincent, J.R., Eds.; Elsevier: Amsterdam, The Netherlands, 2003; Volume 1, pp. 461–516. [Google Scholar]
  23. Schaeffer, G.J.; Alsema, E.; Seebregts, A.; Beurskens, L.; de Moor, H.; van Sark, W.; Durstewitz, M.; Perrin, M.; Boulanger, P.; Laukamp, H.; et al. Learning from the Sun. In Analysis of the Use of Experience Curves for Energy Policy Purposes: The Case of Photovoltaic Power; Final Report of the Photex Project; Energy Research Centre of the Netherlands (ECN): Petten, The Netherlands, 2004. [Google Scholar]
  24. Kamp, L.M.; Smits, R.E.H.M.; Andriesse, C.D. Notions on learning applied to wind turbine development in the Netherlands and Denmark. Energy Policy 2004, 32, 1625–1637. [Google Scholar] [CrossRef]
  25. Koornneef, J.; Junginger, M.; Faaij, A. Development of fluidized bed combustion—An overview of trends, performance and cost. Prog. Energy Combust. Sci. 2007, 33, 19–55. [Google Scholar] [CrossRef]
  26. Tang, T.; Popp, D. The Learning Process and Technological Change in Wind Power: Evidence from China’s CDM Wind Projects. J. Policy Anal. Manag. 2016, 35, 195–222. [Google Scholar] [CrossRef]
  27. Gross, R.; Heptonstall, P.; Greenacre, P.; Candelise, C.; Jones, F.; Castillo Castillo, A. Presenting the Future: Electricity Generation Cost Estimation Methodologies; UK Energy Research Centre (UKERC): London, UK, 2013. [Google Scholar]
  28. Junginger, M.; de Visser, E.; Hjort-Gregersen, K.; Koornneef, J.; Raven, R.; Faaij, A.; Turkenburg, W. Technological learning in bioenergy systems. Energy Policy 2006, 34, 4024–4041. [Google Scholar] [CrossRef]
  29. Yu, C.F.; van Sark, W.G.J.H.M.; Alsema, E.A. Unraveling the photovoltaic technology learning curve by incorporation of input price changes and scale effects. Renew. Sustain. Energy Rev. 2011, 15, 324–337. [Google Scholar] [CrossRef]
  30. De La Tour, A.; Glachant, M.; Ménière, Y. Predicting the costs of photovoltaic solar modules in 2020 using experience curve models. Energy 2013, 62, 341–348. [Google Scholar] [CrossRef]
  31. Rubin, E.S.; Azevedo, I.M.L.; Jaramillo, P.; Yeh, S. A review of learning rates for electricity supply technologies. Energy Policy 2015, 86, 198–218. [Google Scholar] [CrossRef]
  32. Samadi, S. The learning curve theory and its application in the field of electricity generation technologies. Renew. Sustain. Energy Rev. 2016. submitted. [Google Scholar]
  33. Junginger, M.; Faaij, A.; Turkenburg, W.C. Global experience curves for wind farms. Energy Policy 2005, 33, 133–150. [Google Scholar] [CrossRef]
  34. Coulomb, L.; Neuhoff, K. Learning Curves and Changing Product Attributes: The Case of Wind Turbines; University of Cambridge, Electricity Policy Research Group: Cambridge, UK, 2006. [Google Scholar]
  35. Madsen, E.S.; Jensen, C.; Hansen, J.D. Scale in technology and learning-by-doing in the windmill industry. J. Int. Bus. Entrep. Dev. 2003, 1, 27–35. [Google Scholar] [CrossRef]
  36. Milborrow, D. Wind energy technology—The state of the art. Proc. Inst. Mech. Eng. Part A J. Power Energy 2002, 216, 23–30. [Google Scholar] [CrossRef]
  37. Bolinger, M.; Wiser, R. Understanding wind turbine price trends in the U.S. over the past decade. Energy Policy 2012, 42, 628–641. [Google Scholar] [CrossRef]
  38. Ek, K.; Söderholm, P. Technology learning in the presence of public R&D: The case of European wind power. Ecol. Econ. 2010, 69, 2356–2362. [Google Scholar]
  39. Wiser, R.; Bolinger, M. 2014 Wind Technologies Market Report; US Department of Energy: Washington, DC, USA, 2015.
  40. Wiser, R.; Bolinger, M. 2013 Wind Technologies Market Report; US Department of Energy: Washington, DC, USA, 2014.
  41. Berry, D. Innovation and the price of wind energy in the US. Energy Policy 2009, 37, 4493–4499. [Google Scholar] [CrossRef]
  42. Nemet, G.F. Beyond the learning curve: Factors influencing cost reductions in photovoltaics. Energy Policy 2006, 34, 3218–3232. [Google Scholar] [CrossRef]
  43. Pilkington Solar International. Statusbericht Solarthermische Kraftwerke: Erfahrungen, Aussichten und Empfehlungen zur Überwindung der Markthemmnisse für die Technologie der Parabolrinnensolarkraftwerke; Pilkington Solar International: Cologne, Germany, 1996. (In German) [Google Scholar]
  44. Berthélemy, M.; Escobar Rangel, L. Nuclear reactors’ construction costs: The role of lead-time, standardization and technological progress. Energy Policy 2015, 82, 118–130. [Google Scholar] [CrossRef]
  45. Tolley, G.S.; Jones, D.W.; Castellano, M.; Clune, W.; Davidson, P.; Desai, K.; Foo, A.; Kats, A.; Liao, M.; Iantchev, E.; et al. The Economic Future of Nuclear Power; University of Chicago: Chicago, IL, USA, 2004. [Google Scholar]
  46. Komanoff, C. Power Plant Cost Escalation: Nuclear and Coal Capital Costs, Regulation, and Economics; Komanoff Energy Associates: New York, NY, USA, 1981. [Google Scholar]
  47. Cantor, R.; Hewlett, J. The economics of nuclear power: Further evidence on learning, economies of scale, and regulatory effects. Resour. Energy 1988, 10, 315–335. [Google Scholar] [CrossRef]
  48. Canterbery, E.R.; Johnson, B.; Reading, D. Cost Savings from Nuclear Regulatory Reform: An Econometric Model. South. Econ. J. 1996, 62, 554–566. [Google Scholar] [CrossRef]
  49. McCabe, M.J. Principals, Agents, and the Learning Curve: The Case of Steam-Electric Power Plant Design and Construction. J. Ind. Econ. 1996, 44, 357–375. [Google Scholar] [CrossRef]
  50. Mooz, W.E. A Second Cost Analysis of Light Water Reactor Power Plants; Rand Corporation: Santa Monica, CA, USA, 1979. [Google Scholar]
  51. Zimmerman, M.B. Learning Effects and the Commercialization of New Energy Technologies: The Case of Nuclear Power. Bell J. Econ. 1982, 13, 297–310. [Google Scholar] [CrossRef]
  52. Marshall, J.M.; Navarro, P. Costs of Nuclear Power Plant Construction: Theory and New Evidence. RAND J. Econ. 1991, 22, 148–154. [Google Scholar] [CrossRef]
  53. Escobar Rangel, L.; Lévêque, F. Revisiting the Cost Escalation Curse of Nuclear Power: New Lessons from the French Experience. Econ. Energy Environ. Policy 2015, 4, 103–125. [Google Scholar] [CrossRef]
  54. Cour des Comptes. The Costs of the Nuclear Power Sector; Cour des Comptes: Paris, France, 2012. [Google Scholar]
  55. Yeh, S.; Rubin, E.S. A centurial history of technological change and learning curves for pulverized coal-fired utility boilers. Energy 2007, 32, 1996–2005. [Google Scholar] [CrossRef]
  56. Joskow, P.L.; Rose, N.L. The Effects of Technological Change, Experience, and Environmental Regulation on the Construction Cost of Coal-Burning Generating Units. RAND J. Econ. 1985, 16, 1–27. [Google Scholar] [CrossRef]
  57. Grubler, A.; Aguayo, F.; Gallagher, K.; Hekkert, M.; Jiang, K.; Mytelka, L.; Neij, L.; Nemet, G.; Wilson, C. Chapter 24—Policies for the Energy Technology Innovation System (ETIS). In Global Energy Assessment—Toward a Sustainable Future; Cambridge University Press: Cambridge, UK; New York, NY, USA; The International Institute for Applied Systems Analysis: Laxenburg, Austria, 2012; pp. 1665–1744. [Google Scholar]
  58. Grubler, A. The costs of the French nuclear scale-up: A case of negative learning by doing. Energy Policy 2010, 38, 5174–5188. [Google Scholar] [CrossRef]
  59. Klaassen, G.; Miketa, A.; Larsen, K.; Sundqvist, T. The impact of R&D on innovation for wind energy in Denmark, Germany and the United Kingdom. Ecol. Econ. 2005, 54, 227–240. [Google Scholar]
  60. Miketa, A.; Schrattenholzer, L. Experiments with a methodology to model the role of R&D expenditures in energy technology learning processes; first results. Energy Policy 2004, 32, 1679–1692. [Google Scholar]
  61. Lindman, Å.; Söderholm, P. Wind power learning rates: A conceptual review and meta-analysis. Energy Econ. 2012, 34, 754–761. [Google Scholar] [CrossRef]
  62. Wiebe, K.S.; Lutz, C. Endogenous technological change and the policy mix in renewable power generation. Renew. Sustain. Energy Rev. 2016, 60, 739–751. [Google Scholar] [CrossRef]
  63. Cory, K.S.; Bernow, S.; Dougherty, W.; Kartha, S.; Williams, E. Analysis of Wind Turbine Cost Reductions: The Role of Research and Development and Cumulative Production. In Proceedings of the American Wind Energy Association (AWEA) Windpower 1999 Conference, Burlington, VT, USA, 22 June 1999.
  64. Kobos, P.H.; Erickson, J.D.; Drennen, T.E. Technological learning and renewable energy costs: Implications for US renewable energy policy. Energy Policy 2006, 34, 1645–1658. [Google Scholar] [CrossRef]
  65. Söderholm, P.; Klaassen, G. Wind Power in Europe: A Simultaneous Innovation–Diffusion Model. Environ. Resour. Econ. 2007, 36, 163–190. [Google Scholar] [CrossRef]
  66. Baker, E.; Fowlie, M.; Lemoine, D.; Reynolds, S.S. The Economics of Solar Electricity. Annu. Rev. Resour. Econ. 2013, 5, 387–426. [Google Scholar] [CrossRef]
  67. Nemet, G.F. Inter-technology knowledge spillovers for energy technologies. Energy Econ. 2012, 34, 1259–1270. [Google Scholar] [CrossRef]
  68. Loiter, J.M.; Norberg-Bohm, V. Technology policy and renewable energy: Public roles in the development of new energy technologies. Energy Policy 1999, 27, 85–97. [Google Scholar] [CrossRef]
  69. Winskel, M.; Markusson, N.; Jeffrey, H.; Candelise, C.; Dutton, G.; Howarth, P.; Jablonski, S.; Kalyvas, C.; Ward, D. Learning pathways for energy supply technologies: Bridging between innovation studies and learning rates. Technol. Forecast. Soc. Chang. 2014, 81, 96–114. [Google Scholar] [CrossRef]
  70. Winskel, M. When systems are overthrown: The ‘Dash for Gas’ in the British electricity supply industry. Soc. Stud. Sci. 2002, 32, 563–598. [Google Scholar]
  71. Alberth, S. Forecasting technology costs via the experience curve—Myth or magic? Technol. Forecast. Soc. Chang. 2008, 75, 952–983. [Google Scholar] [CrossRef]
  72. Neij, L. Cost development of future technologies for power generation—A study based on experience curves and complementary bottom-up assessments. Energy Policy 2008, 36, 2200–2211. [Google Scholar] [CrossRef]
  73. Dutton, J.M.; Thomas, A. Treating Progress Functions as a Managerial Opportunity. Acad. Manag. Rev. 1984, 9, 235–247. [Google Scholar]
  74. Hall, G.; Howell, S. The experience curve from the economist’s perspective. Strateg. Manag. J. 1985, 6, 197–212. [Google Scholar] [CrossRef]
  75. Abell, D.F.; Hammond, J.S. Strategic Market Planning: Problems and Analytical Approaches; Prentice-Hall: Englewood Cliffs, NJ, USA, 1979. [Google Scholar]
  76. Clarke, L.; Weyant, J.; Edmonds, J. On the sources of technological change: What do the models assume? Energy Econ. 2008, 30, 409–424. [Google Scholar] [CrossRef]
  77. Experience Curves for Energy Technology Policy; International Energy Agency: Paris, France, 2000.
  78. Mackay, R.M.; Probert, S.D. Likely market-penetrations of renewable-energy technologies. Appl. Energy 1998, 59, 1–38. [Google Scholar] [CrossRef]
  79. Huang, N.; Hwang, A. Tongwei to Set up 5GWp Solar Cell Plant in China; DigiTimes: Taipei, Taiwan, 2015. [Google Scholar]
  80. Suk-yee, J. Hanwha Q Cells to Build Nation’s First Solar Cell Plant; BusinessKorea: Seoul, Korea, 2015. [Google Scholar]
  81. Watanabe, C.; Wakabayashi, K.; Miyazawa, T. Industrial dynamism and the creation of a “virtuous cycle” between R&D, market growth and price reduction: The case of photovoltaic power generation (PV) development in Japan. Technovation 2000, 20, 299–312. [Google Scholar]
  82. Qiu, Y.; Anadon, L.D. The price of wind power in China during its expansion: Technology adoption, learning-by-doing, economies of scale, and manufacturing localization. Energy Econ. 2012, 34, 772–785. [Google Scholar] [CrossRef]
  83. Lovering, J.R.; Yip, A.; Nordhaus, T. Historical construction costs of global nuclear power reactors. Energy Policy 2016, 91, 371–382. [Google Scholar] [CrossRef]
  84. Navarro, P. Comparative Energy Policy: The Economics of Nuclear Power in Japan and the United States. Energy J. 1988, 9, 1–15. [Google Scholar] [CrossRef]
  85. David, P.A.; Rothwell, G.S. Standardization, diversity and learning: Strategies for the coevolution of technology and industrial capacity. Int. J. Ind. Organ. 1996, 14, 181–201. [Google Scholar] [CrossRef]
  86. Lantz, E.; Wiser, R.; Hand, M. IEA Wind Task 26: The Past and Future Cost of Wind Energy; National Renewable Energy Laboratory: Golden, CO, USA, 2012. [Google Scholar]
  87. Anderson, J.W. Experience and the Evolution of Wind Power Project Costs in the United States; Stanford Institute for Economic Policy Research: Stanford, CA, USA, 2013. [Google Scholar]
  88. Barbose, G.; Darghouth, N. Tracking the Sun VIII—The Installed Price of Residential and Non-Residential Photovoltaic Systems in the United States; Lawrence Berkeley National Laboratory: Berkeley, CA, USA, 2015. [Google Scholar]
  89. International Monetary Fund. Indices of Primary Commodity Prices, 2005–2015; International Monetary Fund: Washington, DC, USA, 2016. [Google Scholar]
  90. Hayward, J.A.; Graham, P.W. A global and local endogenous experience curve model for projecting future uptake and cost of electricity generation technologies. Energy Econ. 2013, 40, 537–548. [Google Scholar] [CrossRef]
  91. Fondazione Eni Enrico Mattei (FEEM). Report on How to Improve the Representation of Technical Change into IAMs; FEEM: Milano, Italy, 2014. [Google Scholar]
  92. Greenacre, P.; Gross, R.; Heptonstall, P. Great Expectations: The Cost of Offshore Wind in UK Waters—Understanding the Past and Projecting the Future; UK Energy Research Centre (UKERC): London, UK, 2010. [Google Scholar]
  93. International Energy Agency. Projected Costs of Generating Electricity 2010; International Energy Agency: Paris, France, 2010. [Google Scholar]
  94. Van der Zwaan, B.; Rivera-Tinoco, R.; Lensink, S.; van den Oosterkamp, P. Cost reductions for offshore wind power: Exploring the balance between scaling, learning and R&D. Renew. Energy 2012, 41, 389–393. [Google Scholar]
  95. BWEA; Hassan, G. UK Offshore Wind: Charting the Right Course: Scenarios for Offshore Capital Costs for the Next Five Years; BWEA: London, UK, 2009. [Google Scholar]
  96. Nemet, G.F. Interim monitoring of cost dynamics for publicly supported energy technologies. Energy Policy 2009, 37, 825–835. [Google Scholar] [CrossRef]
  97. Gan, P.Y.; Li, Z. Quantitative study on long term global solar photovoltaic market. Renew. Sustain. Energy Rev. 2015, 46, 88–99. [Google Scholar] [CrossRef]
  98. Cohen, B.L. The Nuclear Energy Option: An Alternative for the 90’s; Plenum Publishing Corporation: New York, NY, USA, 1990. [Google Scholar]
  99. Shafiee, S.; Topal, E. A long-term view of worldwide fossil fuel prices. Appl. Energy 2010, 87, 988–1000. [Google Scholar] [CrossRef]
  100. Zellou, A.M.; Cuddington, J.T. Trends and Super Cycles in Crude Oil and Coal Prices; Colorado School of Mines: Golden, CO, USA, 2012. [Google Scholar]
  101. Department of Energy & Climate Change. Electricity Generation Costs 2013; Department of Energy & Climate Change: London, UK, 2013.
  102. Colpier, U.C.; Cornland, D. The economics of the combined cycle gas turbine—An experience curve analysis. Energy Policy 2002, 30, 309–316. [Google Scholar] [CrossRef]
  103. MacKerron, G. Nuclear costs: Why do they keep rising? Energy Policy 1992, 20, 641–652. [Google Scholar] [CrossRef]
  104. Rai, V.; Victor, D.G.; Thurber, M.C. Carbon capture and storage at scale: Lessons from the growth of analogous energy technologies. Energy Policy 2010, 38, 4089–4098. [Google Scholar] [CrossRef]
  105. McNerney, J.; Doyne Farmer, J.; Trancik, J.E. Historical costs of coal-fired electricity and implications for the future. Energy Policy 2011, 39, 3042–3054. [Google Scholar] [CrossRef]
  106. Wiesenthal, T.; Dowling, P.; Morbee, J.; Thiel, C.; Schade, B.; Russ, P.; Simoes, S.; Peteves, S.; Schoots, K.; Londo, M. Technology Learning Curves for Energy Policy Support; European Commission Joint Research Centre Institute for Prospective Technological Studies Institute for Energy and Transport: Luxemburg, 2012. [Google Scholar]
  107. Hewlett, J.G. Economic and Regulatory Factors Affecting the Maintenance of Nuclear Power Plants. Energy J. 1996, 17, 1–31. [Google Scholar] [CrossRef]
  108. Vogel, P. Wind Onshore Cost Development 2013. In Proceedings of the Workshop on Prospective Generation Costs until 2050, Berlin, Germany, 8 March 2013.
  109. Kuntze, J.-C.; Moerenhout, T. Local Content Requirements and the Renewable Energy Industry—A Good Match? International Centre for Trade and Sustainable Development: Geneva, Switzerland, 2013. [Google Scholar]
  110. Taylor, M.; Nemet, G.; Colvin, M.; Begley, L.; Wadia, C.; Dillavou, T. Government Actions and Innovation in Clean Energy Technologies: The Cases of Photovoltaic Cells, Solar Thermal Electric Power, and Solar Water Heating; California Energy Commission: Sacramento, CA, USA, 2007.
  111. Audus, H. The treatment of technology development in energy models. Int. J. Glob. Energy Issues 2000, 13, 58–69. [Google Scholar] [CrossRef]
  112. Technological Learning in the Energy Sector: Lessons for Policy, Industry and Science; Junginger, M.; van Sark, W.; Faaij, A. (Eds.) Edward Elgar Publishing: Cheltenham, UK; Northampton, MA, USA, 2010.
  113. Kalkuhl, M.; Edenhofer, O.; Lessmann, K. Learning or lock-in: Optimal technology policies to support mitigation. Resour. Energy Econ. 2012, 34, 1–23. [Google Scholar] [CrossRef]
  114. Neij, L. Cost dynamics of wind power. Energy 1999, 24, 375–389. [Google Scholar] [CrossRef]
  115. Ferioli, F.; Schoots, K.; van der Zwaan, B.C.C. Use and limitations of learning curves for energy technology policy: A component-learning hypothesis. Energy Policy 2009, 37, 2525–2535. [Google Scholar] [CrossRef]
  116. Roeth, J.; McClellan, S.; Ozkan, D.; Kempton, W.; Levitt, A.; Thomson, H. New York Offshore Wind Cost Reduction Study; New York State Energy Research and Development Authority: Albany, NY, USA, 2015.
  117. The International Renewable Energy Agency (IRENA). Renewable Energy Technology Innovation Policy. A Process Development Guide; IRENA: Abu Dhabi, UAE, 2015. [Google Scholar]
  118. Partridge, I. Renewable electricity generation in India—A learning rate analysis. Energy Policy 2013, 60, 906–915. [Google Scholar] [CrossRef]
  119. MacGillivray, A.; Jeffrey, H.; Winskel, M.; Bryden, I. Innovation and cost reduction for marine renewable energy: A learning investment sensitivity analysis. Technol. Forecast. Soc. Chang. 2014, 87, 108–124. [Google Scholar] [CrossRef]
  120. UK Carbon Capture and Storage. CCS Cost Reduction Task Force. In The Potential for Reducing the Costs of CCS in The UK; UK Carbon Capture and Storage: London, UK, 2013. [Google Scholar]
  121. Azevedo, I.; Jaramillo, P.; Rubin, E.; Yeh, S. Modeling Technology Learning for Electricity Supply Technologies; Electric Power Research Institute: Palo Alto, CA, USA, 2013. [Google Scholar]
  122. Matteson, S.; Williams, E. Residual learning rates in lead-acid batteries: Effects on emerging technologies. Energy Policy 2015, 85, 71–79. [Google Scholar] [CrossRef]
Figure 1. Factors influencing the market costs of electricity generation technologies as identified by the literature review.
Energies 09 00970 g001
Table 1. Literature estimates for the learning-by-searching rate of onshore wind power plants.
Literature SourceGeographical DomainIndependent Variable (Knowledge)Dependent Variable (Costs or Prices)PeriodLbS Rate (%)R2Additional Independent Variable(s) Controlled for
[63]OECD countries/USA 1Cumulative public RD&D expenditure (time lag: 3 years)Cost of generating electricity1985–199532%0.99 2Cumulative production
[59]Denmark, Germany, UKKnowledge stock derived from public RD&D expenditure (time lag: 2 years, depreciation factor: 3% p.a.)Specific investment costs1986–200013%0.72 2Cumulative capacity
[64]GlobalKnowledge stock derived from public RD&D expenditure (time lag: 5 years, depreciation factor: 2.5% p.a.)Specific investment costs1981–199718%0.95 2Cumulative capacity
[65]Denmark, Germany, Spain, UKKnowledge stock derived from public RD&D expenditure (time lag: 2 years, depreciation factor: 3% p.a.)Specific investment costs1986–200013%0.81Cumulative capacity, wind generation level, feed-in-price
[20]Denmark, Germany, Spain, UKCumulative public RD&D expenditureSpecific investment costs1986–20007%0.69 2Cumulative capacity
Knowledge stock derived from public RD&D expenditure (time lag: 2 years, depreciation factor: 3% p.a.)16%0.73 2Cumulative capacity
13%0.77 2Cumulative capacity, wind generation level, feed-in-price
[38]Denmark, Germany, Spain, Sweden, UKKnowledge stock derived from public RD&D expenditures (time lag: 2 years, depreciation factor: 3% p.a.)Specific investment costs1986–200221%0.88Cumulative capacity, economies of unit scale
[62]GlobalKnowledge stock derived from public RD&D expenditure (time lag: 15 years)Wind turbine prices1990–20123%0.84 2Cumulative capacity
Notes: 1 The geographical domains of the dependent and the independent variables differ in this experience curve. The region named first refers to the independent variable, while the country named after the slash refers to the geographical domain of the dependent variable; 2 Numbers refer to the adjusted R2. Unlike R2, the adjusted R2 does not automatically increase as more explanatory variables are added. Instead, the adjusted R2 only increases when additional explanatory variables improve the R2 more than would be expected by chance. LbS: Learning-by-searching; OECD: Organisation for Economic Co-operation and Development; RD&D: Research, development and demonstration; p.a.: Per annum.
Table 2. Summary of the findings of the literature review on factors influencing past cost developments of electricity generation technologies.
Categories of Cost-Influencing FactorsCost-Influencing FactorsWind (On- & Off-Shore)Solar PVCSPNuclear EnergyCoalNatural Gas
Learning and Technological ImprovementsDeployment-Induced Learning
RD&D-Induced Learning(↑)(↓)(↓)
Knowledge Spillovers from Other Technologies(↓)(↓)-
Upsizing↓/oo(↓)o↓/(o)-
Economies of ScaleEconomies of Manufacturing Scale-o(↓)
Economies of Project Scale--
Changes in Input Factor PricesChanges in Material and Labour Costs↓/↑--
Changes in Fuel Costsooo(o)o
Social and Geographical FactorsRegulatory Changes(o)(o)(↑)
Limits to the Availability of Suitable Sites(↑)(o)(o)-
Notes: An arrow pointing downward indicates that there is clear evidence in the literature that a factor has led to cost reductions in the past, while an arrow pointing upward indicates that there is clear evidence that a factor has led to cost increases. Circles imply that the literature has found no effects or only minor effects. Two different signs indicate that a factor has had different effects on a technology’s cost depending on the time period, with the dominant effect over the past one to two decades shown on the right hand side. Brackets are added in cases where the literature is not entirely conclusive and where the author’s assessment of the direction of cost changes is, therefore, based on limited empirical evidence in the literature. A hyphen indicates that no information, or only insufficient information, is available to assess the effects of that particular factor on the cost of a particular technology. PV: Photovoltaics; CSP: Concentrating solar power.
Table 3. Possible future changes in the factors influencing the cost of electricity generation technologies.
Type of Electricity GenerationPossible Future Changes in the Factors Influencing the Cost of Electricity Generation
Wind
  • Limited availability of good sites is likely to become more relevant (+)
  • Possible stronger economies of manufacturing scale once turbine designs change less over time (−)
Solar PV
  • Relevance of economies of manufacturing scale may diminish once the market no longer grows (+)
  • In some regions: limited availability of good sites may sooner or later play a role (+)
  • Chance of RD&D-induced technological breakthroughs generally believed to be bigger than for other technologies (−)
CSP
  • Potential for cost-reducing growth in average unit scale is likely to be limited (+)
  • Availability of good sites may sooner or later play a role (+)
Nuclear Energy
  • Future nuclear accidents may further tighten security regulations, leading to additional costs (+)
  • A stable or more predictive regulatory environment would probably reduce costs (−)
  • Introduction of smaller scale designs may offer more potential for learning and for economies of manufacturing scale (−)
Coal
  • Economies of unit size are either already exploited or offer only limited further potential (+)
  • Uncertain: future evolution of fuel and CO2 emission costs as well as relevant environmental regulation (+/−)
Natural gas
  • Uncertain: future evolution of fuel and CO2 emission costs (+/−)

