Article

Suitability Assessment of an ICE-Based Micro-CCHP Unit in Different Spanish Climatic Zones: Application of an Experimental Model in Transient Simulation

1
Defense University Center, Naval Academy, 36920 Marín, Spain
2
Industrial Engineering School, University of Vigo, Campus Lagoas Marcosende, 36310 Vigo, Spain
*
Author to whom correspondence should be addressed.
Energies 2016, 9(11), 969; https://doi.org/10.3390/en9110969
Submission received: 19 October 2016 / Revised: 11 November 2016 / Accepted: 14 November 2016 / Published: 20 November 2016

Abstract

:
Tri-generation plants will have an important role in the near future in the residential sector where heating and cooling demands come into play throughout the year. Depending on the building’s location, the characteristics of its enclosure and its use, the thermal loads and demands will be different. This article analyses and compares a combined cooling, heating and power (CCHP) system tested in the laboratory and a single household located in Spain. The cooling capacity is obtained using a reversible heat pump where the compressor is driven directly by a gas engine with internal combustion engine (ICE) technology. The tests were carried out in a work bench at three different operating speeds. A variable-speed model is developed in the TRNSYS simulation environment with an operating strategy following the thermal load (FTL). Once the micro-CCHP system was modeled with experimental data and validated, it was dynamically simulated to analyze its performance in different climatic zones defined in the Spanish “Código Técnico de la Edificación” (CTE). This study reveals that the micro-CCHP system is suitable in mild weathers during the summer season.

1. Introduction

An energetic model based on micro-cogeneration units or district models represents a very important issue in the near future [1]. Increasing fuel prices and power demands together with the Kyoto Protocol require more efficient models such as smart grids where the distribution losses are minimized and the waste heat is more useful than in thermal power plants. The correct sizing of the plant is a very important issue to obtain a reduction in greenhouse gas emissions [2].
When energy is used in a cogenerate way, a significant increase in efficiency is obtained. Normally, if a thermal engine produces only electrical power, efficiencies around 40% can be obtained, but if the system has cogeneration capacities this efficiency can be increased up to 90% [3]. Furthermore, if the cogeneration plant moves a heat pump system with reversible possibilities, efficiencies over 100% can be achieved, and the system is usually called a trigeneration plant or combined cooling, heating and power plant (CCHP).
Nowadays the most typical heating system installed in Spain is a conventional condensation boiler [4]. Depending on the application, a different type of micro-tri or co-generation technology can be selected because each one presents different advantages. The most common technologies for prime movers in micro-CCHP units are ICE, micro-turbines, Stirling engine, organic Rankine cycle, or fuel cells, among others [5,6] although the last two are still entering the market. ICE-based CCHP systems are more mature, with many development examples in literature [7,8].
The number of installed units has been growing in the last ten years, in countries like the UK, Japan or China, and policies regarding CCHP stimulate the use of such technologies in the residential sector [9]. Micro-CCHP units are the focus of very recent innovative research. Chen et al. [10] designed a novel residential micro-combined cooling, heating and 5 kW power system incorporating a proton exchange membrane fuel cell (PEMFC) stack. The system was completed with a single effect absortion chiller. A steady state mathematic model of the overall system was developed and validated, and a parametric analysis of system performance was performed. Wu et al. [11] developed a micro-CCHP based on ICE and adsorption chiller (AD). This system incorporated a thermal management controller that automatically assigned waste heat to different water cycles for heating, cooling, or release.
An innovative study with a military and strategic point of view was done by Horvath et al. [12]. They consider that the inefficiency of traditional configurations results in a high fuel requirement which compromises both safety and stability, when the fuel has to travel through a lengthy, complex, hostile network. A CCHP configuration, using thermally activated cooling technology, is proposed and simulated using TRNSYS [13].
Two of the most common operation strategies are to run the prime mover in accordance to either electrical or thermal demand. Mago et al. [14] proposed an innovative micro-CCHP system that operates following a hybrid electrical-thermal load. Han et al. continued working this topic in their work in 2014 [15]. Based on this work, Zheng et al. proposed an optimized operation strategy based on the minimum distance [16]. This improvement is developed in order to make full use of the CCHP system with less excess energy.
Much recent research has aimed to define a better operation strategy of CCHP systems [17,18,19]. Alternative considerations to classic ones were developed by Baniasad et al. [20]. In their work, they consider the effect of heat storage and fuel price on energy management and economics of micro-CCHP systems.
Other technologies can be integrated with CCHP systems. Wang et al. evaluated the possibility of using thermoelectric generators (TEG) and condensing heat exchanger to recover the exhaust gas waste heat of an ICE based CCHP unit [21].
The location of the building is also important due to the different climates and consequently due to the different cooling and heating loads. Exhaustive research has been conducted comparing different locations for mobile homes, like caravans and sailing boats [22,23].
Annual operating hours of these technologies together with thermophotovoltaic generators are evaluated when the cogeneration plant supply energy to two dwellings with different size. The appropriated TES size is also studied in the function of the different technologies [2].
This article analyses and improves the match between a proposed tri-generation system and the needs of a medium detached house. Depending on the DHW demands, and indirectly on the building location, the plant will require a different optimum tank storage capacity and a different battery bank size because the tri-generation engine has different running hours to attend heating and cooling demands among others. The plant was simulated in the TRNSYS simulation environment, following the thermal load (FTL) as an operating strategy.

2. Methodology

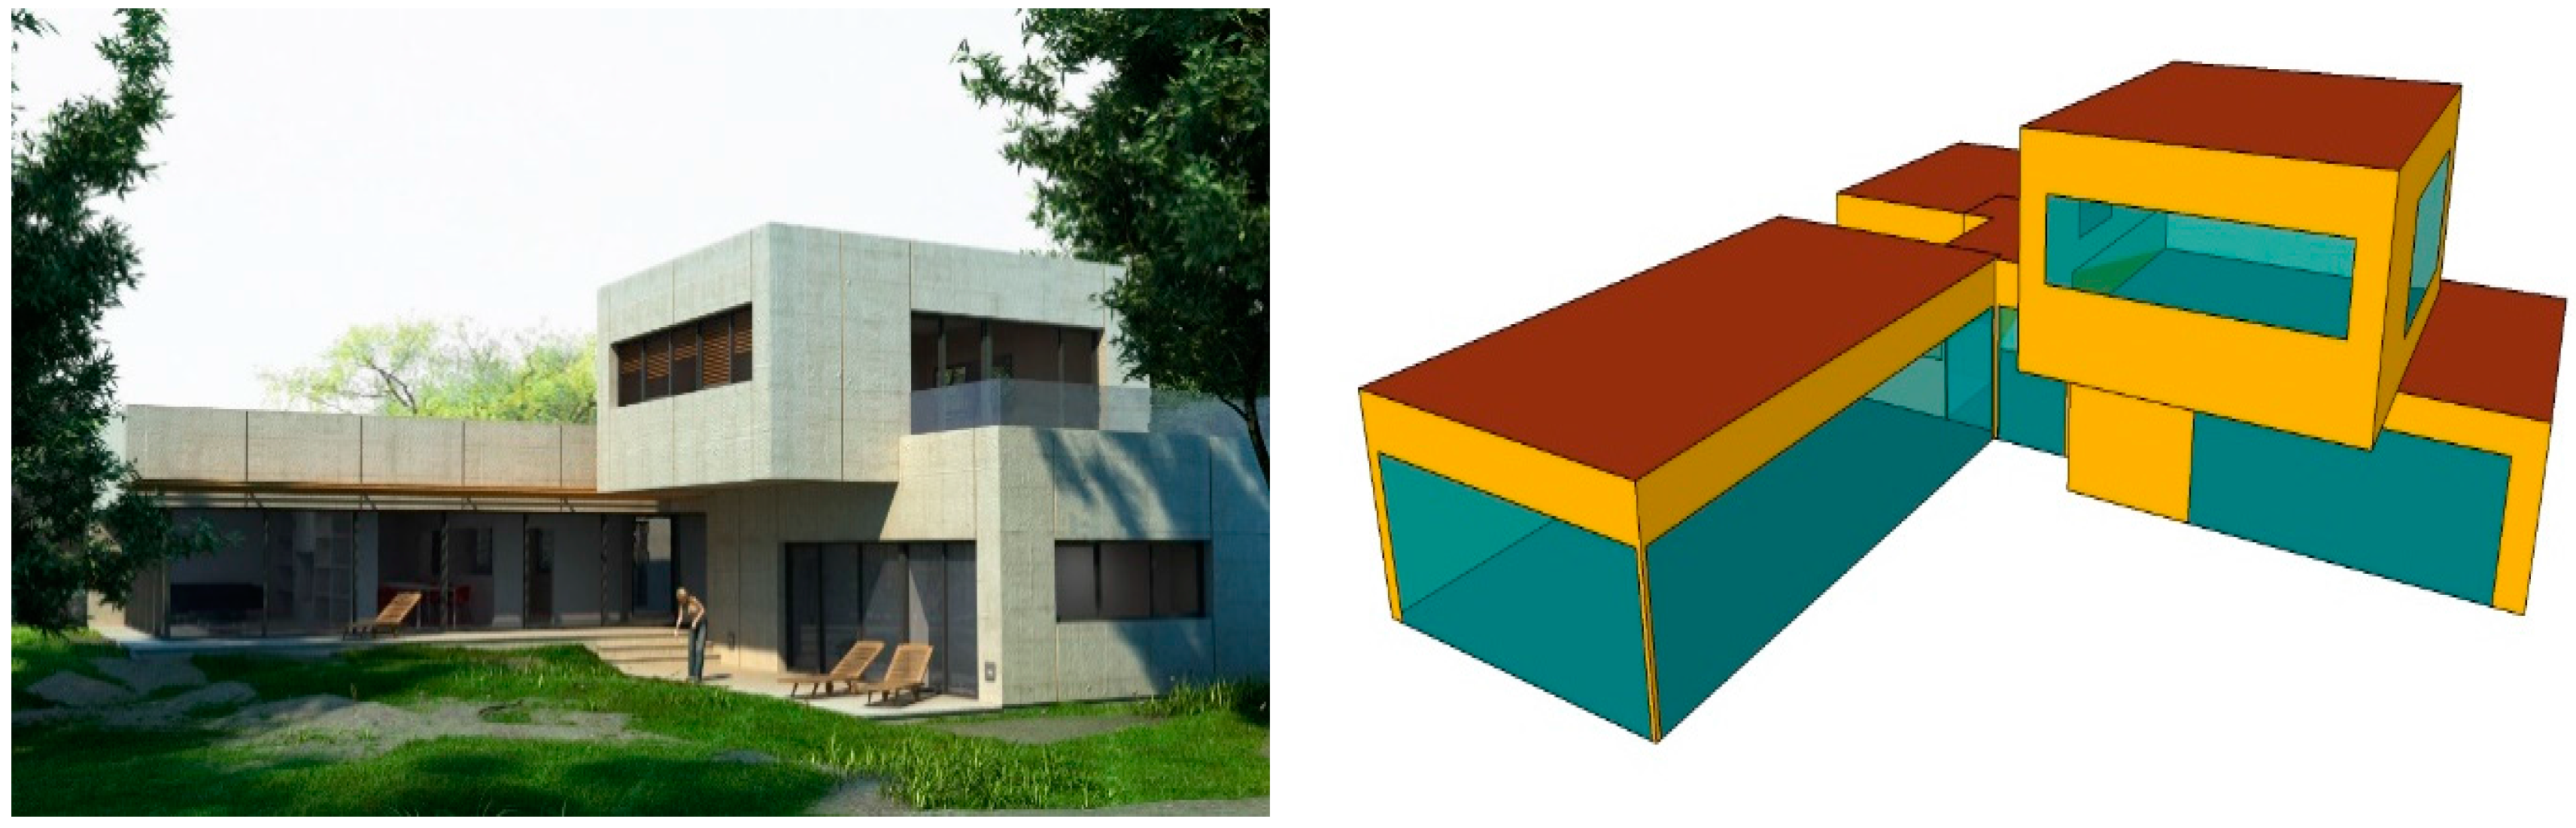
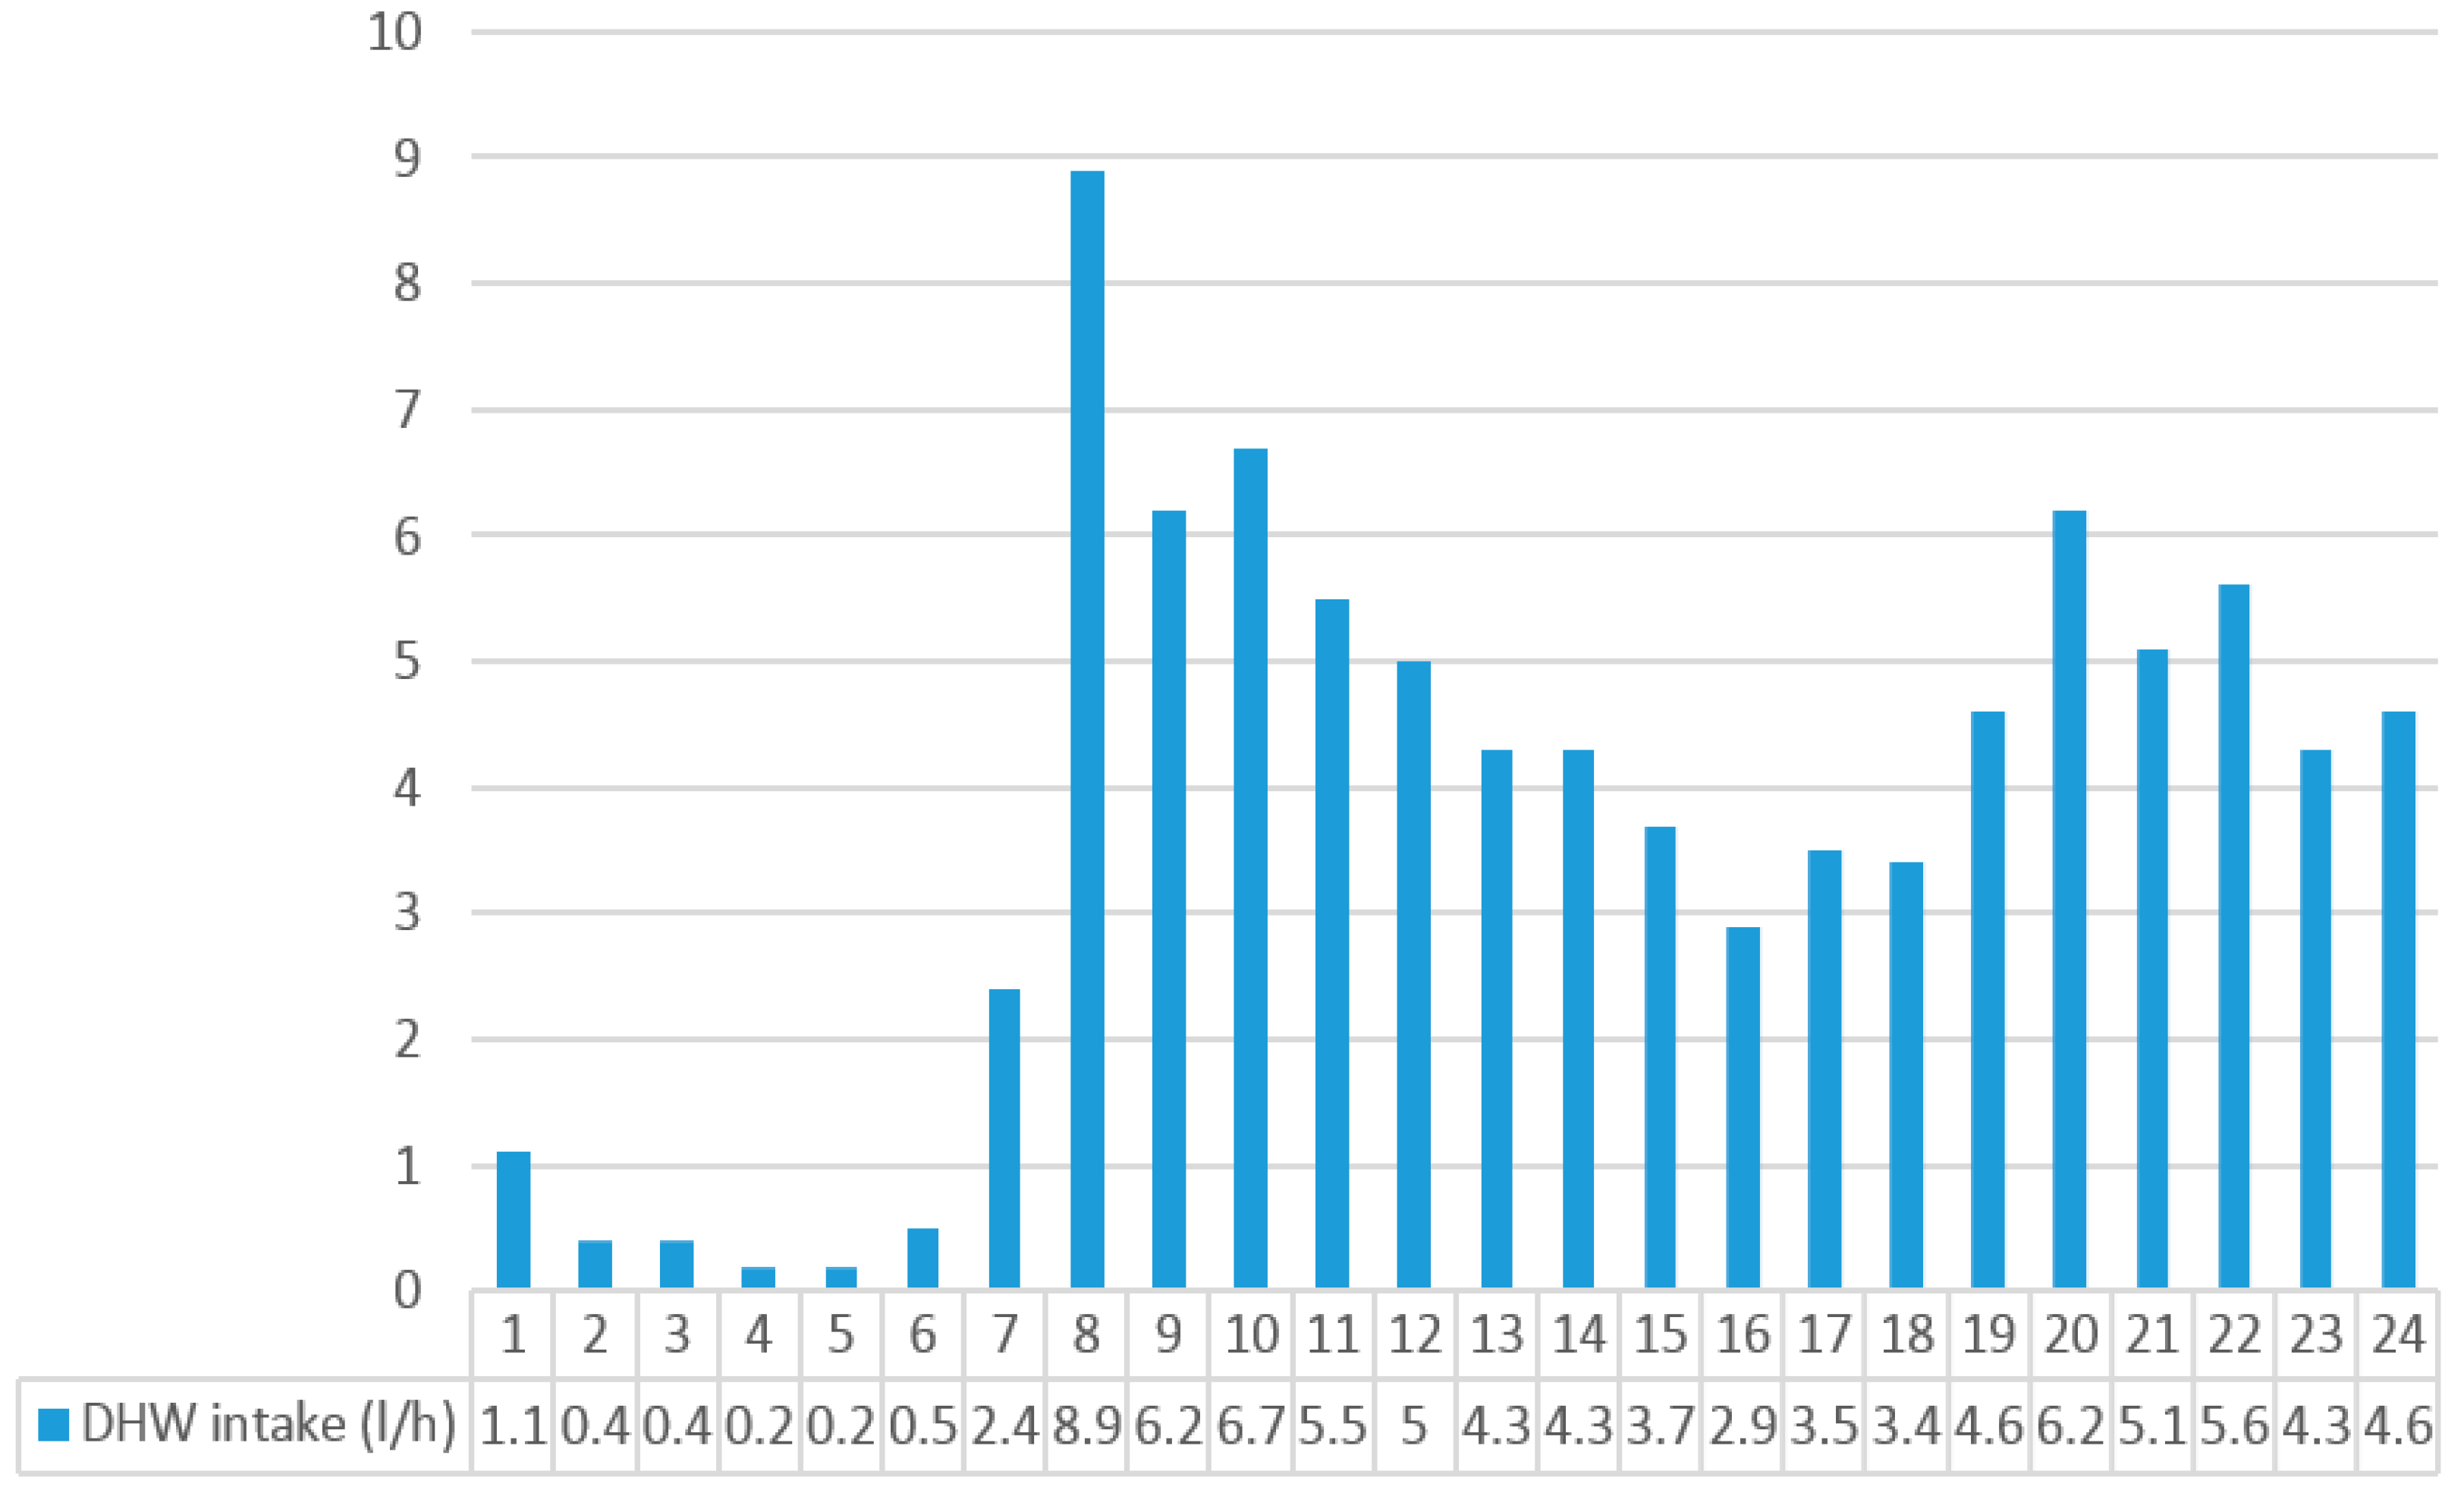
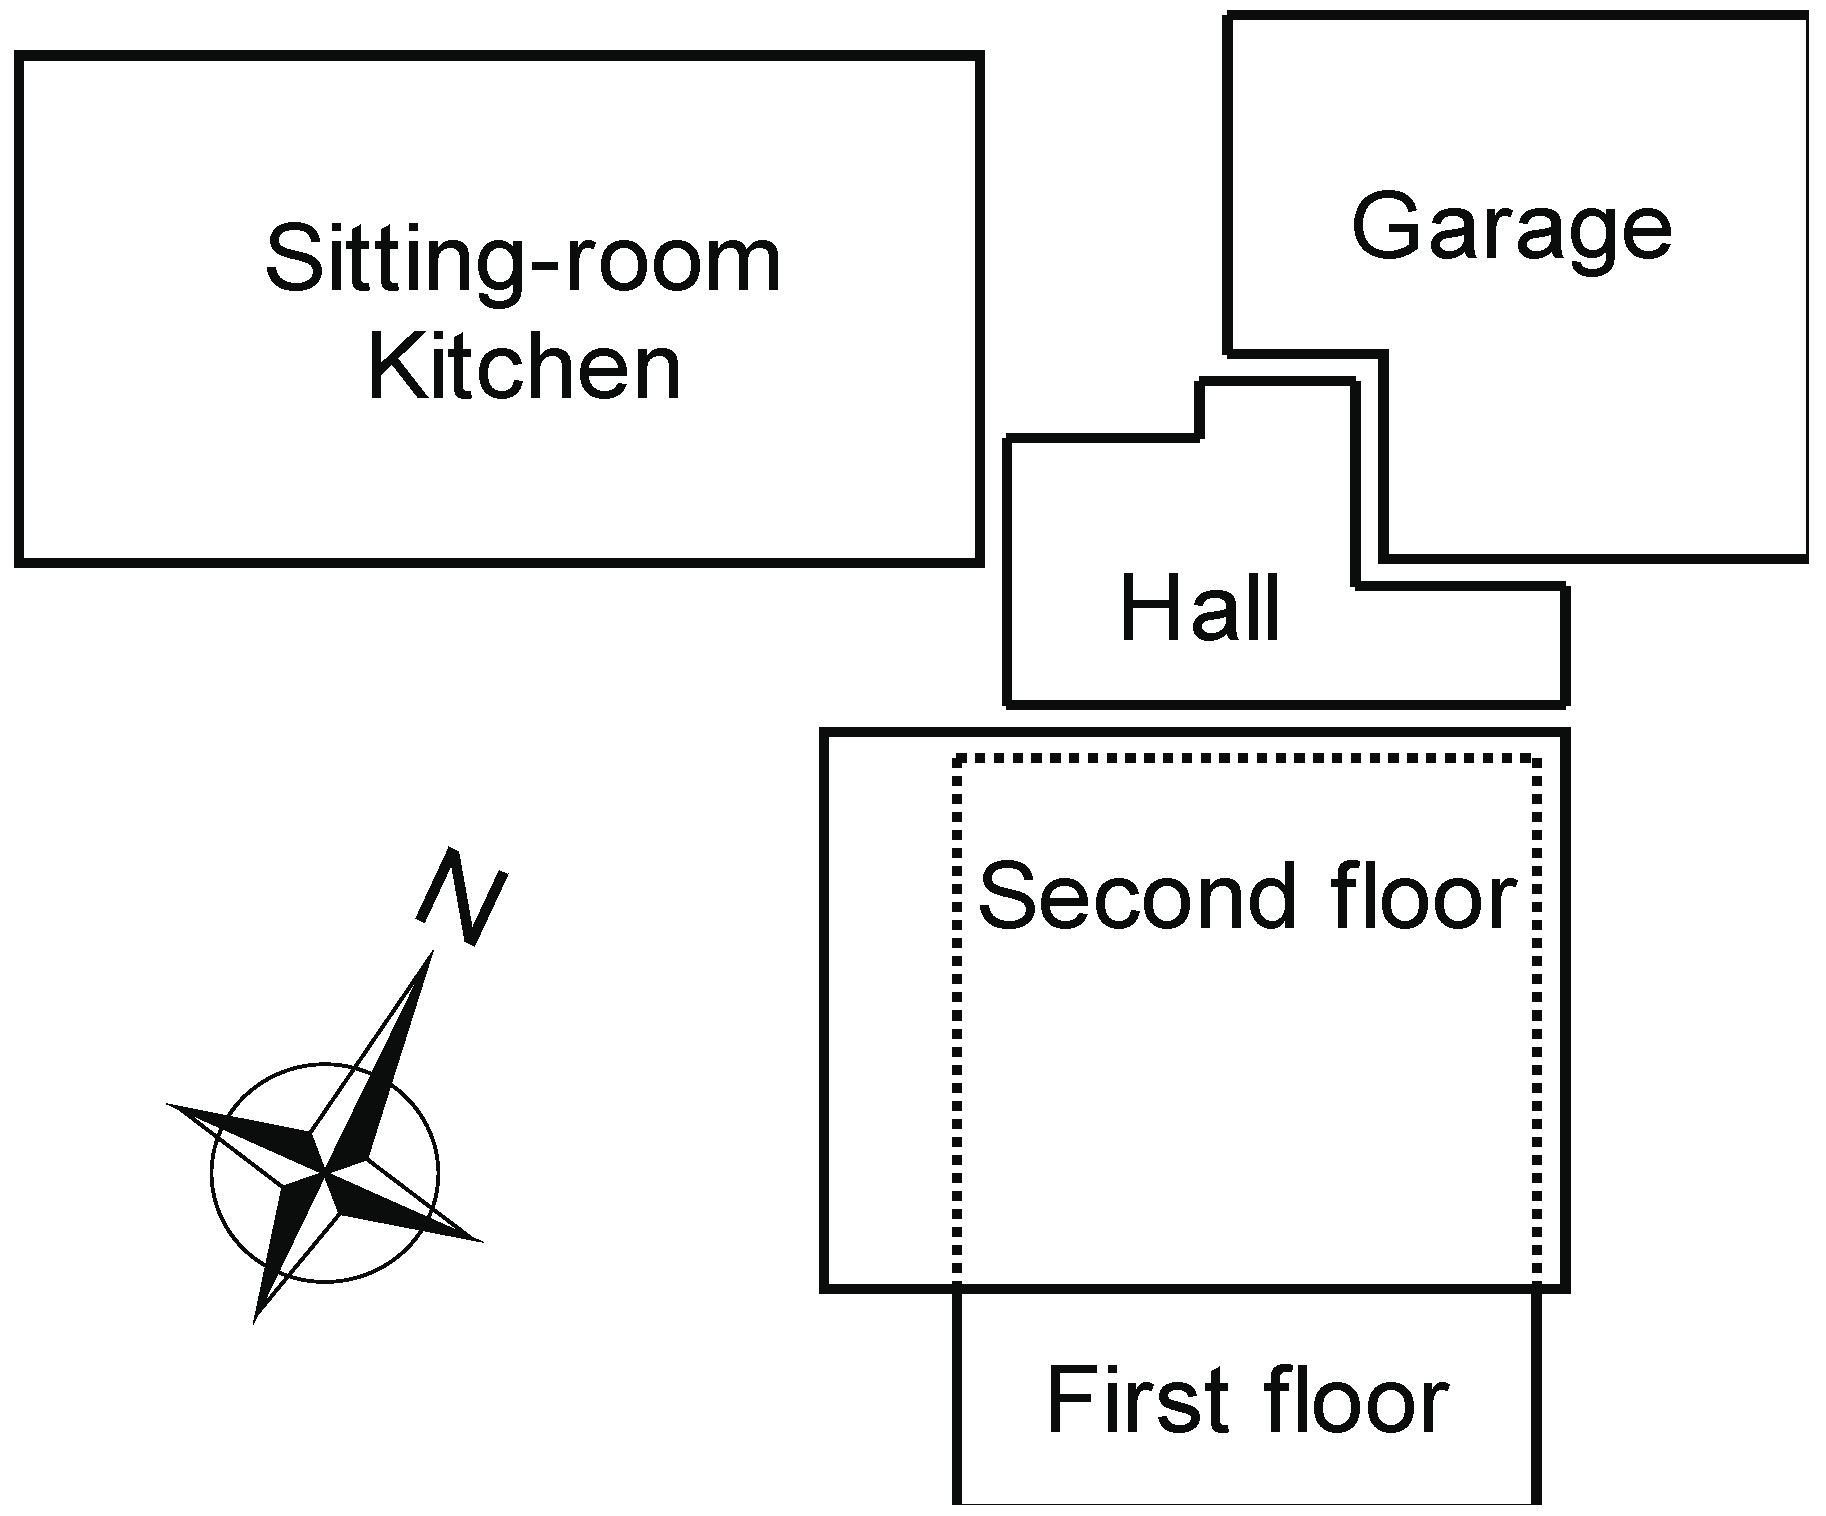
2.1. Building Description, Energy Demands and Climate Conditions

A new detached house was chosen to carry out this research. Total useful area of the dwelling is 286.25 m2, distributed in two floors (Figure 1), and 242.23 m2 are thermally conditioned. Geometrical details of the building are described in Table 1. The building envelope is designed based on the requirements set by the Spanish Building Technical Code (in Spanish: CTE) [24]. Envelope main features are shown in Table 2.
Dwelling geometrical model was designed using SketchUp software; it was divided into four thermal zones (Figure 2), on two different levels: first floor (garage, room 1, kitchen/living room, and hall) and second floor (room 2). A high density of glazed walls was considered in this building. This will have a big influence on the final results. Even though the garage was not thermally conditioned, it was included in the model to define boundary conditions.
The Spanish Technical Building Code [25] stipulates that the codification of a climatic zones comes from a combination of climatic severities (CS), ranging from A to E for winter periods and from 1 to 4 for summer periods [26], where A and 1 are the less severe areas for winter and summer, respectively (Figure 3). Thus, for example, the city of León would have a climatic severity E1, which implies very cold winters and mild summers. Figure 3 shows the different Spanish climatic zones.
Applied methodology for suitability assessment requires choosing at least one place or city for each CTE climatic zone. Table 3 shows selected cities and their winter (A–E) and summer (1–4) climatic severities.
Simulation weather conditions were retrieved from the Meteonorm database [27]. Dwelling capacity was set to 3 people, considering an average capacity of 0.03 people/m2 out of the total area destined for bedrooms [28], as is specified in the CTE [29]. Two time periods were considered for setting temperature limits. The temperature set point in the heating season was set to 17 °C from 0:00 a.m. to 7:00 a.m., and to 20 °C from 7:00 a.m. to 0:00 a.m. [24]. In the cooling season it was set to 25 °C from 16:00 p.m. to 23:00 p.m., and to 27 °C from 0:00 a.m. to 7:00 a.m. [30,31]. A temperature set of 26 °C was chosen for that period where CTE do not specify any set point temperature. This decision was made considering recommendations of Institute for Energy Diversification and Savings (in Spanish: IDAE) [32]. Moreover, airchange ratio was set to 1.55 renovations per hour, according to the air quality specifications of the CTE for such type of building [33].
DHW utilization was calculated according to the conditions established in CTE for detached dwellings, with a daily intake of 30 L/person at 60 °C. DHW daily profiles were provided by IDAE [34]. In the case of this study, considering a capacity of 3 people, a total intake of 90 L/day is necessary and the utilization profile is shown in Figure 4.
Tap water temperature is necessary for DHW thermal energy load estimation. A monthly mean temperature is set for each location as it is shown in Table 4.
Both DHW utilization profile and tap water temperature are considered inputs of the transient simulation.
Electrical demand was based on the annual mean intake of a typical detached dwelling. It was set to 4560 kWh [35]. Annual profile was calculated considering information provided by a Spanish electric supplier [36]. Figure 5 shows annual hourly consumption profile for a standard year. Warm and cool seasons lengths where established following IDAE recommendations [31].
The system tries to satisfy thermal demands, as the operating strategy is FTD. DHW demand is a priority and is always covered. Thus, electricity production is compared to load for coverage estimation.

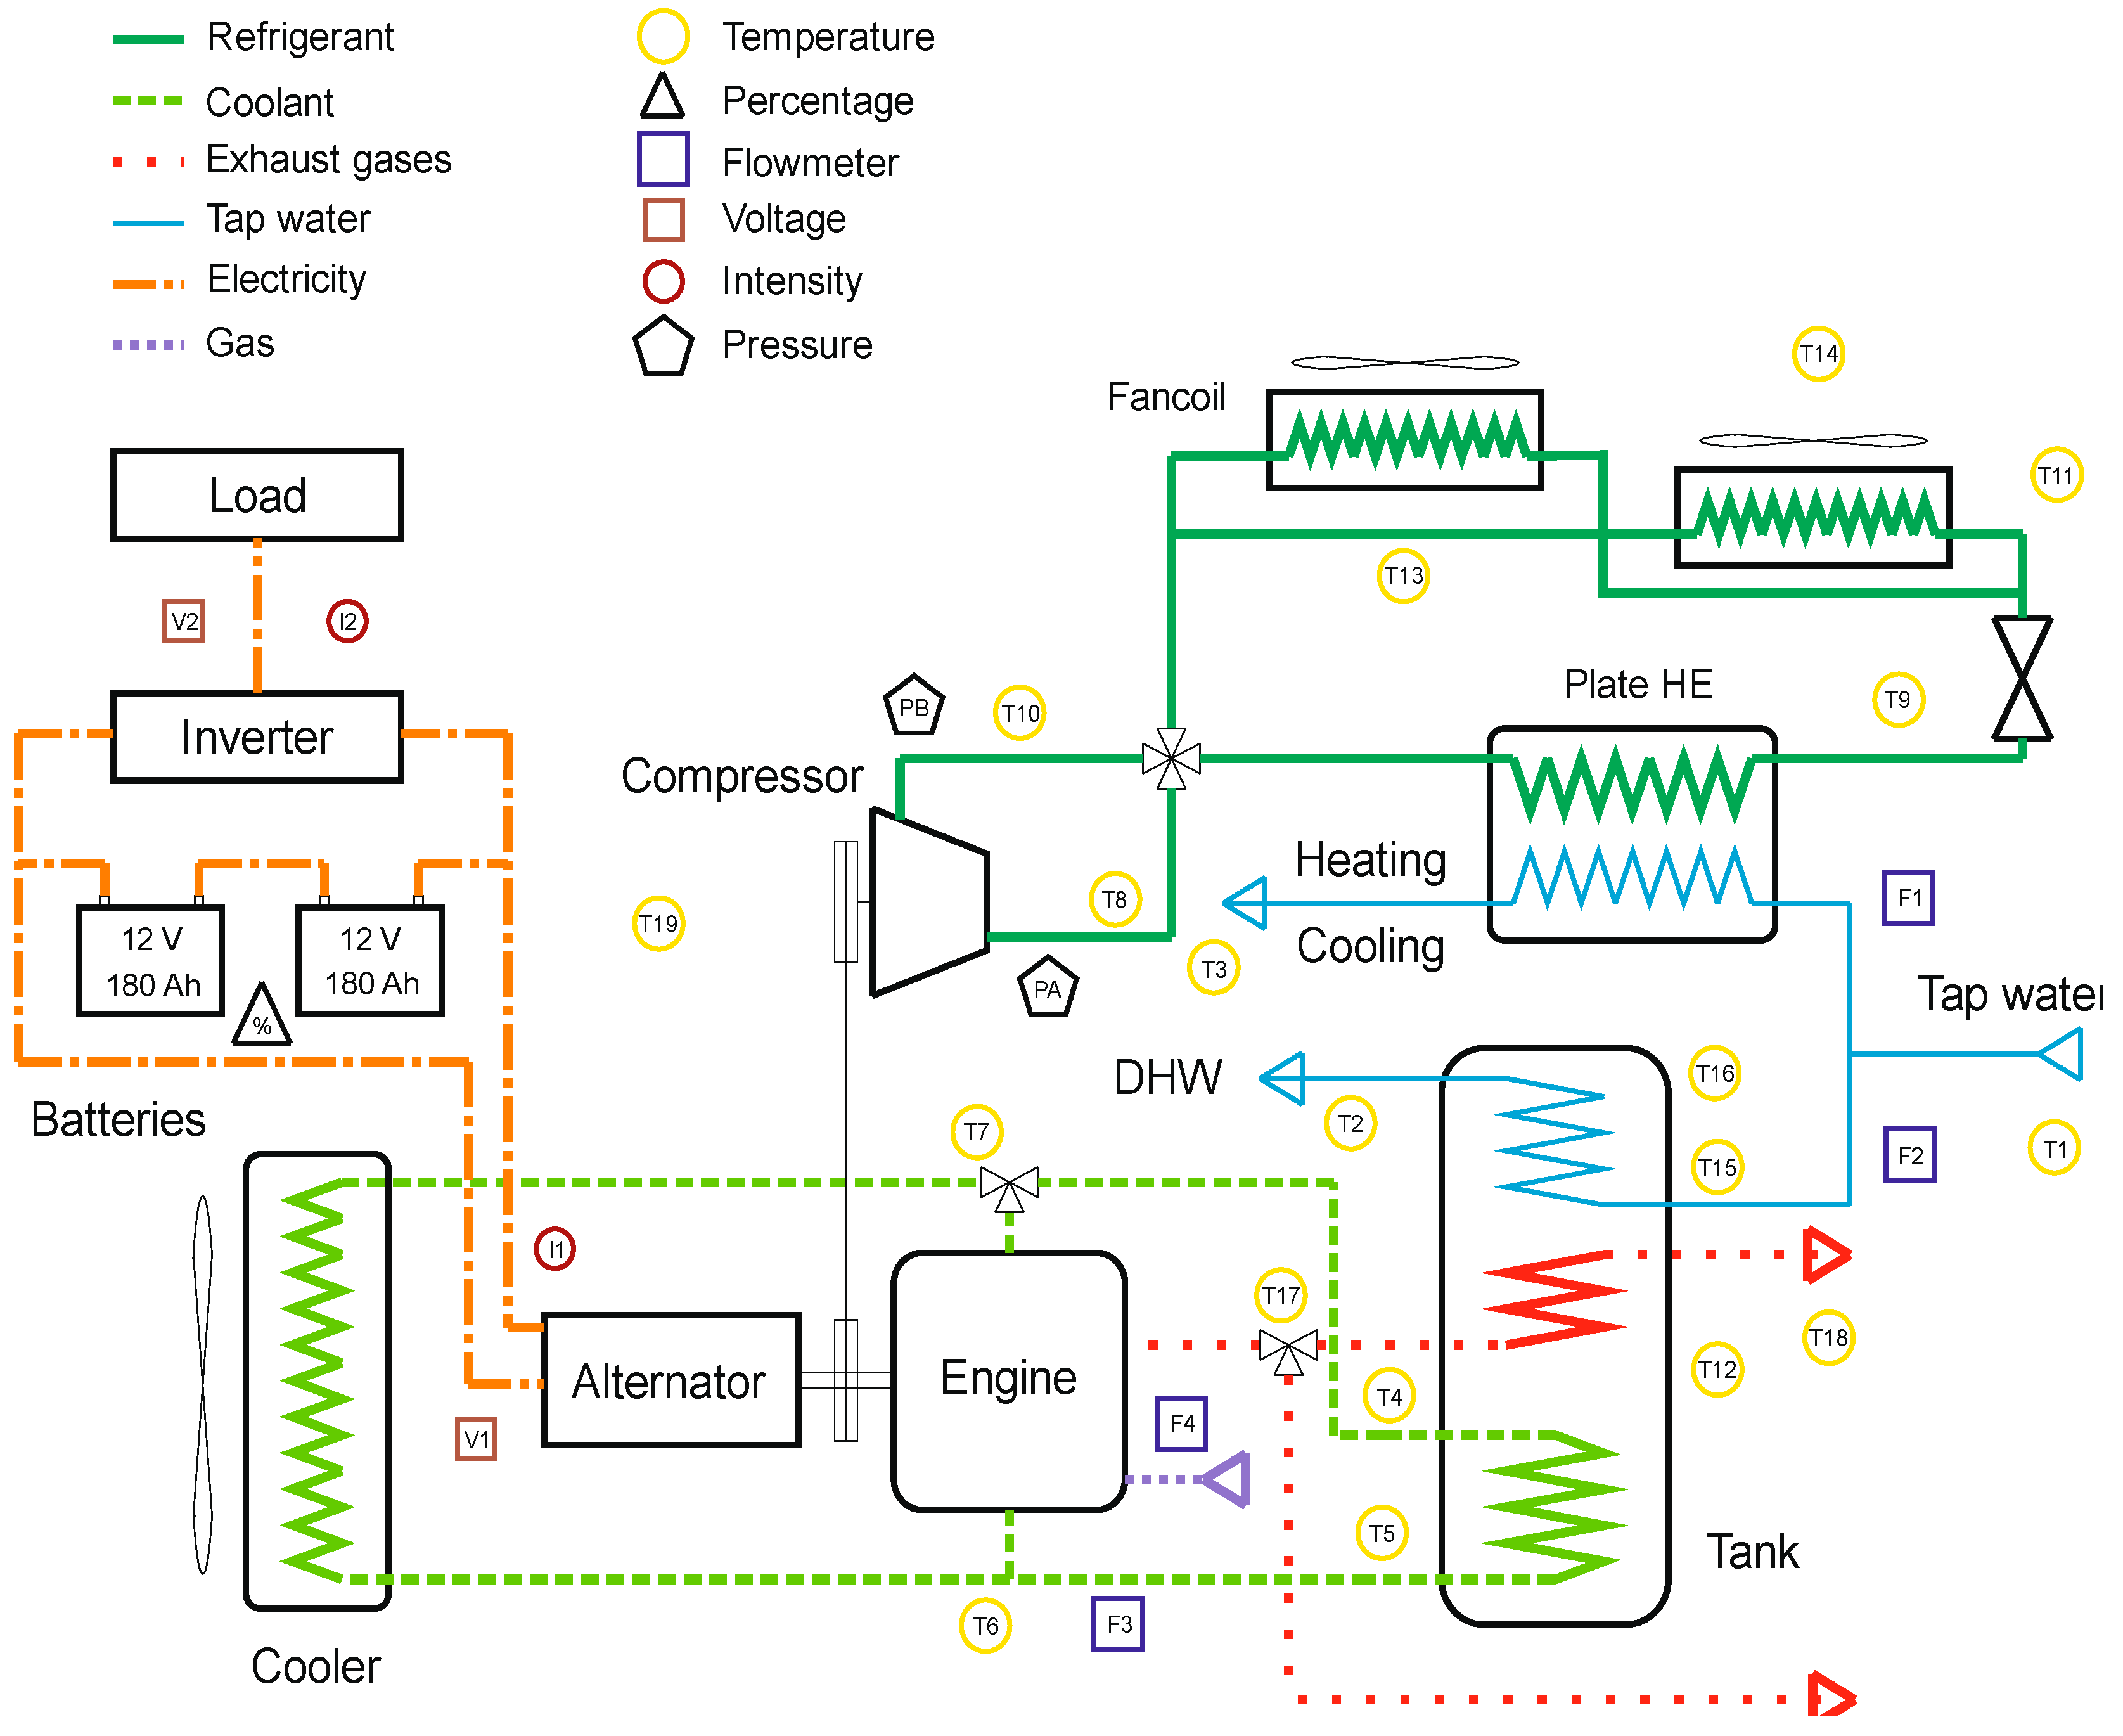
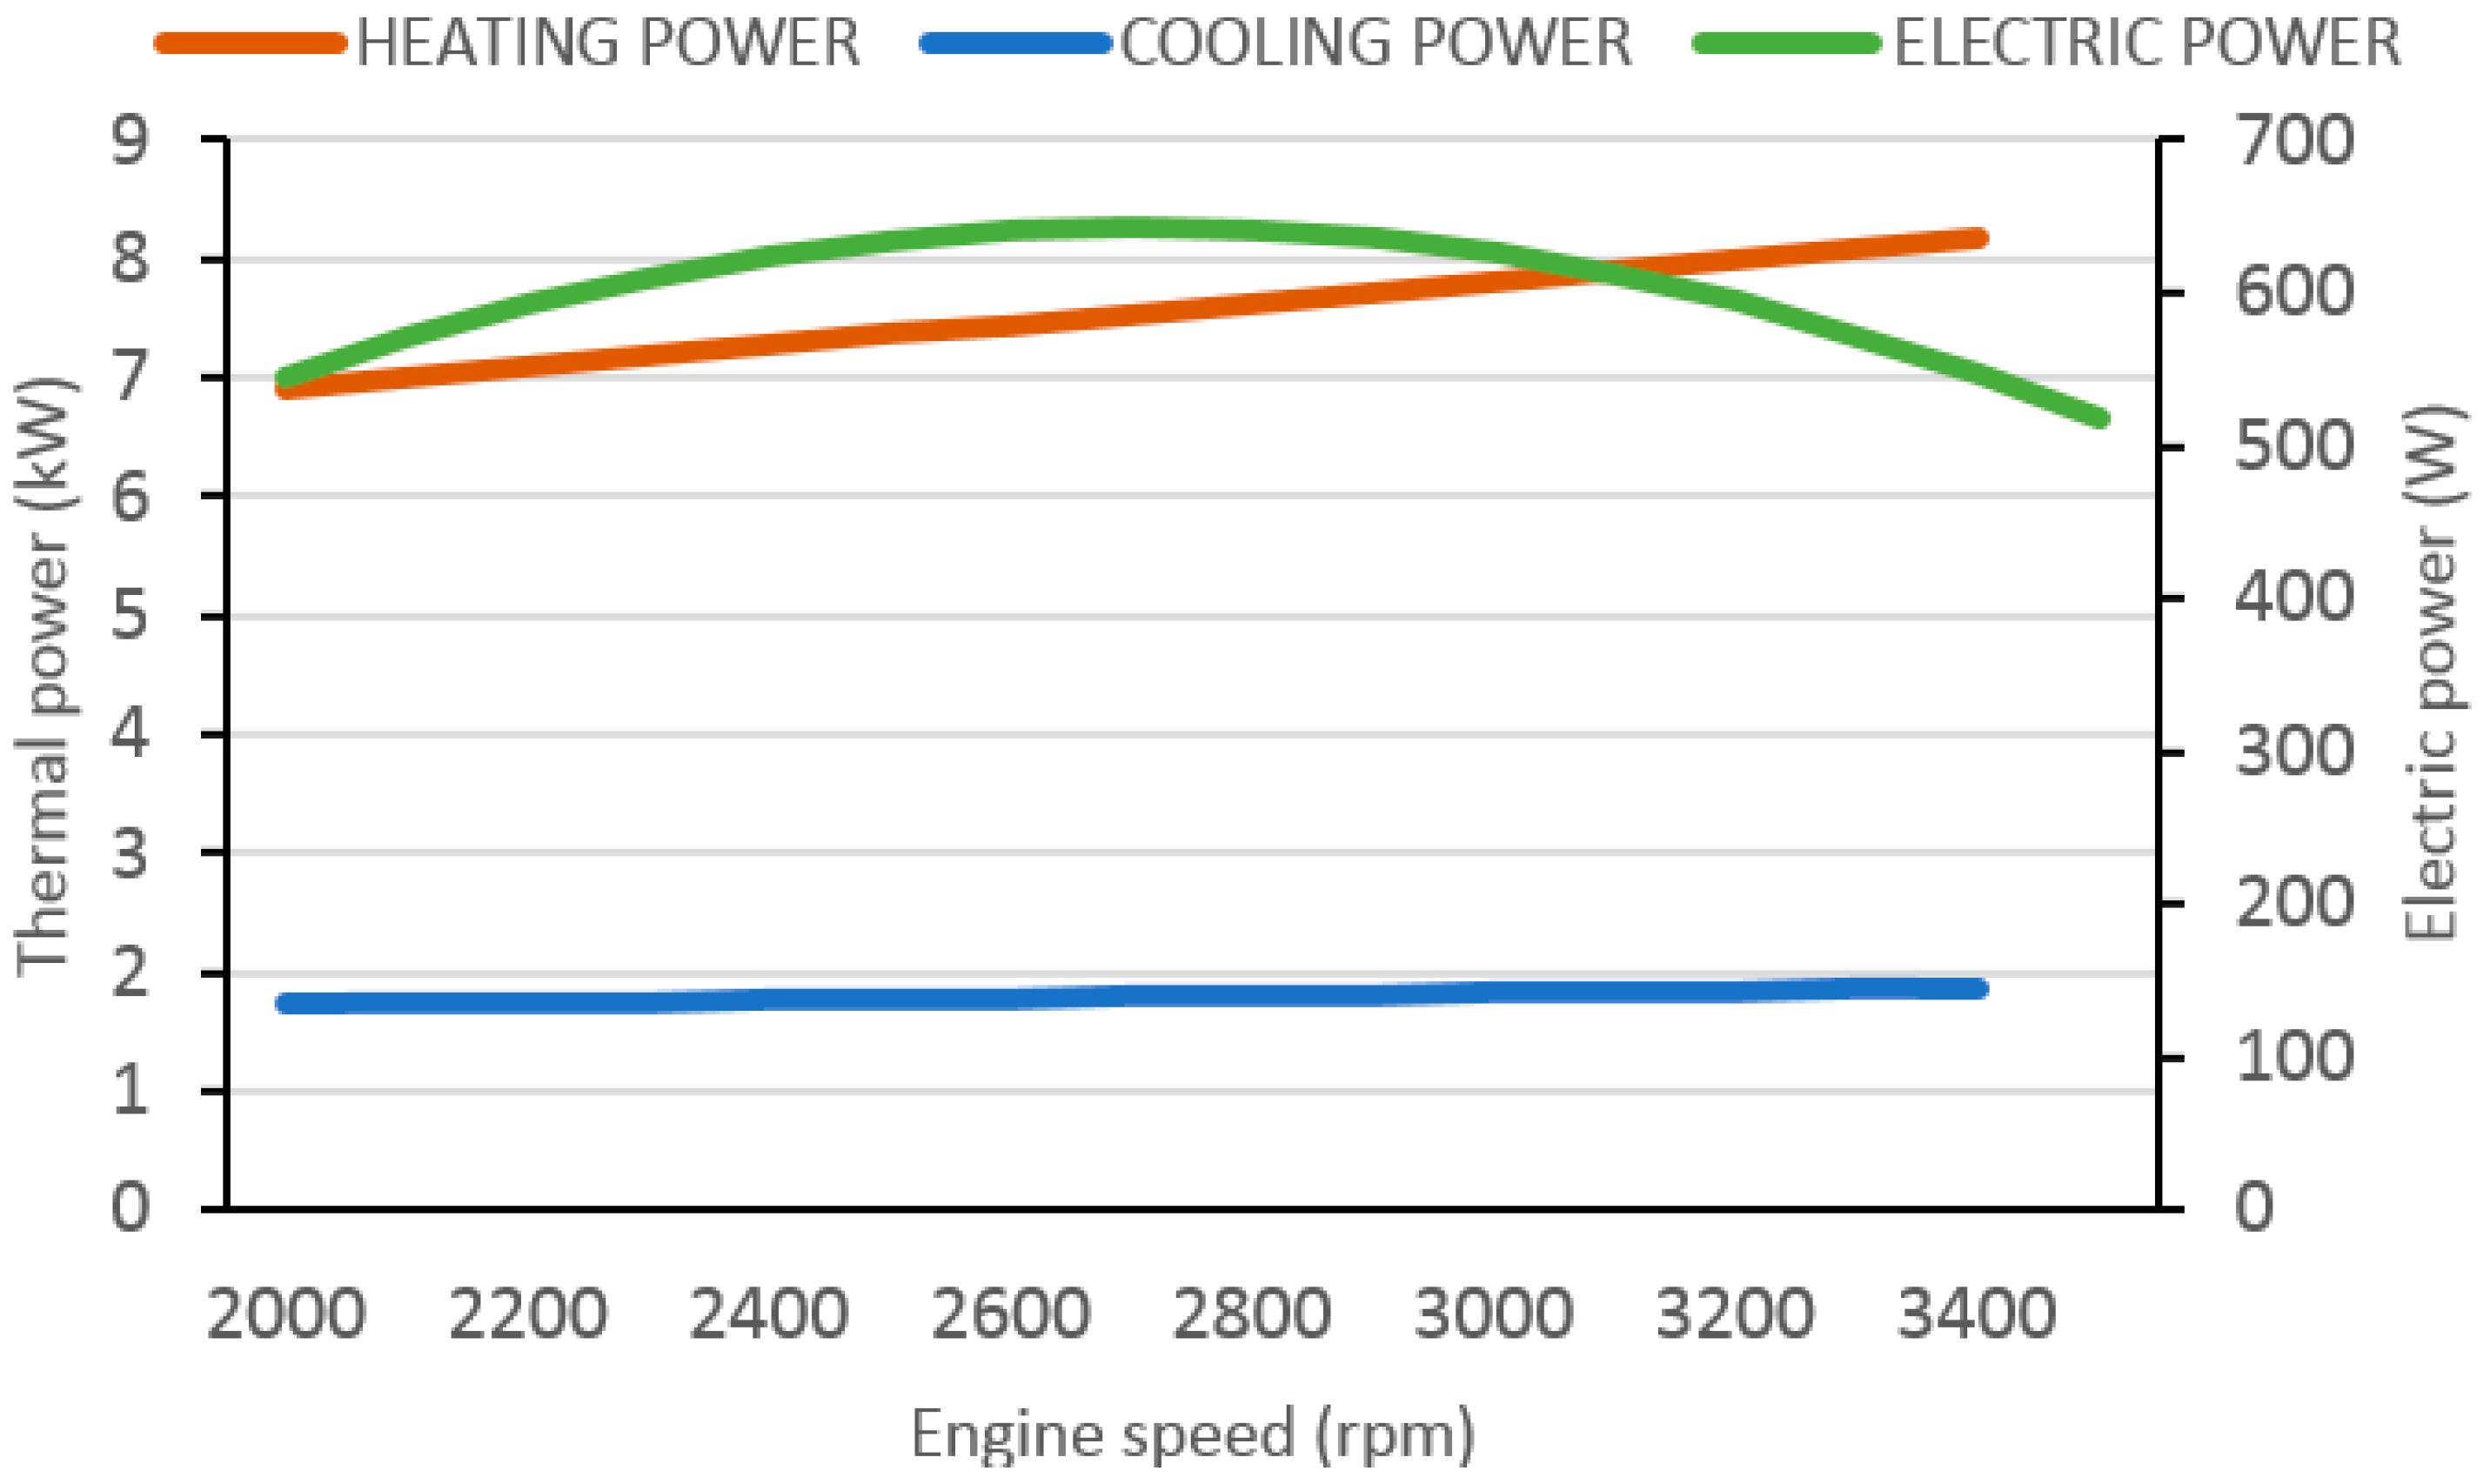
2.2. Micro-CCHP System Description and Performance

The main parts of the trigeneration plant are: an ICE as prime mover, an alternator, an inverter, a water storage tank with two heat exchangers and a heat pump with reversible operation.
The heat pump incorporates one plate heat exchanger, two fancoils, two expansion valves, and a compressor. Figure 6 shows a scheme of the micro-CCHP system and the main connections between elements. Temperature sensors and flow meters locations are also included in the schema.
The system can supply variable demand by changing engine speed. This strategy is very useful when the heat pump is attending heating or cooling demands.
Every single component has been simulated in TRNSYS to validate and predict their behavior. Finally, it has been modeled to act as a unique set. The system starts and stops depending on heating/cooling load and/or DHW demand.
Electrical system is designed to convert mechanical energy produced by the prime mover into electricity, which can be stored in batteries and used when required. The electrical system’s main components are the alternator, regulator, inverter, and battery bank.
Testing and modeling of the micro-CCHP unit were presented in a previous work [37]. Obtained experimental data reveal a maximum electrical efficiency of 7.63%. Cooling and heating maximum powers are 1.86 kW and 8.17 kW respectively, obtained with an engine speed of 3500 rpm. Mean heating and cooling efficiencies are 89% and 21% respectively. Figure 7 shows the schematic evolution of thermal and electrical power when changing engine speed.

2.3. TRNSYS Simulation

Micro-CCHP system has been modeled in the TRNSYS (v17.01.0025), transient system simulation tool, according to working conditions described in previous sections. Particularly, typical thermal loads (DHW, heating and cooling) and electric loads are considered for this research.
The system has been split into five blocks, modeled independently and properly connected (storage tank, cooling circuit, prime mover, electrical circuit, and heat pump). This model has been validated in a previous work [37]. The dwelling has been modeled using TRNSYS extension TRNBUILD. Figure 8 shows the general layout of the simulation.
The methodology followed to compare suitability of the micro-CCHP system in the different climatic zones is as follows. First of all, thermal loads of the dwelling were calculated for the different locations. Monthly and annual heating and cooling demands were determined. Following, micro-CCHP model is applied to calculate heating and cooling production necessary to attend thermal demand. The model returns monthly and annual thermal production, besides the electrical production. The system prioritizes and is always capable of satisfying DHW demand, supplied through engine cooling circuit, independently of heating and cooling power provided by the heat pump.

3. Results

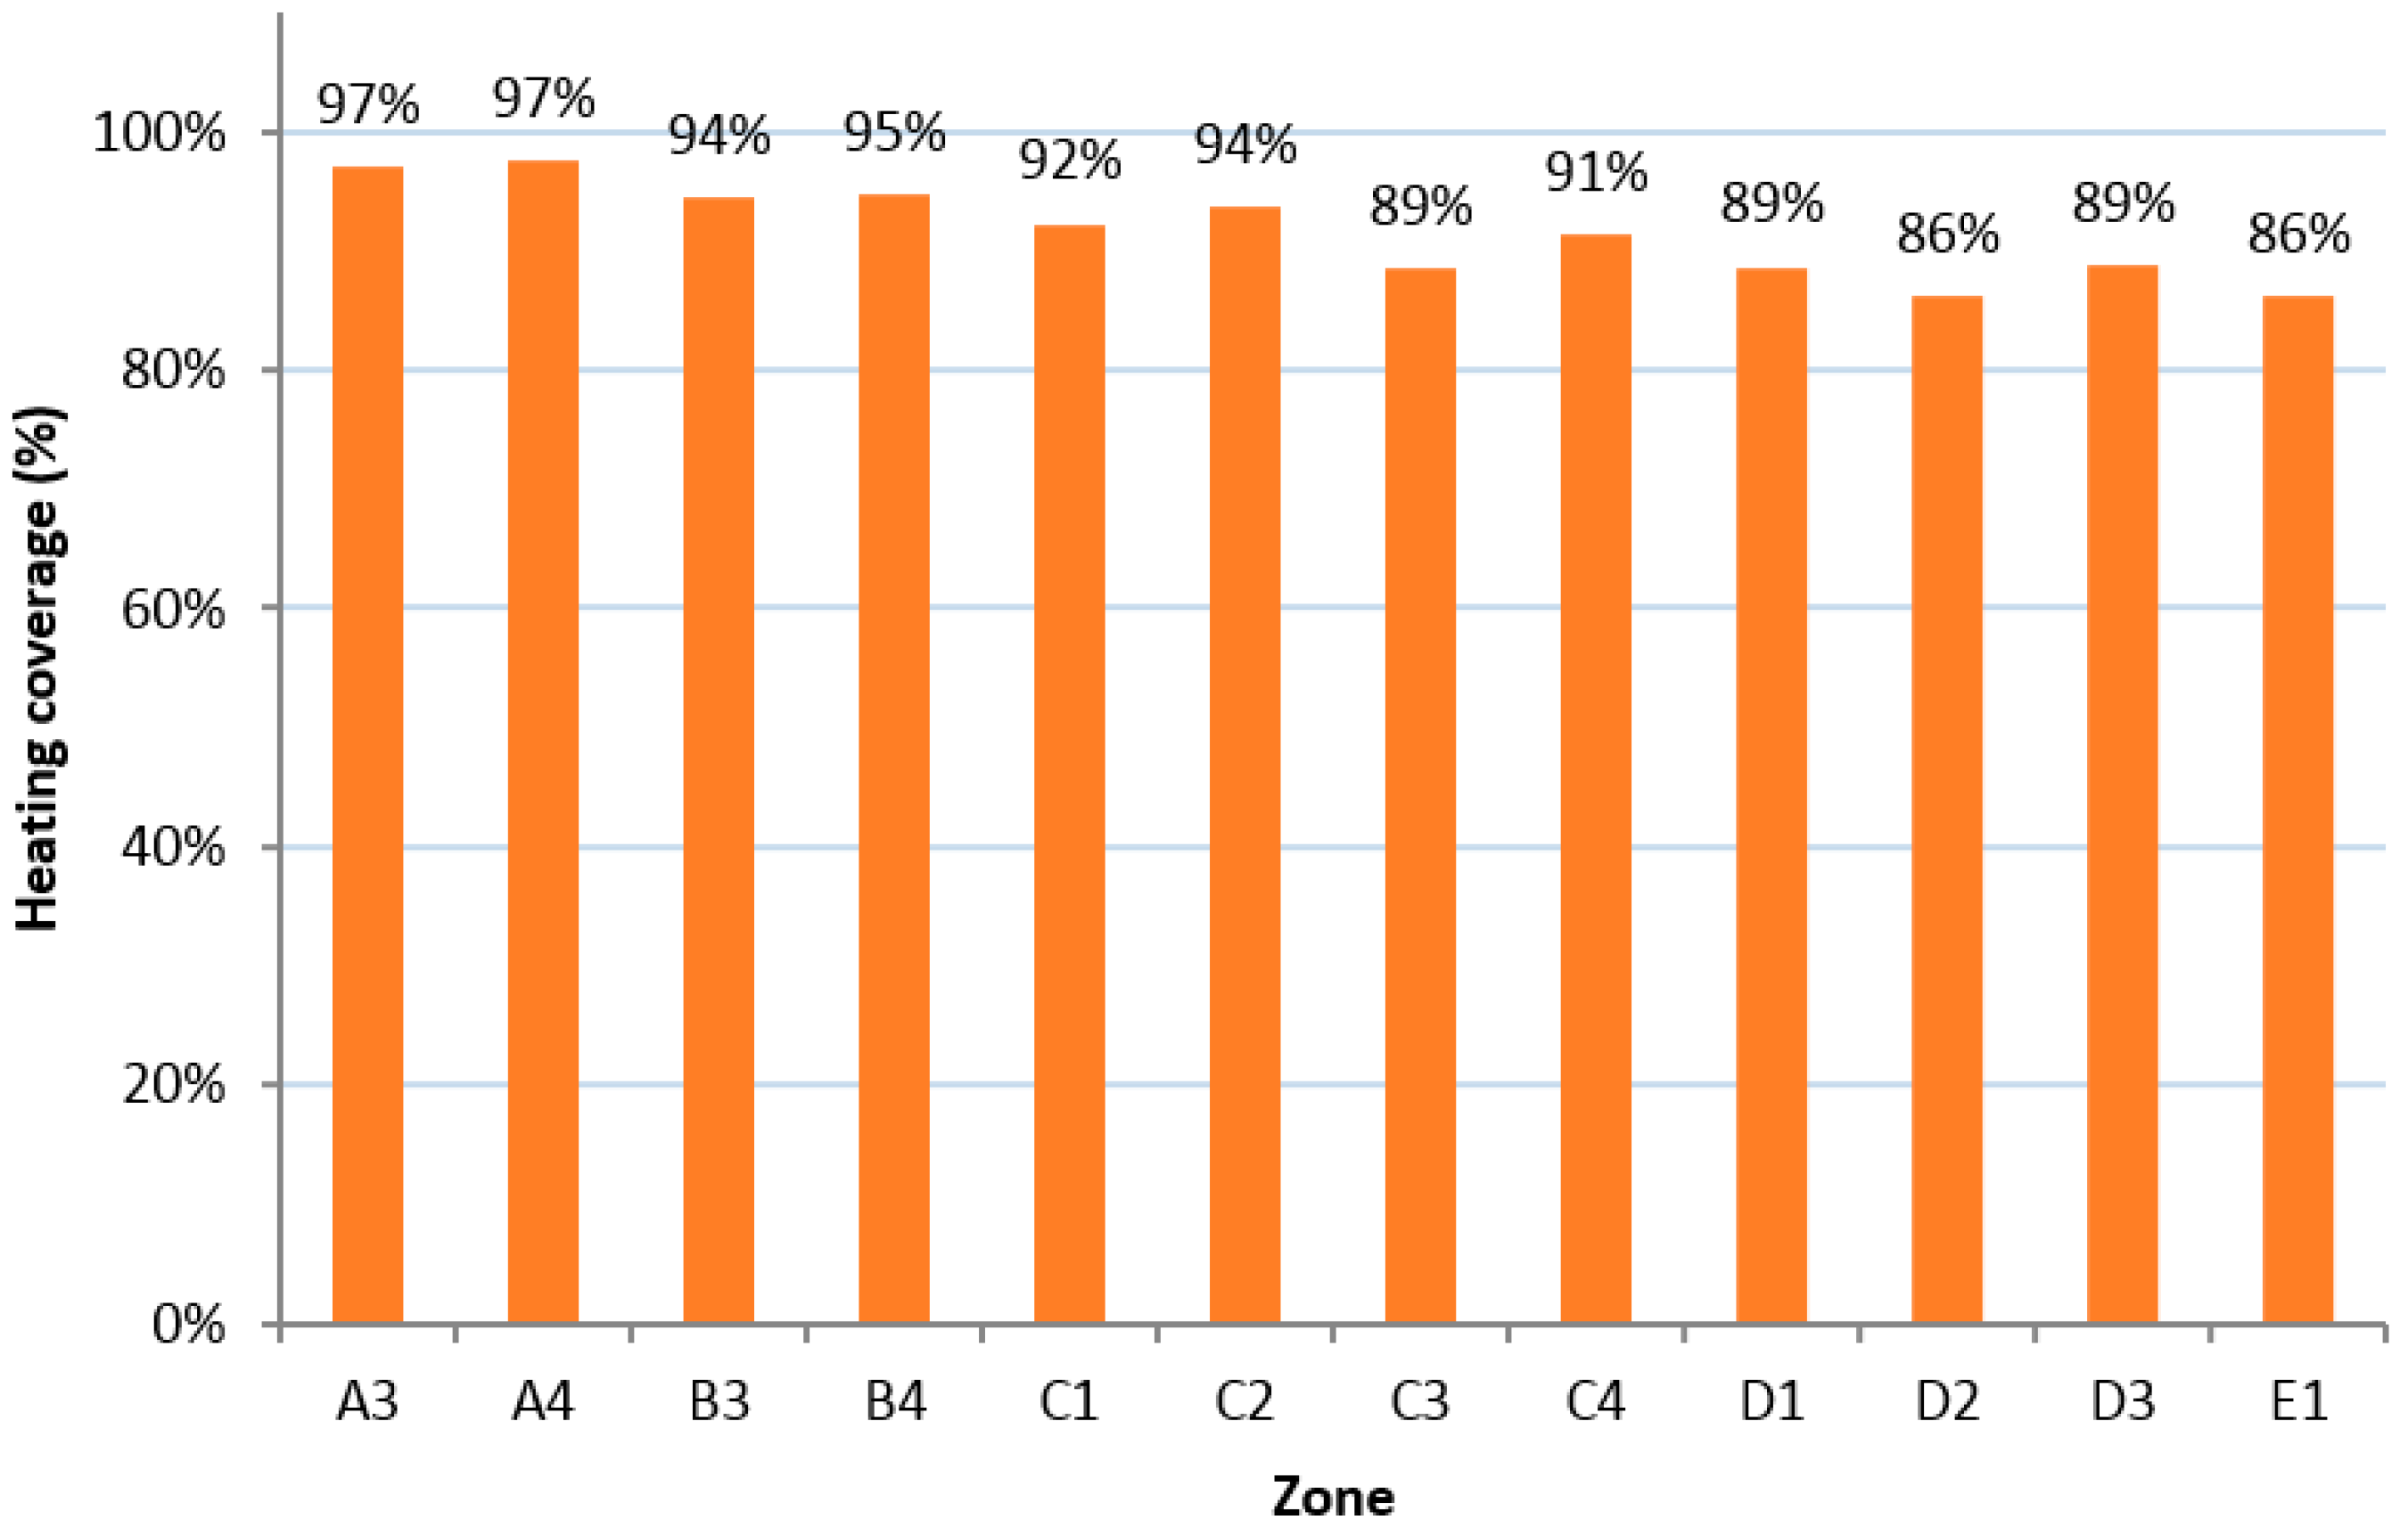
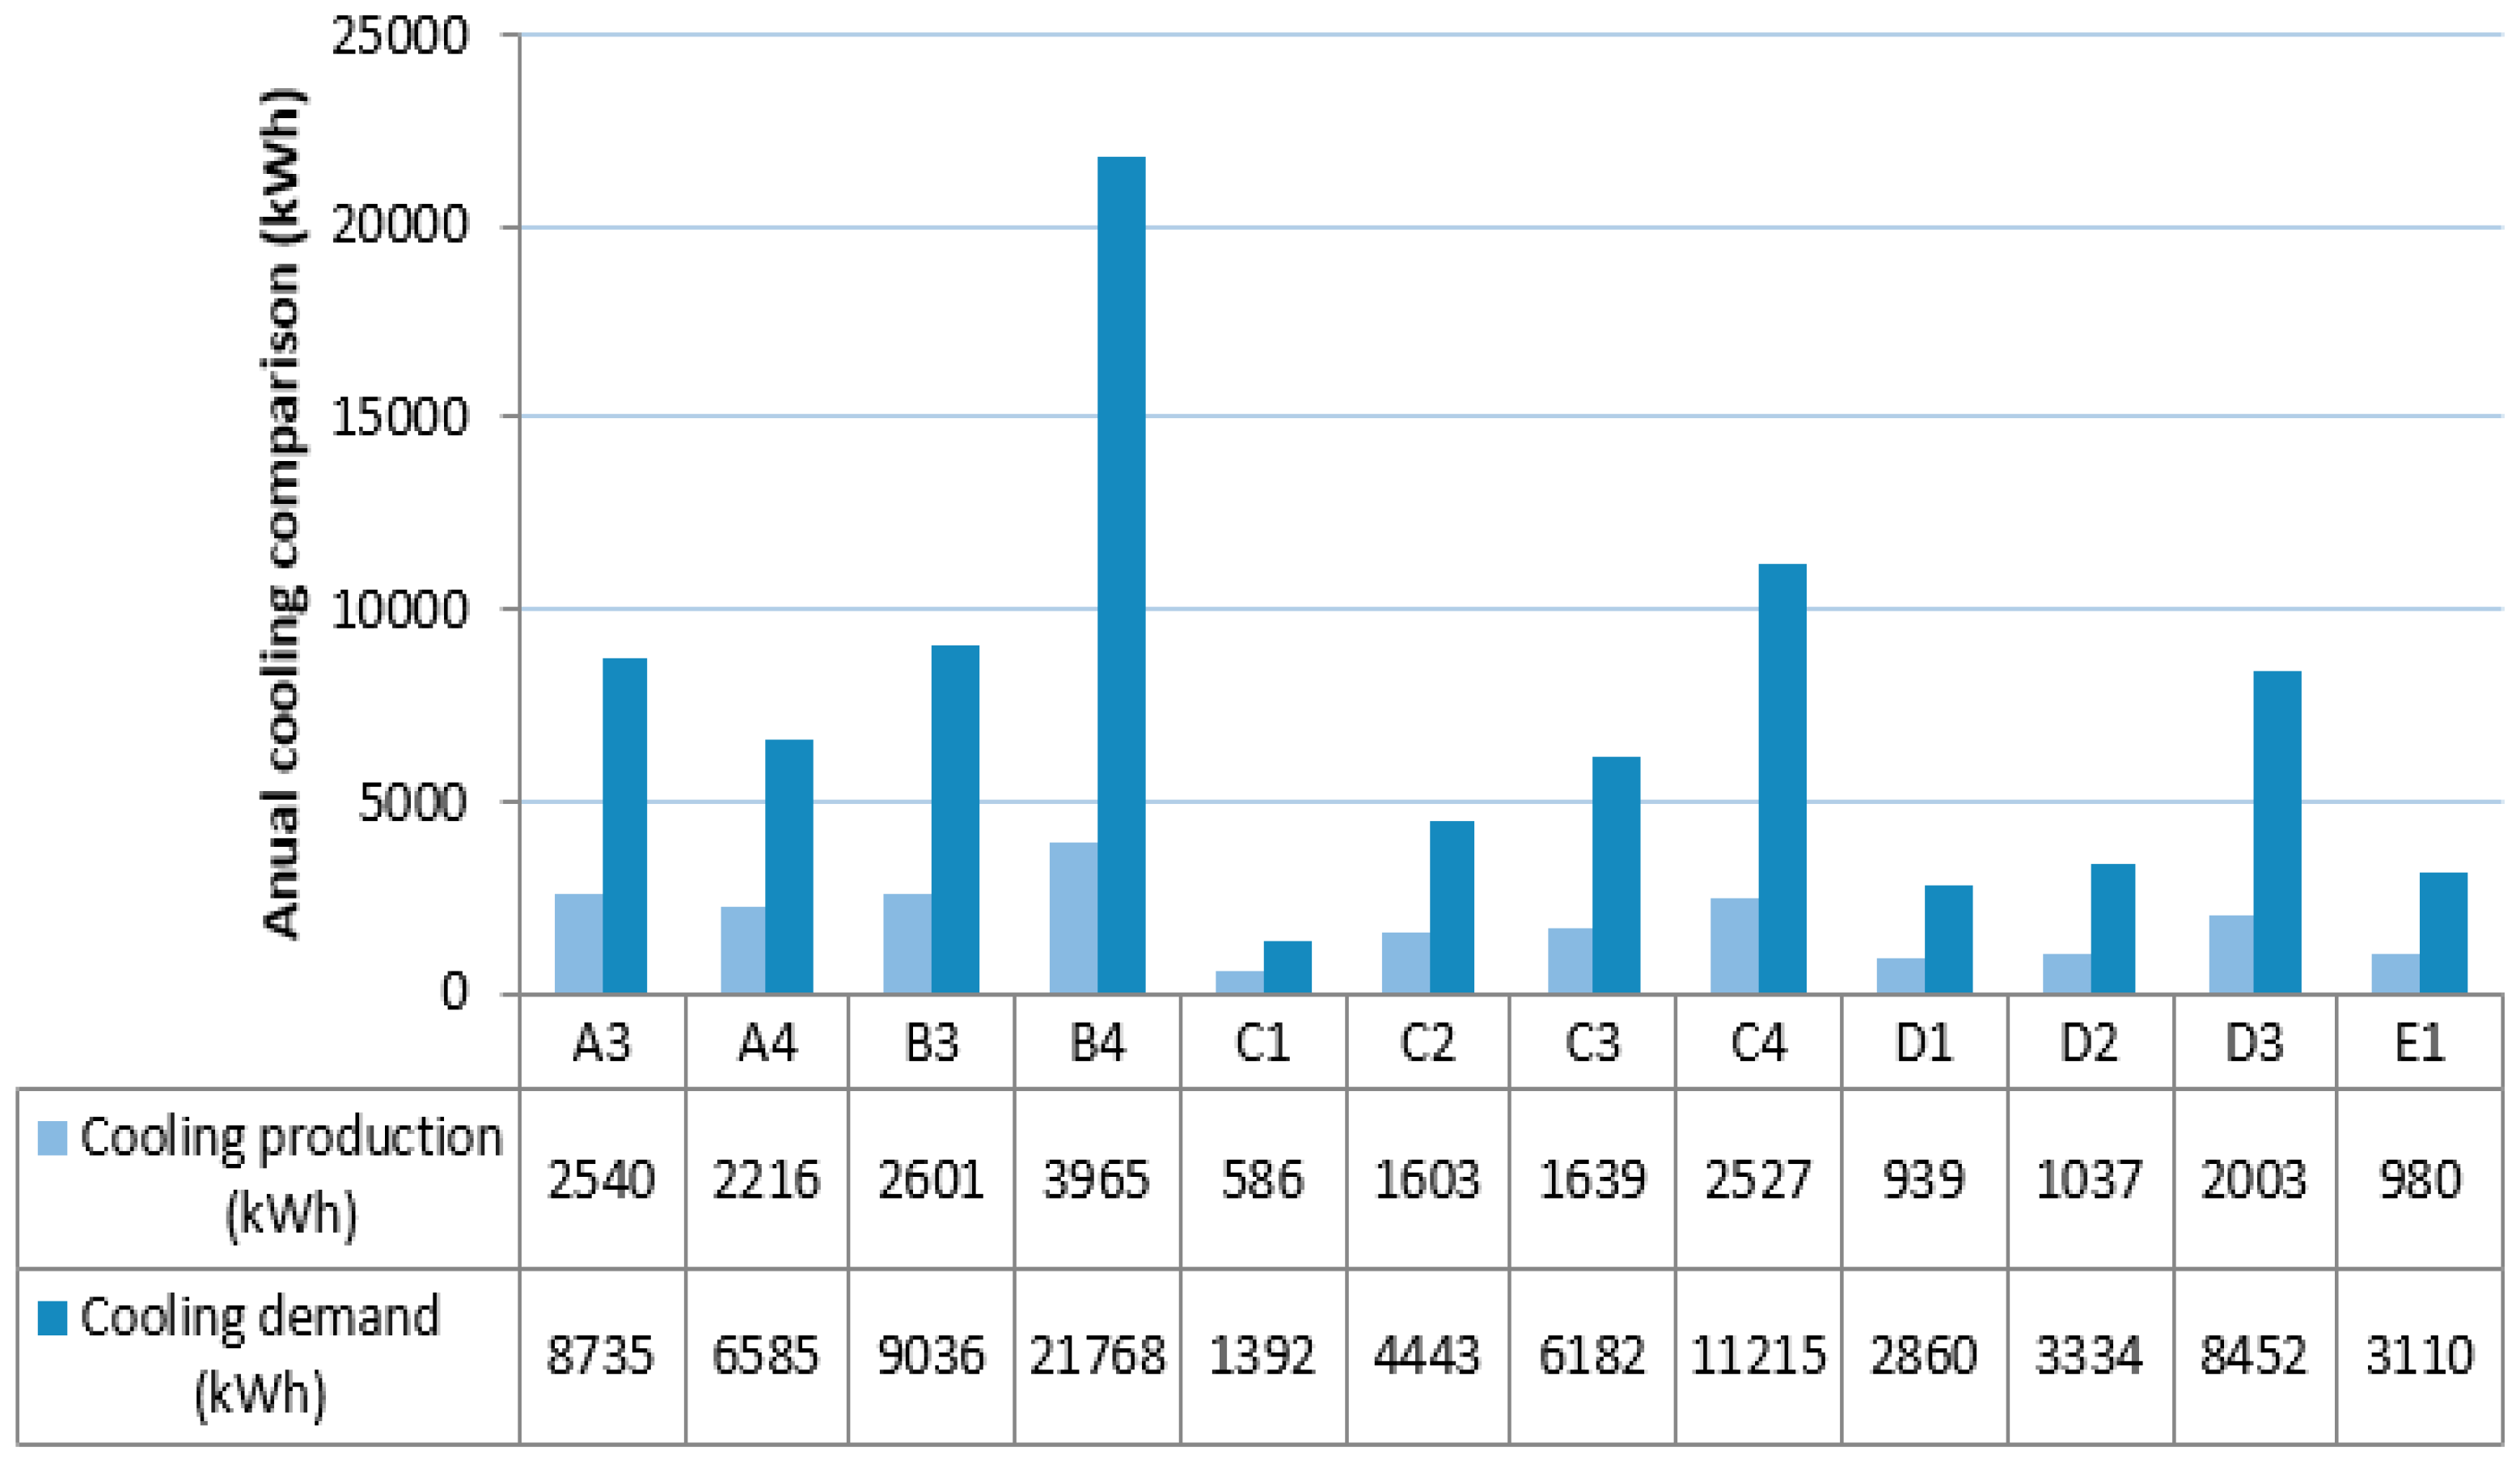
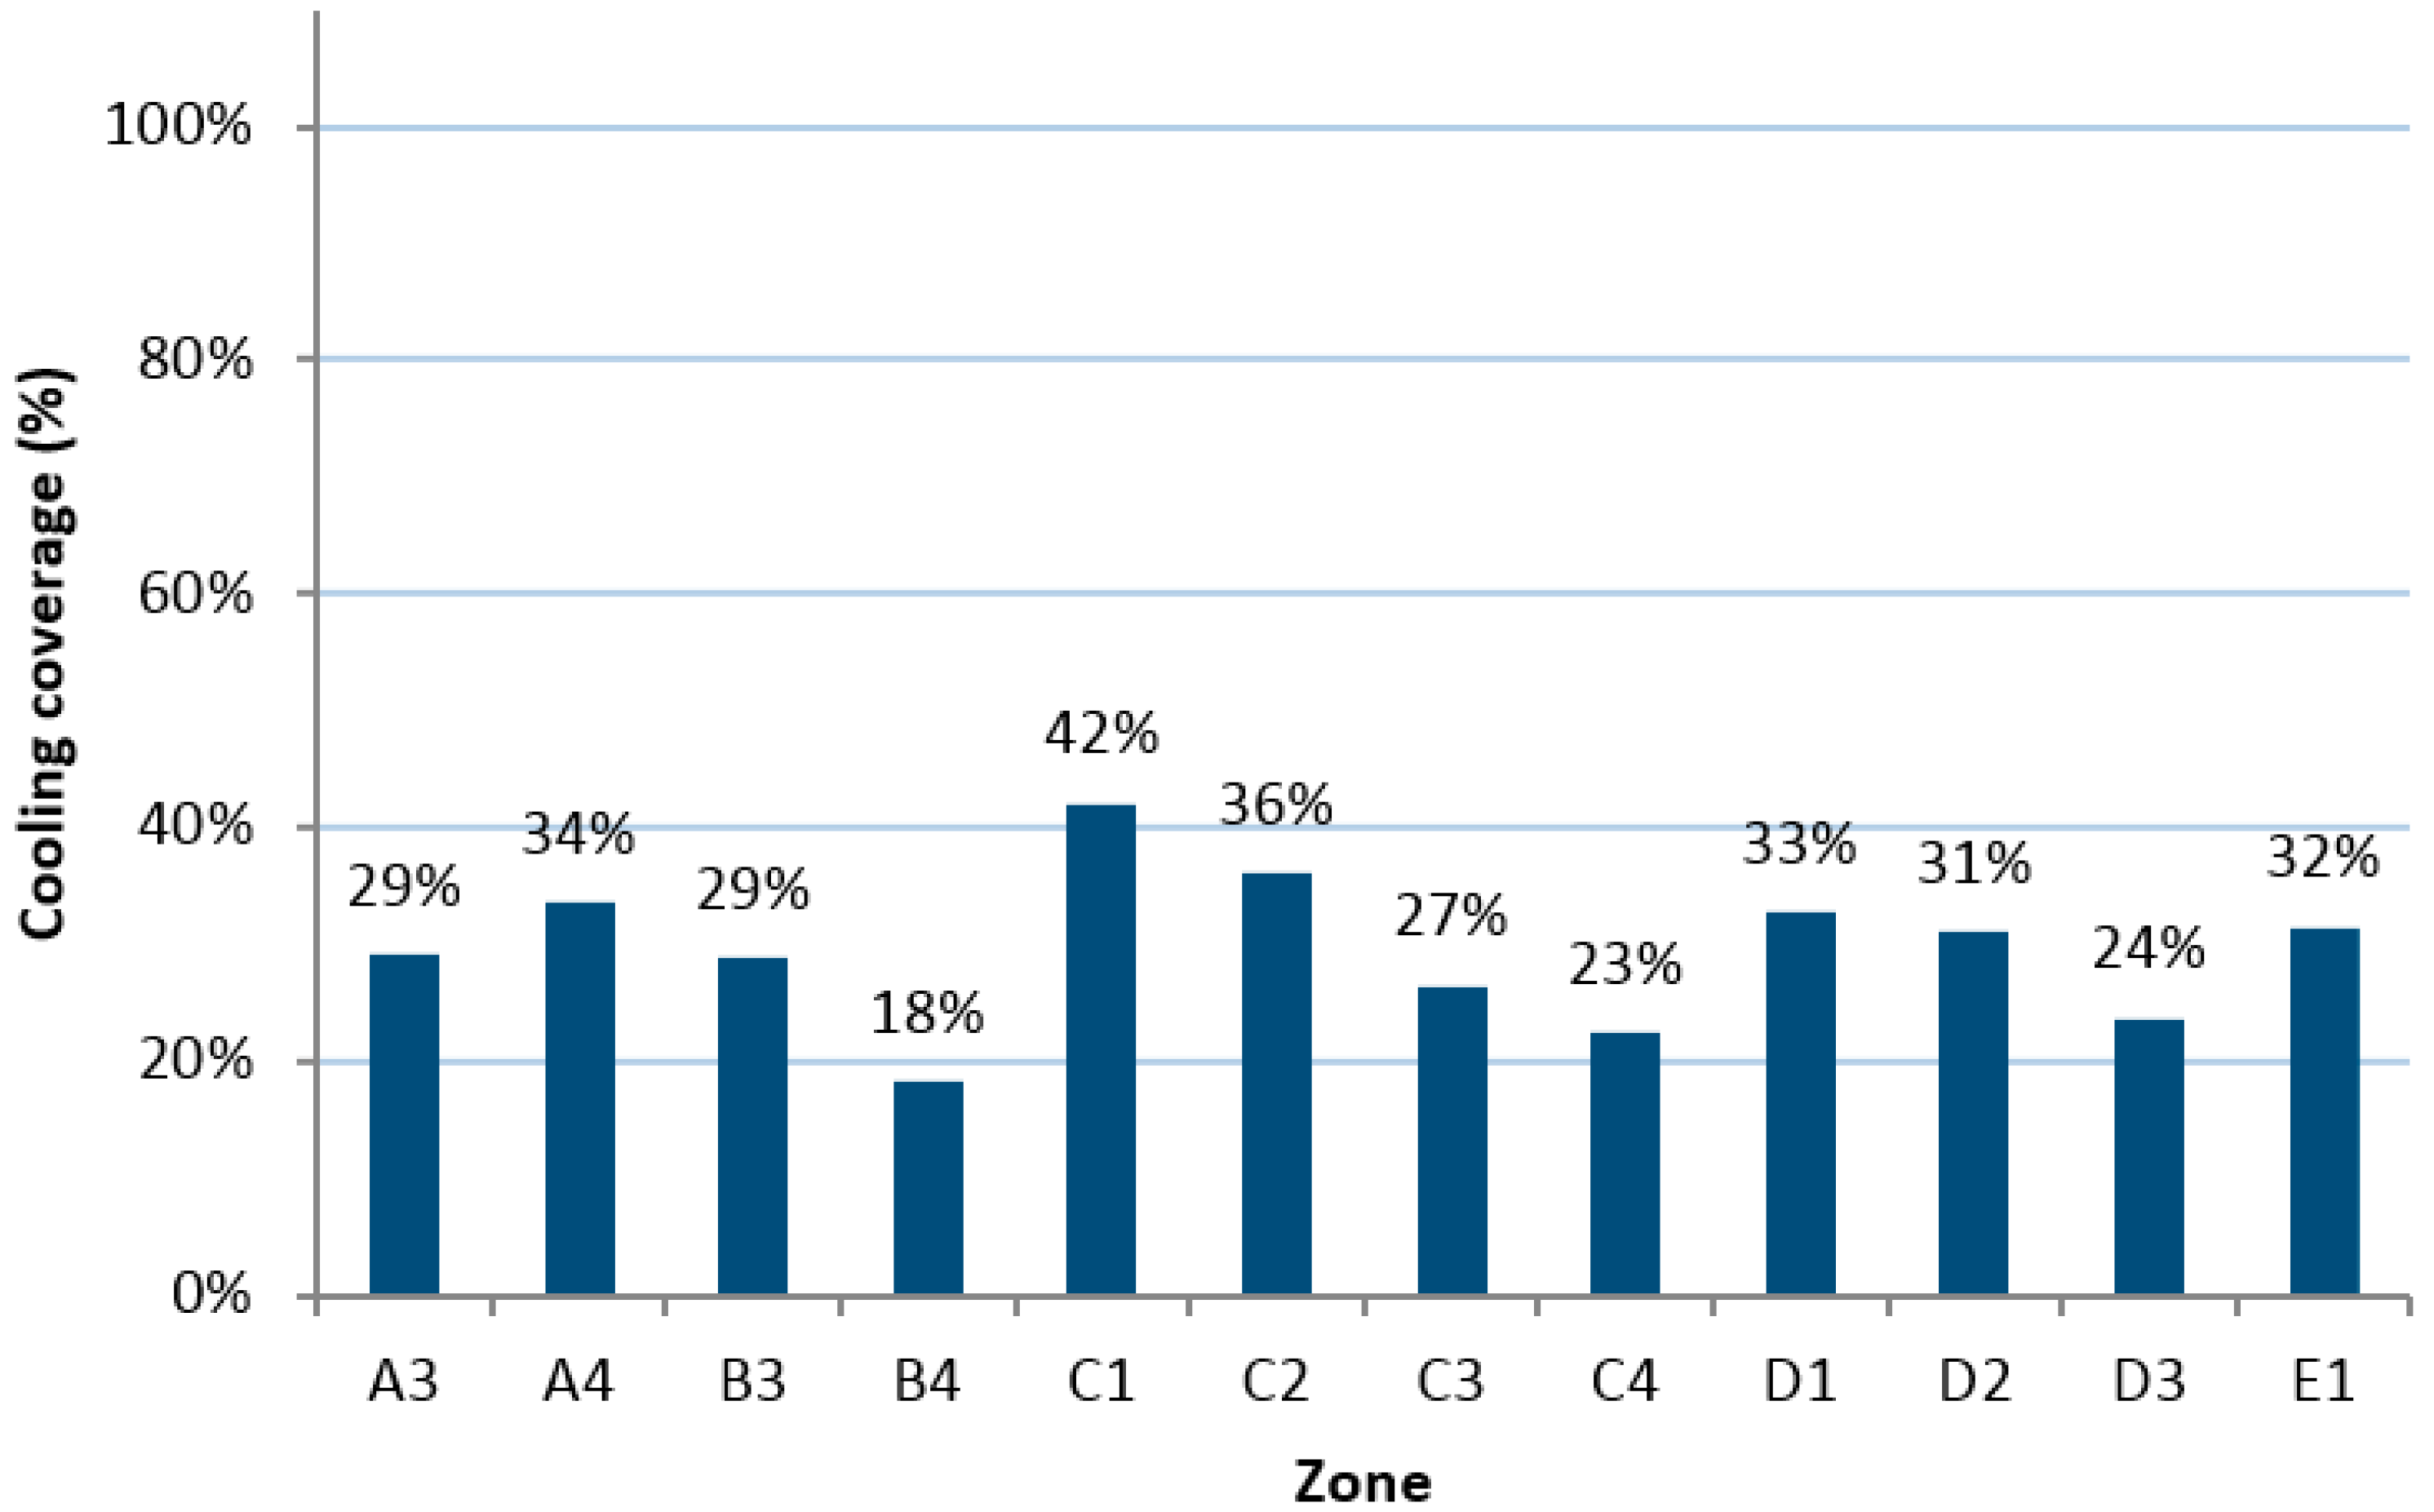
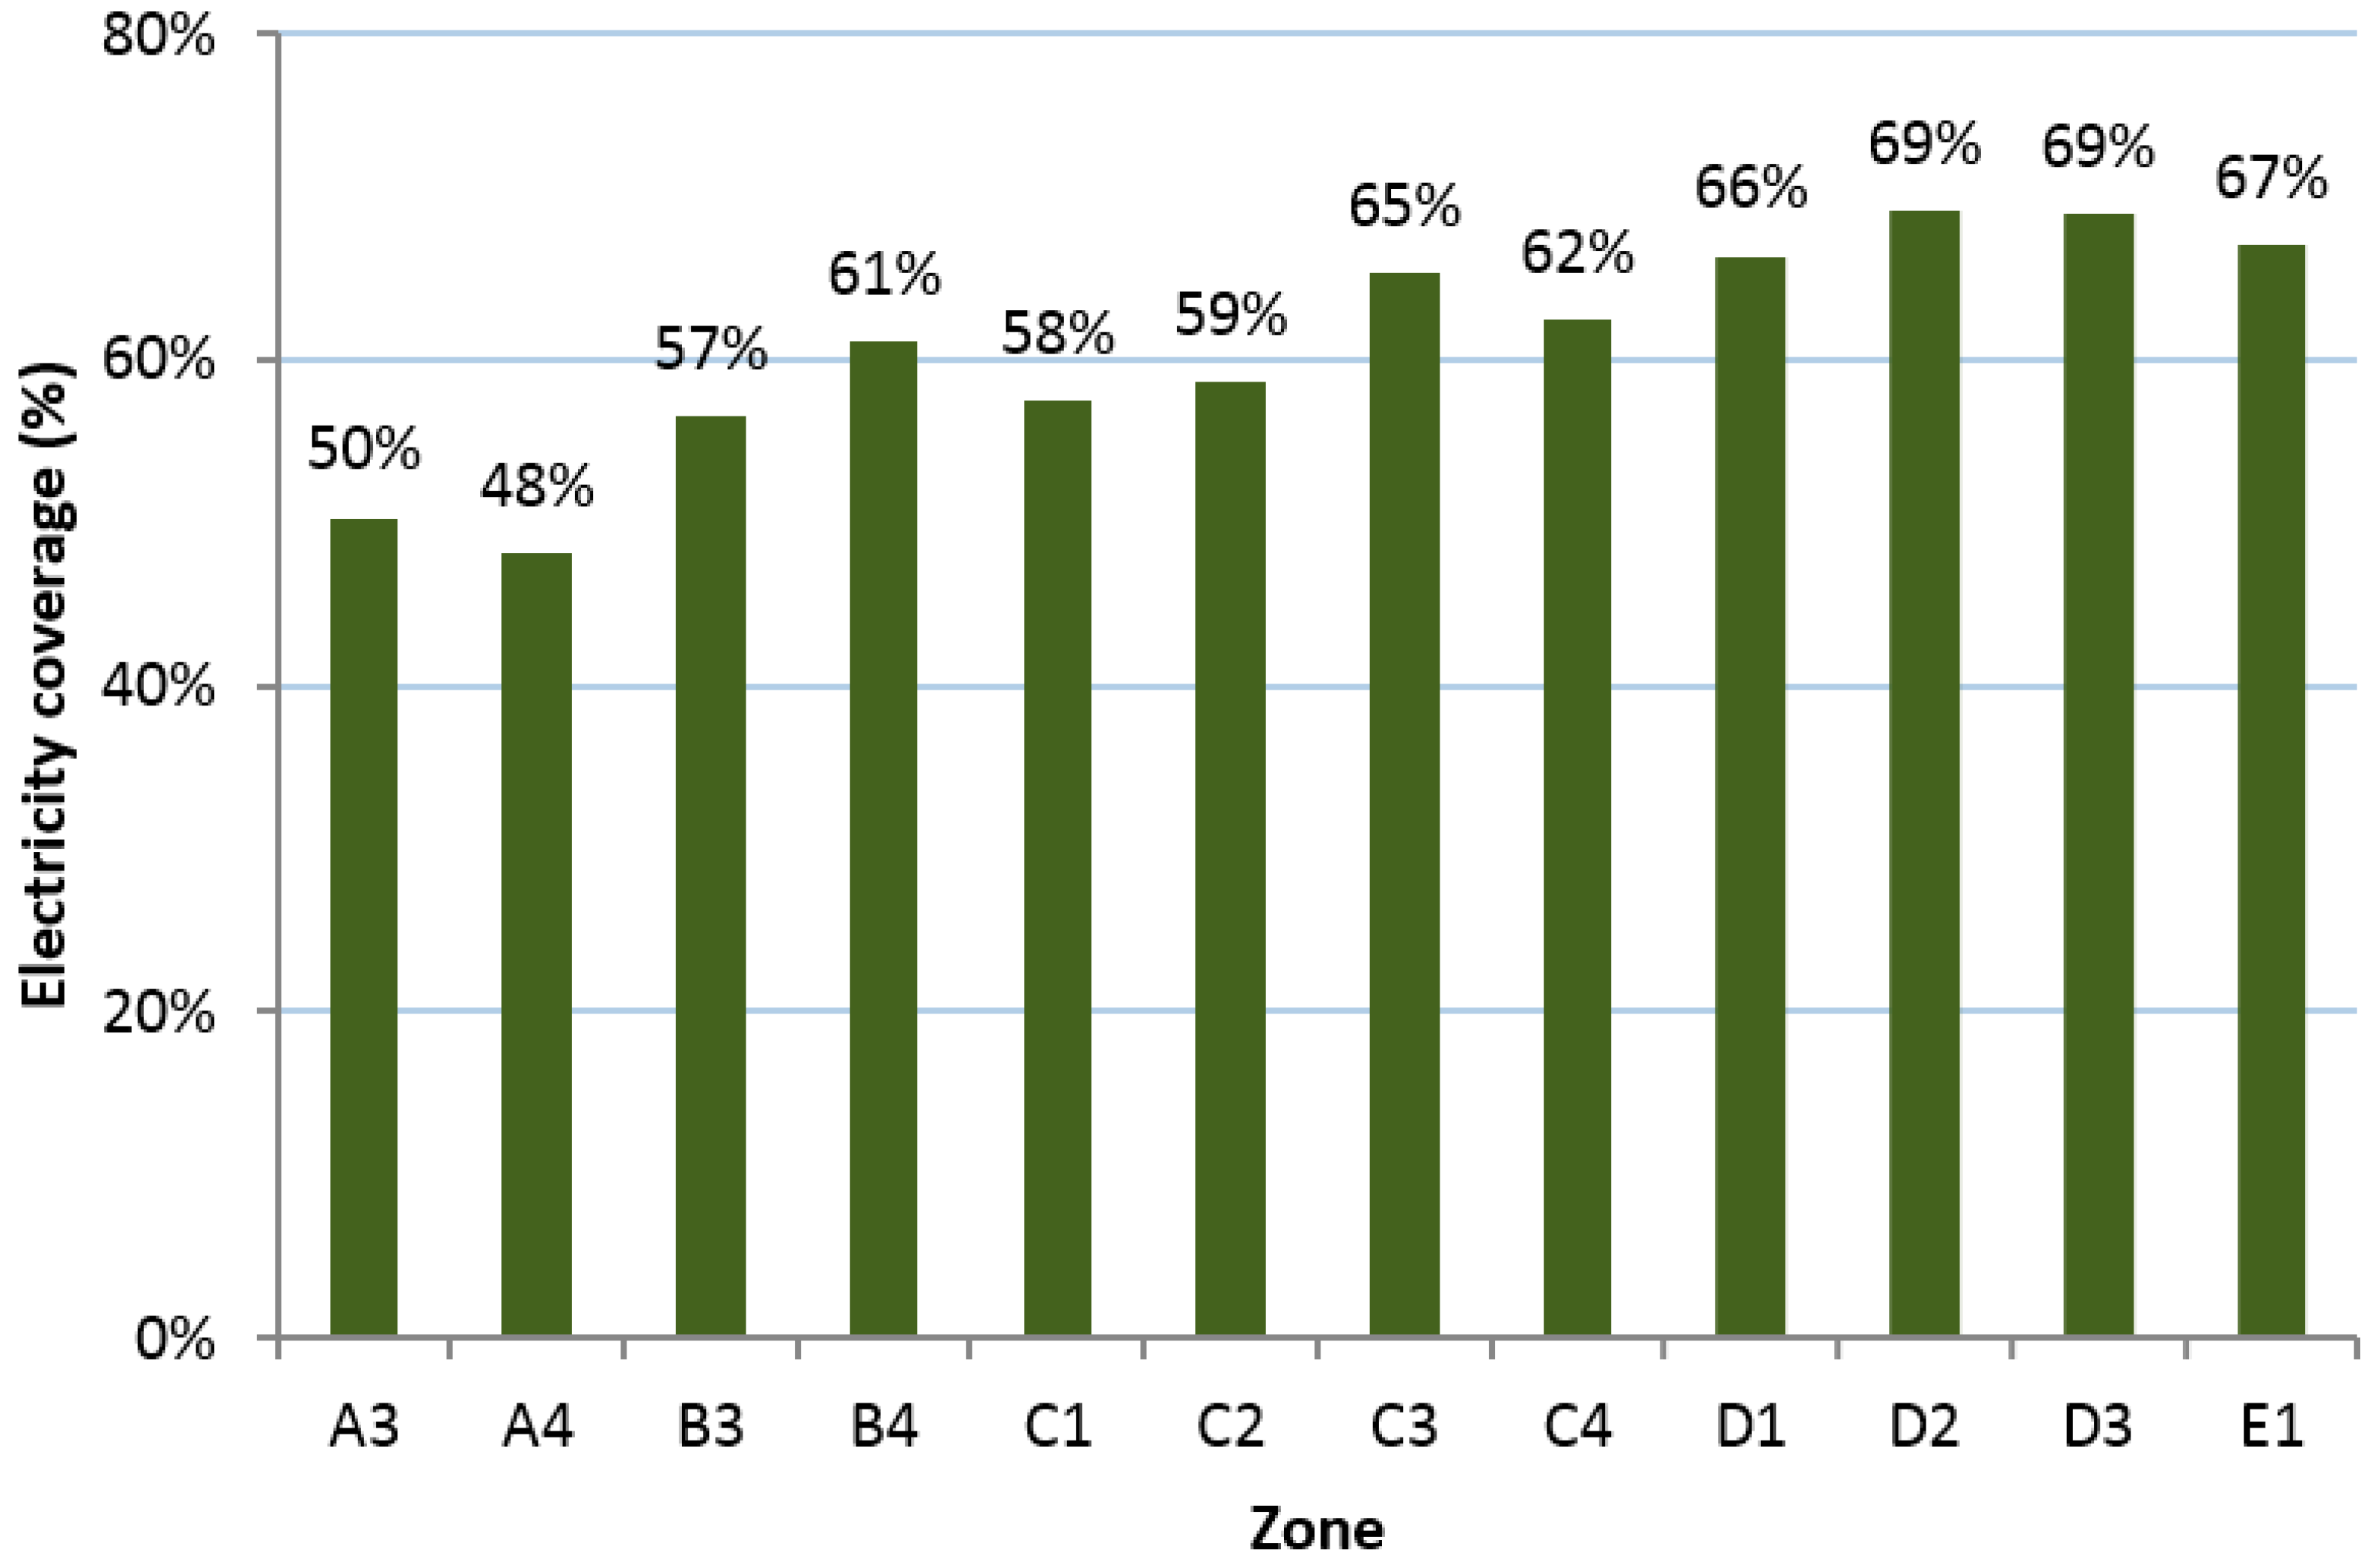
Heating and Cooling Demand and Production

Heating demand and production obtained for the different locations under study are shown in Figure 9. Heating load increases when moving from zone A to E. The highest heating demand corresponds to climate zone D2, with an annual demand of 30,224 kWh. This is also the zone where the highest production is achieved, reaching 26,045 kWh. The least demanding zone, as expected, is A3, with 6373 kWh, with a heating production close to 6184 kWh.
Figure 10 shows heating coverage for the different zones. Coverage is quite high in all the zones, achieving a mean value of 92%. Coverage drops off in extreme weather zones, due to high demand peaks in cool seasons. Regardless, minimum coverage is an acceptable 86%.
Something similar happens to cooling demand; it increases going from zone 1 to 4, as expected. Figure 11 shows annual cooling demand versus production. Among all zones being studied, B4 is the highest because it is a Spanish climatic zone with a very extreme weather in the warm season.
Figure 12 shows cooling coverage for the micro-CCHP system in the different zones. Maximum coverage is in the C1 zone as its cooling demand is very low. The selected dwelling has a large glazed façade, which makes the cooling demand in summer increase compared to other conventional houses. This issue must be taken into account when analyzing cooling coverages. Mild summer weather zones like 1 and 2 are, comparatively, where the micro-CCHP best fits the cooling requirements. These are also zones with a low irradiation.
Electrical coverage is also studied for each climatic zone. Electric demand is the same for all the zones, and equal to 4560 kWh as previously mentioned. Figure 12 shows the electrical coverage of the micro-CCHP system in the different zones. Zones with better coverage are those with a more intensive use of the system, which does not imply that thermal coverage is good, i.e., electrical coverage is the highest in the D3 zone, but it is only the third with worse cooling and heating coverage. The C1 and C2 mild weather zones have an electrical coverage of 58% and 59% respectively, which make them very interesting zones to be considered for micro-CHP system suitability.
Finally, operating time is compared for the different zones. As can be observed comparing Figure 13 and Figure 14, operating time is proportional to electrical coverage and production. The C1 and C2 zones, highlighted by their thermal performance, have an adequate operating time (around 50%).

4. Conclusions

Once the micro-CCHP system was modeled with experimental data and validated, it was dynamically simulated to analyze its performance in different climatic zones defined in the Spanish CTE. This study reveals that the system is suitable to operate in mild weather zones, like C1 and C2, but not in zones with extreme cooling demands. It was also found from in this study that these zones have an acceptable operating time, around 50%. Heating coverage is high in all the zones and cooling coverage is acceptable in mild weather zones (C1, C2), considering that the detached house has a highly glazed façade.
Micro-CCHP system is suitable in mild weather during the summer season. In order to maximize its potential, it would be interesting to apply the proposed methodology in more northern climates to complement other studies like those by Deutscher Kältetechnik Verein [38]. There is a long tradition in the use of cogeneration systems in the countries of northern Europe, so now that the methodology for assessing the suitability of the micro-CCHP system has been established in this work, it is relatively simple to perform a similar study for various European locations.

Acknowledgments

This project has been supported by funding from the Center for Industrial Technological Development (CDTI) through Interconnecta program (grant number: IDI-20111660), Ministry of Economy and Competitiveness of Spain.

Author Contributions

All authors contributed to this work.

Conflicts of Interest

The authors declare no conflict of interest.

References

  1. Chesi, A.; Ferrara, G.; Ferrari, L.; Magnani, S.; Tarani, F. Influence of the heat storage size on the plant performance in a smart user case study. Appl. Energy 2013, 112, 1454–1465. [Google Scholar] [CrossRef]
  2. Barbieri, E.S.; Melino, F.; Morini, M. Influence of the thermal energy storage on the profitability of micro-CHP systems for residential building applications. Appl. Energy 2012, 97, 714–722. [Google Scholar] [CrossRef]
  3. Monteiro, E.; Moreira, N.A.; Ferreira, S. Planning of micro-combined heat and power systems in the Portuguese scenario. Appl. Energy 2009, 86, 290–298. [Google Scholar] [CrossRef]
  4. Campos Celador, A.; Erkoreka, A.; Martin Escudero, K.; Sala, J. Feasibility of small-scale gas engine-based residential cogeneration in Spain. Energy Policy 2011, 39, 3813–3821. [Google Scholar] [CrossRef]
  5. Wu, D.; Wang, R. Combined cooling, heating and power: A review. Prog. Energy Combust. Sci. 2006, 32, 459–495. [Google Scholar] [CrossRef]
  6. Cho, H.; Smith, A.D.; Mago, P. Combined cooling, heating and power: A review of performance improvement and optimization. Appl. Energy 2014, 136, 168–185. [Google Scholar] [CrossRef]
  7. Mıguez, J.; Murillo, S.; Porteiro, J.; López, L. Feasibility of a new domestic CHP trigeneration with heat pump: I. Design and development. Appl. Therm. Eng. 2004, 24, 1409–1419. [Google Scholar] [CrossRef]
  8. Porteiro, J.; Mıguez, J.; Murillo, S.; López, L. Feasibility of a new domestic CHP trigeneration with heat pump: II. Availability analysis. Appl. Therm. Eng. 2004, 24, 1421–1429. [Google Scholar] [CrossRef]
  9. Jradi, M.; Riffat, S. Tri-generation systems: Energy policies, prime movers, cooling technologies, configurations and operation strategies. Renew. Sustain. Energy Rev. 2014, 32, 396–415. [Google Scholar] [CrossRef]
  10. Chen, X.; Gong, G.; Wan, Z.; Luo, L.; Wan, J. Performance analysis of 5 kW PEMFC-based residential micro-CCHP with absorption chiller. Int. J. Hydrog. Energy 2015, 40, 10647–10657. [Google Scholar] [CrossRef]
  11. Wu, J.; Wang, J.; Li, S.; Wang, R. Experimental and simulative investigation of a micro-CCHP (micro combined cooling, heating and power) system with thermal management controller. Energy 2014, 68, 444–453. [Google Scholar] [CrossRef]
  12. Horvath, C.; Hwang, Y.; Radermacher, R.; Gerstler, W.; Tang, C. Waste heat and electrically driven hybrid cooling systems for a high ambient temperature, off-grid application. Energy 2014, 66, 711–721. [Google Scholar] [CrossRef]
  13. Klein, S.A.; Beckman, W.A.; Mitchell, J.W.; Duffie, J.A.; Duffie, N.A.; Freeman, T.L.; Mitchell, J.C.; Braun, J.E.; Evans, B.L.; Kummer, J.P.; et al. TRNSYS 16–A TRaNsient System Simulation Program, User Manual; Solar Energy Laboratory, University of Wisconsin-Madison: Madison, WI, USA, 2004. [Google Scholar]
  14. Mago, P.; Chamra, L.; Ramsay, J. Micro-combined cooling, heating and power systems hybrid electric-thermal load following operation. Appl. Therm. Eng. 2010, 30, 800–806. [Google Scholar] [CrossRef]
  15. Han, G.; You, S.; Ye, T.; Sun, P.; Zhang, H. Analysis of combined cooling, heating, and power systems under a compromised electric–thermal load strategy. Energy Build. 2014, 84, 586–594. [Google Scholar] [CrossRef]
  16. Zheng, C.; Wu, J.; Zhai, X. A novel operation strategy for CCHP systems based on minimum distance. Appl. Energy 2014, 128, 325–335. [Google Scholar] [CrossRef]
  17. Li, L.; Mu, H.; Li, N.; Li, M. Analysis of the integrated performance and redundant energy of CCHP systems under different operation strategies. Energy Build. 2015, 99, 231–242. [Google Scholar] [CrossRef]
  18. Wang, J.; Jing, Y.; Zhang, C.; Zhai, Z.J. Performance comparison of combined cooling heating and power system in different operation modes. Appl. Energy 2011, 88, 4621–4631. [Google Scholar] [CrossRef]
  19. Mago, P.J.; Hueffed, A.K. Evaluation of a turbine driven CCHP system for large office buildings under different operating strategies. Energy Build. 2010, 42, 1628–1636. [Google Scholar] [CrossRef]
  20. Askari, I.B.; Sadegh, M.O.; Ameri, M. Effect of heat storage and fuel price on energy management and economics of micro CCHP cogeneration systems. J. Mech. Sci. Technol. 2014, 28, 2003–2014. [Google Scholar] [CrossRef]
  21. Wang, J.; Wu, J.; Zheng, C. Simulation and evaluation of a CCHP system with exhaust gas deep-recovery and thermoelectric generator. Energy Convers. Manag. 2014, 86, 992–1000. [Google Scholar] [CrossRef]
  22. Ulloa, C.; Porteiro, J.; Eguía, P.; Pousada-Carballo, J.M. Application model for a stirling engine micro-generation system in caravans in different European locations. Energies 2013, 6, 717–732. [Google Scholar] [CrossRef]
  23. Ulloa, C.; Eguía, P.; Miguez, J.L.; Porteiro, J.; Pousada-Carballo, J.M.; Cacabelos, A. Feasibility of using a stirling engine-based micro-CHP to provide heat and electricity to a recreational sailing boat in different European ports. Appl. Therm. Eng. 2013, 59, 414–424. [Google Scholar] [CrossRef]
  24. Spanish Technical Building Code, Basic Document HE 1: Energy Demand: Characteristic Parameters of the Envelope; Ministry of Development, Spanish Government: Madrid, Spain, 2013.
  25. Spanish Technical Building Code, Reference Climates Descriptive Document; Ministry of Development, Spanish Government: Madrid, Spain, 2015.
  26. González-Pino, I.; Campos-Celador, A.; Pérez-Iribarren, E.; Terés-Zubiaga, J.; Sala, J. Parametric study of the operational and economic feasibility of stirling micro-cogeneration devices in Spain. Appl. Therm. Eng. 2014, 71, 821–829. [Google Scholar] [CrossRef]
  27. Global Meteorological Database for Solar Application and System Design, version 7; Meteonorm: Bern, Switzerland, 2015.
  28. Energy Rating of Existing Buildings Technical Handbook; Institute for Energy Diversification and Saving (IDEA), Spanish Government: Madrid, Spain, 2015.
  29. Spanish Technical Building Code, Basic Document HE 4: Energy Savings; Ministry of Development, Spanish Government: Madrid, Spain, 2013.
  30. Conditions of Acceptance of Alternative Procedures to LIDER and CALENER. Available online: http://www.minetur.gob.es/energia/desarrollo/EficienciaEnergetica/CertificacionEnergetica/DocumentosReconocidos/OtrosDocumentos/Calificaci%C3%B3n%20energ%C3%A9tica.%20Viviendas/Guia-8_Condiciones_Alternativos.pdf (accessed on 16 September 2015).
  31. Conditions of Acceptance of Alternative Procedures to LIDER and CALENER. Annexes. Available online: http://www.minetur.gob.es/energia/desarrollo/EficienciaEnergetica/CertificacionEnergetica/DocumentosReconocidos/OtrosDocumentos/Calificaci%C3%B3n%20energ%C3%A9tica.%20Viviendas/Cond_acept_anexos.pdf (accessed on 16 September 2015).
  32. National Energy Efficiency Action Plan 2011–2020; Institute for Energy Diversification and Saving (IDAE), Spanish Government: Madrid, Spain, 2011.
  33. Spanish Technical Building Code, Basic Document HS; Ministry of Development, Spanish Government: Madrid, Spain, 2015.
  34. Institute for Energy Diversification and Saving (IDAE). Technical Guide Central DHW; Industry, Tourism and Trade, Spanish Government: Madrid, Spain, 2010.
  35. Institute for Energy Diversification and Saving (IDAE). SECH-SPAHOUSEC Project: Analysis of the Energy Consumption in the Spanish Households; Final Report; Ministry of Industry, Tourism and Trade, Spanish Government: Madrid, Spain, 2011.
  36. REE, Spanish Electricity Grid. Available online: http://www.ree.es (accessed on 16 September 2015).
  37. Rey, G.; Ulloa, C.; Cacabelos, A.; Barragáns, B. Performance analysis, model development and validation with experimental data of an ICE-based micro-CCHP system. Appl. Therm. Eng. 2015, 76, 233–244. [Google Scholar] [CrossRef]
  38. DKV, Deutscher Kälte- und Klimatechnischer Verein e.V. Available online: http://www.dkv.org (accessed on 11 November 2016).
Figure 1. Building outside view and Sketchup model.
Energies 09 00969 g001
Figure 2. Floor plan and thermal zones of the dwelling.
Energies 09 00969 g002
Figure 3. Distribution map of Spanish thermal zones.
Energies 09 00969 g003
Figure 4. DHW utilization profile.
Energies 09 00969 g004
Figure 5. Hourly electrical profile for a standard year.
Energies 09 00969 g005
Figure 6. Trigeneration unit components [37].
Energies 09 00969 g006
Figure 7. Trigeneration unit schematic experimental performance.
Energies 09 00969 g007
Figure 8. General layout of the simulation in TRNSYS.
Energies 09 00969 g008
Figure 9. Annual heating comparison for the different climatic zones.
Energies 09 00969 g009
Figure 10. Annual heating coverage comparison for the different climatic zones.
Energies 09 00969 g010
Figure 11. Annual cooling comparison for the different climatic zones.
Energies 09 00969 g011
Figure 12. Annual cooling coverage comparison for the different climatic zones.
Energies 09 00969 g012
Figure 13. Annual electricity coverage comparison for the different climatic zones.
Energies 09 00969 g013
Figure 14. Annual operating time.
Energies 09 00969 g014
Table 1. Geometrical data.
Dwelling Geometrical ParameterValue
Gross Volume of Heated Rooms (V)779.67 m3
External surface (S)655.36 m2
Ratio S/V1.19
Internal surface (Su)97.22 m2
External glazing128.26 m2
Table 2. Characteristics of the constructive elements.
Transmittance (W/m2·K)Thickness (m)
External wall0.370.65
Ground floor0.430.65
Roof0.390.39
Internal wall0.120.12
Adjacent ceiling0.590.32
Windows2.76-
Table 3. Cities selected for the research and climatic severities.
1234
A MálagaAlmería
B CastellónCórdoba
CBilbaoBarcelonaGranadaJaén
DPamplonaValladolidAlbacete
ELeón
Table 4. Tap water monthly and annual mean temperature in °C.
Climatic ZoneCityJan.Feb.Mar.Apr.MayJun.Jul.Aug.Sep.Oct.Nov.Dec.Annual
A3Málaga11121314161820201916131215
A4Almería12121314161820211917141216
B3Castellón10111213151819201816111215
B4Córdoba10111214161921211916121015
C1Bilbao9101011131517171614111013
C2Barcelona9101112141719191715121014
C3Granada89101214172019171411813
C4Jaén910111316192121191512915
D1Pamplona789101113151514129811
D2Valladolid678101316181816129712
D3Albacete789111417191917139713
E1León66891214161615118611

