
An Overview of Modeling Approaches Applied to Aggregation-Based Fleet Management and Integration of Plug-in Electric Vehicles † †


Abstract
:1. Introduction
2. Structure of Modeling Aggregation-Based PEVF
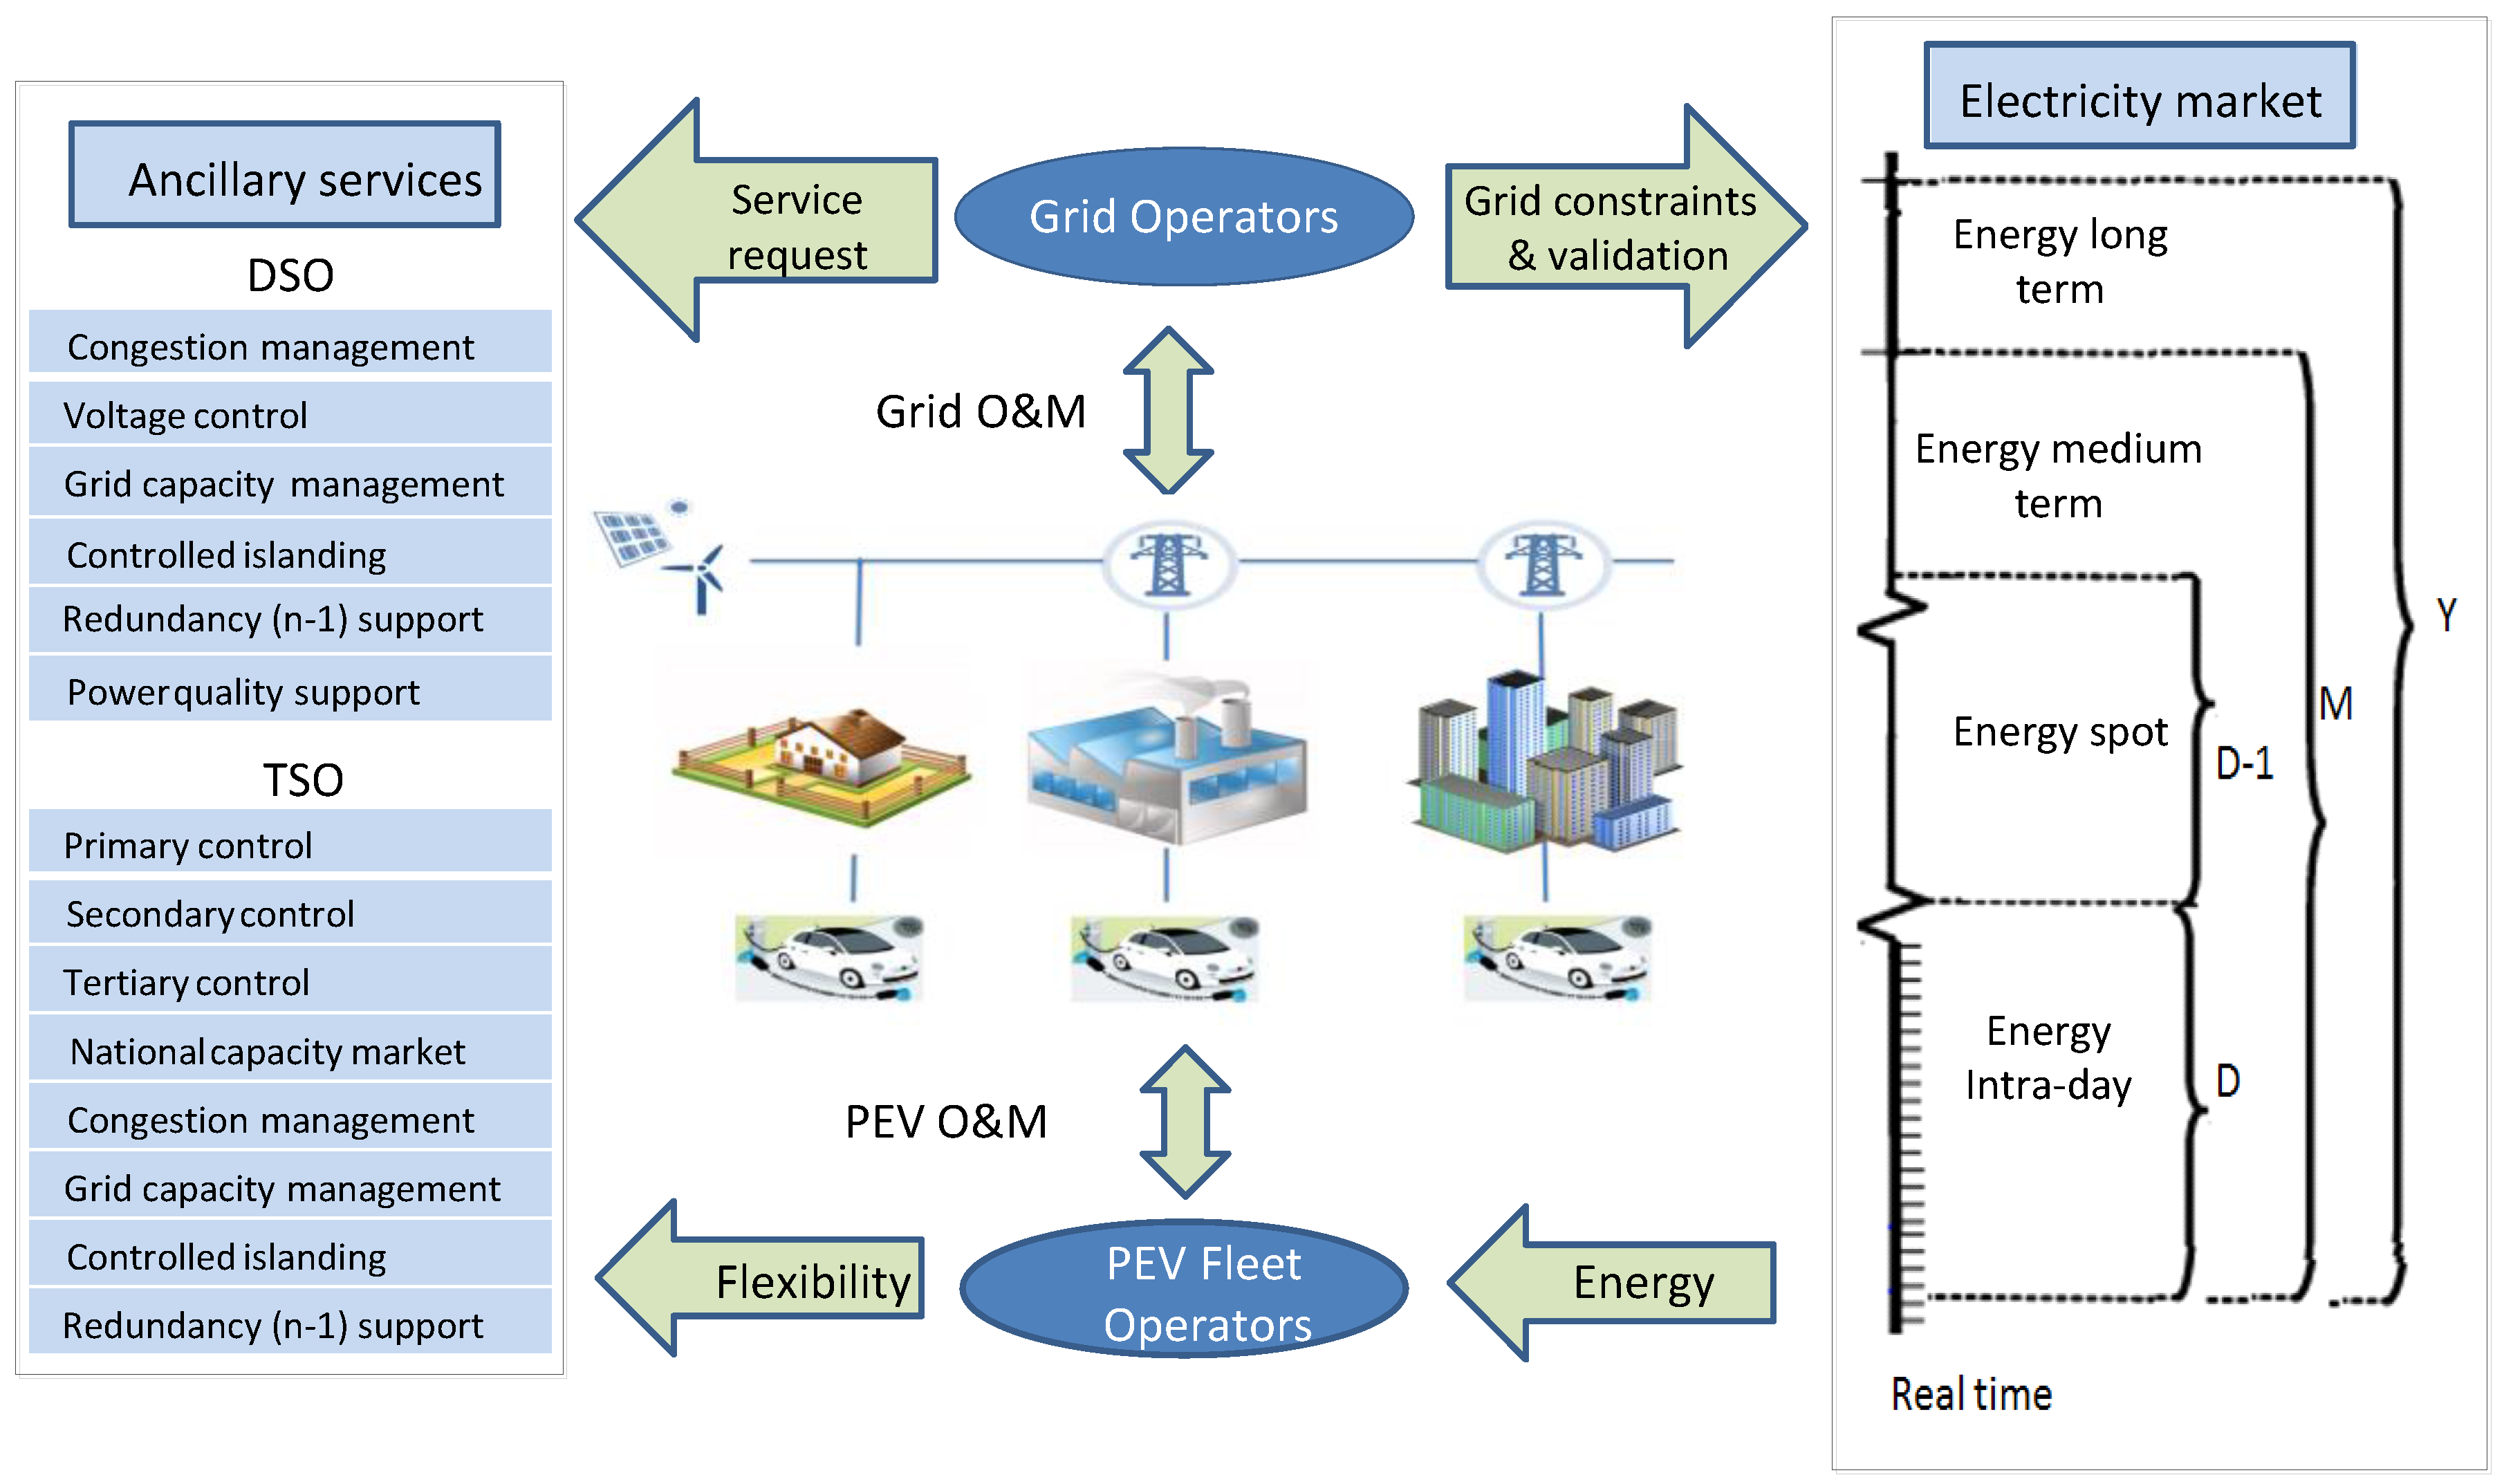
2.1. System Models
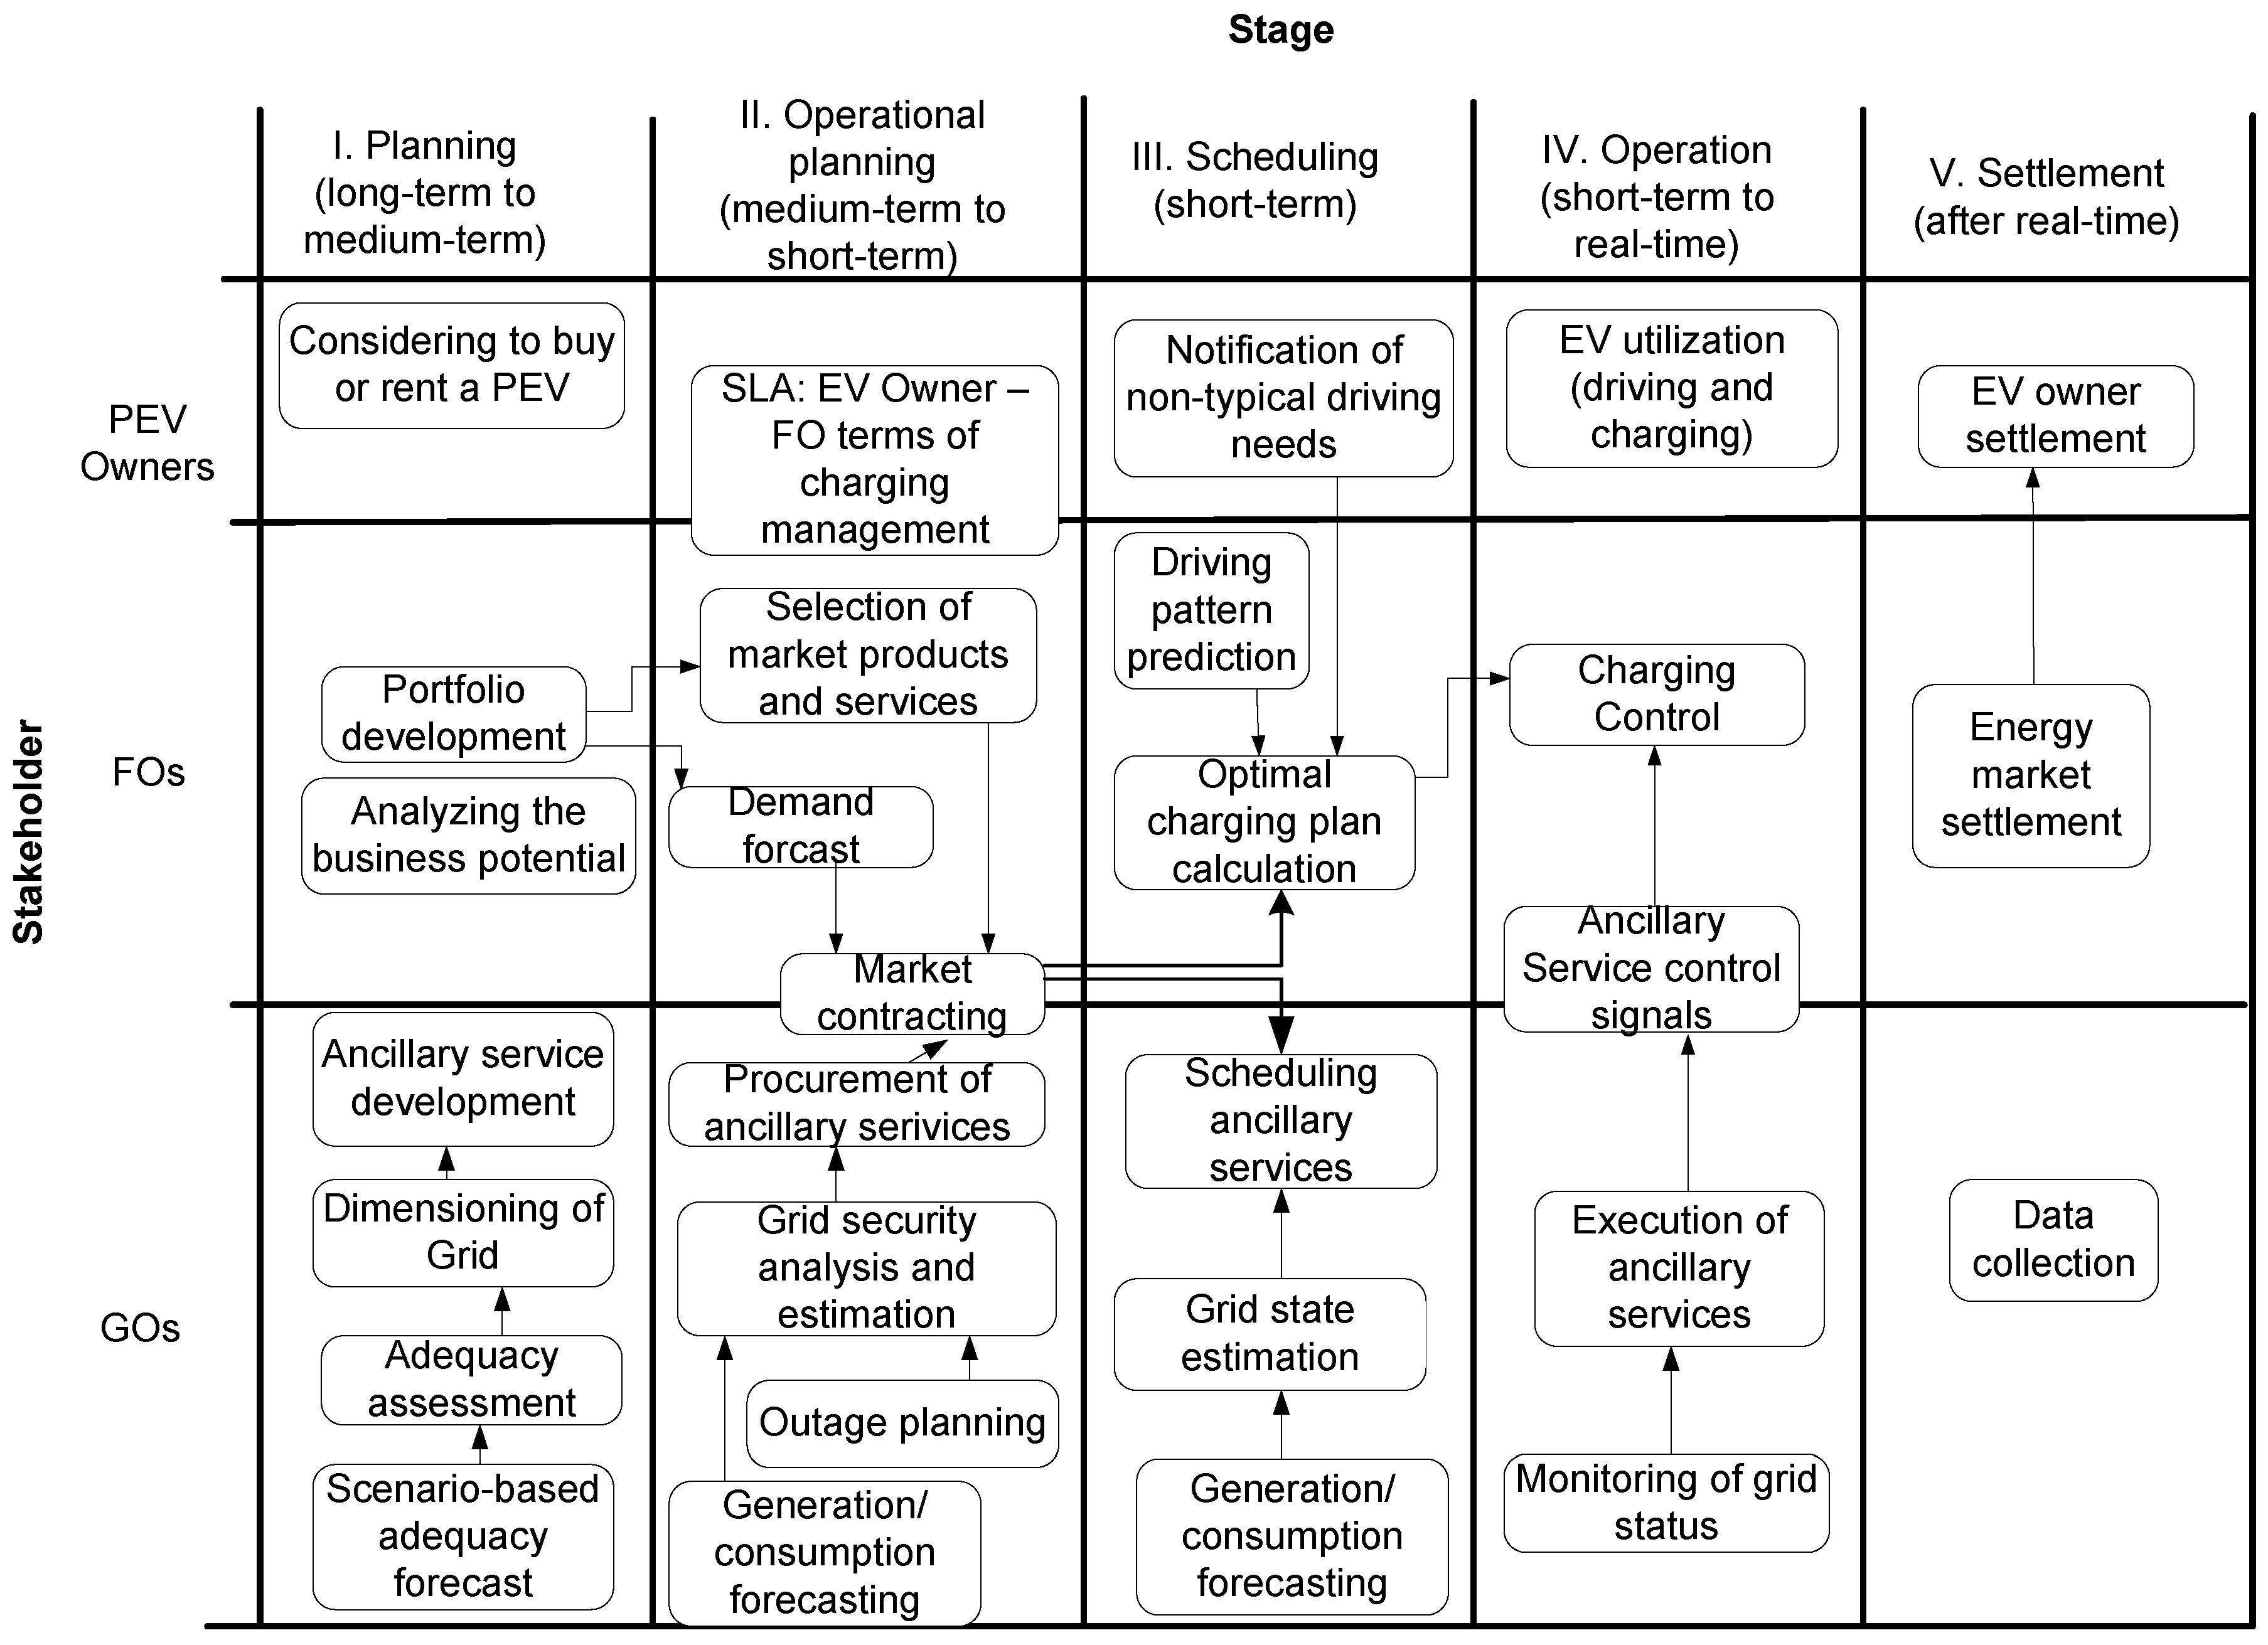
2.2. Process Models
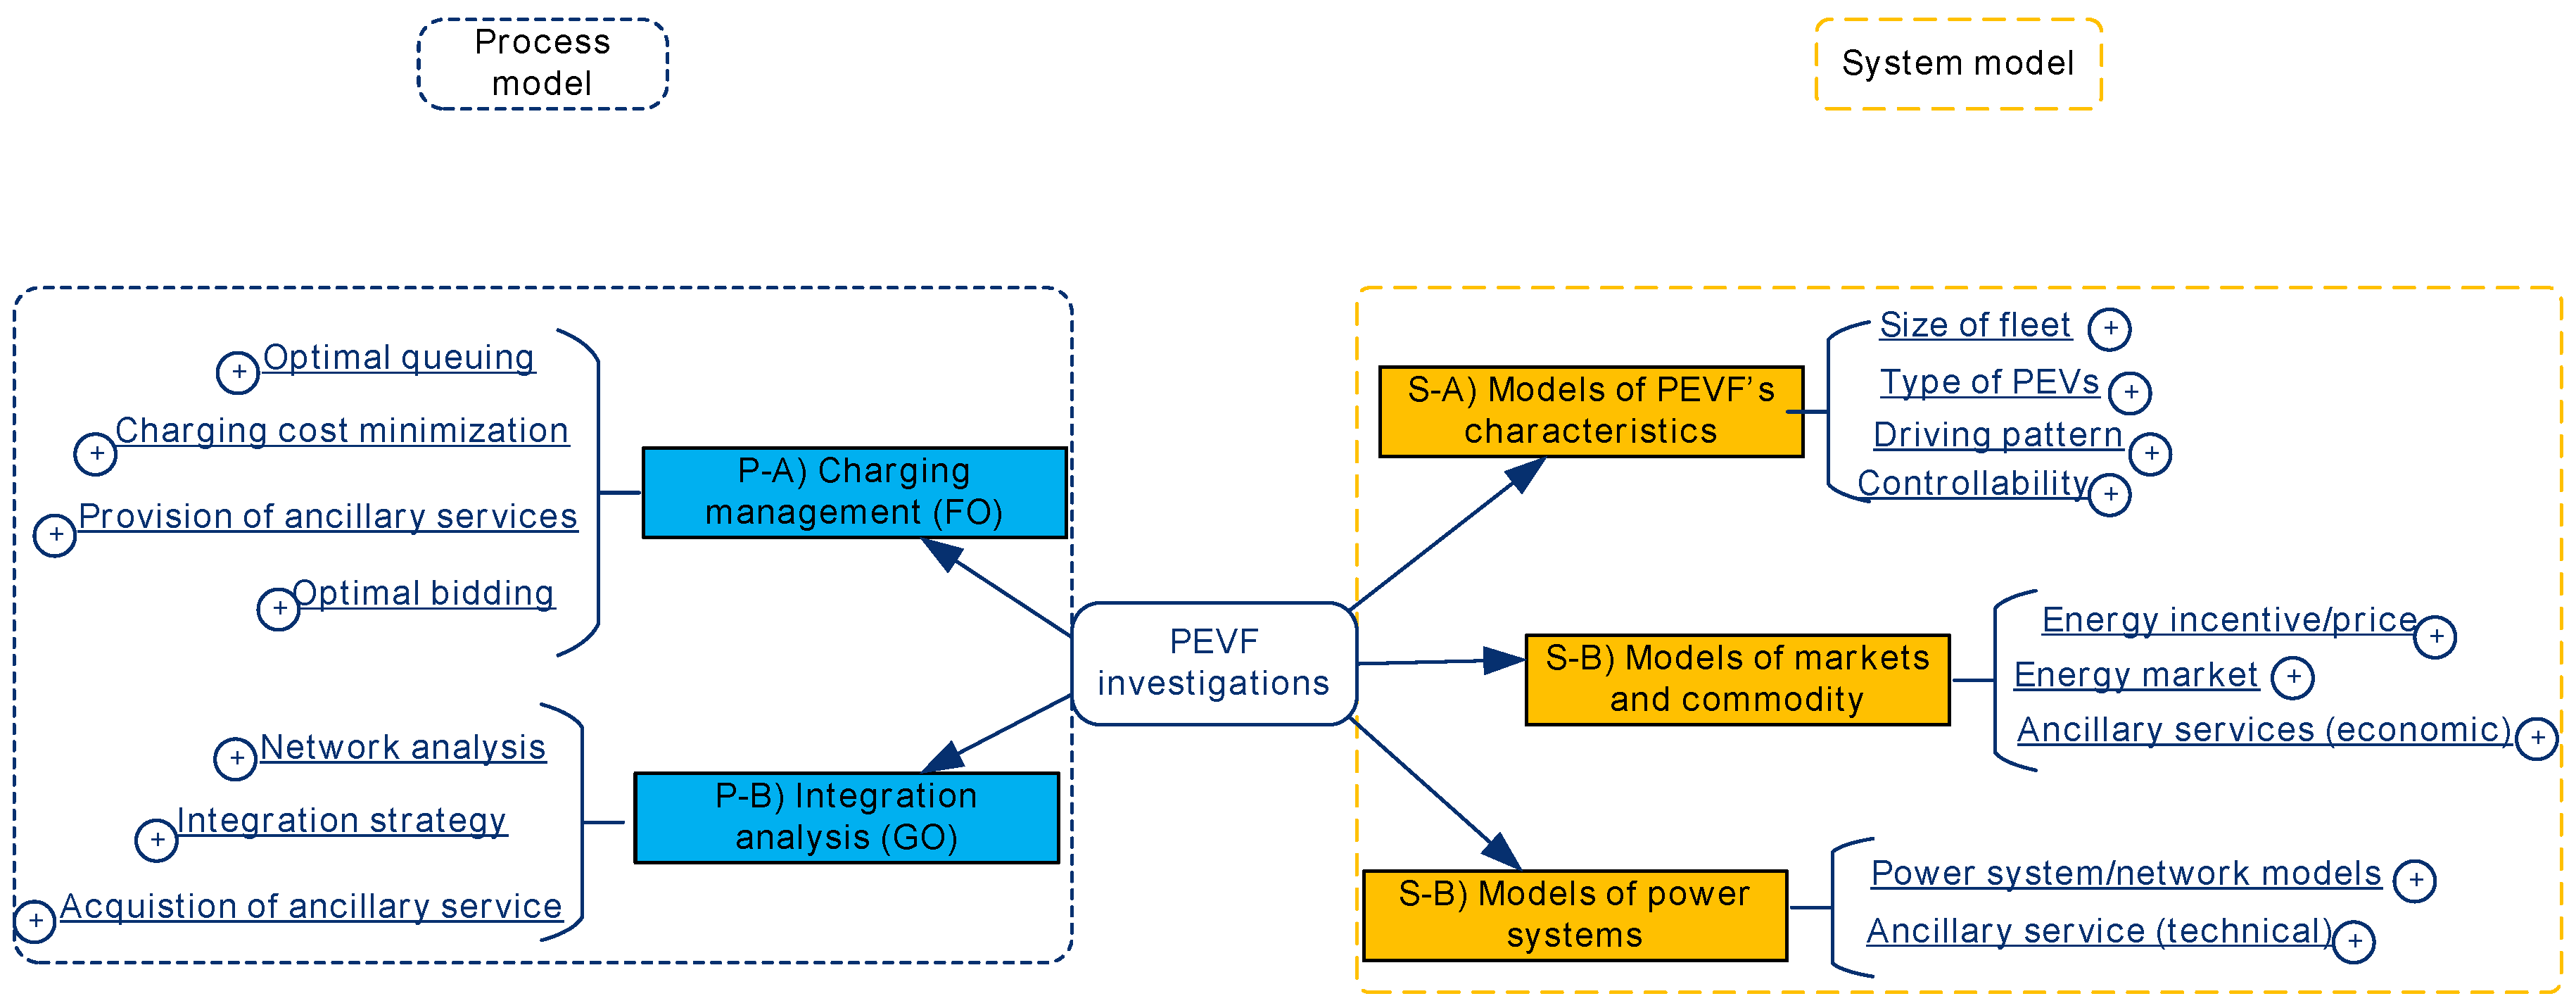
2.3. Combined Models Driven by Different Views of GOs and FOs
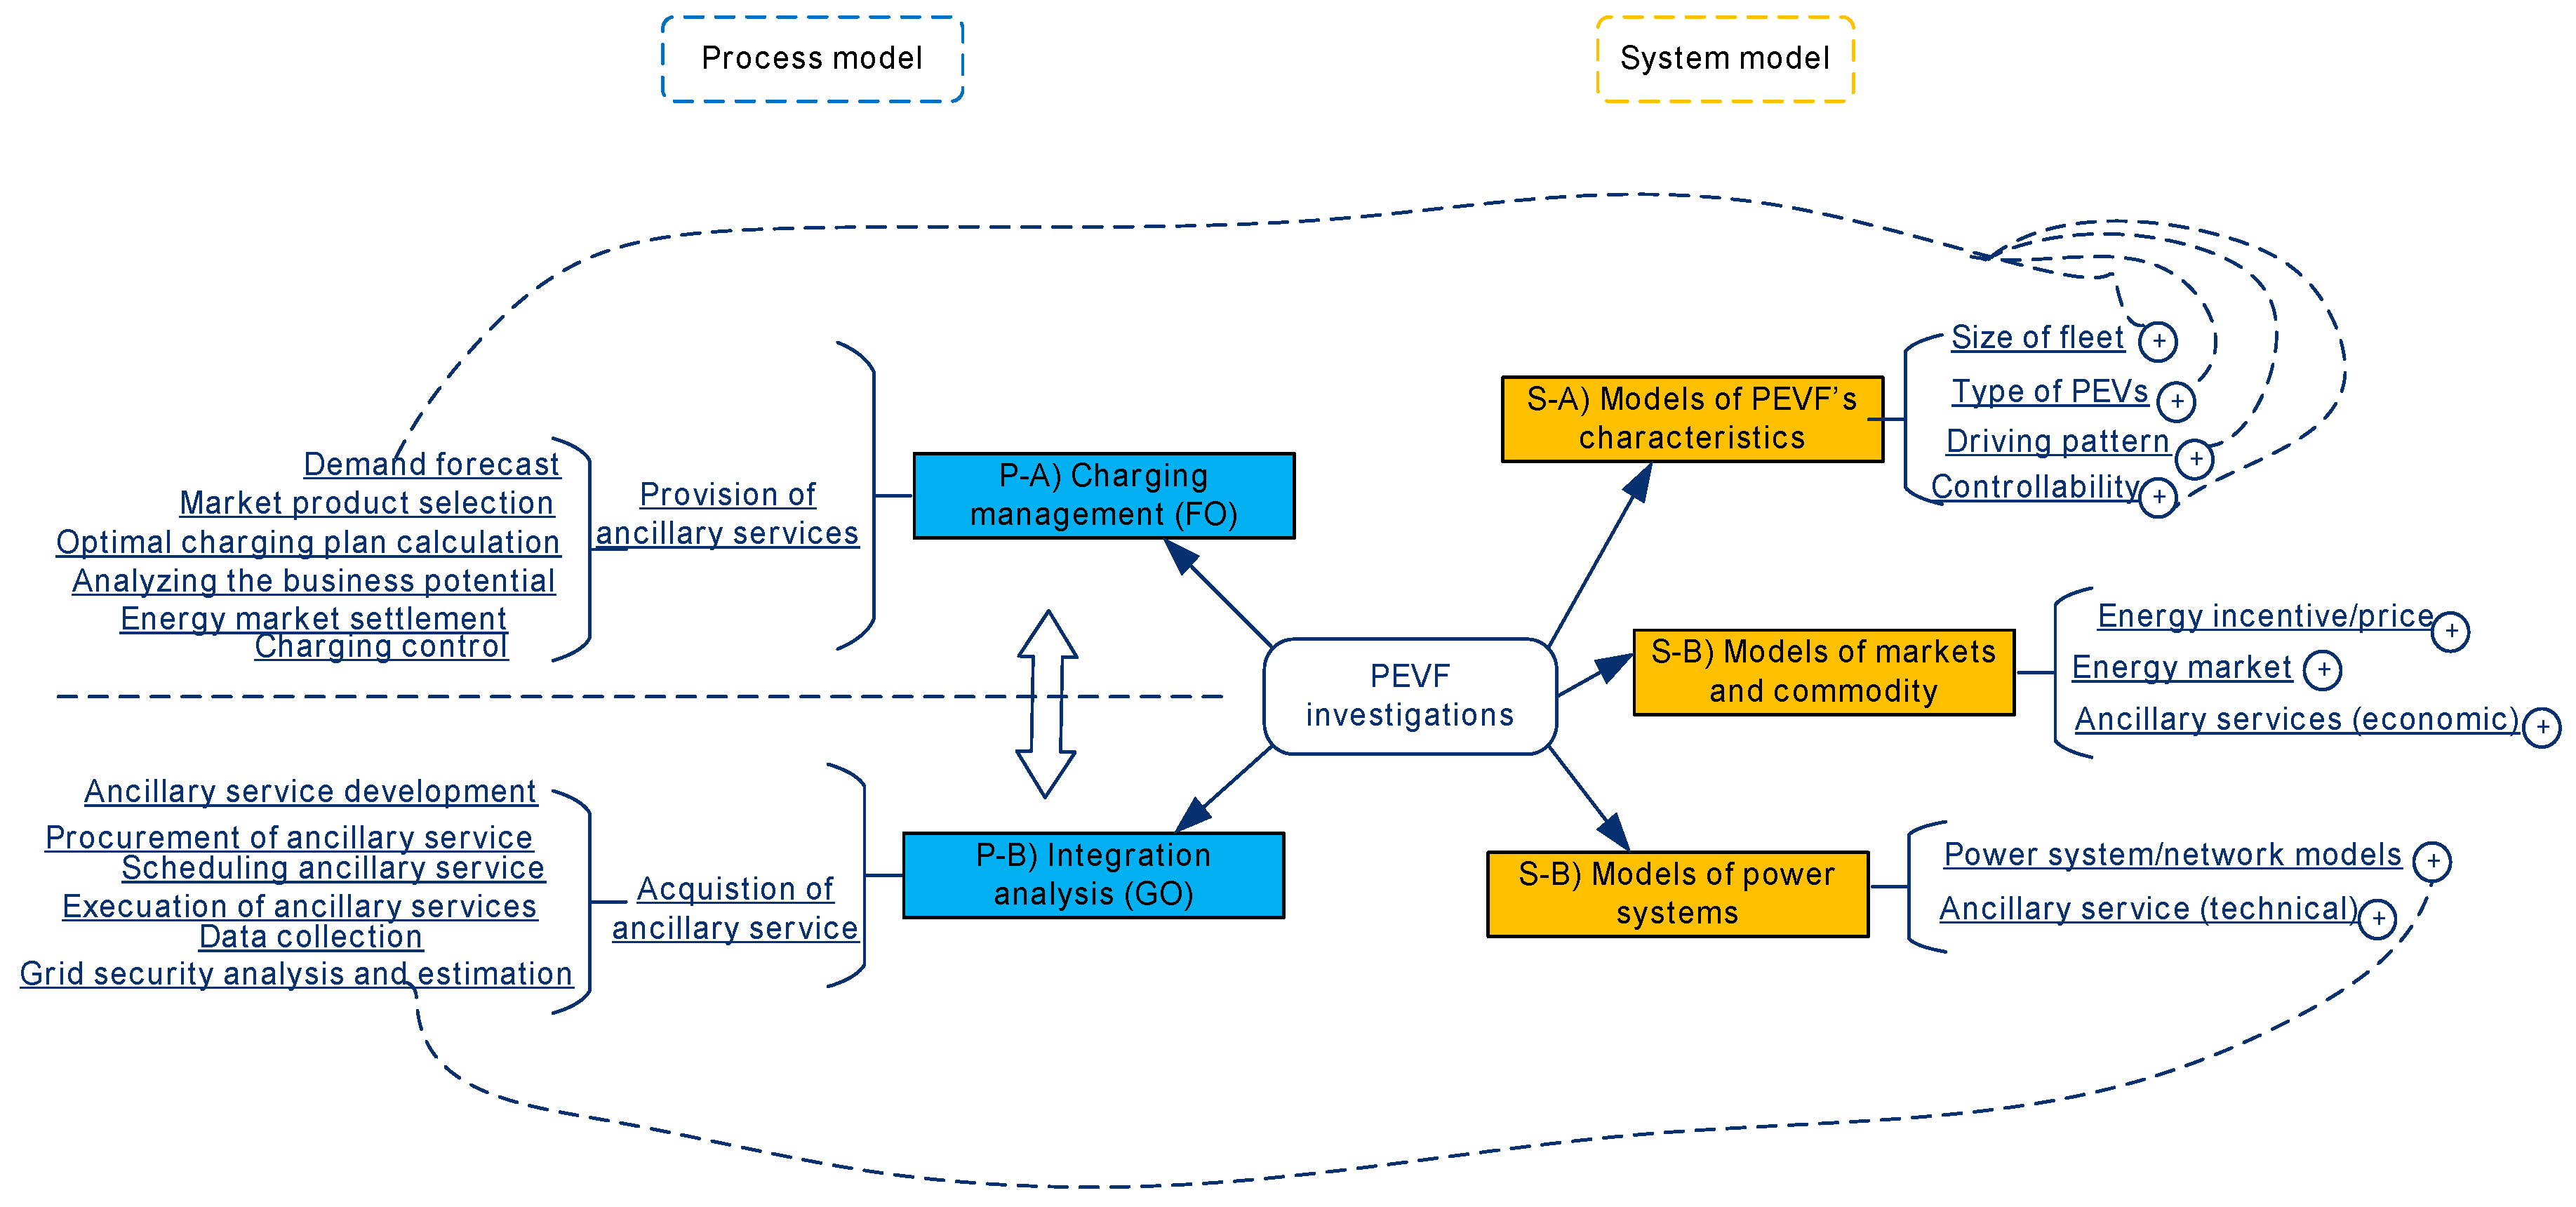
2.4. An Illustrative Example of Combing System Models and Process Models
3. Methods Applied to Model the Key System Models and Processes
3.1. Models of an Individual PEV Characteristics
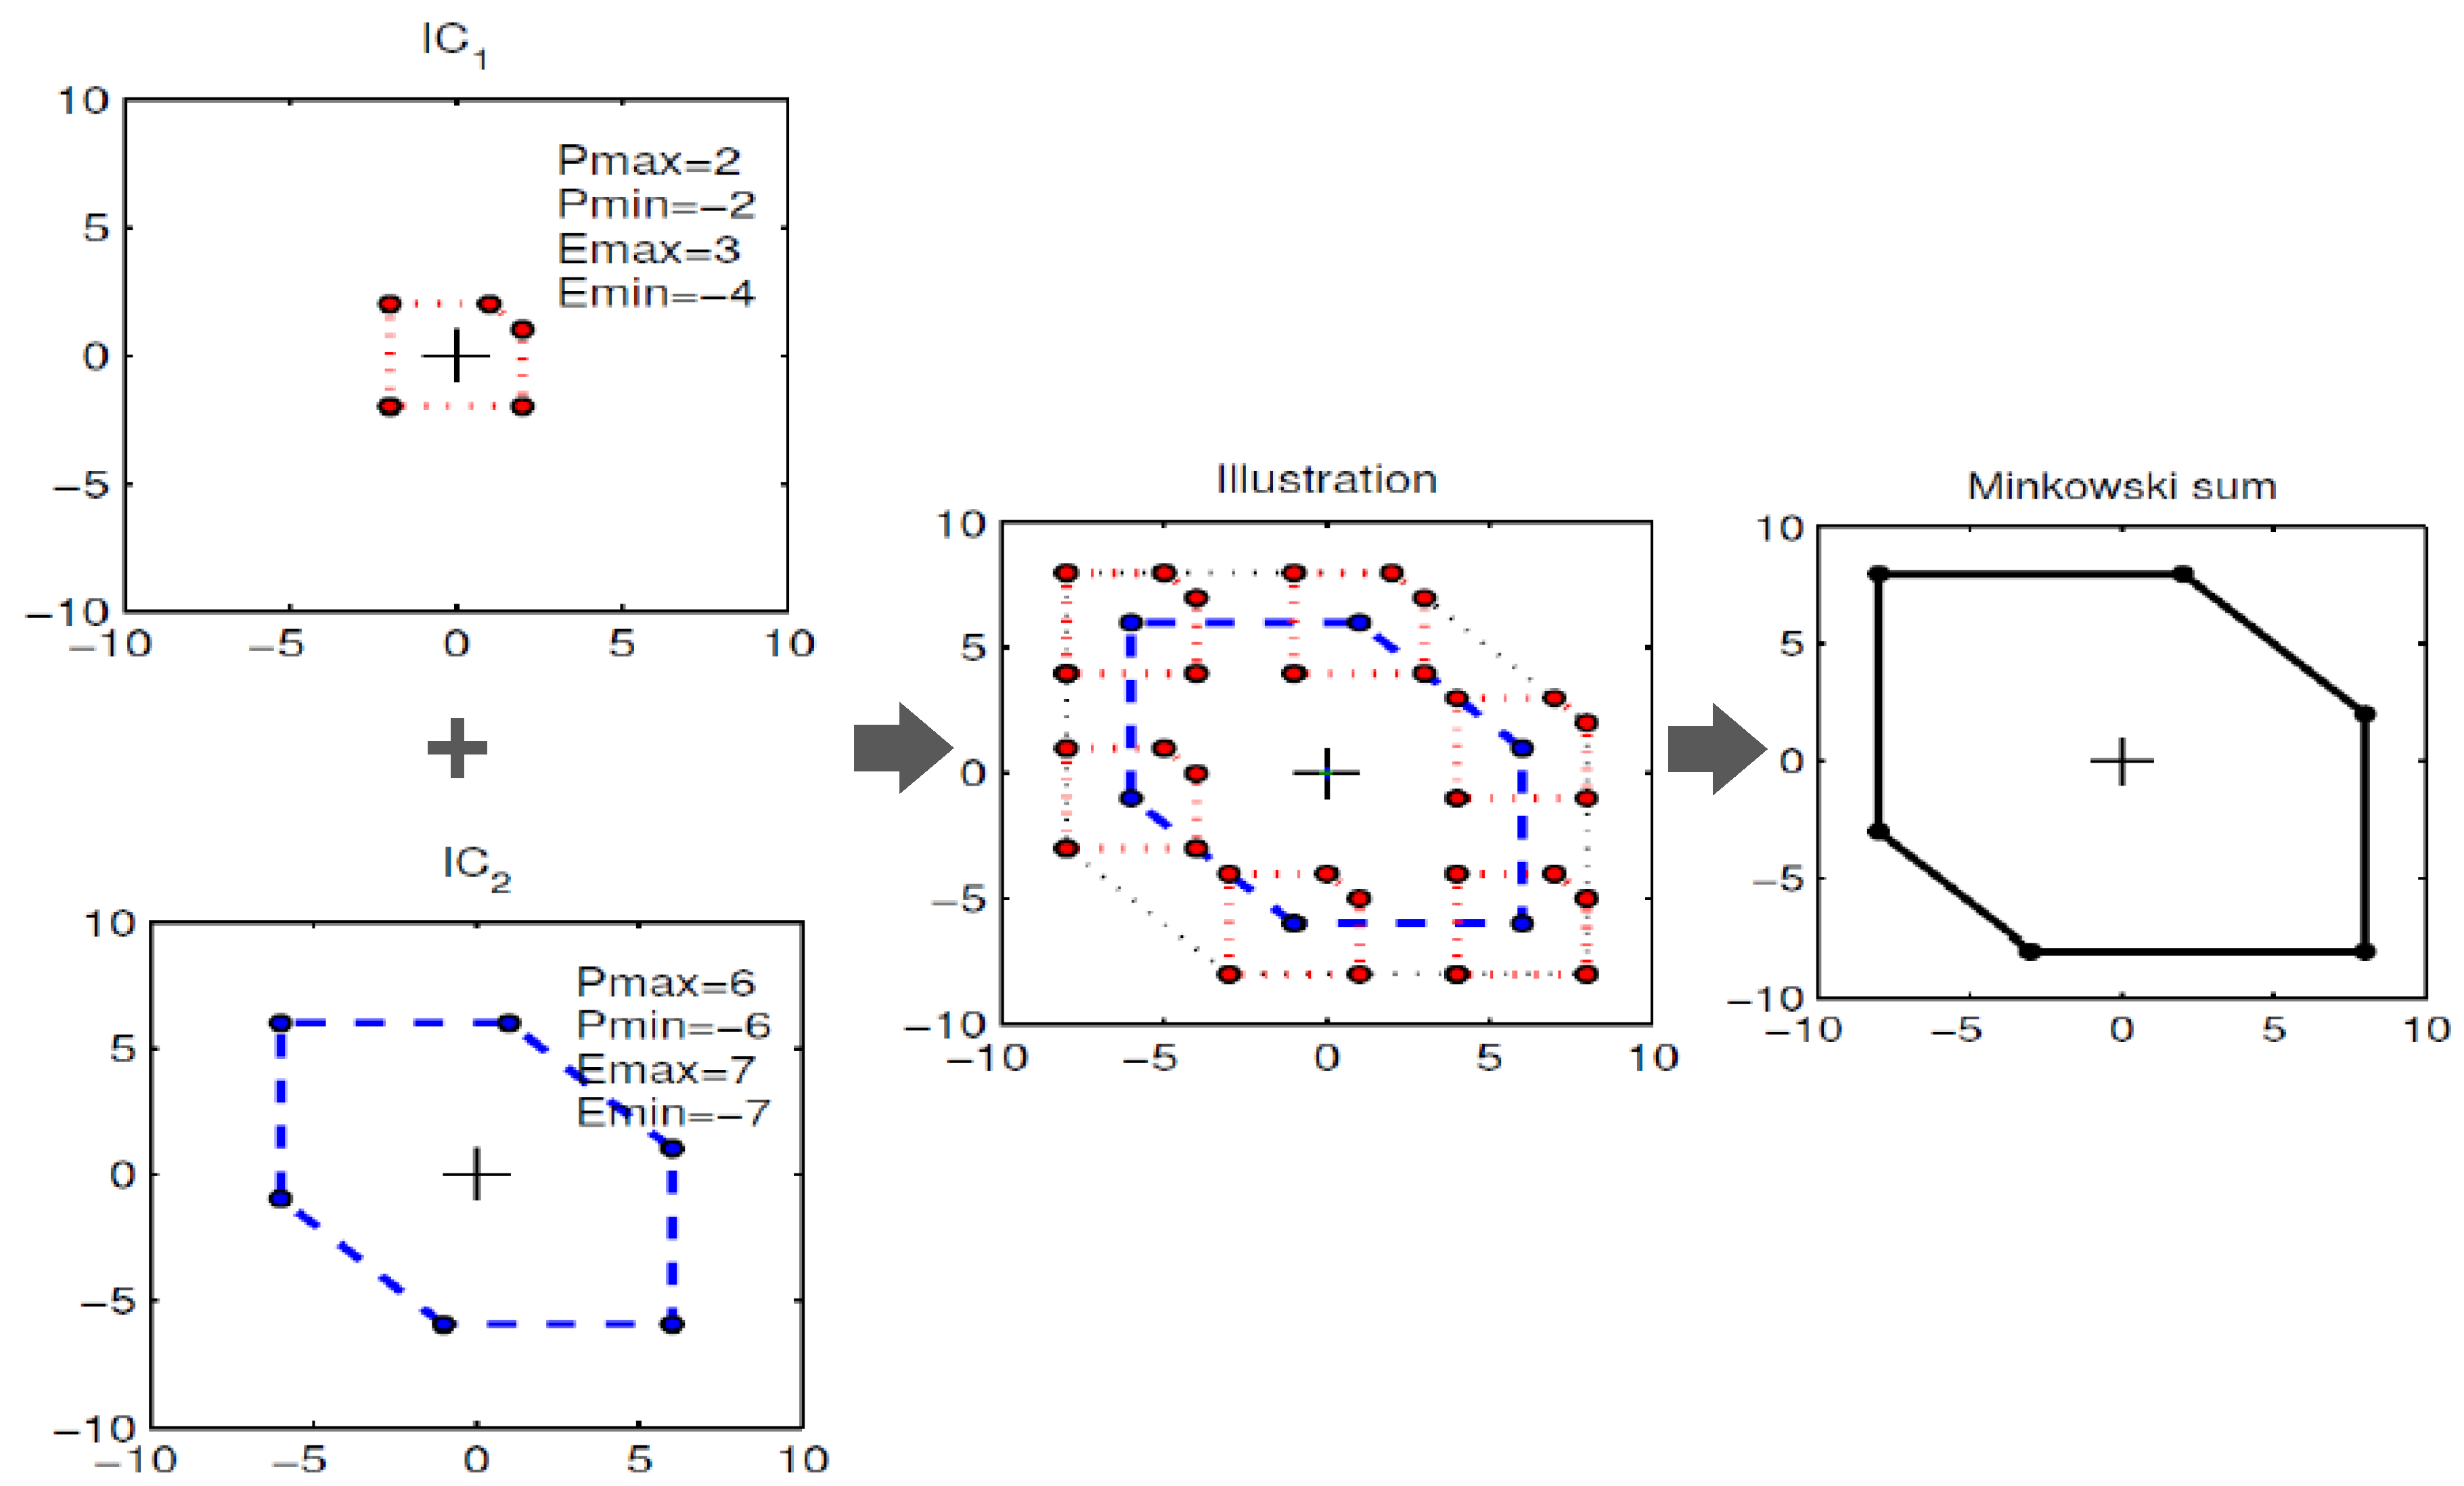
3.2. Aggregation Models for PEVF Representation
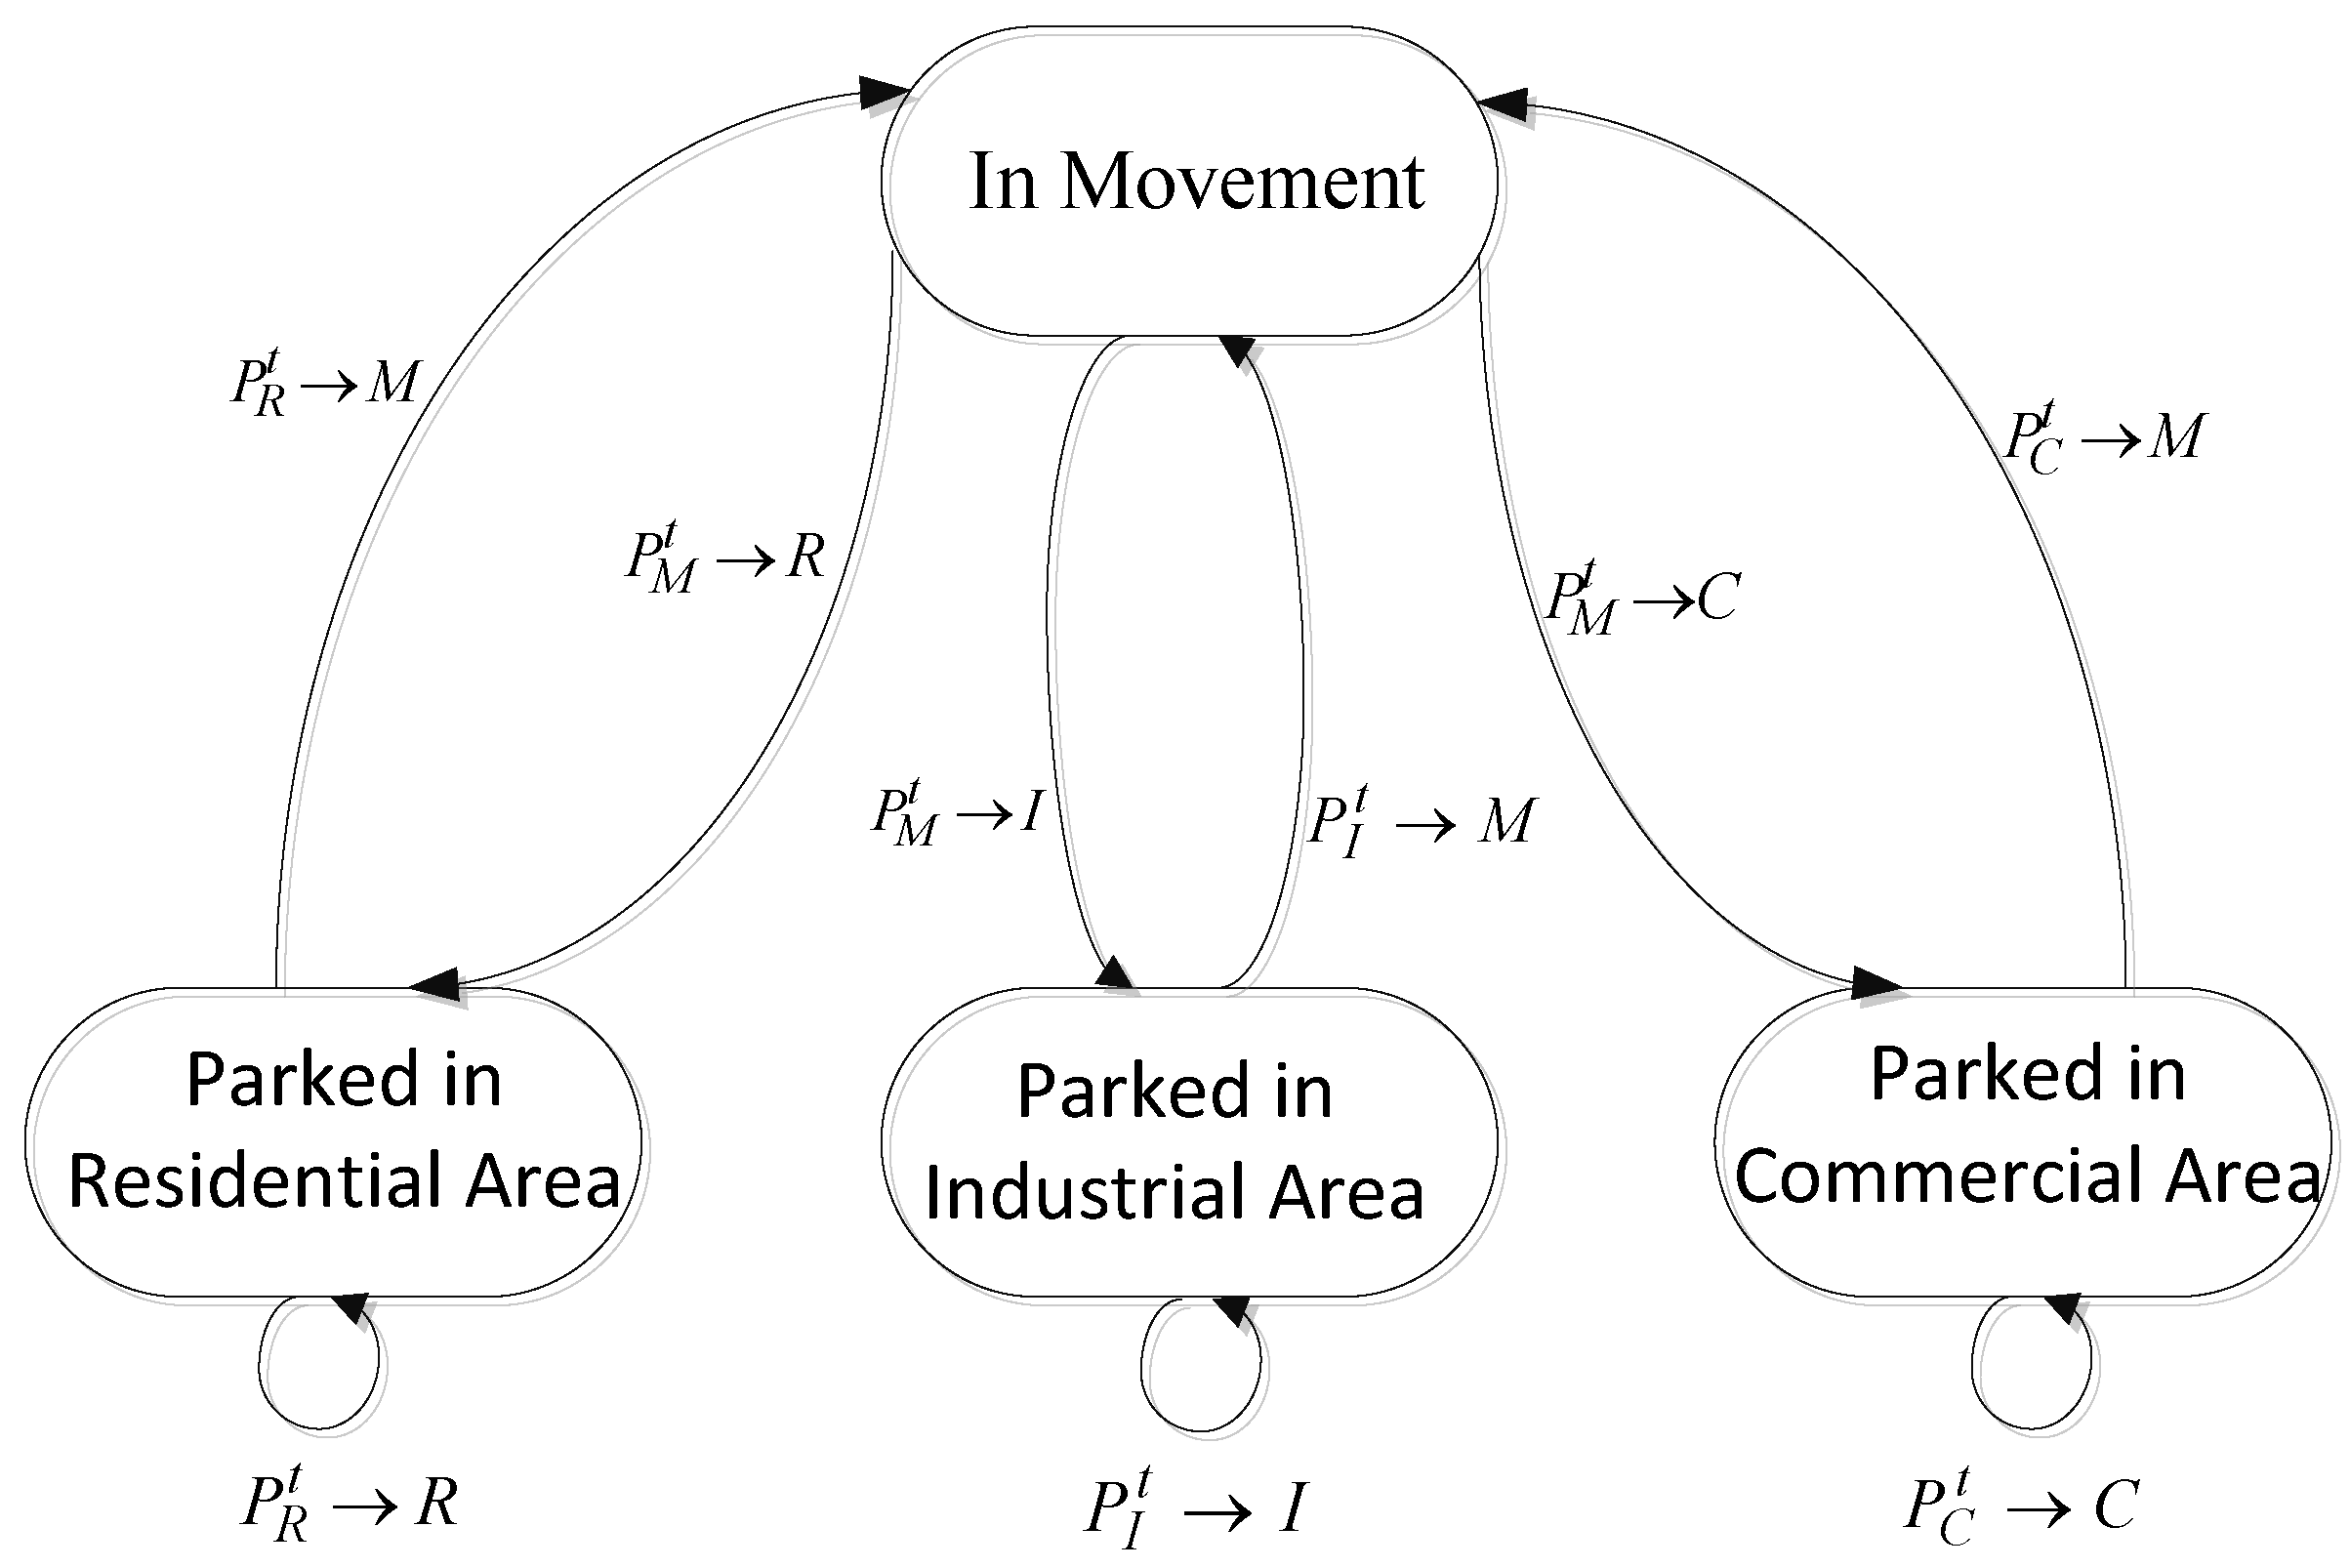
3.3. Driving Pattern Modeling
3.4. PEVs in an Aggregator’s Portfolio with other Flexibility Sources
3.5. Modeling the Related Systems: Energy Markets and the Power System
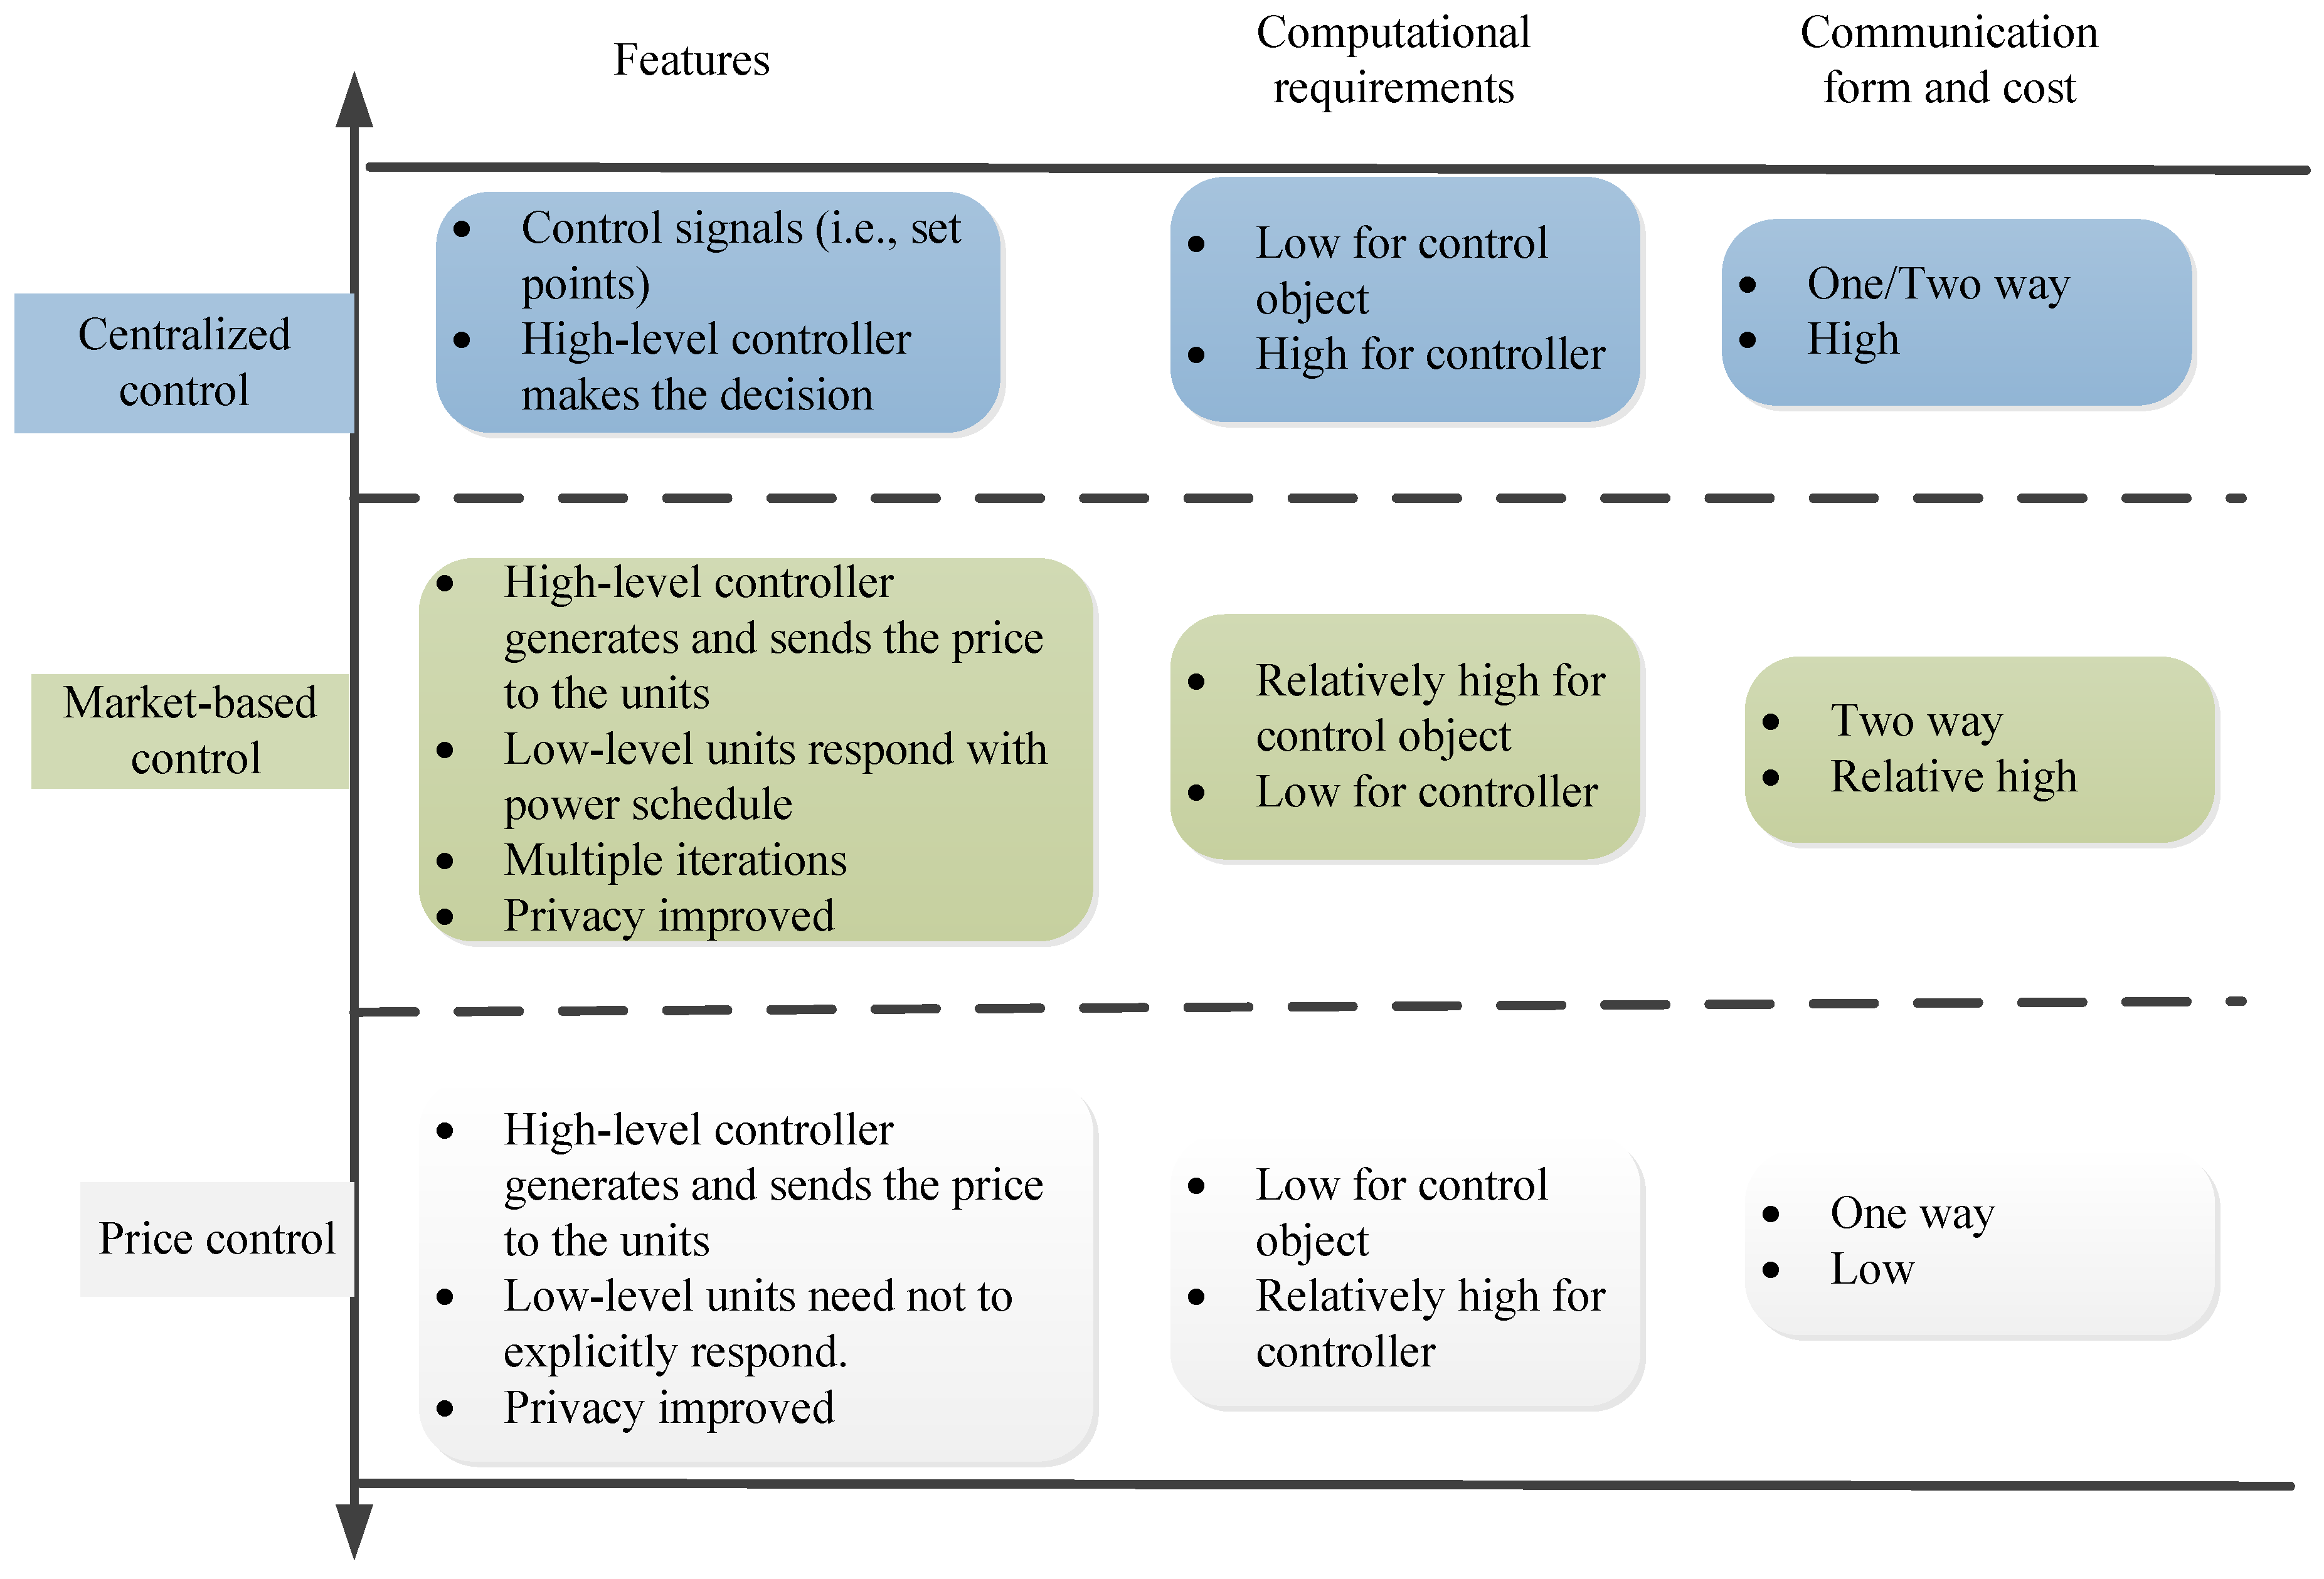
3.6. Charging Management Strategies
- (1)
- Optimal queueing: Except for battery swapping, charging a PEV to the expected energy level can be heavily time-consuming in many occasions. Given the assumption that the charging infrastructure has limited capability, either temporal (i.e., one charging station) or spatial (i.e., more than one charging stations that are geographically distributed), or both, queues might occur at charging stations. Optimal solutions to this issue, as in [58,74], are developed to ensure PEVs are charged to their expected levels of SOC as much as possible by charging them sequentially in a given period, which typically considers the stochastic pattern of arrival and departure of PEVs. This problem is also sometimes known as optimal routing, when the spatial influence, such as the distance between charging stations [75,76] and traffic jams, are modeled [77]. In addition to including the driving needs and the basic characteristics of the PEVF, the formulation of optimal queueing or routing often takes into account the capacity of charging infrastructures as additional constraints. The corresponding objectives also cover one or more of the following: shortest path, minimum energy consumption during driving and waiting, shortest waiting time, etc., which complement the fundamental needs of charging, i.e., energy. The solutions derived by optimal queueing or routing can be used not only by FOs to manage the charging of their PEVF, but can also be used for charging infrastructure planning in relation to both sizing and siting [78].
- (2)
- Charging cost minimization: As one of the fundamental and essential objectives that a FO wants to achieve, cost minimization often refers to the operational cost of charging the PEVF. If the electricity is bought from the wholesale market, then the cost minimization implies the FOs needs to come up with optimal bidding strategies that can ensure the operational cost is minimized while considering both the uncertainty of market prices and the uncertainty of energy consumption [35,79]. If the electricity price is already known ahead of time (e.g., dynamic tariff), for achieving the same objective, only the intermittency of charging needs to be considered [35,55,56]. In some cases, additional cost items, such as the cost for battery life reduction [33], is also included in the objective, incurring the need of having additional considerations to represent the cost formulation and the related control scheme.
- (3)
- Profit maximization can be formulated by FOs who aim at maximizing the profit of using PEVs to provide one or more ancillary services. In contrast to charging cost minimization, profit maximization is based on the assumptions that the flexibility of PEVs is managed to meet the technical requirements of ancillary services. Typically, this process is combined with cost minimization because trading energy and trading ancillary services are closely related to each other, such as in [40,61], where the day-ahead energy trading is combined with regulation services and manual reserves, respectively. Additional constraints in such groups of problems are usually about market regulations and bidding strategies that would result in optimal schedules of the PEVF.
- (4)
- Minimization of negative impacts: When PEVs are passively connected to a power system, this new form of intermittent demand may result in a number of issues, such as network congestion [67,80,81]. Both FOs and GOs intend to minimize the corresponding negative impacts as much as possible by either controlling the charging of PEVs at the phase of operation directly or setting charging limits (temporal and spatial) to the PEVs. Such problems often require additional constraints (network operational requirements) and other kinds of generation/load models in order to model the negative impacts from the PEVs and to find the corresponding solutions.
- (5)
- Maximization of the technical flexibility of the PEVF: With properly-designed charging management strategies, the flexibility of the PEVF can be used to address various kinds of power system challenges, such as frequency support and congestion management. In contrast to profit maximization, which considers the provision of ancillary services from the economic perspective, the models that fall into this category are built from the technical perspective and used for assessing the technical benefits. The optimality part of this work is on maximizing the flexibility utilization to meet the technical requirements of ancillary services, especially control-wise (reaction time and ramp rate), while considering the intermittency of the PEVs. In [66] the PEVs are controlled to offer primary, secondary, and tertiary reserves using a hierarchical model predictive control (MPC) structure. In [82], congestion management is modeled as a service offered by the FOs to optimally allocate the charging flexibility of the PEVF. Additional constraints are, therefore, mainly modeled from the power system side (e.g., modeling the variation of frequency signals and network performance) for formulating the system context of ancillary services.
4. Discussion and Concluding Remarks
Conflicts of Interest
References
- EVvolumes. Available online: http://www.ev-volumes.com/country/total-world-plug-in-vehicle-volumes/ (accessed on 3 August 2016).
- Faria, R.; Marques, P.; Moura, P.; Freire, F.; Delgado, J.; de Almeida, A.T. Impact of the electricity mix and use profile in the life-cycle assessment of electric vehicles. Renew. Sustain. Energy Rev. 2013, 24, 271–287. [Google Scholar] [CrossRef]
- Richardson, D.B. Electric vehicles and the electric grid: A review of modeling approaches, Impacts, and renewable energy integration. Renew. Sustain. Energy Rev. 2013, 19, 247–254. [Google Scholar] [CrossRef]
- Mwasilu, F.; Justo, J.J.; Kim, E.K.; Do, T.D.; Jung, J.W. Electric vehicles and smart grid interaction: A review on vehicle to grid and renewable energy sources integration. Renew. Sustain. Energy Rev. 2014, 34, 501–516. [Google Scholar] [CrossRef]
- Tomić, J.; Kempton, W. Using fleets of electric-drive vehicles for grid support. J. Power Sources 2007, 168, 459–468. [Google Scholar] [CrossRef]
- Knezović, K.; Marinelli, M.; Codani, P.; Perez, Y. Distribution grid services and flexibility provision by electric vehicles: A review of options. In Proceedings of the 50th International Universities Power Engineering Conference (UPEC ′15), Staffordshire, UK, 1–4 September 2015; pp. 1–6.
- Divya, K.C.; Østergaard, J. Battery energy storage technology for power systems—An overview. Electr. Power Syst. Res. 2009, 79, 511–520. [Google Scholar] [CrossRef]
- San Román, T.G.; Momber, I.; Abbad, M.R.; Miralles, A.S. Regulatory framework and business models for charging plug-in electric vehicles: Infrastructure, agents, and commercial relationships. Energy Policy 2011, 39, 6360–6375. [Google Scholar] [CrossRef]
- Andersson, S.L.; Elofsson, A.K.; Galus, M.D.; Göransson, L.; Karlsson, S.; Johnsson, F.; Andersson, G. Plug-in hybrid electric vehicles as regulating power providers: Case studies of Sweden and Germany. Energy Policy 2010, 38, 2751–2762. [Google Scholar] [CrossRef]
- Bessa, R.J.; Matos, M.A. Economic and technical management of an aggregation agent for electric vehicles: A literature survey. Eur. Trans. Electr. Power 2012, 22, 334–350. [Google Scholar] [CrossRef]
- Rigas, E.S.; Ramchurn, S.D.; Bassiliades, N. Managing electric vehicles in the smart grid using artificial intelligence: A survey. IEEE Trans. Intell. Transp. Syst. 2015, 16, 1619–1635. [Google Scholar] [CrossRef]
- Flatabo, N.; Doorman, G.; Grande, O.S.; Randen, H.; Wangensteen, I. Experience with the Nord Pool design and implementation. IEEE Trans. Power Syst. 2003, 18, 541–547. [Google Scholar] [CrossRef]
- Heussen, K.; You, S.; Biegel, B.; Hansen, L.H.; Andersen, K.B. Indirect control for demand side management—A conceptual introduction. In Proceedings of the 3rd IEEE PES Innovative Smart Grid Technologies Europe (ISGT Europe ′12), Berlin, Germany, 14–17 October 2012; pp. 1–8.
- Alizadeh, M.; Kesidis, G.; Scaglione, A. Clustering consumption in queues: A scalable model for electric vehicle scheduling. In Proceedings of the 2013 IEEE Asilomar Conference on Signals, Systems and Computers, Pacific Grove, CA, USA, 3–6 November 2013; pp. 374–378.
- Kristoffersen, T.K.; Capion, K.; Meibom, P. Optimal charging of electric drive vehicles in a market environment. Appl. Energy 2011, 88, 1940–1948. [Google Scholar] [CrossRef]
- Kempton, W.; Tomić, J. Vehicle-to-grid power fundamentals: Calculating capacity and net revenue. J. Power Sources 2005, 144, 268–279. [Google Scholar] [CrossRef]
- Aalami, H.A.; Moghaddam, M.P.; Yousefi, G.R. Modeling and prioritizing demand response programs in power markets. Electr. Power Syst. Res. 2010, 80, 426–435. [Google Scholar] [CrossRef]
- Rotering, N.; Ilic, M. Optimal charge control of plug-in hybrid electric vehicles in deregulated electricity markets. IEEE Trans. Power Syst. 2011, 26, 1021–1029. [Google Scholar] [CrossRef]
- Foley, A.; Tyther, B.; Calnan, P.; Gallachóir, B.Ó. Impacts of electric vehicle charging under electricity market operations. Appl. Energy 2013, 101, 93–102. [Google Scholar] [CrossRef]
- Su, C.L.; Kirschen, D. Quantifying the effect of demand response on electricity markets. IEEE Trans. Power Syst. 2009, 24, 1199–1207. [Google Scholar]
- Andersen, P.B.; Hu, J.; Heussen, K. Coordination strategies for distribution grid congestion management in a multi-actor, multi-objective setting. In Proceedings of the 3rd IEEE PES Innovative Smart Grid Technologies Europe (ISGT Europe ′12), Berlin, Germany, 14–17 October 2012; pp. 1–8.
- Ackermann, T.; Carlini, E.M.; Ernst, B.; Groome, F.; Orths, A. Integrating variable renewables in Europe: Current status and recent extreme events. IEEE Power Energy Mag. 2015, 13, 67–77. [Google Scholar] [CrossRef]
- Juul, N.; Pantuso, G.; Iversen, J.E.B.; Boomsma, T.K. Strategies for Charging Electric Vehicles in the Electricity Market. Int. J. Sustain. Energy Plan. Manag. 2015, 7, 67–74. [Google Scholar]
- Ortega-Vazquez, M.A.; Bouffard, F.; Silva, V. Electric vehicle aggregator/system operator coordination for charging scheduling and services procurement. IEEE Trans. Power Syst. 2013, 28, 1806–1815. [Google Scholar] [CrossRef]
- Fotouhi, A.; Auger, D.J.; Propp, K.; Longo, S.; Wild, M. A review on electric vehicle battery modelling: From Lithium-ion toward Lithium–Sulphur. Renew. Sustain. Energy Rev. 2016, 56, 1008–1021. [Google Scholar] [CrossRef]
- Zhang, C.; Li, K.; Mcloone, S.; Yang, Z. Battery modelling methods for electric vehicles-A review. In Proceedings of the IEEE 2014 European Control Conference, Strasbourg, France, 24–27 July 2014; pp. 2673–2678.
- Nikdel, M. Various battery models for various simulation studies and applications. Renew. Sustain. Energy Rev. 2014, 32, 477–485. [Google Scholar]
- Hemi, H.; Ghouili, J.; Cheriti, A. Dynamic modeling and simulation of temperature and current effects on an electric vehicles Lithium Ion battery. In Proceedings of the 2015 IEEE 28th Canadian Conference on Electrical and Computer Engineering (CCECE), Halifax, NS, Canada, 3–6 May 2015; pp. 970–975.
- Koirala, N.; He, F.; Shen, W. Comparison of two battery equivalent circuit models for state of charge estimation in electric vehicles. In Proceedings of the 2015 IEEE 10th Conference on Industrial Electronics and Applications (ICIEA), Auckland, New Zealand, 15–17 June 2015; pp. 17–22.
- Knezovic, K.; Martinenas, S.; Andersen, P.B.; Zecchino, A.; Marinelli, M. Enhancing the Role of Electric Vehicles in the Power Grid: Field Validation of Multiple Ancillary Services. IEEE Trans. Transp. Electr. 2016, 99. [Google Scholar] [CrossRef]
- Ko, K.; Han, S.; Sung, D.K. A New Mileage Payment for EV Aggregators with Varying Delays in Frequency Regulation Service. IEEE Trans. Smart Grid 2016, 99. [Google Scholar] [CrossRef]
- You, S.; Hu, J.; Pedersen, A.B.; Andersen, P.B.; Rasmussen, C.N. Numerical comparison of optimal charging schemes for electric vehicles. In Proceedings of the 2012 IEEE Power and Energy Society General Meeting (IEEPES ′12), San Diego, CA, USA, 22–26 July 2012; pp. 1–6.
- He, Y.; Venkatesh, B.; Guan, L. Optimal scheduling for charging and discharging of electric vehicles. IEEE Trans. Smart Grid 2012, 3, 1095–1105. [Google Scholar] [CrossRef]
- Zheng, J.; Wang, X.; Men, K.; Zhu, C.; Zhu, S. Aggregation model-based optimization for electric vehicle charging strategy. IEEE Trans. Smart Grid 2013, 4, 1058–1066. [Google Scholar] [CrossRef]
- Škugor, B.; Deur, J. A novel model of electric vehicle fleet aggregate battery for energy planning studies. Energy 2015, 92, 444–455. [Google Scholar] [CrossRef]
- Ortega-Vazquez, M.A. Optimal scheduling of electric vehicle charging and vehicle-to-grid services at household level including battery degradation and price uncertainty. IET Gener. Transm. Distrib. 2014, 8, 1007–1016. [Google Scholar] [CrossRef]
- Al-Alawi, B.M.; Bradley, T.H. Review of hybrid, plug-in hybrid, and electric vehicle market modeling studies. Renew. Sustain. Energy Rev. 2013, 21, 190–203. [Google Scholar] [CrossRef]
- Vagropoulos, S.I.; Bakirtzis, A.G. Optimal bidding strategy for electric vehicle aggregators in electricity markets. IEEE Trans. Power Syst. 2013, 28, 4031–4041. [Google Scholar] [CrossRef]
- Di Giorgio, A.; Liberati, F.; Canale, S. Electric vehicles charging control in a smart grid: A model predictive control approach. Control Eng. Pract. 2014, 22, 147–162. [Google Scholar] [CrossRef]
- Bessa, R.J.; Soares, F.J.; Lopes, J.P.; Matos, M.A. Models for the EV aggregation agent business. In Proceedings of the IEEE PowerTech, Trondheim, Norway, 19–23 June 2011; pp. 1–8.
- González Vayá, M.; Andersson, G. Optimal Bidding Strategy of a Plug-In Electric Vehicle Aggregator in Day-Ahead Electricity Markets Under Uncertainty. IEEE Trans. Power Syst. 2015, 30, 2375–2385. [Google Scholar] [CrossRef]
- Pillai, J.R.; Bak-Jensen, B. Integration of vehicle-to-grid in the western Danish power system. IEEE Trans. Sustain. Energy 2011, 2, 12–19. [Google Scholar] [CrossRef]
- Izadkhast, S.; Garcia-Gonzalez, P.; Frías, P. An aggregate model of plug-in electric vehicles for primary frequency control. IEEE Trans. Power Syst. 2015, 30, 1475–1482. [Google Scholar] [CrossRef]
- Izadkhast, S.; Garcia-Gonzalez, P.; Frìas, P.; Ramìrez-Elizondo, L.; Bauer, P. An aggregate model of plug-in electric vehicles including distribution network characteristics for primary frequency control. IEEE Trans. Power Syst. 2016, 31, 2987–2998. [Google Scholar] [CrossRef]
- Liu, M.; Shi, Y.; Gao, H. Aggregation and Charging Control of PHEVs in Smart Grid: A Cyber–Physical Perspective. Proc. IEEE 2016, 104, 1071–1085. [Google Scholar] [CrossRef]
- Ma, Z.; Callaway, D.S.; Hiskens, I.A. Decentralized charging control of large populations of plug-in electric vehicles. IEEE Trans. Control Syst. Technol. 2013, 21, 67–78. [Google Scholar] [CrossRef]
- Liu, M.; Shi, Y. Model predictive control of aggregated heterogeneous second-order thermostatically controlled loads for ancillary services. IEEE Trans. Power Syst. 2016, 31, 1963–1971. [Google Scholar] [CrossRef]
- Barot, S.; Taylor, J.A. A concise, approximate representation of a collection of loads described by polytopes. Int. J. Electr. Power Energy Syst. 2017, 84, 55–63. [Google Scholar] [CrossRef]
- Trangbaek, K.; Bendtsen, J. Exact constraint aggregation with applications to smart grids and resource distribution. In Proceedings of the IEEE 51st IEEE Conference on Decision and Control (CDC 12′), Maui, HI, USA, 10–13 December 2012; pp. 4181–4186.
- Müller, F.L.; Sundström, O.; Szabó, J.; Lygeros, J. Aggregation of energetic flexibility using zonotopes. In Proceedings of the 2015 54th IEEE Conference on Decision and Control (CDC), Osaka, Japan, 15–18 December 2015; pp. 6564–6569.
- Ulbig, A.; Andersson, G. Analyzing operational flexibility of electric power systems. Int. J. Electr. Power Energy Syst. 2015, 72, 155–164. [Google Scholar] [CrossRef]
- Balmer, M.; Axhausen, K.; Nagel, K. Agent-based demand-modeling framework for large-scale microsimulations. Transp. Res. Record J. Transp. Res. Board 2006, 1985, 125–134. [Google Scholar] [CrossRef]
- Yang, T.; Xu, X. EV Charging Behavior Analysis and Modeling Based on Wireless Sensor Network Data. In Proceedings of the IEEE Power and Energy Society General Meeting (PESGM 16’), Boston, MA, USA, 17–21 July 2016; pp. 1–6.
- Shao, C.; Wang, X.; Wang, X.; Du, C.; Wang, B. Hierarchical charge control of large populations of EVs. IEEE Trans. Smart Grid 2016, 7, 1147–1155. [Google Scholar] [CrossRef]
- Bessa, R.J.; Matos, M.A. Global against divided optimization for the participation of an EV aggregator in the day-ahead electricity market. Part I: Theory. Electr. Power Syst. Res. 2013, 95, 309–318. [Google Scholar] [CrossRef]
- Bessa, R.J.; Matos, M.A. Global against divided optimization for the participation of an EV aggregator in the day-ahead electricity market. Part II: Numerical analysis. Electr. Power Syst. Res. 2013, 95, 319–329. [Google Scholar] [CrossRef]
- Stenfan, U.; Fabian, L.; Pedro, A.; Stephane, R. EV stochastic sampling: Addressing limited geographic areas. In Proceedings of the 23rd International Conference and Exhibition on Electricity Distribution (CIRED 15′), Lyon, France, 15–18 June 2015; pp. 1–6.
- Soares, F.J.; Lopes, J.P.; Almeida, P.R.; Moreira, C.L.; Seca, L. A stochastic model to simulate electric vehicles motion and quantify the energy required from the grid. In Proceedings of the Power Systems Computation Conference (PSCC), Stockholm, Sweden, 22–26 August 2011; pp. 1–6.
- Farkas, C.; Szabó, K.I.; Prikler, L. Impact assessment of electric vehicle charging on a LV distribution system. In Proceedings of the IEEE 3rd International Youth Conference on Energetics, Leiria, Portugal, 7–9 July 2011; pp. 1–8.
- Rassaei, F.; Soh, W.S.; Chua, K.C. A Statistical modelling and analysis of residential electric vehicles’ charging demand in smart grids. In Proceedings of the IEEE Innovative Smart Grid Technologies Conference (ISGT 15′), Washington, DC, USA, 17–20 February 2015; pp. 1–5.
- Bessa, R.J.; Matos, M.A. Optimization models for EV aggregator participation in a manual reserve market. IEEE Trans. Power Syst. 2013, 28, 3085–3095. [Google Scholar] [CrossRef]
- Borges, N.; Soares, J.; Vale, Z. Fuzzy-Probabilistic Estimation of the Electric Vehicles Energy Consumption. In Proceedings of the Mexican International Conference on Artificial Intelligence, Cancún, Mexico, 23–29 October 2015; pp. 26–36.
- Masuta, T.; Yokoyama, A. Supplementary load frequency control by use of a number of both electric vehicles and heat pump water heaters. IEEE Trans. Smart Grid 2012, 3, 1253–1262. [Google Scholar] [CrossRef]
- Galus, M.D.; Koch, S.; Andersson, G. Provision of load frequency control by PHEVs, controllable loads, and a cogeneration unit. IEEE Trans. Ind. Electron. 2011, 58, 4568–4582. [Google Scholar] [CrossRef]
- Battistelli, C.; Conejo, A.J. Optimal management of the automatic generation control service in smart user grids including electric vehicles and distributed resources. Electr. Power Syst. Res. 2014, 111, 22–31. [Google Scholar] [CrossRef]
- Kennel, F.; Görges, D.; Liu, S. Energy management for smart grids with electric vehicles based on hierarchical MPC. IEEE Trans. Ind. Inform. 2013, 9, 1528–1537. [Google Scholar] [CrossRef]
- Sundstrom, O.; Binding, C. Flexible charging optimization for electric vehicles considering distribution grid constraints. IEEE Trans. Smart Grid 2012, 3, 26–37. [Google Scholar] [CrossRef]
- Xu, Z.; Hu, Z.; Song, Y.; Zhao, W.; Zhang, Y. Coordination of PEVs charging across multiple aggregators. Appl. Energy 2014, 136, 582–589. [Google Scholar] [CrossRef]
- Mitra, P.; Venayagamoorthy, G.K. Wide area control for improving stability of a power system with plug-in electric vehicles. IET Gener. Transm. Distrib. 2010, 4, 1151–1163. [Google Scholar] [CrossRef]
- Mu, Y.; Wu, J.; Ekanayake, J.; Jenkins, N.; Jia, H. Primary frequency response from electric vehicles in the Great Britain power system. IEEE Trans. Smart Grid 2013, 4, 1142–1150. [Google Scholar] [CrossRef]
- Shafie-khah, M.; Moghaddam, M.P.; Sheikh-El-Eslami, M.K.; Rahmani-Andebili, M. Modeling of interactions between market regulations and behavior of plug-in electric vehicle aggregators in a virtual power market environment. Energy 2012, 40, 139–150. [Google Scholar] [CrossRef]
- Hu, J.; Morais, H.; Sousa, T.; Lind, M. Electric vehicle fleet management in smart grids: A review of services, optimization and control aspects. Renew. Sustain. Energy Rev. 2016, 56, 1207–1226. [Google Scholar] [CrossRef]
- Yang, Z.; Li, K.; Foley, A. Computational scheduling methods for integrating plug-in electric vehicles with power systems: A review. Renew. Sustain. Energy Rev. 2015, 51, 396–416. [Google Scholar] [CrossRef]
- Zenginis, I.; Vardakas, J.S.; Zorba, N.; Verikoukis, C.V. Analysis and quality of service evaluation of a fast charging station for electric vehicles. Energy 2016, 112, 669–678. [Google Scholar] [CrossRef]
- Eisner, J.; Funke, S.; Storandt, S. Optimal Route Planning for Electric Vehicles in Large Networks. In Proceedings of the 25th Conference on Artificial Intelligence (AAAI 11′), San Francisco, CA, USA, 7–11 August 2011; pp. 1–6.
- Baum, M.; Dibbelt, J.; Gemsa, A.; Wagner, D. Towards route planning algorithms for electric vehicles with realistic constraints. Comput. Sci. Res. Dev. 2016, 31, 105–109. [Google Scholar] [CrossRef]
- Luo, Y.; Zhu, T.; Wan, S.; Zhang, S.; Li, K. Optimal charging scheduling for large-scale EV (electric vehicle) deployment based on the interaction of the smart-grid and intelligent-transport systems. Energy 2016, 97, 359–368. [Google Scholar] [CrossRef]
- Hess, A.; Malandrino, F.; Reinhardt, M.B.; Casetti, C.; Hummel, K.A.; Barceló-Ordinas, J.M. Optimal deployment of charging stations for electric vehicular networks. In Proceedings of the First Workshop on Urban Networking, Nice, France, 10–13 December 2012; pp. 1–6.
- Bessa, R.J.; Matos, M.A.; Soares, F.J.; Lopes, J.A.P. Optimized bidding of a EV aggregation agent in the electricity market. IEEE Trans. Smart Grid 2012, 3, 443–452. [Google Scholar] [CrossRef]
- Gonzalez, V.M.; Baringo, L.; Krause, T. EV aggregation models for different charging scenarios. In Proceedings of the 23rd International Conference and Exhibition on Electricity Distribution (CIRED 15′), Lyon, France, 15–18 June 2015; pp. 1–6.
- Carrión, M.; Zárate-Miñano, R. Operation of renewable-dominated power systems with a significant penetration of plug-in electric vehicles. Energy 2015, 90, 827–835. [Google Scholar] [CrossRef]
- Hu, J.; You, S.; Lind, M.; Østergaard, J. Coordinated charging of electric vehicles for congestion prevention in the distribution grid. IEEE Trans. Smart Grid 2014, 5, 703–711. [Google Scholar] [CrossRef]
- Moradijoz, M.; Moghaddam, M.P.; Haghifam, M.R.; Alishahi, E. A multi-objective optimization problem for allocating parking lots in a distribution network. Int. J. Electr. Power Energy Syst. 2013, 46, 115–122. [Google Scholar] [CrossRef]
- Zakariazadeh, A.; Jadid, S.; Siano, P. Multi-objective scheduling of electric vehicles in smart distribution system. Energy Convers. Manag. 2014, 79, 43–53. [Google Scholar] [CrossRef]

 denotes further extension is possible).
denotes further extension is possible).
denotes further extension is possible).


© 2016 by the authors; licensee MDPI, Basel, Switzerland. This article is an open access article distributed under the terms and conditions of the Creative Commons Attribution (CC-BY) license (http://creativecommons.org/licenses/by/4.0/).
Share and Cite
You, S.; Hu, J.; Ziras, C. An Overview of Modeling Approaches Applied to Aggregation-Based Fleet Management and Integration of Plug-in Electric Vehicles †. Energies 2016, 9, 968. https://doi.org/10.3390/en9110968
You S, Hu J, Ziras C. An Overview of Modeling Approaches Applied to Aggregation-Based Fleet Management and Integration of Plug-in Electric Vehicles †. Energies. 2016; 9(11):968. https://doi.org/10.3390/en9110968
Chicago/Turabian StyleYou, Shi, Junjie Hu, and Charalampos Ziras. 2016. "An Overview of Modeling Approaches Applied to Aggregation-Based Fleet Management and Integration of Plug-in Electric Vehicles †" Energies 9, no. 11: 968. https://doi.org/10.3390/en9110968
APA StyleYou, S., Hu, J., & Ziras, C. (2016). An Overview of Modeling Approaches Applied to Aggregation-Based Fleet Management and Integration of Plug-in Electric Vehicles †. Energies, 9(11), 968. https://doi.org/10.3390/en9110968