
The Demand Side Management Potential to Balance a Highly Renewable European Power System

Abstract
:1. Introduction
2. Model Description
2.1. Generation and Load Data
2.2. Demand Side Management
- (i)
- Compute the ratio of the power limit to remaining energy storage for each category
- (ii)
- Compute the DSM charging rate of category c with the lowest ratiois the sum of charging rates of all categories with a lower ratio than c. For the category with the lowest ratio, it equals zero.
- (iii)
- Compute the storage filling level of category c for the next time step
- (iv)
- Repeat steps (ii) and (iii) for the category with the next lowest ratio until the storage filling level for all categories was computed.
- (v)
- Finally, compute the total interaction with the DSM storage at node n, , via
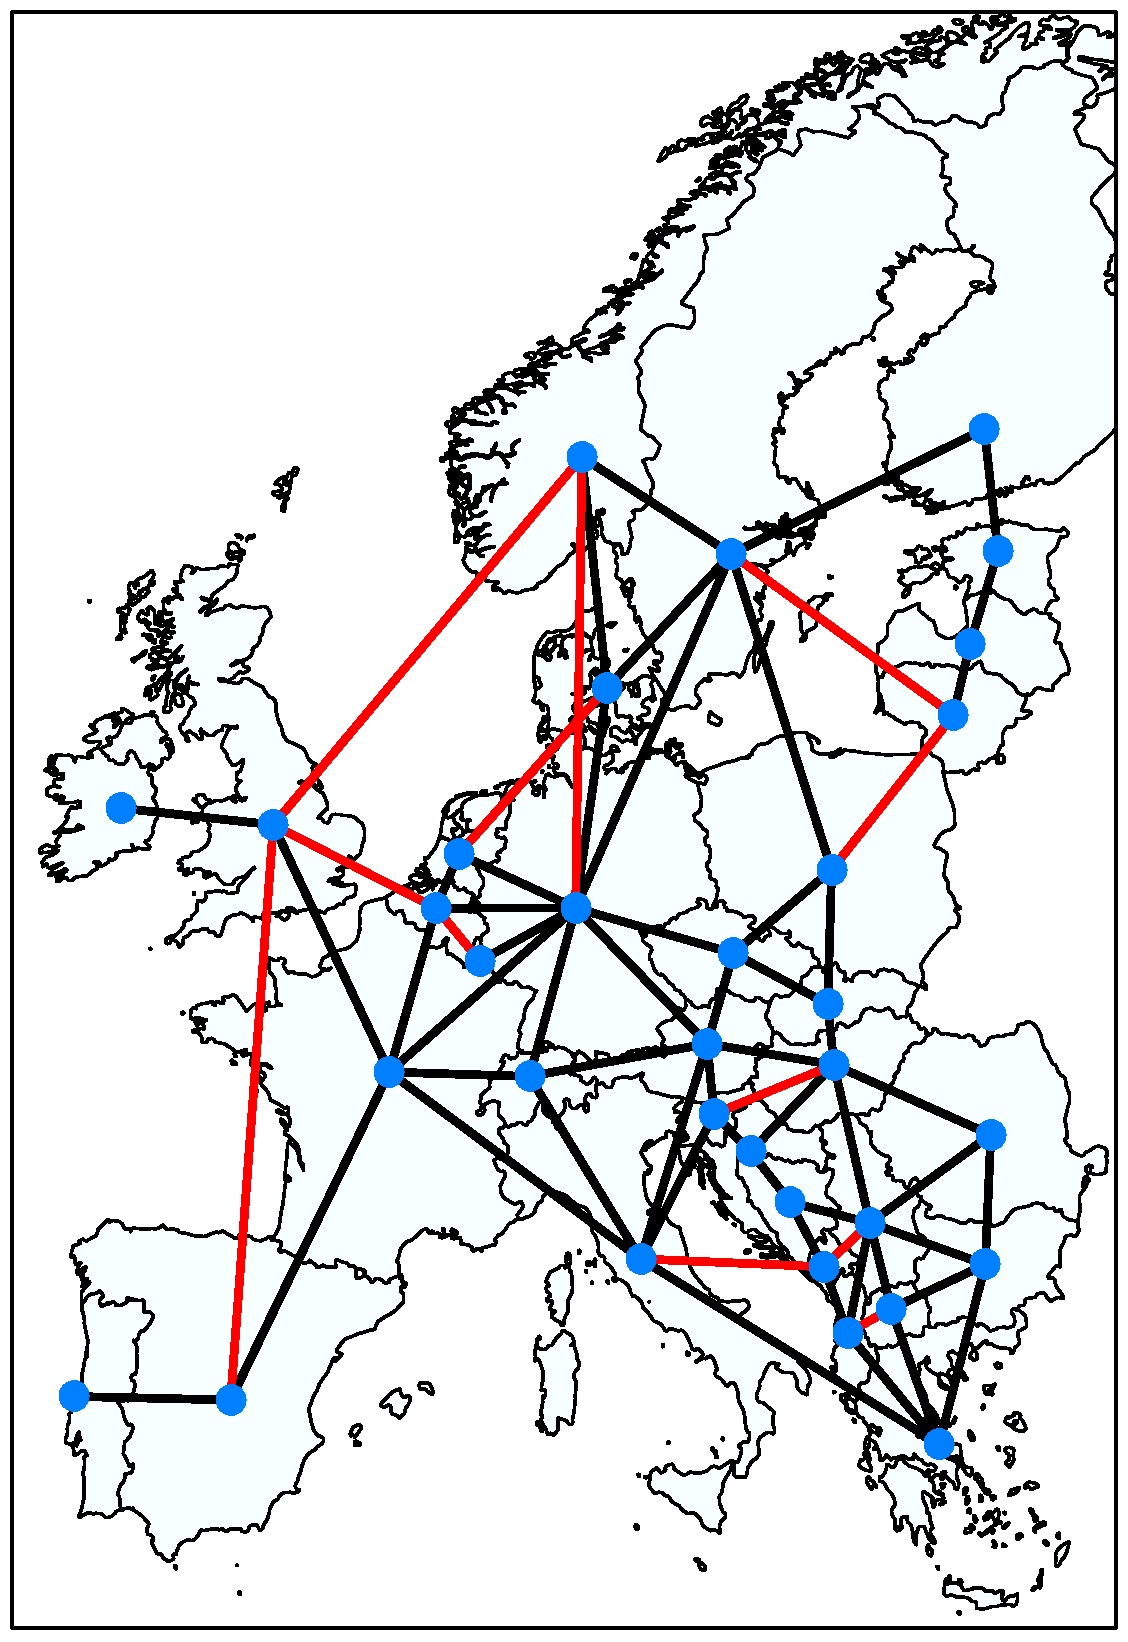
2.3. Transmission
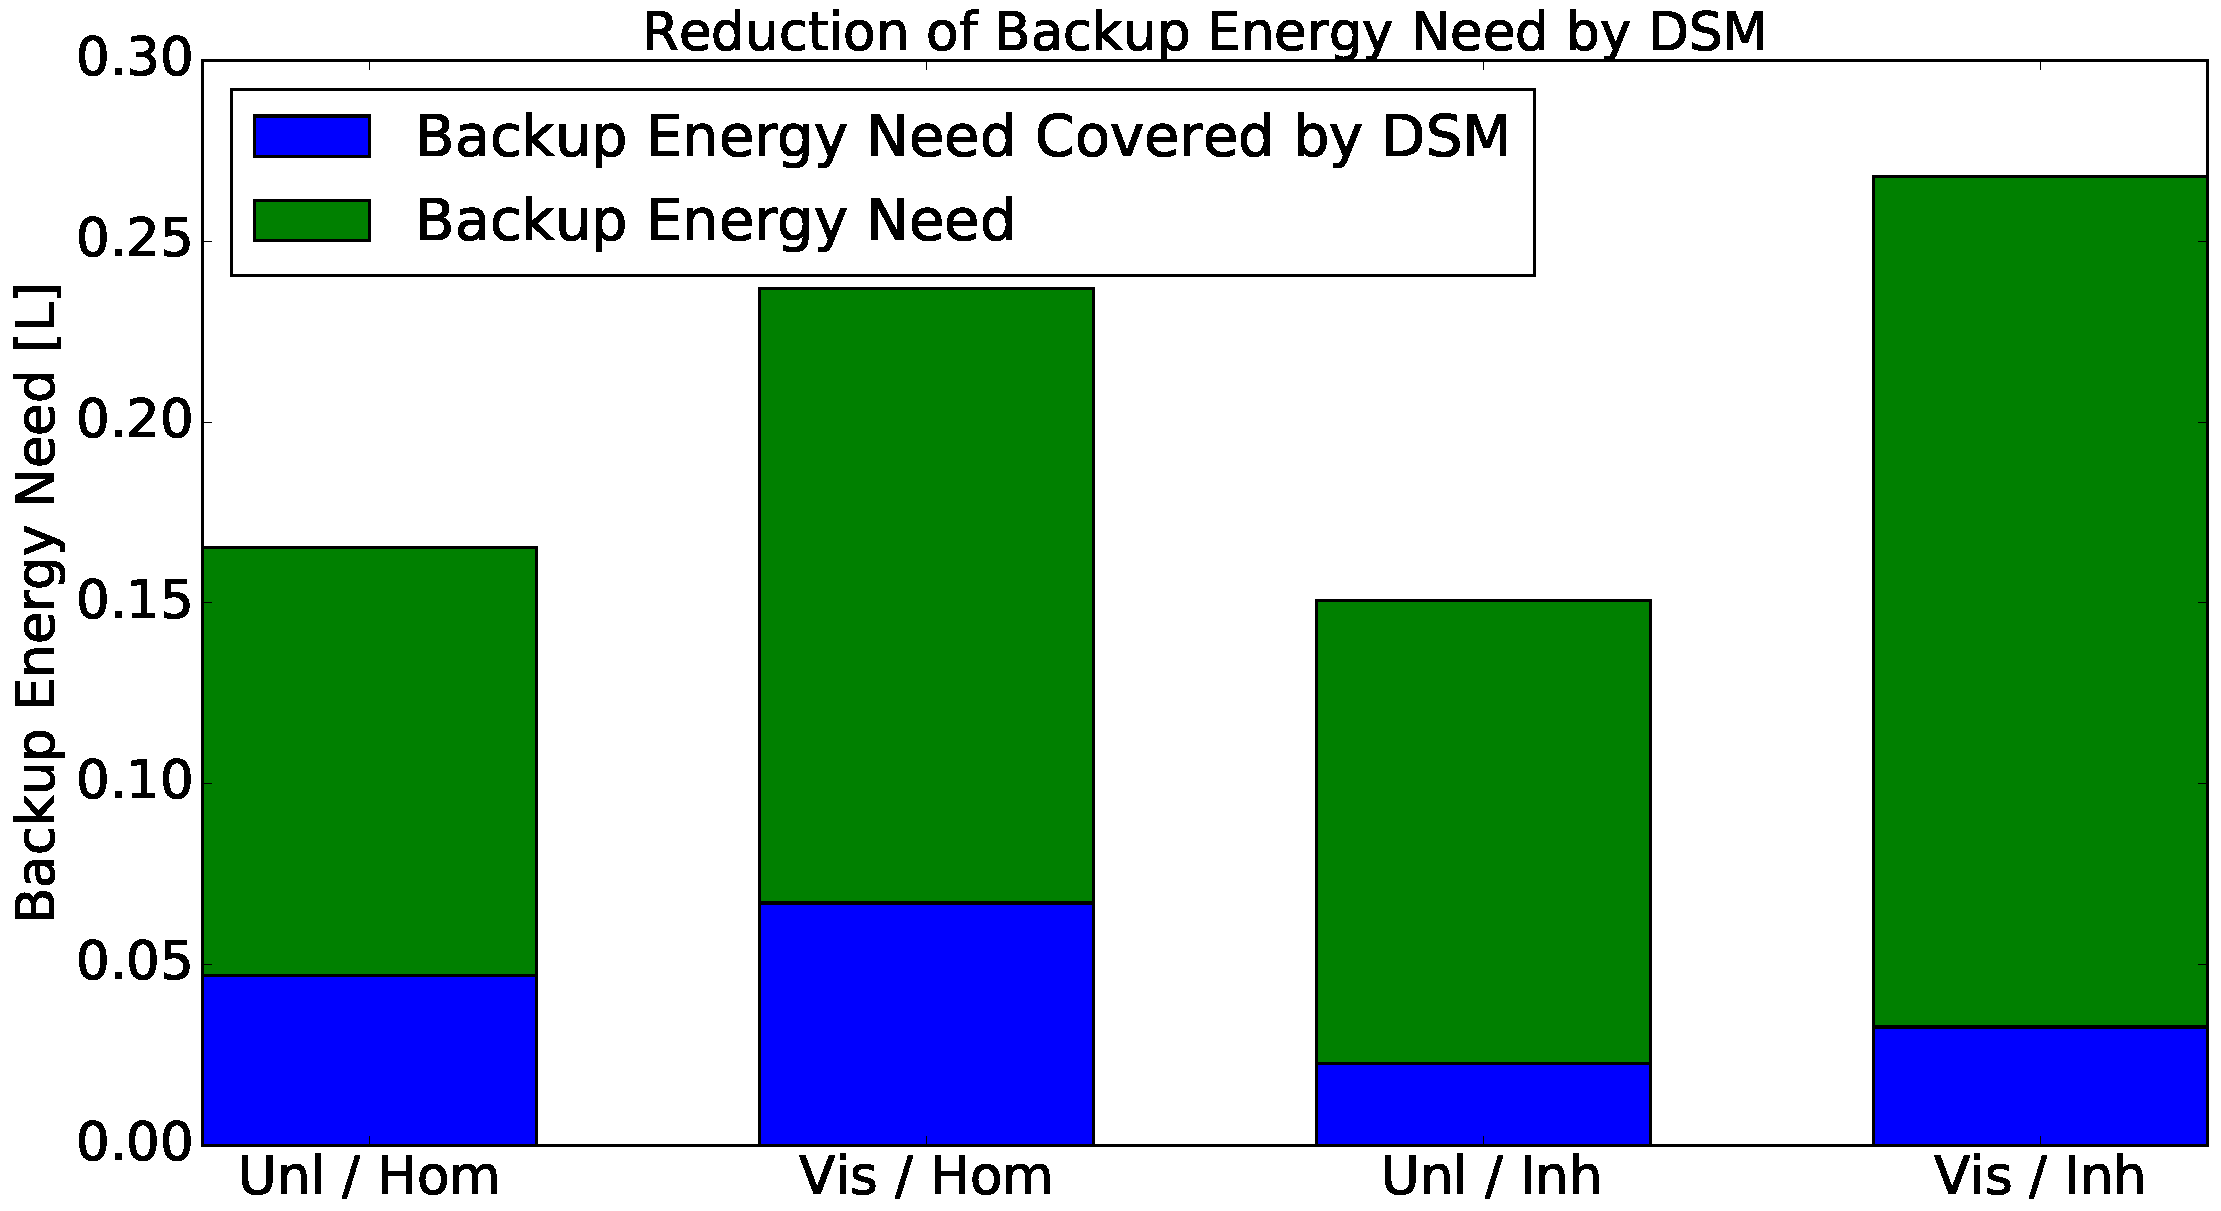
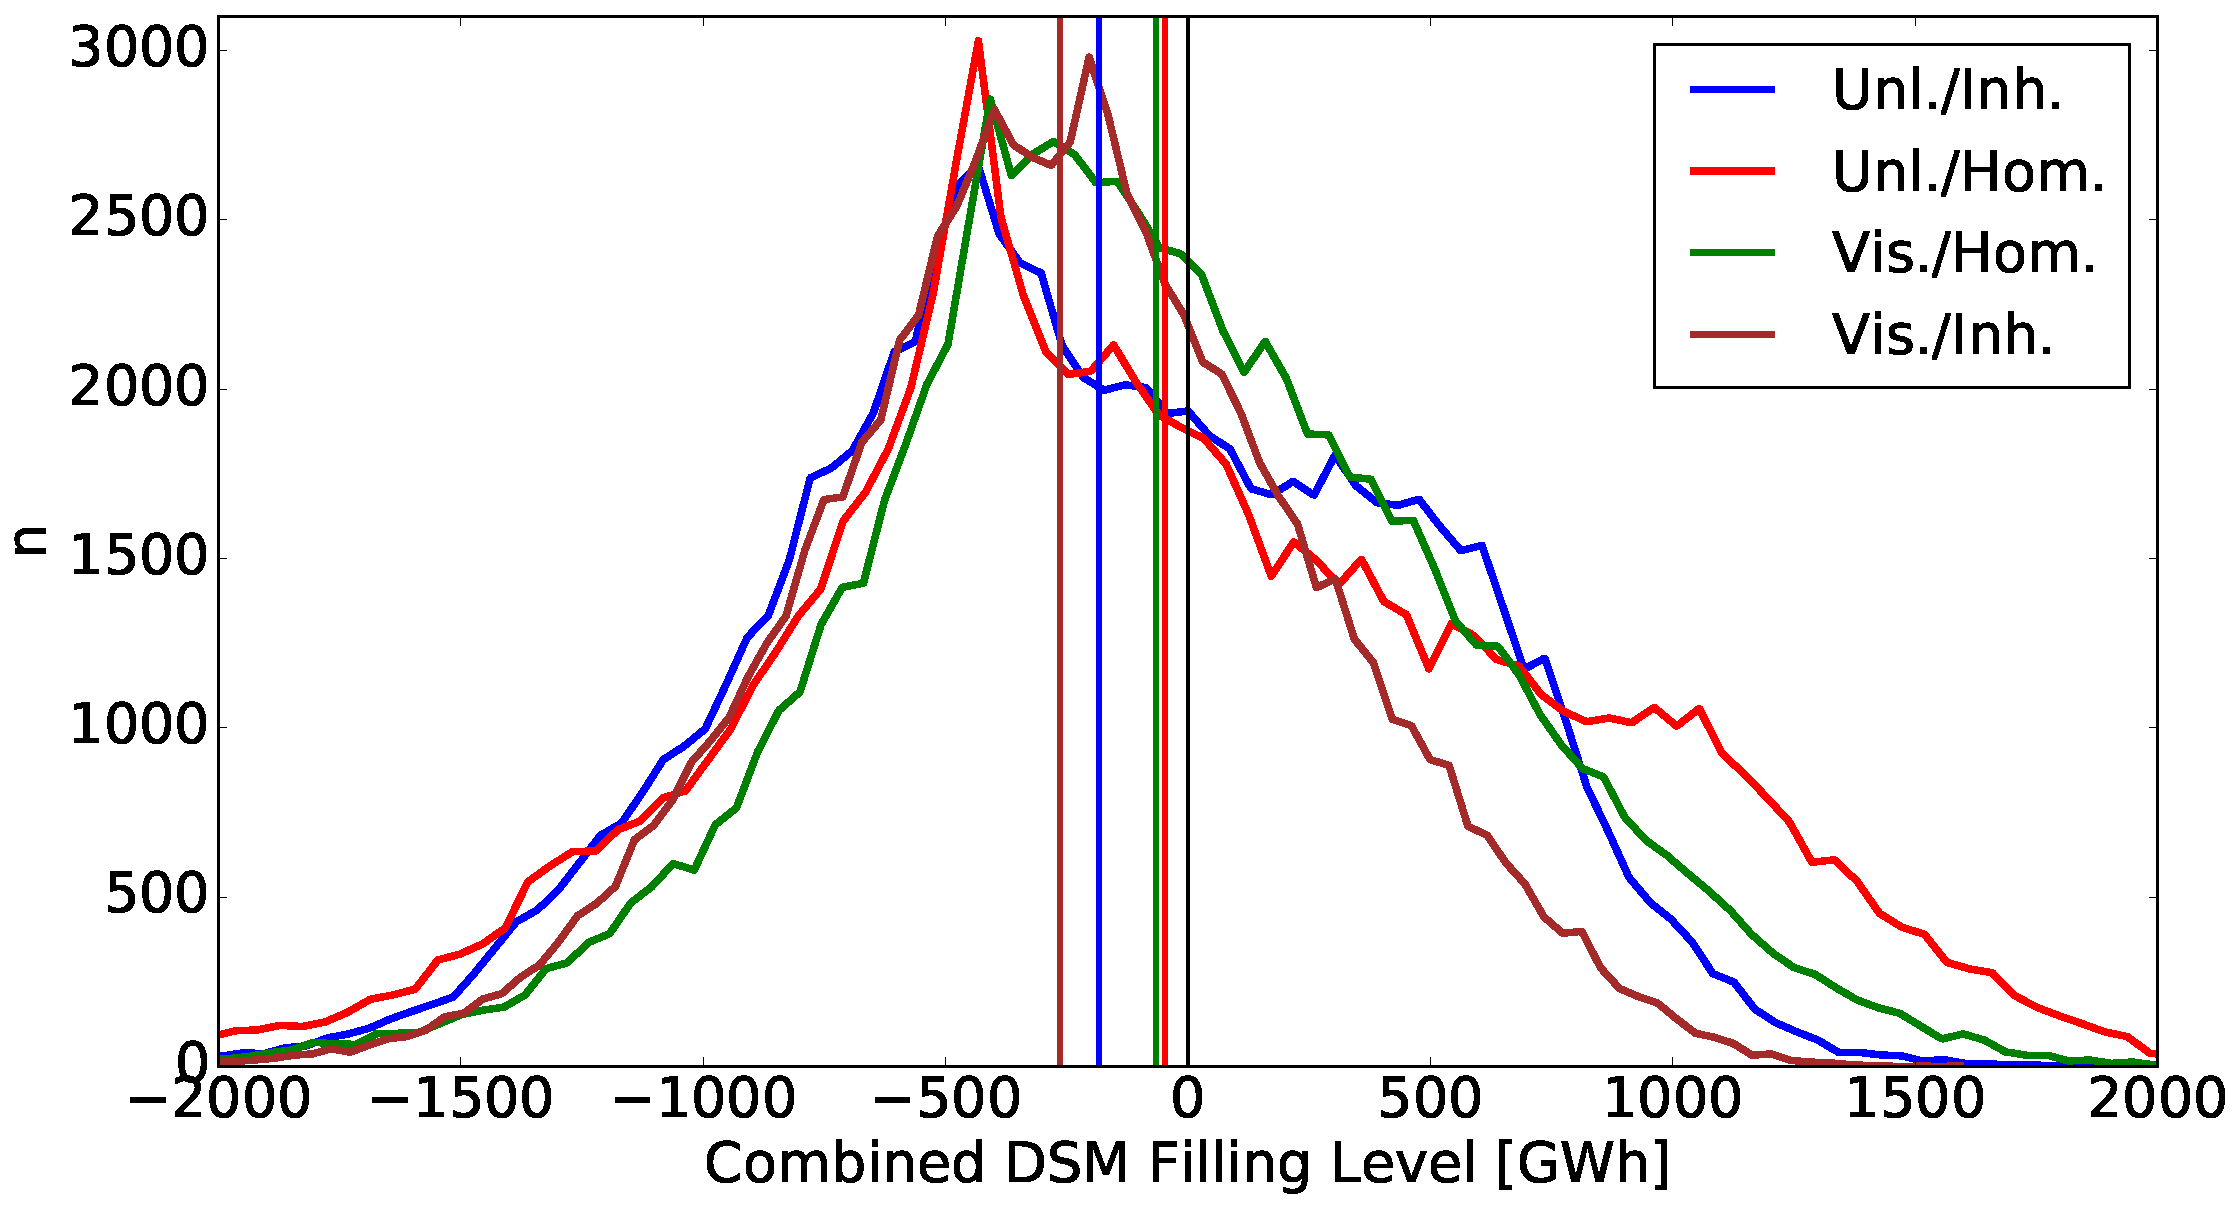
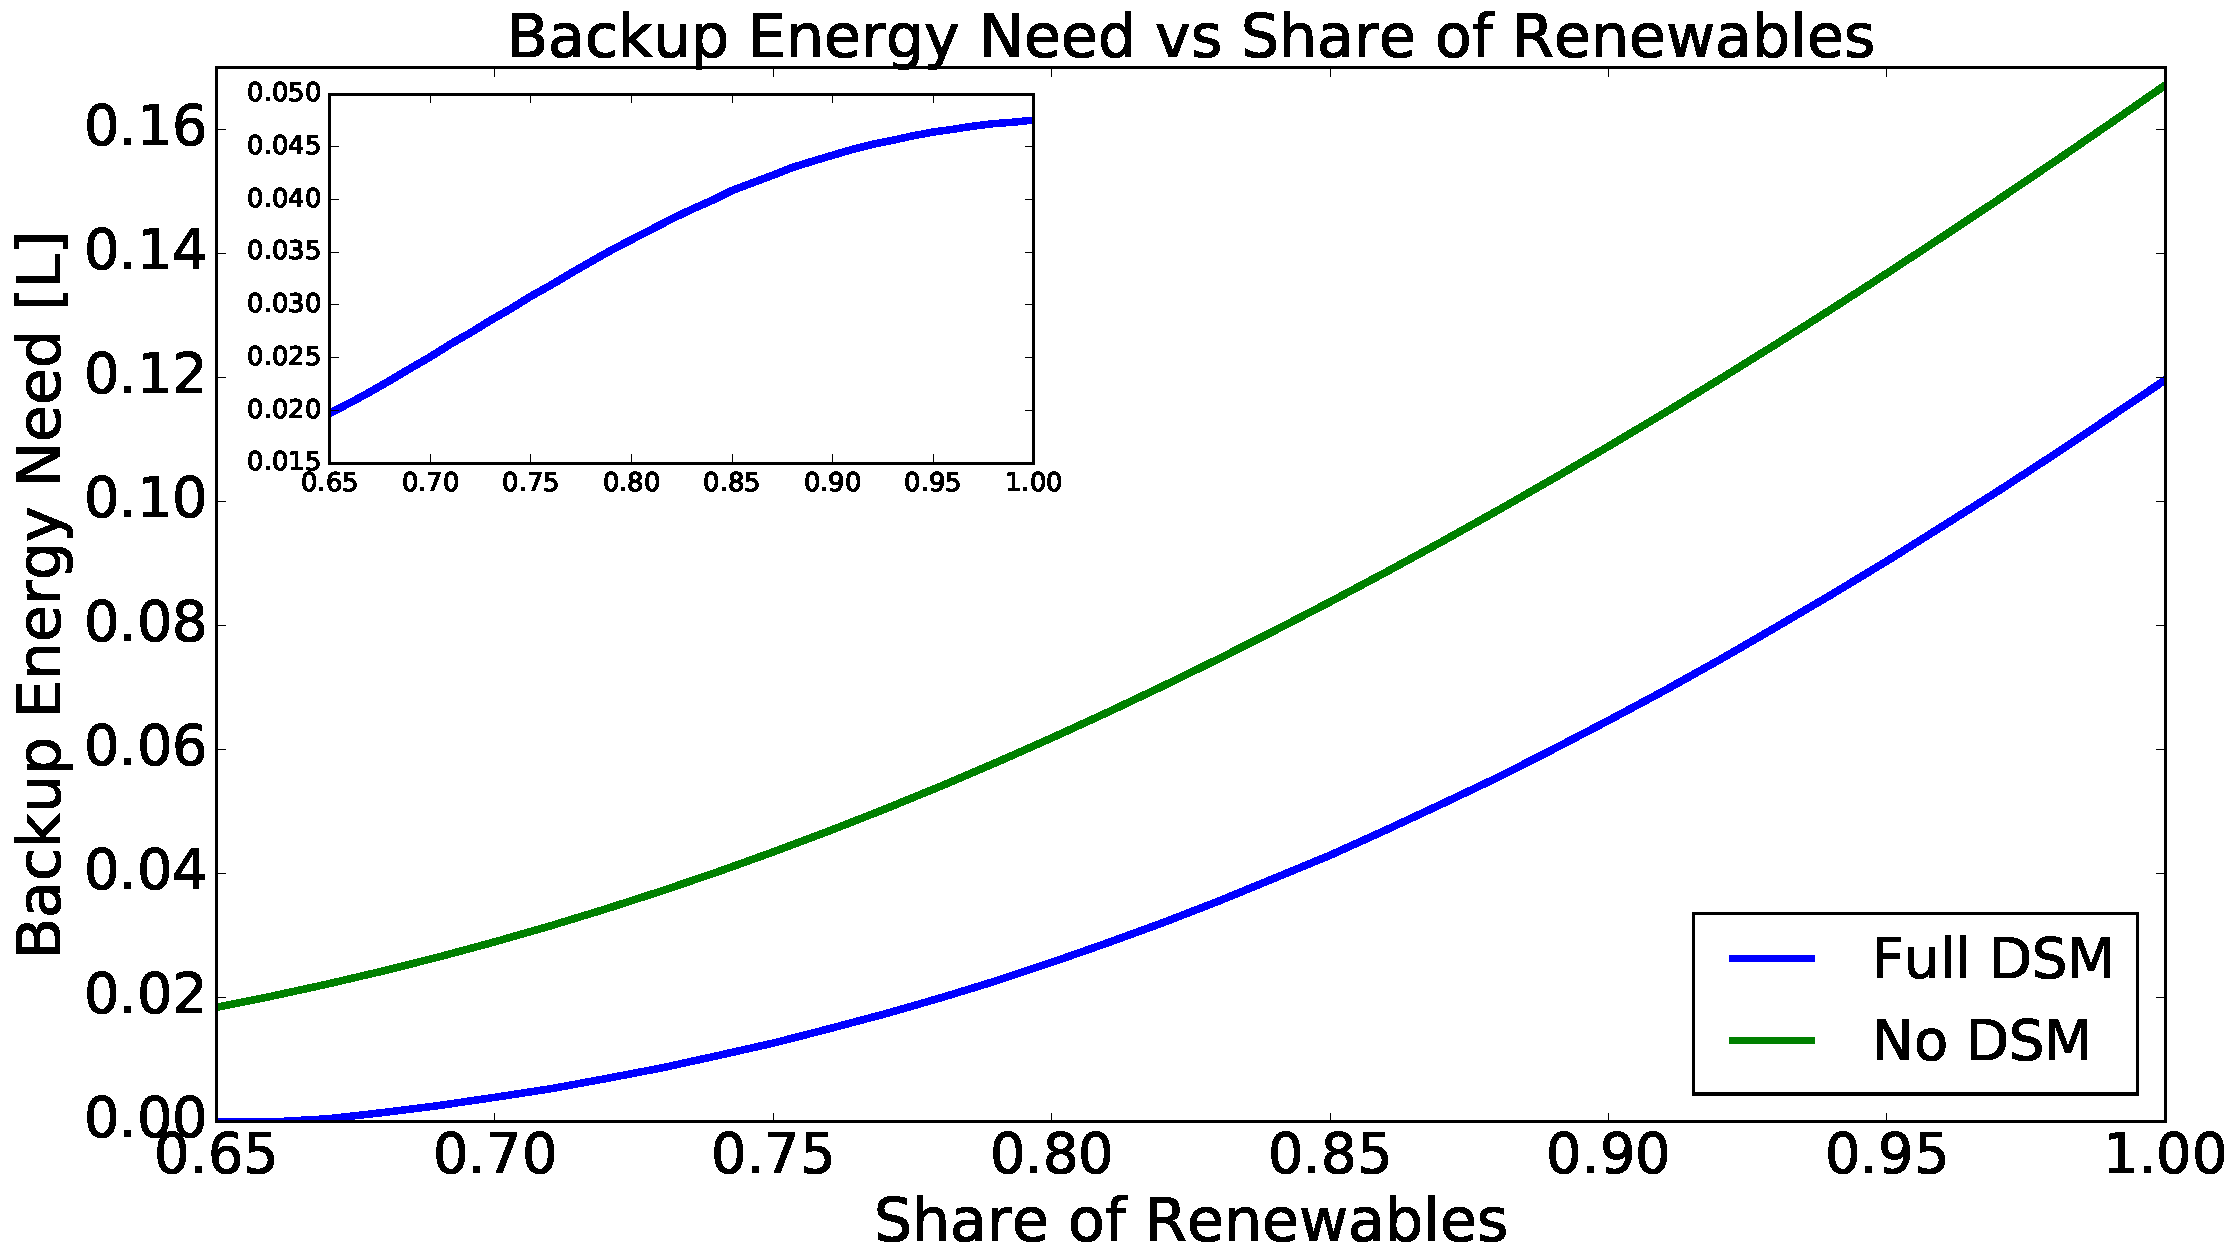
3. The Impact of DSM on Backup Energy Need
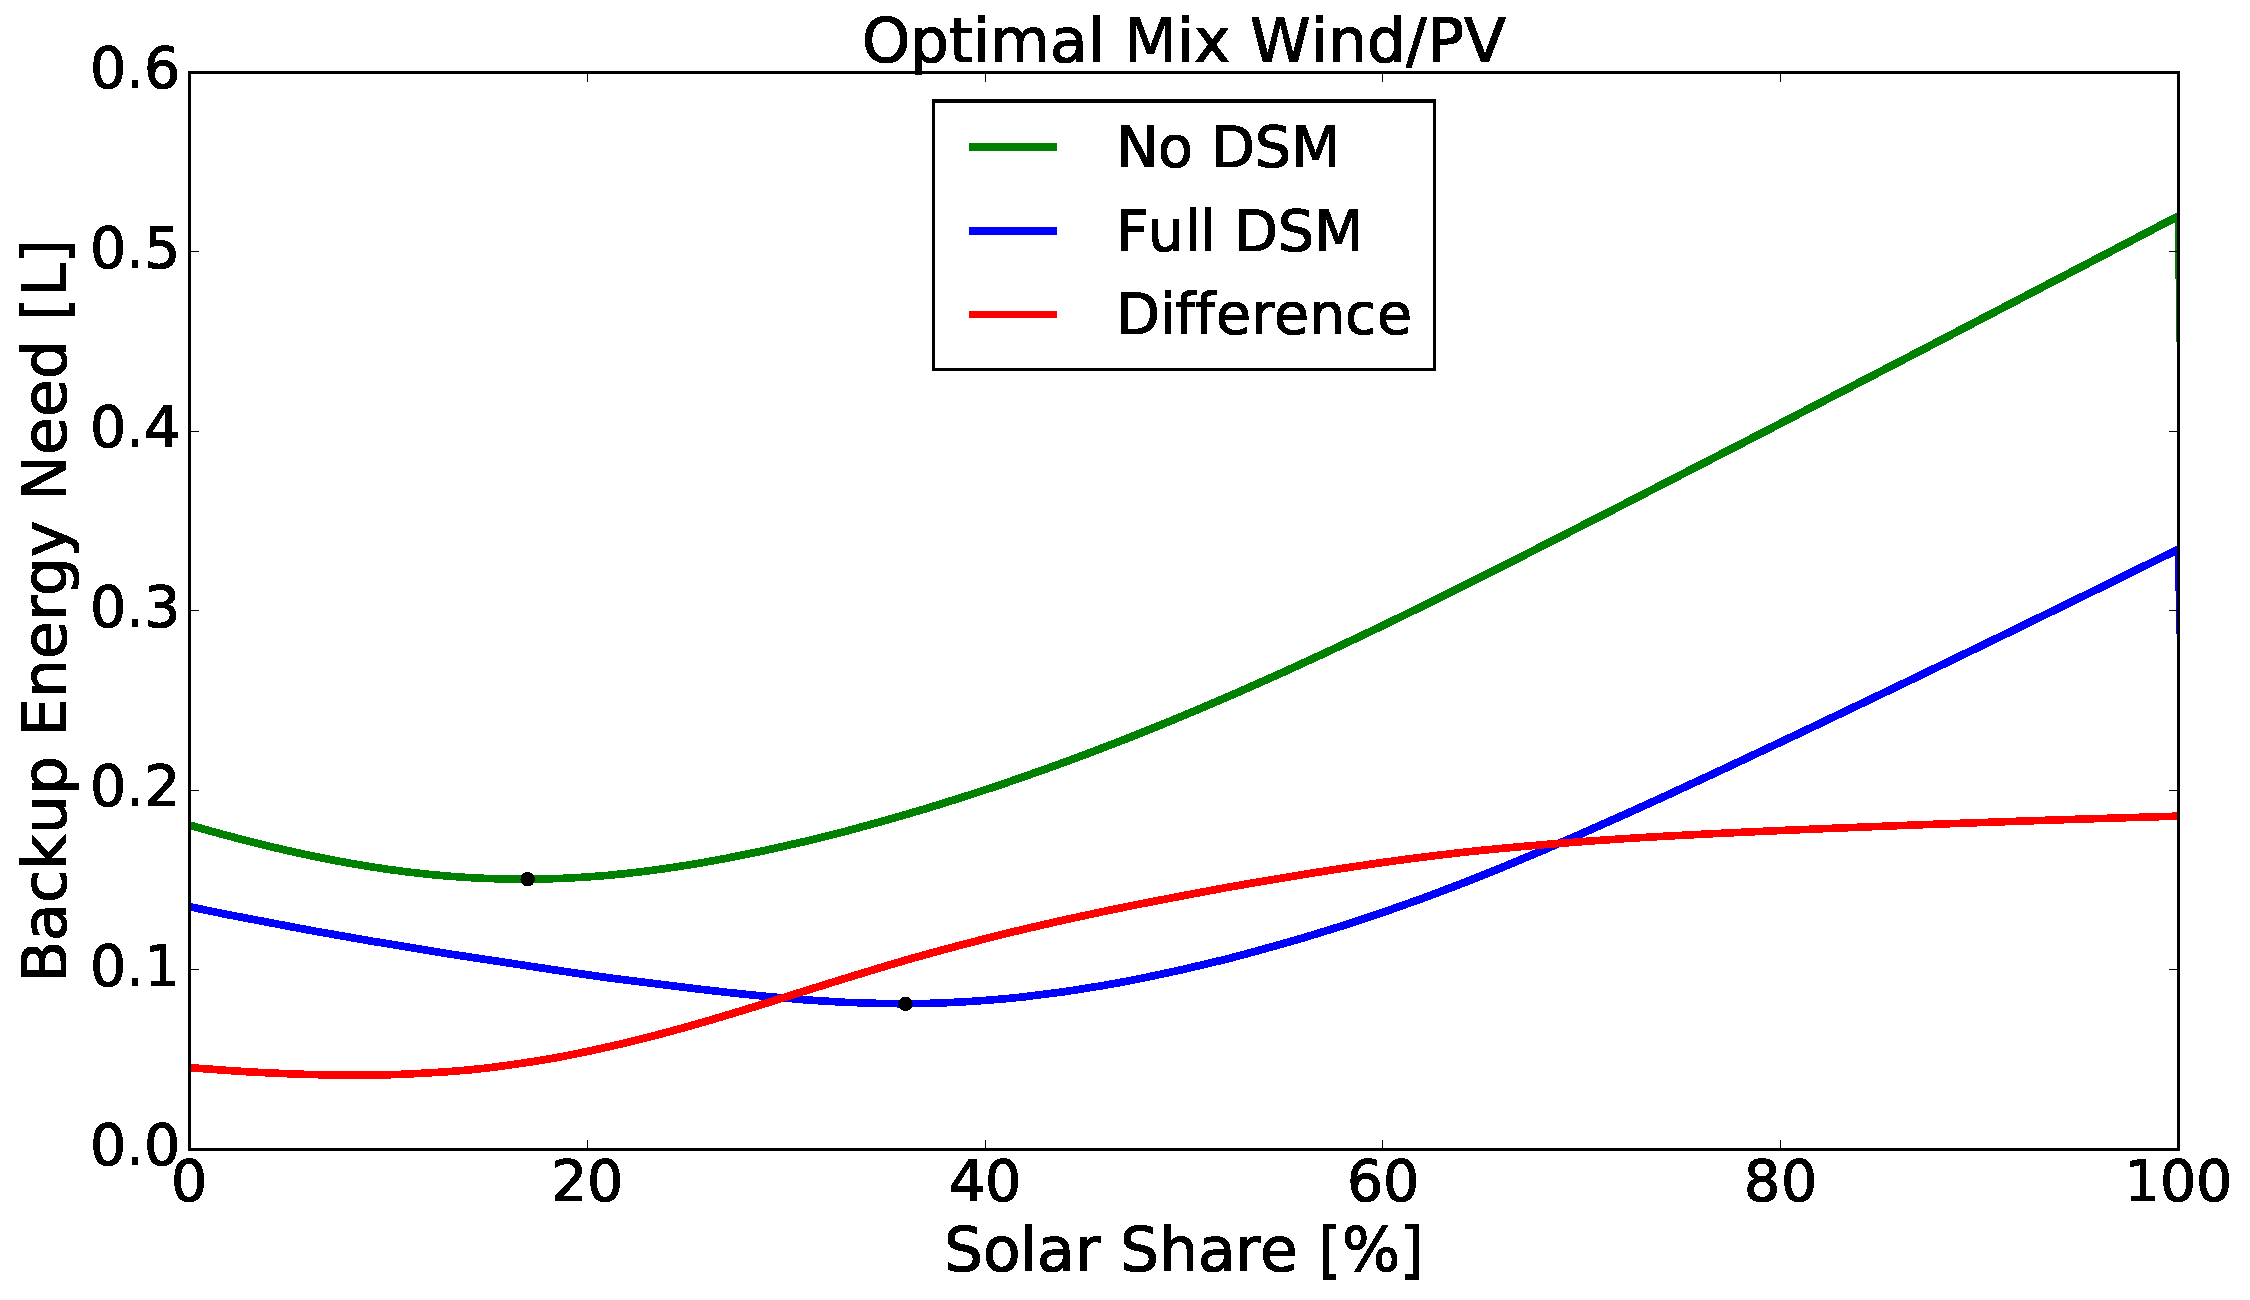
4. Influence of DSM on the Optimal Mix of Wind and PV
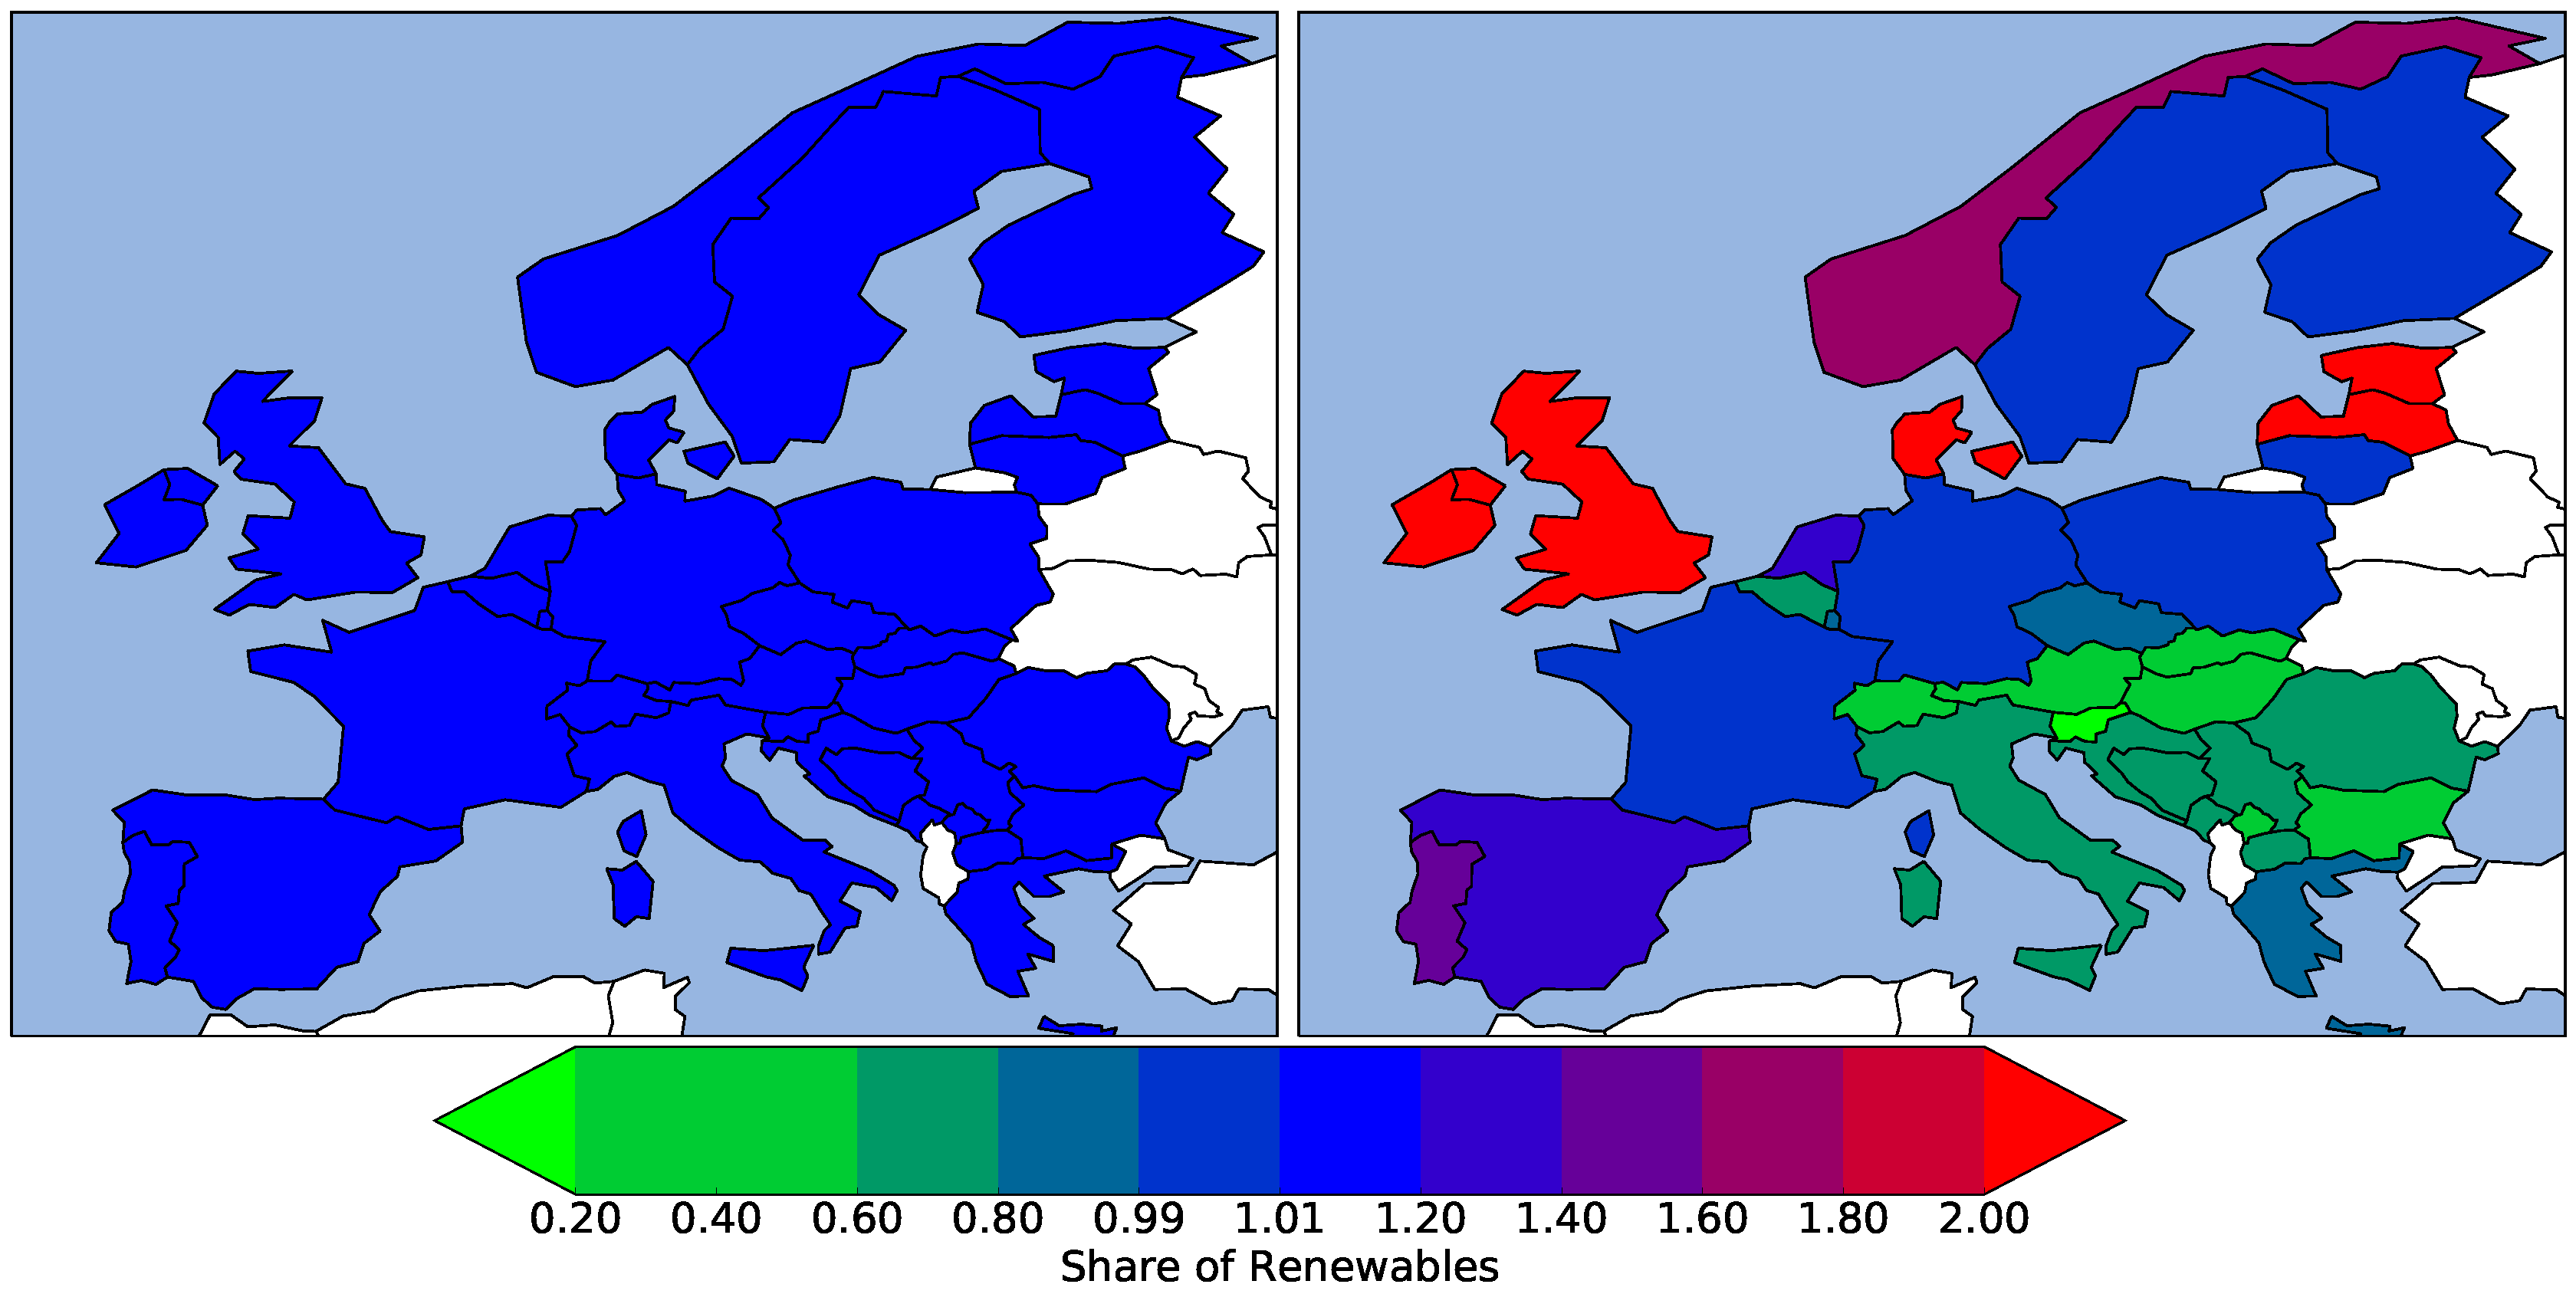
5. DSM Potential vs. Share of Renewables
6. Conclusions
Acknowledgments
Author Contributions
Conflicts of Interest
Abbreviations
| European country/node of the network | |
| generation time series from renewable sources of wind and PV of country n | |
| scheduled load time series of country n | |
| generation-load mismatch time series of country n | |
| injection pattern time series of country n | |
| backup time series of country n | |
| curtailment time series of country n | |
| DSM charging/discharging time series of country n | |
| DSM charging rate of country n and load category c | |
| backup energy need of country n | |
| share of renewables of country n | |
| realised load time series of country n | |
| time series of DSM storage energy limits | |
| time series of DSM power limits | |
| time series of DSM energy filling level | |
| K | incidence matrix of the network |
| L | Laplace matrix of the network |
| link transmission constraints in both directions |
References
- Lund, H. Large-scale integration of wind power into different energy systems. Energy 2005, 30, 2402–2412. [Google Scholar] [CrossRef]
- Lund, H. Large-scale integration of optimal combinations of PV, wind and wave power into the electricity supply. Renew. Energy 2006, 31, 503–515. [Google Scholar] [CrossRef]
- Heide, D.; von Bremen, L.; Greiner, M.; Hoffmann, C.; Speckmann, M.; Bofinger, S. Seasonal optimal mix of wind and solar power in a future, highly renewable Europe. Renew. Energy 2010, 35, 2483–2489. [Google Scholar] [CrossRef]
- François, B.; Hingray, B.; Raynaud, D.; Borga, M.; Creutin, J. Increasing climate-related-energy penetration by integrating run-of-the river hydropower to wind/solar mix. Renew. Energy 2016, 87, 686–696. [Google Scholar] [CrossRef]
- Kies, A.; Nag, K.; von Bremen, L.; Lorenz, E.; Heinemann, D. Investigation of balancing effects in long term renewable energy feed-in with respect to the transmission grid. Adv. Sci. Res. 2015, 12, 91–95. [Google Scholar] [CrossRef]
- Santos-Alamillos, F.; Pozo-Vázquez, D.; Ruiz-Arias, J.; Von Bremen, L.; Tovar-Pescador, J. Combining wind farms with concentrating solar plants to provide stable renewable power. Renew. Energy 2015, 76, 539–550. [Google Scholar] [CrossRef]
- Tafarte, P.; Das, S.; Eichhorn, M.; Thrän, D. Small adaptations, big impacts: Options for an optimized mix of variable renewable energy sources. Energy 2014, 72, 80–92. [Google Scholar] [CrossRef]
- Kies, A.; Schyska, B.U.; von Bremen, L. The optimal share of wave power in a highly renewable power system on the Iberian Peninsula. Energy Rep. 2016, 2, 221–228. [Google Scholar] [CrossRef]
- Weitemeyer, S.; Kleinhans, D.; Vogt, T.; Agert, C. Integration of renewable energy sources in future power systems: The role of storage. Renew. Energy 2015, 75, 14–20. [Google Scholar] [CrossRef]
- Weitemeyer, S.; Kleinhans, D.; Wienholt, L.; Vogt, T.; Agert, C. A European perspective: Potential of grid and storage for balancing renewable power systems. Energy Technol. 2015, 4, 114–122. [Google Scholar] [CrossRef]
- Heide, D.; Greiner, M.; von Bremen, L.; Hoffmann, C. Reduced storage and balancing needs in a fully renewable European power system with excess wind and solar power generation. Renew. Energy 2011, 36, 2515–2523. [Google Scholar] [CrossRef]
- Huber, M.; Dimkova, D.; Hamacher, T. Integration of wind and solar power in Europe: Assessment of flexibility requirements. Energy 2014, 69, 236–246. [Google Scholar] [CrossRef]
- Schlachtberger, D.; Becker, S.; Schramm, S.; Greiner, M. Backup flexibility classes in emerging large-scale renewable electricity systems. Energy Convers. Manag. 2016, 125, 336–346. [Google Scholar] [CrossRef]
- Becker, S.; Rodriguez, R.; Andresen, G.; Schramm, S.; Greiner, M. Transmission grid extensions during the build-up of a fully renewable Pan-European electricity supply. Energy 2014, 64, 404–418. [Google Scholar] [CrossRef]
- Brown, T. Transmission network loading in Europe with high shares of renewables. IET Renew. Power Gener. 2015, 9, 57–65. [Google Scholar] [CrossRef]
- Rabl, V.A.; Gellings, C.W. The concept of demand-side management. In Demand-Side Management and Electricity End-Use Efficiency; Springer: Heidelberg, Germany, 1988; pp. 99–112. [Google Scholar]
- Strbac, G. Demand side management: Benefits and challenges. Energy Policy 2008, 36, 4419–4426. [Google Scholar] [CrossRef]
- Diamond, A.P. Energy Glossary; Nova Science Publishers: New York, NY, USA, 2002. [Google Scholar]
- Atzeni, I.; Ordóñez, L.G.; Scutari, G.; Palomar, D.P.; Fonollosa, J.R. Demand-side management via distributed energy generation and storage optimization. IEEE Trans. Smart Grid 2013, 4, 866–876. [Google Scholar] [CrossRef]
- Stötzer, M.; Gronstedt, P.; Styczynski, Z. Demand side management potential-A case study for Germany. In Proceedings of the 21st International Conference on Electricity Distribution, Frankfurt, Germany, 6–9 June 2011.
- Paulus, M.; Borggrefe, F. The potential of demand-side management in energy-intensive industries for electricity markets in Germany. Appl. Energy 2011, 88, 432–441. [Google Scholar] [CrossRef]
- Mesarić, P.; Krajcar, S. Home demand side management integrated with electric vehicles and renewable energy sources. Energy Build. 2015, 108, 1–9. [Google Scholar] [CrossRef]
- Emec, S.; Kuschke, M.; Chemnitz, M.; Strunz, K. Potential for demand side management in automotive manufacturing. In Proceedings of the 2013 4th IEEE/PES Innovative Smart Grid Technologies Europe (ISGT EUROPE), Lyngby, Denmark, 6–9 October 2013; IEEE: Piscataway, NJ, USA; pp. 1–5.
- Klobasa, M. Analysis of demand response and wind integration in Germany’s electricity market. IET Renew. Power Gener. 2010, 4, 55–63. [Google Scholar] [CrossRef]
- Lund, H.; Kempton, W. Integration of renewable energy into the transport and electricity sectors through V2G. Energy Policy 2008, 36, 3578–3587. [Google Scholar] [CrossRef]
- Stadler, I. Power grid balancing of energy systems with high renewable energy penetration by demand response. Util. Policy 2008, 16, 90–98. [Google Scholar] [CrossRef]
- Moura, P.S.; De Almeida, A.T. The role of demand-side management in the grid integration of wind power. Appl. Energy 2010, 87, 2581–2588. [Google Scholar] [CrossRef]
- Pollhammer, K.; Kupzog, F.; Gamauf, T.; Kremen, M. Modeling of demand side shifting potentials for smart power grids. In Proceedings of the 2011 AFRICON, Livingstone, Zambia, 13–15 September 2011; IEEE: Piscataway, NJ, USA, 2011; pp. 1–5. [Google Scholar]
- Palensky, P.; Dietrich, D. Demand side management: Demand response, intelligent energy systems, and smart loads. IEEE Trans. Ind. Inform. 2011, 7, 381–388. [Google Scholar] [CrossRef]
- Göransson, L.; Goop, J.; Unger, T.; Odenberger, M.; Johnsson, F. Linkages between demand-side management and congestion in the European electricity transmission system. Energy 2014, 69, 860–872. [Google Scholar] [CrossRef]
- Zerrahn, A.; Schill, W.P. On the representation of demand-side management in power system models. Energy 2015, 84, 840–845. [Google Scholar] [CrossRef] [Green Version]
- Tröster, E.; Kuwahata, R.; Ackermann, T. European Grid Study 2030/2050; Greenpeace International: Langen, Germany, 18 January 2011. [Google Scholar]
- Kohler, S.; Agricola, A.; Seidl, H. Dena Grid Study IIe—Integration of Renewable Energy Sources in the German Power Supply System from 2015–2020 with an Outlook to 2025; Deutsche Energie-Agentur (dena), German Energy Agency: Berlin, Germany, 2010. [Google Scholar]
- Kleinhans, D. Towards a systematic characterization of the potential of demand side management. 2014. [Google Scholar]
- Rienecker, M.M.; Suarez, M.J.; Gelaro, R.; Todling, R.; Bacmeister, J.; Liu, E.; Bosilovich, M.G.; Schubert, S.D.; Takacs, L.; Kim, G.K.; et al. MERRA: NASA’s modern-era retrospective analysis for research and applications. J. Clim. 2011, 24, 3624–3648. [Google Scholar] [CrossRef]
- Cano, D.; Monget, J.; Albuisson, M.; Guillard, H.; Regas, N.; Wald, L. A method for the determination of the global solar radiation from meteorological satellite data. Sol. Energy 1986, 37, 31–39. [Google Scholar] [CrossRef]
- Hammer, A.; Heinemann, D.; Westerhellweg, A. Derivation of daylight and solar irradiance data from satellite observations. In Proceedings of the 9th Conference on Satellite Meteorology and Oceanography, Paris, France, 25–29 May 1998; pp. 747–750.
- Klucher, T. Evaluation of models to predict insolation on tilted surfaces. Sol. Energy 1979, 23, 111–114. [Google Scholar] [CrossRef]
- Kies, A.; Chattopadhyay, K.; von Bremen, L.; Lorenz, E.; Heinemann, D. Simulation of renewable feed-in for power system studies. In RESTORE 2050 Project Report; Technical Report; NEXT ENERGY-EWE-Forschungszentrum für Energietechnologie: Oldenburg, Germany, 2016. [Google Scholar]
- Meyer, K.; Kleinhans, D. Arbeitspaket 5: Lastmanagement charakterisierung und quantifizierung des lastmanagementpotentials fuer Europa. In Restore 2050; Technical Report; NEXT ENERGY—EWE-Forschungszentrum für Energietechnologie: Oldenburg, Germany, 2015. [Google Scholar]
- Oeding, D.; Oswald, B.R. Elektrische Kraftwerke und Netze; Springer: Berlin/Heidelberg, Germany, 2004; Volume 6. [Google Scholar]
- Heide, D. Statistical Physics of Power Flows on Networks with a High Share of Fluctuating Renewable Generation. Ph.D. Thesis, Johann Wolfgang Goethe-Universitaet Frankfurt am Main, Frankfurt, Germany, 2010. [Google Scholar]
- Rodriguez, R.A.; Becker, S.; Greiner, M. Cost-optimal design of a simplified, highly renewable pan-European electricity system. Energy 2015, 83, 658–668. [Google Scholar] [CrossRef]
- Kies, A.; von Bremen, L.; Chattopadhyay, K.; Lorenz, E.; Heinemann, D. Backup, storage and transmission estimates of a supra-European electricity grid with high shares of renewables. In Proceedings of the 14th Wind Integration Workshop, Brussels, Belgium, 20–22 October 2015.
- Rodriguez, R.A.; Becker, S.; Andresen, G.B.; Heide, D.; Greiner, M. Transmission needs across a fully renewable European power system. Renew. Energy 2014, 63, 467–476. [Google Scholar] [CrossRef]
- Kies, A.; Schyska, B.; von Bremen, L. Curtailment in a highly renewable power system and its effect on capacity factors. Energies 2016, 9, 510. [Google Scholar] [CrossRef]
- European Network of Transmission System Operators for Electricity. Ten-Year Network Development Plan 2016; European Network of Transmission System Operators for Electricity: Brussels, Belgium, 2016. [Google Scholar]
- Pfluger, B.; Sensfuß, F.; Schubert, G.; Leisentritt, J. Tangible Ways towards Climate Protection in the European Union (EU Long-Term Scenarios 2050); Fraunhofer Institut für System-und Innovationsforschung ISI: Karlsruhe, Germany, 2011. [Google Scholar]
- Bett, P.E.; Thornton, H.E. The climatological relationships between wind and solar energy supply in Britain. Renew. Energy 2016, 87, 96–110. [Google Scholar] [CrossRef]
- Rasmussen, M.G.; Andresen, G.B.; Greiner, M. Storage and balancing synergies in a fully or highly renewable pan-European power system. Energy Policy 2012, 51, 642–651. [Google Scholar] [CrossRef]


| Category | (h) | Utilisation (%) |
|---|---|---|
| Industrial bandload | 4 | 25 |
| Cooling | 1 | 12 |
| Households | 12 | 10 |
| Heat pumps | 24 | 100 |
| E mobility | 6 | 80 |
© 2016 by the authors; licensee MDPI, Basel, Switzerland. This article is an open access article distributed under the terms and conditions of the Creative Commons Attribution (CC-BY) license (http://creativecommons.org/licenses/by/4.0/).
Share and Cite
Kies, A.; Schyska, B.U.; Von Bremen, L. The Demand Side Management Potential to Balance a Highly Renewable European Power System. Energies 2016, 9, 955. https://doi.org/10.3390/en9110955
Kies A, Schyska BU, Von Bremen L. The Demand Side Management Potential to Balance a Highly Renewable European Power System. Energies. 2016; 9(11):955. https://doi.org/10.3390/en9110955
Chicago/Turabian StyleKies, Alexander, Bruno U. Schyska, and Lueder Von Bremen. 2016. "The Demand Side Management Potential to Balance a Highly Renewable European Power System" Energies 9, no. 11: 955. https://doi.org/10.3390/en9110955