Article

Raman Spectral Characteristics of Oil-Paper Insulation and Its Application to Ageing Stage Assessment of Oil-Immersed Transformers

State Key Laboratory of Power Transmission Equipment & System Security and New Technology, Chongqing University, Chongqing 400044, China
*
Author to whom correspondence should be addressed.
Energies 2016, 9(11), 946; https://doi.org/10.3390/en9110946
Submission received: 9 August 2016 / Revised: 27 October 2016 / Accepted: 8 November 2016 / Published: 12 November 2016
(This article belongs to the Special Issue Power Transformer Diagnostics, Monitoring and Design Features)

Abstract

:
The aging of oil-paper insulation in power transformers may cause serious power failures. Thus, effective monitoring of the condition of the transformer insulation is the key to prevent major accidents. The purpose of this study was to explore the feasibility of confocal laser Raman spectroscopy (CLRS) for assessing the aging condition of oil-paper insulation. Oil-paper insulation samples were subjected to thermal accelerated ageing at 120 °C for up to 160 days according to the procedure described in the IEEE Guide. Meanwhile, the dimension of the Raman spectrum of the insulation oil was reduced by principal component analysis (PCA). The 160 oil-paper insulation samples were divided into five aging stages as training samples by clustering analysis and with the use of the degree of polymerization of the insulating papers. In addition, the features of the Raman spectrum were used as the inputs of a multi-classification support vector machine. Finally, 105 oil-paper insulation testing samples aged at a temperature of 130 °C were used to further test the diagnostic capability and universality of the established algorithm. Results demonstrated that CLRS in conjunction with the PCA-SVM technique provides a new way for aging stage assessment of oil-paper insulation equipment in the field.

1. Introduction

Transformers are essential components of a power transmission and distribution system. According to the reports of the International Council of Large Electric Systems (CIGRE), the operating life of transformers in most countries averages 30 years, and it is influenced by various factors, including load, manufacturing process, and operating environment [1]. The condition of a transformer is critical to the safety and reliability of the power system. The probability of an accident from transformers increases with the deterioration of the insulation. Oil-paper insulation, which is the main insulation type for oil-immersed transformers, suffers from thermal and electrical aging during long-term operation. Thus, the identification of the different aging stages of oil-paper insulation, particularly for transformers running for more than 20 years, becomes particularly critical and important. Given that the degradation of insulation performance is a major and direct threat to the reliability of transformer, a study on aging condition monitoring is of considerable importance in the subject of insulation. Such a study can contribute to insulation diagnosis and lifetime prediction several years in advance.
The degree of polymerization (DP) in insulation paper is commonly used to characterize the aging degree of the insulation paper and has been regarded as a basic parameter to evaluate the aging stage of oil-paper insulation by the IEEE Guide [2]. On the basis of the massive body of research on the aging mechanism and aging characteristic of insulation paper, Emsley introduced and improved the kinetic equation for the degradation reaction of insulation paper to describe the development law of the DP in the aging process [3,4,5]. Although DP has been accepted worldwide as the most effective indicator for the discriminant analysis of the aging stages of insulation paper, it necessitates cutting the power and hanging the cover of the transformer during sampling and measurement; as a result, the field application of DP is restricted. For this reason, the aging state of the transformer insulation is mainly indirectly reflected by the aging characteristics of the oil-paper insulation, namely its degradation and dissolution in insulation oil [6].
Shroff studied the formation of furfural in the paper aging process and confirmed that an approximate logarithmic relationship exists between the furfural content and the DP of the insulation paper [7]. Thus, the concentration of furfural can serve as an essential characteristic to assess the aging condition of the insulation [8,9,10,11]. Currently, high performance liquid chromatography (HPLC), ultraviolet (UV) spectrophotometry and the colorimetric method are the major methods to detect the concentration of furfural dissolved in oil. However, these methods have their respective disadvantages. The drawbacks of HPLC include complex operation, difficult elution, and extra-column effect existence [12]. UV spectrophotometry has poor stability and is susceptible to the organic matter in the transformer oil [13]. Toluidine, which is used in the colorimetric method, is recognized as one of the most potent carcinogens in the world; furthermore, the colorimetric method has lower measurement accuracy than the other methods [14].
The thermal and electrical faults that develop in an oil-immersed power transformer are typically associated with the formation of dissolved gases, including CO, CO2, CH4, C2H4, C2H2, C2H6 and H2 [15,16,17]. Used for several decades in testing and monitoring oil-immersed transformers, dissolved gas analysis (DGA) has been accepted worldwide as an effective method for the diagnosis of the aging stage of power transformers [18,19,20]. Various gas-in-oil detection methods have been developed, including gas chromatography (GC), which is a well-known diagnostic method for accurately determining the concentrations of nine different gases [21,22]. However, the performance of chromatograph columns degrades with time, and GC monitoring systems need to be operated in a laboratory by highly qualified personnel.
Raman spectroscopy has been widely used in food, materials, chemistry, biochemistry and other fields for qualitative or quantitative analyses [23,24,25,26,27]. It shows considerable potential in the early failure diagnosis for transformers. Furfural was previously characterized by the Raman signal at 1707 cm−1 and reached a detection limit of 14.4 mg/L [28]. In recent years, Raman detection for dissolved gases in oil has also been proposed [29]. However, the application of Raman spectra to the assessment of the aging condition of a transformer has been rarely reported. Accordingly, the primary objectives of this study are to explore the Raman spectral characteristics of oil-paper insulation, and to establish a method of its application to aging stage assessment of oil-immersed transformers.
In this study, thermal accelerated aging experiments were conducted at 120 °C for up to 160 days in order to obtain oil-paper samples [2]. The mapping relationship between the Raman signal of the insulation oil and the DP of the insulation paper was investigated. Firstly, a principal component analysis (PCA) was conducted to extract the representative features from the Raman signal for use in the aging condition diagnosis. Secondly, the dimension-reduced spectral data were utilized in the clustering analysis to divide the sample into five categories, which correspond to the five aging stages according to the average DP of the insulation paper immersed in oil. Next, a genetic algorithm (GA)-optimized multi-classification support vector machine (SVM) was employed to develop a suitable diagnostic algorithm for assessing the aging condition of the oil-paper insulation. Finally, 105 more insulation samples were aged at 130 °C and used to further test the diagnosis performance of the established algorithm model.

2. Materials and Methods

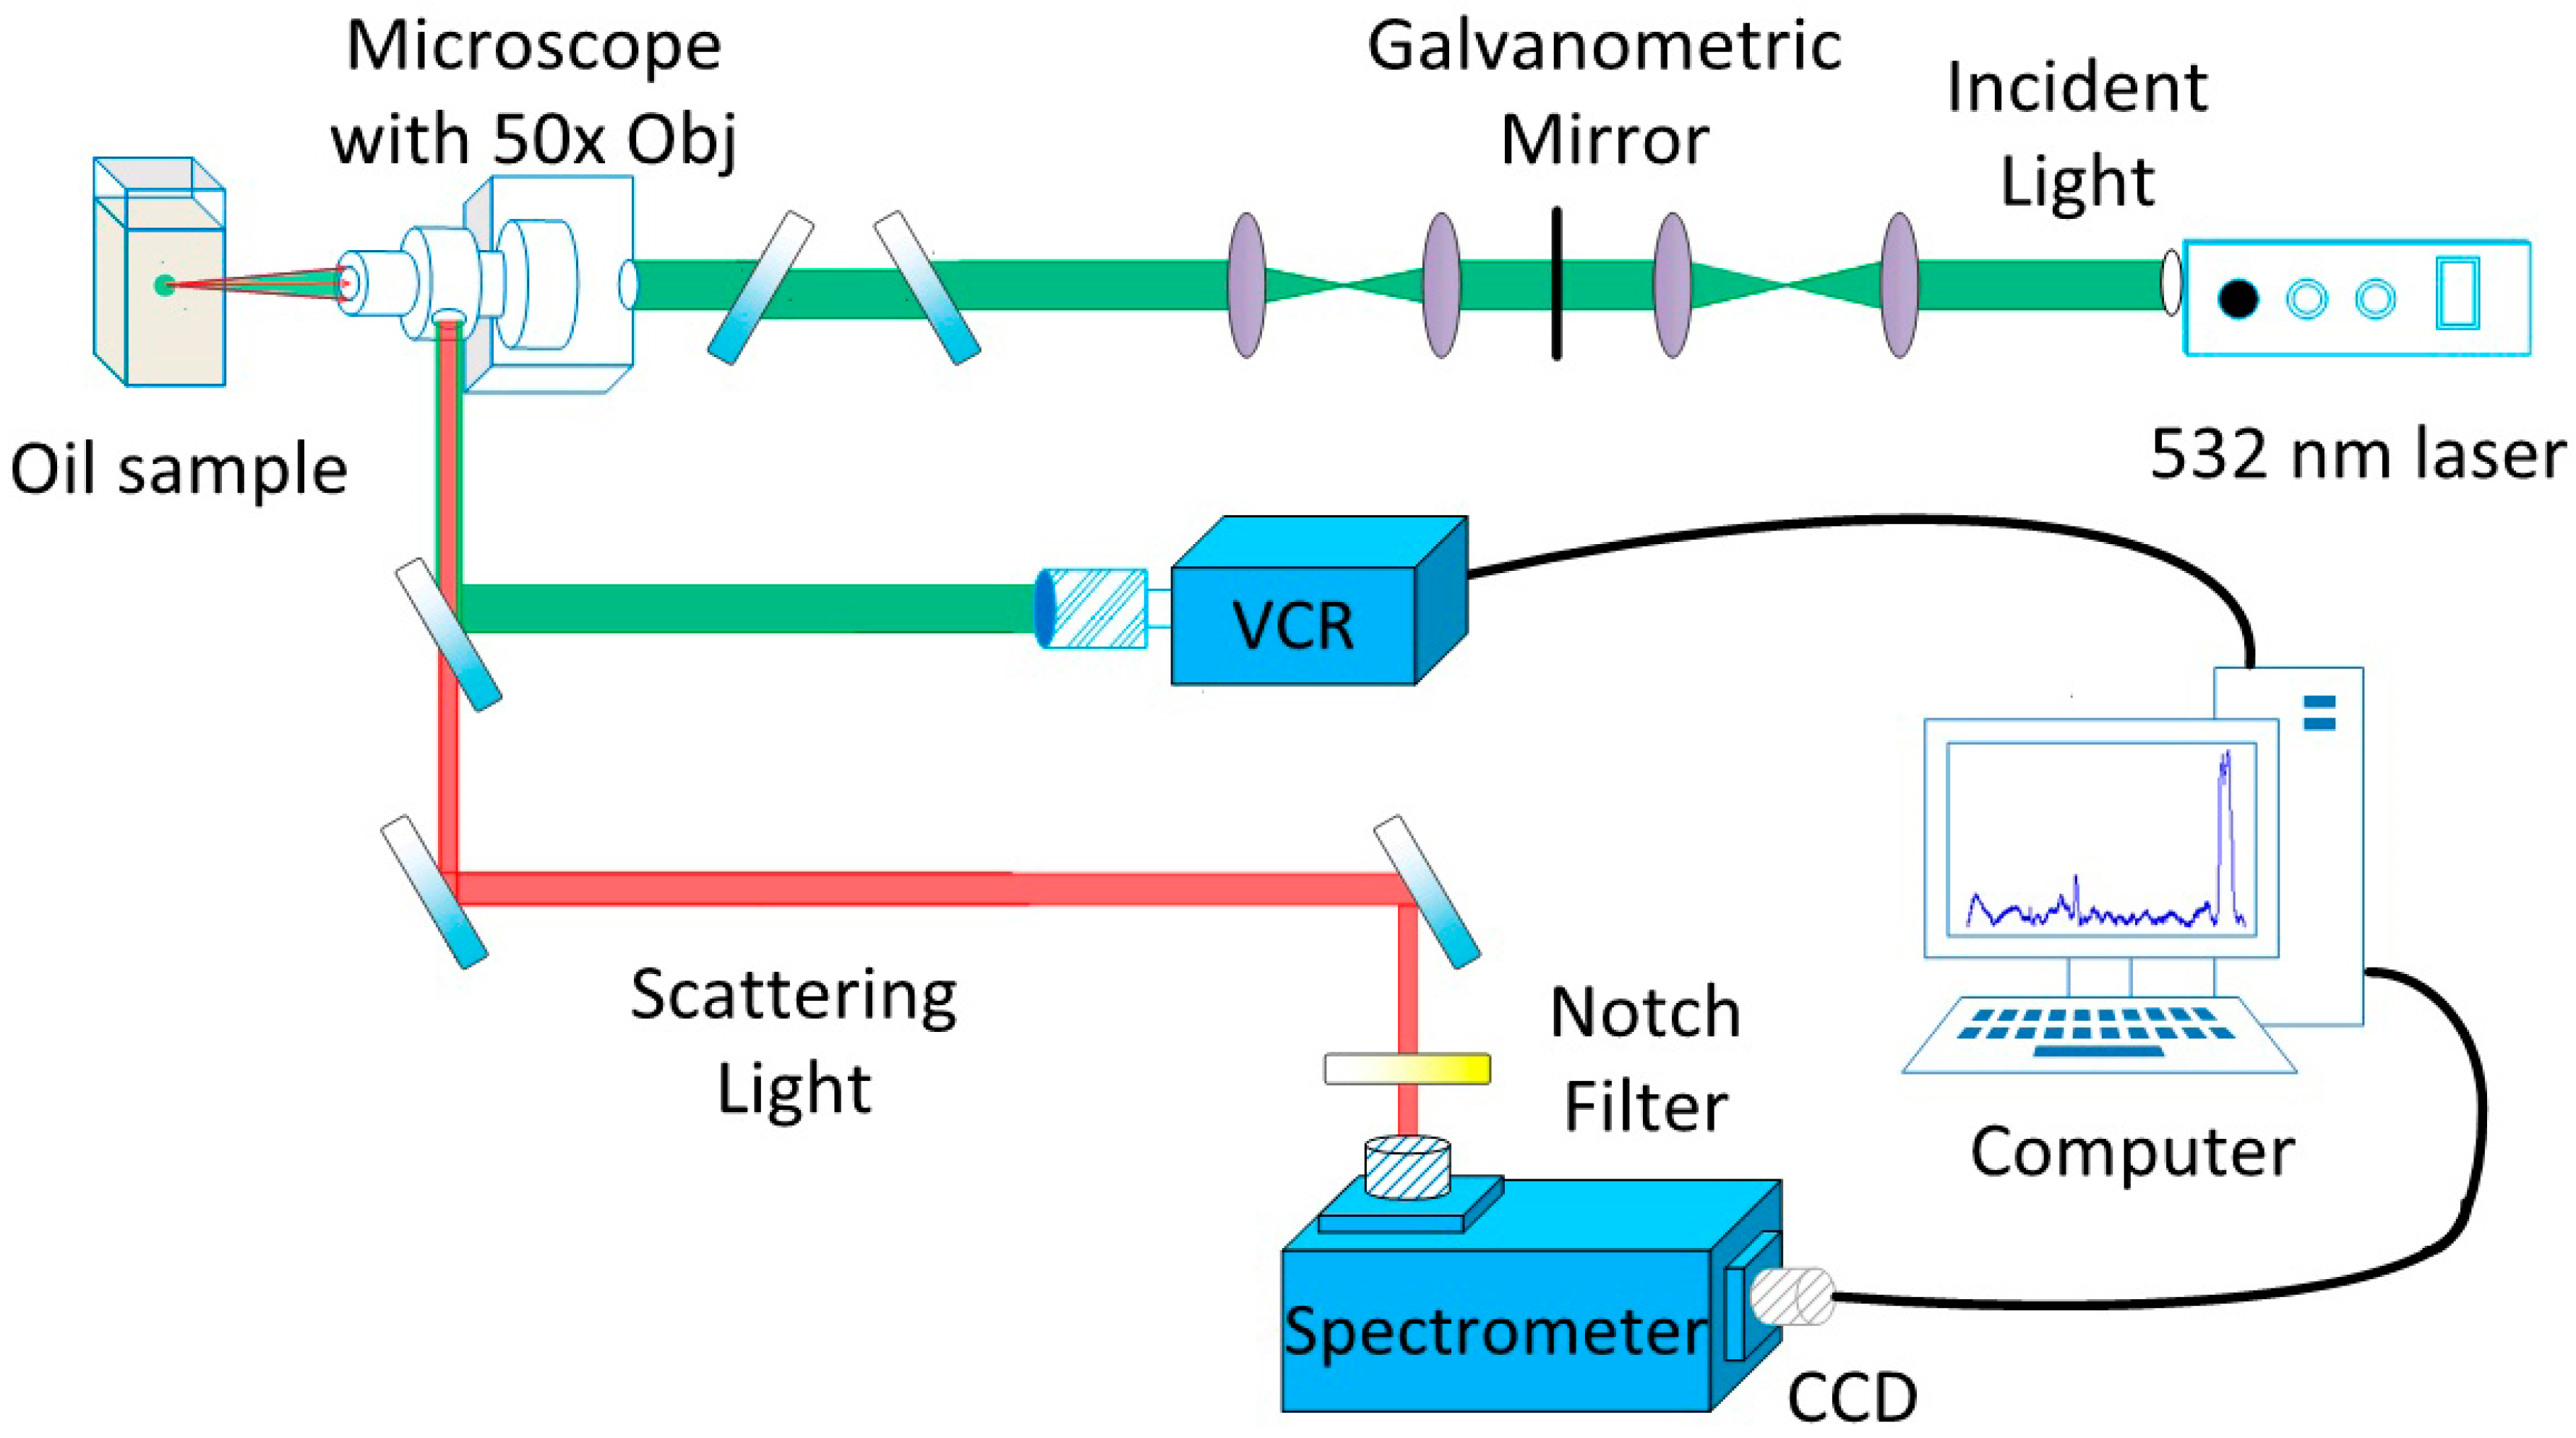
2.1 Raman Instrumentation

The working principle of the platform used in the Raman spectroscopic studies of insulation oil is illustrated in Figure 1, the excitation source is focused on the oil sample by confocal microscopy to excite Raman scattering. Subsequently, the scattered light is collected by an objective and guided into a charge-coupled device (CCD), which is connected to the spectrometer controlled by a personal computer. The Raman spectra of the insulation oil associated is displayed on the computer screen in real time and can be saved for further analysis.
On the basis of the given operating principle, a Raman detection platform was constructed to study the Raman spectra of the insulation oil. The system mainly consists of a 532 nm CW laser with a power of 500 mW as the excitation source, and its current controller (LDX-3232) and temperature controller (TCU151); a 50× long-focal-length objective used for laser convergence and signal collection, which has a high spatial resolution to avoid the interferences produced by the entrance window; a Video Cassette Recorder (VCR) helping to adjust the facula; a back-thinned CCD (refrigeration temperature: −85 °C, distinguishability: 2000 × 256, quantum efficiency: >90%), an Andor 500i series spectrometer with three blazed gratings (600 lines per 500 nm, 1800 lines per 500 nm, and 1200 lines per 750 nm) and the focal length of the spectrometer was 500 mm. The system acquired the Raman spectra with light intensity on the oil sample stabilized at 35 mW, the spectrum over the wavenumber range of 390–3082 cm−1. Exposure time and the number of accumulations were respectively set to 5 s and three times to avoid signal oversaturation and light degradation of the oil characteristics. Moreover, the width of the entrance slit of the spectrometer was set to 100 μm.

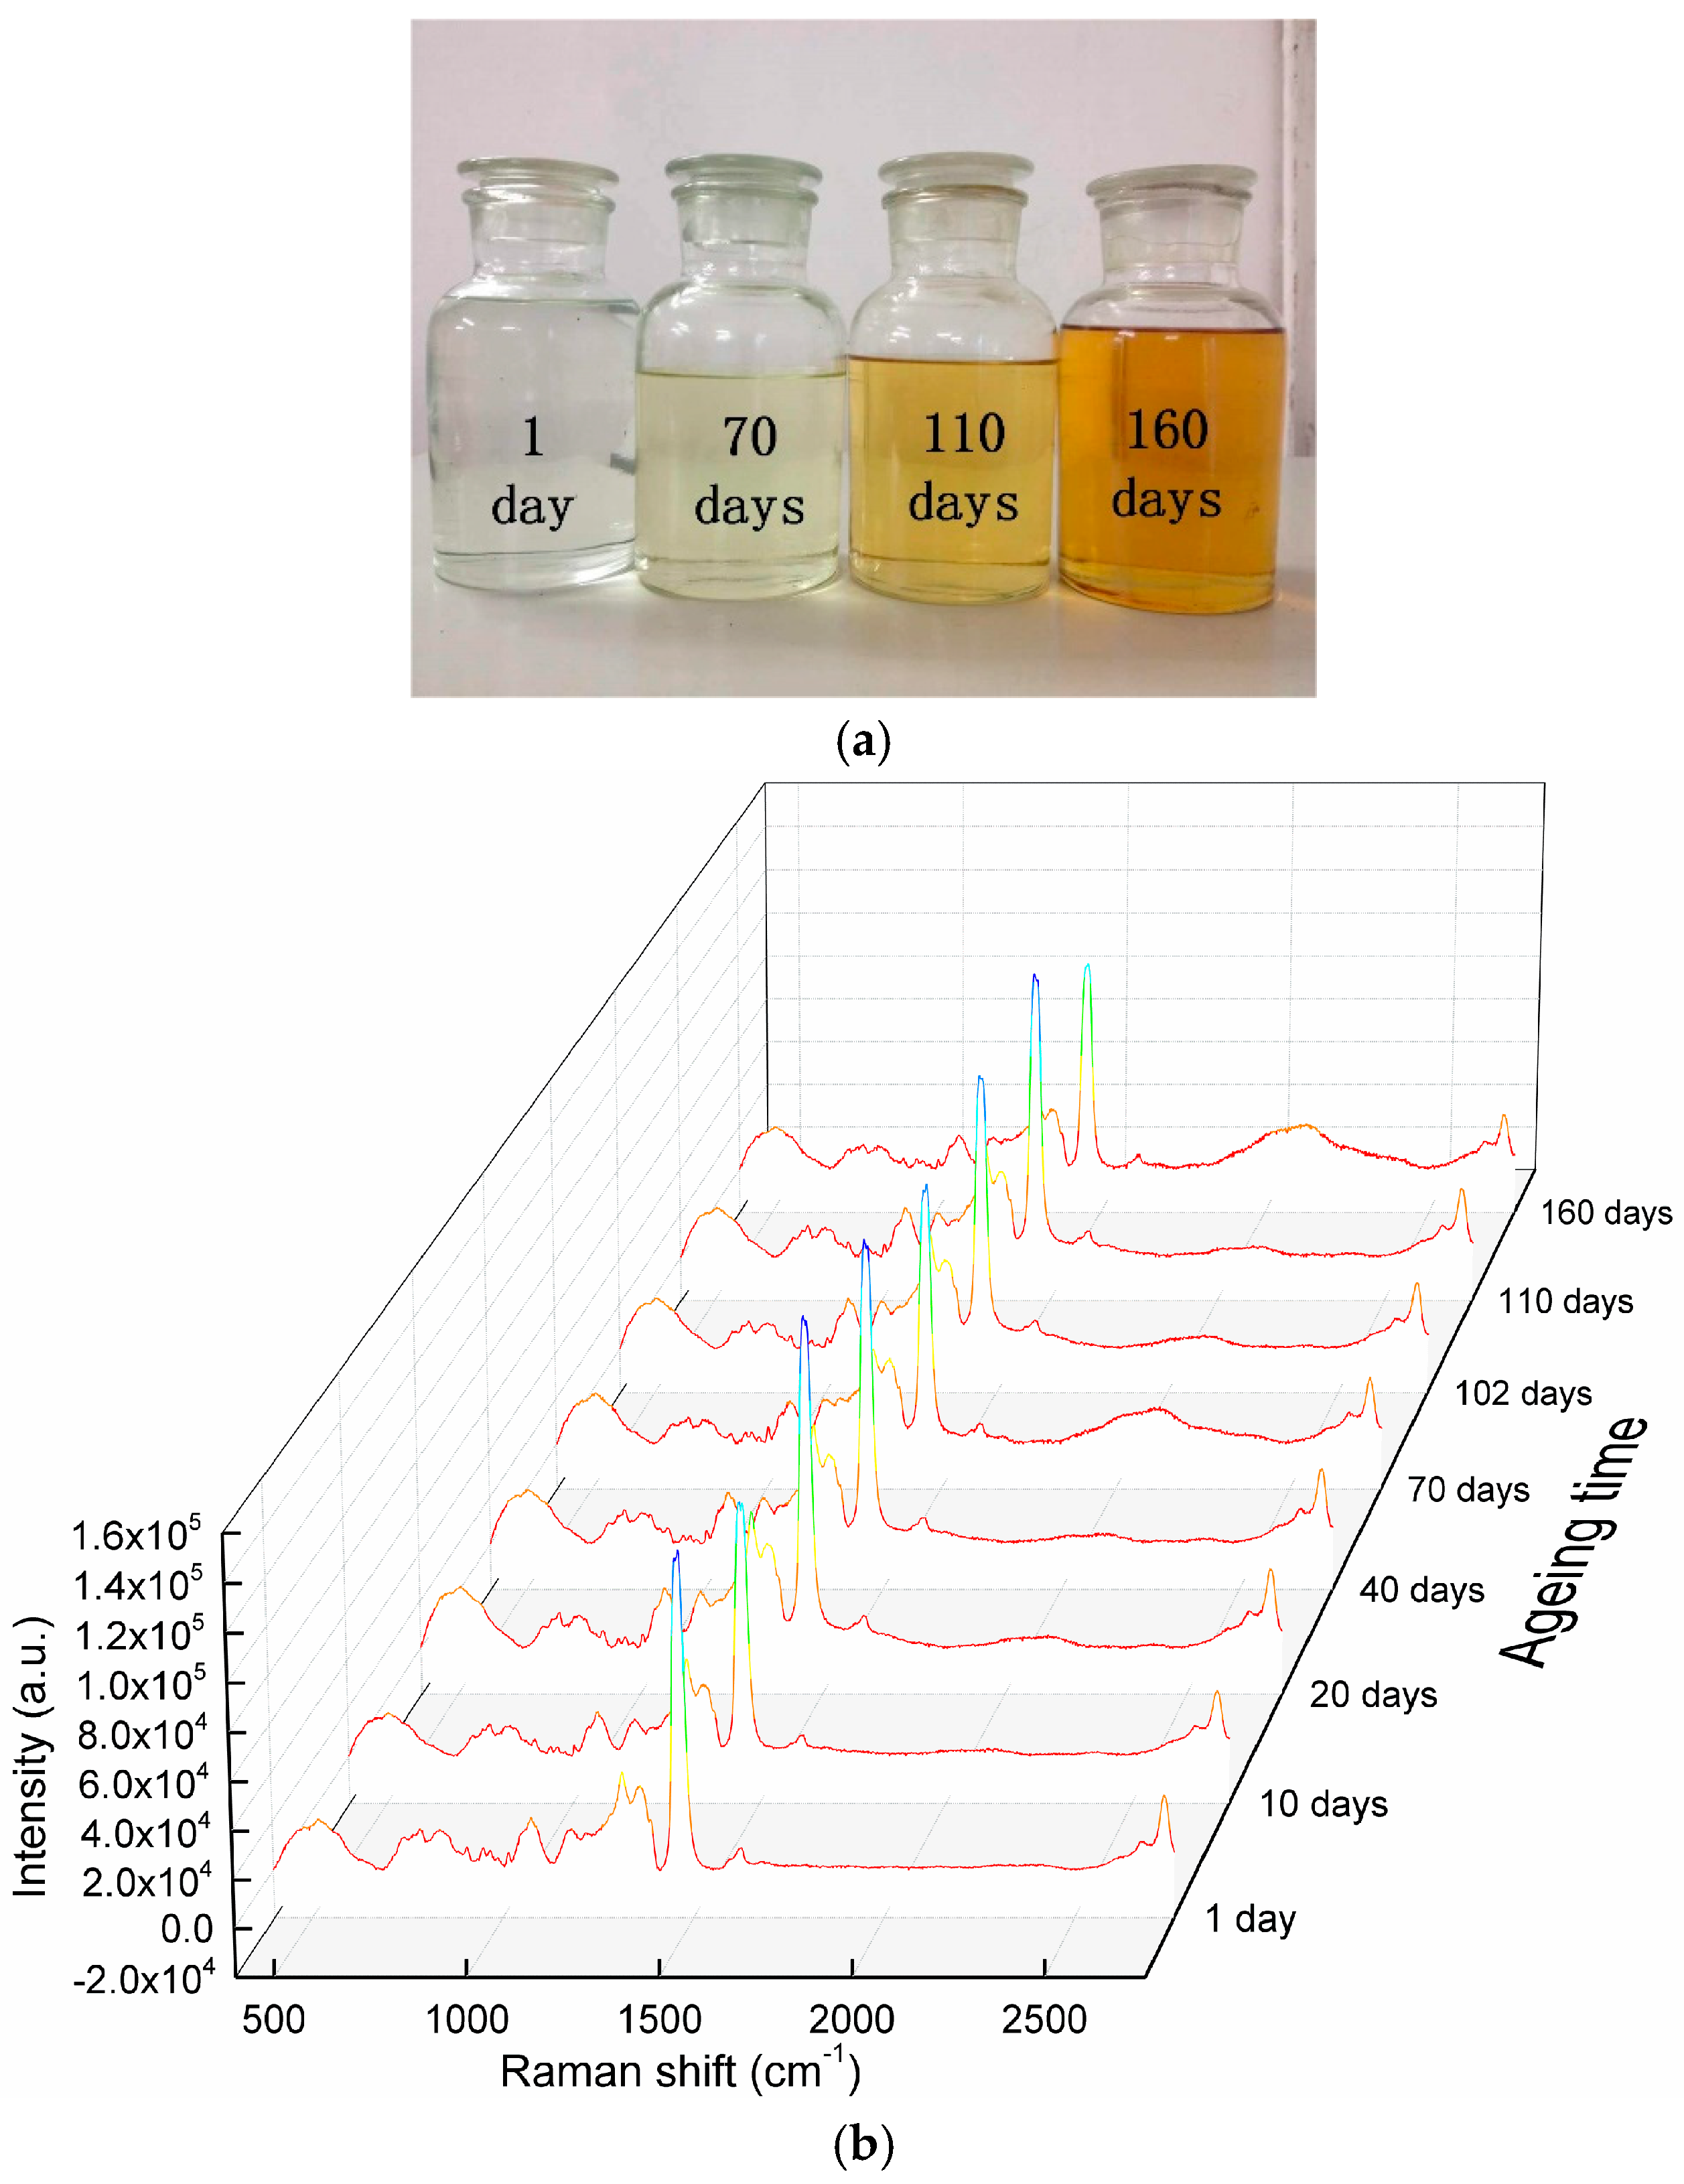
2.2 Thermal Accelerated Aging Experiment

Thermal accelerated aging experiments were conducted to obtain oil-paper samples at different aging stages in a short time. Performing accelerated aging in sealed systems is recommended in the IEEE loading guide to simulate the real aging of modern sealed transformers [2]. The 25# transformer mineral oil was provided by Chuanrun Lubricant Company, China. The cellulose papers samples provided by Baoqing Paper Co. Ltd. (Hunan, China) had a thickness of 0.3 mm and a diameter of 32 mm. The samples were pretreated as follows: Firstly, 17.6 g of papers samples were taken out every time and placed in a glass bottle (250 mL), all papers samples were placed in a vacuum box and dried at 90 °C for 48 h. The temperature of the vacuum box was then adjusted to 40 °C. Secondly, fresh mineral oil was then added into each bottle at an oil/paper mass weight ratio of 10:1 (each bottle contains 176 g of oil and 17.6 g of paper). Thirdly, all the bottles were placed back to the vacuum box. The temperature of the vacuum box was maintained at 90 °C for another 48 h and then cooled down to room temperature. Subsequently, each bottle was filled with dry nitrogen gas and then sealed (1 atm). Finally, the 160 samples were placed in aging ovens and heated to 120 °C for the accelerated thermal aging of up to 160 days. Twenty samples were collected in days 1, 10, 20, 40, 70, 102, 110, and 160 to obtain oil-paper insulation samples with different aging states.
Before CLRS measurement was performed, the oil samples were cooled naturally to room temperature (28 °C). For the analysis of aging condition of the oil-paper insulation, the DP of the oil-impregnated papers aged with the oil was measured according to ASTM D4243-99.

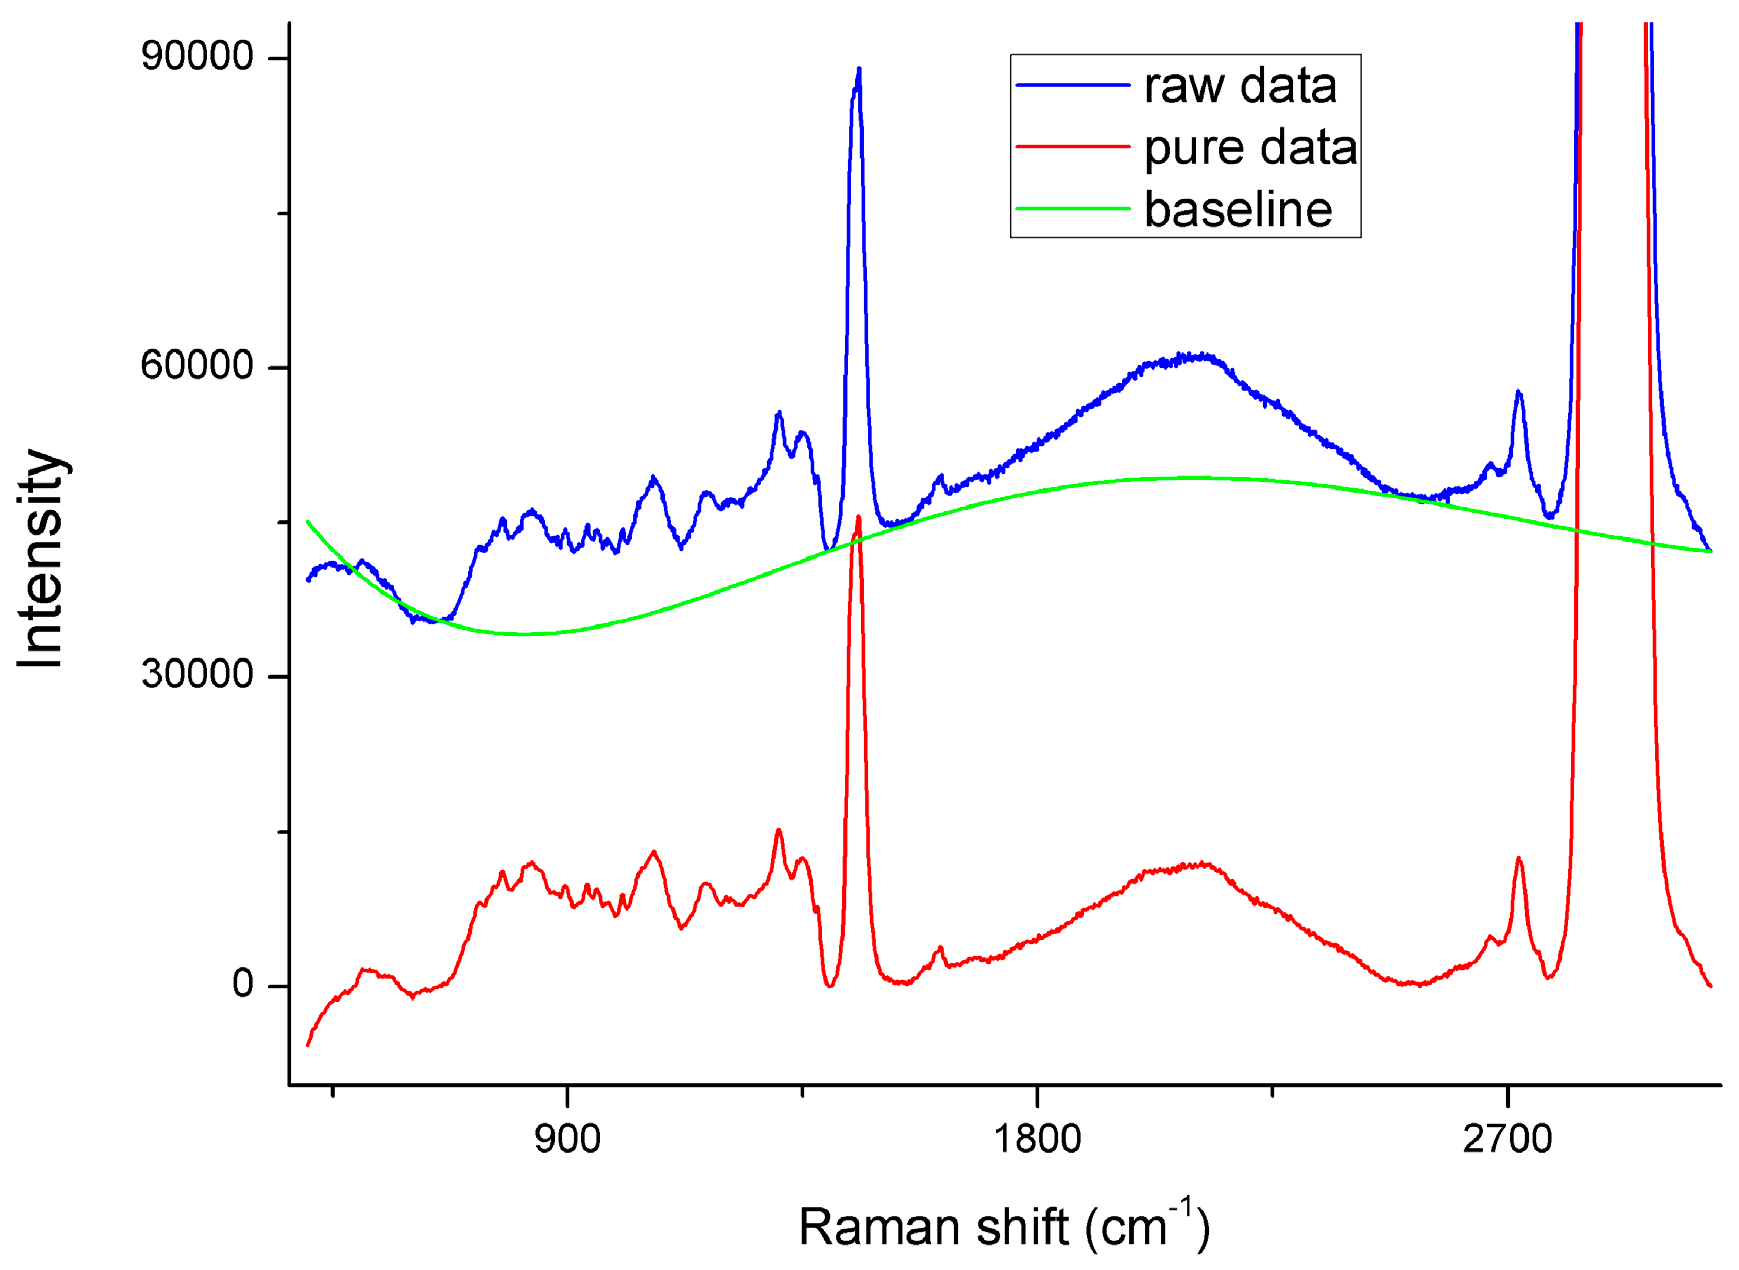
2.3 Data Pre-Processing

The average spectral data set of five repeated Raman measurements on each insulation oil sample was used for oil classification to reduce the spectral measurement errors in this study. The raw spectra acquired from the insulation oil in the 390–3082 cm−1 range represented a combination of prominent oil fluorescence, oil Raman scattering signals, and noise. Baseline commonly exists in the spectrum detection, and it is mainly caused by fluorescent substance generated during the aging process, the fluorescence of oil, impurities in oil and the detecting equipment. The baseline will bring a very adverse impact on the extraction of spectral features. Accordingly, baseline correction is important means to solve this problem, and is an important part of Raman spectrum signal preprocessing. The raw spectra were preprocessed by adjacent five-point smoothing to reduce the noise. For the polynomial baseline correction method, the baseline was estimated using cubic spline functions [30,31,32], which were obtained by the least-squares criterion. As shown in Figure 2, the function fitted by the points was then subtracted from the raw spectrum to obtain pure Raman spectrum of each oil sample. Each of the baseline-subtracted Raman spectra was normalized to the integrated area under the curve in the wavenumber range of 390–3082 cm−1 to enable a better comparison of the spectral shapes and relative peak intensities among the different oil samples.

2.4 Empirical Approach

Oil color is one of the important indicators of insulation performance. In this study, the color of the insulation oil produced by the same company became darker as aging time is extended, as shown in Figure 3a. Fresh oil is usually pale yellow and transparent. The mechanical mixture and free carbon generated the aging characteristic groups, such as C=C and C=O, which were responsible for darkening and browning of oil in the process of aging experiment. As shown in Figure 3b, the deepening of the color of the insulation oil resulted in an increase in the baseline noise; as a result, some details of the spectra were covered, and the signal-to-noise ratio was reduced.

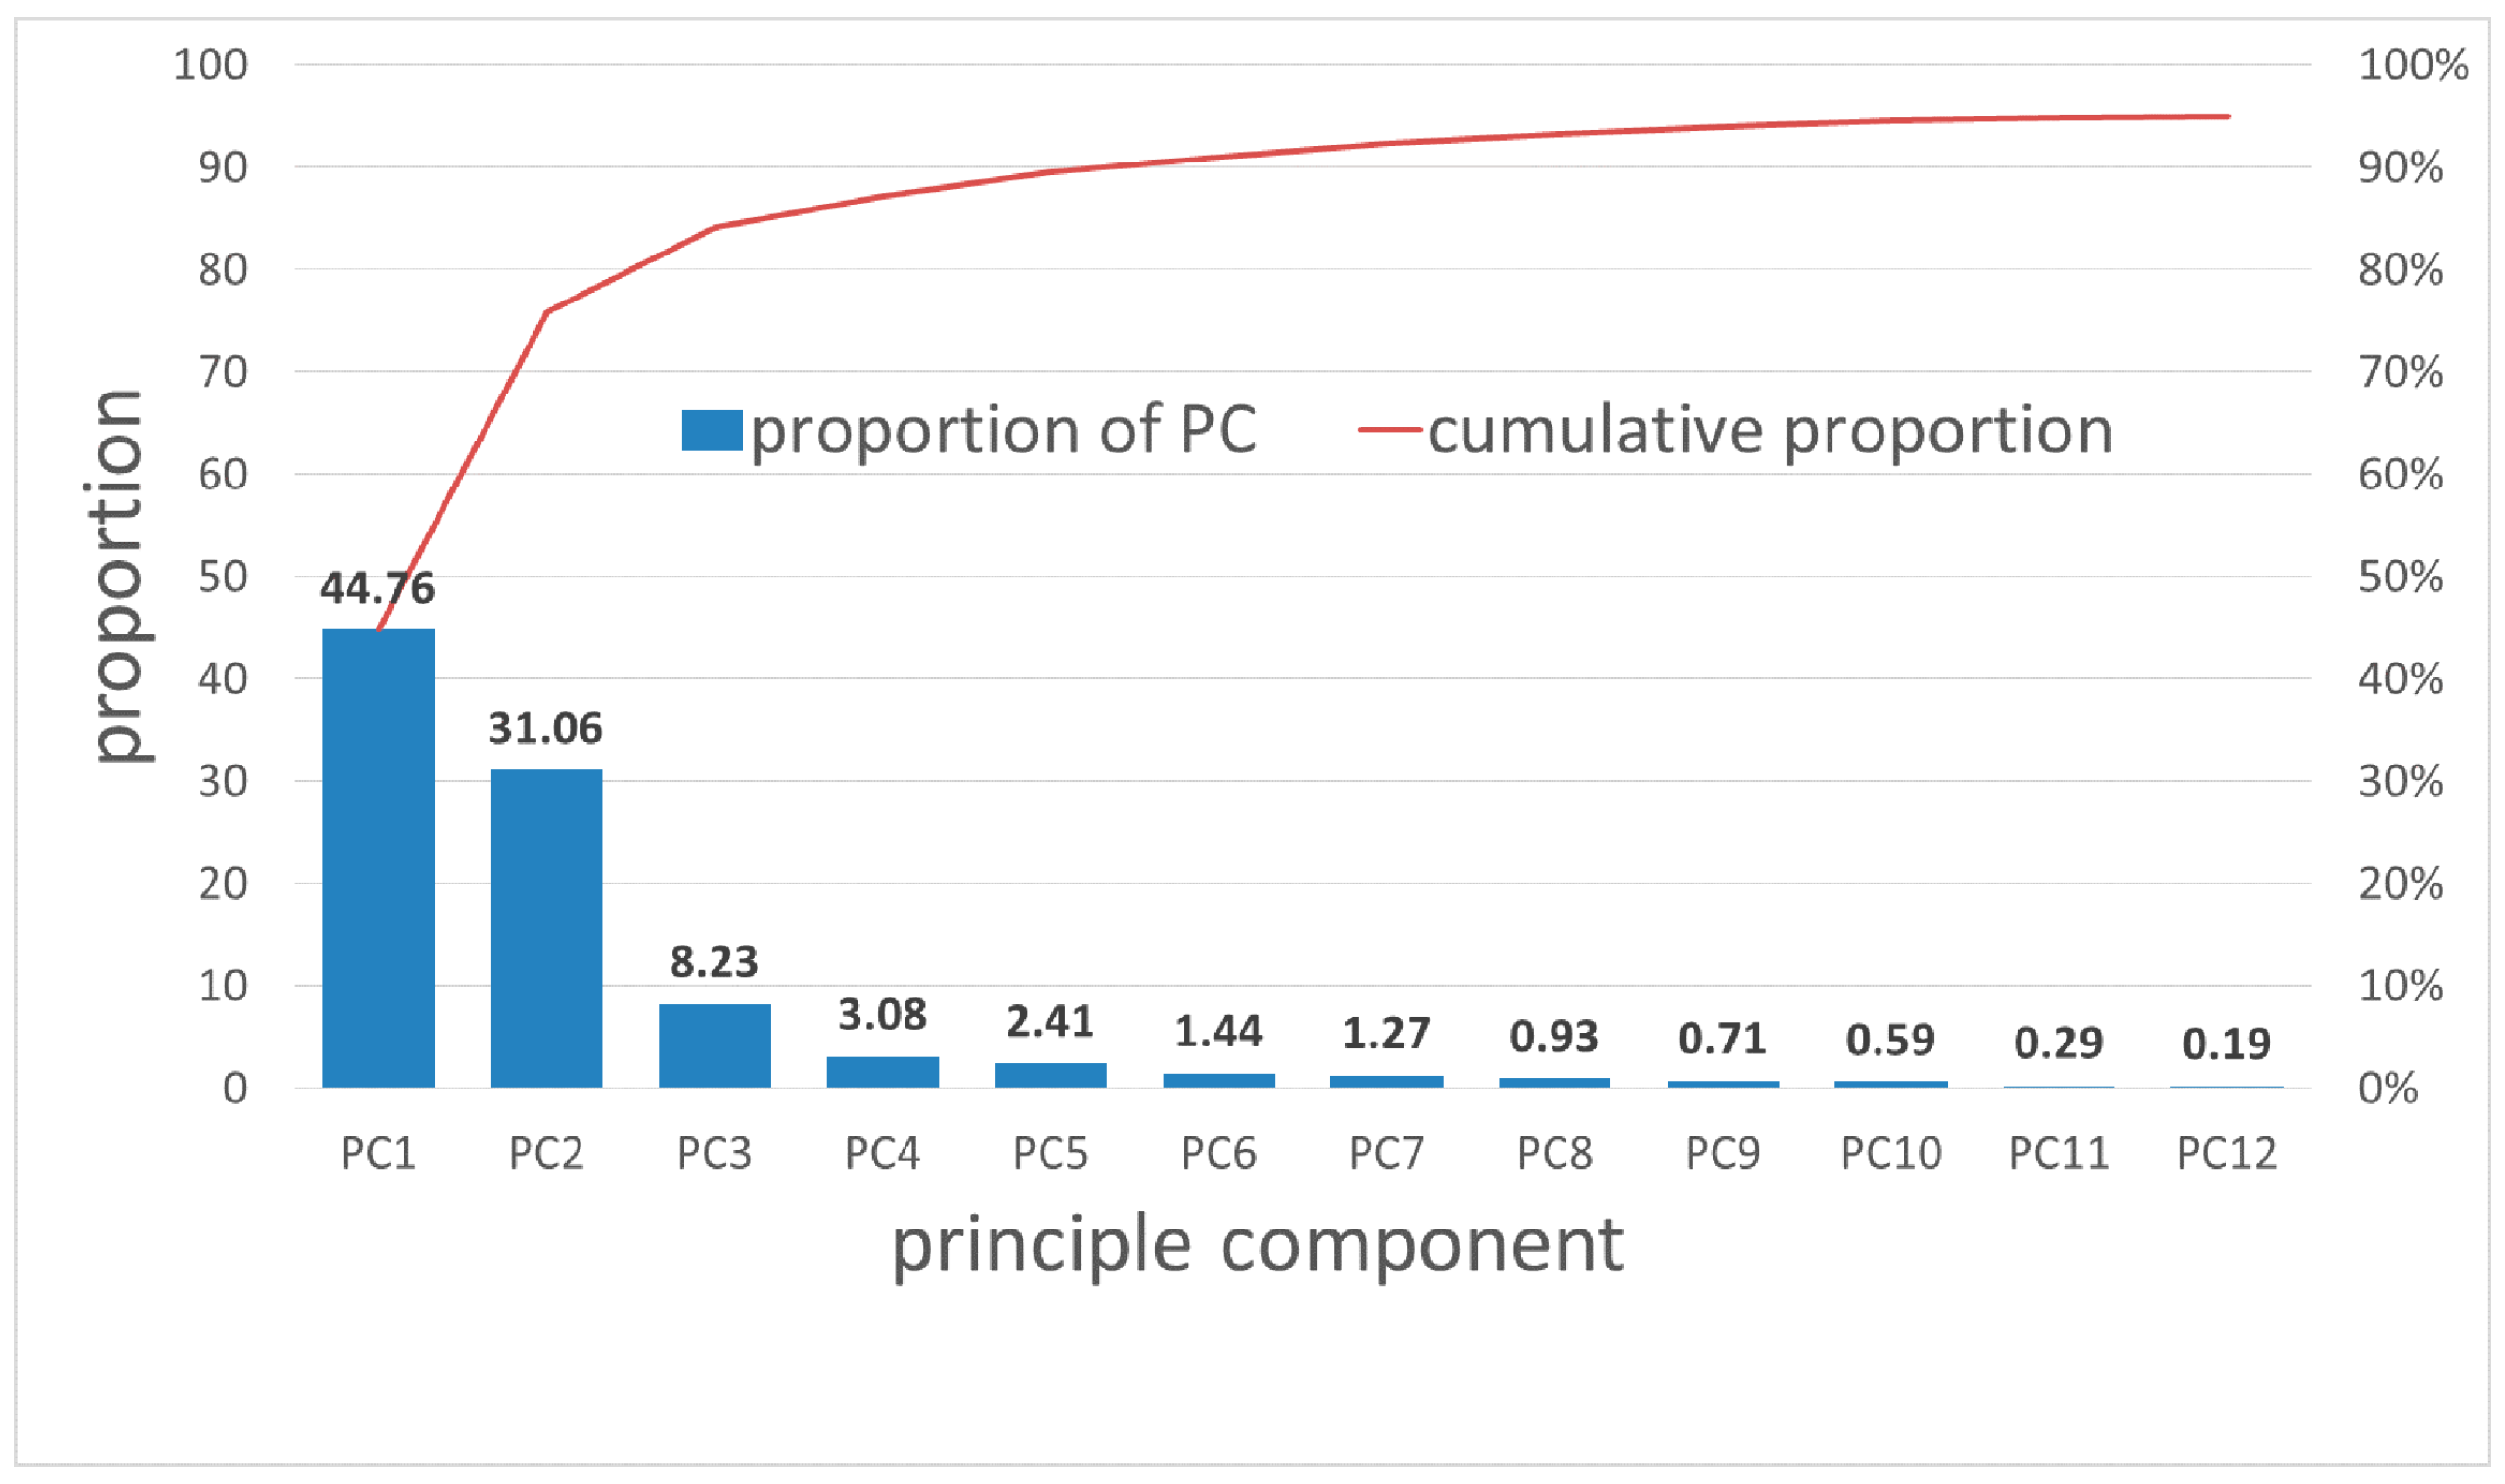
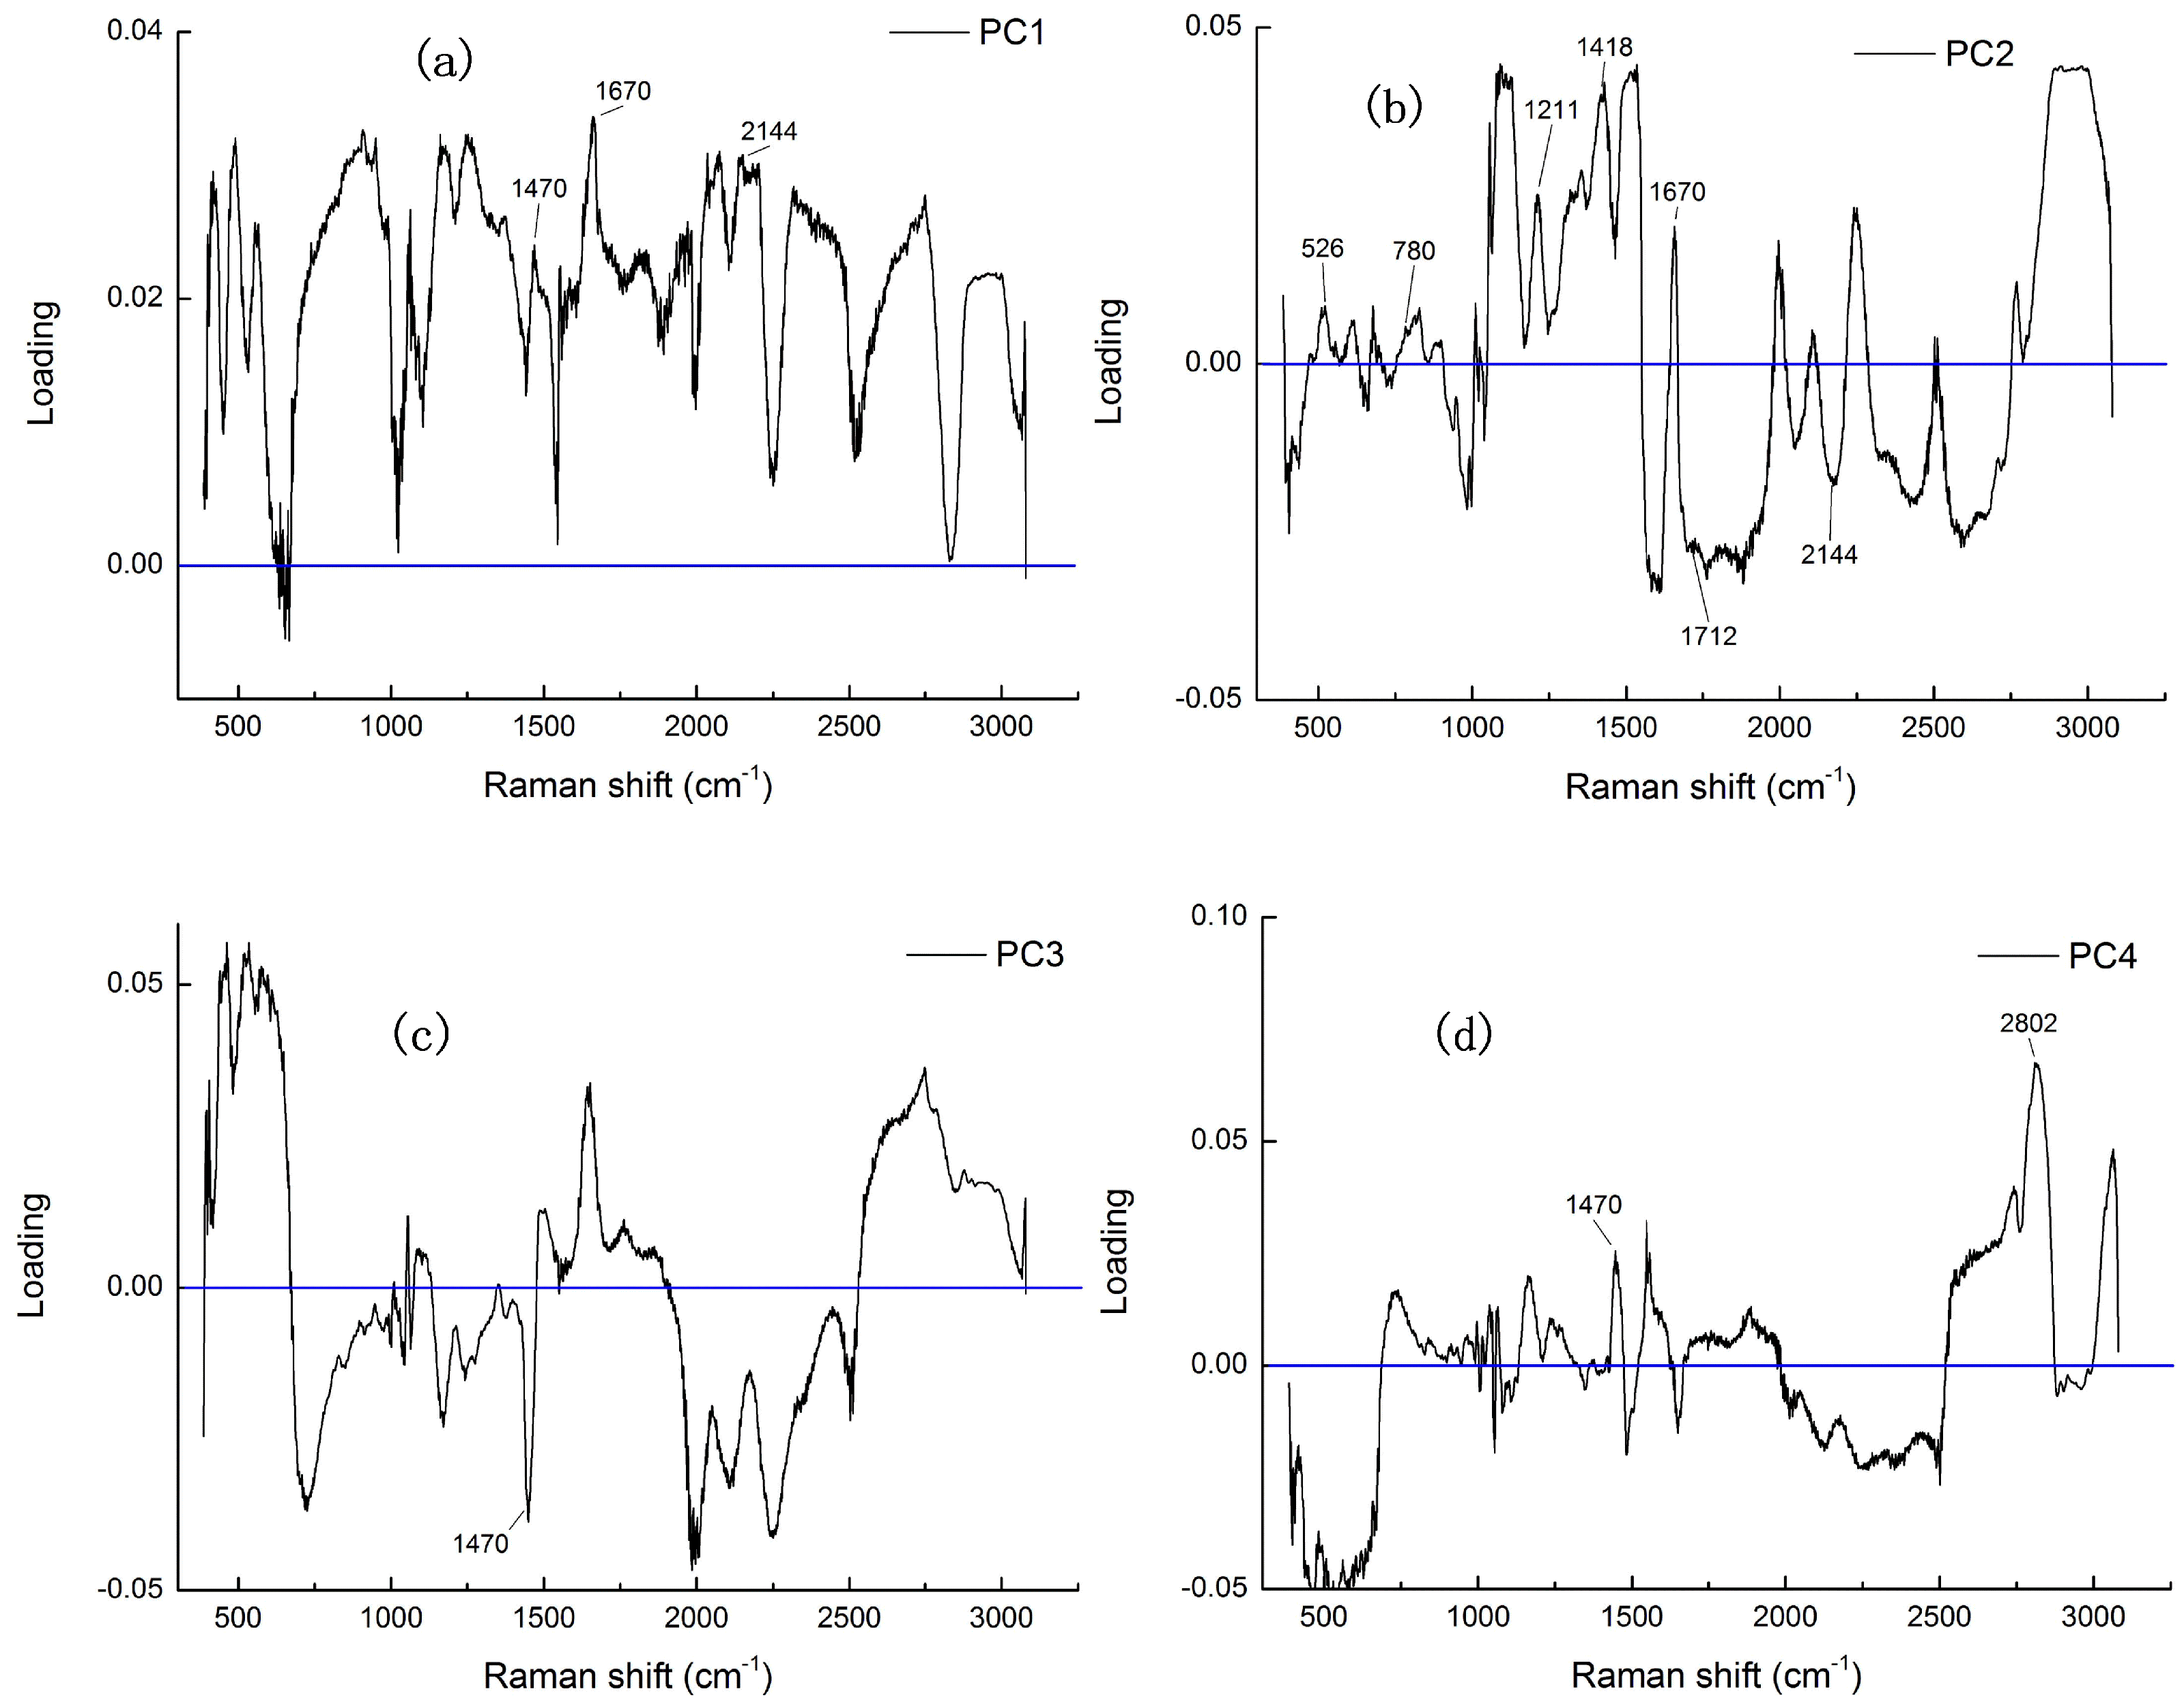
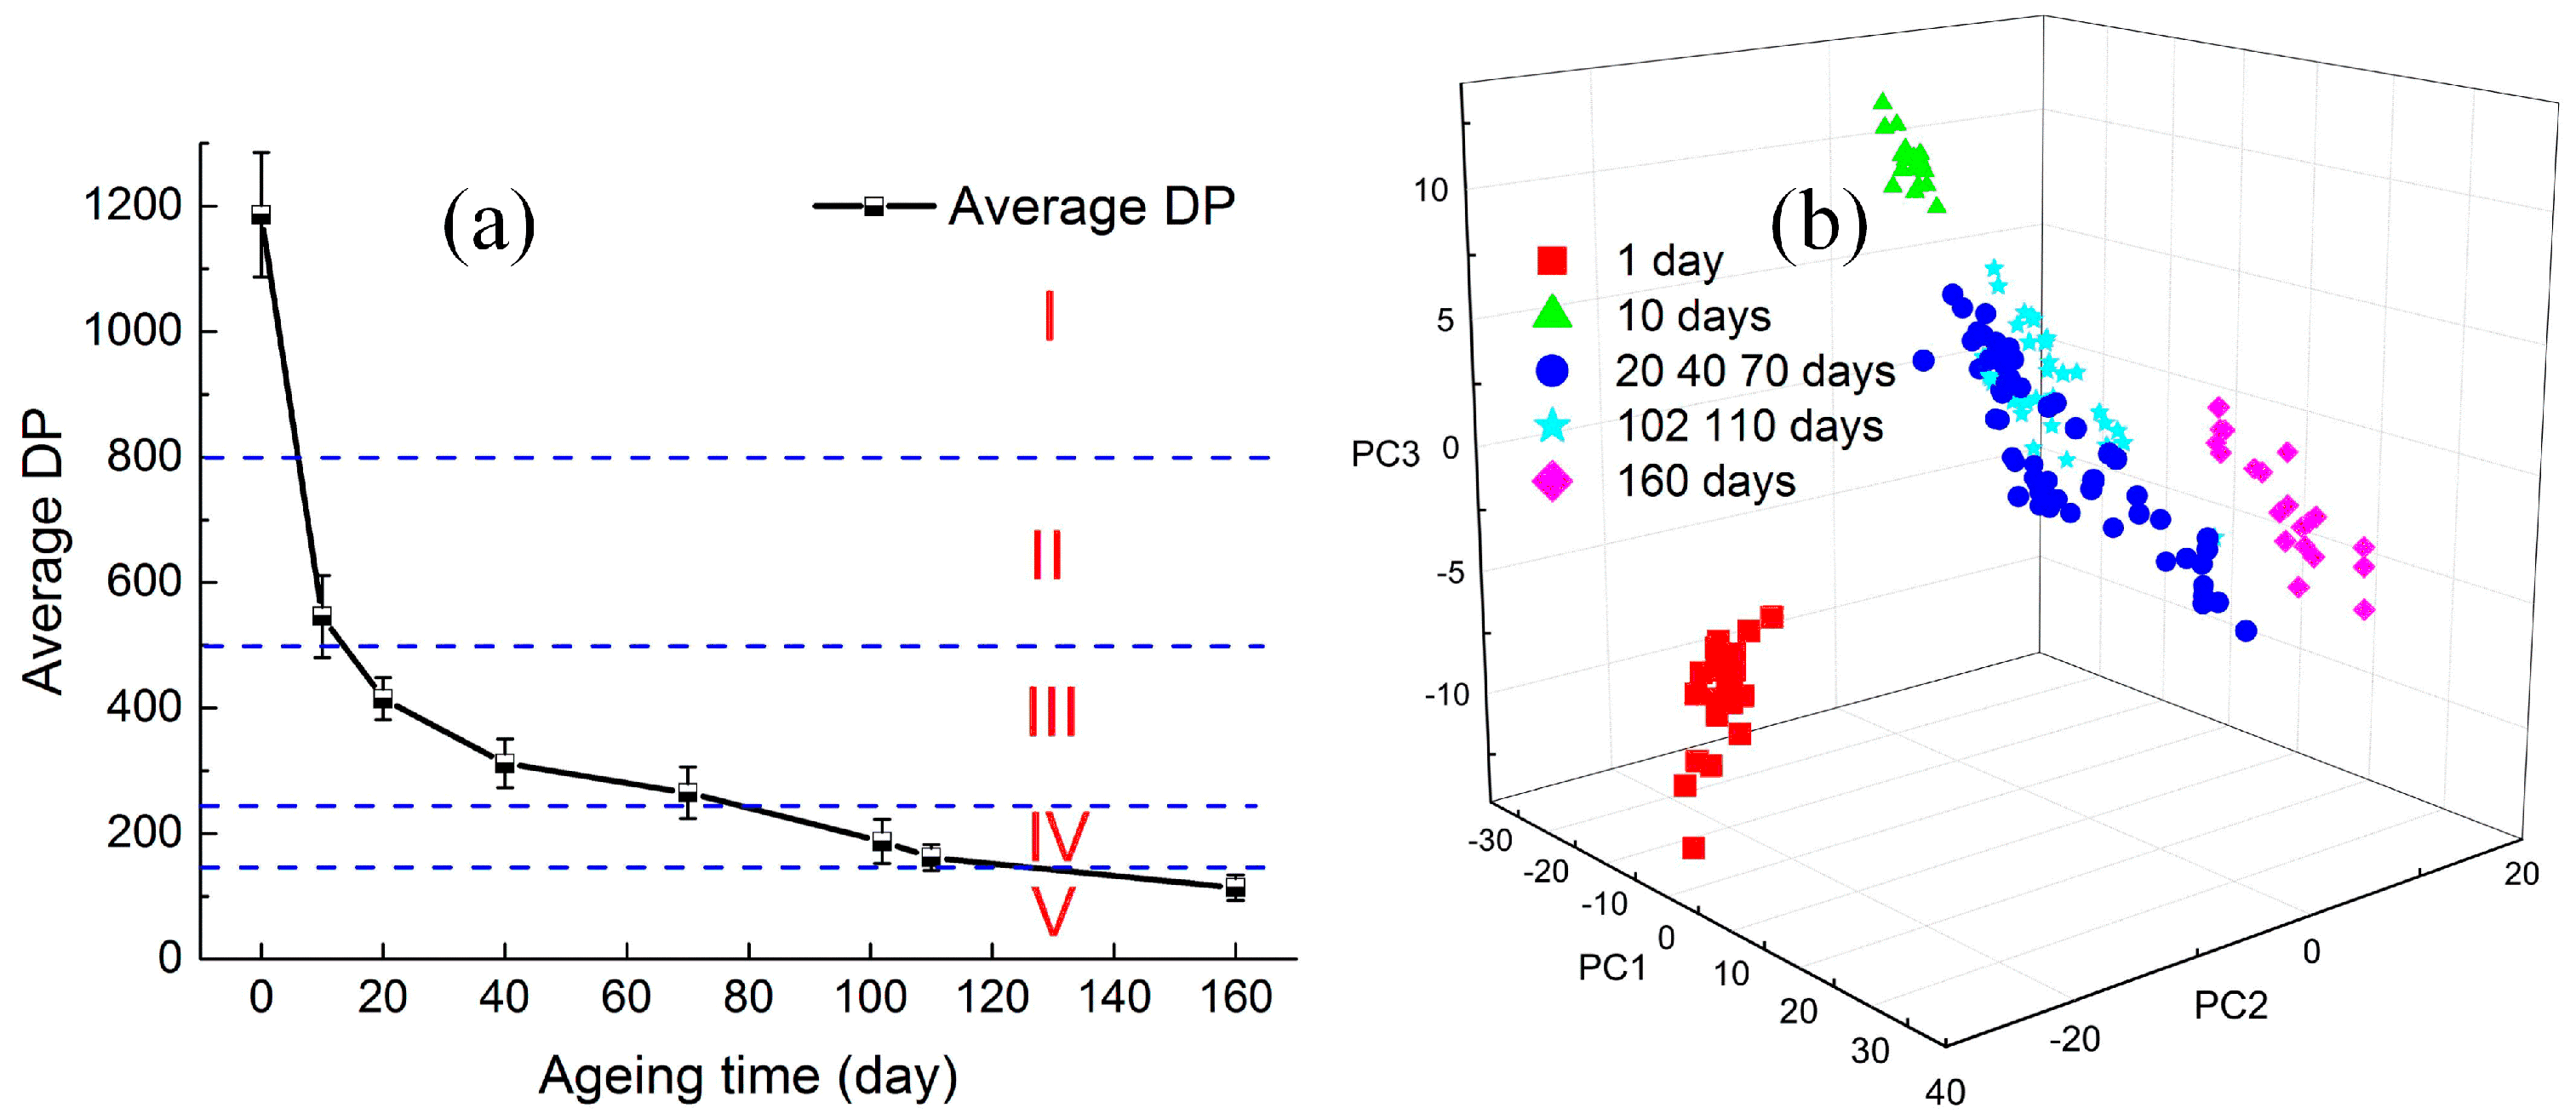
2.5 Multivariate Analysis

A high dimension of the Raman spectral space (each Raman spectrum had 2000 data points) results in the complexity of computation and inefficiency of optimization [33]. Thus, in this study, PCA was first performed on the insulation oil Raman data set to reduce the dimension of the Raman spectral space whilst retaining the most diagnostically significant information for oil classification. The entire spectrum was standardized so that the mean of the spectrum was zero and the standard deviation of all the spectral intensities was one to eliminate the influence of inter- and intra-subject spectral variability on PCA. Mean centering ensured that the principal components (PCs) form an orthogonal basis [34,35]. The standardized Raman data sets were assembled into data matrices with feature columns and instance case rows. Thus, PCA was performed on the standardized spectral data matrices to generate PCs comprising a reduced number of orthogonal variables, which accounted for most of the total variance in the original spectra. PC scores reflected the differences between each class. These significant PC scores were applied to select the training samples for clustering analysis and develop the SVM algorithm for multiclass classification.
The SVM used was a binary classifier that assessed the aging stage of the oil-paper insulation in this study as a multi-classification problem. A multi-classification method called one-against-one is constructed to solve the multi-classification problem and recognize the aging stage of the oil-paper insulation in transformers [36]. The basic principle of the “one-against-one” method is that k ( k 1 ) / 2 classifiers can be constructed to solve a k-class discrimination problem and each of these classifiers is trained to distinguish two classes. With the training data assumed to belong to the m th and the n th class, the multi-classifier can be derived by solving the binary classifier problem:
min ω , b , ξ    1 2 ( ω m n ) T ( ω m n ) + C i = 1 k ( ξ i m n ) ( ω m n ) T    ξ i 0 i f y i = m ,    ( ω m n ) T ϕ ( x t ) + b m n 1 ξ i m n i f y i = n ,    ( ω m n ) T ϕ ( x t ) + b m n 1 + ξ i m n
where ( x 1 , y 1 ) , , ( x l , y l ) denote the training data; x i represents the attributes (features); y i { 1 , , k } is the target value (class labels); ϕ is the function used to map x i to a higher dimensional space; ω = [ ω 1 , ω 2 , , ω N ] T is the linear weight vector which links the feature space to output space; b is the threshold; and C is the penalty parameter of the error term. The training samples were mapped from the input space into a higher dimensional feature space via a mapping function ϕ . The scalar product ϕ ( x i ) · ϕ ( x j ) is calculated directly by computing the kernel function k ( x i , x j ) for given training data in an input space. Radial basis function (RBF) is a common kernel function as the follows.
k ( x i , x j ) = exp ( γ x i x j 2 )
where γ is the kernel parameter, and γ > 0.

3. Results

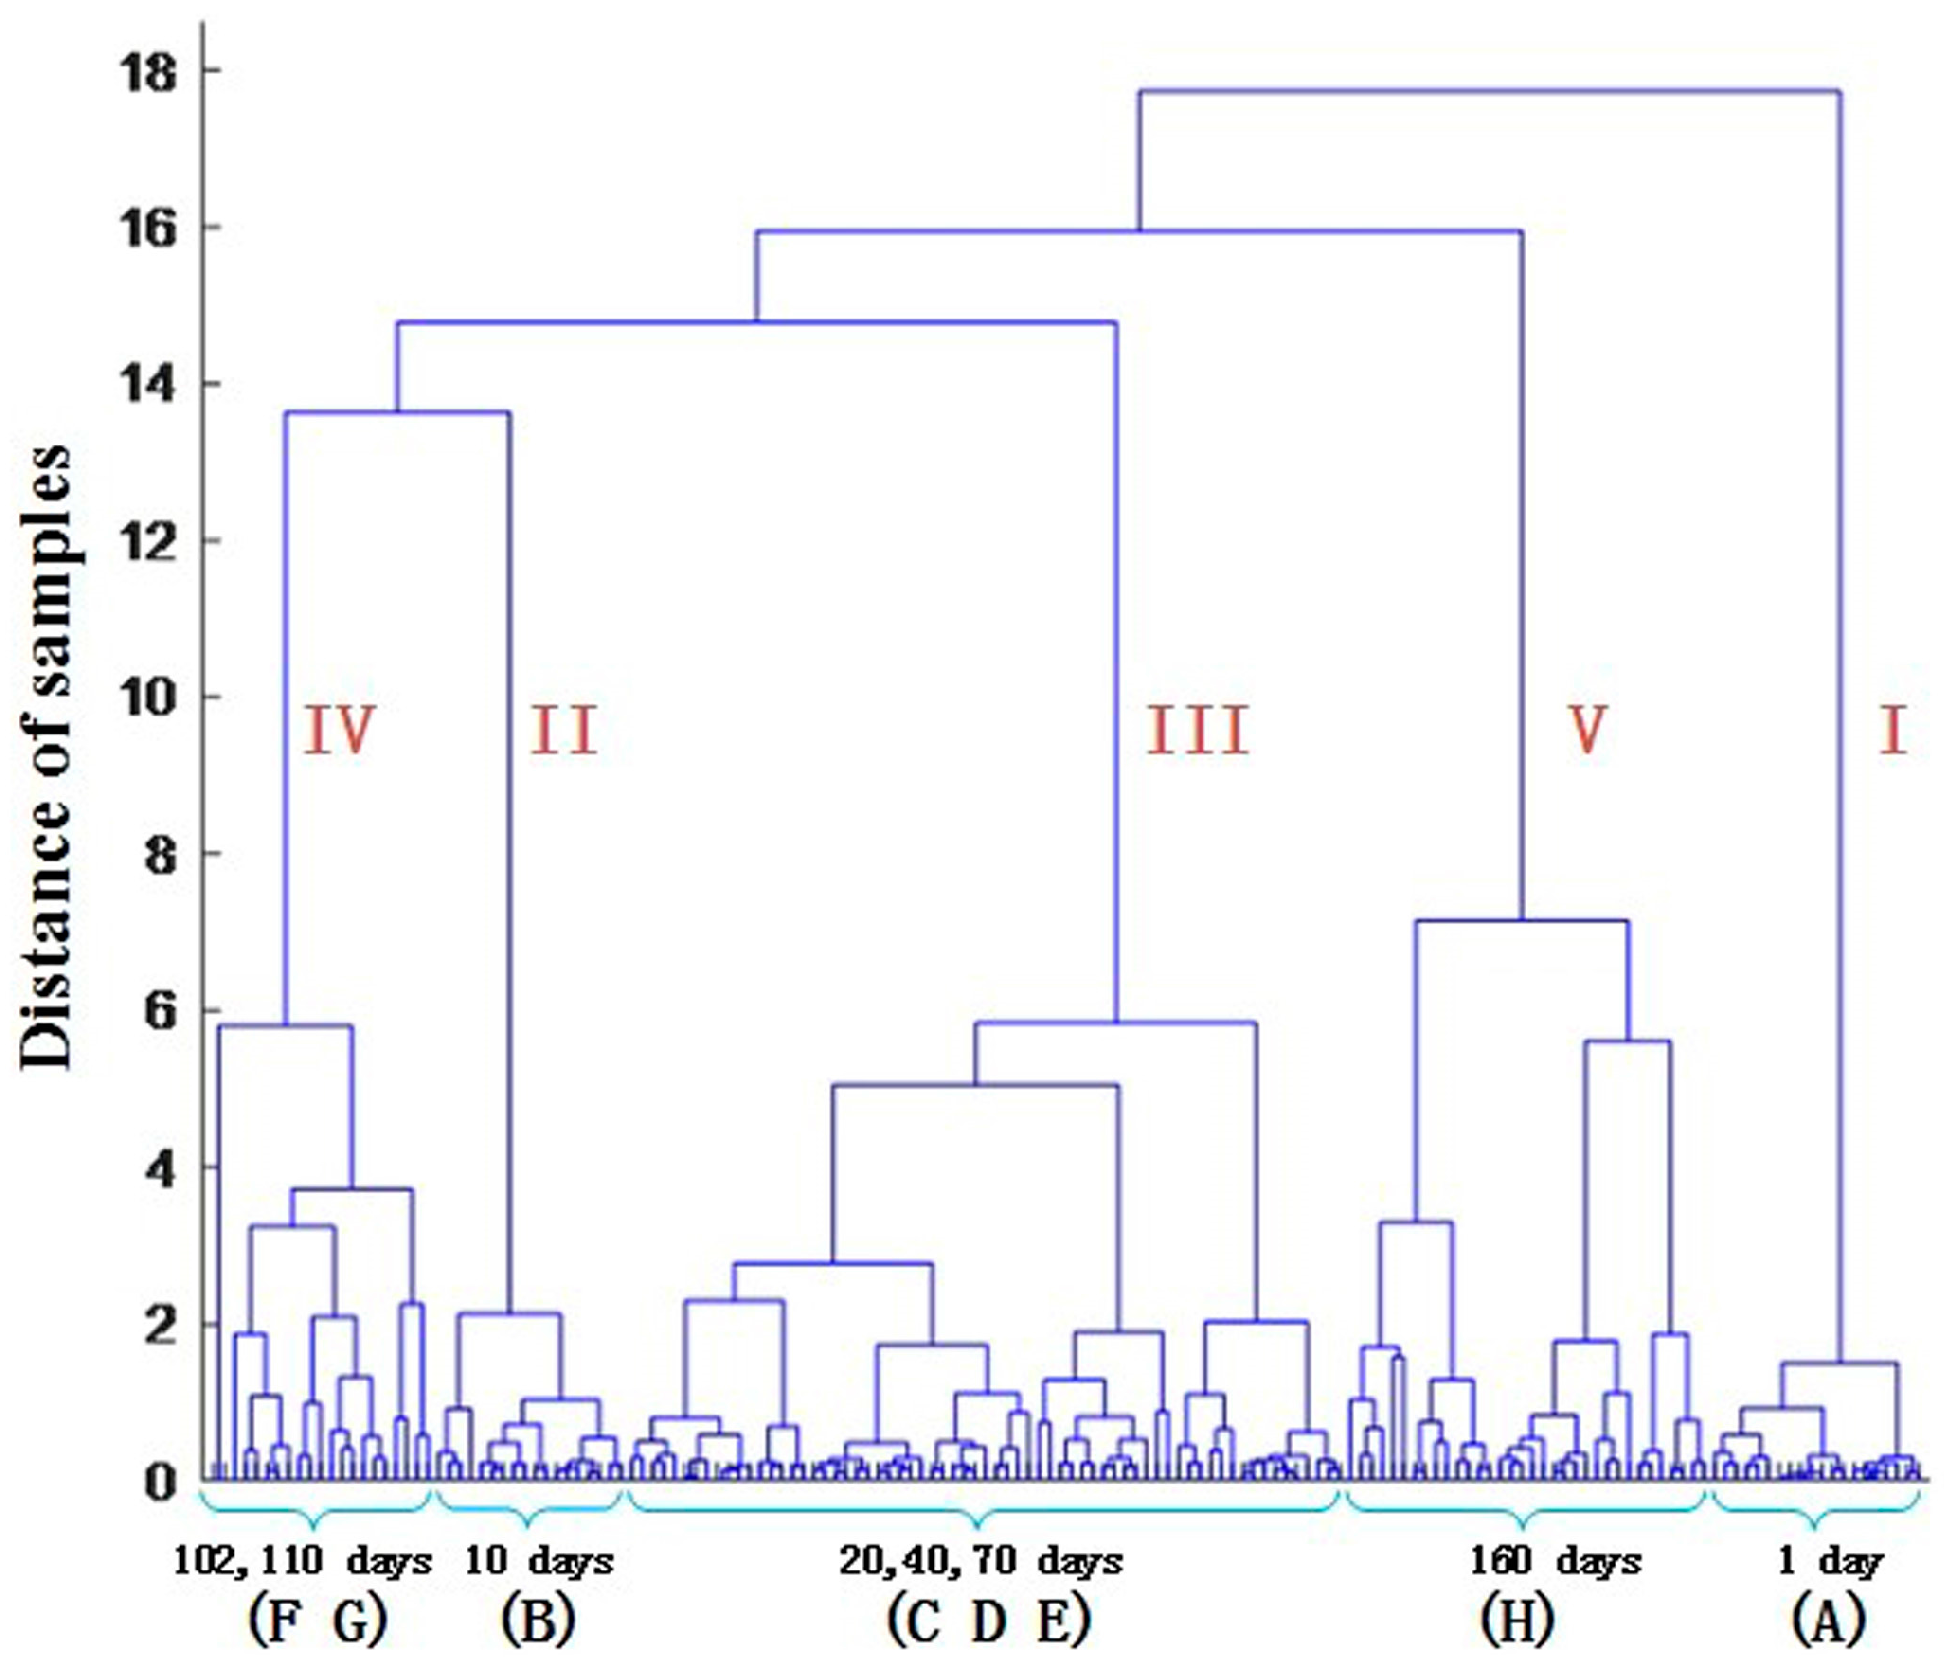
3.1 Classification of the Training Samples

We employed the entire Raman spectrum (390–3082 cm−1) to determine the most diagnostically significant Raman features and to improve the analysis and classification of the insulation oil. Firstly, the raw spectra were treated using the baseline correction and denoising method. After normalization, PCA was employed to observe the latent distribution of the samples subjected to the spectral pre-processing methods. As shown in Figure 4, the obtained PC scores indicate that the cumulative variance proportion of the first 12 PCs (PC1, PC2,…, PC12) reaches about 95%, which is diagnostically significant for discriminating oil-paper insulation of different aging conditions.
Although PCA analysis does not provide the answer for what the physical meaning of the PC component is, the loading plot can provide some hints related to the characteristic vibrational frequencies giving the dominant contribution to the components. Figure 5 is PCA loading plots 1, 2, 3 and 4 on the Raman spectra of the insulation oil; the loading indicated the variable's contribution to the principal component. The vibration characteristics of the loading weight are closely related to the contribution of the chemical composition to the principal components. Thus, the loading plots show us which vibrational bands have significantly contributed to the differences seen in the PCA plot, and provide more information on the Raman spectra of oil in each aging stage.
Some relatively high (positive and negative) values are marked and associated with their corresponding variables in the Raman spectra, such as peaks from furfural (1418 cm−1, 1470 cm−1 and 1670 cm−1), CO (2144 cm−1), CO2 (2802 cm−1); acetone, which is the recently proposed aging characteristic, generated peaks at 526 cm−1, 780 cm−1, 1211 cm−1 and 1712 cm−1 [29,37]. From the loading plot we can see that PC1 has a high correlation ranging all the Raman bands. PC2 has a positive correlation in the Raman bands of 1000–1500 cm−1 and 2750–3000 cm−1; PC3 has a high correlation in the Raman bands of 400–600 cm−1, 1900–2500 cm−1 and 2750–3000 cm−1; and PC4 has a high correlation in the Raman bands of 400–600 cm−1 and 2000–2800 cm−1.
Every 20 thermal accelerated aging samples were taken out from the aging ovens at eight time points of one, 10, 20, 40, 70, 102, 110 and 160 days and numbered from #1 to #160. The samples were divided into eight groups: A, B, C, D, E, F, G and H. The DP of the oil-impregnated papers was measured and the clustering analysis was conducted on the low-dimension features of all 160 oil samples. The clustering results of oil at different aging times provided the basis for the classification of the training samples. Mahalanobis distance and shortest distance methods were employed in clustering the characterization factors without any prior knowledge [38]. The clustering results are shown in Figure 6.
Observing the clustering spectra without any prior reference, we arrived at the following conclusions: firstly, the 160 samples could be divided into two classes when the distance of the samples was approximately 16.5. The samples aged for only one day (nearly fresh) were separated from those aged for more than 10 days. Secondly, when the distance of the samples was reduced to 15.5, the seriously aged (160 days) samples could be separated from the others. When the distance was set to 5–13, the samples aged for 10 days; 20, 40 and 70 days; 102 and 110 days belonged to three different aging stages, respectively. However, certain crosses occurred between classes in the clustering result. For instance, a few samples in group E (70 days) joined class IV with groups F (102 days) and G (110 days). Furthermore, some samples in group D (40 days) even jumped to class V and were classified together with group H (160 days). Nevertheless, we still divided the 160 training samples into five classes according to the real aging time. Corresponding to the average DPs of the oil-impregnated papers in the groups, these five classes represented the five aging stages.
According to the guide for the diagnosis of insulation aging in oil-immersed power transformers [39,40], the five training classes of the clustering results in Figure 7a represented five aging stages: fresh condition (DP > 800), early age (500 < DP < 800), medium age (250 < DP < 500), late age (150 < DP < 250) and terminal age (DP < 150). Figure 7b illustrated the utility of the first three PCs for the classification of the training samples. PC1, PC2 and PC3 retained high percentages of the total variance (44.77%, 31.06% and 8.23%, respectively). With the information on PC1, PC2 and PC3, classes I, II and V were clearly distinguished; however, the identification of class III and class IV initially did not achieve an ideal effect. By combined analysis of the loading plot (Figure 5) and the scores plot (Figure 7b), we can see that the aging process has a positive correlation with PC2, which can be largely ascribed to the generation of the typical aging characteristics (furfural, CO and CO2). Besides, the acetone shows a clear contribution to PC2. During the aging process, the break and formation of C–C and C=C may influence the contribution of bands 400–600 cm1 and 2750–3000 cm1. The information in the loading plot can also be used to discriminate the aging stage of the oil-paper insulation.

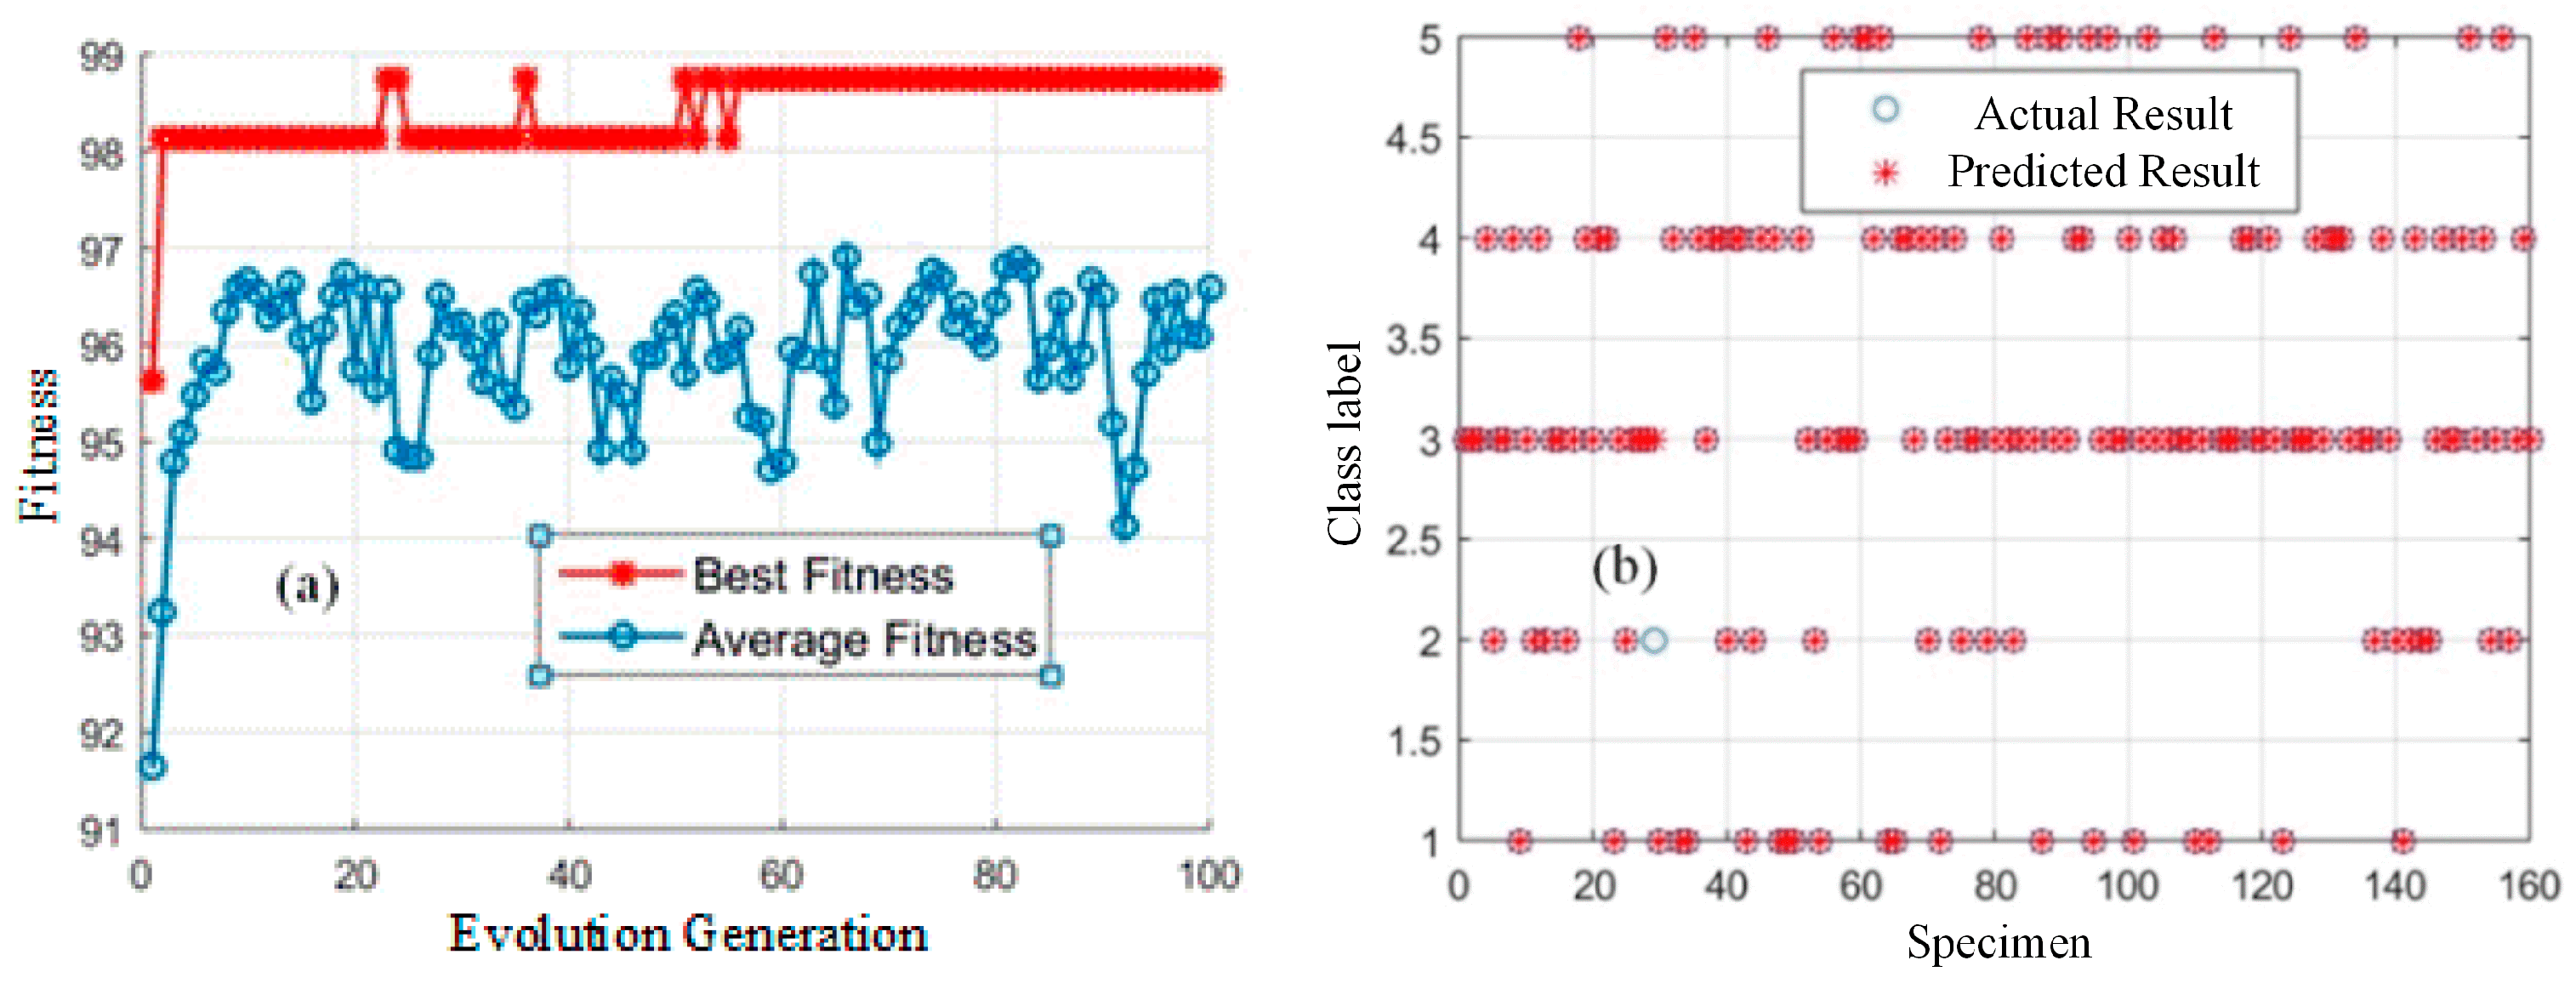
3.2 Results of the Multi-Classification SVM

Accordingly, all 12 diagnostically significant PCs were loaded into the multi-classification SVM model to generate a suitable diagnostic algorithm for aging stage classification and to improve oil diagnosis. Table 1 shows the classification results based on the PCA-SVM technique coupled with the 10-fold cross-validation method.
The classification results indicated that the PCA-SVM diagnostic algorithm demonstrated a significantly good capability in diagnosing the oil-paper insulation aging stage. In the 10-fold cross-validation for the original cases, the average accuracy of the 10 instances of training and testing was 92.5%. The method had the capability to distinguish fresh oil and serious aged oil clearly, but had a slight difficulty with the middle three aging stages.
In this study, the penalty parameter C and the kernel function parameters γ for SVM can be optimized by a genetic algorithm [40]. After being trained with the feature quality of the historic training data, the best parameters C and γ for SVM can be determined. For each chromosome representing C, γ and selected features, the training dataset is used to train the SVM classifier, while the testing dataset is used to calculate the classification accuracy. When the classification accuracy is obtained, each chromosome is evaluated by fitness function [41]. The fitness curve of seeking for the best C and γ of the SVM by GA is shown in Figure 8a. The best C and γ are 17.3 and 1.44, respectively. It can be seen from Figure 8b that the accuracy of the 10-fold cross-validation [42] has been raised to 99.37% (159/160).

3.3 Testing for the Established Diagnostic Method

In order to test the diagnostic capability and universality of the established algorithm, 105 testing samples with another weight ratio of oil and paper were accelerated for aging at 130 °C. The samples were prepared and aged following the procedure mentioned before. Every 15 samples were taken out from the aging ovens at aging times of zero, three, 11, 20, 30, 38 and 70 days. The average DP of the oil-impregnated papers at each aging time was measured. Although detecting results for the DPs of samples in same aging time may fluctuate a lot, the seven groups of samples were divided into five aging stages according to the average DP of each group. The classification result was shown in Figure 9a; there are 30, 15, 30, 15, 15 samples in each class.
The Raman spectrum of every oil sample was detected using the same experimental procedure. Firstly, each raw Raman spectrum was pre-treated by smoothing and baseline correction. Then, the dimension was reduced to 12 features by using the same transfer matrix obtained and used for the training samples in the PCA process. Figure 9b demonstrated the first three PCs of the 105 samples; it indicated that the testing samples, especially the middle three classes, were more confusing than the training samples. However, the fresh condition and serious aging still had high identification. Finally, the processed spectral data set was recognized by our multi-classification SVM trained by the 160 training samples mentioned before. Table 2 shows the testing diagnosis results by the established algorithm.
The results of the testing experiment were evaluated by the classification result of the average DP, which showed a decrease in the accuracy of the data set (73.3%). Results of the DP measurement indicated that the aging stages of the tested samples were more confusing than those of the training samples. The aging stage of some individual samples (e.g., samples aged for 20, 30 and 38 days) between two adjacent aging times was hardly identified even though the two groups had a clear difference in average DP. Furthermore, the errors in the DP measurement and spectral detection also had an impact on the accuracy of the testing experiment.

4. Discussion

Given that the oil-paper insulation aging process is part of a widely accepted multistep, continuum progression cascade from fresh insulation oil to insulation deterioration, the component and content distinction of insulation oils at each aging stage is vague, rendering the characterization and discrimination of these oils by Raman spectral analysis more challenging. The Raman spectral pattern between oil samples at each aging stage could be very similar. For these reasons, accurately classified training samples should be obtained to develop a robust diagnostic algorithm. In this study, the training samples were classified by clustering analysis and defined by the widely accepted gold standard for assessing the transformer aging stage, i.e., the DP of the papers aged together with oil.
However, this study did not focus on any specific characteristic products of oil-paper insulation aging for the following reasons: (1) The concentration of furfural in oil will fluctuate with a change in the operating temperature of a transformer; (2) Different weight ratio of oil and paper in a transformer will lead to different furfural content detection results for equipment at the same aging stage; (3) Even if gases are detected accurately, the employment of the most used methods (e.g., Rogers, International Electrotechnical Commission (IEC)ratio and Duval triangle) for DGA data may yield a certain percentage of incorrect diagnoses, and their significance is also easily misinterpreted [6]. In a Raman fingerprint information analysis, the quantitative detection of the specific components of the sample is not required; only the contents of the chemical components and the proportion relationship in the form of a macroscopic spectral signal are needed. Thus, the problem resulting from the presence of numerous components in transformer oil and the difficulties in qualitative and quantitative analyses are mitigated.
Although this study has provided milestone contributions, further work may focus on the following aspects. Firstly, the in situ detection based on Raman technology has not yet realized a precise quantitative analysis for the aging characteristics of substances in mineral oil. With the development of Raman detecting technology, such as the use of surface-enhanced Raman spectroscopy, the difference between insulation oil in every aging stage may be highlighted, and may ultimately realize quantitative analysis for characteristics in oil. Secondly, all the materials in this study are provided by the same company, prepared in the same mode, and aged in the same environment, whereas real operating transformers have different materials, structures, aging environments, and other conditions. Thirdly, the related data processing method and classification algorithm can still be optimized to improve the accuracy of the diagnosis. In order to make this diagnostic method suitable for field application, a great deal of work is required to collect oil-paper samples from transformer substations, which is helpful for the growth of the diagnostic model.

5. Conclusions

In summary, for the purpose of using more information contained in the Raman spectra for spectral analysis, a multivariate statistical analysis using an entire spectrum to determine the most diagnostically significant spectral features was proposed. The training samples were divided into five classes by cluster analysis and defined as five aging stages according to the DP of the insulating paper. The final accuracy of multi-classification SVM is 99.37% by 10-fold cross-validation. Although the algorithm did not perform as expected in the final test, the accuracy can principally meet the demand of engineering applications. The diagnosis accuracy can be further improved by enhancing the detection technology, adopting a higher laser power, classifying training samples accurately, adopting surface enhanced Raman scattering (SERS) and optimizing the algorithm. Therefore, the CLRS method can provide a new mode for realizing a fast, non-destructive, and comprehensive assessment of the aging state of oil-paper insulation.

Acknowledgments

The authors are grateful for the financial support from the National “111” Project of the Ministry of Education of China (No. B08036) and the National Natural Science Foundation of China (No. 61605020).

Author Contributions

The research presented in this paper was a collaborative effort among all authors. Weigen Chen and Jingxin Zou conceived and designed the experiments; Jingxin Zou and Zhou Fan performed the experiments; Weigen Chen, Jingxin Zou and Fu Wan wrote the paper; Zhou Fan and Lingling Du discussed the results and revised the manuscript critically.

Conflicts of Interest

The authors declare no conflict of interest.

References

  1. Aging of Cellulose in Mineral-Oil Insulated Transformers; Conseil International des Grands Réseaux Électriques (CIGRÉ): Paris, France, 2007.
  2. IEEE Guide for Loading Mineral Oil Immersed Transformers; IEEE: New York, NY, USA, 1995.
  3. Emsley, A.M. The kinetics and mechanisms of degradation of cellulosic insulation in power transformers. Polym. Degrad. Stab. 1994, 44, 343–349. [Google Scholar] [CrossRef]
  4. Emsley, A.M.; Xiao, X.; Heywood, R.J.; Ali, M. Degradation of cellulosic insulation in power transformers. Part 2: Formation of furan products in insulating oil. IEE Proc. Sci. Meas. Technol. 2000, 147, 110–114. [Google Scholar] [CrossRef]
  5. Emsley, A.M.; Xiao, X.; Heywood, R.J.; Ali, M. Degradation of cellulosic insulation in power transformers. Part 3: Effects of oxygen and water on aging in oil. IEE Proc. Sci. Meas. Technol. 2000, 147, 115–119. [Google Scholar] [CrossRef]
  6. N’cho, J.S.; Fofana, I.; Hadjadj, Y.; Beroual, A. Review of physicochemical-based diagnostic techniques for assessing insulation condition in aged transformers. Energies 2016, 9, 367. [Google Scholar] [CrossRef]
  7. Shroff, D.H.; Stannett, A.W. A review of paper aging in power transformers. IEE Proc. C Gener. Transm. Distrib. 1985, 132, 312–319. [Google Scholar] [CrossRef]
  8. Scheirs, J.; Camino, G.; Avidano, M.; Tumiatti, W. Origin of furanic compounds in thermal degradation of cellulosic insulating paper. J. Appl. Polym. Sci. 1998, 69, 2541–2547. [Google Scholar]
  9. Morais, R.M.; Mannheimer, W.A.; Carballeira, M.; Noualhaguet, J.C. Furfural analysis for assessing degradation of thermally upgraded papers in transformer insulation. IEEE Trans. Dielectr. Electr. Insul. 1999, 6, 159–163. [Google Scholar] [CrossRef]
  10. Höhlein, I.; Kachler, A.J. Aging of cellulose at transformer service temperatures. Part 2. Influence of moisture and temperature on degree of polymerization and formation of furanic compounds in free-breathing systems. IEEE Electr. Insul. Mag. 2005, 21, 20–24. [Google Scholar] [CrossRef]
  11. Okabe, S.; Ueta, G.; Tsuboi, T. Investigation of aging degradation status of insulating elements in oil-immersed transformer and its diagnostic method based on field measurement data. IEEE Trans. Dielectr. Electr. Insul. 2013, 20, 346–355. [Google Scholar] [CrossRef]
  12. Bruzzoniti, M.C.; Maina, R.; De Carlo, R.M.; Sarzanini, C.; Tumiatti, V. GC methods for the determination of methanol and ethanol in insulating mineral oils as markers of cellulose degradation in power transformers. Chromatographia 2014, 77, 1081–1089. [Google Scholar] [CrossRef]
  13. Ren, M.; Dong, M.; Liu, J. Statistical analysis of partial discharges in SF6 gas via optical detection in various spectral ranges. Energies 2016, 9, 152. [Google Scholar] [CrossRef]
  14. DuBois, M.; Gilles, K.A.; Hamilton, J.K.; Rebers, P.A.; Smith, F. Colorimetric method for determination of sugars and related substances. Anal. Chem. 1956, 28, 350–356. [Google Scholar] [CrossRef]
  15. Zheng, Y.; Sun, C.; Li, J.; Yang, Q.; Chen, W. Entropy-based bagging for fault prediction of transformers using oil-dissolved gas data. Energies 2011, 4, 1138–1147. [Google Scholar] [CrossRef]
  16. Xiang, C.; Zhou, Q.; Li, J.; Huang, Q.; Song, H.; Zhang, Z. Comparison of dissolved gases in mineral and vegetable insulating oils under typical electrical and thermal faults. Energies 2016, 9, 312. [Google Scholar] [CrossRef]
  17. Guide to the Interpretation of Dissolved and Free Gases Analysis; IEC Publication: Geneva, Switzerland, 2007.
  18. Shintemirov, A.; Tang, W.; Wu, Q.H. Power transformer fault classification based on dissolved gas analysis by implementing bootstrap and genetic programming. IEEE Trans. Syst. Man Cybern. Part C 2009, 39, 69–79. [Google Scholar] [CrossRef]
  19. Su, Q.; Mi, C.; Lai, L.L.; Austin, P. A fuzzy dissolved gas analysis method for the diagnosis of multiple incipient faults in a transformer. IEEE Trans. Power Syst. 2000, 15, 593–598. [Google Scholar] [CrossRef]
  20. Kelly, J.J. Transformer fault diagnosis by dissolved-gas analysis. IEEE Trans. Ind. Appl. 1980, IA-16, 777–782. [Google Scholar] [CrossRef]
  21. Arakelian, V.G. The long way to the automatic chromatographic analysis of gases dissolved in insulating oil. IEEE Electr. Insul. Mag. 2004, 20, 8–25. [Google Scholar] [CrossRef]
  22. Terry, S.C.; Jerman, J.H.; Angell, J.B. A gas chromatographic air analyzer fabricated on a silicon wafer. IEEE Trans. Electron Devices 1979, 26, 1880–1886. [Google Scholar] [CrossRef]
  23. Bateni, A.; Erdem, E.; Repp, S.; Weber, S.; Somer, M. Al-doped MgB2 materials studied using electron paramagnetic resonance and Raman spectroscopy. Appl. Phys. Lett. 2016, 108, 202601. [Google Scholar] [CrossRef]
  24. Schicks, J.M.; Spangenberg, E.; Giese, R.; Steinhauer, B.; Klump, J.; Luzi, M. New approaches for the production of hydrocarbons from hydrate bearing sediments. Energies 2011, 4, 151–172. [Google Scholar] [CrossRef]
  25. Kiefer, J. Recent advances in the characterization of gaseous and liquid fuels by vibrational spectroscopy. Energies 2015, 8, 3165–3197. [Google Scholar] [CrossRef]
  26. Kong, W.D.; Wu, S.F.; Richard, P.; Lian, C.S.; Wang, J.T.; Yang, C.L.; Shi, Y.G.; Ding, H. Raman scattering investigation of large positive magnetoresistance material WTe2. Appl. Phys. Lett. 2015, 106, 081906. [Google Scholar] [CrossRef]
  27. Teh, S.K.; Zheng, W.; Ho, K.Y.; Teh, M.; Yeoh, K.G.; Huang, Z. Diagnostic potential of near-infrared Raman spectroscopy in the stomach: Differentiating dysplasia from normal tissue. Br. J. Cancer 2008, 98, 457–465. [Google Scholar] [CrossRef] [PubMed]
  28. Somekawa, T.; Fujita, M.; Izawa, Y.; Kasaoka, M.; Nagano, Y. Furfural analysis in transformer oils using laser raman spectroscopy. IEEE Trans. Dielectr. Electr. Insul. 2015, 22, 229–231. [Google Scholar] [CrossRef]
  29. Li, X.Y.; Xia, Y.X.; Huang, J.M.; Zhan, L. A Raman system for multi-gas-species analysis in power transformer. Appl. Phys. B 2008, 93, 665–669. [Google Scholar] [CrossRef]
  30. Reinsch, C.H. Smoothing by spline functions. Numer. Math. 1967, 10, 177–183. [Google Scholar] [CrossRef]
  31. Smith, R., Jr.; Price, J.; Howser, L. A Smoothing Algorithm Using Cubic Spline Functions; NASA-TN-D-7397; NASA: Washington, WA, USA, 1974.
  32. Zhang, Z.-M.; Chen, S.; Liang, Y.-Z. Baseline correction using adaptive iteratively reweighted penalized least squares. Analyst 2010, 135, 1138–1146. [Google Scholar] [CrossRef] [PubMed]
  33. Jiang, X.; Xia, Y.; Hu, J.; Zhang, Z.; Shu, L.; Sun, C. An S-transform and support vector machine (SVM)-based online method for diagnosing broken strands in transmission lines. Energies 2011, 4, 1278–1300. [Google Scholar] [CrossRef]
  34. Lachenbruch, P.A.; Mickey, M.R. Estimation of error rates in discriminant analysis. Technometrics 1968, 10, 1–11. [Google Scholar] [CrossRef]
  35. Devore, J.L. Probability and Statistics for Engineering and the Sciences; Cengage Learning: Boston, MA, USA, 2015. [Google Scholar]
  36. Hsu, C.; Lin, C. A comparison of methods for multiclass support vector machines. IEEE Trans. Neural Netw. 2002, 13, 415–425. [Google Scholar] [PubMed]
  37. Chen, W.; Gu, Z.; Zou, J.; Wan, F.; Xiang, Y. Analysis of furfural dissolved in transformer oil based on confocal laser Raman spectroscopy. IEEE Trans. Dielect. Electr. Insul. 2016, 23, 915–921. [Google Scholar] [CrossRef]
  38. De Maesschalck, R.; Jouan-Rimbaud, D.; Massart, D.L.L. The Mahalanobis distance. Chemom. Intell. Lab. Syst. 2000, 50, 1–18. [Google Scholar] [CrossRef]
  39. Saha, T.K. Review of modern diagnostic techniques for assessing insulation condition in aged transformers. IEEE Trans. Dielect. Electr. Insul. 2003, 10, 903–917. [Google Scholar] [CrossRef] [Green Version]
  40. Van Bolhuis, J.P.; Gulski, E.; Smit, J.J. Monitoring and diagnostic of transformer solid insulation. IEEE Trans. Power Deliv. 2002, 17, 528–536. [Google Scholar] [CrossRef]
  41. Huang, C.; Wang, C. A GA-based feature selection and parameters optimization for support vector machines. Expert Syst. Appl. 2006, 31, 231–240. [Google Scholar] [CrossRef]
  42. Kohavi, R. A study of cross-validation and bootstrap for accuracy estimation and model selection. In Proceedings of the 14th International Joint Conference on Artificial intelligence, San Francisco, CA, USA, 20–25 August 1995; Volume 2, pp. 1137–1143.
Figure 1. Schematic diagram of the CLRS liquid detection test platform.
Energies 09 00946 g001
Figure 2. Data pre-processing for Raman spectra of oil samples.
Energies 09 00946 g002
Figure 3. Oil samples and the shape of Raman spectra: (a) Four oil samples collected at different aging times; (b) Raw Raman spectra of the insulation oil samples for different aging times.
Energies 09 00946 g003
Figure 4. Cumulative variance of the first 12 principal components.
Energies 09 00946 g004
Figure 5. The first four diagnostically significant principal components (PCs). PCA loading plot for (a) PC1; (b) PC2; (c) PC3 and (d) PC4.
Energies 09 00946 g005
Figure 6. Clustering results of the oil samples.
Energies 09 00946 g006
Figure 7. Classification result of training samples: (a) Relationship between DP and aging time; (b) Scatter plots of the PC scores for five classes of oil samples, with the PC scores derived from the Raman spectra.
Energies 09 00946 g007
Figure 8. GA-optimized PCA-SVM for aging stage assessment of oil-paper insulation: (a) The fitness curve of seeking the best C and γ by GA; (b) Classification results of the training samples.
Energies 09 00946 g008
Figure 9. Classification results of testing samples: (a) Relationship between DP and aging time; (b) Scatter plots of the PC scores for five classes of oil samples, with the PC scores derived from the Raman spectra.
Energies 09 00946 g009
Table 1. Confusion matrix for the support vector machine.
True ClassPredicted ClassTrue Positive RatesPositive Predictive Values
IIIIIIIVV
I19010095.0%100%
II01730085.0%94.4%
III01590098.3%84.3%
IV00634085.0%100%
V00101995.0%100%
Table 2. Results of the testing experiment using GA-SVM.
Aging Time (Day)Average DPTrue ClassPredicted ClassAccuracy
IIIIIIIVV
01124I14010093.3%
3916I12111080.0%
11621II2921160.0%
20449III13101066.7%
30382III01120280.0%
38221IV1138253.3%
70132V00121280.0%

