Article

Effect of Air Staging Ratios on the Burning Rate and Emissions in an Underfeed Fixed-Bed Biomass Combustor

Industrial Engineering School, University of Vigo, Campus Lagoas-Marcosende, s/n, 36310 Vigo, Spain
*
Author to whom correspondence should be addressed.
Energies 2016, 9(11), 940; https://doi.org/10.3390/en9110940
Submission received: 8 September 2016 / Revised: 31 October 2016 / Accepted: 4 November 2016 / Published: 11 November 2016

Abstract

:
This experimental work studies a small-scale biomass combustor (5–12 kW) with an underfed fixed bed using low air staging ratios (15%–30%). This document focuses on the influence of the operative parameters on the combustion process, so gaseous emissions and the distribution and concentration of particulate matter have also been recorded. The facility shows good stability and test repeatability. For the studied airflow ranges, the results show that increasing the total airflow rate does not increase the overall air excess ratio because the burning rate is proportionally enhanced (with some slight differences that depend on the air staging ratio). Consequently, the heterogeneous reactions at the bed remain in the so-called oxygen-limited region, and thus the entire bed operates under sub-stoichiometric conditions with regards of the char content of the biomass. In addition, tests using only primary air (no staging) may increase the fuel consumption, but in a highly incomplete way, approaching a gasification regime. Some measured burning rates are almost 40% higher than previous results obtained in batch combustors due to the fixed position of the ignition front. The recorded concentration of particulate matter varies between 15 and 75 mg/Nm3, with a main characteristic diameter between 50 and 100 nm.

1. Introduction

Some of the main concerns that accompany the increasingly widespread use of biomass boilers in the household energetic sector are the following: first, boiler efficiency [1,2], the study of the main operating parameters and their influence on combustion [3,4,5,6,7,8,9]; second, the high gaseous emissions, which cause pollution [3,4,5,10,11]; and finally, the high production of particulate matter (PM) smaller than 2.5 μm [4,7,10,11,12], which is considered dangerous to both human beings and the environment [13].
To increase the understanding of the abovementioned problems, some investigations are being carried out. In some cases, commercial boilers are being used [10,11,14], whereas in other cases, pilot-scale plants with several measurement devices have been designed [3,4,5,7,15,16,17,18]. Numerous experimental studies have been conducted in biomass lab-scale plants, most of which have only primary air inputs and the feeding is conducted in batches [7,19,20,21]. For this study, an underfeed fixed-bed biomass combustor with primary and secondary air inputs and a continuous feeding system has been designed and manufactured. There are not many studies conducted in boilers of these characteristics so far [4,22,23].
Many studies have been carried out to analyze the influence of operative parameters on the combustion in small-scale biomass combustion plants [3,5,24]. It has been demonstrated that one of the most important parameters is the primary air flow rate [24]. Depending on the primary airflow through the bed, three different stages of combustion can be identified [7,24]. If the amount of air supplied is small, the availability of oxygen limits the combustion and the facility consequently operates in sub-stoichiometric conditions. This stage is known by the term “oxygen-limited” in which the total amount of char consumed increases linearly as the total quantity of primary air flow rate increases. When the quantity of oxygen increases over a certain limit, the aforementioned linear relationship is broken and the propagation of the reaction front is limited by the burning rate, and the process evolves from strongly sub-stoichiometric towards stoichiometric. In numerous studies, this stage is known as “fuel limited”. Finally slightly above the stoichiometric proportion of fuel reaction rate and air flow rate the burning is quenched by convection leading to the sudden cease of the reaction in the bed [6,8,16,25,26].
In underfed biomass fixed beds using only primary air, the maximum front velocity is obtained under sub-stoichiometric conditions, in which cooling effects from the air excess are minimum [7,16]. One of the possible disadvantages of working on the bed at sub-stoichiometric conditions is the risk of a higher carbon content in the residual ash and the presence of CO in the exhaust gases [24]. If the flowrate is increased, the combustion is better, but there is a critical flowrate from which the combustion rate starts to decrease [6,7,8,24]. Other facilities have shown the effect of air preheating on combustion, causing the acceleration of the ignition and burning rates [19,23,27,28]. It has been proven to enhance burning rate, improving the output power and efficiency of the boiler [29,30]. Aside from the aforementioned parameters, there are still too few studies focused on the effect of the secondary air [4,7].
As previously mentioned, the high emissions of particulate matter are also among the most important problems in biomass combustion compared to gaseous and liquid fossil fuels. This leads to growing concerns for the development of cost-effective techniques to reduce aerosol emissions in small-scale biomass boilers [31]. To characterize the behavior of the particulate matter, the most important parameters are their size, mass and composition. Fernandes et al. [10,11] tested a 22 kW commercial biomass boiler in steady state to study the chemical and morphological characteristics of these particles. They used a three-stage cascade impactor and performed PM characterization by means of SEM/EDS techniques. To determine the range of PM concentration in small-scale pellet boilers, numerous studies have been carried out and have found it may vary from 10 to 70 mg/Nm3 [31,32,33,34,35,36] but mostly between 30 and 60 mg/Nm3 [32,34,37]. Larger-scale boilers (on the order of MW) have been situated in the 50–85 mg/Nm3 range [38,39]. It is almost impossible to compare the exact conditions and methodologies of the experiments performed in each combustion system; therefore, it can be concluded that regular biomass boilers using wood pellets, no matter their size and technology, produce PM emissions in the range of 10 to 100 mg/Nm3.
It has been extensively stated that most particles emitted by biomass combustion systems have diameters less than one micrometer [10,14,31,34,37], and a bimodal distribution may be the result of entrainment of coarse particles when the sampling point is close enough to the flame [4,10,15]. Conversely, when the flame is far from the place where the measurement is taken, the size distribution of the particles can be unimodal [34].
Gaseous emissions are normally measured in parallel with particles. There are several works that associate operative parameters and features of the fuel with the gaseous emissions, such as the release of CO that increases with the amount of moisture in the fuel [40] or the increase in CO and CH4 concentration with small fuel particles [41]. The fuel-feeding ratio and air excess affect not only the gaseous emissions but also the combustion efficiency [25]. It was also shown that emissions of CO, CxHy and NO are highly influenced by air excess [42] and that adequate air staging reduces NOx emissions [38] but may increase CO [5].
The facility developed for this work is an underfeed fixed-bed burner with primary and secondary air inlets. The tests performed aim to increase the available data using different air staging ratios and their effects in terms of burning rate and emissions (gaseous and particulate matter).

2. Materials and Methods

2.1. Fuels

Three different types of commercial wood pellets (wp1, wp2 and wp3) without additives have been tested. They all have a 6 mm diameter and a characteristic length of approximately 20 mm but a slightly different composition as they were provided from different commercial batches. Their proximate and elemental analyses are shown in Table 1. The presence of other minor elements such as Cl or S was not detected because their values are below the equipment detection limit (DL = 0.30%). As shown, there is no large difference among the fuels except for the ash content, which increases sharply for wp3.
An assessment of the performance of the different fuels is not intended this work. However, different batches supplied from the same company during the tests presented the abovementioned variable composition. These differences are not believed to be critical for the experiments but were monitored during the tests to avoid uncontrolled side-effects.

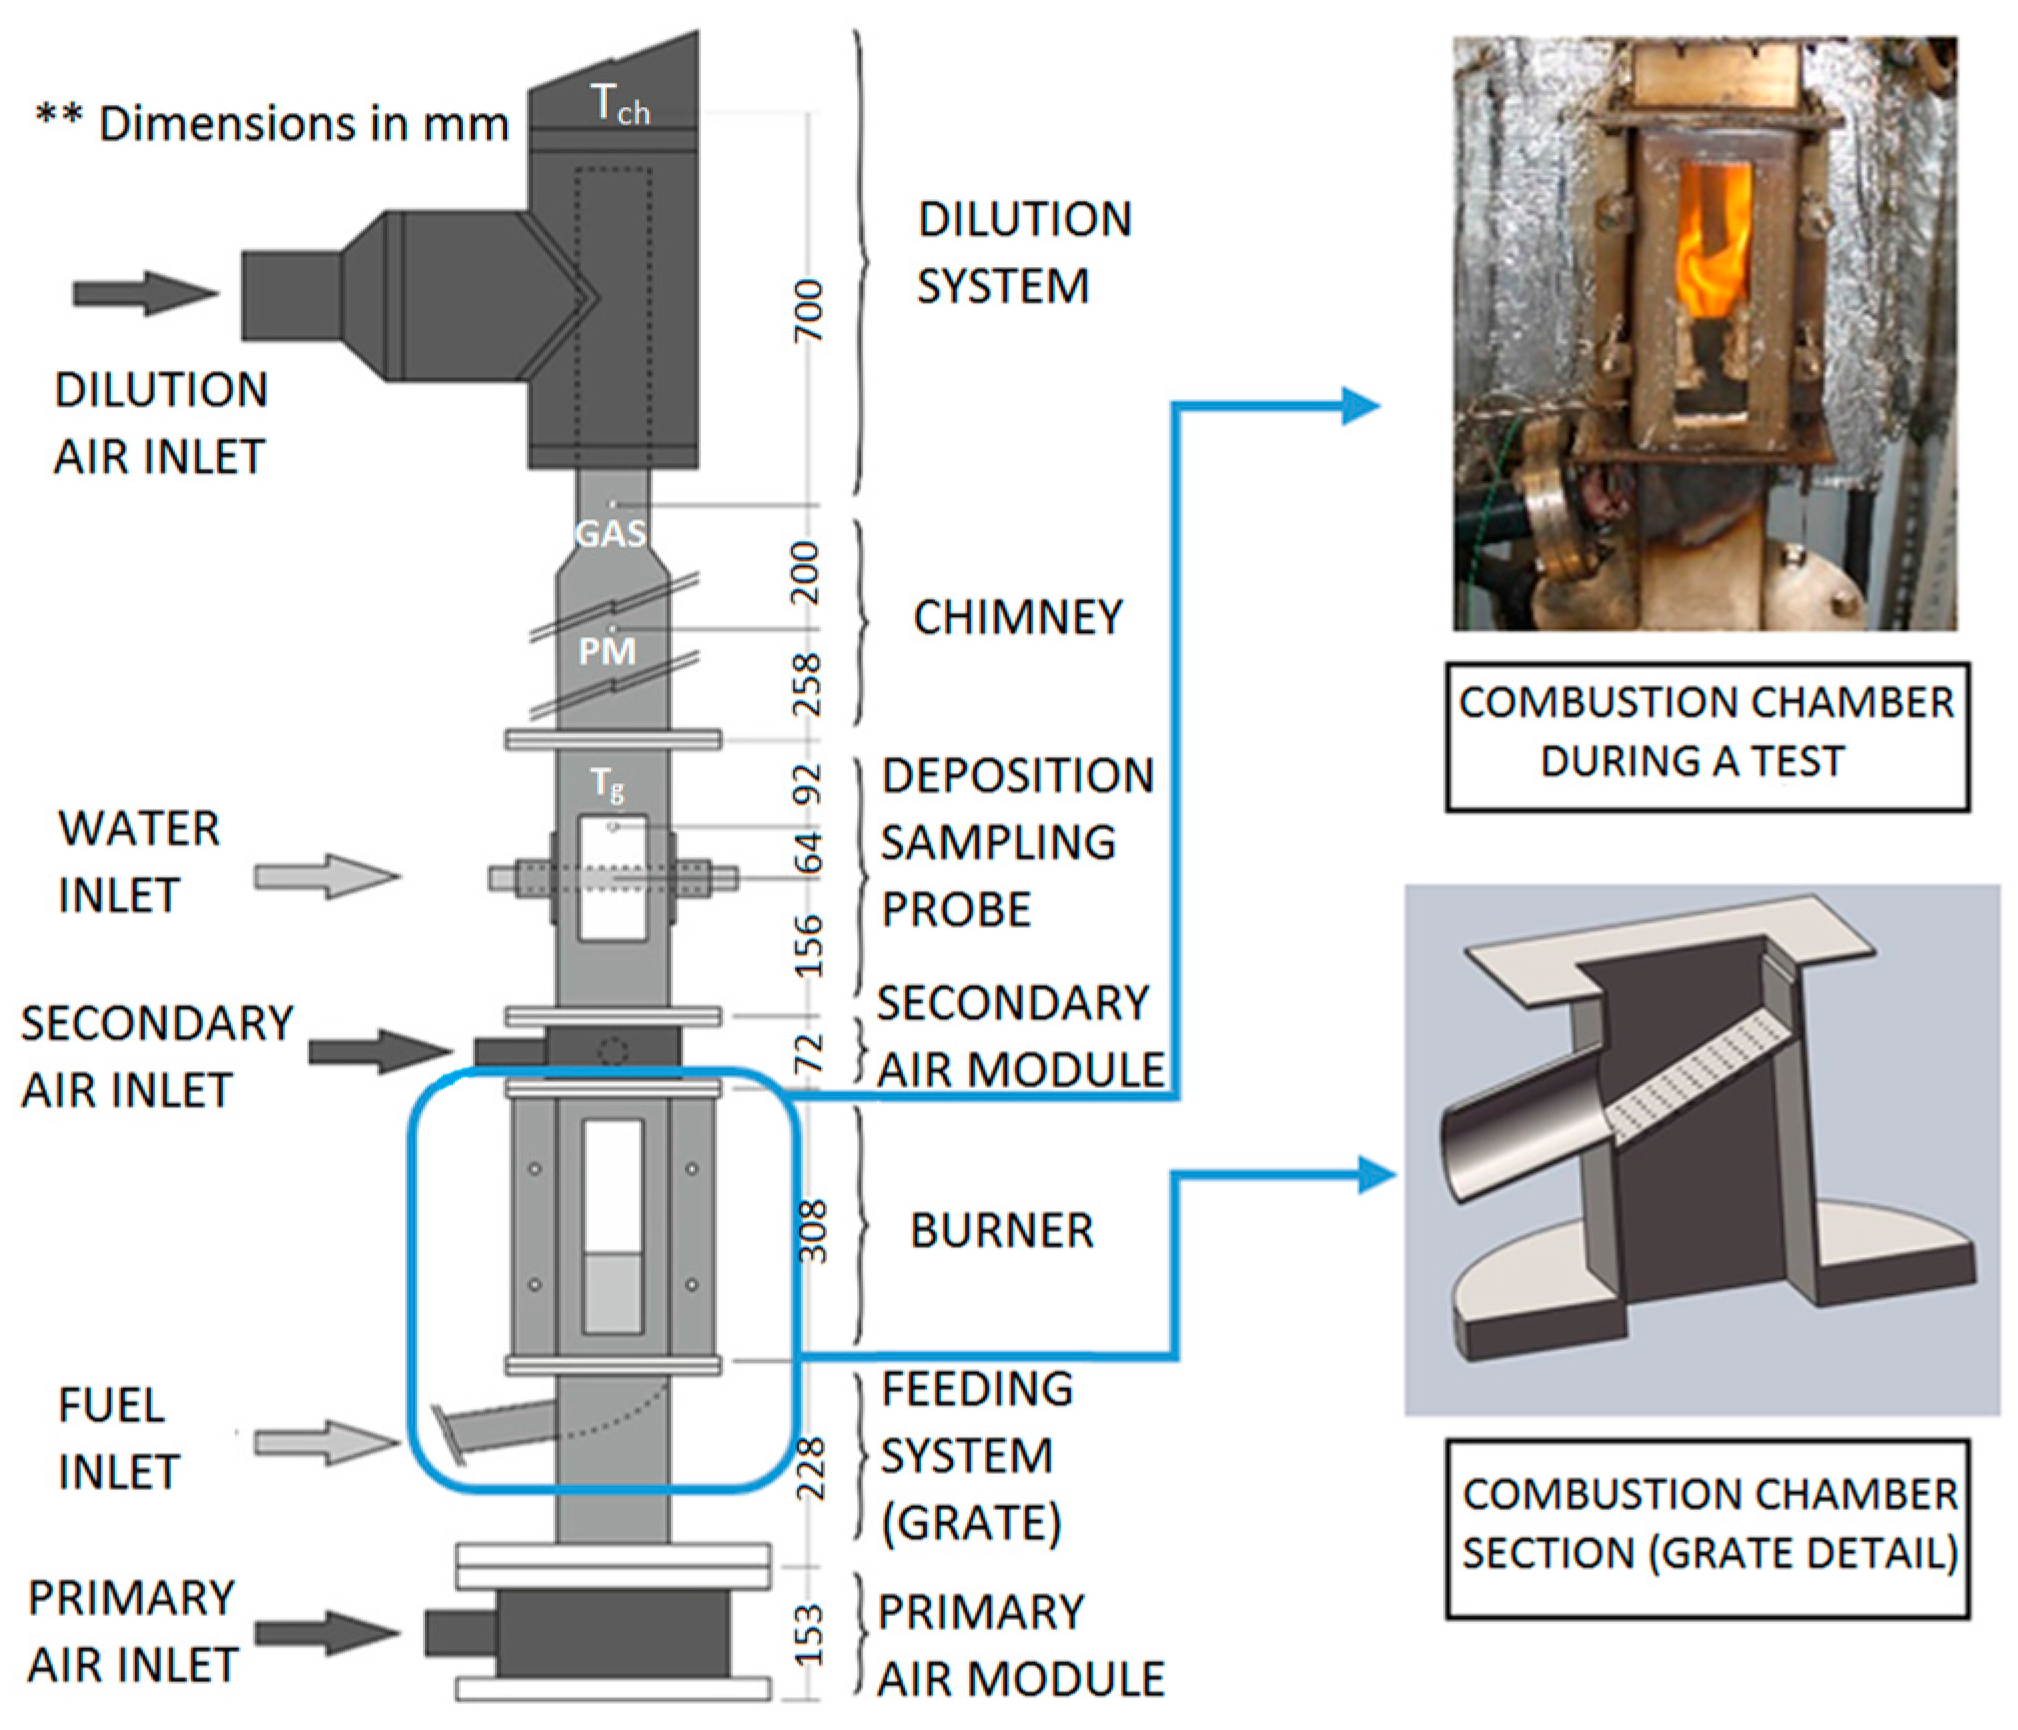
2.2. Description of the Pilot Plant

The general scheme of the facility and its different sections is shown in Figure 1. It can be defined as a low-scale combustor with underfeed fixed-bed and air staging by means of primary and secondary air. The power produced is variable but in the range of 5–12 kWth (300–900 kW/m2).
Primary air ( m ˙ 1 ) is supplied through the lowest module. It flows into the feeding system and through the grate to reach the bed. The air is supplied by a centrifugal fan and measured with an inline mass flow sensor VPF.R200.100 (0.5% fs) with a 1-inch connection. The fan is controlled by means of an Altivar 31 variable frequency drive coupled to an Omron E5CK digital PID controller. Therefore the fan speed is continuously adapted to maintain a constant air flow rate despite the small variations in the packed bed height. The biomass feeding unit is positioned just above. The pelletized biomass is transported from the hopper by a screw, which feeds it directly into the curved grate. The fuel entering beneath the chamber pushes the bed upwards. By controlling the duty (on/off ratio) of the feeding system, at steady state, fuel is supplied at the same rate at which it is consumed. A load cell measures the weight loss at the hopper, which is used to determine the average fuel feeding rate or burning rate ( m ˙ f ) .
The burner body has a square shape with an inner side of 120 mm, and it is made of AISI 310 stainless steel. It has a partially transparent gate in the front panel. The access to the interior is allowed through this removable part, which also provides visual information about the process and bed height. The burner is not insulated but is surrounded by radiation reflection panels.
The facility includes a secondary air inlet ( m ˙ 2 ) above the burner. This body is made of AISI 316 stainless steel, and the air is introduced normal to the surface by means of 44 holes (4.4 mm diameter) uniformly distributed along the inner perimeter. An identical system to that described for primary air is used to control the mass flow rate of secondary. The combustor does not have any air preheating system so both the primary and secondary air are introduced at room temperature (20–25 °C).
A deposition-sampling module with a 25 mm diameter is placed just above. It consists of a sampling probe (water-cooled tube), which transversally crosses the combustor approximately 400 mm above the surface of the bed. Fouled matter can be collected and measured in this device to analyse the fouling tendency of the fuel. The deposition process can be visually supervise through a window developed for that purpose. The flue gas temperature ( T g ) is acquired using a K-type thermocouple 64 mm over the sampling tube.
On the top, the dilution system cools the flue gases with fresh air before leaving the facility into the chimney. This module is not considered as a tertiary air inlet because any reaction taking place in this region is far from the combustion zone and does not have any influence there. However, it has an influence on the composition of the gas downstream; therefore, the sampling ports to measure pollutant emissions and PM were placed below this dilution. The isokinetic impactor port is 800 mm above the bed and 350 mm above the thermocouple spot. The sampled gas is suctioned through an isothermal line and introduced without a dilution tunnel into a heated 13-stage Dekati low-pressure cascade impactor (DLPI). The gaseous emissions are measured using a Servomex 4900 analyser (Servomex Group Ltd: East Sussex, UK) whose sampling port is 200 mm above the impactor.

2.3. Experimental Methodology

Steady state combustion is sustained for at least 3 h in every test performed in this work. Larger periods of combustion were tested but discarded owing to disturbances in the process produced by small accumulations of ash and unburnt matter in the bed. The influence of these phenomena in the process within the 3 h period is small, as will be shown. Aside from that, every test also includes two transient periods, start-up (45 min) and switch-off (approximately 15 min). During switch-off, airflow rates are maintained, but fuel feeding is stopped, allowing consumption of the fuel remaining in the grate.
Both the impactor and the extraction tube are wrapped with a heating jacket at 120 °C to avoid inline condensation and the temperature in the collecting point varies between 200 and 300 °C, depending on the test conditions. The collection substrates employed are made of aluminum. Preliminary measurements of particulate matter in this facility were carried out using back-up filter in the 13-stage DLPI. The results showed that more than the 95% of the mass is retained in the previous stages. Considering this, the back-up filters were removed to simplify the measurement methodology.
Preliminary tests noted a certain evolution of the plant during the steady state. Figure 2 depicts the total PM concentration for more than 30 assays using the same operative conditions and fuel type, changing only the moment of the sampling. The PM sampling time was varied from 30 to 240 min after reaching the steady state. In terms of particulate emissions, it seems that remaining ash and unburnt matter in the bed increase the particle concentration. This phenomenon does not seem to significantly affect other parameters, but PM measurements are more sensitive because more particulates in the bed are susceptible to be elutriated. For similar reasons, the combustion process may also be worsened, producing slightly higher CO emissions and leading to higher PM concentrations. This fact may reduce the accuracy of the measurements, so its effect is minimized by consistently using the same sampling time, which is 60 min after stability.
The composition of the gas is sampled in a port just before the dilution entry (see Figure 1). The gas is cooled and dried before entering the analyzer using a gas conditioner which model is JCC type L-112401 and emissions (CO, CO2, NOx and O2) are continuously recorded throughout the test with a Servomex gas analyzer.

3. Results and Discussion

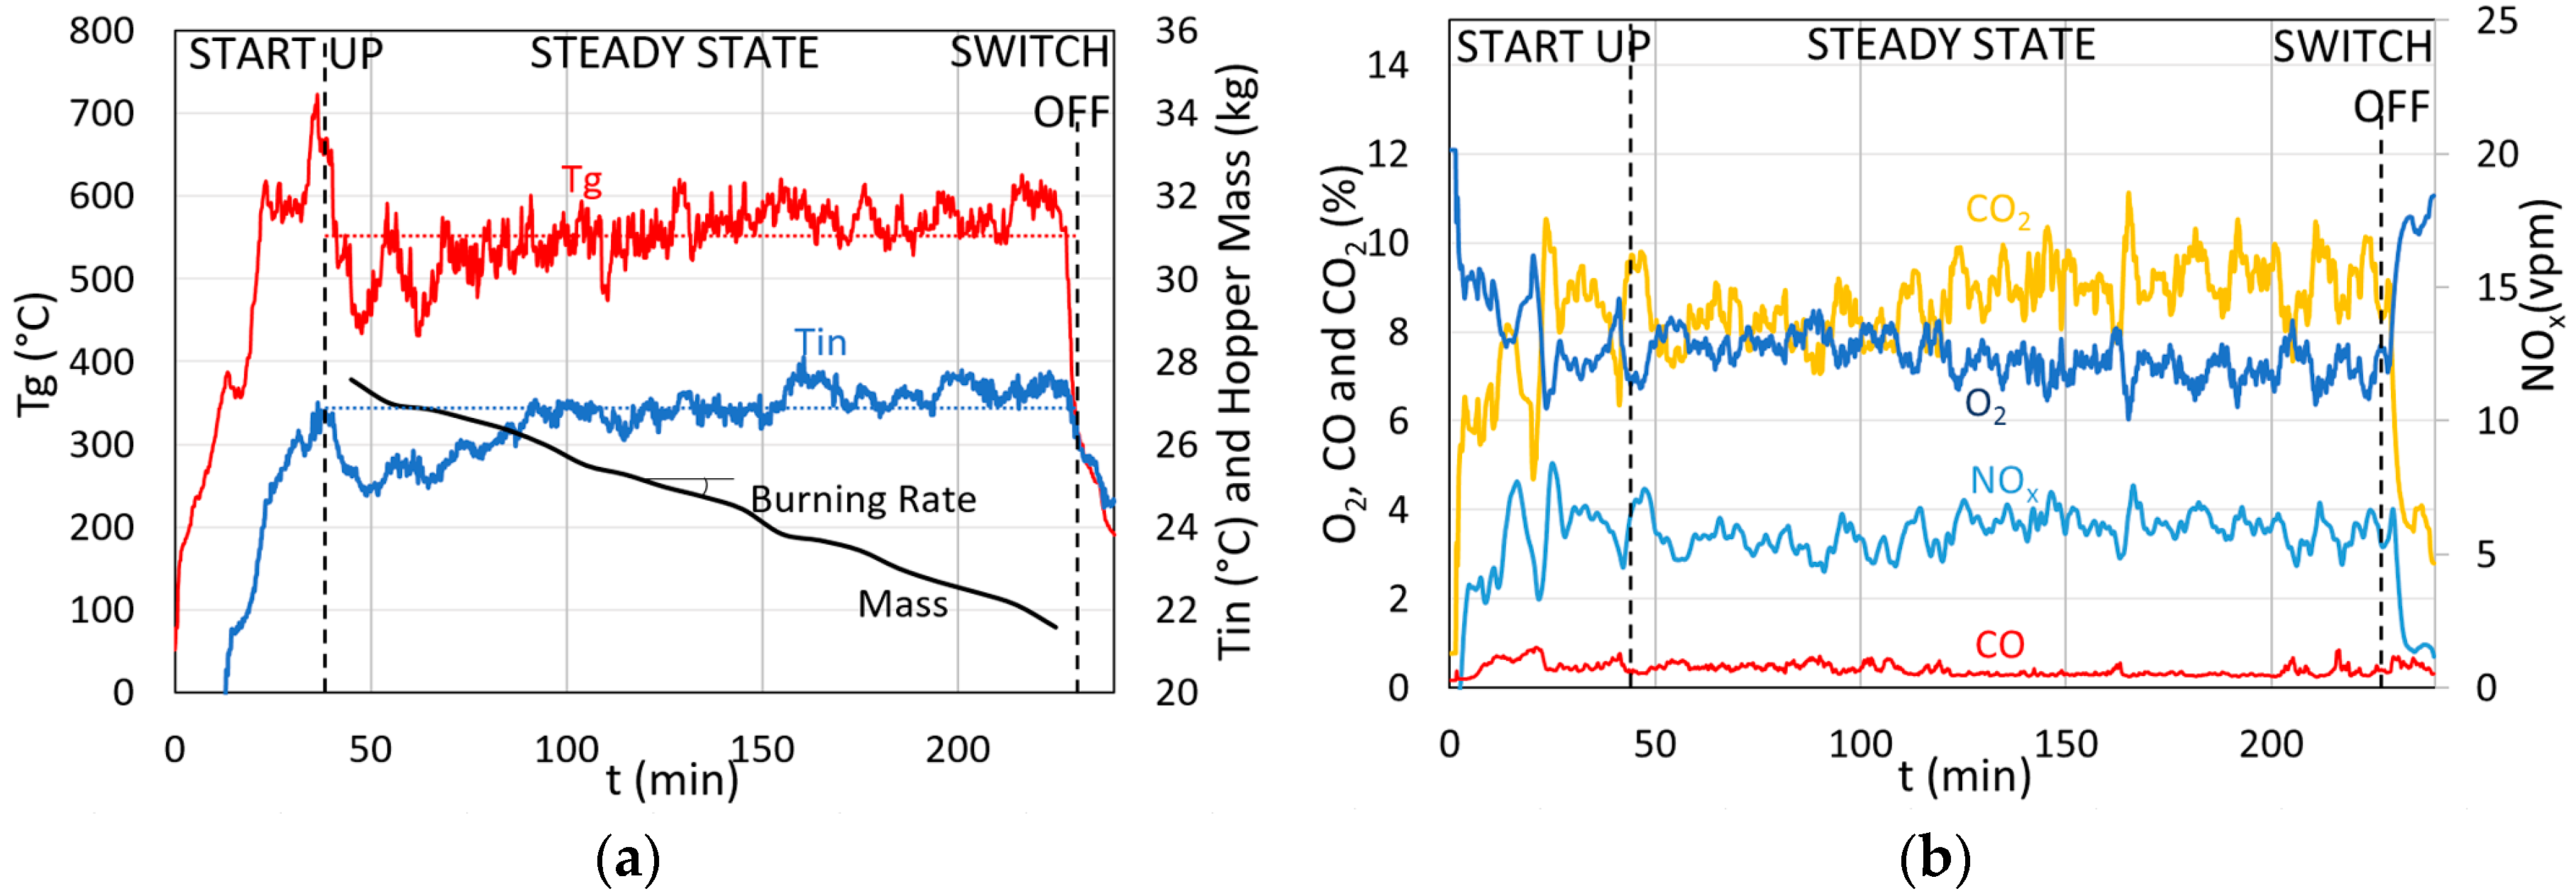
3.1. Plant Stability and Repeatability

After the construction and initial trials of the plant, setup tests were run to assess the stability and repeatability of the system. With this aim, results from several tests (more than 45) performed under the same conditions were analysed. The relative deviations for the main variables (burning rate and gas temperature) have been calculated. These calculations include experiments using the three different fuels at a constant airflow rate of 0.457 (kg/m2s) while varying only the air staging ratio. The air staging ratios (φ) used in these tests were selected between 15% and 30%. In view of these data, the plant appears to exhibit stable behaviour, and repeatability is between 4.7% and 10% when the burning rate is analyzed (Table 2), depending on the test conditions. In relation to the relative deviation of the temperature, the values obtained are between 2.5% and 9.3%. In fact, as shown in Table 2, the quality of the fuel assumes an important role in this issue. The results revealed prominent differences among trials when the fuel with the higher ash content is employed, therefore less accuracy in its results.
Figure 3 presents the gas temperature, water temperature and the gas analyzer results in a typical test. It represents the time evolution of the plant during both transient and steady combustion. It also aims to show the stability of the system and the capacity for controlling the heat exchanger temperature. The oscillations are presumably generated by the inherently unsteady nature of the fuel feeding system. It also shows the load cell curve that determines the burning rate. The representative average value is extracted after the start-up transition.

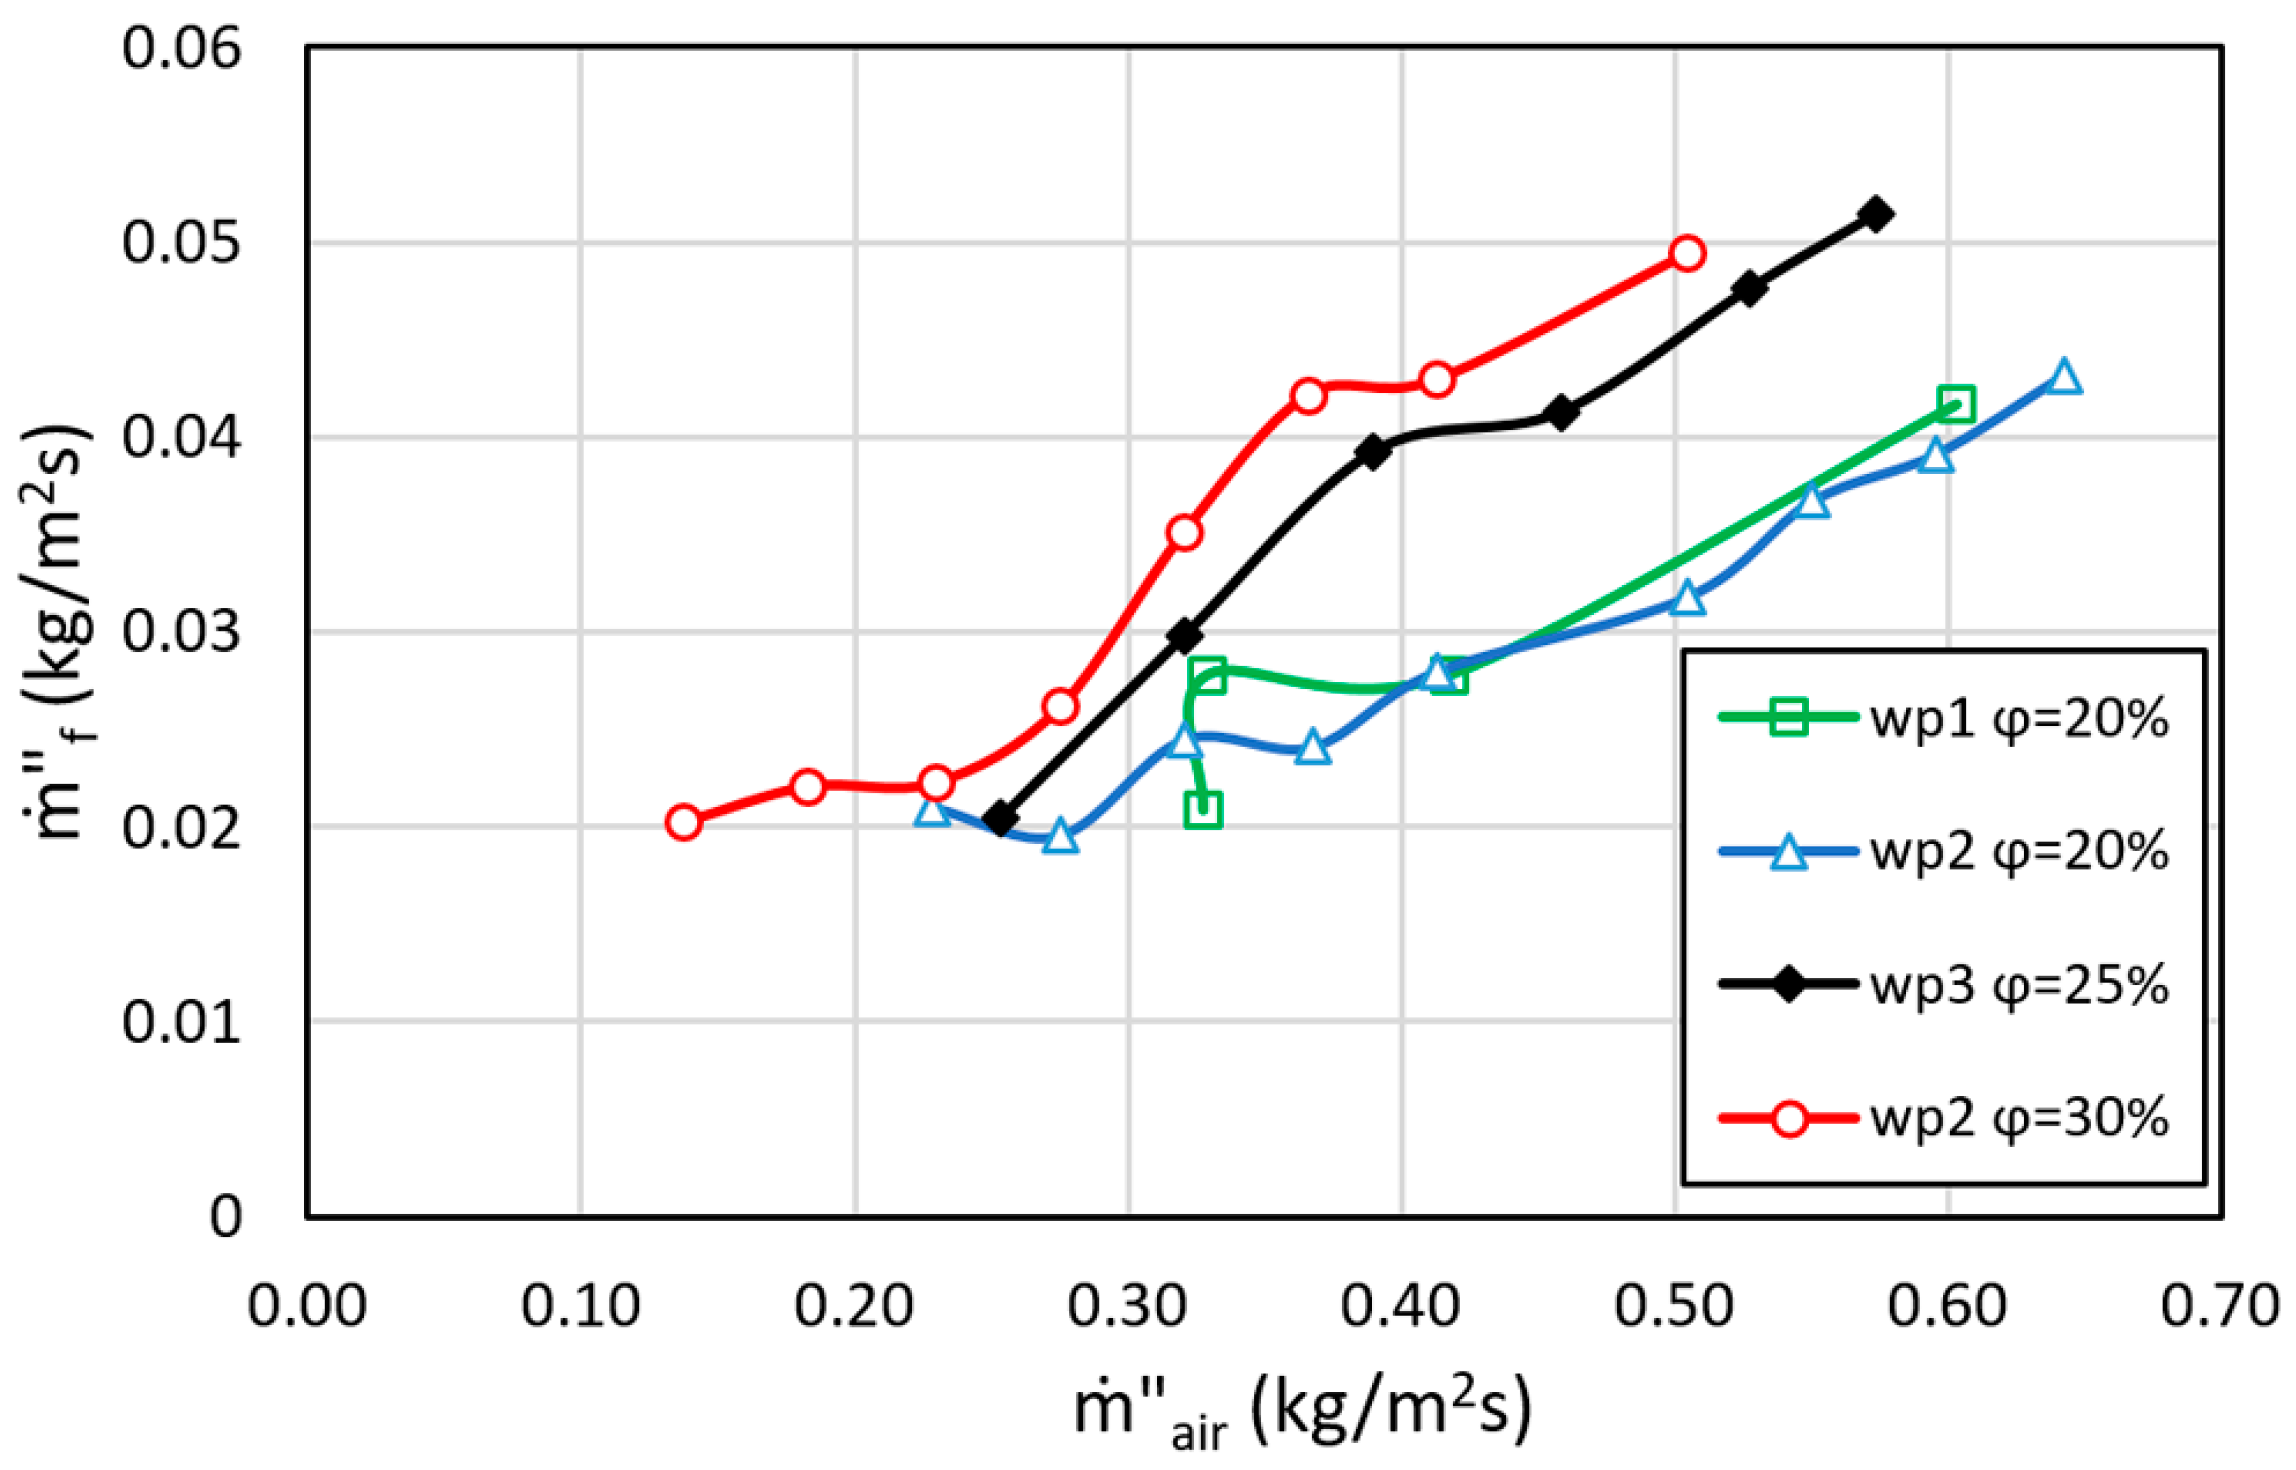
3.2. Influence of Air Configuration

Regular air staging ratios related to the primary air in commercial biomass boilers and burners generally vary between 30% and 50% [43]. Independently of this value, the primary air excess should normally be maintained close to 0.7–0.8 [38]. However, lower air staging values may also be beneficial in reducing the solid particulates elutriated from the bed. With this in mind, low air staging ratios (15%–30%) were analyzed in this work.
The first results show the effect of the total airflow rate and the air staging. Figure 4 gives the evolution of the burning rate for three different air staging ratios (20%, 25% and 30%). A quite proportional relationship between the total air supplied and the fuel consumed appears to exist. In fact, this proportionality is kept all over the airflow rates tested, meaning that the limit of the quenching by convection was not reached through the entire range of tests. With regard to the air staging, an increase in the total airflow rate generates a higher fuel devolatilization in the bed and a greater availability of air in the secondary zone to burn the volatilized matter (homogeneous combustion). This increase in the released thermal power generates higher gas temperatures and a larger heat transfer from the flame to the bed mainly by radiation, counterbalancing the cooling by convection. Therefore, higher airflow rates can be achieved compared with other combustors producing similar thermal power but employing only a primary air inlet [7,8,16,25].
Because of the abovementioned results, the stoichiometric ratio (SR) or air excess (Equation (1)) is held almost constant while increasing the air. Figure 5 suggests that this ratio varies with the air staging factor but remains close to a certain value. In high burning rate conditions (φ = 30%), it oscillates above 1.5, and the maximum of approximately 2.5 is achieved for φ = 20%.
λ = ( m ˙ a i r m ˙ f ) A F R ,
The main idea suggested by Figure 4 and Figure 5 is that primary air is one of the key parameter influencing the combustion rate; numerous studies have been conducted in experimental burners to study their behavior. As mentioned in the introduction, previous works using lab-scale burners have investigated the effect of the primary air; in most cases, this was the only available air inlet for combustion [7,8,25,26]. Accordingly, Figure 6 shows the relation between primary airflow and the burning rate for the three former air-staging ratios (20%, 25% and 30%). At least in the air range studied, introducing a greater amount of primary air always ensures greater fuel consumption in the bed, although this does not imply its complete combustion. In other words, the amount of primary air supplied controls the thermal power released by the combustor by keeping the supply of volatiles to the combustion chamber. The direct relation between the burning rate and the average gas temperature for an entire set of tests under variable conditions was similarly verified.
A further analysis of the results is shown in Figure 7. λ1 expresses the primary air excess ratio (Equation (2)), and λC is the char air excess ratio or in-bed λ (Equation (4)), considering char to be pure carbon and complete combustion to be the reference. In this specific case, A F R C = 11.46 . As noted in previous works, the reaction rate of the bed is determined by the char stoichiometry. Increasing the air supplied in the gasification zone of the burner (primary zone) increases the reacting particles (char) at a proportional rate close to λC = 1 (0.9–1.1), almost independently of the other combustion conditions, at least inside the air range tested in this work.
λ 1 = m ˙ 1 m ˙ f A F R ,
m ˙ c h a r = m ˙ f · X c h a r ,
λ C = m ˙ 1 m ˙ c h a r A F R C .
Figure 8 aims to compare the current results with previous records obtained in a different lab-scale burner [7,8]. It must be noted that the reference work was performed with a round batch combustor (hereafter called C#1) with only primary air, and the fuel consumption rate is obtained by means of thermocouples in terms of the ignition front propagation speed. Although this last parameter is not exactly equal to burning rate, the difference in absolute value is small and can be neglected for the sake of comparison. The fuels employed in both cases are wood pellets, whose composition slightly varies as they belonged to an earlier batch of fuel. It means, the main differences between the current and the other facility are, basically, the feeding system and the air staging.
Figure 8 shows the relationship between primary airflow and char burning rate in the two facilities compared. The solid line represents the stoichiometric ratio for carbon complete combustion (CO2), while the dashed line is the stoichiometry for incomplete combustion (CO). The char combustion rate for C#1 follows a classical trend in which the three combustion stages (oxygen limited, fuel limited and quenching by convection) are quite clearly shown. There is also the transition between sub- and over-stoichiometric ratios. However, this trend does not appear in the data from the present study. The depicted points include different air staging ratios (20%–30%) but low primary airflow rate. For safety reasons, this airflow rate cannot be increased further using air staging because the power released will compromise the security of the plant.
Notwithstanding, a fair comparison may be established if only primary air (φ = 100%) is used. Figure 9 shows the results obtained in the current facility using only primary air and are compared with the previous results obtained in the fixed-bed combustor downward flame propagation and only primary air supply [7,8]. The results show a similar behavior in both burners. In the batch combustor C#1, if the airflow is low, the combustion takes place in sub-stoichiometric conditions. Under these circumstances, there is the aforementioned proportional relationship between the airflow rate and the reaction rate in the bed. If the airflow increases further, char stoichiometry ratio is achieved, and the convective cooling effect begins to appear. Consequently, by increasing the airflow, the fuel consumption remains more or less constant, limited by the ability of the fuel to react (fuel kinetic) rather than by the introduced airflow. Finally, the extinction phase is reached [7,8,26].
For low airflow rates (left part of the curves), the behavior of both burners is very similar in terms of reaction rate and stoichiometry of the bed. However, beginning at the value of 0.2 kg/m2s, their behavior varies. For similar airflows, the current burner reaches higher reaction rates (reaching approximately up to 40% higher). The main difference between the facilities is that in C#1, the combustion front is moving along the burner, causing greater heat dissipation as the front needs to advance heating the wall. However, in the current facility, the fuel is supplied continuously, and the combustion front is always kept at the same point. This creates a much more adiabatic environment, which reduces the cooling effect of the advancing front allowing a further increase in air quantity without entering the quenching phase. Consequently, the developed reaction front is wider, and higher temperatures are reached. Although tests with higher airflow rates should be performed to ascertain the shape of the curve for the current combustor (Figure 9), technical limitations of the plant impede the operation at those levels. Notwithstanding, in the final part (airflow rates higher than 0.23 kg/m2s), the burning rate seems to lose proportionality and stabilizes. The recorded data approach to CO2 stoichiometry ratio. This could mean that the end of first stage of combustion is not far away from that primary air flux. A vague extrapolation of the data (dashed line) indicates that at around 0.3–0.35 kg/m2s, the further supply of primary air will start a cooling effect and drive the combustor to the quenching phase.
Finally, Figure 10 compares all tests performed in this work. The char burning rates with and without air staging are similar at low airflows (0.05–0.15 kg/m2s); however, the comparison for high values could not been established. By employing only primary air, the reaction rate increases, but the data move closer to the line of incomplete combustion (CO). This means that there is a high rate of volatilization in the bed, but the gases generated may not burn completely owing to the lack of oxygen supply. The thermal power released in the bed is high, but the combustion is very poor, approaching regimes closer to those typical of gasification. When the burning rate stabilizes (above 0.2 kg/m2s), the records move again close to complete combustion line (CO2). Once this limit is crossed, in-bed over-stoichiometric regime rules and the quenching stage presumably arrives.

3.3. Emissions

The influence of the operative parameters on the PM concentration was also analyzed, but no significant results are obtained. A complete set of experiments varying the total airflow conditions, the fuel, and air staging have been carried out. Any possible influence of these parameters lies in the measurement uncertainty, and conclusions cannot be found other than the total concentration and the particle distribution. Despite the scatter in the data, all experiments were performed with very low air staging ratios (15%–30%). The PM concentration in these cases moves from near 15 to almost 75 mg/Nm3 at 6% O2 in the worst case (Figure 11). These values match or improve upon the reference works using biomass combustion systems with low PM emissions [32,33,35,36,44] that, as aforementioned, usually move at approximately 10–100 mg/Nm3. Nevertheless, the results should be compared carefully with other works. The non-dilution measurement principle used in this work and the absence of back-up filter may generate lower PM concentrations. However, in this facility, it has been confirmed that when only primary air without air staging is used, the concentration of particulate matter has a value greater than 360 mg/Nm3 at 6% O2.
Regarding the size distribution of the particles collected, the most relevant aspect is that, independent of the total amount of air introduced in the facility, the representative size is in the range of 50–100 nm (less than one micrometer) with a unimodal shape curve (Figure 12) [45]. In the absence of a dilution tunnel and with a burnout path approximately 0.5 m between the secondary air inlet and the sampling point, the results seem to be reasonable [14]. Because the gas sample is kept hot, condensation of the gas phase over the particle nuclei is minimal. The influence of the air staging ratio on the distribution vaguely indicates a slight increase of the main aerodynamic diameter for higher primary airflows. Although results at this point are non-conclusive, the effect makes sense because larger airflow in the primary zone may expel larger particles (ashes) from the bed.
The composition of the gaseous emissions has been analyzed, but there is still difficulty in the accurate performance of these measures. Figure 13 presents the evolution of the average NOx and CO emissions for different air configurations. As primary airflow goes up, the NOx emissions increase, probably due to the associated increase of burning rate and air availability. Both effects improve the main NOx formation mechanisms. Higher burning rates increase fuel NO while higher combustion temperatures and a higher presence of air enhance thermal and prompt formation of NO [9]. In parallel, CO emissions seem to increase as the air excess ratio does. Probably, a decrease in the global temperature of the process associated to a high air excess may explain this behavior.
As a final remark, a clear relation between CO and PM emissions was also found in this work [46,47]. This trade-off is supported by Figure 14. As already known, when combustion takes place under poor conditions, solid particulate matter is mainly determined by unburnt products (soot) [3]. Accordingly, the influence of CO in PM emissions is more relevant than any other parameter previously analyzed in this work. That could explain the difficulties found to extract conclusions about the PM behavior in terms of total airflow or air staging ratios, as those parameters seem to be less relevant.

4. Conclusions

The facility designed and built for this study presented steady and accurate behaviour during all the tests performed to analyze the influence of the operative parameters in the combustion. The results shown in this paper seem to support the following main conclusions:
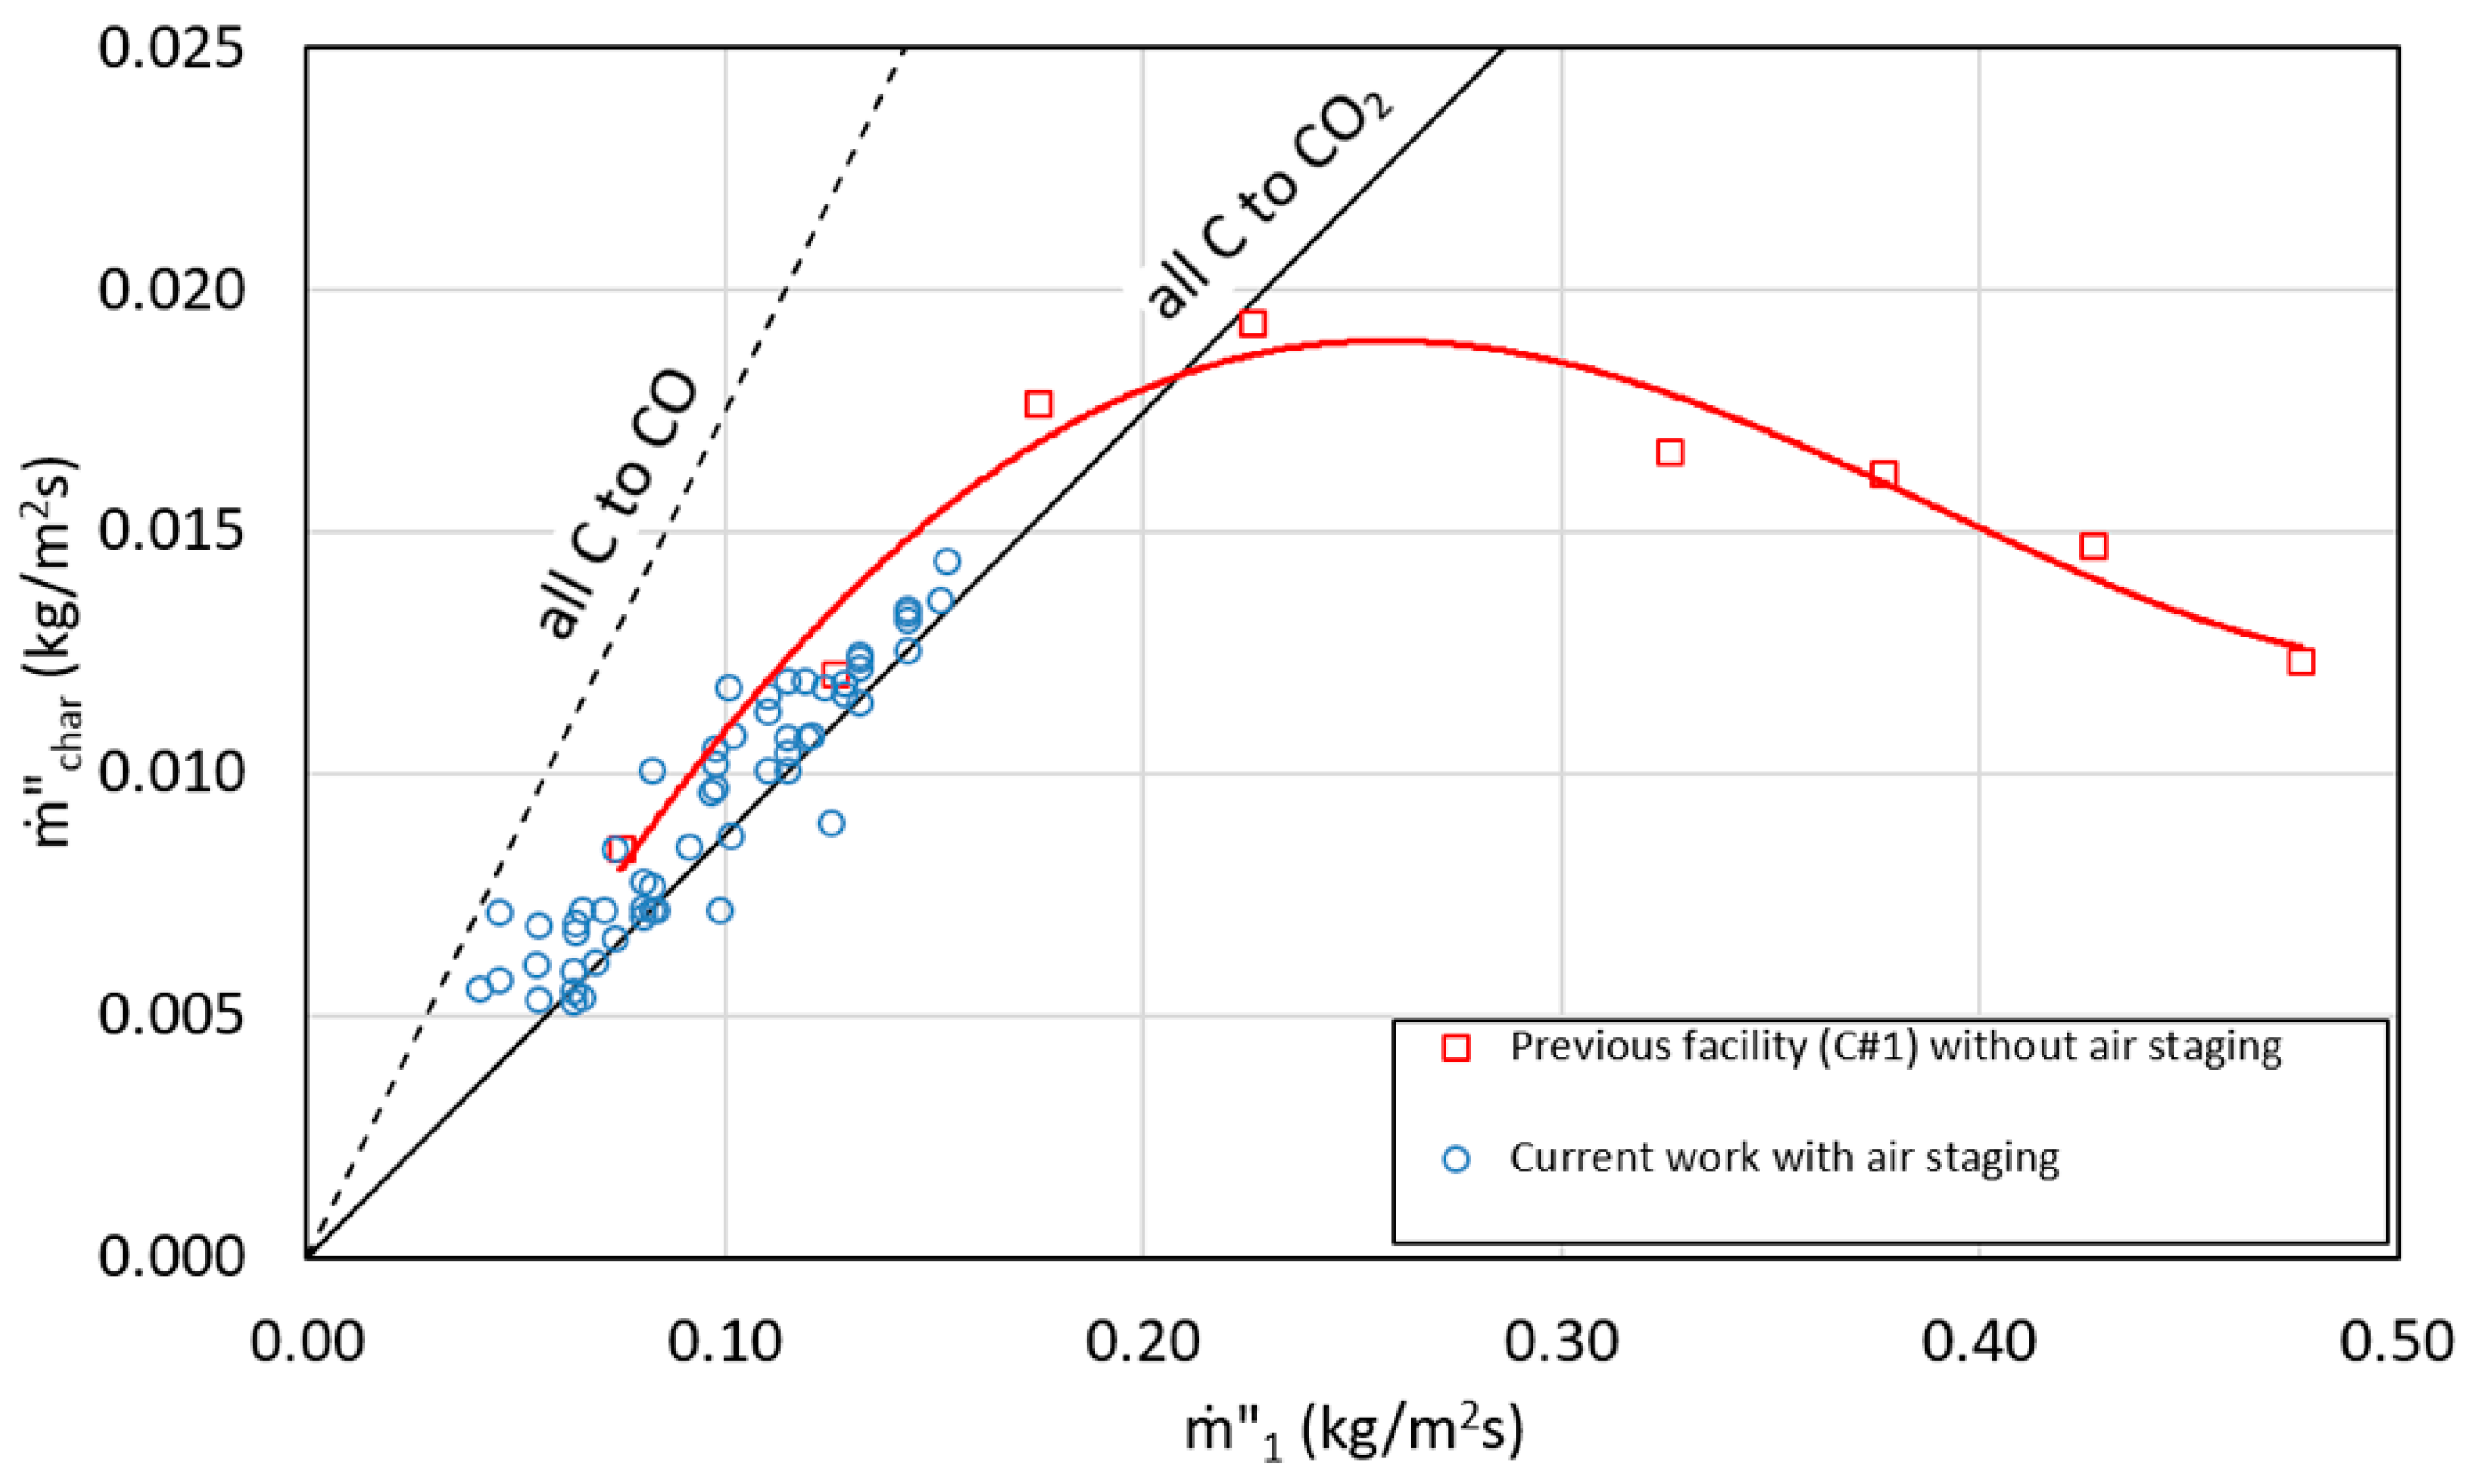
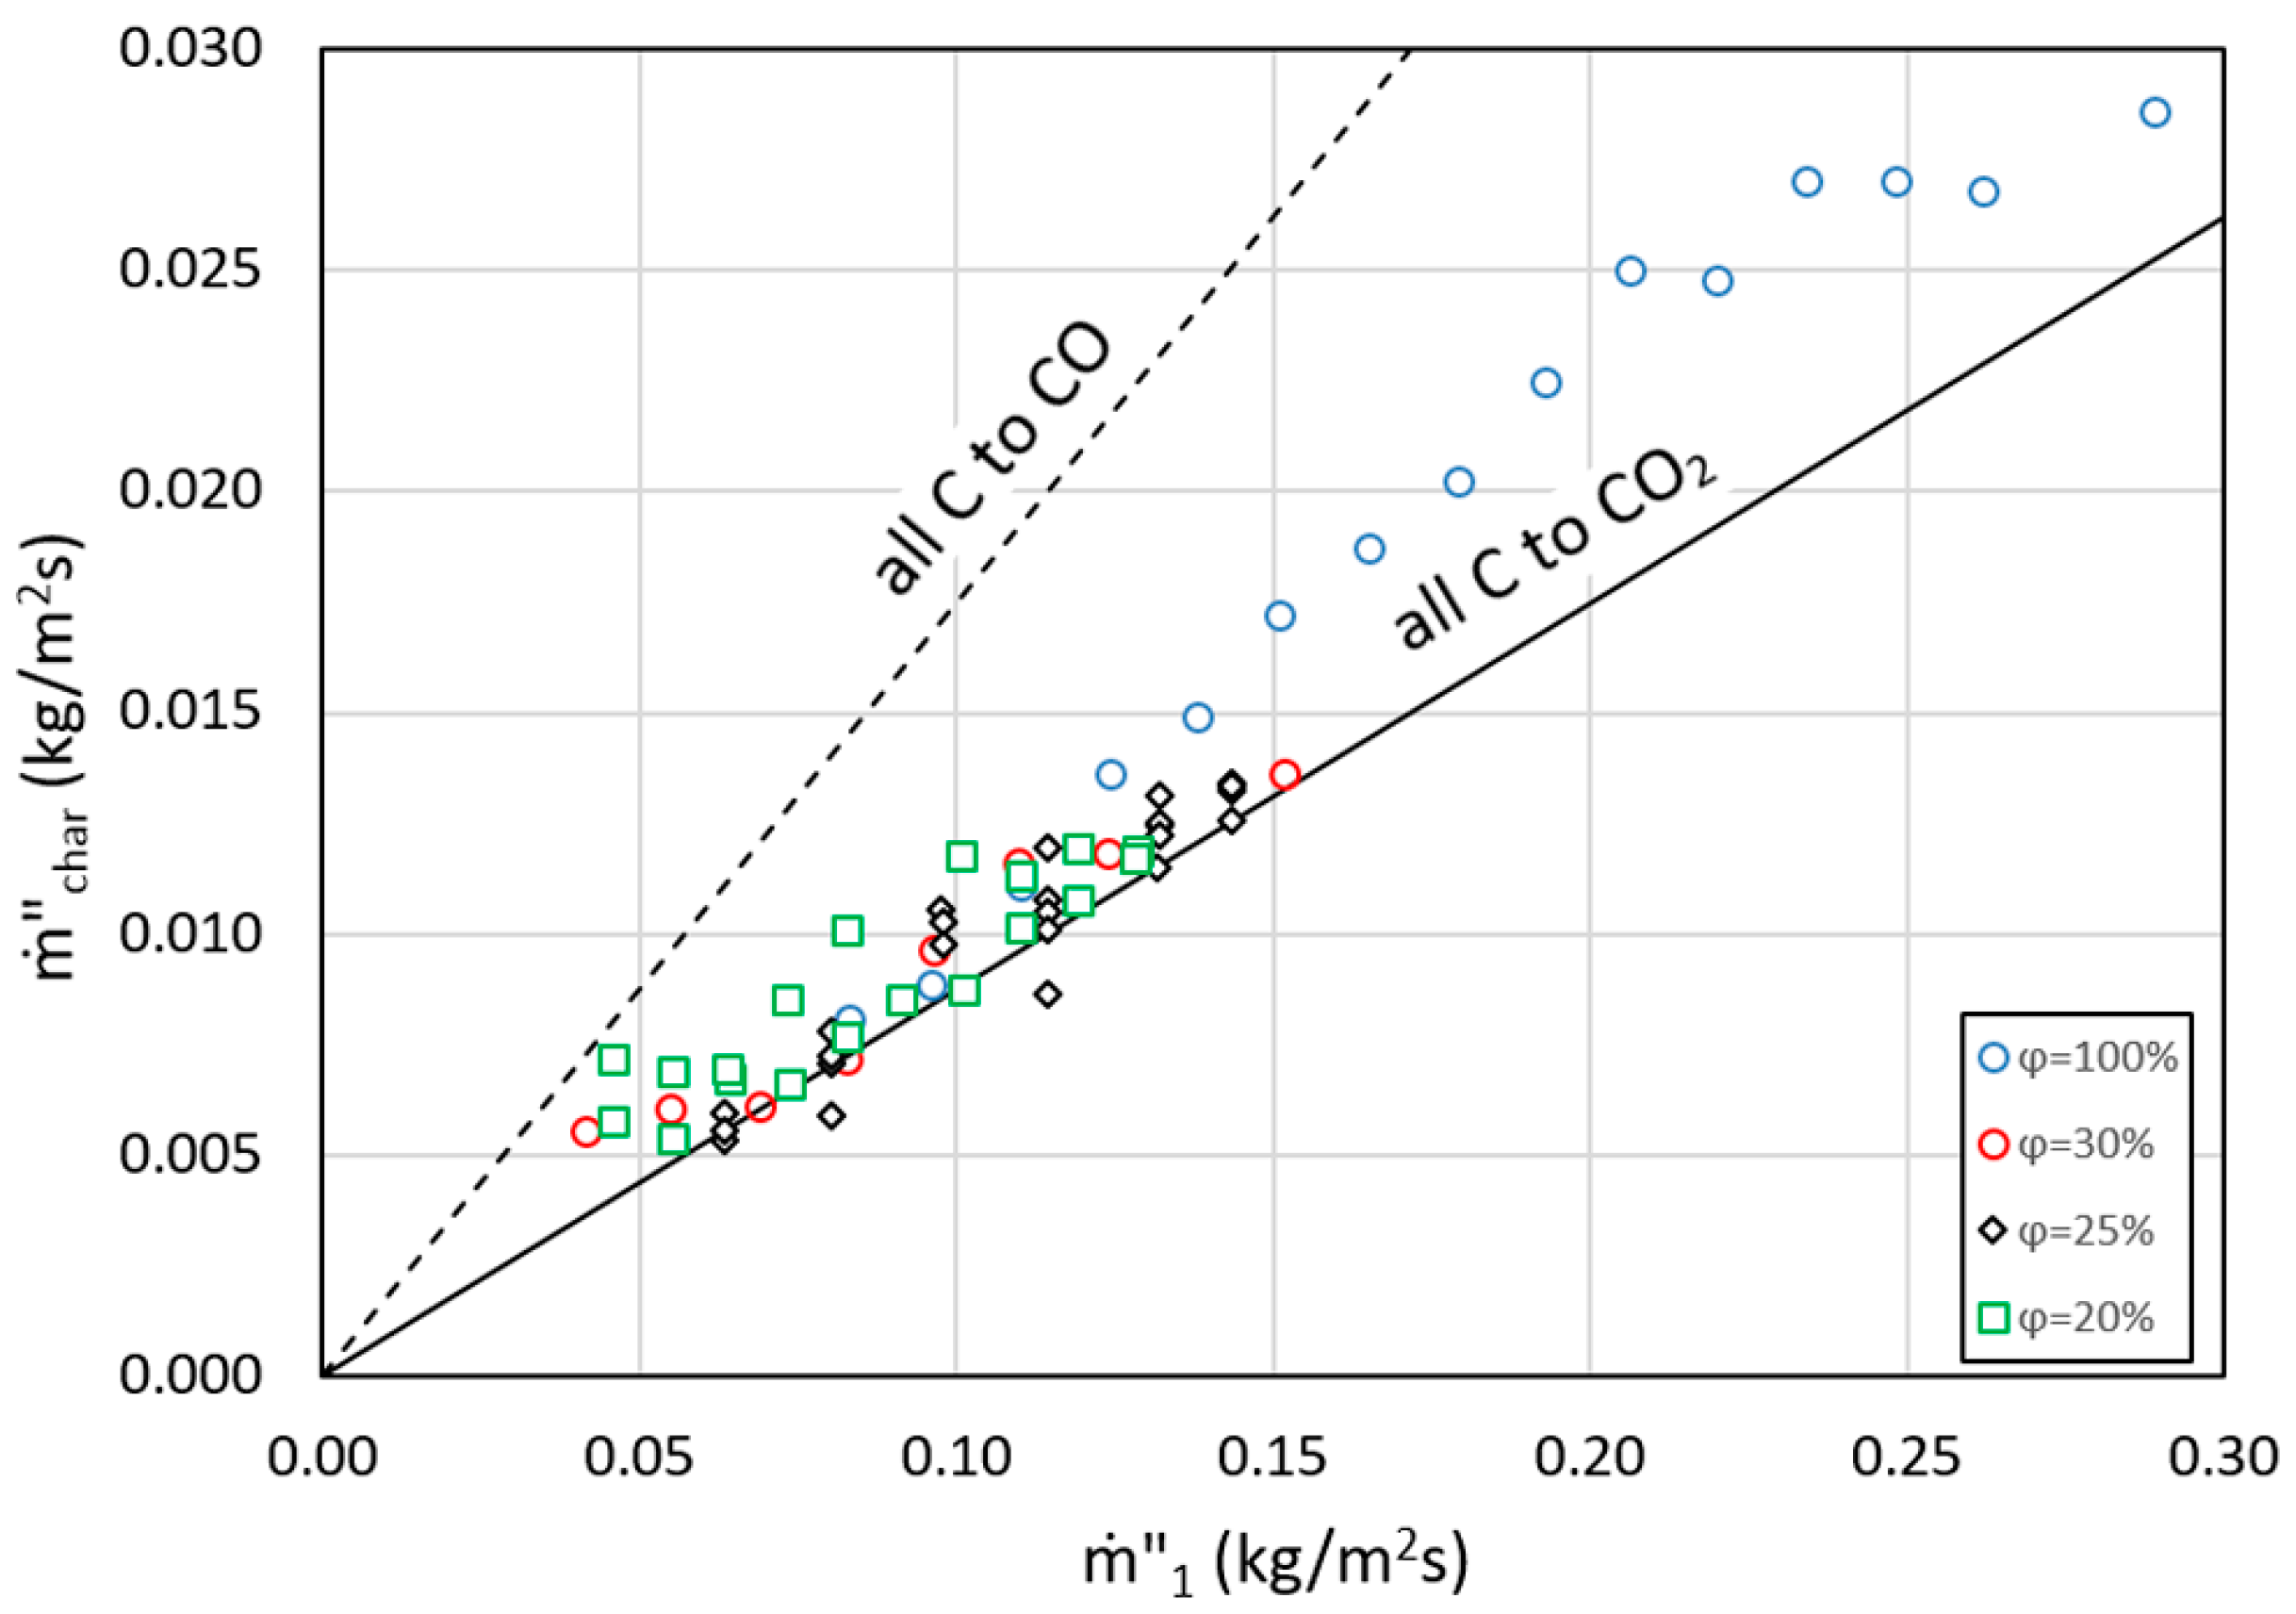
  • The effect of air staging and total airflow in the burning (reaction) rate was analyzed. When low primary airflows are used, similar reaction rates were measured, regardless of whether the plant is working only with primary or air staging. For higher primary airflows, the reaction rate, bed devolatilization and thermal power rise up. Using only primary airflows, the combustion is poorer and the values move closer to the incomplete combustion (sub-stoichiometric regimen) while using air staging the burning rate and gas temperature grew almost proportionally following the char stoichiometric line.
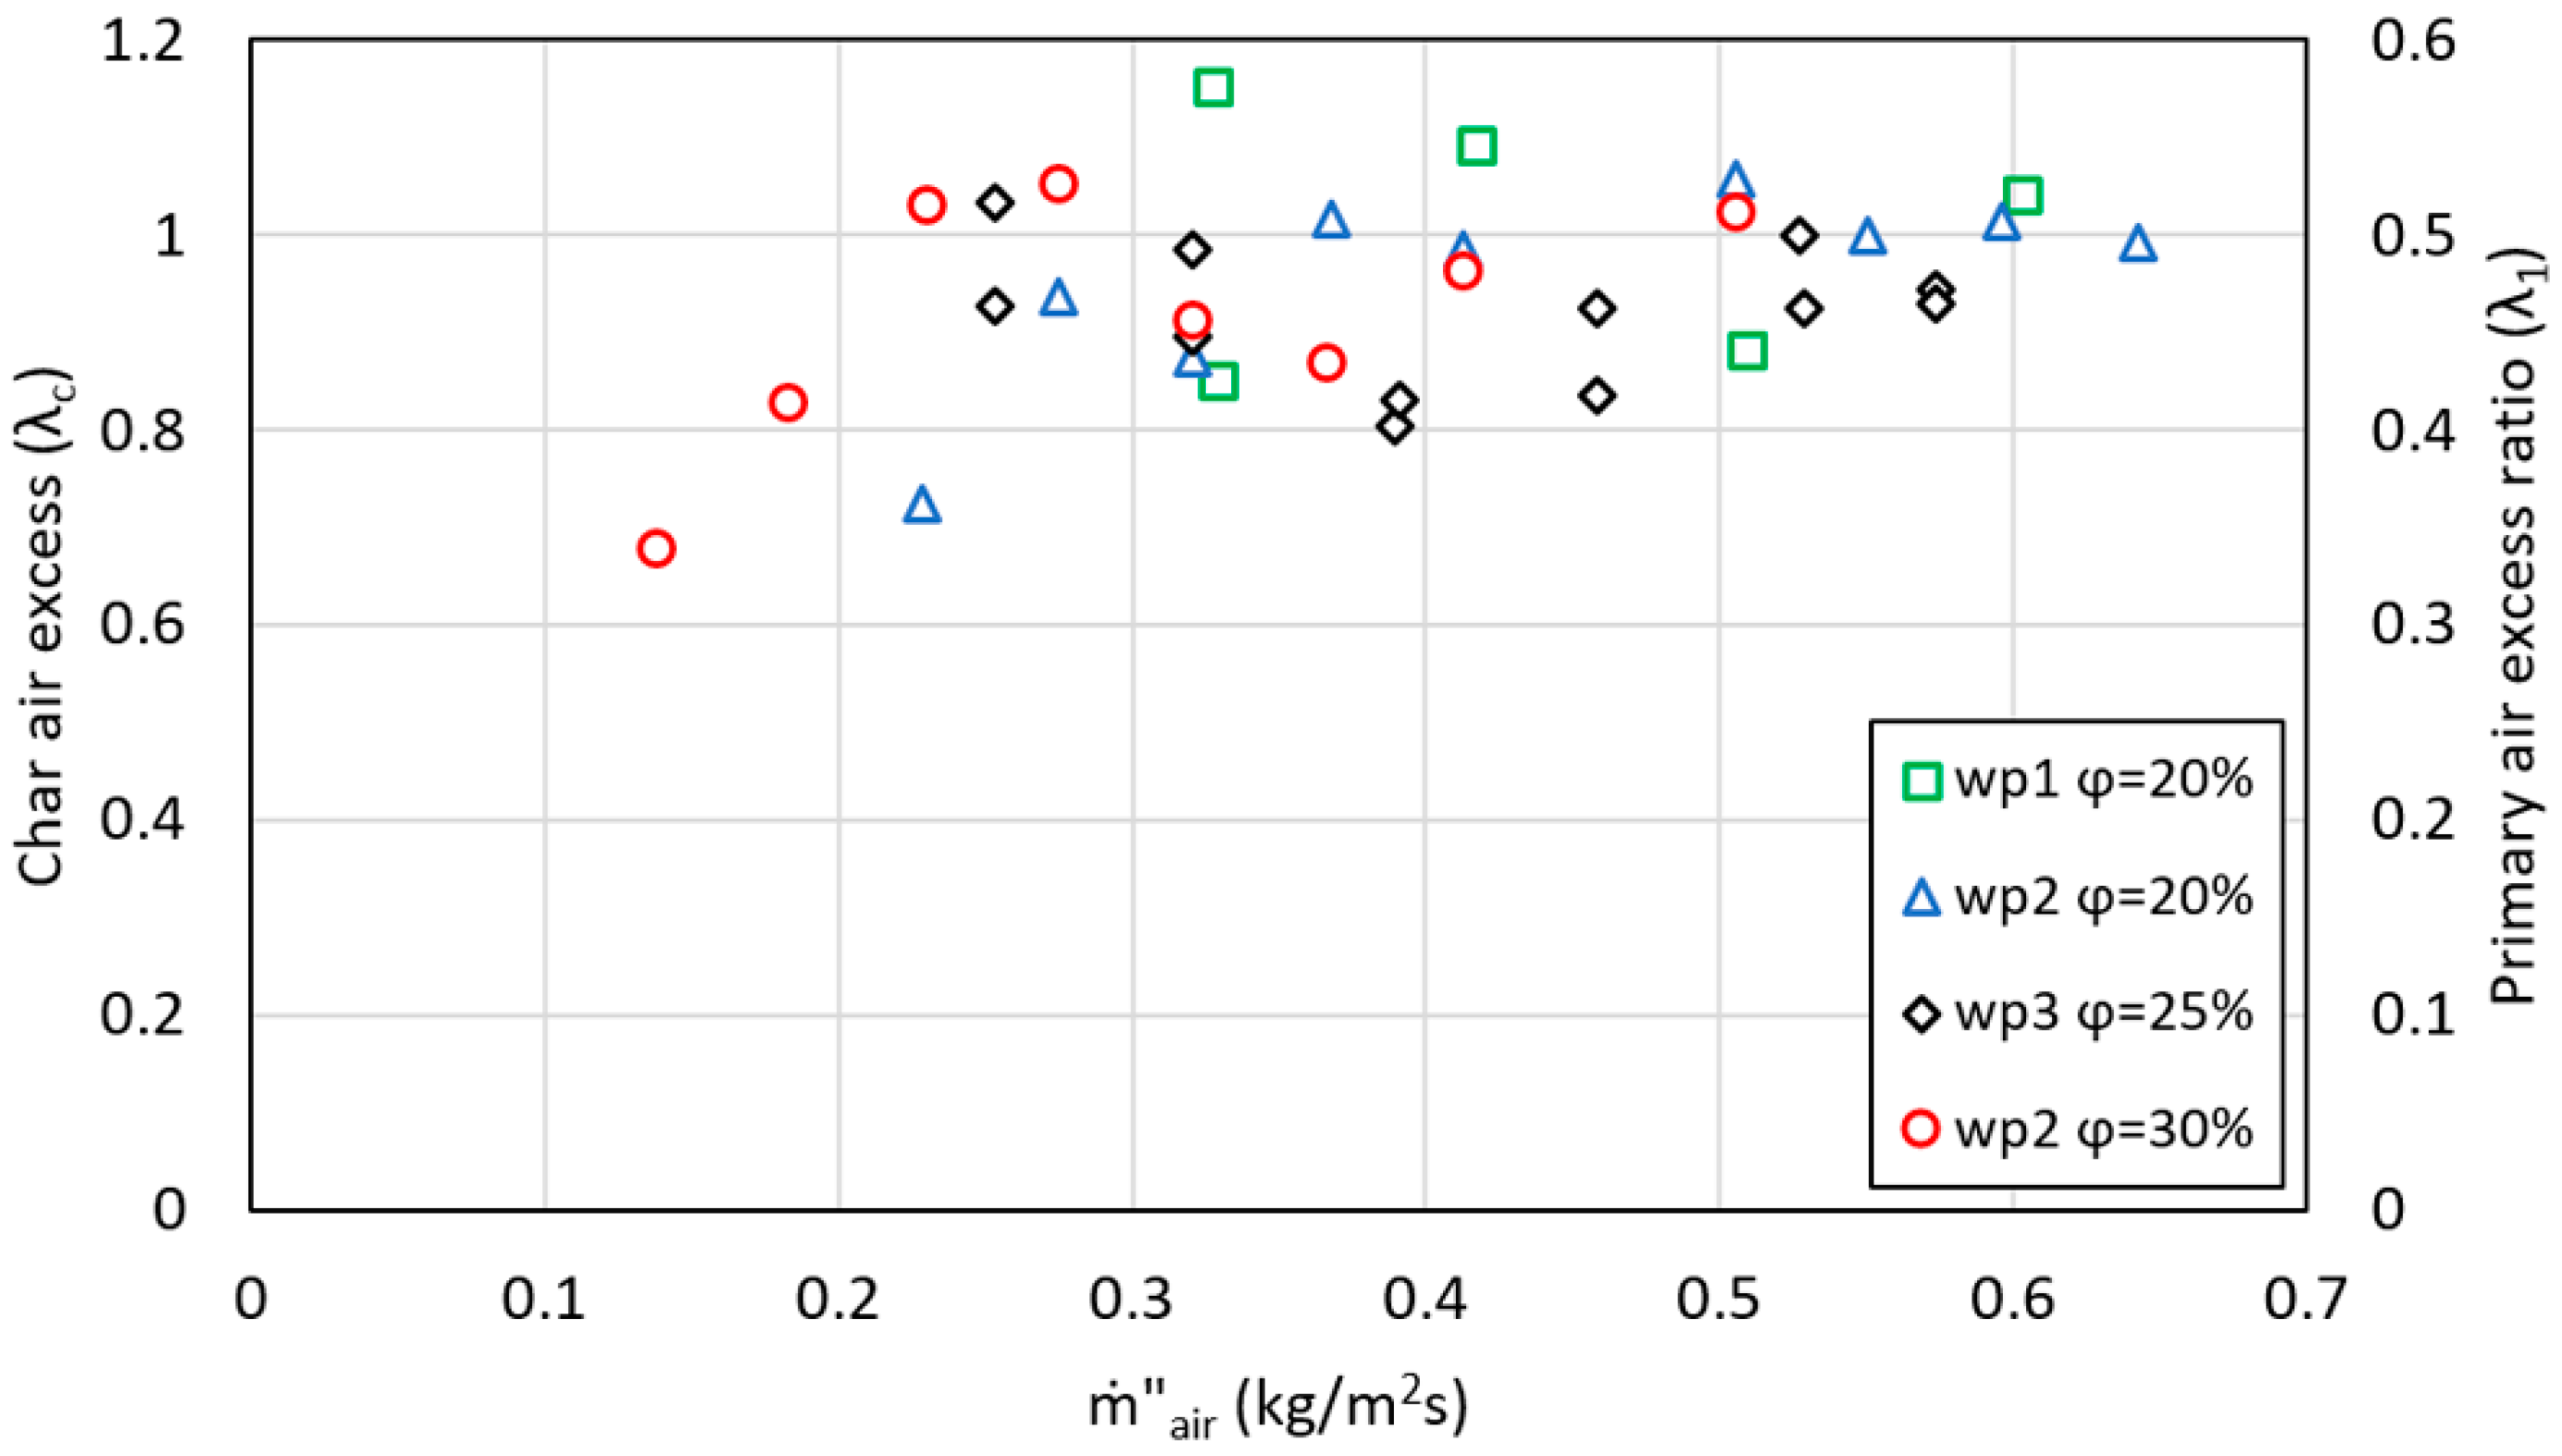
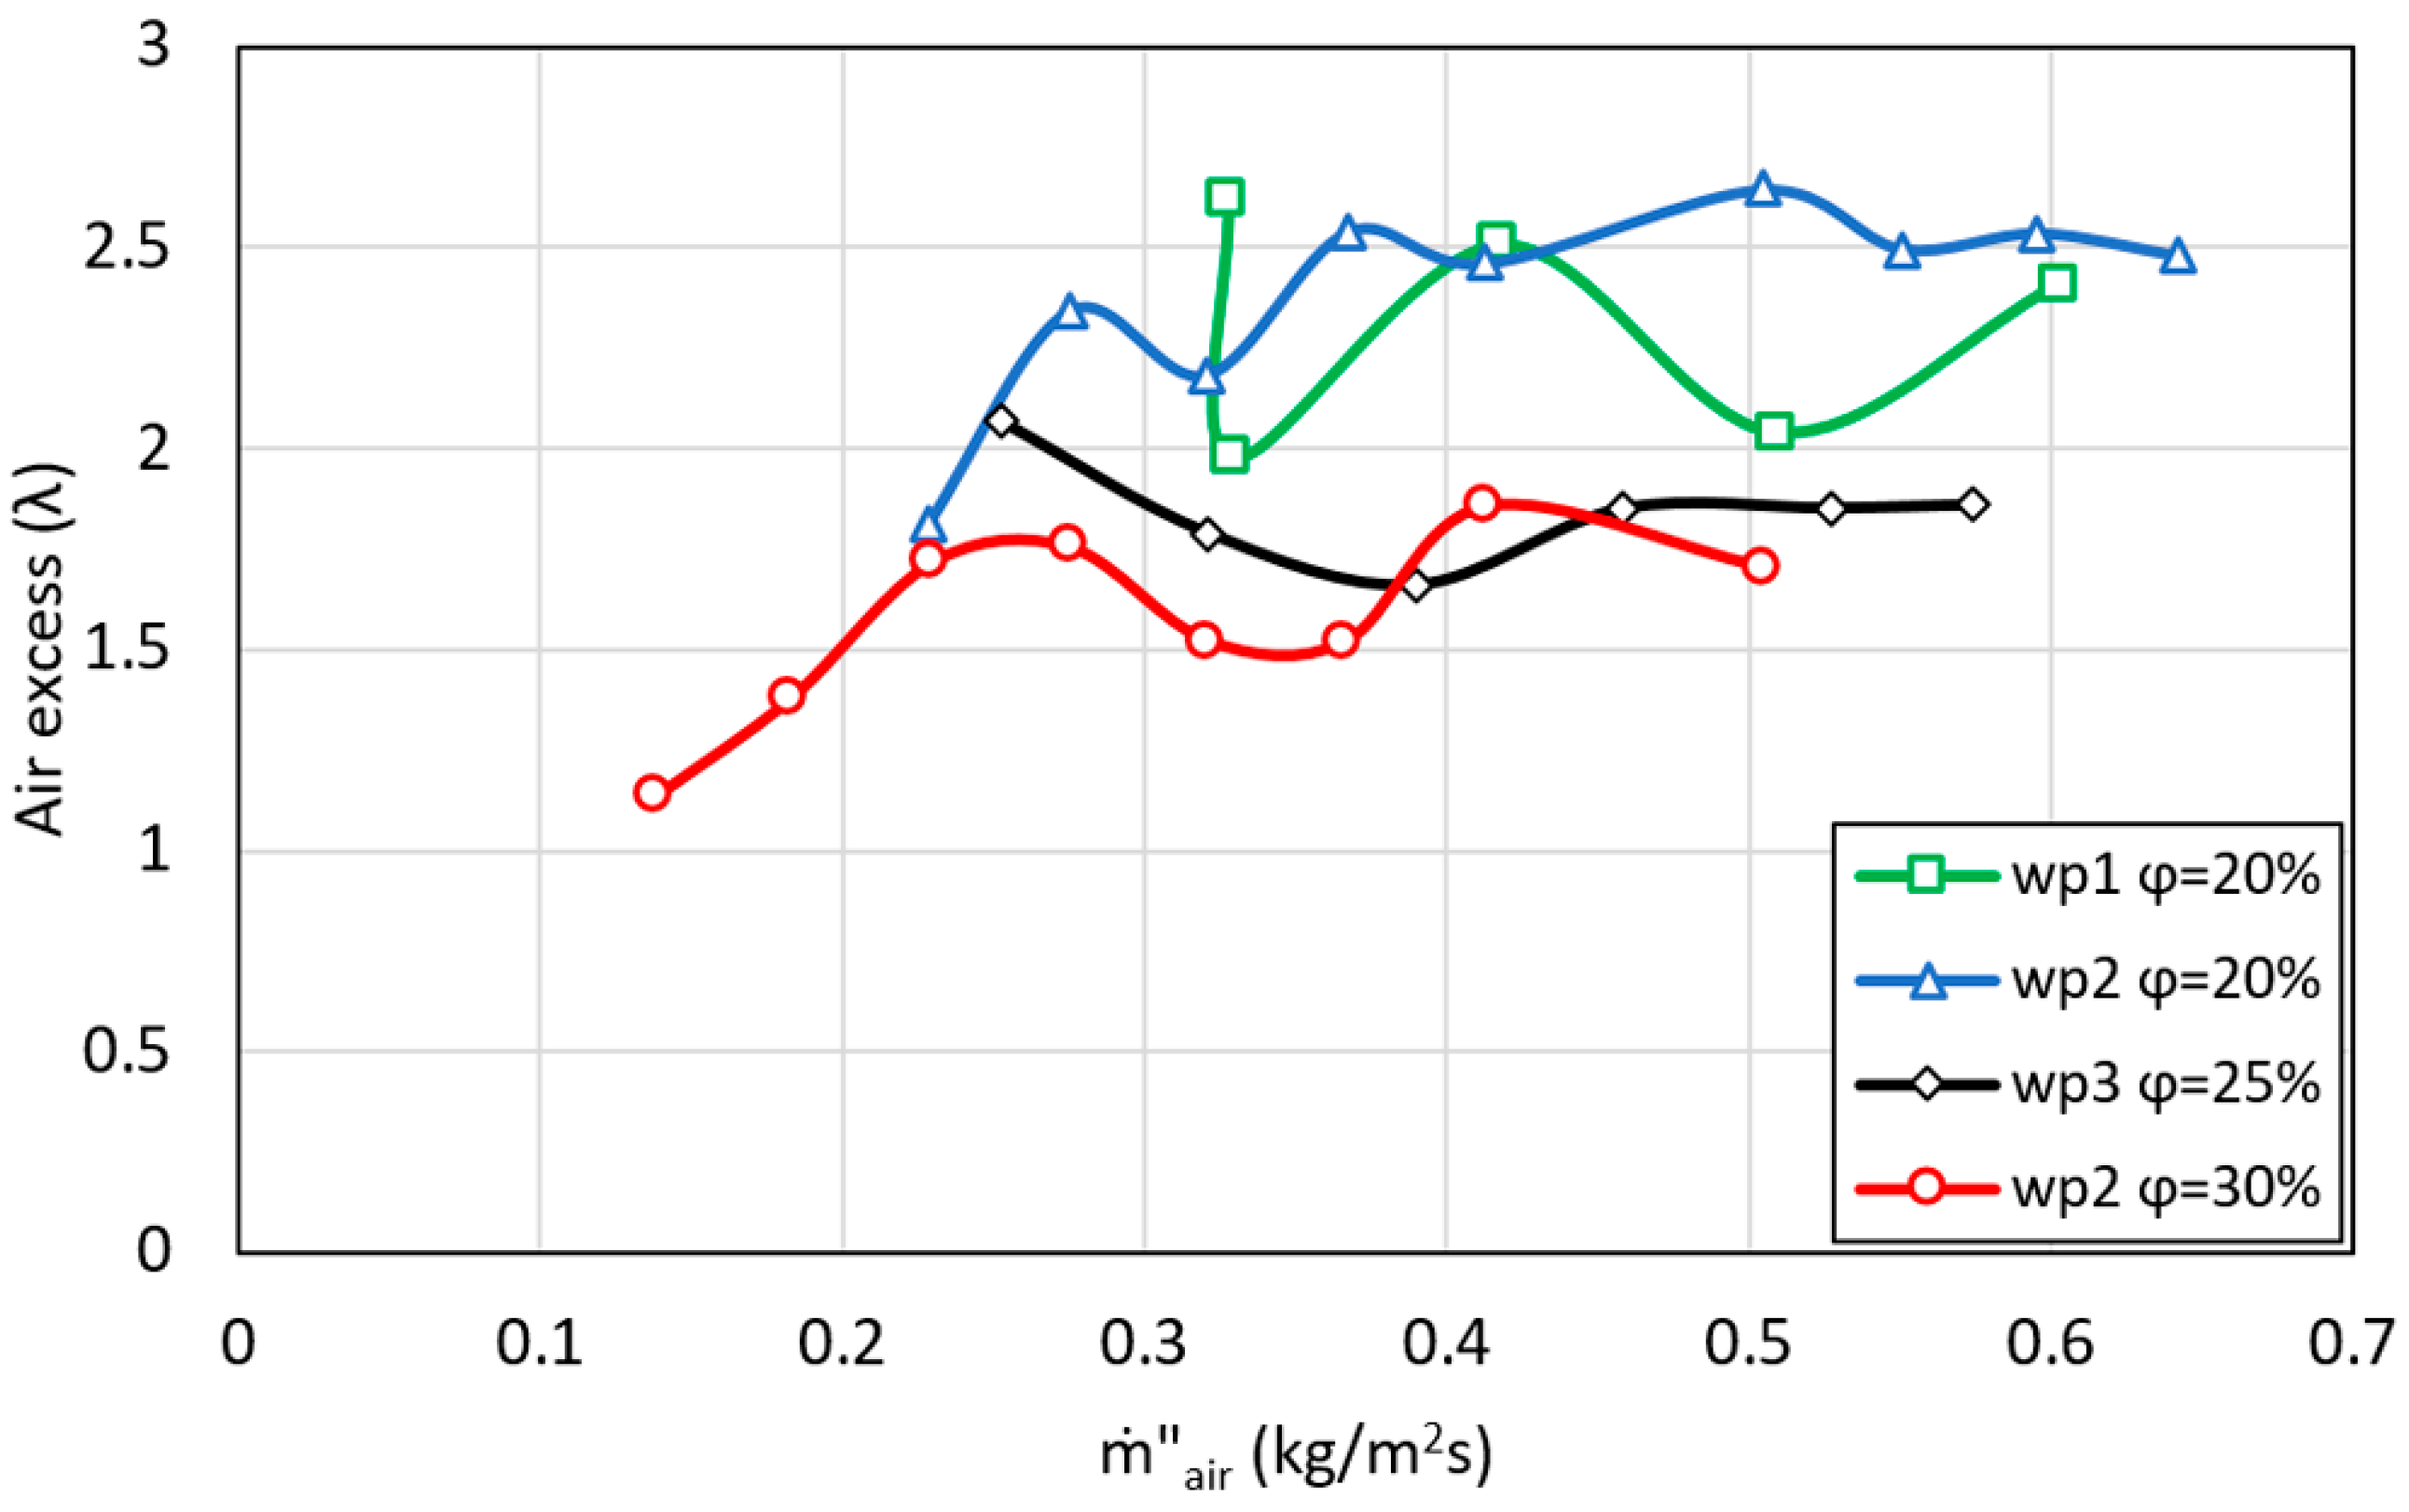
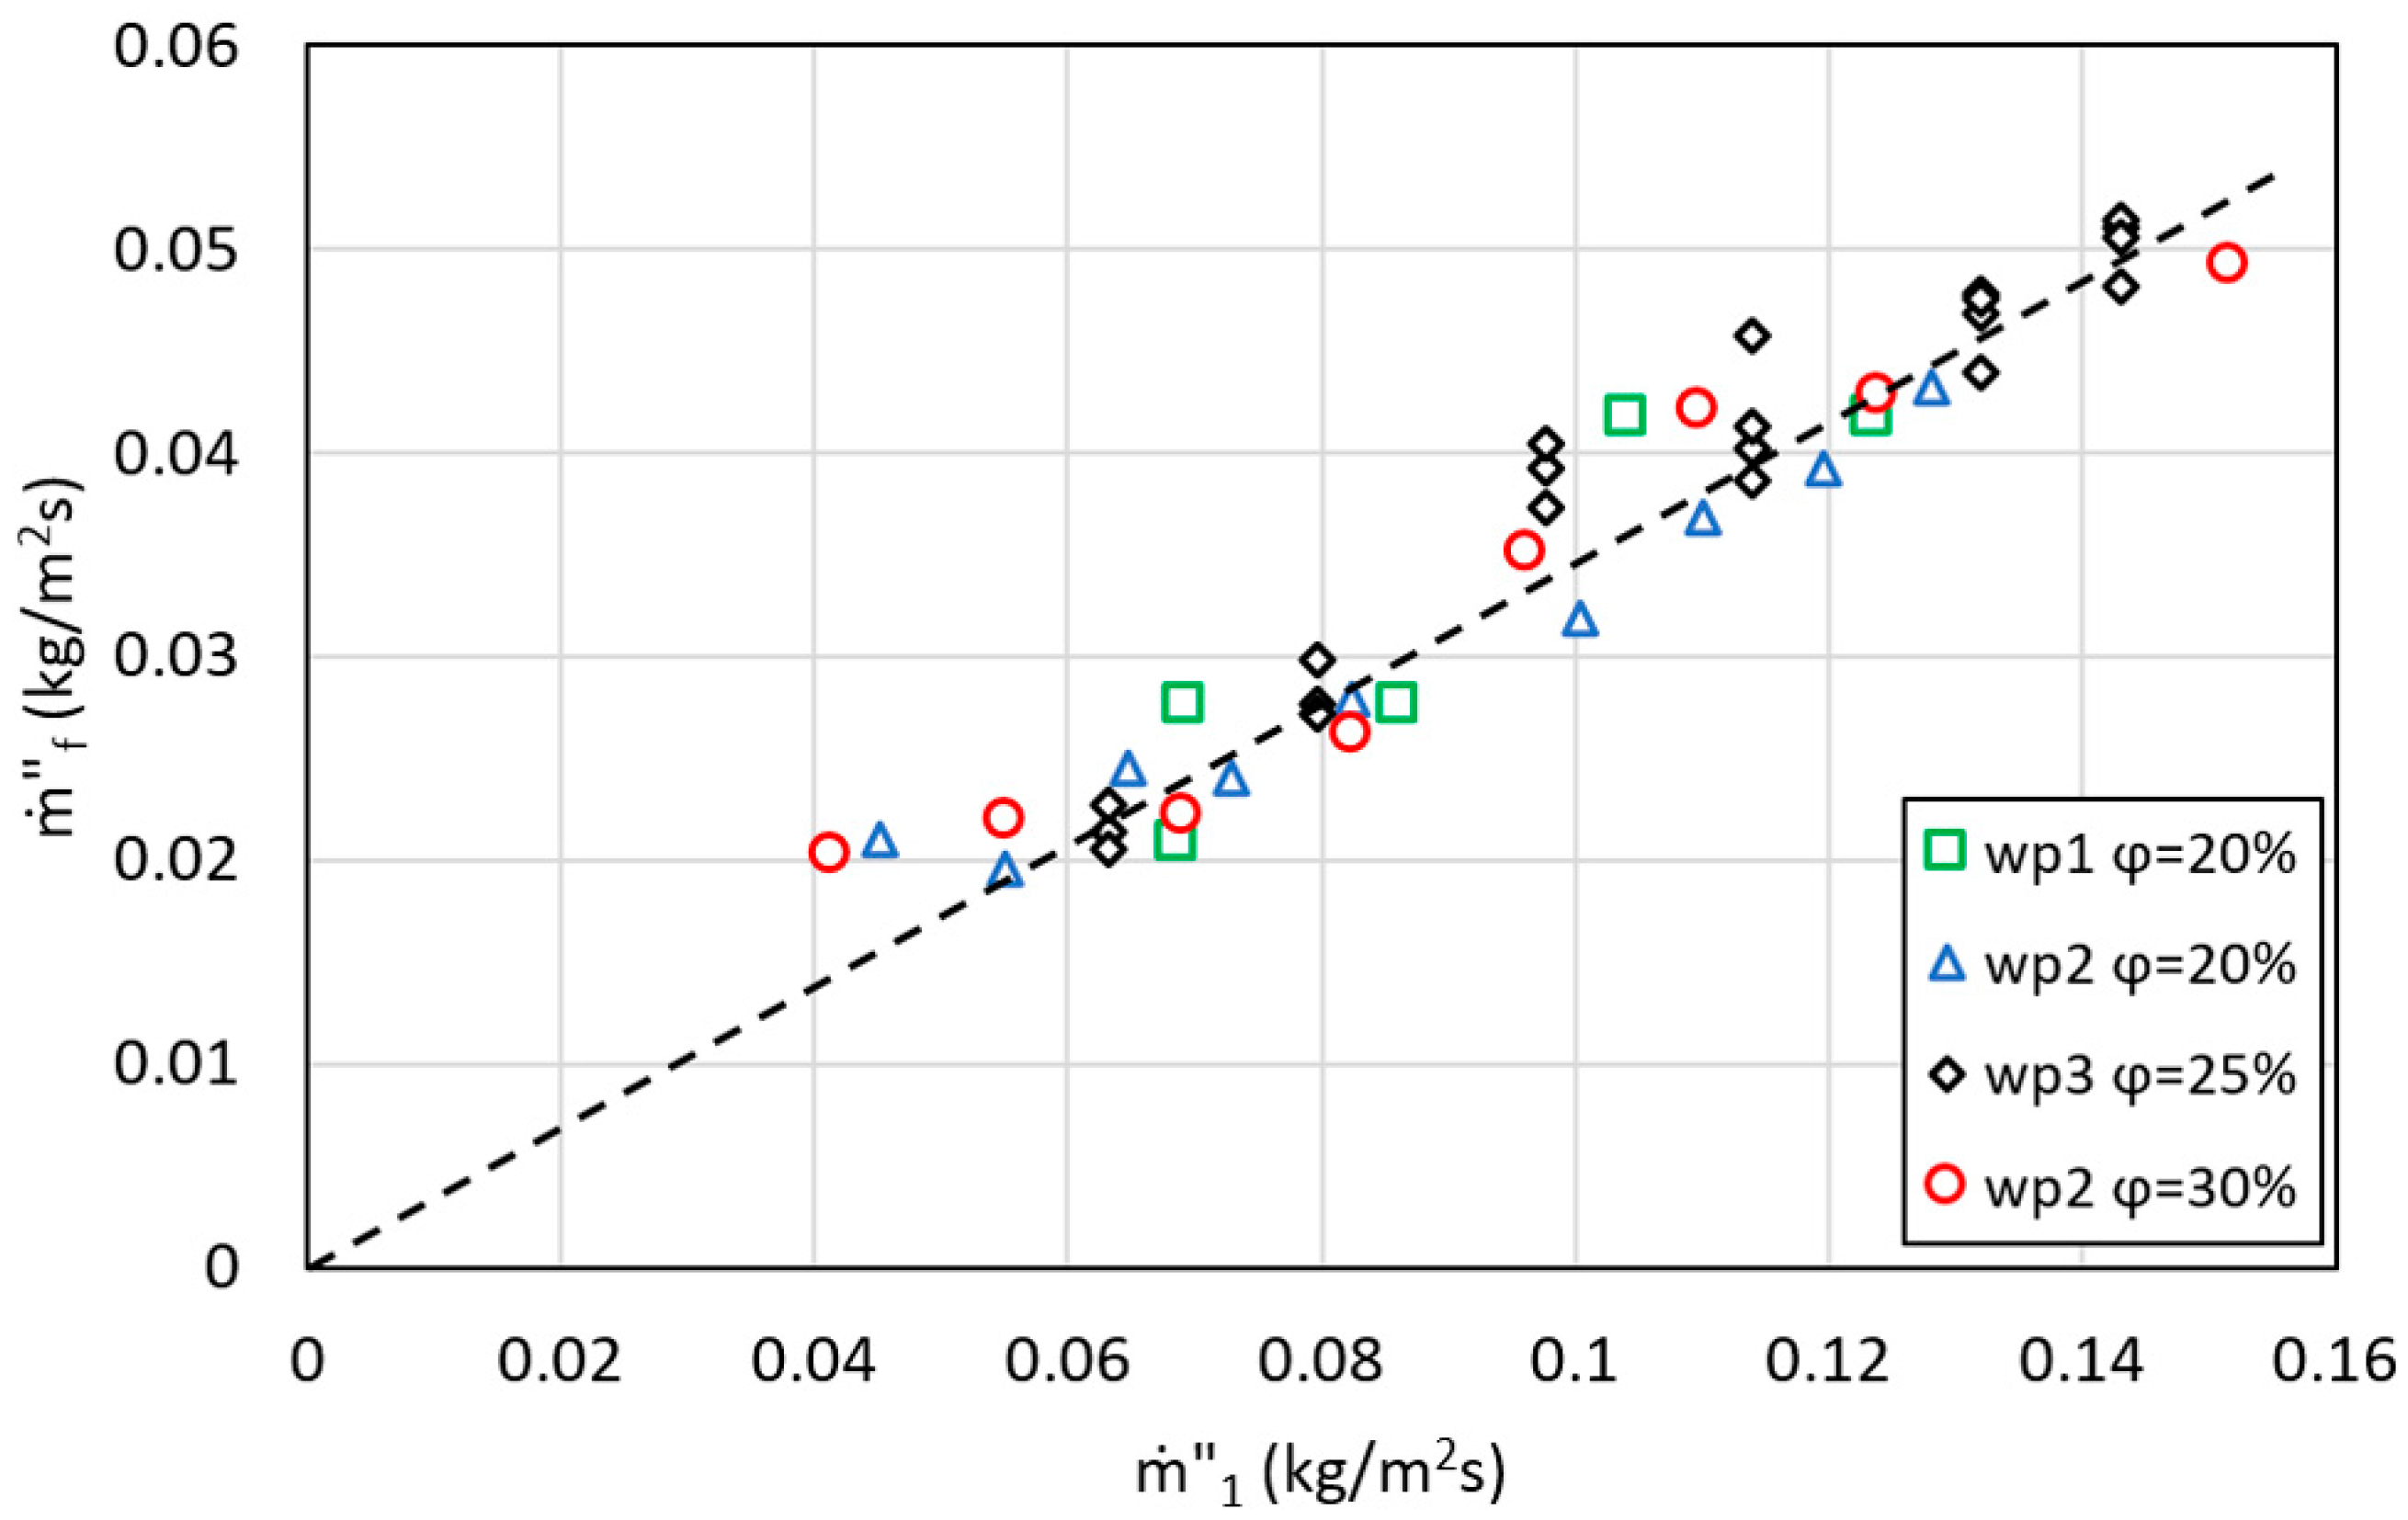
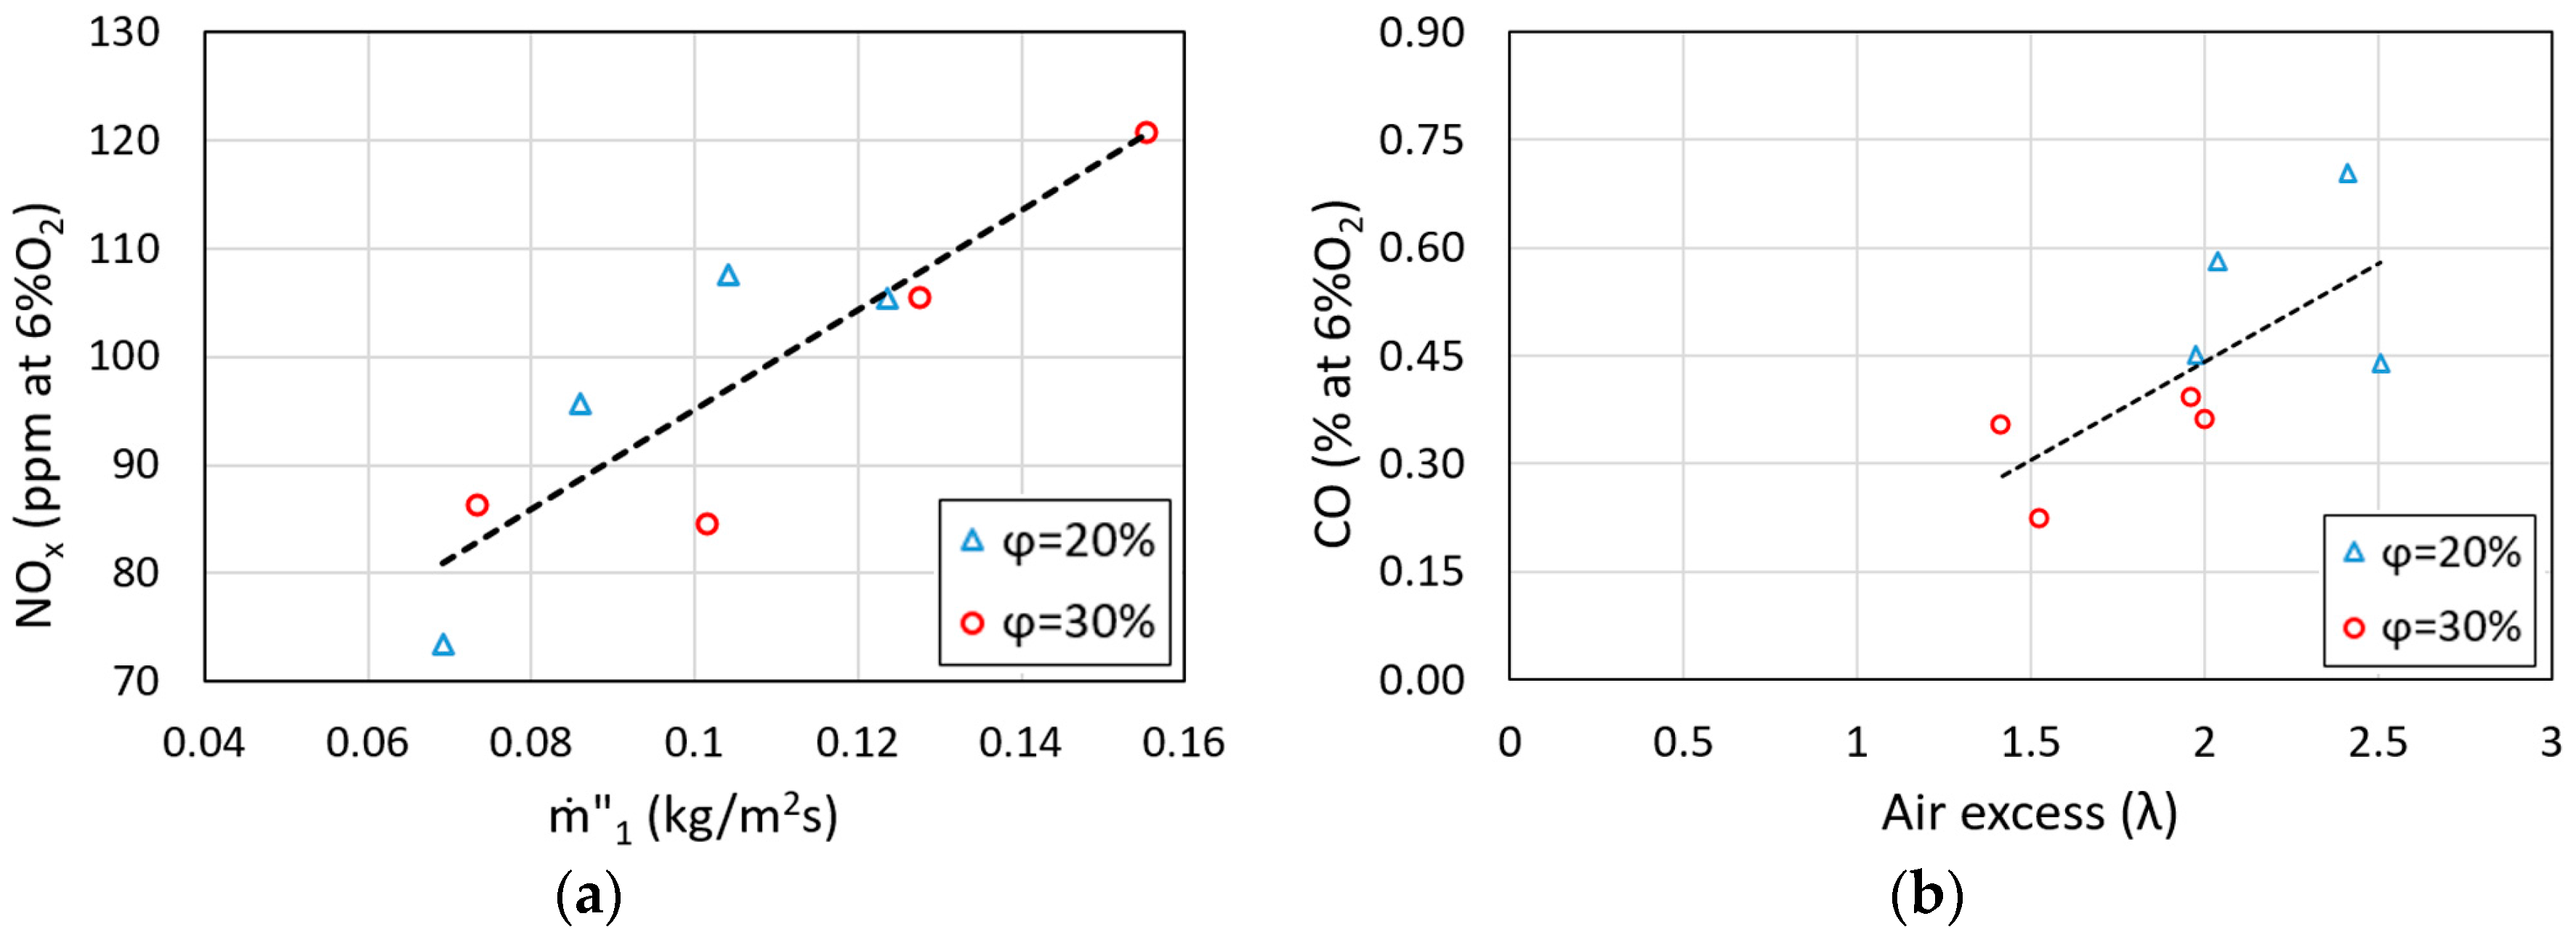
  • An increase in the total amount of primary air supplied enhance the burning rate with an almost constant air excess ratio (λ). This ratio varies depending on the air staging, but it normally moves between 1.5 and 2.5.
  • Primary air excess ratio (λ1) between 0.4 and 0.55 as well as in-bed stoichiometric ratio (λC) close to one were experimentally measured as a consequence of the continuous oxygen-limited char combustion regime.
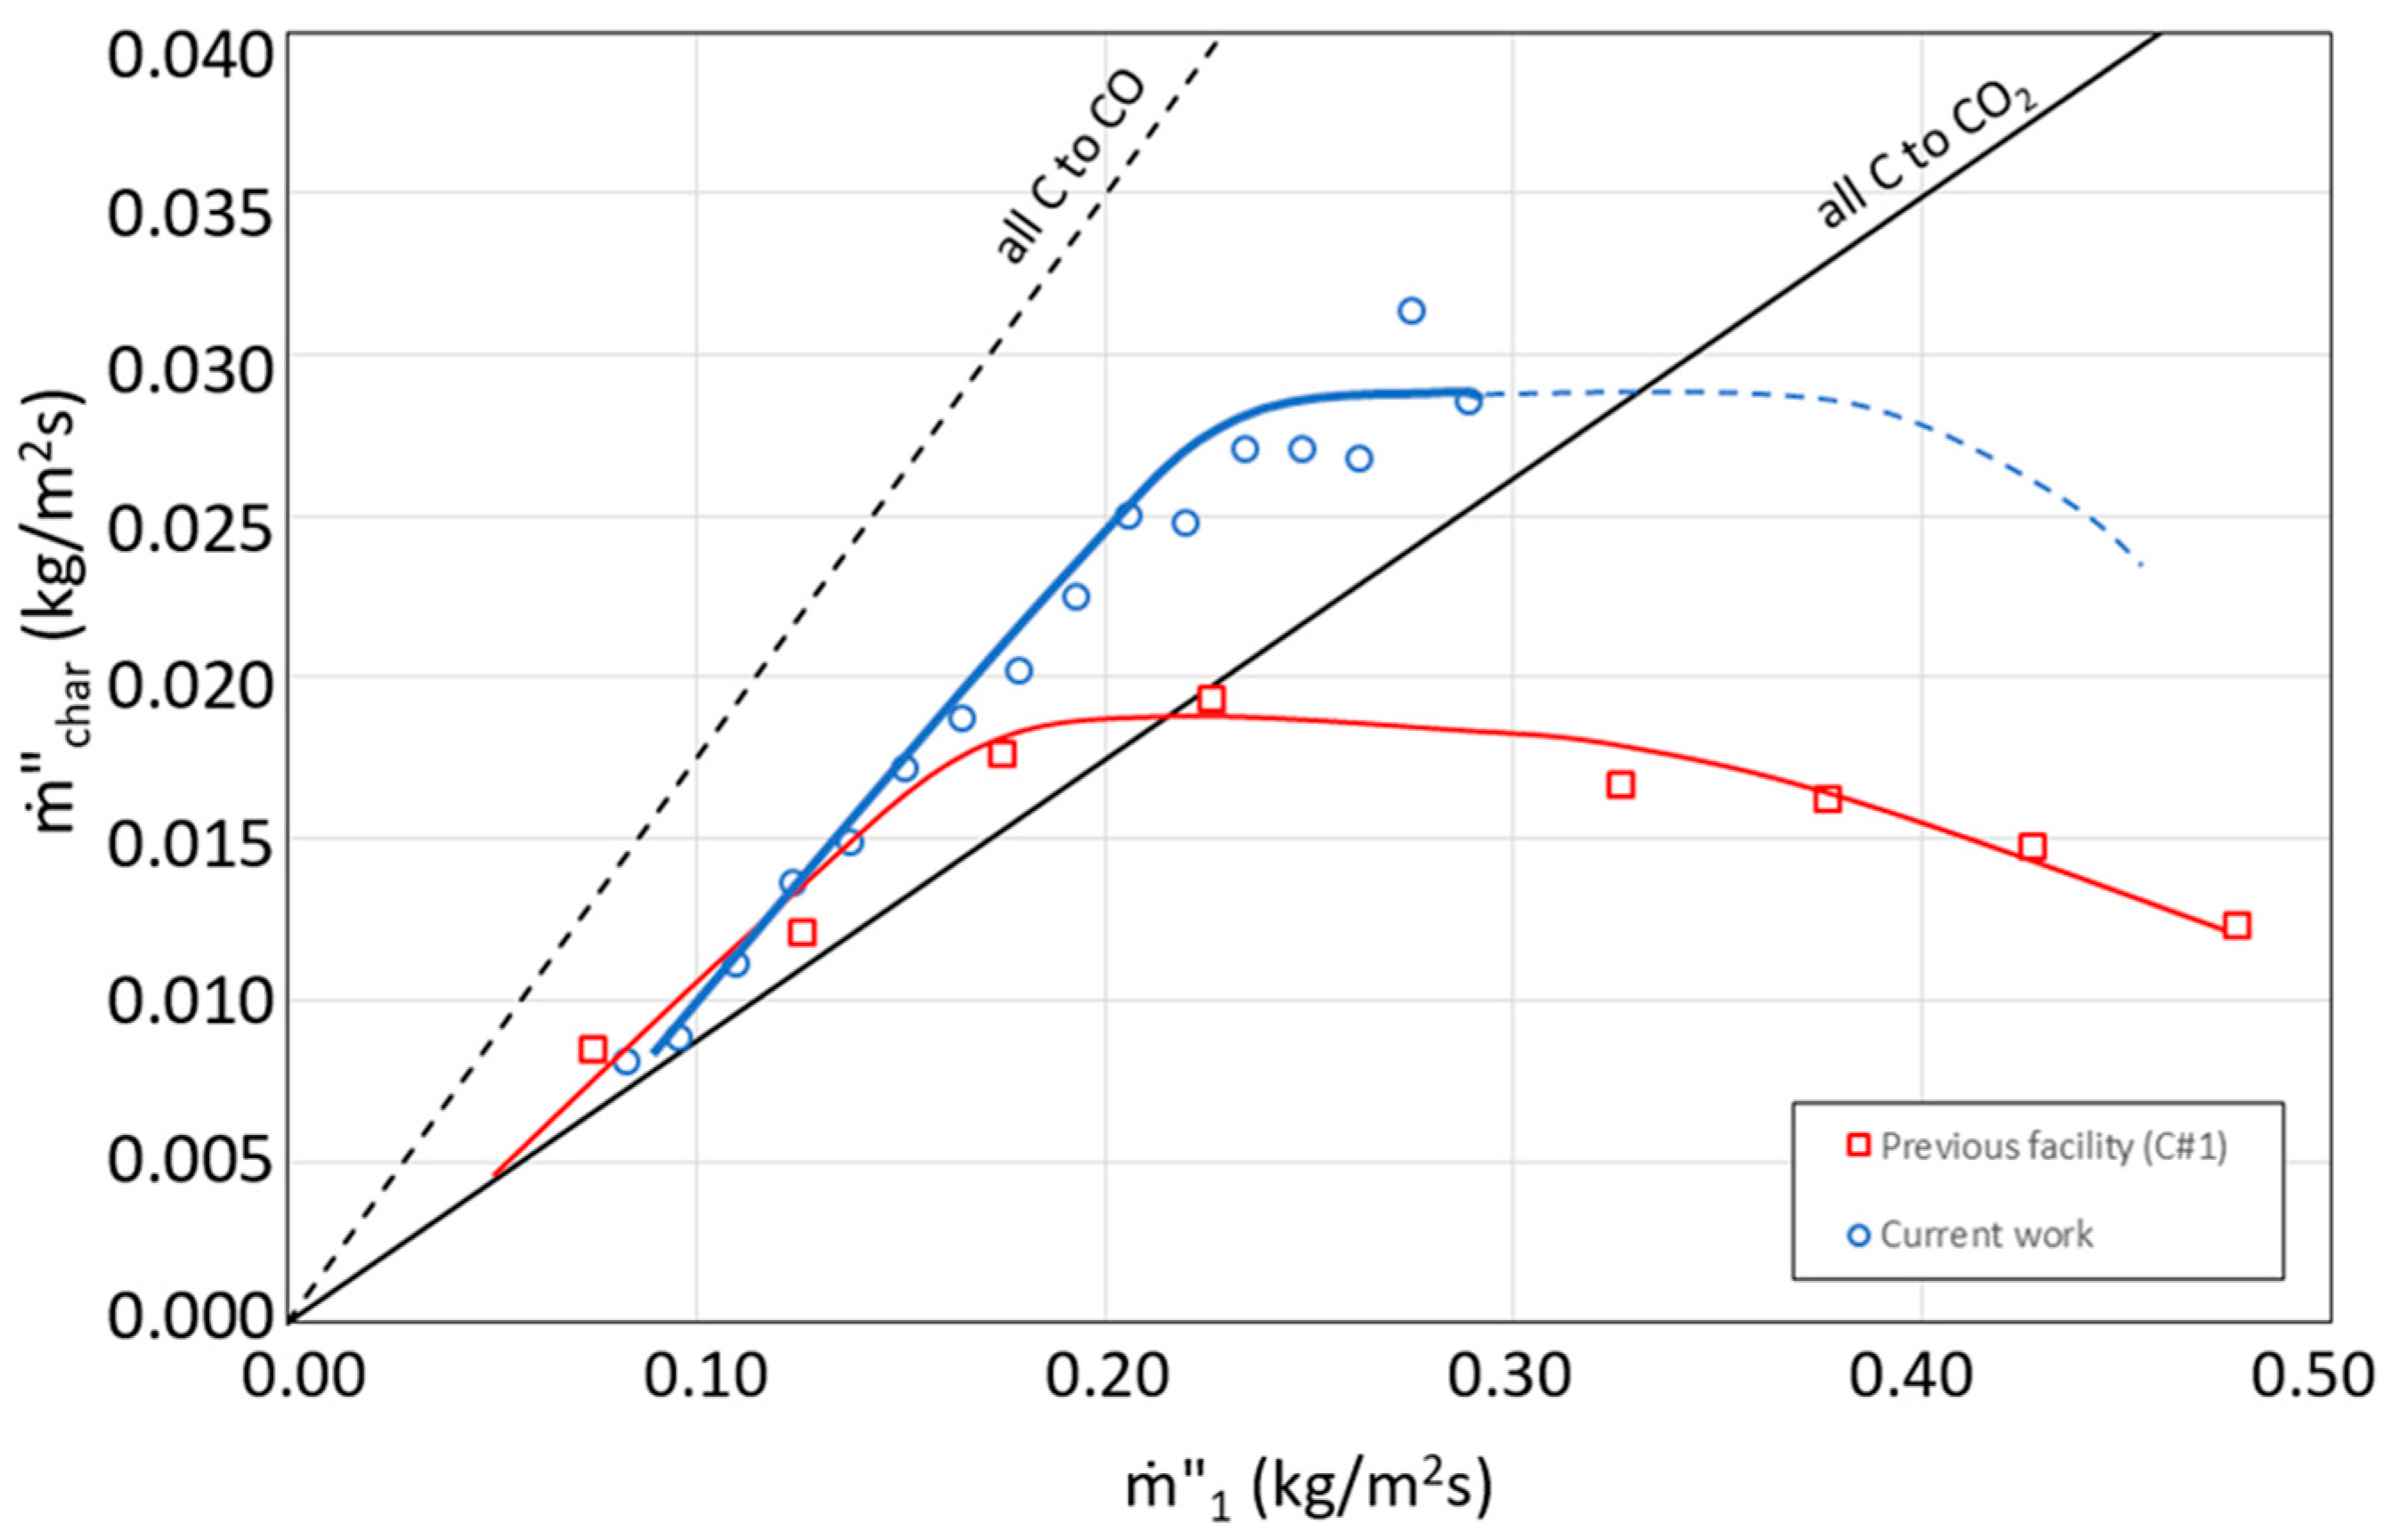
  • The burning rates measured in this work are much higher when compare with reference data obtained in a batch combustor. The main explanation for this behavior is not only the effect of the air staging that enhances the reaction rate, but also the steady position of the ignition front due to the continuous feeding. In a batch combustor, as the ignition front travels along the tube there is an important heat dissipation. However, in the current facility, the combustion front is always steady in the same place owing to the continuously feeding system, increasing the temperature and thickness of the reaction front.
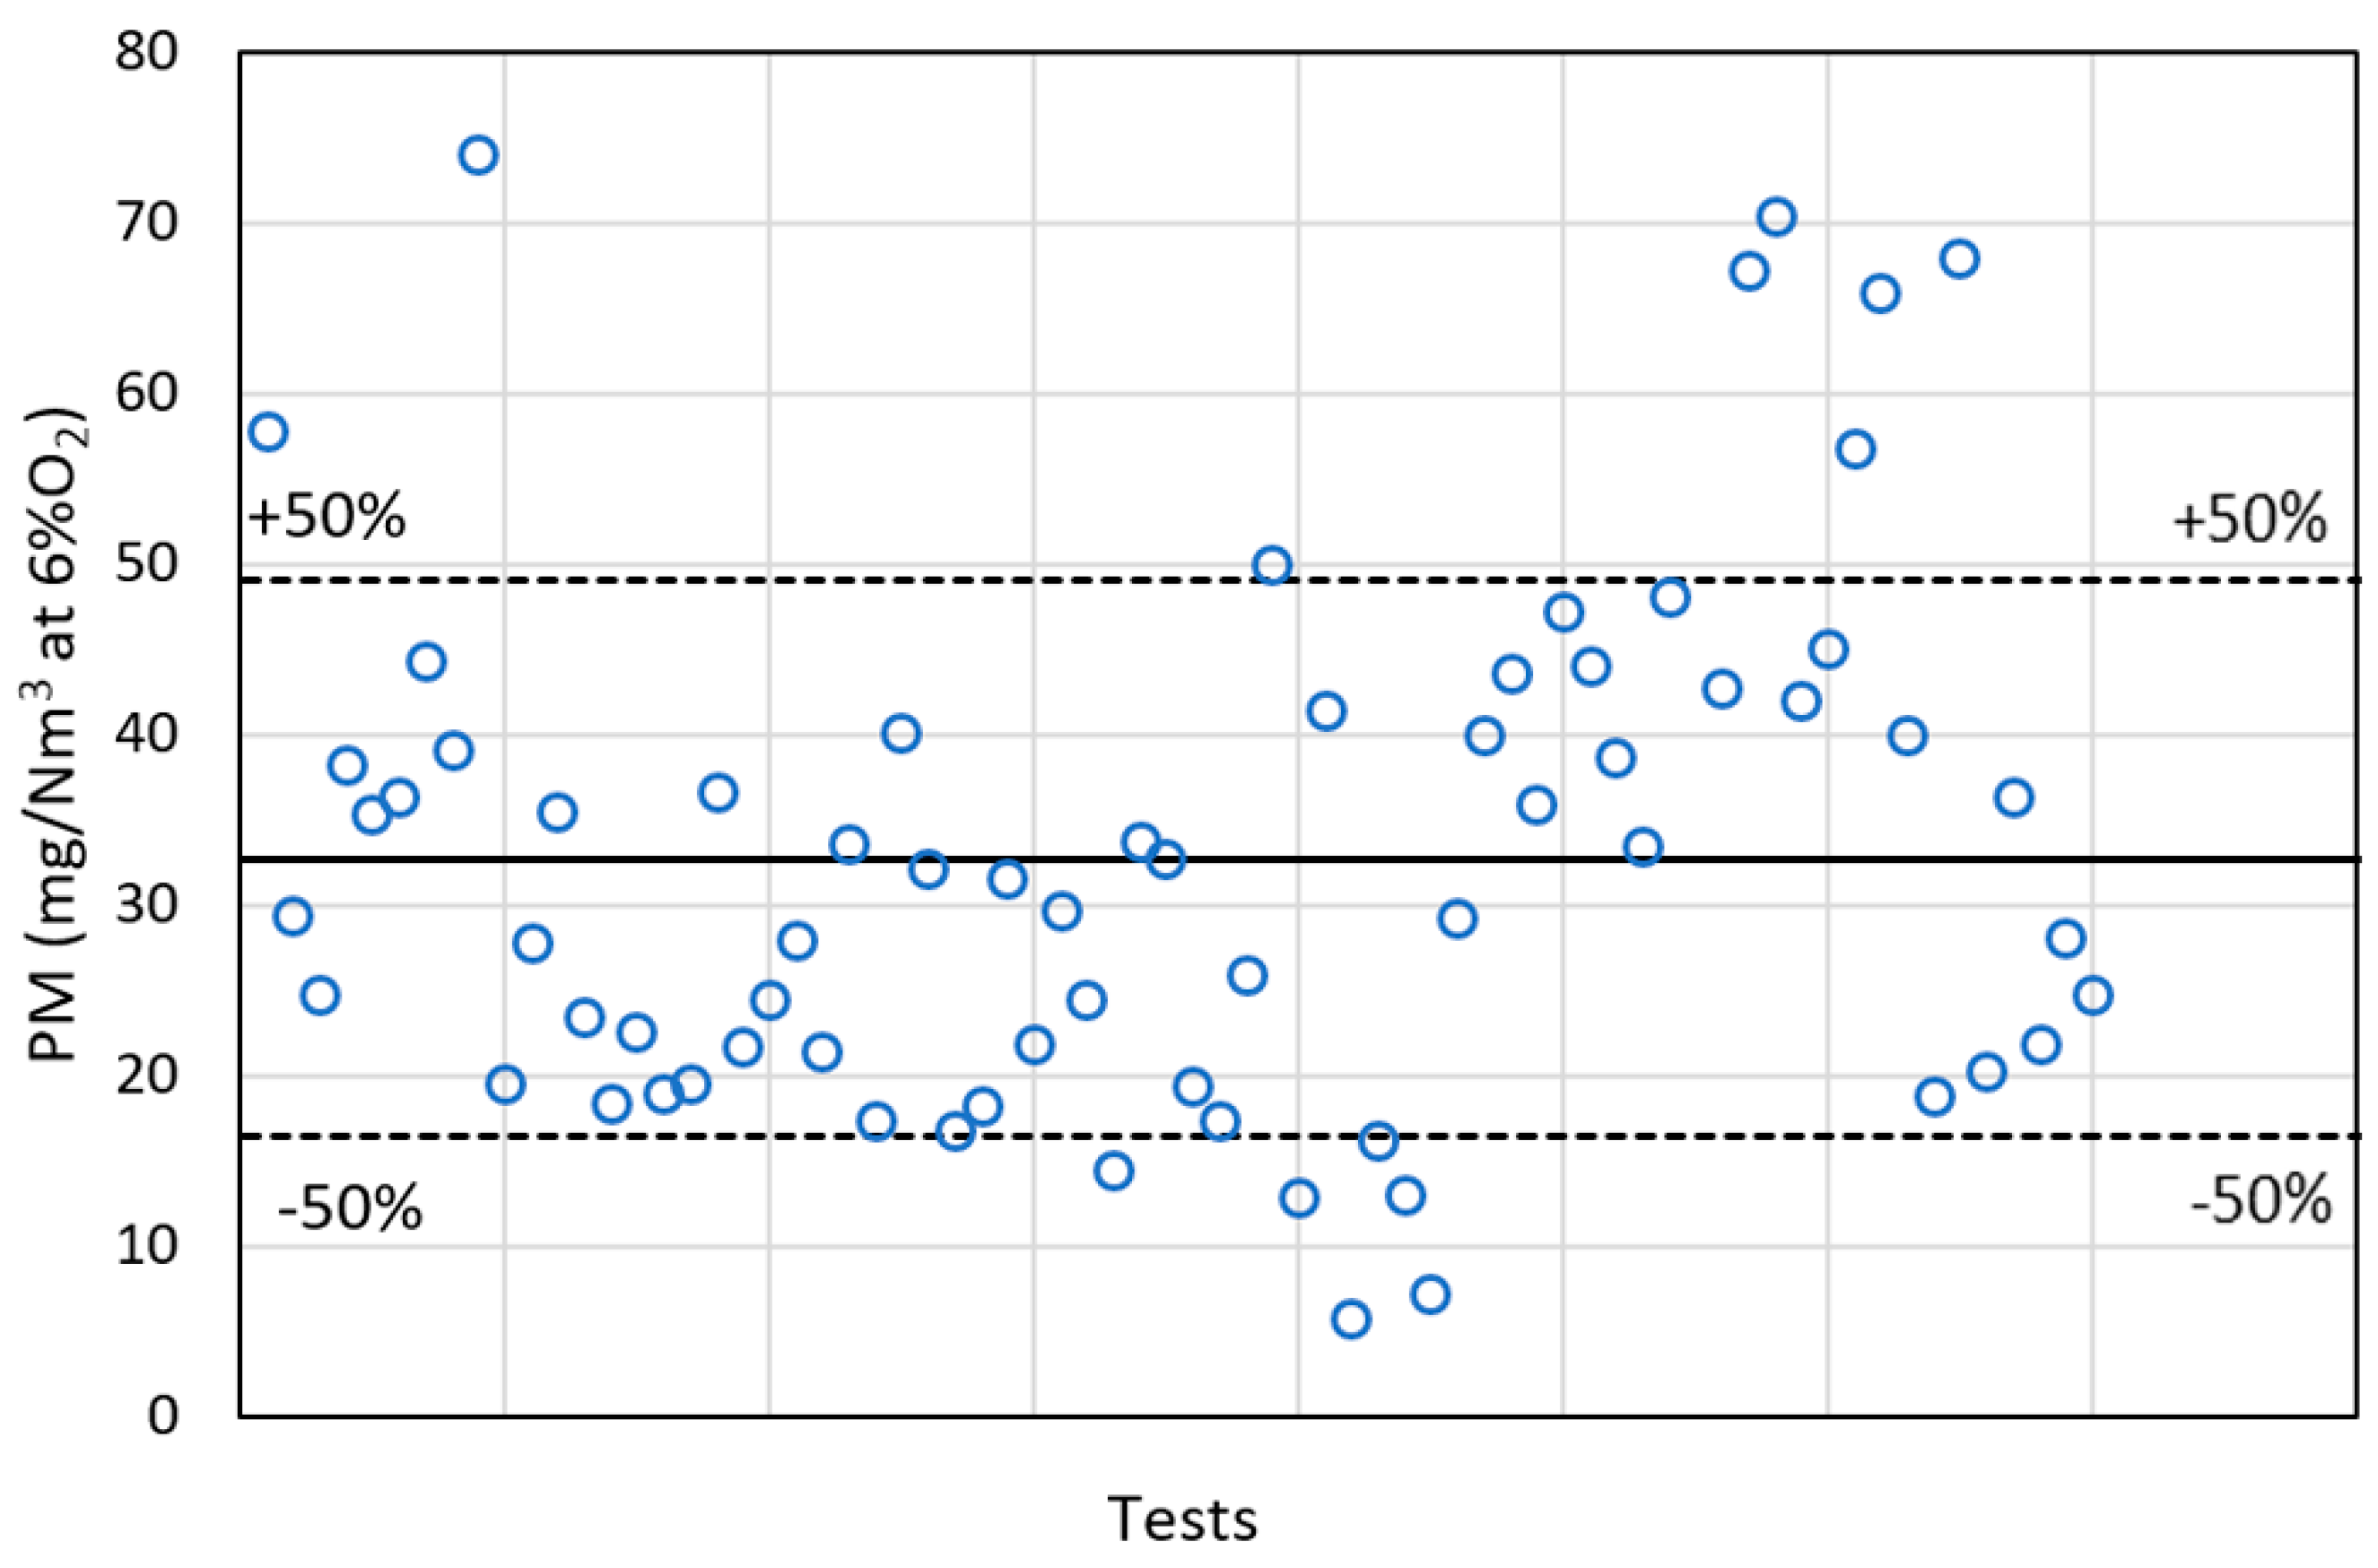
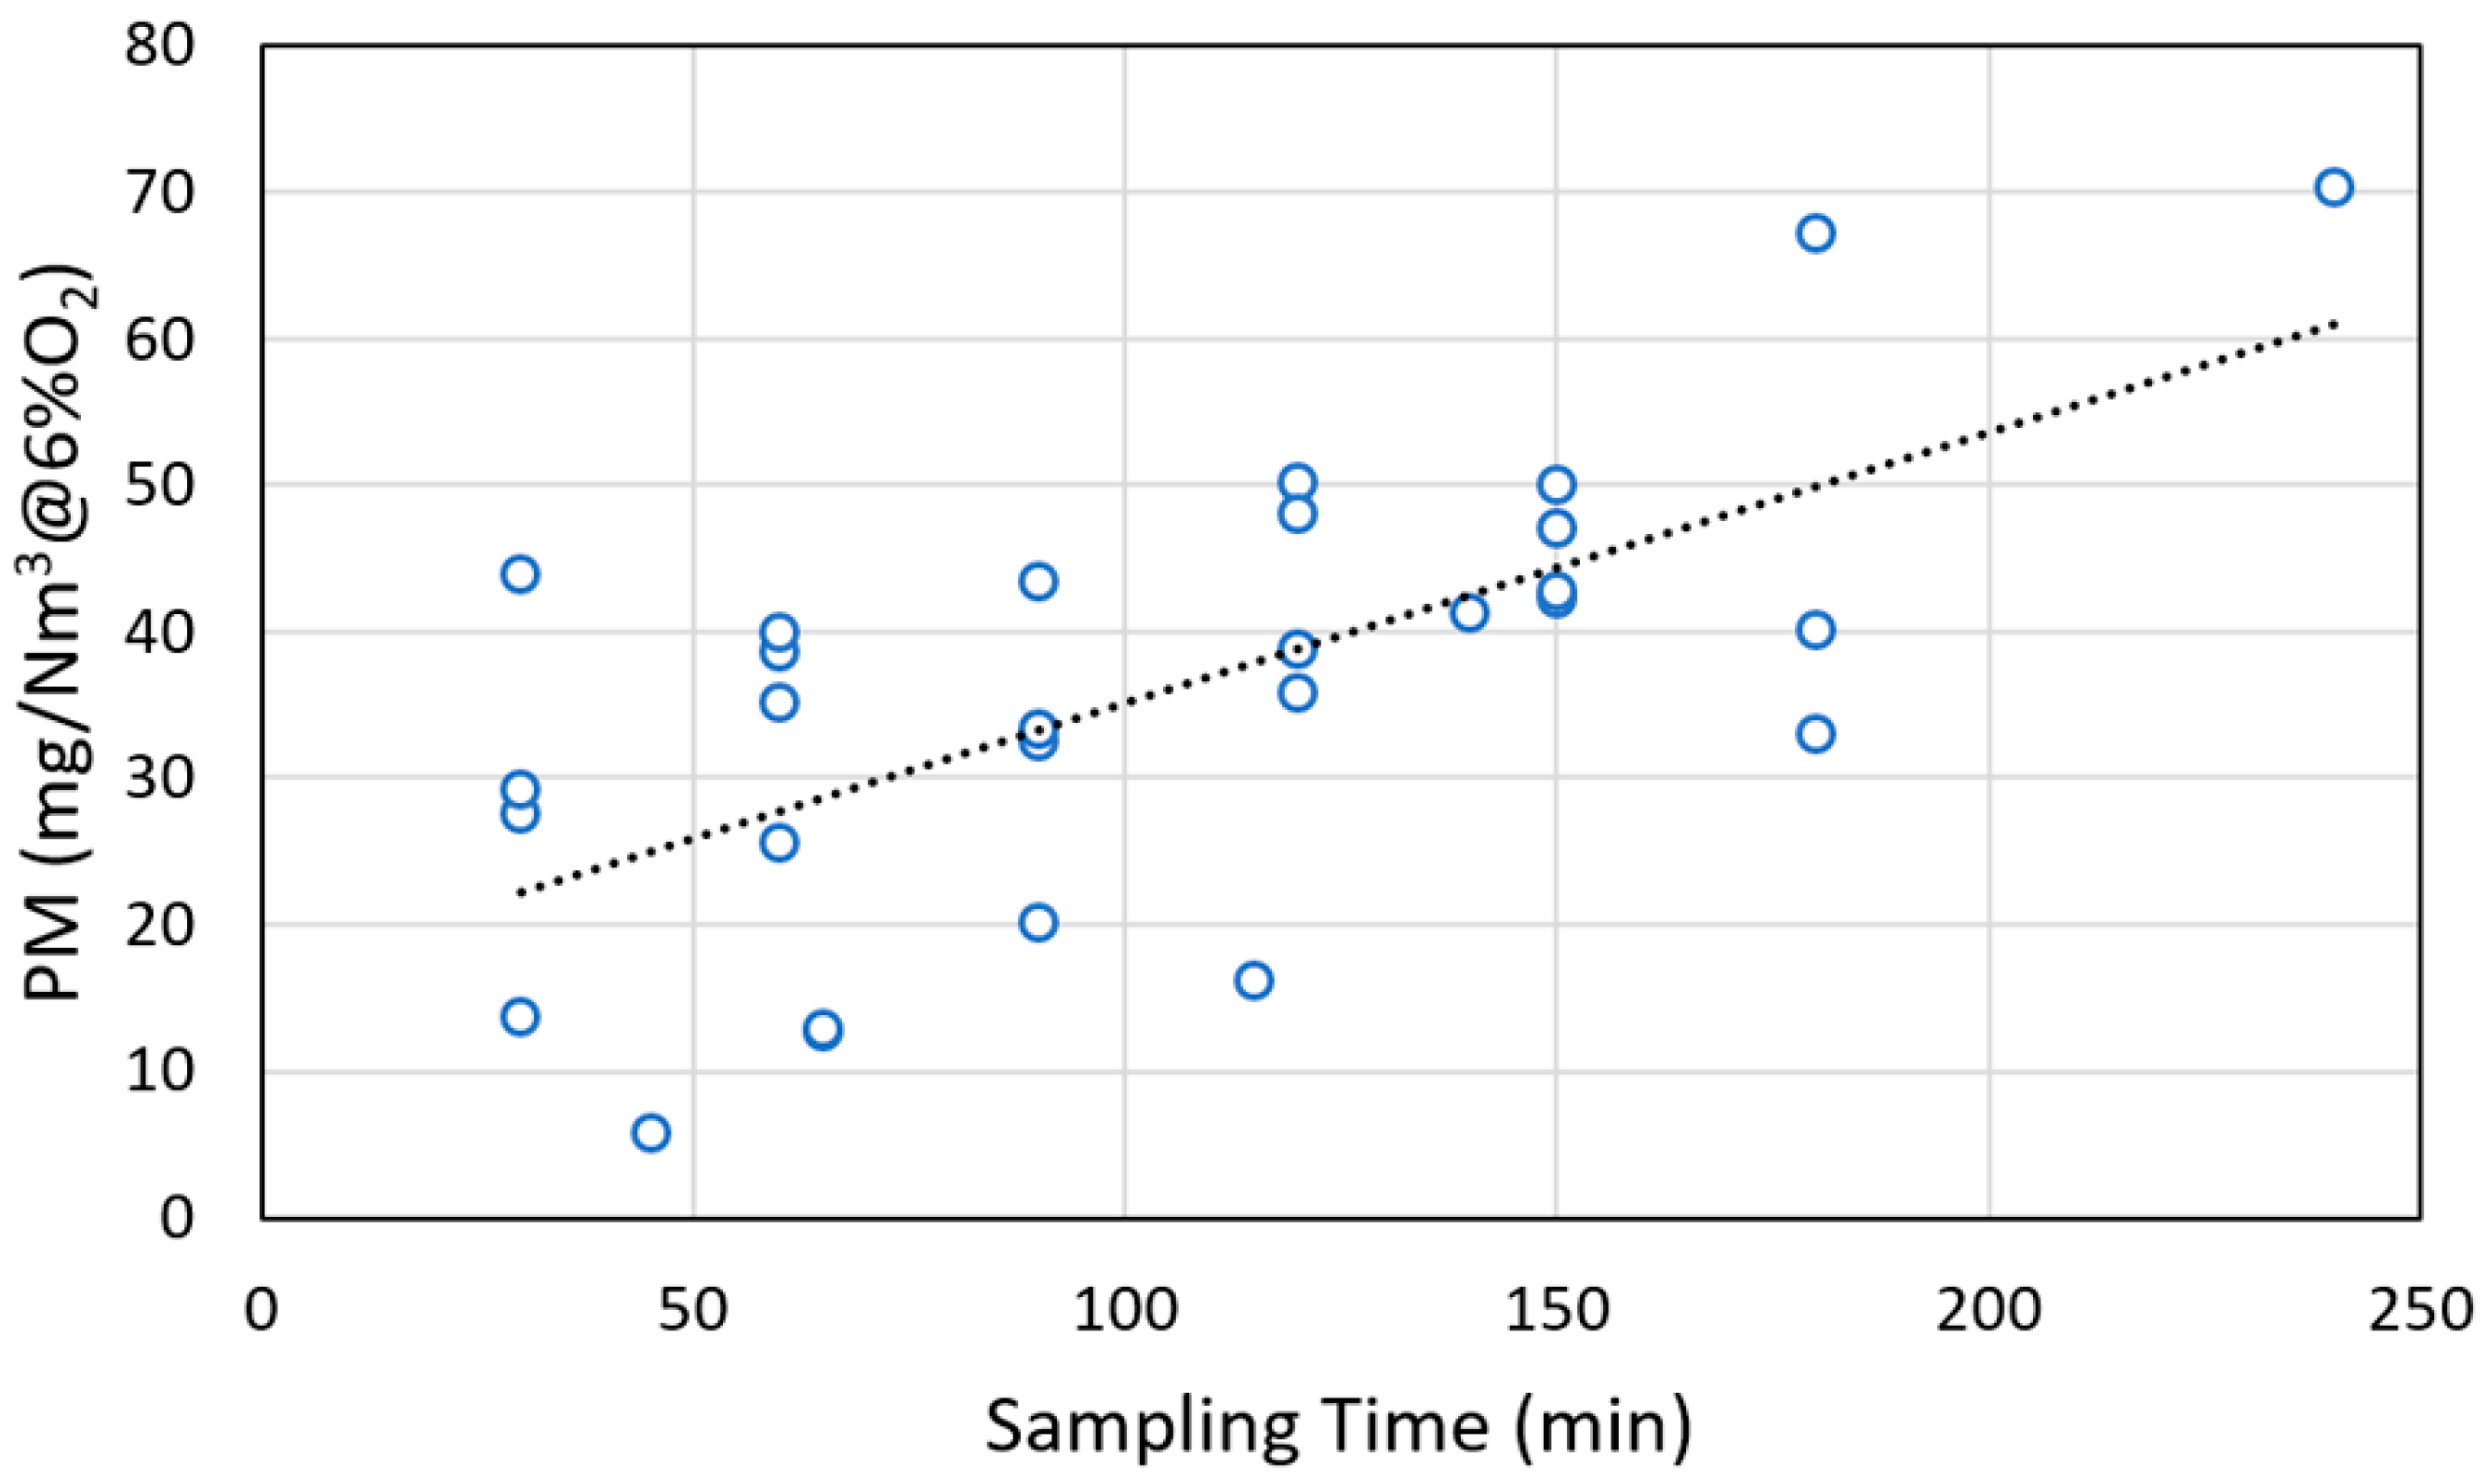
  • The amount of particulate matter collected is a function of the sampling moment due to the ash accumulation in the combustion chamber.
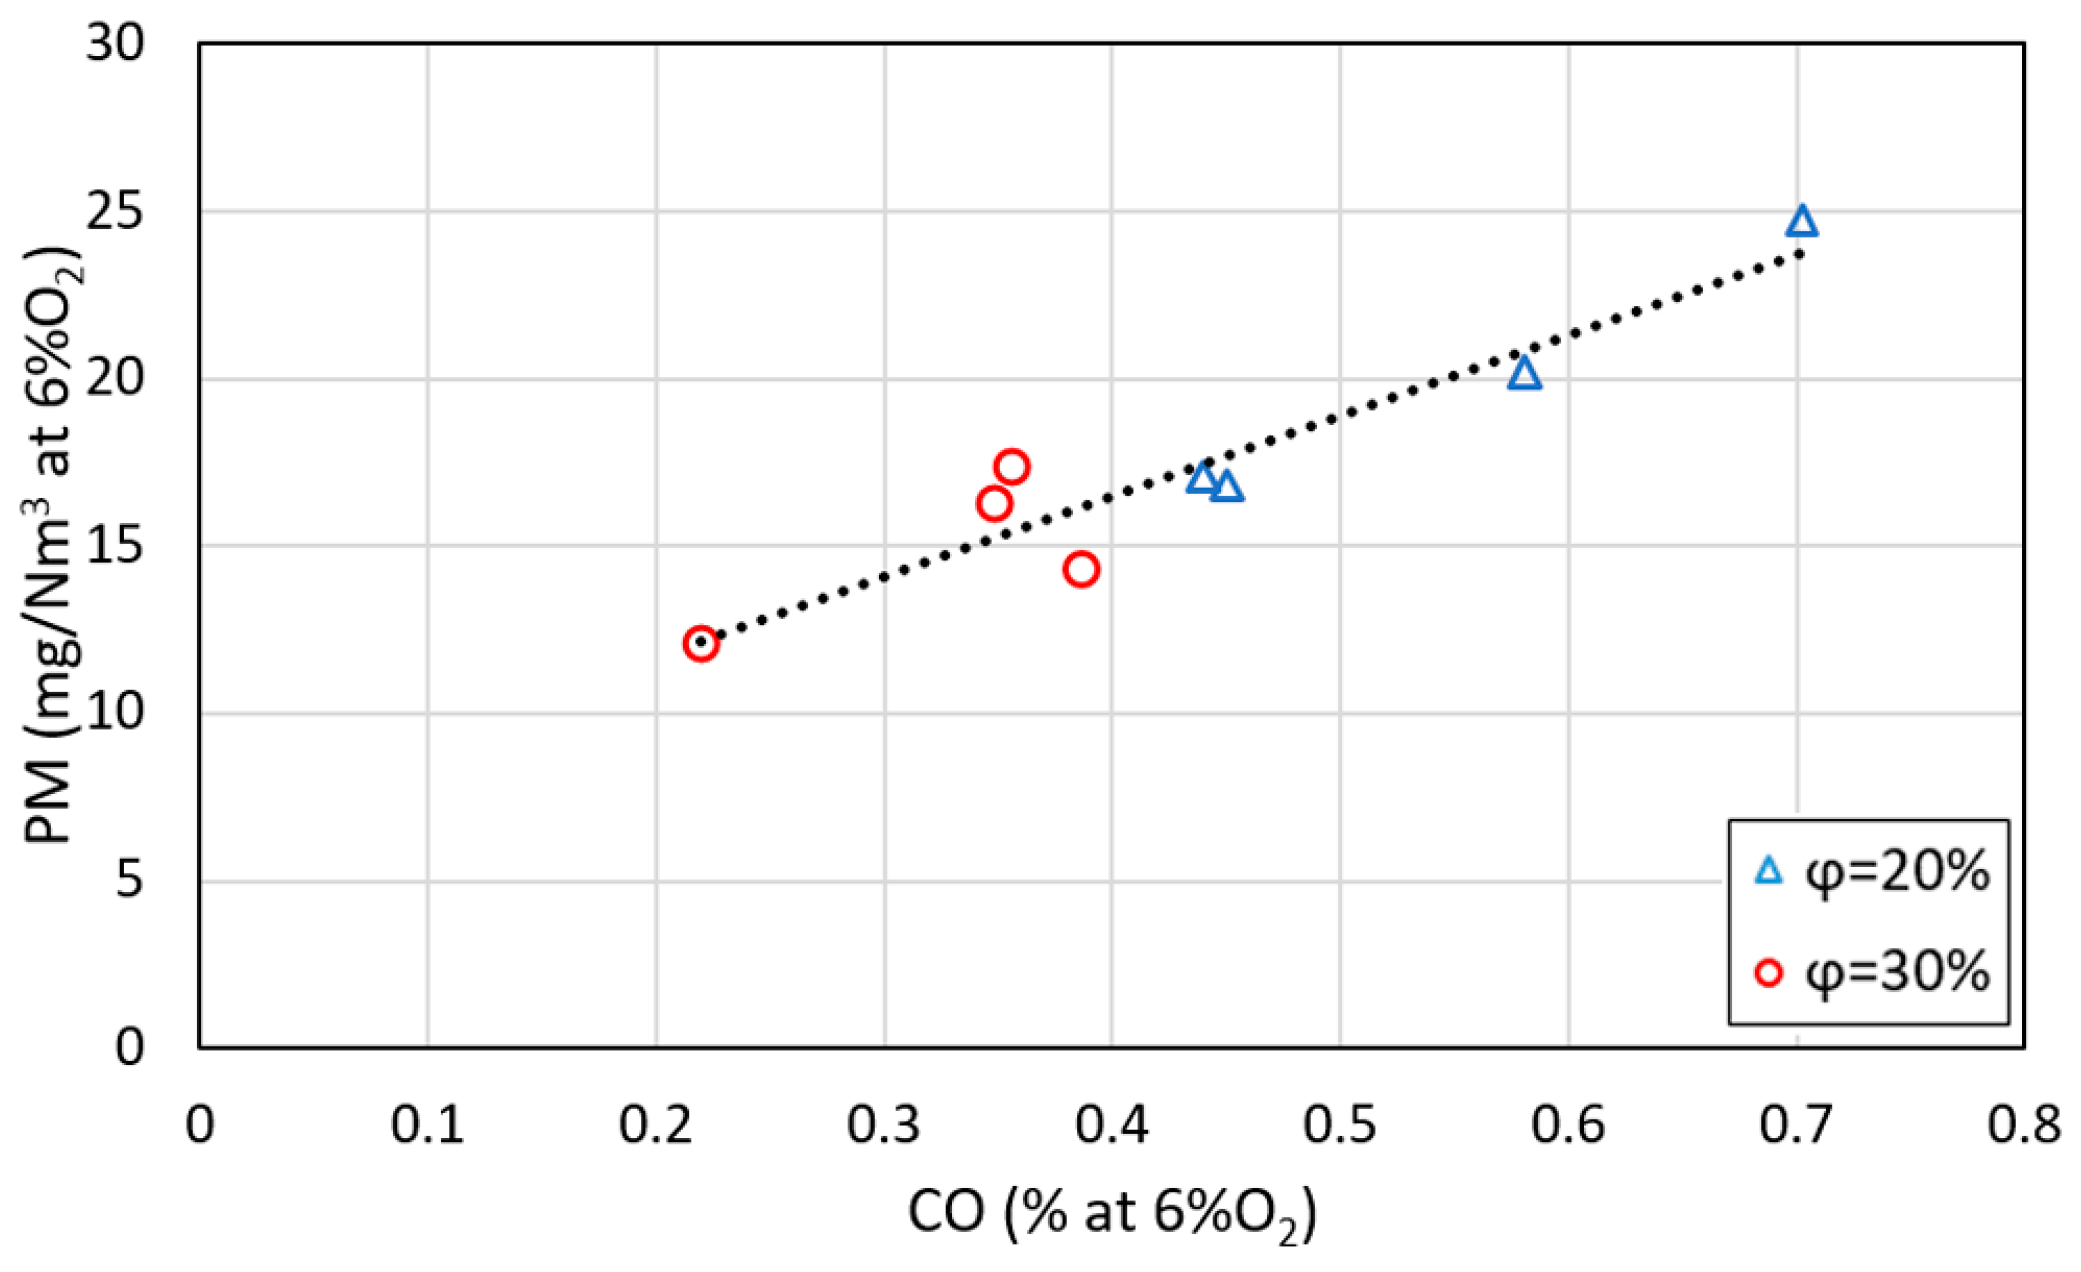
  • Particle concentrations between 15 and 75 mg/Nm3 at 6% O2 were recorded with air staging in most of the cases. When only primary air is introduced, the concentration is increased, reaching values of up 360 mg/Nm3.
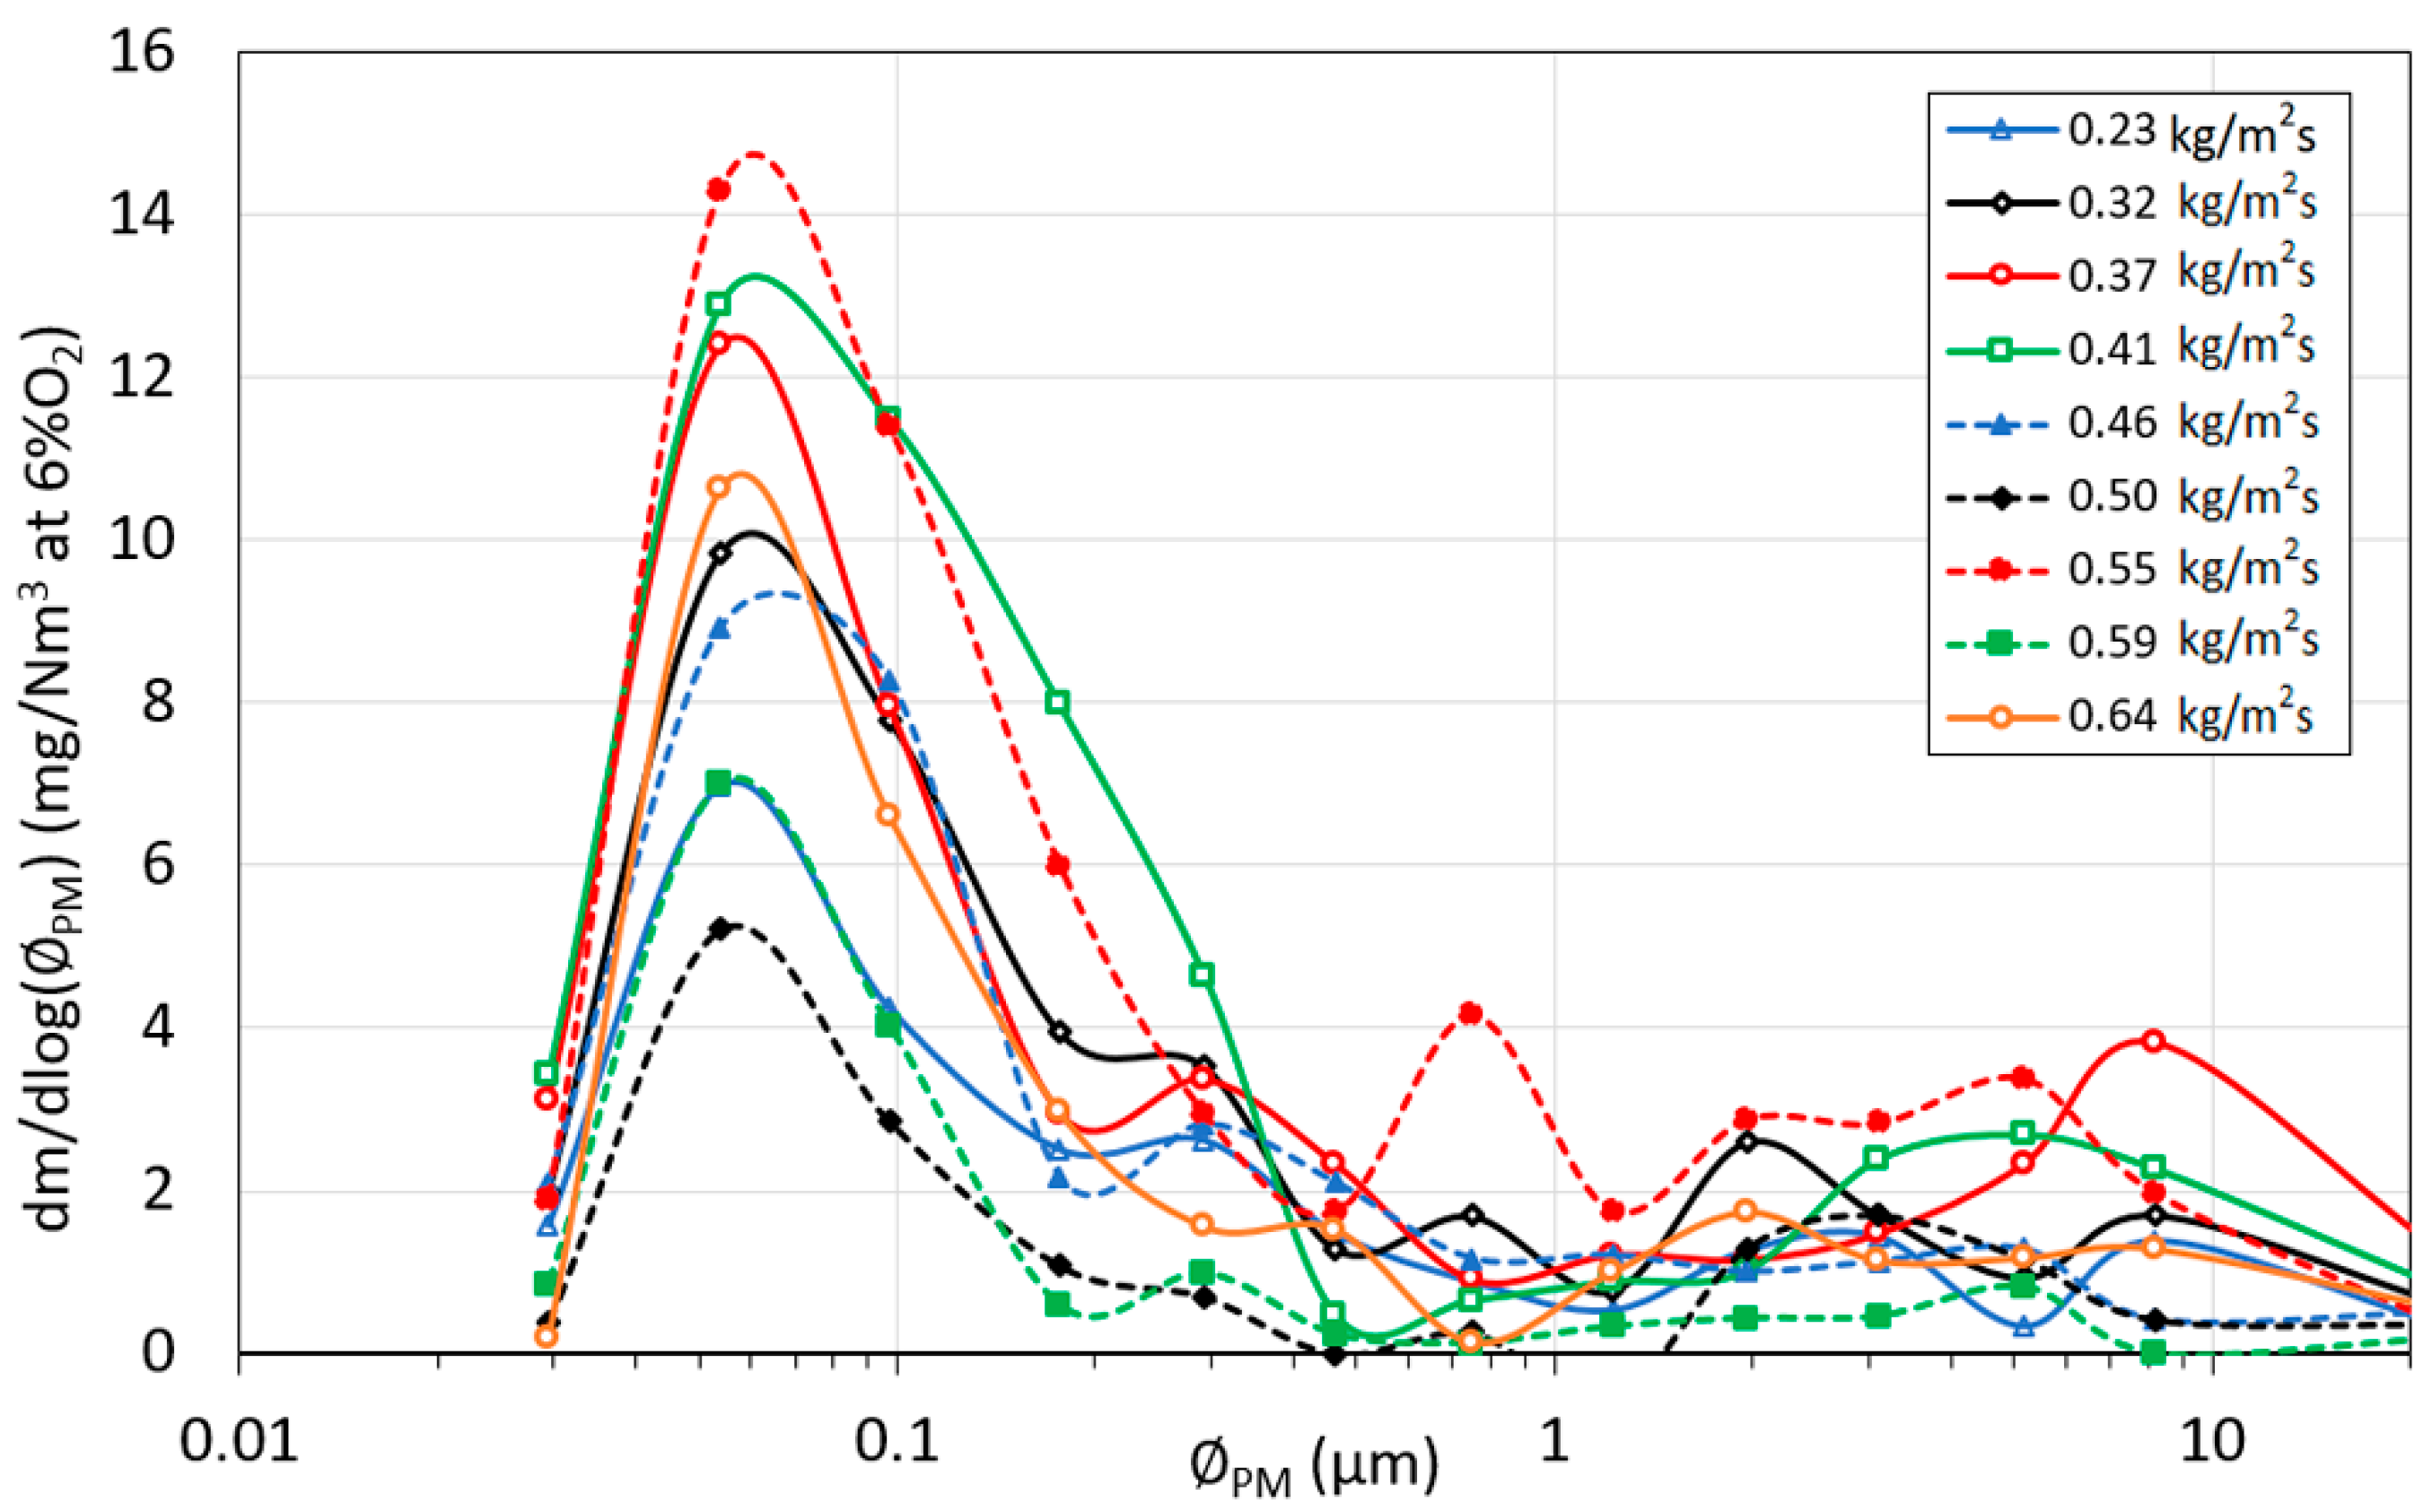
  • The characteristic size obtained for the PM was 0.05–0.1 μm. As with the total concentration, this size does not seem to vary significantly with the air conditions (total airflow or staging ratios). At the very least, the variations are lower than the measurement uncertainty for this study.

Acknowledgments

The authors acknowledge the financial support from the project ENE2015-67439-R of the Ministry of Economy and Competitiveness (Spain) and the project ENE2014-60046-R of the Ministry of Economy and Competitiveness (Spain). The work of the first author, a Ph.D. student, has been supported by the grant BES-2013-064073 of the Ministry of Economy and Competitiveness (Spain).

Author Contributions

Araceli Regueiro, David Patiño and José Luis Míguez designed and conducted the research. In addition, Araceli Regueiro and David Patiño wrote the manuscript. Jacobo Porteiro and Enrique Granada collaborated in the interpretation and analysis of data. All authors reviewed and accepted the final manuscript.

Conflicts of Interest

The authors declare no conflict of interest.

Nomenclature

m ˙ 1 Primary air mass flow (kg/m2s)
m ˙ 2 Secondary air mass flow (kg/m2s)
m ˙ air Total air mass flow ( m ˙ 1 + m ˙ 2 ) (kg/m2s)
m ˙ f Fuel burning rate (kg/m2s)
m ˙ char Char/carbon burning rate (kg/m2s)
AFRParticle air to fuel stoichiometric ratio (kg of dry air per kg of fuel burnt)
AFRCChar air to fuel stoichiometric ratio (kg of dry air per kg of carbon burnt)
TchChimney/Stack gas temperature (°C)
TgGas temperature (°C)
TinWater inlet temperature (°C)

Greek Symbols

λAir excess (total air-fuel equivalence ratio)
λ1Primary air excess (primary air-fuel equivalence ratio)
λCChar air excess (primary air-char equivalence ratio)
φAir staging ratio ( m ˙ 1 / m ˙ air )
ØPMParticulate matter representative size (μm)

Abbreviation

DLPIDekati Low Pressure Impactor
PMParticulate Matter (mg/Nm3)
SEM/EDSScanning Electron Microscopy/Energy Dispersive Spectroscopy
wpwood pellet

References

  1. Michopoulos, A.; Skoulou, V.; Voulgari, V.; Tsikaloudaki, A.; Kyriakis, N. The exploitation of biomass for building space heating in Greece: Energy, environmental and economic considerations. Energy Convers. Manag. 2014, 78, 276–285. [Google Scholar] [CrossRef]
  2. Tchapda, A.H.; Pisupati, S.V. A review of thermal co-conversion of coal and biomass/waste. Energies 2014, 7, 1098–1148. [Google Scholar] [CrossRef]
  3. Wiinikka, H.; Gebart, R. Critical parameters for particle emissions in small-scale fixed-bed combustion of wood pellets. Energy Fuels 2004, 18, 897–907. [Google Scholar] [CrossRef]
  4. Wiinikka, H.; Gebart, R.; Boman, C.; Boström, D.; Nordin, A.; Öhman, M. High-temperature aerosol formation in wood pellets flames: Spatially resolved measurements. Combust. Flame 2006, 147, 278–293. [Google Scholar] [CrossRef]
  5. Wiinikka, H.; Gebart, R. Experimental investigations of the influence from different operating conditions on the particle emissions from a small-scale pellets combustor. Biomass Bioenergy 2004, 27, 645–652. [Google Scholar] [CrossRef]
  6. Yang, Y.; Sharifi, V.; Swithenbank, J. Effect of air flow rate and fuel moisture on the burning behaviours of biomass and simulated municipal solid wastes in packed beds. Fuel 2004, 83, 1553–1562. [Google Scholar] [CrossRef]
  7. Porteiro, J.; Patiño, D.; Collazo, J.; Granada, E.; Moran, J.; Miguez, J. Experimental analysis of the ignition front propagation of several biomass fuels in a fixed-bed combustor. Fuel 2010, 89, 26–35. [Google Scholar] [CrossRef]
  8. Porteiro, J.; Patiño, D.; Moran, J.; Granada, E. Study of a fixed-bed biomass combustor: Influential parameters on ignition front propagation using parametric analysis. Energy Fuels 2010, 24, 3890–3897. [Google Scholar] [CrossRef]
  9. Buchmayr, M.; Gruber, J.; Hargassner, M.; Hochenauer, C. Experimental investigation of the primary combustion zone during staged combustion of wood-chips in a commercial small-scale boiler. Biomass Bioenergy 2015, 81, 356–363. [Google Scholar] [CrossRef]
  10. Fernandes, U.; Costa, M. Formation of fine particulate matter in a domestic pellet-fired boiler. Energy Fuels 2013, 27, 1081–1092. [Google Scholar] [CrossRef]
  11. Fernandes, U.; Costa, M. Particle emissions from a domestic pellets-fired boiler. Fuel Process. Technol. 2012, 103, 51–56. [Google Scholar] [CrossRef]
  12. Ozgen, S.; Cernuschi, S.; Giugliano, M. Experimental evaluation of particle number emissions from wood combustion in a closed fireplace. Biomass Bioenergy 2013, 50, 65–74. [Google Scholar] [CrossRef]
  13. Murasawa, N.; Koseki, H. Investigation of Heat Generation from Biomass Fuels. Energies 2015, 8, 5143–5158. [Google Scholar] [CrossRef]
  14. Boman, C.; Pettersson, E.R.; Westerholm, R.; Boström, D.; Nordin, A. Stove performance and emission characteristics in residential wood log and pellet combustion, Part 1: Pellet stoves. Energy Fuels 2011, 25, 307–314. [Google Scholar] [CrossRef]
  15. Wiinikka, H.; Gebart, R.; Boman, C.; Boström, D.; Öhman, M. Influence of fuel ash composition on high temperature aerosol formation in fixed bed combustion of woody biomass pellets. Fuel 2007, 86, 181–193. [Google Scholar] [CrossRef]
  16. Ryu, C.; Yang, Y.B.; Khor, A.; Yates, N.E.; Sharifi, V.N.; Swithenbank, J. Effect of fuel properties on biomass combustion: Part I. Experiments—Fuel type, equivalence ratio and particle size. Fuel 2006, 85, 1039–1046. [Google Scholar] [CrossRef]
  17. Tarelho, L.A.C.; Neves, D.S.F.; Matos, M.A.A. Forest biomass waste combustion in a pilot-scale bubbling fluidised bed combustor. Biomass Bioenergy 2011, 35, 1511–1523. [Google Scholar] [CrossRef]
  18. Shao, Y.; Wang, J.; Preto, F.; Zhu, J.; Xu, C. Ash deposition in biomass combustion or co-firing for power/heat generation. Energies 2012, 5, 5171–5189. [Google Scholar] [CrossRef]
  19. Ryu, C.; Phan, A.N.; Sharifi, V.N.; Swithenbank, J. Combustion of textile residues in a packed bed. Exp. Therm. Fluid Sci. 2007, 31, 887–895. [Google Scholar] [CrossRef]
  20. Zhao, W.; Li, Z.; Wang, D.; Zhu, Q.; Sun, R.; Meng, B.; Zhao, G. Combustion characteristics of different parts of corn straw and NO formation in a fixed bed. Bioresour. Technol. 2008, 99, 2956–2963. [Google Scholar] [CrossRef] [PubMed]
  21. Gómez, M.; Porteiro, J.; Patiño, D.; Míguez, J. Fast-solving thermally thick model of biomass particles embedded in a CFD code for the simulation of fixed-bed burners. Energy Convers. Manag. 2015, 105, 30–44. [Google Scholar] [CrossRef]
  22. Febrero, L.; Granada, E.; Pérez, C.; Patiño, D.; Arce, E. Characterisation and comparison of biomass ashes with different thermal histories using tg-dsc. J. Therm. Anal. Calorim. 2014, 118, 669–680. [Google Scholar] [CrossRef]
  23. Rogaume, T.; Auzanneau, M.; Jabouille, F.; Goudeau, J.; Torero, J. The effects of different airflows on the formation of pollutants during waste incineration. Fuel 2002, 81, 2277–2288. [Google Scholar] [CrossRef]
  24. Khodaei, H.; Al-Abdeli, Y.M.; Guzzomi, F.; Yeoh, G.H. An overview of processes and considerations in the modelling of fixed-bed biomass combustion. Energy 2015, 88, 946–972. [Google Scholar] [CrossRef]
  25. Horttanainen, M.; Saastamoinen, J.; Sarkomaa, P. Operational limits of ignition front propagation against airflow in packed beds of different wood fuels. Energy Fuels 2002, 16, 676–686. [Google Scholar] [CrossRef]
  26. Nicholls, P. Underfeed Combustion, Effect of Preheat, and Distribution of Ash in Fuel Beds; United states Government Printing Office: Washington, DC, USA, 1934.
  27. Katunzi, M. Biomass Conversion in Fixed Bed Experiments; Report Number WVT; Technische Universiteit Eindhoven: Eindhoven, The Netherlands, 2006; pp. 1–55. [Google Scholar]
  28. Zhou, H.; Jensen, A.; Glarborg, P.; Jensen, P.A.; Kavaliauskas, A. Numerical modeling of straw combustion in a fixed bed. Fuel 2005, 84, 389–403. [Google Scholar] [CrossRef]
  29. Van Blijderveen, M.; Gucho, E.M.; Bramer, E.A.; Brem, G. Spontaneous ignition of wood, char and RDF in a lab scale packed bed. Fuel 2010, 89, 2393–2404. [Google Scholar] [CrossRef]
  30. Razuan, R.; Chen, Q.; Finney, K.N.; Russell, N.V.; Sharifi, V.N.; Swithenbank, J. Combustion of oil palm stone in a pilot-scale fluidised bed reactor. Fuel Process. Technol. 2011, 92, 2219–2225. [Google Scholar] [CrossRef]
  31. Obaidullah, M.; Bram, S.; Verma, V.; De Ruyck, J. A review on particle emissions from small scale biomass combustion. Int. J. Renew. Energy Res. 2012, 2, 147–159. [Google Scholar]
  32. Sippula, O. Fine Particle Formation and Emissions in Biomass Combustion. Available online: http://www.atm.helsinki.fi/faar/reportseries/rs-108.pdf (accessed on 18 March 2010).
  33. Obernberger, I.; Brunner, T.; Bärnthaler, G. Fine particulate emissions from modern Austrian small-scale biomass combustion plants. In Proceedings of the 15th European Biomass Conference & Exhibition, Berlin, Germany, 7–11 May 2007; pp. 1546–1557.
  34. Johansson, L.; Tullin, C.; Leckner, B.; Sjövall, P. Particle emissions from biomass combustion in small combustors. Biomass Bioenergy 2003, 25, 435–446. [Google Scholar] [CrossRef]
  35. Gaegauf, C.; Wieser, U.; Macquat, Y. Field investigation of nanoparticle emissions from various biomass combustion systems. In Proceedings of the International Seminar on Aerosol from Biomass Combustion, Zurich, Switzerland, 27 June 2001; pp. 81–85.
  36. Chen, Q.; Zhang, X.; Bradford, D.; Sharifi, V.; Swithenbank, J. Comparison of emission characteristics of small-scale heating systems using biomass instead of coal. Energy Fuels 2010, 24, 4255–4265. [Google Scholar] [CrossRef]
  37. Boman, C.; Nordin, A.; Boström, D.; Öhman, M. Characterization of inorganic particulate matter from residential combustion of pelletized biomass fuels. Energy Fuels 2004, 18, 338–348. [Google Scholar] [CrossRef]
  38. Nussbaumer, T. Combustion and co-combustion of biomass: Fundamentals, technologies, and primary measures for emission reduction. Energy Fuels 2003, 17, 1510–1521. [Google Scholar] [CrossRef]
  39. Wierzbicka, A.; Lillieblad, L.; Pagels, J.; Strand, M.; Gudmundsson, A.; Gharibi, A.; Swietlicki, E.; Sanati, M.; Bohgard, M. Particle emissions from district heating units operating on three commonly used biofuels. Atmos. Environ. 2005, 39, 139–150. [Google Scholar] [CrossRef]
  40. Yang, Y.; Yamauchi, H.; Nasserzadeh, V.; Swithenbank, J. Effects of fuel devolatilisation on the combustion of wood chips and incineration of simulated municipal solid wastes in a packed bed. Fuel 2003, 82, 2205–2221. [Google Scholar] [CrossRef]
  41. Yang, Y.B.; Ryu, C.; Khor, A.; Sharifi, V.N.; Swithenbank, J. Fuel size effect on pinewood combustion in a packed bed. Fuel 2005, 84, 2026–2038. [Google Scholar] [CrossRef]
  42. Arromdee, P.; Kuprianov, V.I. Combustion of peanut shells in a cone-shaped bubbling fluidized-bed combustor using alumina as the bed material. Appl. Energy 2012, 97, 470–482. [Google Scholar] [CrossRef]
  43. Liu, H.; Chaney, J.; Li, J.; Sun, C. Control of NOx emissions of a domestic/small-scale biomass pellet boiler by air staging. Fuel 2013, 103, 792–798. [Google Scholar] [CrossRef]
  44. Ehrlich, C.; Noll, G.; Kalkoff, W. Determining PM-emission fractions (PM10, PM2.5, PM1.0) from small-scale combustion units and domestic stoves using different types of fuels including biofuels like wood pellets and energy grain. In Proceedings of the 18th Clean Air Society of Australia and New Zealand (CASANZ) Conference, Brisbane, Australia, 9–13 September 2007.
  45. Bäfver, L.S.; Leckner, B.; Tullin, C.; Berntsen, M. Particle emissions from pellets stoves and modern and old-type wood stoves. Biomass Bioenergy 2011, 35, 3648–3655. [Google Scholar] [CrossRef]
  46. Kelz, J.; Brunner, T.; Obernberger, I.; Jalava, P.; Hirvonen, M. PM emissions from old and modern biomass combustion systems and their health effects. In Proceedings of the 18th European Biomass Conference and Exhibition, Lyon, France, 3–7 May 2010.
  47. Krugly, E.; Martuzevicius, D.; Puida, E.; Buinevicius, K.; Stasiulaitiene, I.; Radziuniene, I.; Minikauskas, A.; Kliucininkas, L. Characterization of Gaseous-and Particle-Phase Emissions from the Combustion of Biomass-Residue-Derived Fuels in a Small Residential Boiler. Energy Fuels 2014, 28, 5057–5066. [Google Scholar] [CrossRef]
Figure 1. Scheme of the facility.
Energies 09 00940 g001
Figure 2. Particulate matter (PM) concentration as a function of the sampling moment (minutes after stability). Tests conditions φ = 20%, m ˙ a i r = 0.457 kg/m2s and wp2.
Energies 09 00940 g002
Figure 3. Time evolution and stability of the plant for a test with φ = 25%; m ˙ a i r = 0.457 kg/m2s; m ˙ f = 0.15 kg/m2s and tube water temperature Tin = 25–30 °C. (a) gas and water inlet temperature; (b) gaseous emissions.
Energies 09 00940 g003
Figure 4. Burning rate versus total airflow for different air configurations.
Energies 09 00940 g004
Figure 5. Air excess versus total airflow for different air configurations.
Energies 09 00940 g005
Figure 6. Burning rate versus primary airflow ( m ˙ 1 ).
Energies 09 00940 g006
Figure 7. Primary (λ1) and char (λC) excess ratios versus total airflow rate.
Energies 09 00940 g007
Figure 8. Relation between char burning rate and primary airflow rate with and without air staging.
Energies 09 00940 g008
Figure 9. Comparison of the char burning rates using only primary air for different facilities.
Energies 09 00940 g009
Figure 10. Comparison of the char burning rates with and without air staging (φ).
Energies 09 00940 g010
Figure 11. Complete set of PM measurements for different fuels and air configurations using the Dekati low-pressure cascade impactor (DLPI).
Energies 09 00940 g011
Figure 12. PM size distribution function for φ = 20% but different total airflow rates and wp2.
Energies 09 00940 g012
Figure 13. (a) Relation between NOX and primary airflow rate; (b) CO emissions versus air excess ratio.
Energies 09 00940 g013
Figure 14. Relation between particulate matter and average CO emissions.
Energies 09 00940 g014
Table 1. Properties of the biomass fuels.
Proximate Analysis 1 (% Weight)
wp1wp2wp3
Moisture6.856.605.81
Volatile68.5066.6566.46
Fixed carbon 224.2425.7524.60
Ash0.411.003.13
Ultimate Analysis 3 (% Weight)
C47.4346.2347.71
H6.226.296.17
N0.142.551.95
O46.2144.9344.17
1 wet basis with ashes; 2 char; 3 dry basis ash free.
Table 2. Measurement repeatability for the main parameters.
FuelNumber of TestsParameterRelative Deviation %Air Staging φ
wp19Burning rate6.120%
Gas temperature9.3
5Burning rate4.715%
Gas temperature2.7
5Burning rate7.630%
Gas temperature3.8
wp217Burning rate10.320%
Gas temperature4.9
wp346Burning rate10.425%
Gas temperature8.8

