Article

A Phase Current Reconstruction Approach for Three-Phase Permanent-Magnet Synchronous Motor Drive

School of Electrical Engineering and Automation, Harbin Institute of Technology, Harbin 150001, China
*
Author to whom correspondence should be addressed.
Energies 2016, 9(10), 853; https://doi.org/10.3390/en9100853
Submission received: 10 July 2016 / Revised: 23 September 2016 / Accepted: 14 October 2016 / Published: 21 October 2016
(This article belongs to the Special Issue Electric Machines and Drives for Renewable Energy Harvesting)

Abstract

:
Three-phase permanent-magnet synchronous motors (PMSMs) are widely used in renewable energy applications such as wind power generation, tidal energy and electric vehicles owing to their merits such as high efficiency, high precision and high reliability. To reduce the cost and volume of the drive system, techniques of reconstructing three-phase current using a single current sensor have been reported for three-phase alternating current (AC) control system using the power converts. In existing studies, the reconstruction precision is largely influenced by reconstructing dead zones on the Space Vector Pulse Width Modulation (SVPWM) plane, which requires other algorithms to compensate either by modifying PWM modulation or by phase-shifting of the PWM signal. In this paper, a novel extended phase current reconstruction approach for PMSM drive is proposed. Six novel installation positions are obtained by analyzing the sampling results of the current paths between each two power switches. By arranging the single current sensor at these positions, the single current sensor is sampled during zero voltage vectors (ZVV) without modifying the PWM signals. This proposed method can reconstruct the three-phase currents without any complex algorithms and is available in the sector boundary region and low modulation region. Finally, this method is validated by experiments.

1. Introduction

Environmental concern is now promoting the utilization of renewable and clean energy, which has largely developed electrical energy [1,2,3,4]. Power converters for electrical energy conversion have been widely used in the renewable energy applications such as motor control, electric vehicle, energy storage, high-power-factor rectifiers, and compensators for reactive and harmonic currents to the grid [5,6,7,8,9,10,11,12,13,14,15]. In these systems, at least two current sensors are employed to implement the closed-loop current control and overcurrent protection. To reduce cost and volume, as well as to increase reliability in hostile environment [16], technical trends move towards driving power converts with fewer sensors or without sensors. Research to reconstruct three-phase currents using single current sensors, especially in motor drive systems, has been undertaken [17,18,19,20,21,22,23,24,25,26,27,28,29,30,31,32,33,34].
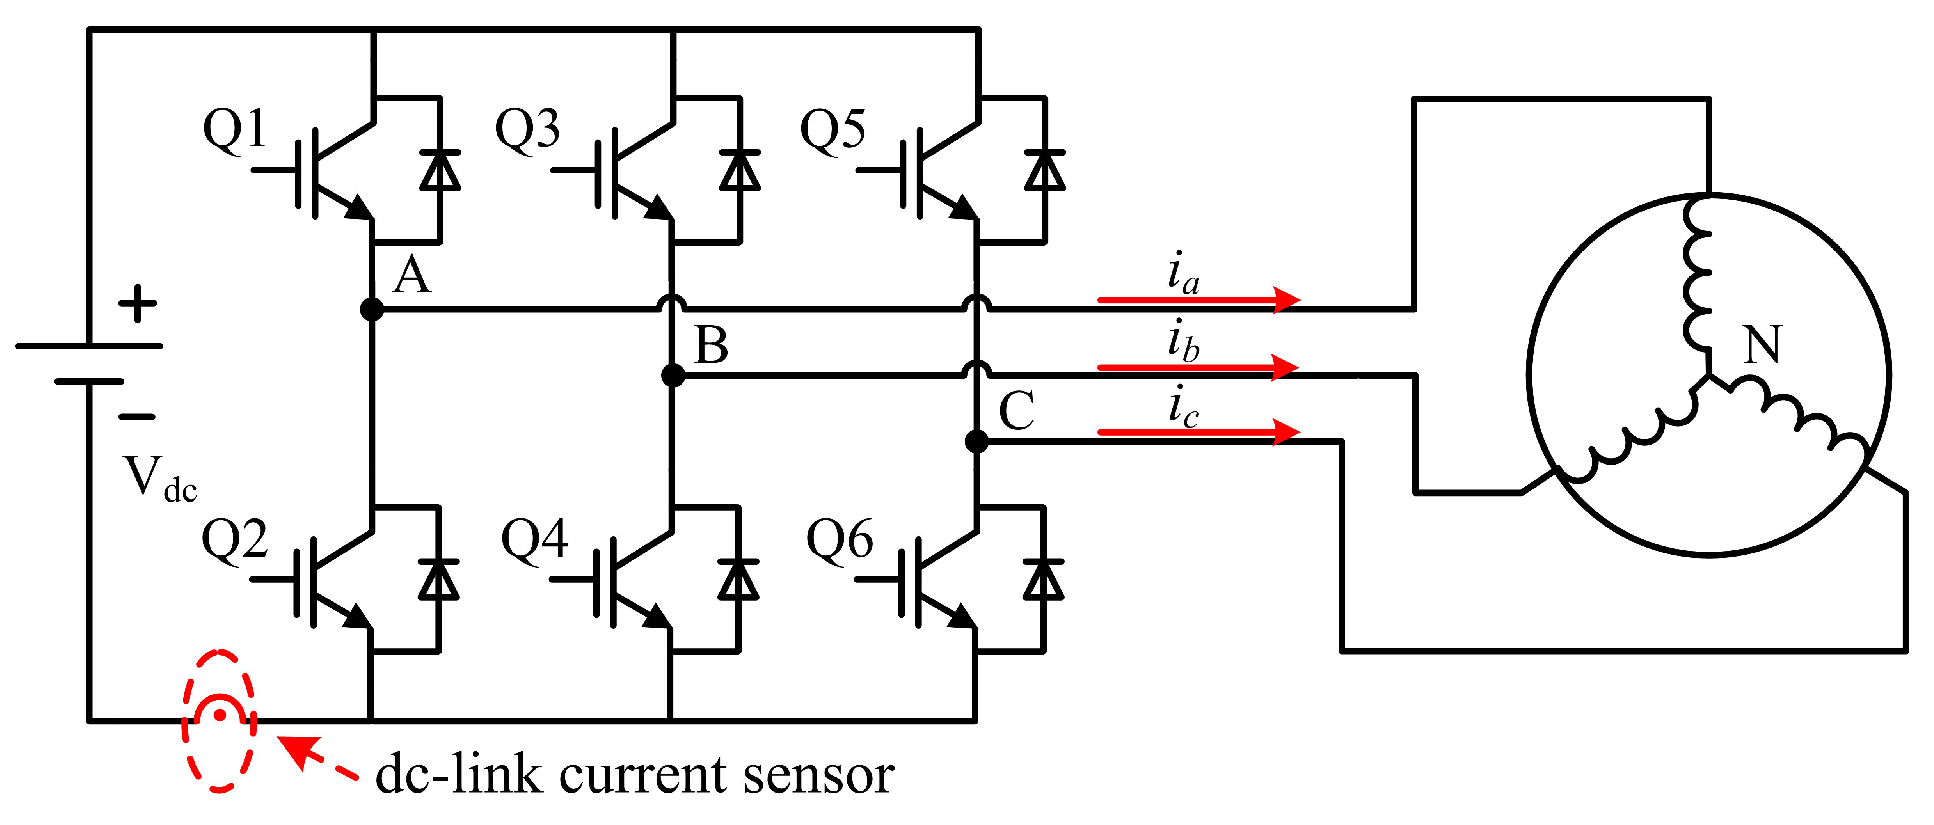
In recent years, PMSMs have been widely used owing to the merits such as high efficiency, high precision and high reliability. To reduce the volume and costs of the drive system, single current sensor techniques are used for PMSM drives. Among most of the single current sensor techniques, the single current sensor is used to sample the DC-link (direct current-link) current. As illustrated in Figure 1, the steady-state relationships between the three-phase currents and the DC-link current for various switching states are analysed in [
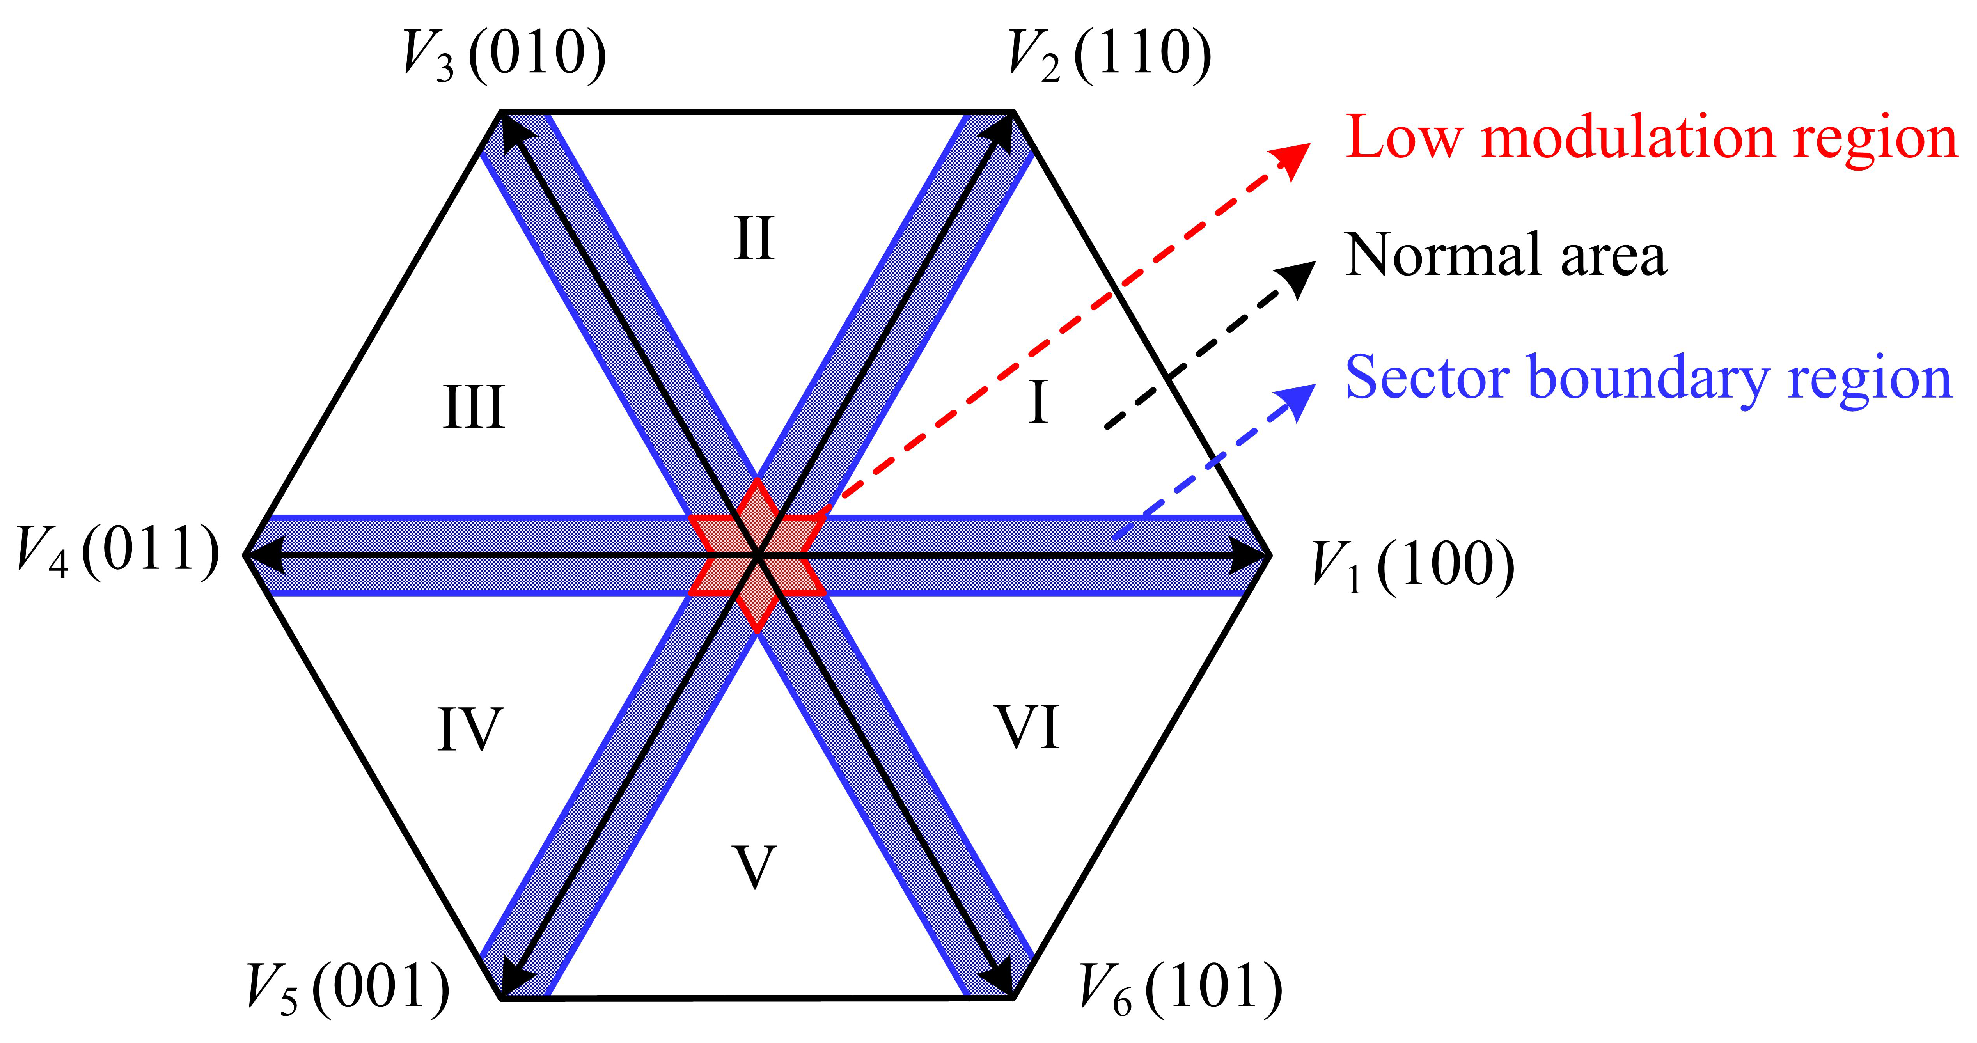
17]. However, dead zones are caused by using this method, and, in these dead zones, the steady-state conditions can not be satisfied. Ref. [
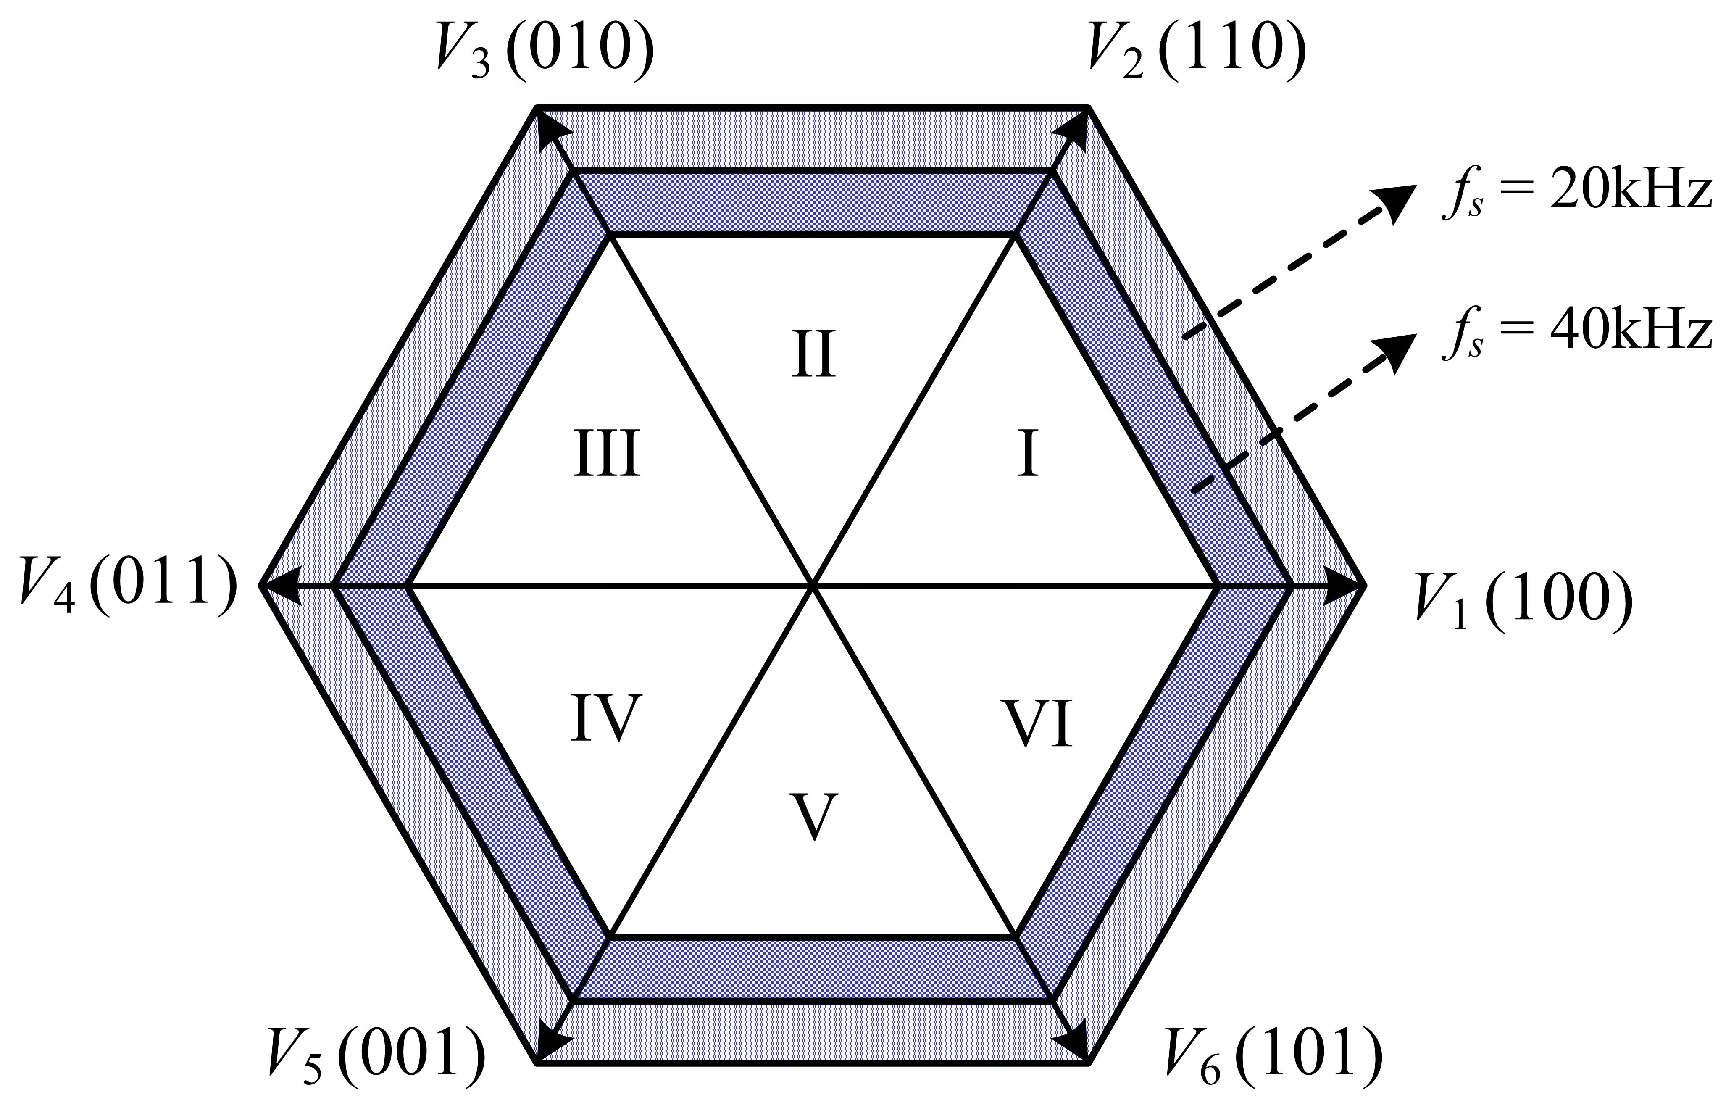
18] researches the dead zones, as shown in Figure 2, and it can be seen that the dead zones are located in low modulation regions and space-vector sector boundary regions. A lot of compensation methods are proposed to deal with the current reconstruction dead zones, which are based on the measurement vector insertion method, modifying PWM modulation strategy, and the phase shifting method.
In [19,20], the modified PWM modulation strategies for reconstructing the three-phase currents using the single DC-link current are given. A new modulation strategy that can reduce the current distortion and enlarge the current reconstruction range for a three-phase inverter using only a DC-link sensor is also proposed in [21]. It is a hybrid method that consists of the space vector modulation method and the PWM method without using zero voltage vectors. In [22,23], the three-phase currents are reconstructed by using the state observer algorithms. Moreover, in [24,25], a novel phase current reconstruction technology is used in the switched reluctance motor (SRM) drive and sensorless control. The single current sensor is also used to reconstruct the phase currents in direct matrix converters (DMC) [26,27]. There are nine power switches in the DMC, which increase the cost and volume compared with the three-phase pulse width modulation voltage source inverter.
Furthermore, in [28], the measurement vector insertion method (MVIM) is used to reconstruct the three-phase currents using a single current sensor. The switching state phase shift method is proposed to reduce the dead zones in [29]. An approach for predicting phase currents in vector-controlled inverters is reported in [30]. Some other methods, like the over-modulation, tri-state PWM and Luenberger observers are all applied in the single current sensor techniques [31,32,33]. In these methods, the single current sensor are installed on the DC-link and the PWM signals should be modified to enlarge the working regions.
After analyzing the existing single DC-link current sensor methods, the current reconstruction dead zones can be further optimised and the working region of power converters can be improved. Taking these factors into consideration, a method named zero voltage vector sampling method (ZVVSM) is proposed in [34]. The single hall-effect current sensor is installed in a new position to sample the sum currents of two current flow paths.
Based on the ZVVSM, this paper proposes an extended single current sensor technique used in the three-phase PMSM drive due to the fact that the installation position of the single current sensor in [34] is not a unique way to realize the phase current reconstruction. This paper extends this method by changing the installation position of the single current sensor and sampling the current during the zero voltage vectors. The structure of this paper is organized as follows. First, in Section 2, the sampling analysis of the current paths between each two power switches are introduced. In addition, the six kinds of current sensor installation positions that can reconstruct the three-phase currents are listed. Then, the proposed phase current approach and dead zone analysis are introduced in Section 3. The closed loop control system based on the proposed method and the experimental platform are established in Section 4. Section 5 presents the experimental results for further validation. Finally, Section 6 gives the conclusions.

2. Sampling Analysis and Installation Position of the Single Current Sensor for Three-Phase Current Reconstruction

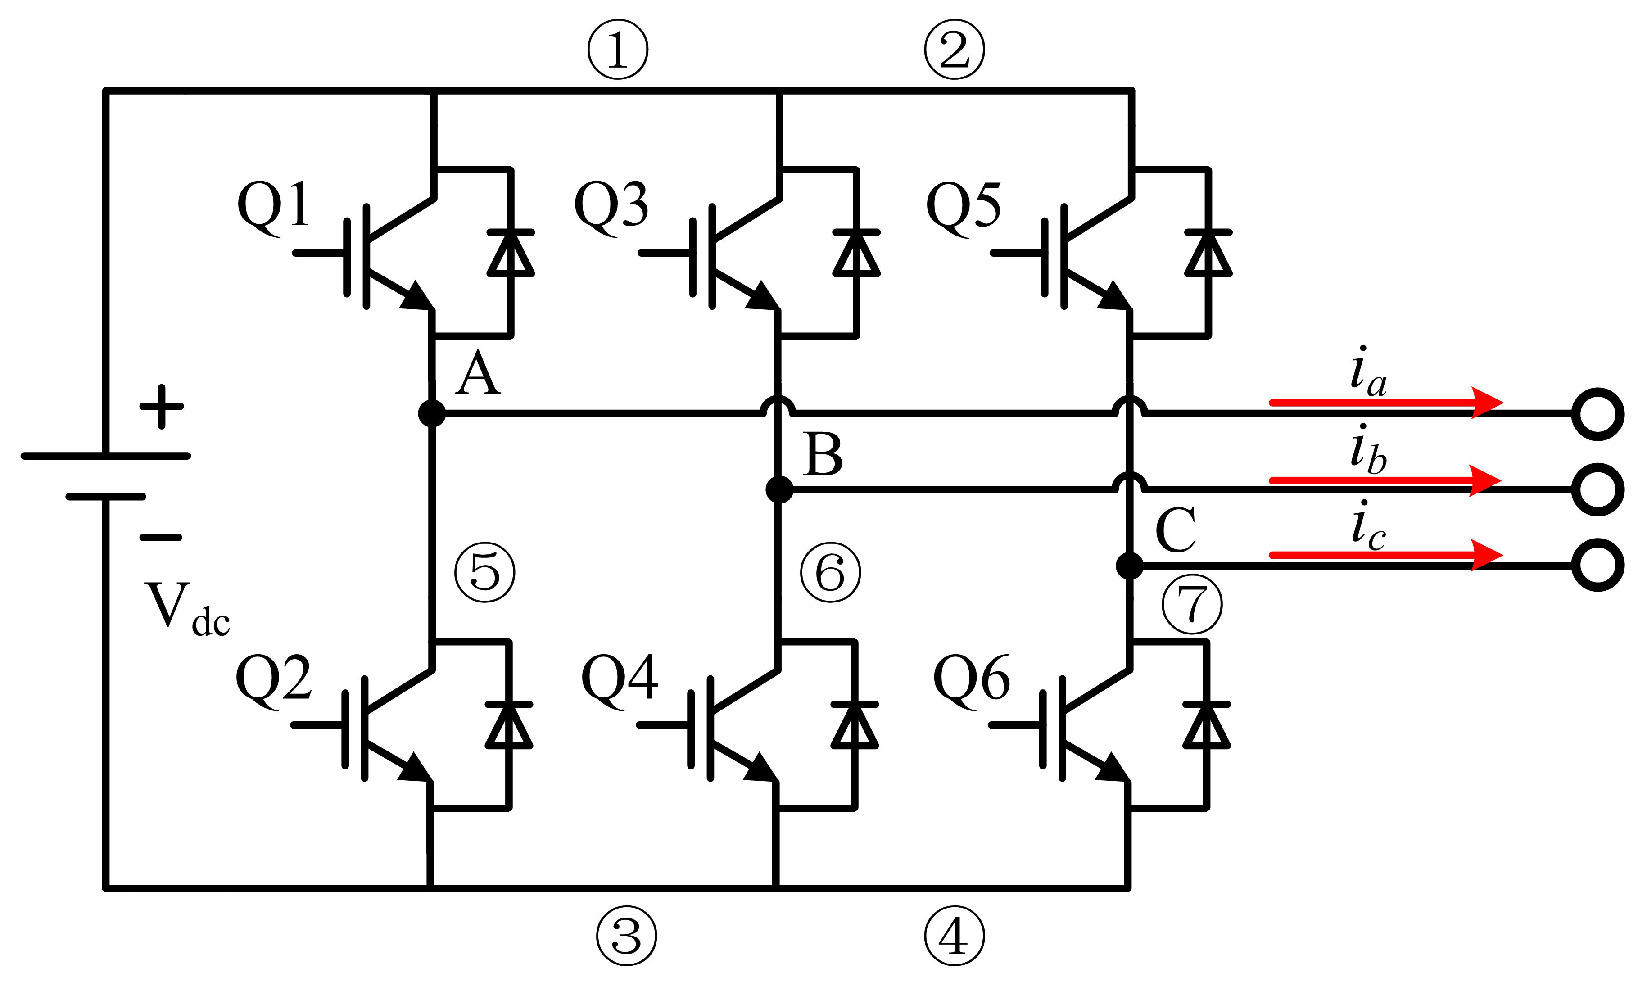
Figure 3 shows the schematic diagram of the conventional three-phase PMSM drive system using the PWM-VSI (Pulse Width Modulation-Voltage Source Inverter). In general, the PMSM is controlled by a PWM-VSI that includes six power switches and six freewheeling diodes. The power switches have eight combinations that form two zero voltage vectors and six active voltage vectors across its terminals. Usually, the eight generated switching states can be denoted as the voltage space vector V i , i { 0 , 1 , 2 , . . . , 7 } , as illustrated in Figure 2.
Since the SVPWM algorithms are implemented by a combination of different voltage vectors, the currents between each two power switches change with the switching states. In Figure 3, the current paths between each two power switches are labeled with circled numbers (①, ②, . . . , ⑦) for further analysis. First of all, the proposed phase current reconstruction method in this paper is available when the currents are sampled during the ZVVs. The sampling currents of the seven current paths during the two zero voltage vectors V 0 (000) and V 7 (111) are shown in Table 1.
From Table 1, it can be concluded that the currents of these seven paths vary with the switching states. Moreover, all of these currents will turn to zero during one of these two zero voltage vectors. If the hall-effect current sensor is adopted to sample the sum currents of some two of the seven currents, two phase currents can be obtained in a PWM period and the three-phase currents can be reconstructed. Nevertheless, not all the sum currents can be used to reconstruct the phase current, there are some principles. First, the two current paths sampled should not be on the upper or lower side of the three-phase PWM-VSI at the same time. For example, ① and ② should not be sampled together because the sum currents are always zero during V 0 and the three-phase currents cannot be reconstructed. Similarly, ③ and ④ are both on the lower side of the PWM-VSI and the sum currents are always zero during V 7 . The other principle is that the two sampling results during the zero voltage vectors should not be the same phase current. For example, if ① and ⑤ are sampled together, the two sampling results are both i a and three-phase currents cannot be reconstructed. Taking these limitations into consideration, there are six combinations that can realize the three-phase current reconstruction, ① + ④, ② + ③, ① + ⑥, ① + ⑦, ② + ⑤, and ② + ⑥. In this paper, the single current sensor samples the sum currents of paths ② and ⑤ as examples and the proposed method is explained in the following section.

3. Proposed Phase Current Reconstruction Approach

Different from the previous methods, this paper proposes a phase current reconstruction method for a three-phase PMSM drive which uses the current paths between each two power switches and samples the sum currents. In addition, the proposed method is implemented by changing the installation position of the single current sensor and sampling its output during the two zero voltage vectors.
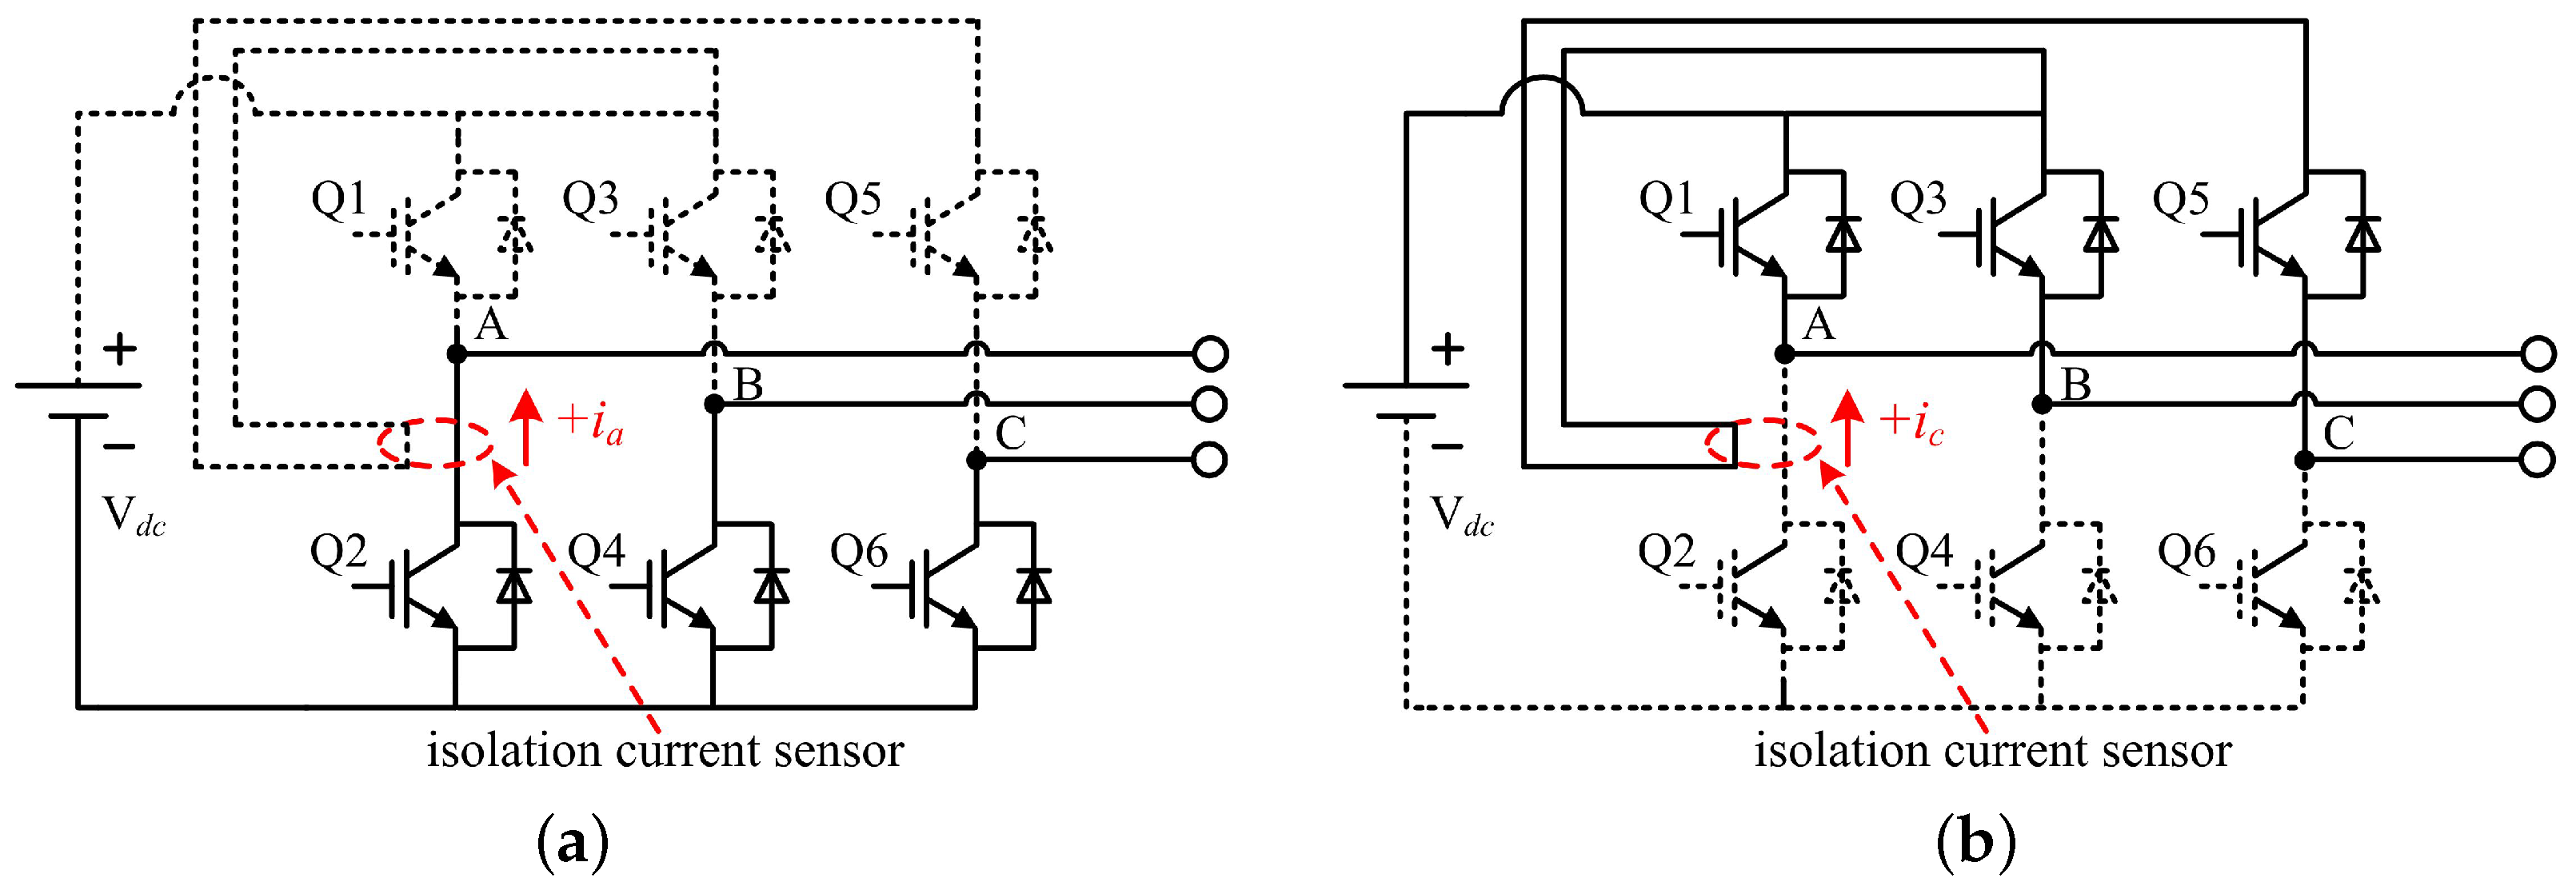
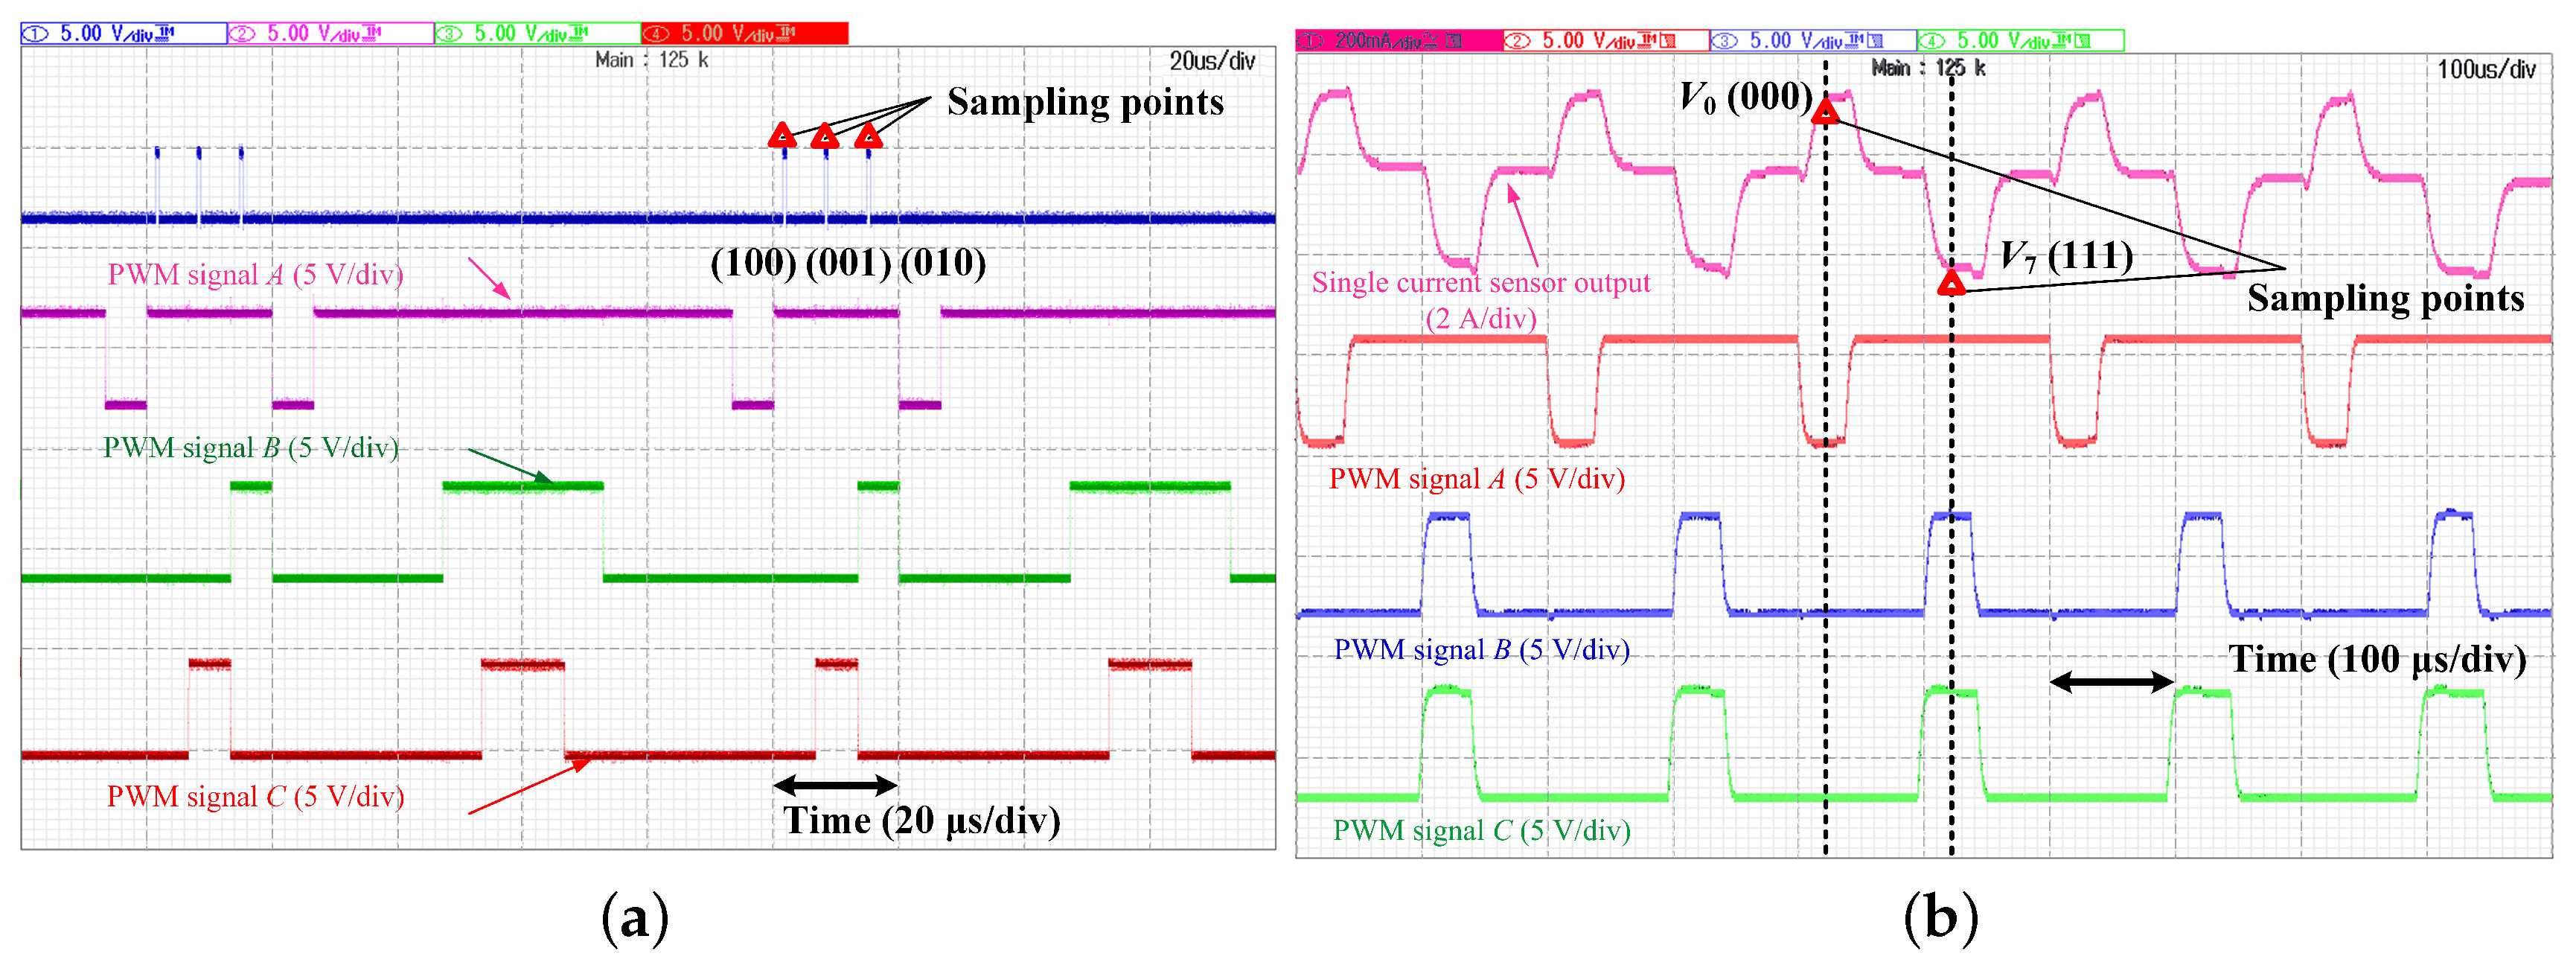
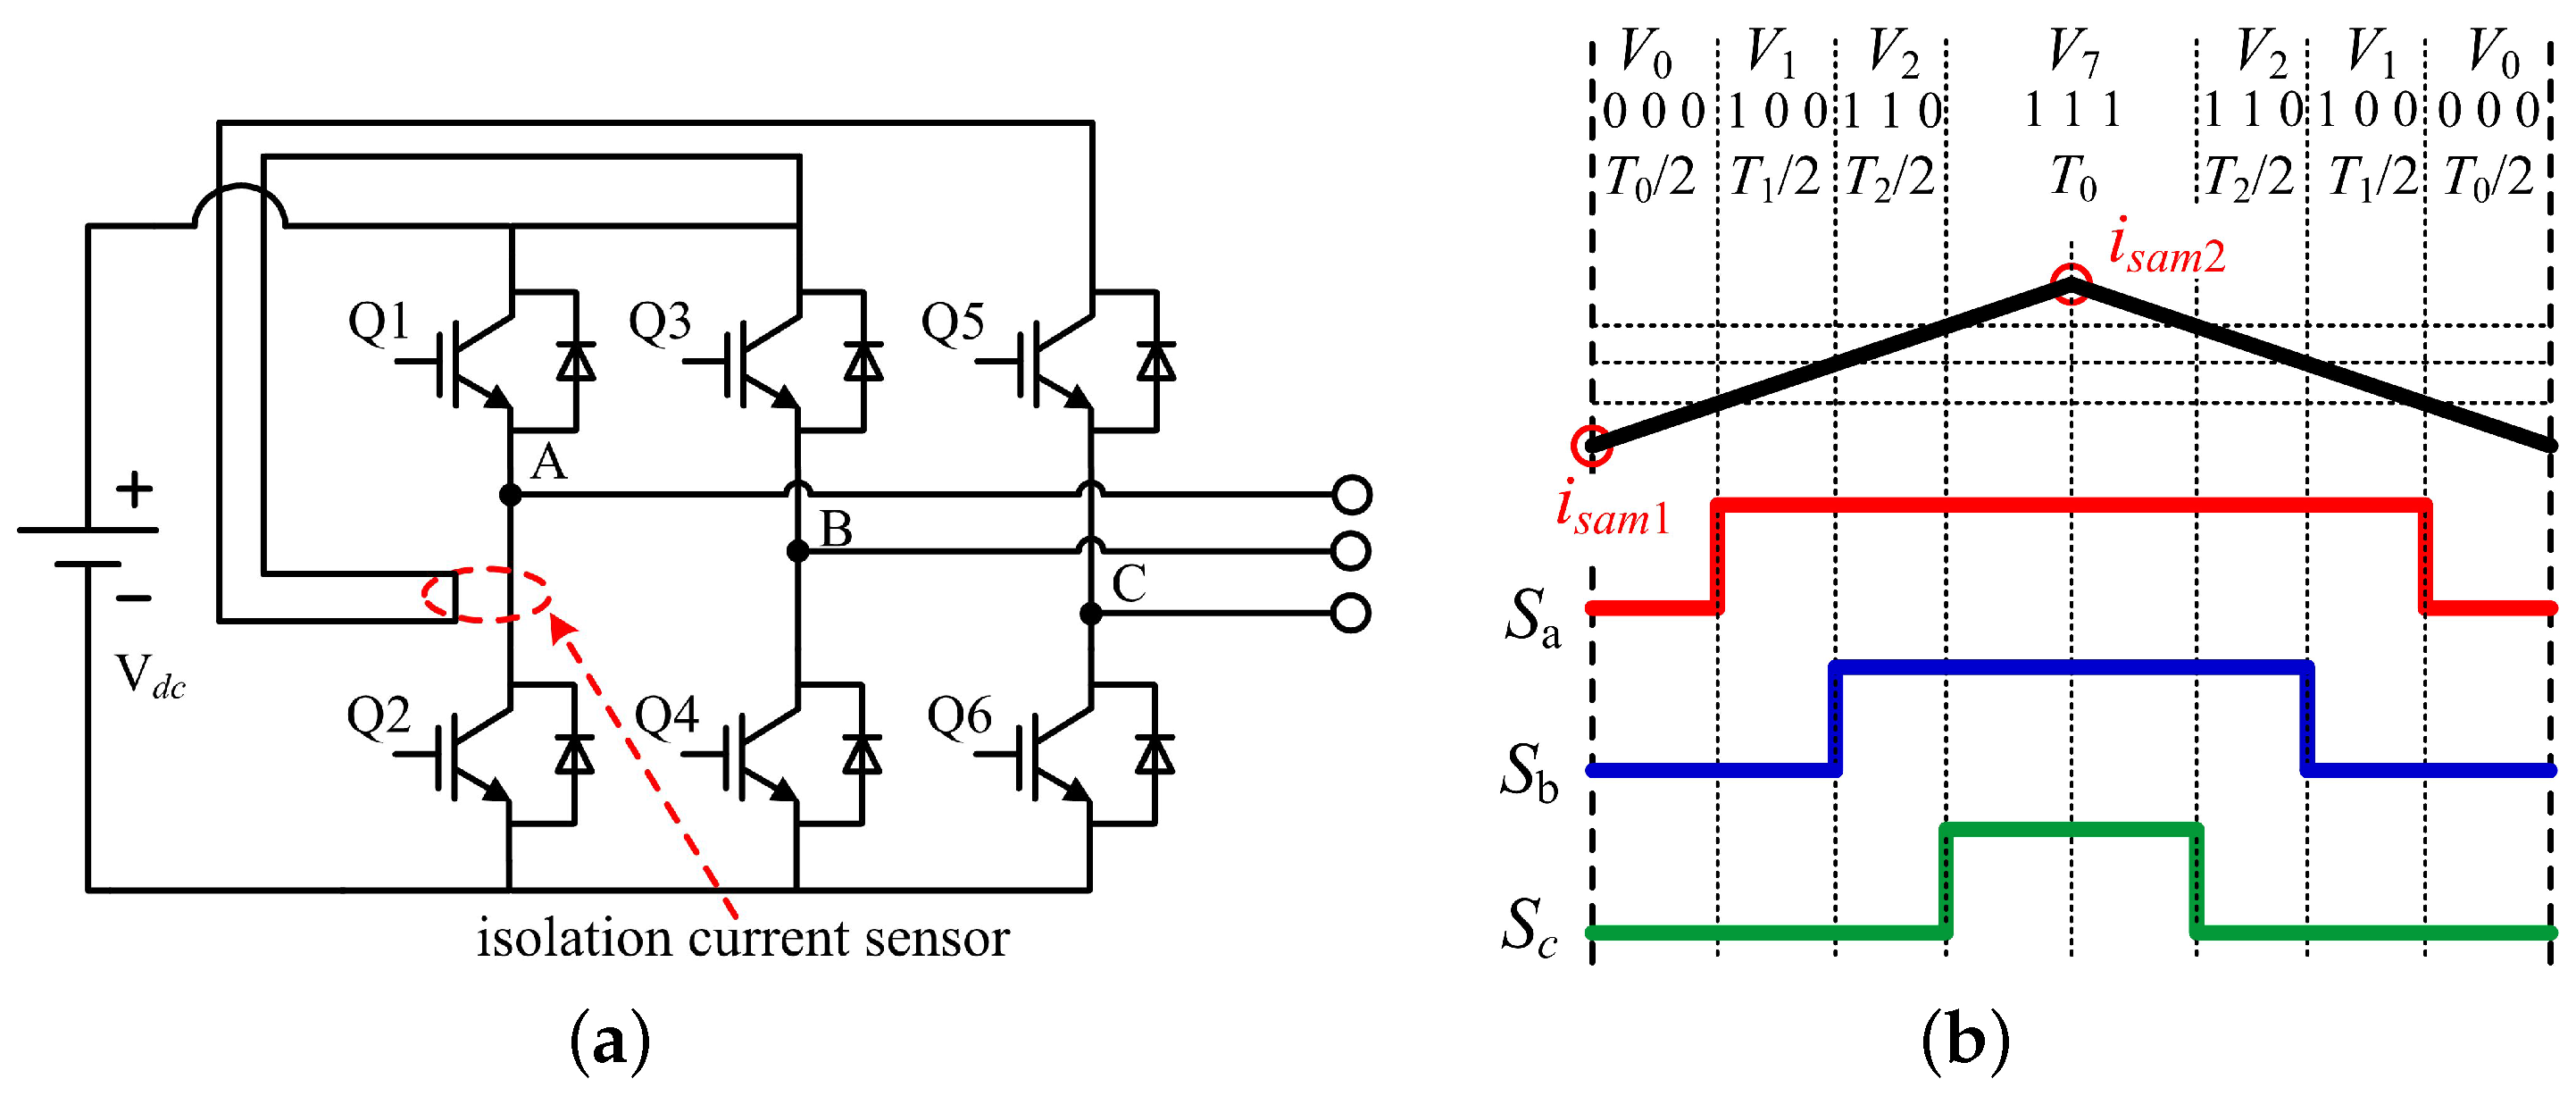
The circuit topology and the sampling points of the proposed method are shown in Figure 4. In this paper, only the circuit topology that samples the sum currents of paths ② and ⑤ is analysed as an example. The isolated hall-effect current sensor is installed to detect the sum current flowing between two power switches. Moreover, as Figure 4b illustrates, the current sensor output can be sampled at the zero voltage vectors.

3.1. Basic Working Principle of the Proposed Method

In this proposed method, the three-phase currents can be reconstructed by sampling the output of the single current sensor during the two zero voltage vectors. For further analysis, taking the voltage vector in the space vector hexagon, for example, in a PWM period, there are two zero voltage vectors V 0 (000) and V 7 (111). Moreover, the positive sign (+) represents the inflow of the three-phase currents and the negative sign (-) represents the outflow of the three-phase currents.
Figure 5a illustrates the current flow path when the output voltage vector is V 0 (000). The load current of the power converter freewheels through the lower switches, and the current sensor is sampled as
i s a m 1 = + i a ,
where i s a m 1 is the sample result of the current sensor. Then, Figure 5b shows the current flow path when the output voltage vector is V 7 (111). Different from the above switching state, the current freewheels through the upper switches and the load. Then, the sample result of the current sensor is
i s a m 2 = + i c .
Therefore, the phase currents i a and i c can be obtained if the single hall-effect current sensor is sampled during the two zero voltage vectors V 0 (000) and V 7 (111). Since the three-phase load are usually Y-connected and the phase currents meet the following Equation (3), the phase current of phase B i b can be also calculated. As a result, the three-phase currents can be reconstructed during a PWM period:
i a + i b + i c = 0 .

3.2. Minimum Sample Time

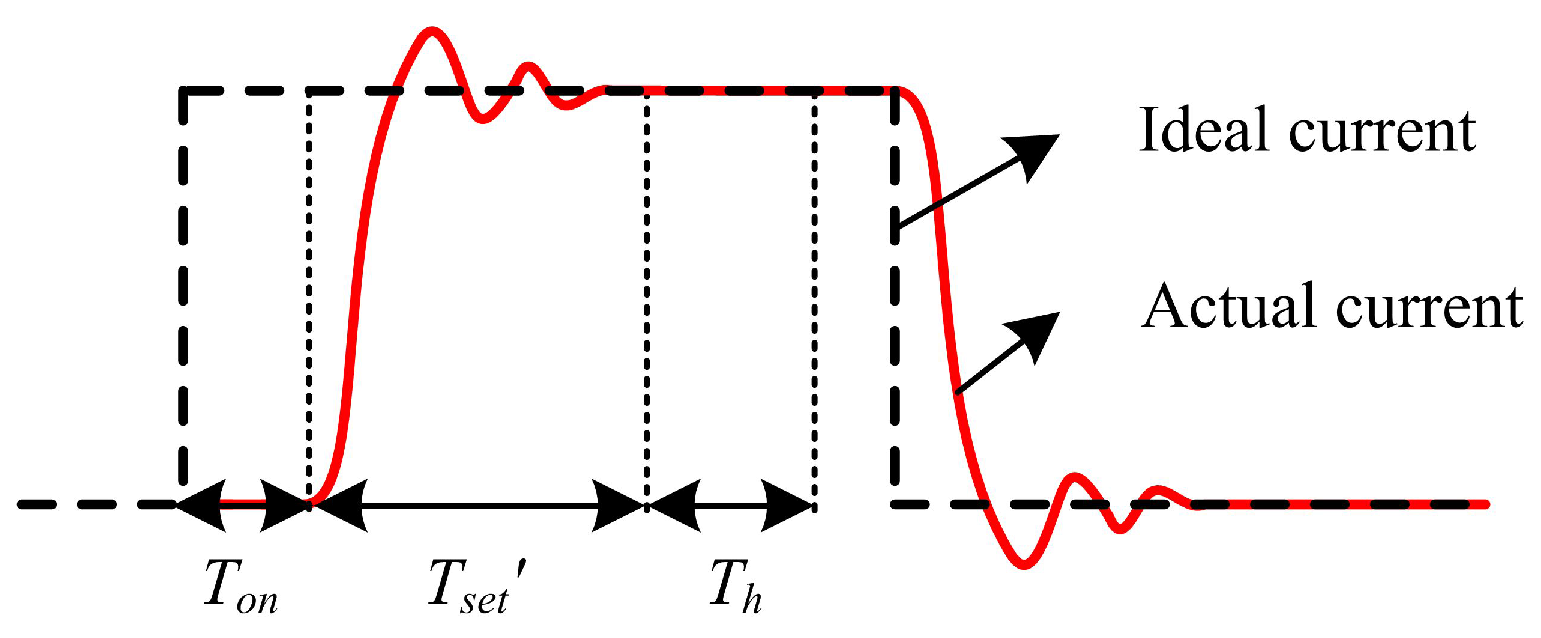
In the actual situation of current sampling, illustrated in Figure 6, the current cannot follow the applied voltage immediately due to the motor inductance and there is some time delay, denoted as T s e t , to reach the steady-state. Furthermore, the A/D converter in the digital signal processor (DSP) needs extra conversion time to hold the results after reaching the steady-state, denoted as T h . In addition, the total switching device turn-on delay time and the dead zone time between the two switching devices in one bridge leg for protection should be considered as well, which are denoted as T o n and T d , respectively. Furthermore, the dc link line is increased by using the novel method, and the stray inductance of the prolonged wire can influence the signal settling time. Hence, the signal settling time is changed from T s e t to T s e t after considering the increased dc link line. However, in the actual power circuits, this dc link line is not increased so much as Figure 4a shows, and the effect of the proposed topology on the current sampling can be acceptable.
Based on these factors, a minimum duration of the voltage vectors is required for precise sampling. This minimum duration time, denoted as T m i n , should meet the following inequality:
T m i n T s e t + T h + T o n + T d .

3.3. Dead Zone Analysis

Like other phase current reconstruction methods, there are also current reconstruction dead zones in the proposed method. The zero voltage vectors must be held long enough for reliable current sampling. Since the duration of zero voltage vectors will decrease with the amplitude of voltage vector increasing, the current cannot be sampled accurately when the amplitude of voltage vector is too large. As a result, the current reconstruction dead zone will be formed, which is illustrated in Figure 7 and marked with the shaded area.
To further analyse the current reconstruction dead zones, a proportionality coefficient, μ, is introduced. It is the ratio of active voltage vector duration to the PWM period, expressed as (5):
μ = T s T 0 T s .
In the conventional Space Vector PWM algorithm, the duration of zero voltage vector T 0 is equally distributed to the switching states (000) and (111). Since there is a limitation of minimum sample time T m i n for the two zero voltage vectors duration discussed above, the interval of zero voltage vector should meet the inequality
T 0 2 T m i n .
By substitution of the inequality into (5), the maximum active voltage vector proportionality coefficient, μ m a x , can be calculated as (7):
μ m a x = T s 2 · T m i n T s = 1 / f s 2 · T m i n 1 / f s = 1 2 f s · T m i n .
Then, the maximum voltage vectors output of the proposed phase current reconstruction method is
V m a x = 2 3 V d c ( 1 2 f s · T m i n ) .
It can be seen that the proportionality coefficient, μ m a x , decreases with the PWM frequency f s or the minimum sample time T m i n increasing. In general, the minimum sample time T m i n is a constant, so the maximum active voltage vector proportionality coefficient μ m a x , as well as the effective operation zones of the voltage vector, will decrease with the PWM frequency increasing. As shown in Figure 7, the effective operation zones shrink inward with the PWM frequency increasing. The shadow zones indicate the dead zones of the proposed phase current reconstruction approach at different frequencies. However, there is a limitation that the switching frequency or the ratio between the switching and modulation frequencies can not be too low. If the switching frequency of the SVPWM is too low, as 200 Hz, the three-phase currents and the single current sensor output will change too much in a PWM period. Consequently, if the phase currents would greatly change during half of the PWM period, the two samples will not represent the same state and the sampling errors will become large. Furthermore, low switching frequency will also cause the distortion of the phase currents, which can affect the drive performances of the system. Therefore, the switching frequency should be set at several kHz for the proposed phase current reconstruction method.
In addition, compared with the method using the single DC-link current sensor, the proposed method can drive the three-phase PMSM effectively in the low modulation region and sector boundary region. Hence, some complicated compensation algorithms used to narrow the dead zones are not needed.

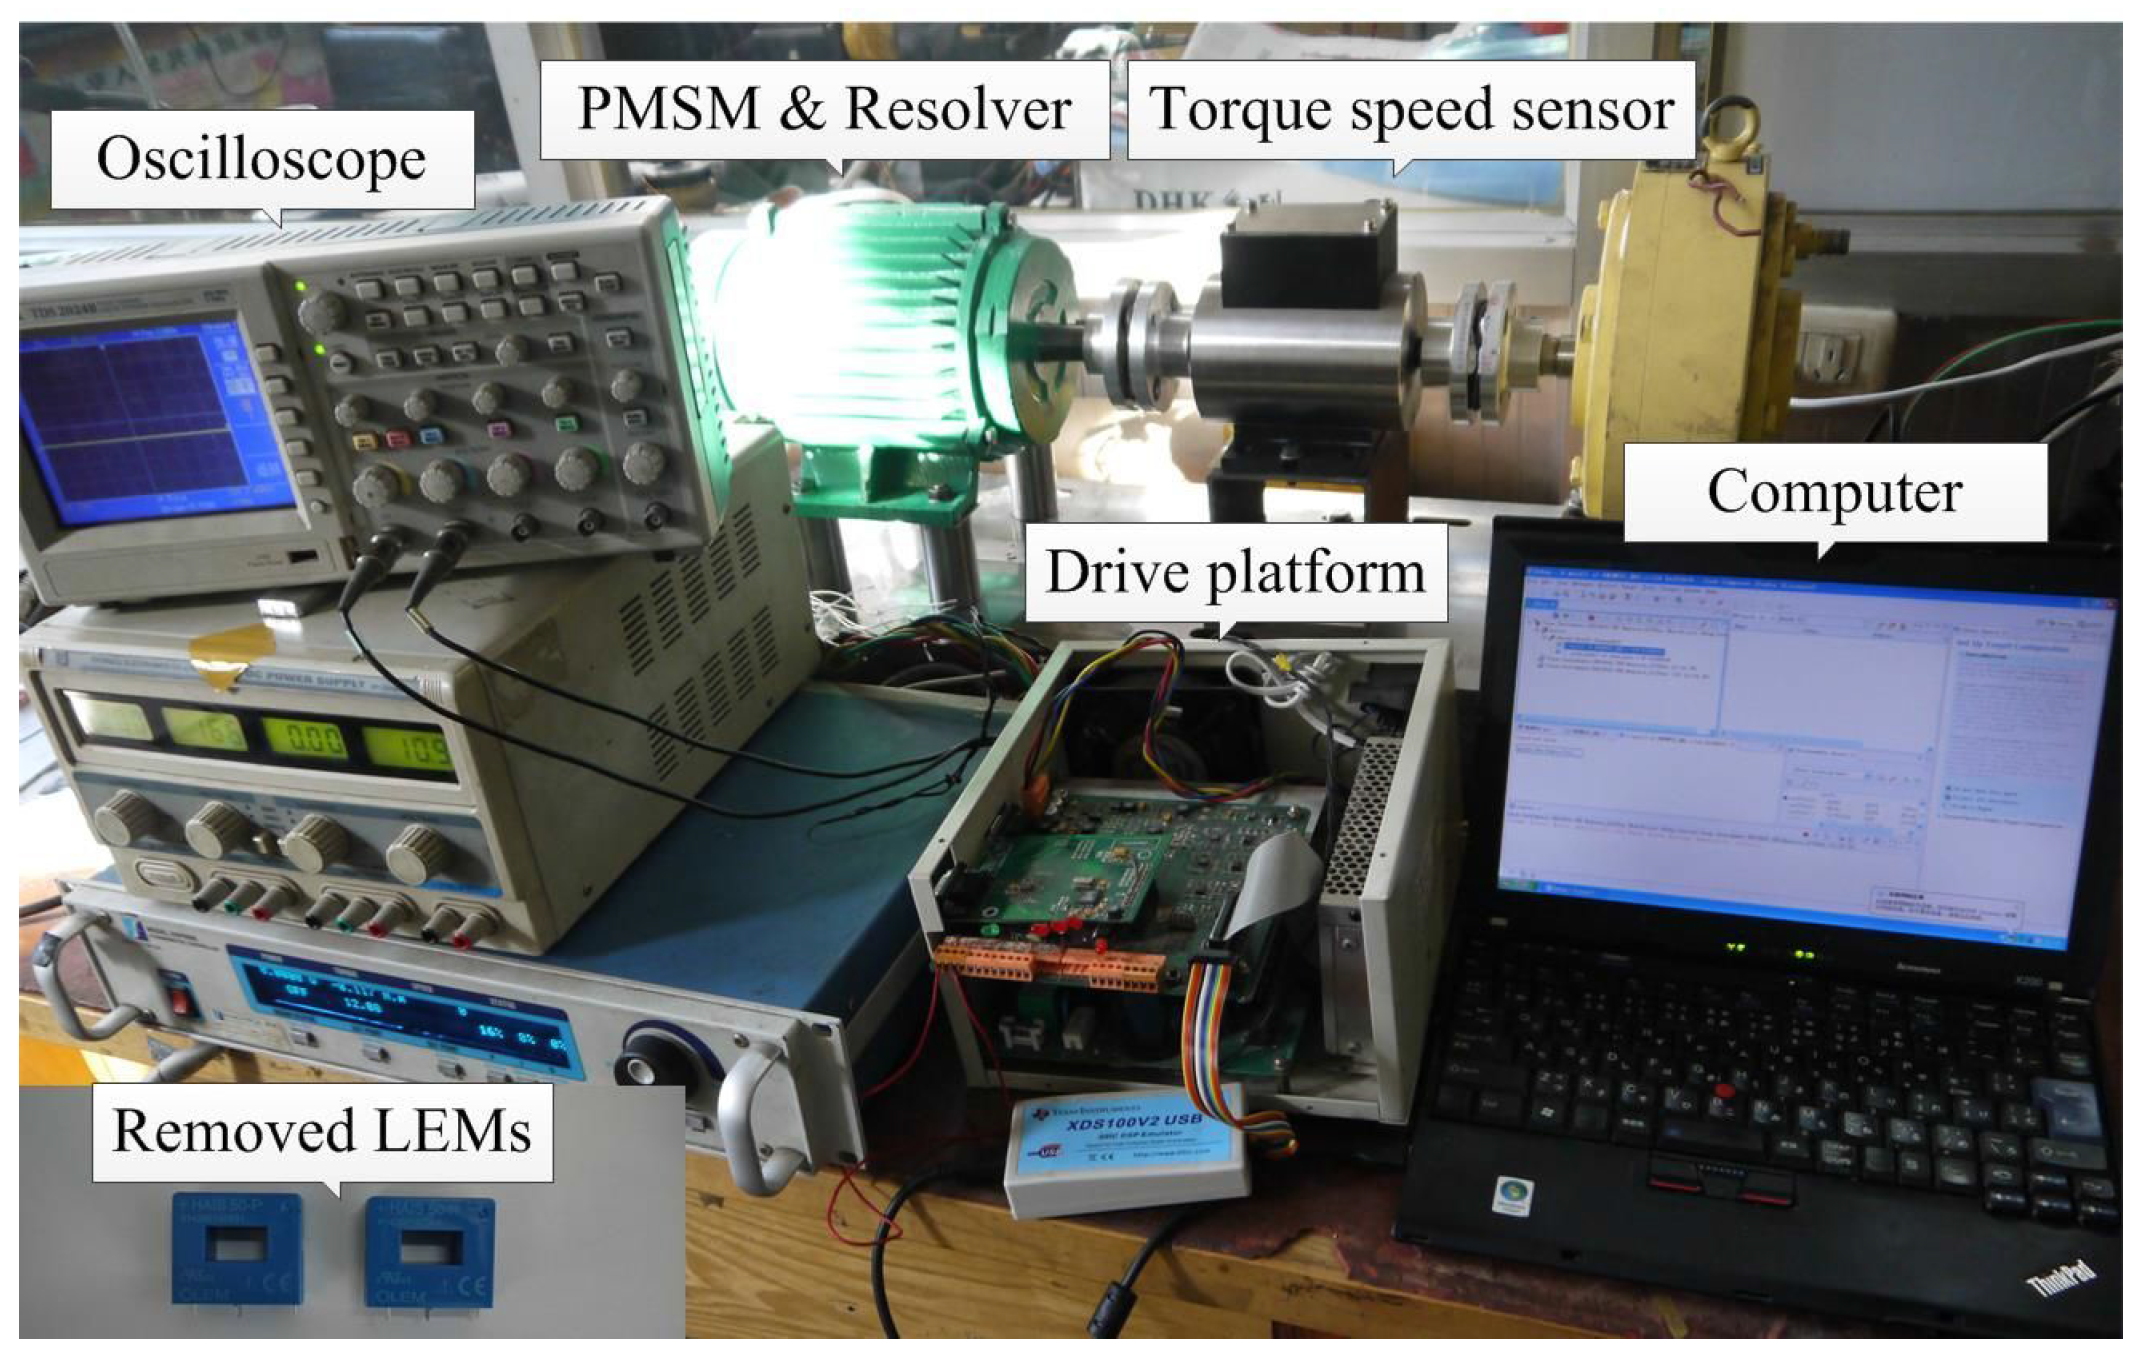
4. Experimental Setup

To verify the proposed phase current reconstruction method for motor drive, an experiment platform is established, whose scheme and photograph are shown in Figure 8 and Figure 9, respectively. In the experimental setup, a PMSM with a resolver is selected as the three-phase load. In addition, a PWM-VSI, a drive platform and a dc source are included. The PWM-VSI has a 3 kVA nominal power, a 5 kHz switching frequency of the IGBTs (Insulated Gate Bipolar Transistor) and an 80 V DC-link voltage. In the drive platform, a DSP (Digital Signal Processor) (TMS320F2812) (Texas Instruments Incorporated, Dallas, Texas, USA) is used as the control unit to generate the three-phase PWM signals, sampling signals and implement the proposed phase current reconstruction method. In the experiments, the minimum sample time T m i n is set as 5 μ s. Moreover, motor parameters are reported in 
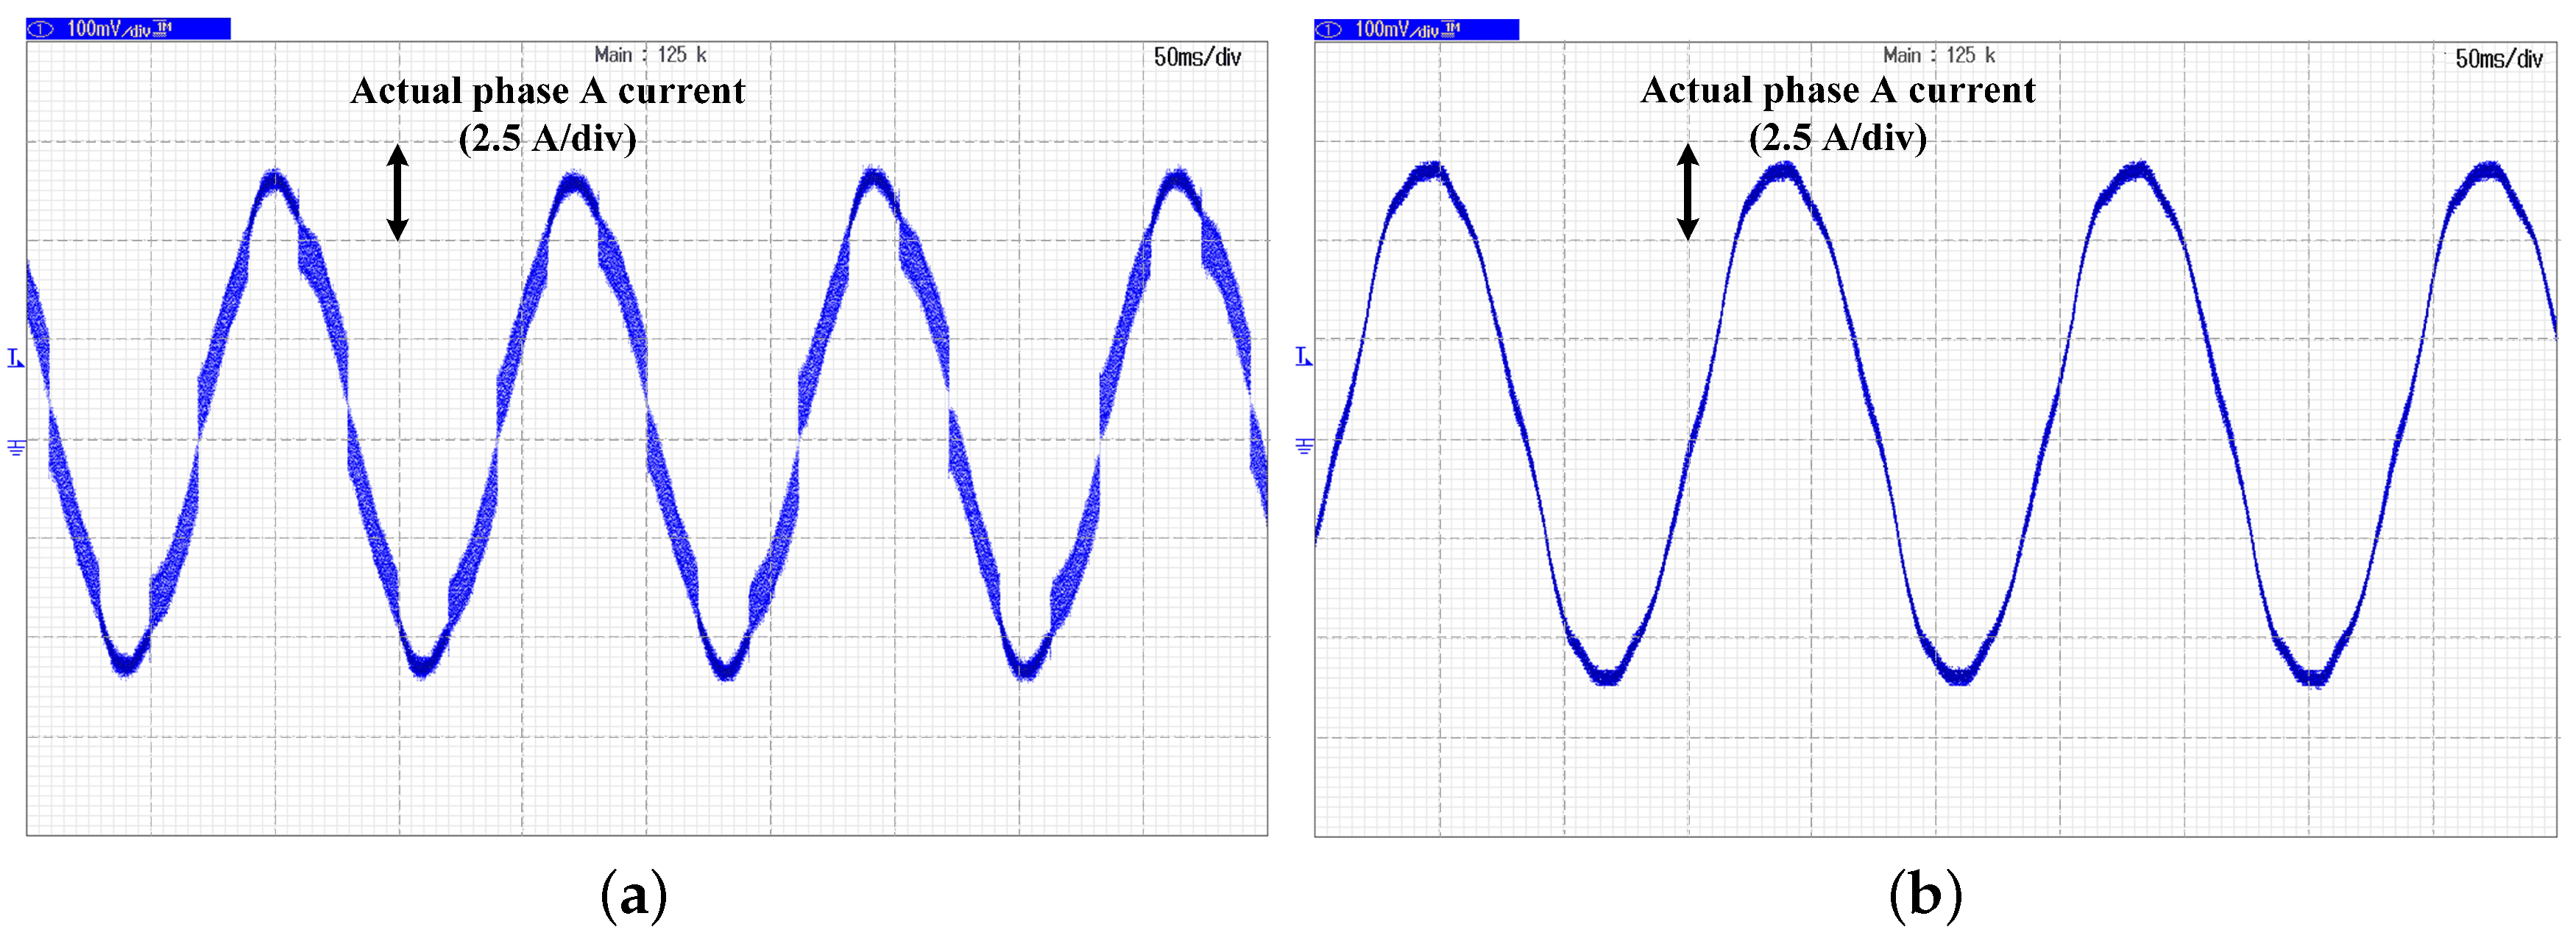
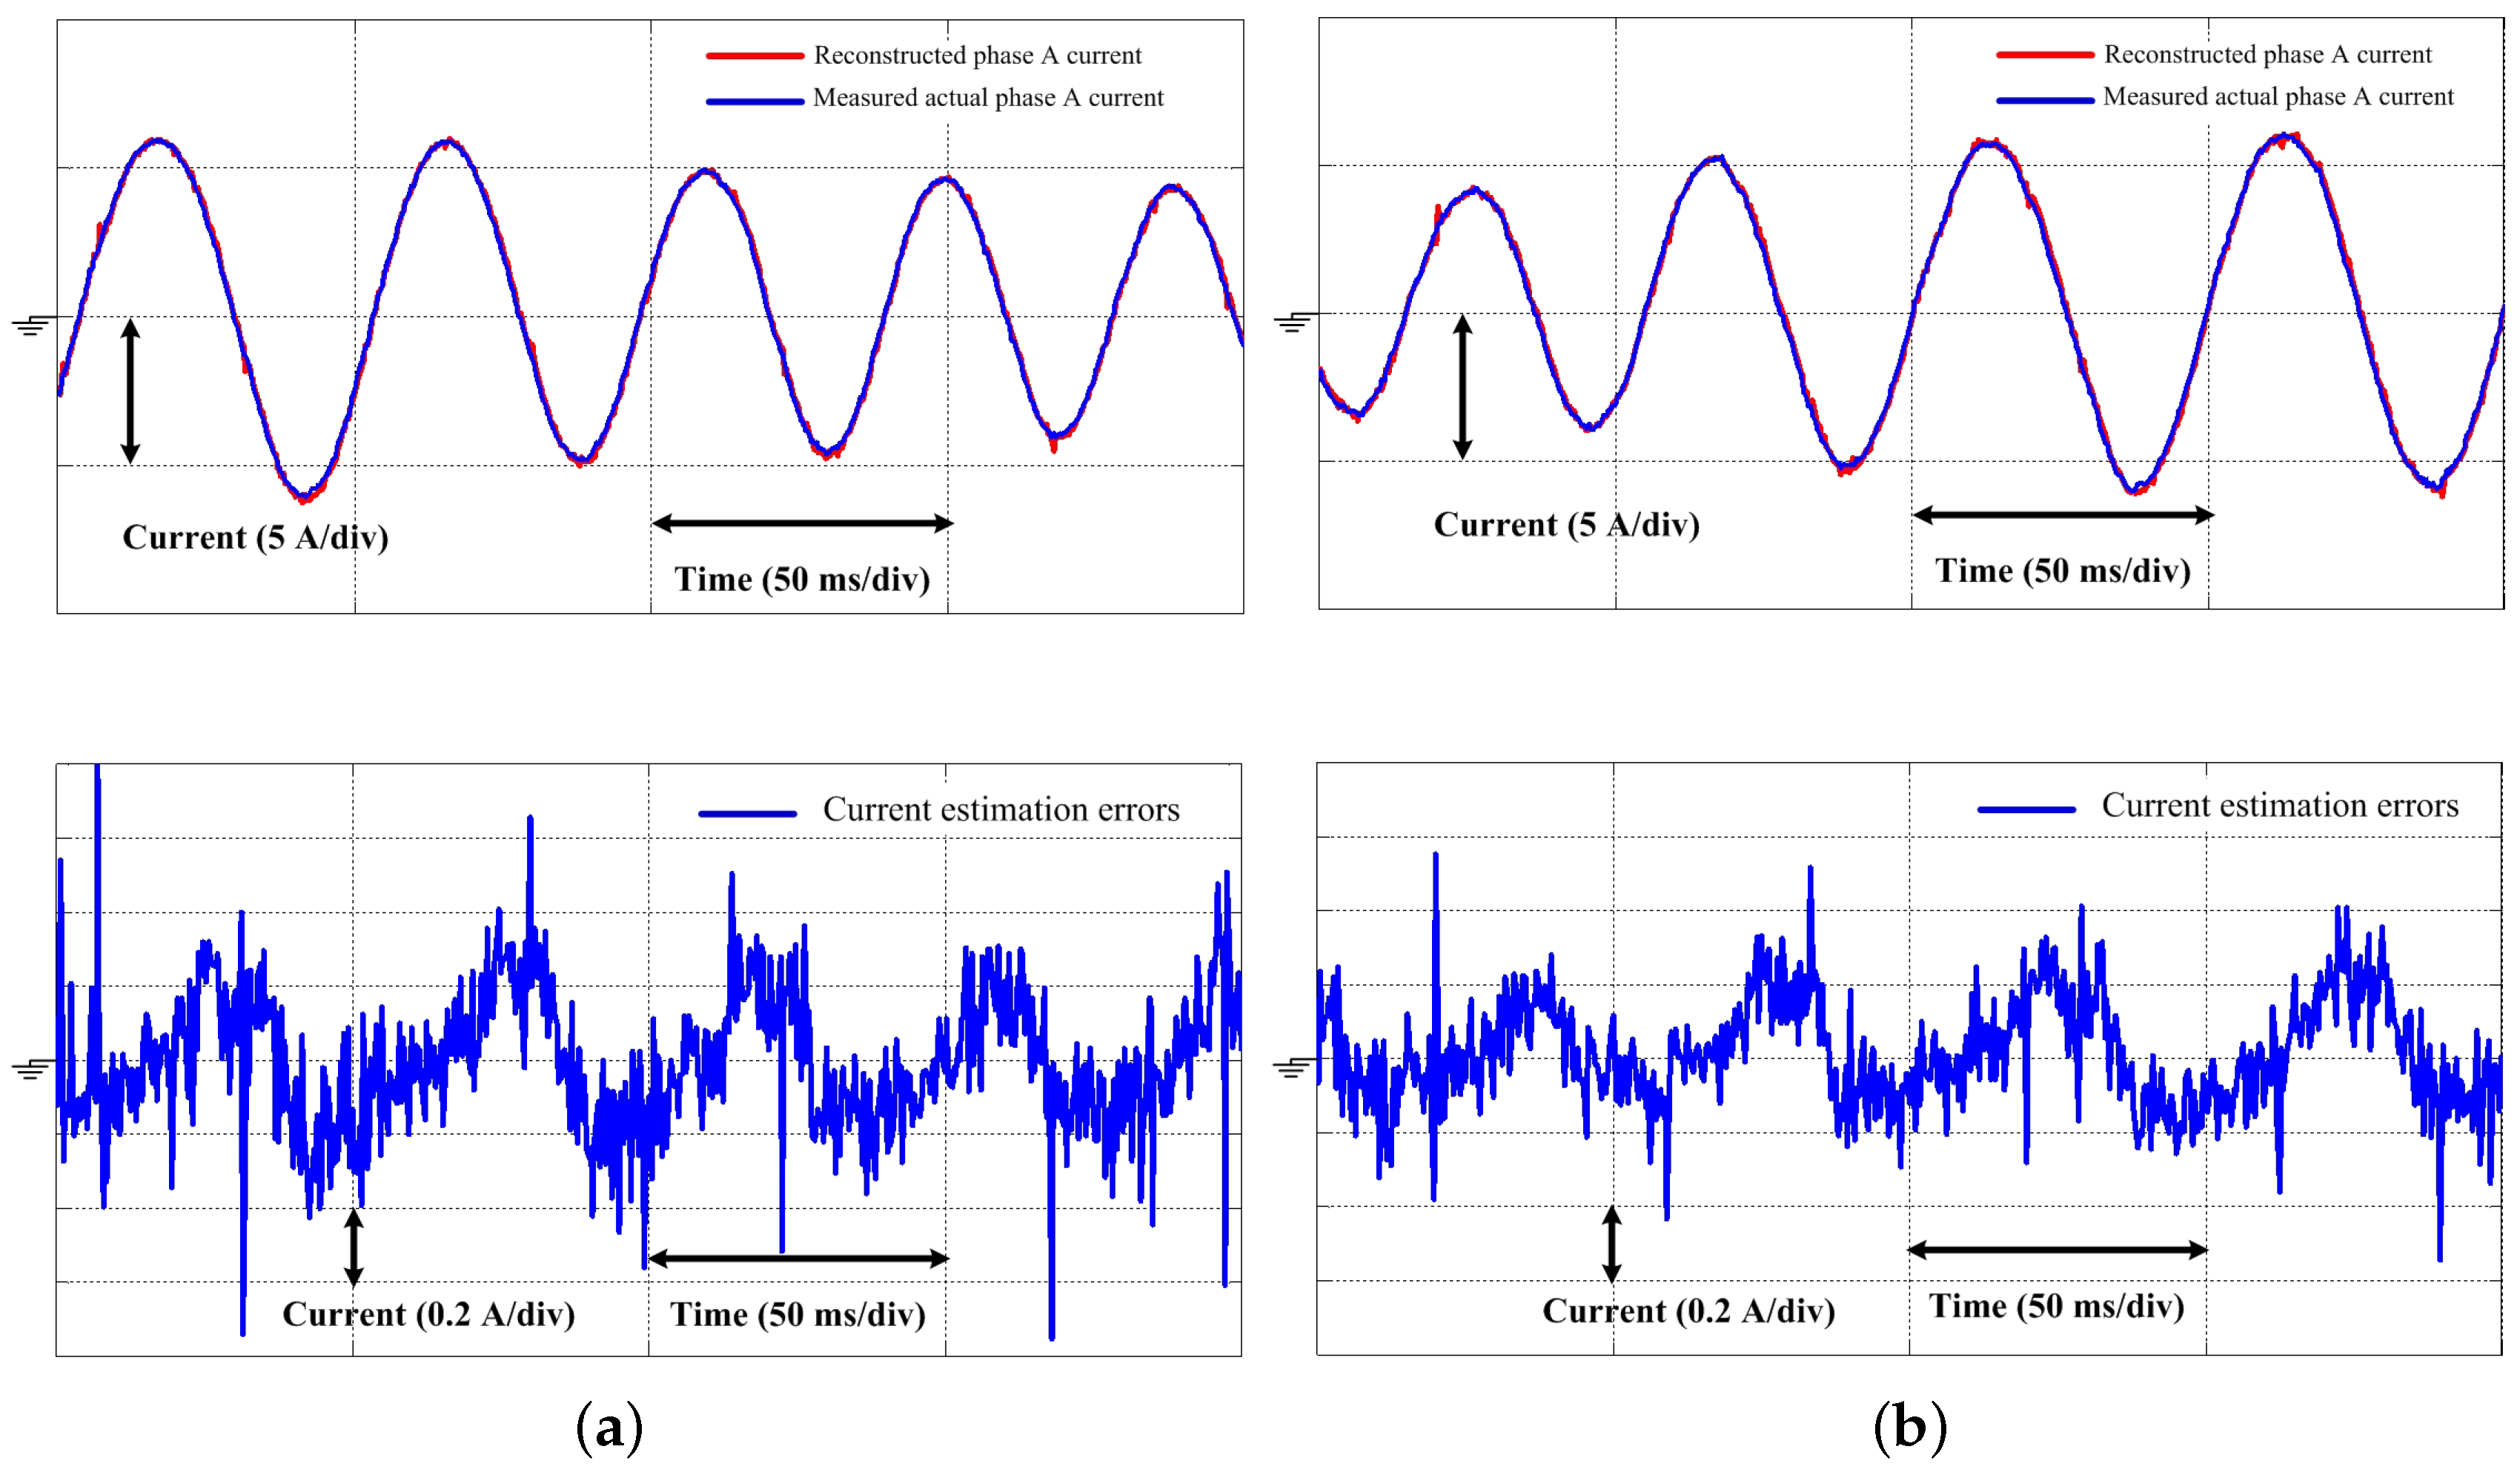
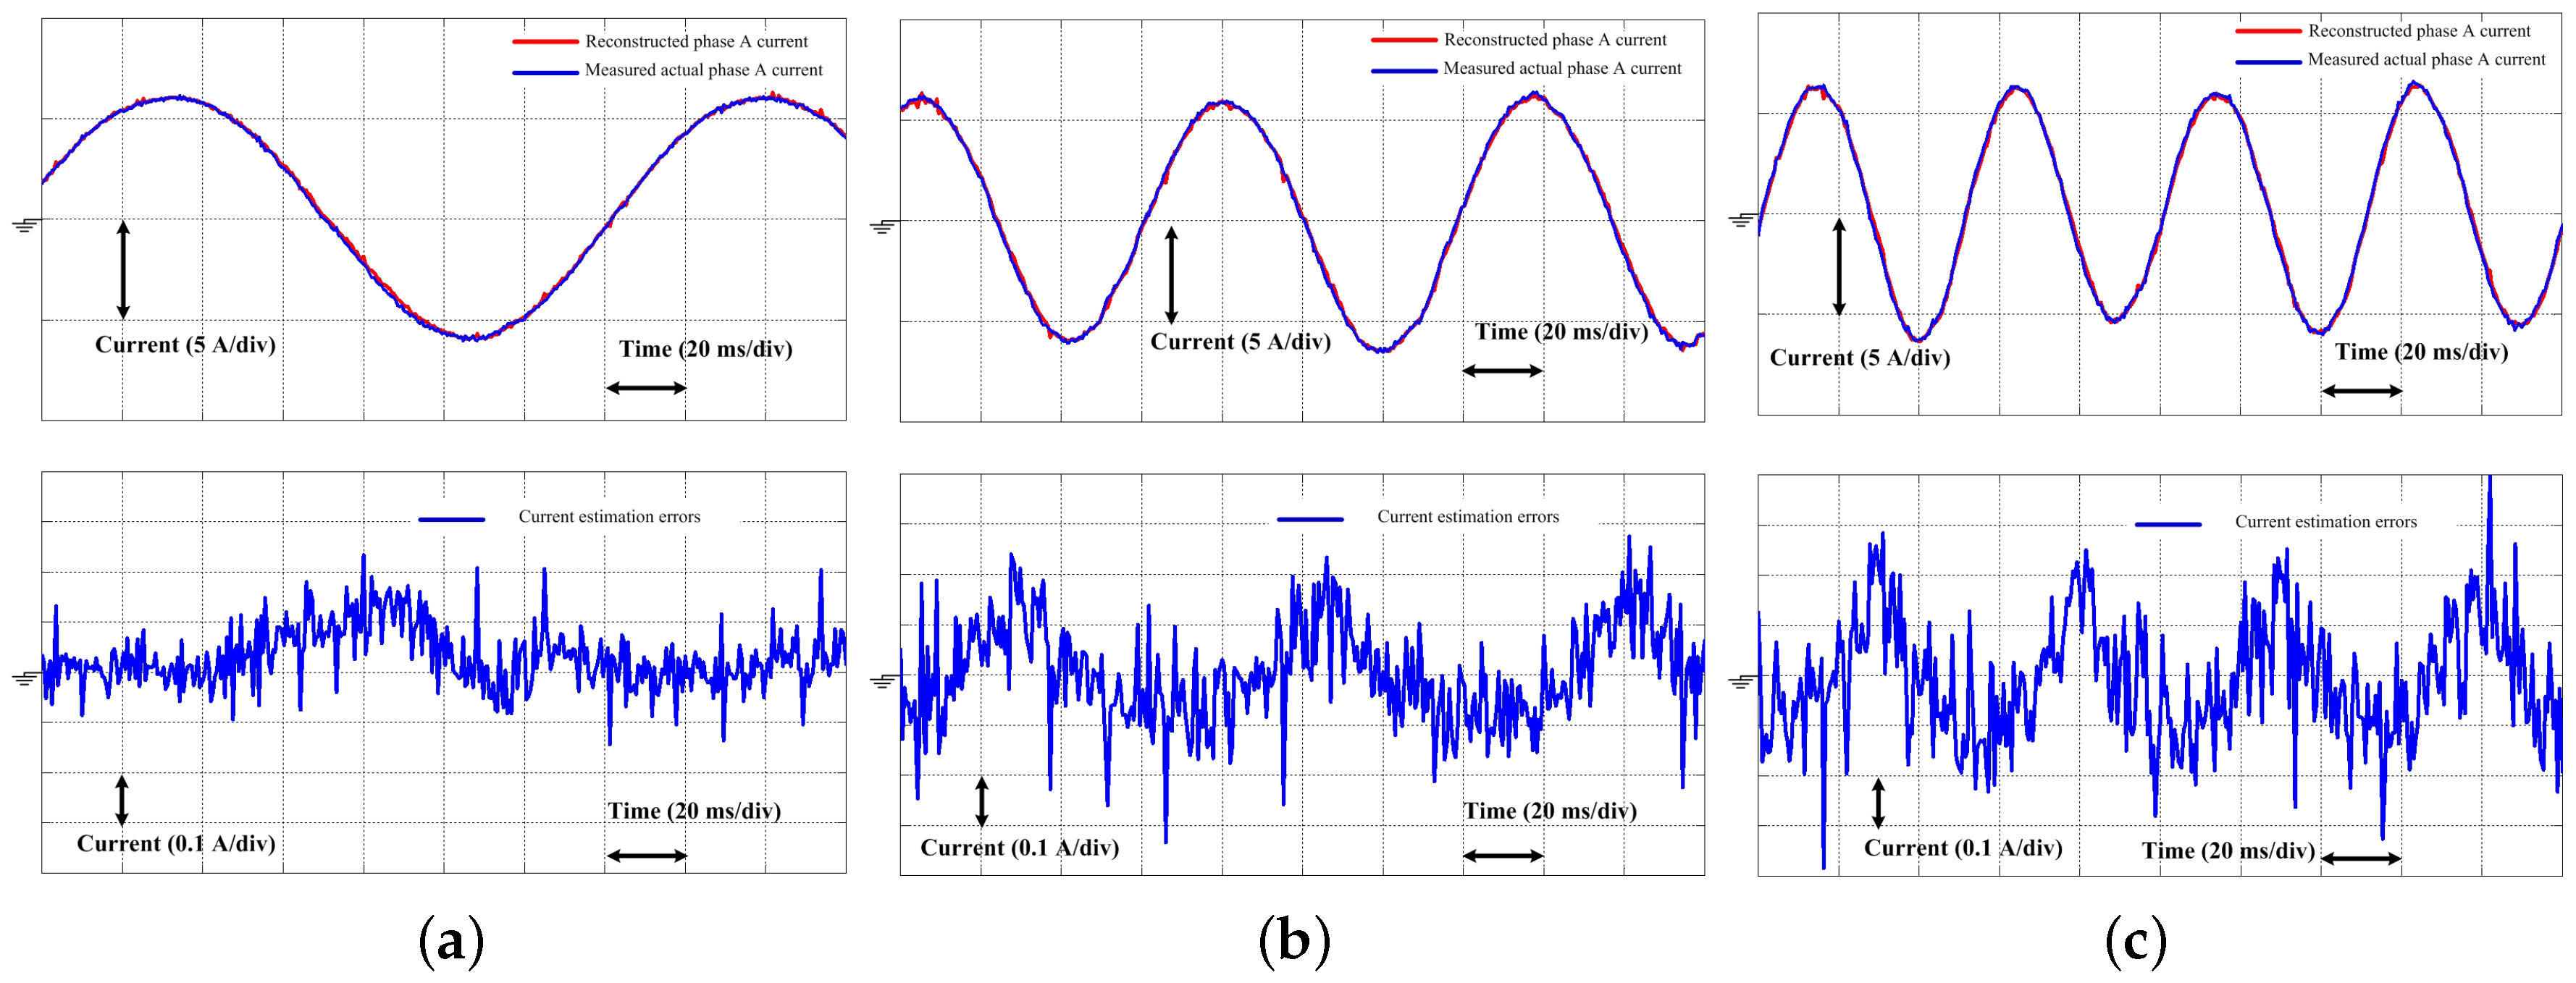
Table 2. Furthermore, in order to sample the current accurately, an isolated hall-effect current sensor (LEM HAIS-50P) (LEM Incorporated, Geneva, Switzerland)with a maximum sample rate 50 kHz is employed. In the drive platform, two current sensors are used. By changing the installation position of the DC-link current sensor to the proposed position in this paper, one current sensor is used to implement the proposed method. The other current sensor is the phase A current sensor and is used for comparison and calculating the estimation errors of the proposed phase current reconstruction method. To avoid the influence of high frequency noises in A/D on the sampling results and the reconstructed three-phase current, a small filter capacitor is connected in parallel to the output of the current sensor. Moreover, the signal processing circuit constructed by the amplifier is adopted to further improve the reconstruction phase current waveform quality. Finally, in the software of the whole drive system, when the current sampling interrupt occurs, the current signals will be cyclical sampled four times by the A/D module of DSP. Then, the four times of sampling results will be averaged, which can further improve the accuracy of the results.
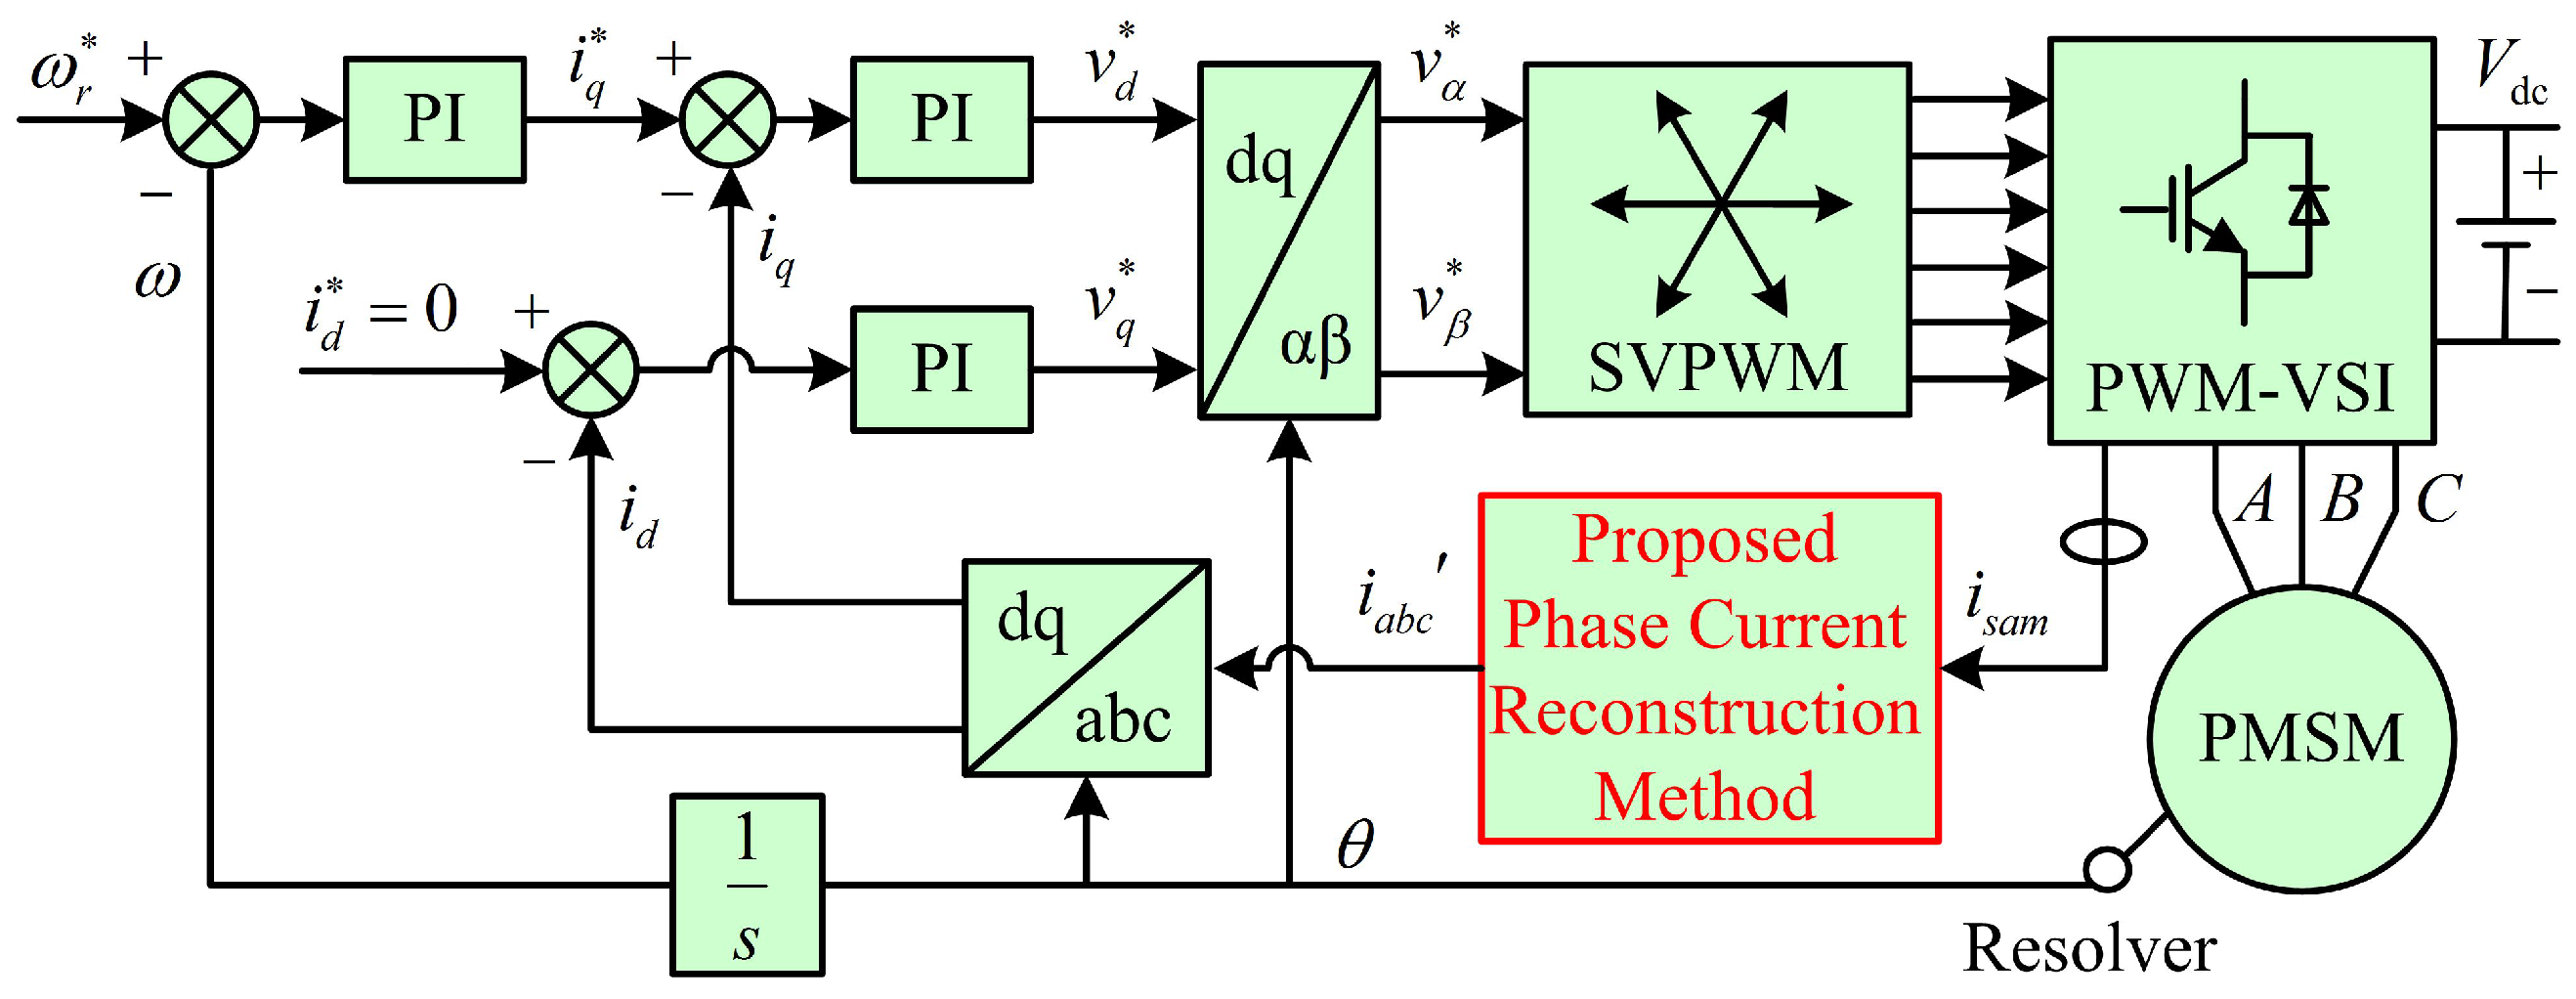
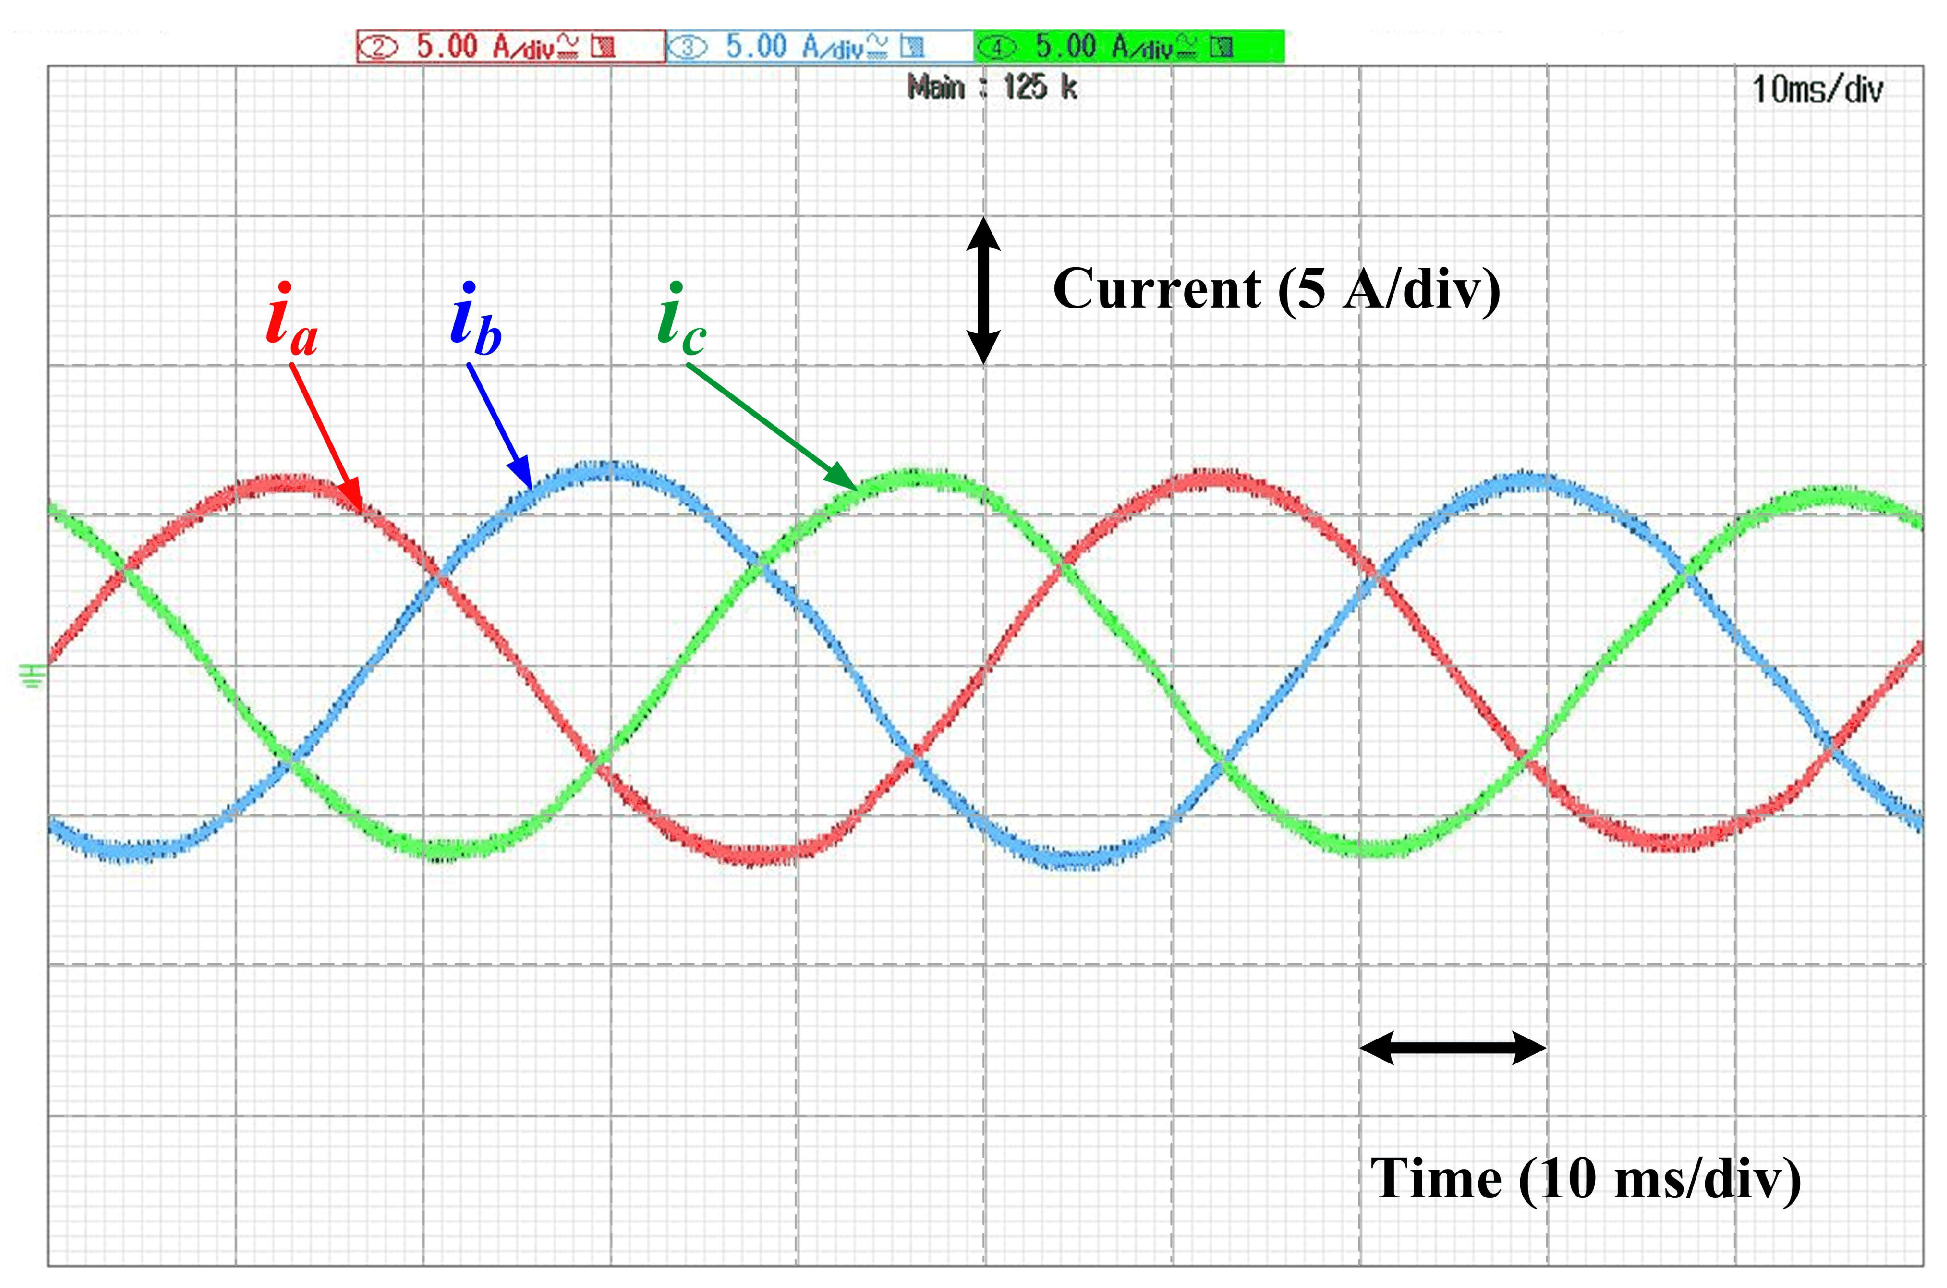
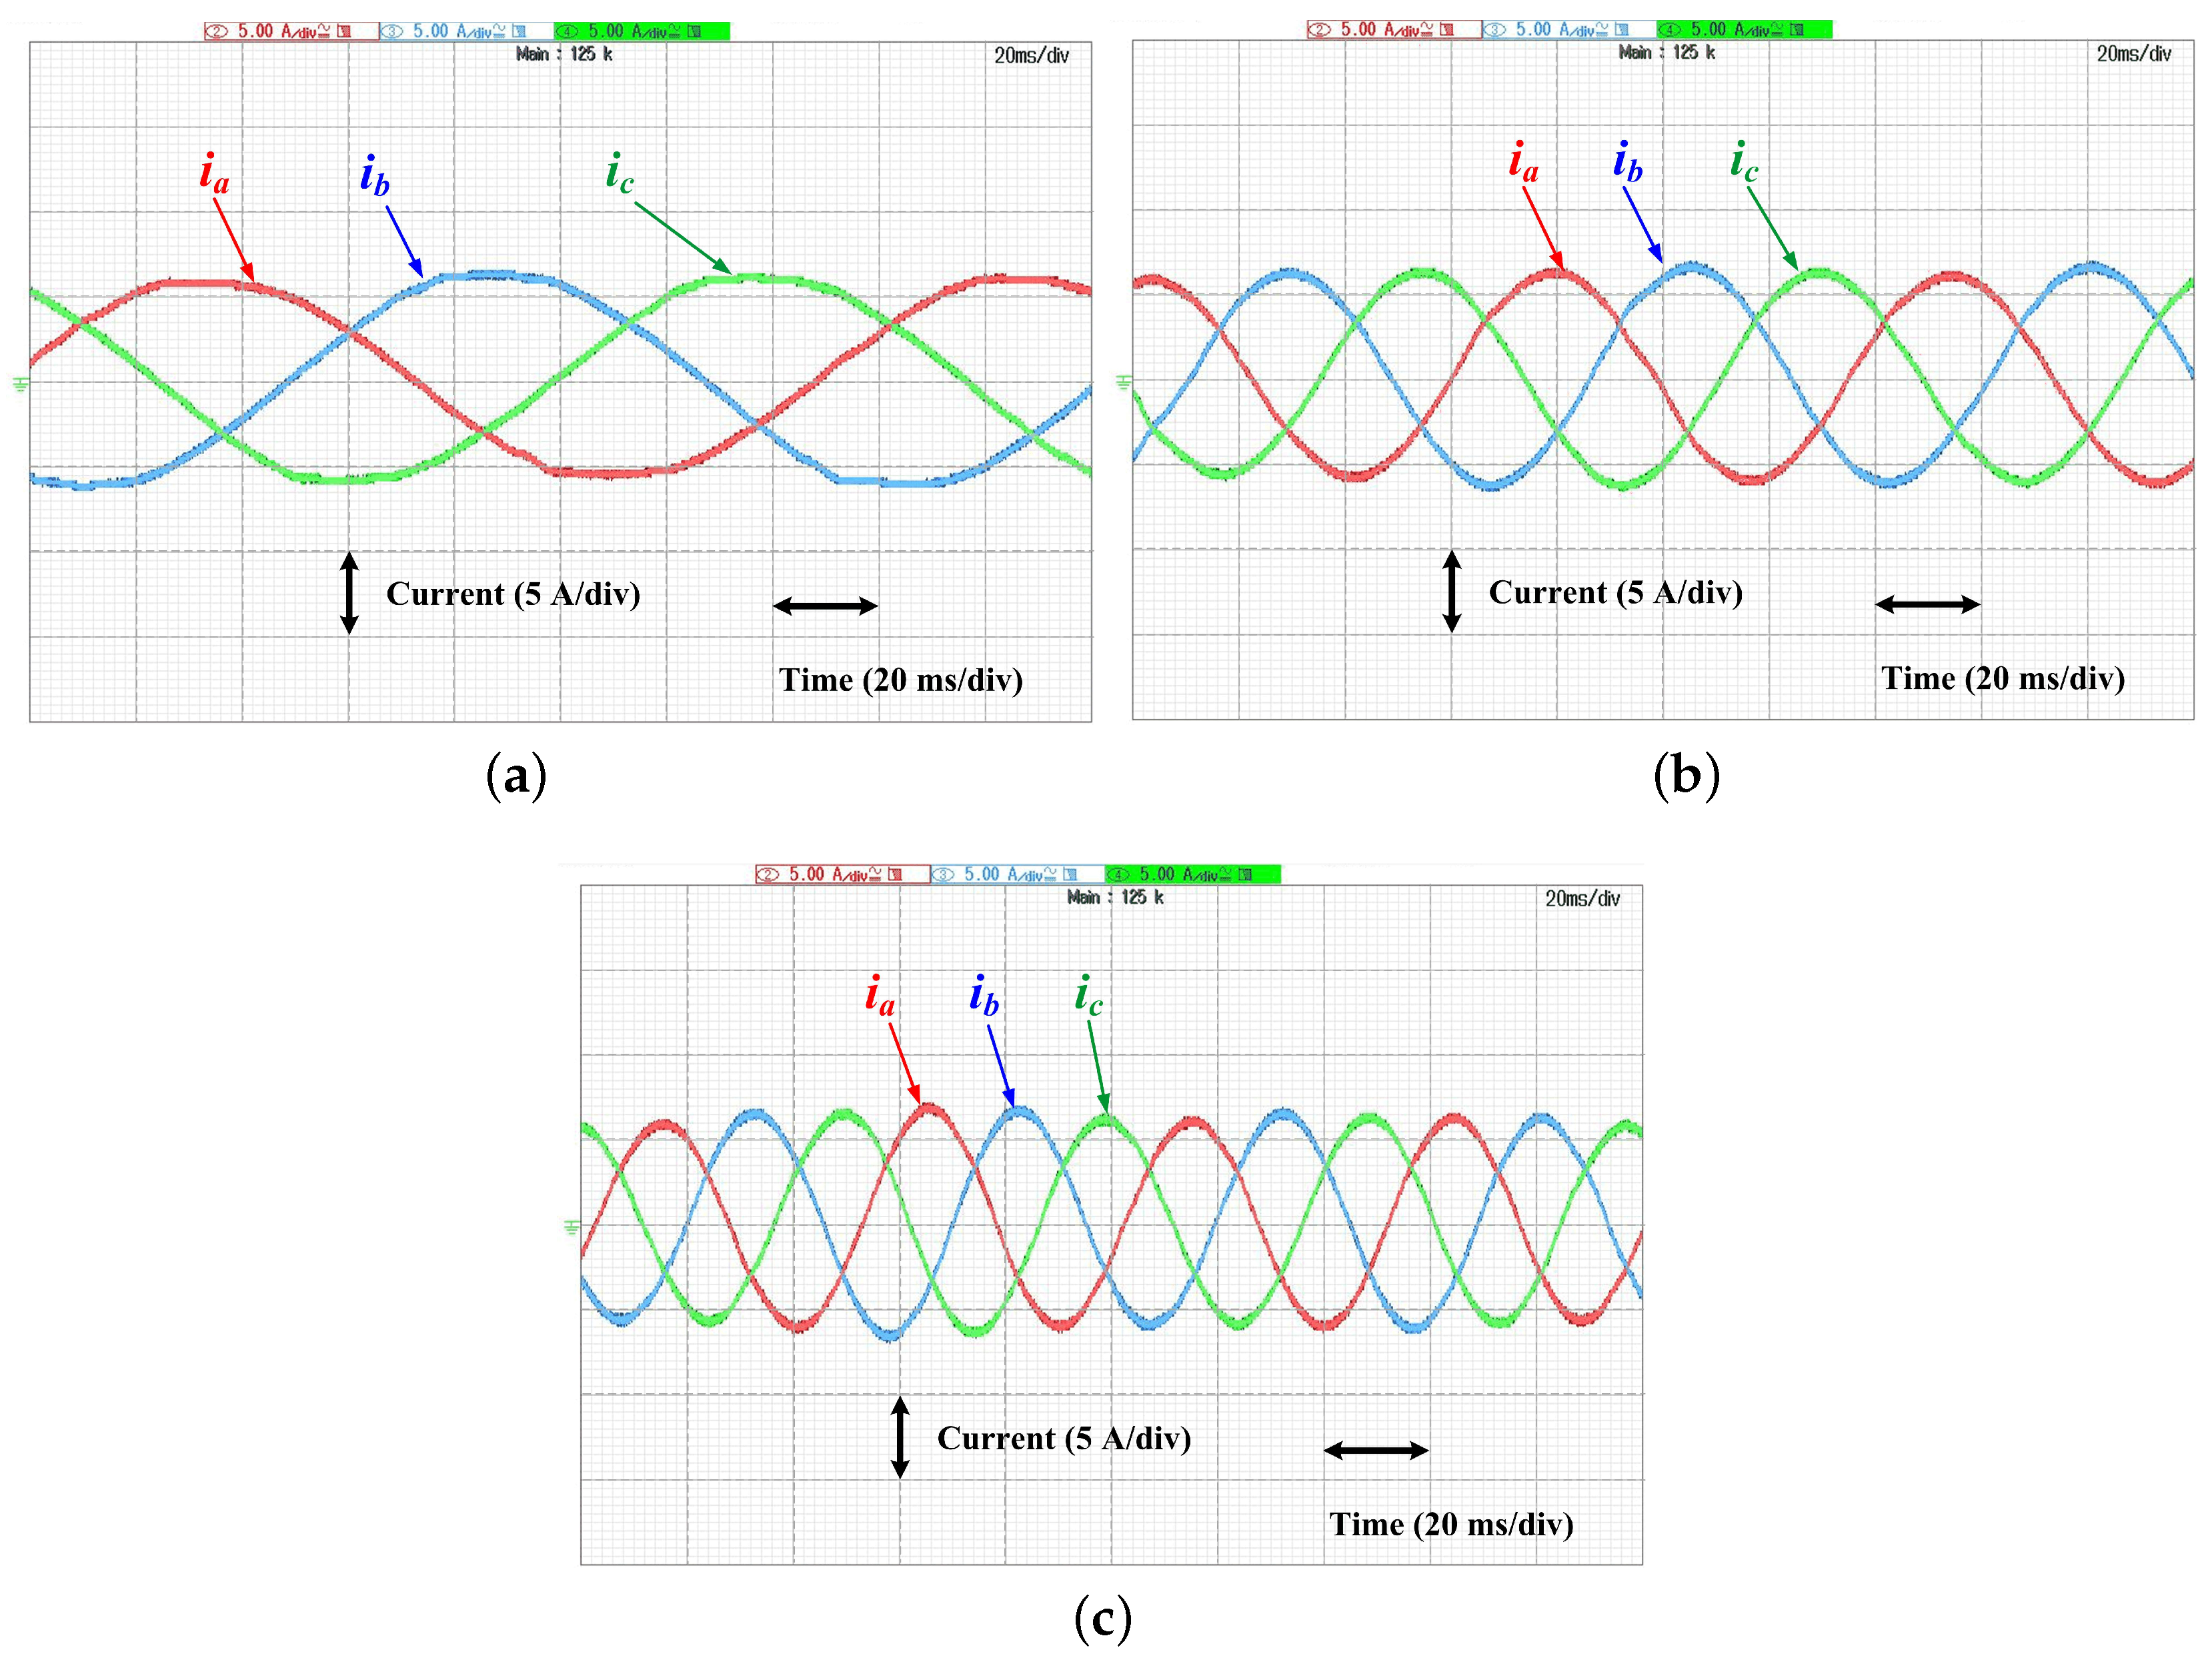
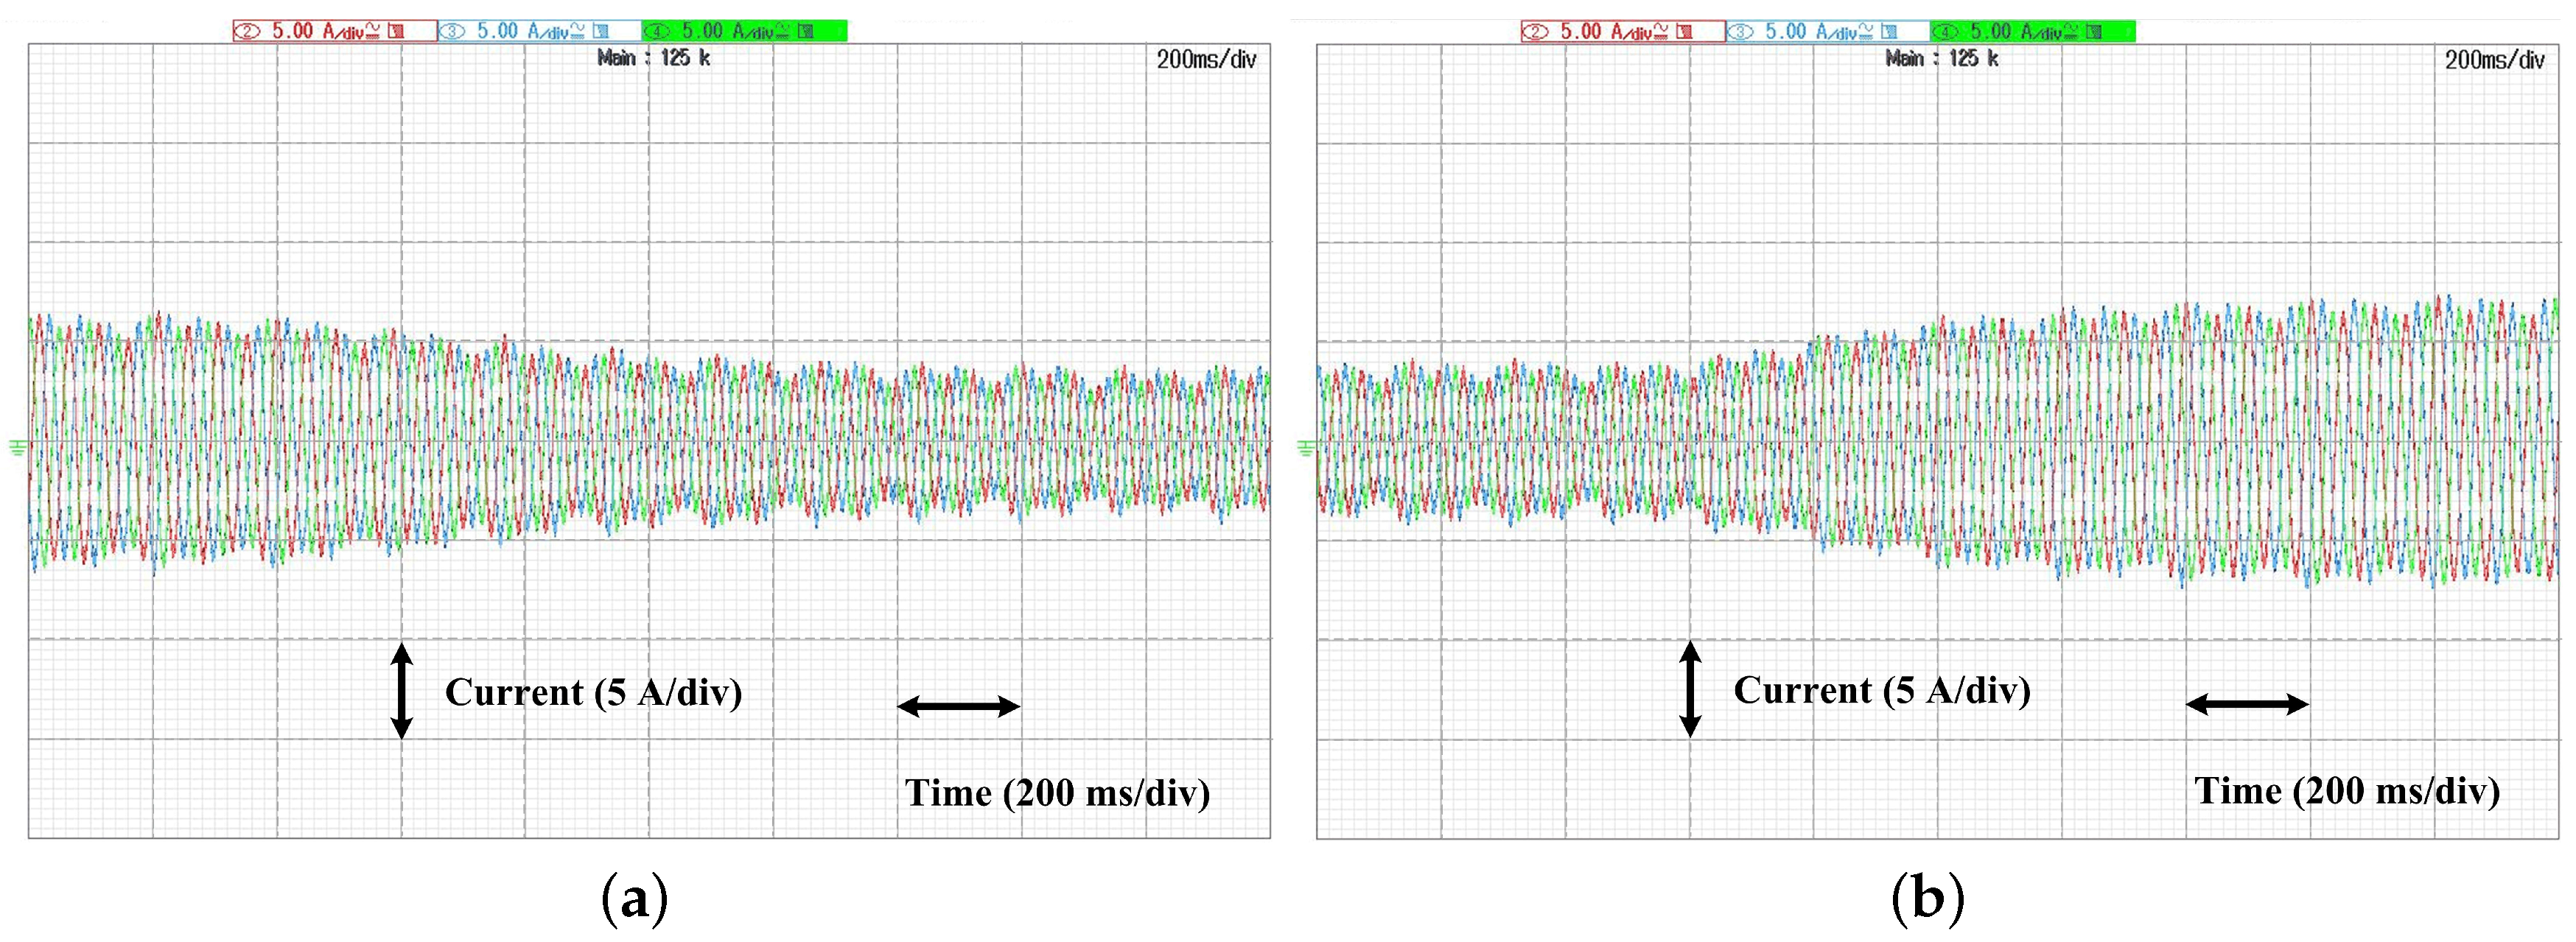
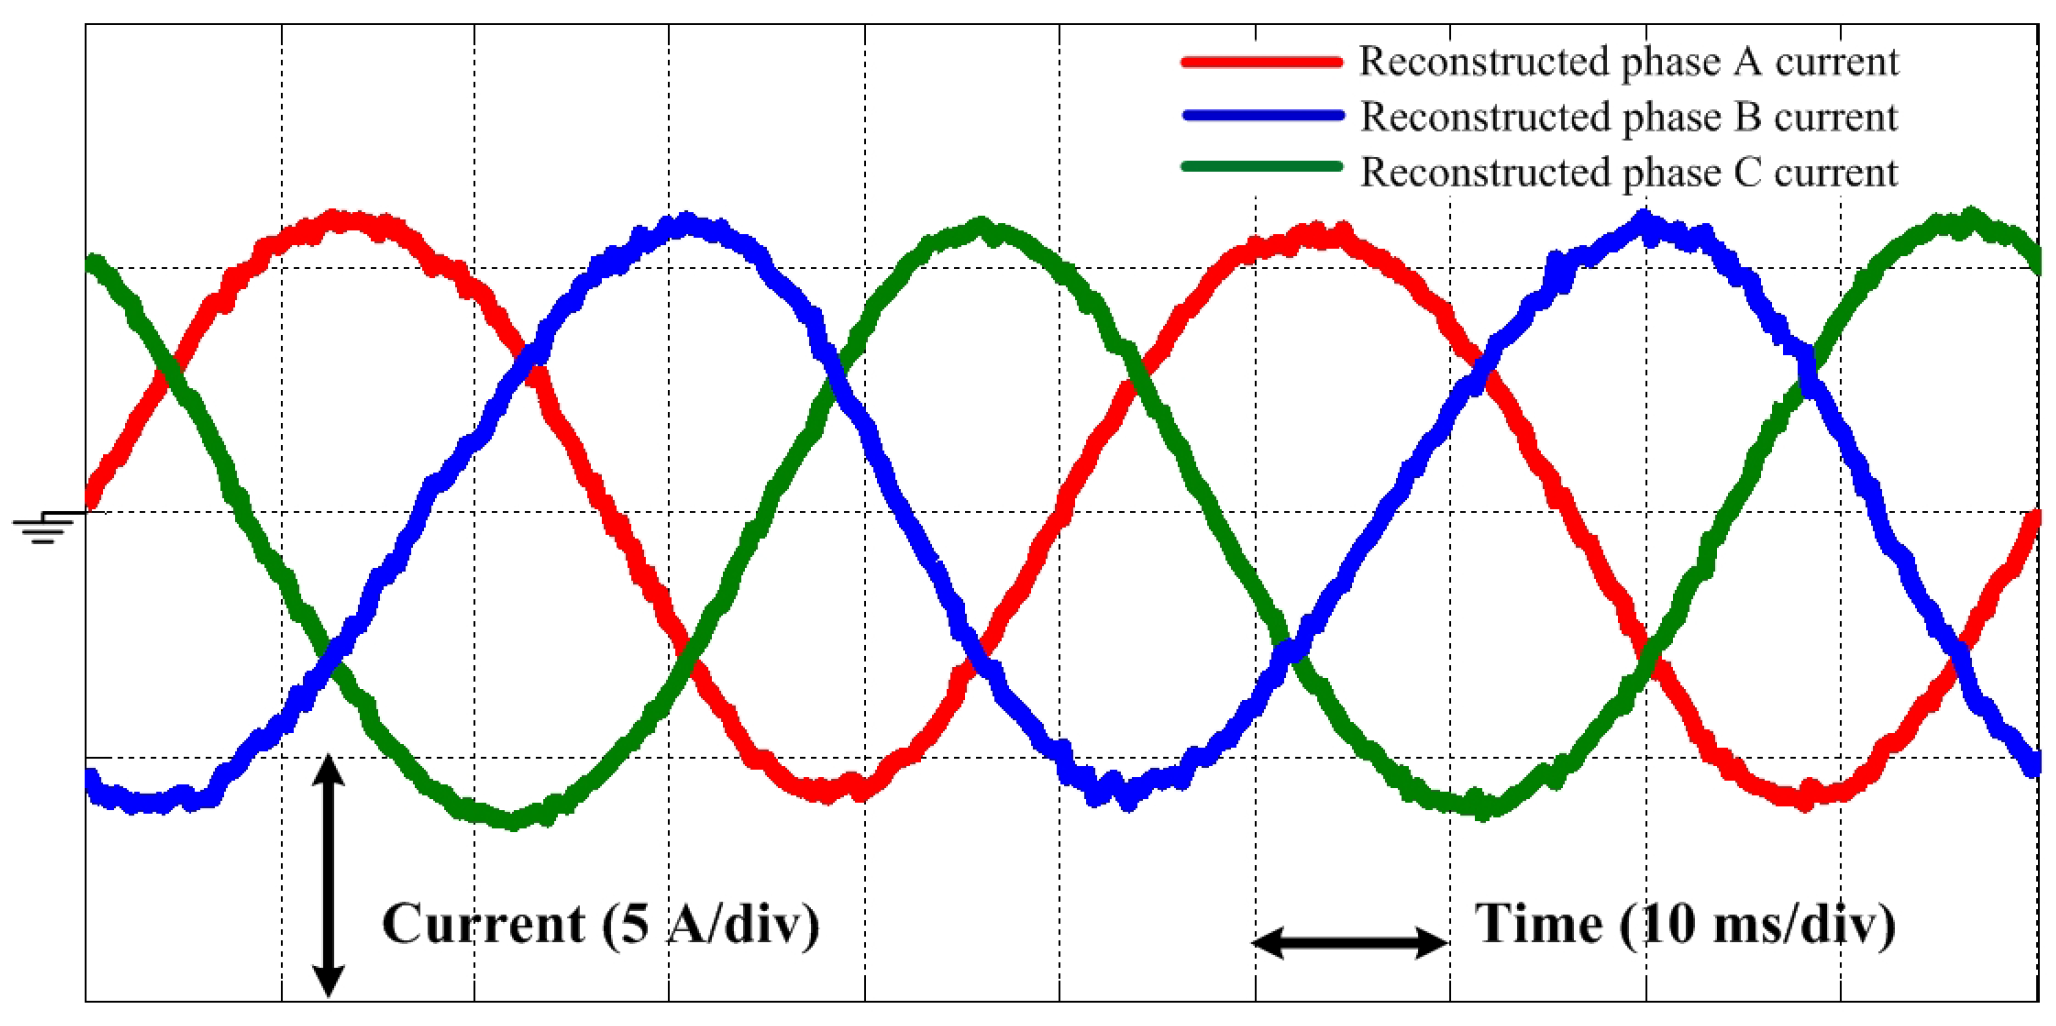
Figure 10 shows the PMSM control strategy based on the proposed phase current reconstruction method. In the control strategy, the PMSM is controlled by a speed and current double closed loop. The outputs of single current sensor are sampled based on the proposed method and the three-phase currents are reconstructed. Then, the reconstructed three-phase currents are transformed to the d–q (direct axis-quadrature axis) synchronous rotating frame, i d and i q , which are the feedback current signals of the current loops. Other algorithms in this control strategy are identical to the conventional double close loop PMSM control strategy.

5. Experimental Results

5.1. Experimental Results at Rated Operating State

First, the experiment at rated operating state is conducted. As shown in Table 2, the rated torque is 5 N·m and the rated motor speed is 300 r/min.
Figure 11 shows the experimental results of the single current sensor output i s a m at the rated operating state. It can be observed that the single current sensor output contains the phase current information, which verify the above analysis of working principle. The envelope curves of the single current sensor output are consistent with the phase currents.
To show the sampling points of the proposed phase current reconstruction clearly, the waveform of the single current sensor output and the three-phase PWM signals are put together in one figure. What’s more, the previous DC-link single current sensor method is carried out for comparison. Figure 12 shows the current sampling points and PWM signals of the two methods. In the DC-link current sensor method, shown in Figure 12a, the measurement vector insertion method (MVIM) is used to reconstruct the three-phase currents. In the end of each PWM period, three measurement vectors are inserted to sample the single current sensor and the three-phase currents are obtained. Nevertheless, this method changes the modulation mode of the PWM signals. As the Figure 12b show, the proposed method in this paper do not change the PWM signals and the single current sensor is sampled during the two zero voltage vectors V 0 (000) and V 7 (111). Therefore, the proposed method avoids the complicated algorithms and available in the sector boundary region and low modulation region.
The actual phase currents by using the two methods are shown in the Figure 13. As shown in Figure 13a, it is obvious that there are waveform distortion and harmonic contents in the phase currents of the pervious DC-link current sensor method, while the phase currents of the proposed method in this paper, shown in Figure 13b, is more sinusoidal. Therefore, the proposed method in this paper will be beneficial to the operation performances of the motor drive system.
Figure 14 shows the reconstructed three-phase currents by using the proposed method. The results are calculated with the proposed phase current reconstruction method and transmitted to the computer by the serial port RS232. Then, the waveforms are drawn by MATLAB (Version 2014b, MathWorks Incorporated, Natick, MA, USA). From the figure, it can be seen that the reconstructed three-phase currents are sinusoidal and contain less harmonic components, which demonstrates the effectiveness of the proposed method.
Then, the actual three-phase currents are shown in Figure 15. The motor is operated at the rated motor speed 300 r/min and the rated torque 5 N·m. In the close-loop control for the motor, the reconstructed three-phase currents are used to calculate i d and i q , as the feedback current signals of the current loops. The sinusoidal actual three-phase currents also demonstrate the effectiveness of the proposed method.
For further analysis of the current estimation accuracy, two current sensors are used in the drive platform. One is the current sensor to realize the proposed method, and the other one samples the phase A current for comparison. Figure 16a shows the reconstructed and actual measured phase A currents at the rated operation condition. It can be concluded that the reconstructed phase A current is consistent with the measured actual phase A current. The current estimation error is small, which is 4.2% as shown in Figure 16b.

5.2. Current Reconstruction Results at Different Motor Speeds

Figure 17 shows the actual three-phase currents at the motor speed of 100 r/min, 200 r/min and 300 r/min when the proposed phase current reconstruction method is used. In this experiment, the motor load remains constant (5 N·m) during different motor speeds.
Furthermore, the reconstructed and actual measured phase A currents as well as the current estimation errors of phase A at different motor speeds are shown in Figure 18. It can be seen that the proposed phase current reconstruction method is available at different motor speeds. Furthermore, the current estimation errors become large with the motor speed increasing because the phase currents as well as the current sensor outputs will change more rapidly in a PWM period at the high speed. However, the current estimation errors are not influenced by the motor speed too much and are still acceptable for the motor normal operation.

5.3. Current Reconstruction Results at Variable Load

To verify the dynamic performance of proposed phase current reconstruction method, a variable load experiment is carried out. The motor load is varied from the rated torque 5 N·m to 3 N·m and then back to 5 N·m.
Figure 19a,b show the actual three-phase currents when the motor load is decreasing and increasing, respectively. Moreover, the reconstructed and actual measured phase A currents as well as the current estimation errors of phase A are shown in Figure 20. From the results, it can be seen that the reconstructed phase current is consistent with the actual measured phase current and the dynamic performance of the proposed phase current reconstruction method is acceptable.
In all, the experimental results demonstrate that the proposed phase current reconstruction method can reconstruct the phase currents accurately in different operating conditions. A significant reason is that this method does not change the modulation mode of SVPWM, which is different from some other complicated algorithms such as measurement voltage injection method and switching-state phase shift method. Thus, this method can make the reconstructed phase currents with less waveform distortion and less harmonic contents, which are the advantages of this method. Furthermore, the experiments at different motor speeds and variable load demonstrate that the dynamic performance of the proposed method is acceptable, which can enlarge its application.

6. Conclusions

In this paper, a novel extended single current sensing technique is proposed for the three-phase PMSM drive, which can reconstruct the three-phase currents without modifying the PWM signal. Since the currents between each two power switches change with the switching states, by arranging the single current sensor at six novel positions and sampling their sum currents in two zero voltage vectors, the phase current can be reconstructed. In this method, the modulation mode of Space Vector PWM is not changed, and there are no dead zones in the sector boundary region and low modulation region. Therefore, lots of complicated compensation algorithms are avoided. Compared with previous single current sensor methods, the proposed method is easy to realize and other modification methods are not needed. Furthermore, it can reduce the cost and volume of the motor drive system. Although this proposed method increases the DC-link line, the influence is small and the phase current reconstruction results are still acceptable. The effectiveness of the proposed phase current reconstruction method for motor drive is validated by the different experiments. The proposed phase current reconstruction method is a suitable control strategy for low-cost and small-size three-phase PMSM drive systems, which can be used in electric energy conversion application.

Acknowledgments

This work was supported in part by the 973 Program under Grant 2013CB035605, in part by the National Natural Science Foundation of China under Grant 51437004, and in part by the National Natural Science Foundation of China under Grant 51577036. The funds have been received for covering the costs to publish this paper in open access. (973 = the National Key Basic Research Program of China)

Author Contributions

Hao Yan conceived the proposed phase current reconstruction approach, designed the experiments and drafted the manuscript; Yongxiang Xu analyzed the experimental data; and Jibin Zou revised the full manuscript.

Conflicts of Interest

The authors declare no conflict of interest.

References

  1. Rehman, H. Detuning Minimization of Induction Motor Drive System for Alternative Energy Vehicles. Energies 2015, 8, 9117–9136. [Google Scholar] [CrossRef]
  2. Yang, Y.P.; Shih, G.Y. Optimal Design of an Axial-Flux Permanent-Magnet Motor for an Electric Vehicle Based on Driving Scenarios. Energies 2016, 9, 285. [Google Scholar] [CrossRef]
  3. Guo, X.; Wu, S.; Fu, W.; Liu, Y.; Wang, Y.; Zeng, P. Control of a Dual-Stator Flux-Modulated Motor for Electric Vehicles. Energies 2016, 9, 517. [Google Scholar] [CrossRef]
  4. Wu, X.; Wang, H.; Huang, S.; Huang, K.; Wang, L. Sensorless Speed Control with Initial Rotor Position Estimation for Surface Mounted Permanent Magnet Synchronous Motor Drive in Electric Vehicles. Energies 2015, 8, 11030–11046. [Google Scholar] [CrossRef]
  5. Quang, N.K.; Hieu, N.T.; Ha, Q.P. FPGA-Based Sensorless PMSM Speed Control Using Reduced-Order Extended Kalman Filters. IEEE Trans. Ind. Electron. 2014, 61, 6574–6582. [Google Scholar] [CrossRef]
  6. Wang, Z.; Chen, J.; Cheng, M.; Chau, K.T. Field-Oriented Control and Direct Torque Control for Paralleled VSIs Fed PMSM Drives With Variable Switching Frequencies. IEEE Trans. Power Electron. 2016, 31, 2417–2428. [Google Scholar] [CrossRef]
  7. Xu, Y.; Yuan, Q.; Zou, J.; Yao, Y.; Zhu, G. Sinusoidal periodic carrier frequency modulation in reducing electromagnetic noise of permanent magnet synchronous motor. IET Electr. Power Appl. 2013, 7, 223–230. [Google Scholar] [CrossRef]
  8. Pan, L.; Zhang, C. An Integrated Multifunctional Bidirectional AC/DC and DC/DC Converter for Electric Vehicles Applications. Energies 2016, 9, 493. [Google Scholar] [CrossRef]
  9. Liu, K.; Zhu, Z.Q. Quantum Genetic Algorithm-Based Parameter Estimation of PMSM Under Variable Speed Control Accounting for System Identifiability and VSI Nonlinearity. IEEE Trans. Ind. Electron. 2015, 62, 2363–2371. [Google Scholar] [CrossRef]
  10. Qiu, T.; Wen, X.; Zhao, F. Adaptive-Linear-Neuron-Based Dead-Time Effects Compensation Scheme for PMSM Drives. IEEE Trans. Power Electron. 2016, 31, 2530–2538. [Google Scholar] [CrossRef]
  11. Xie, G.; Lu, K.; Dwivedi, S.K.; Rosholm, J.R.; Blaabjerg, F. Minimum-Voltage Vector Injection Method for Sensorless Control of PMSM for Low-Speed Operations. IEEE Trans. Power Electron. 2016, 31, 1785–1794. [Google Scholar] [CrossRef]
  12. Kim, E.K.; Mwasilu, F.; Choi, H.H.; Jung, J.W. An Observer-Based Optimal Voltage Control Scheme for Three-Phase UPS Systems. IEEE Trans. Ind. Electron. 2015, 62, 2073–2081. [Google Scholar] [CrossRef]
  13. Zhou, D.; Blaabjerg, F.; Franke, T.; Tønnes, M.; Lau, M. Comparison of Wind Power Converter Reliability With Low-Speed and Medium-Speed Permanent-Magnet Synchronous Generators. IEEE Trans. Ind. Electron. 2015, 62, 6575–6584. [Google Scholar] [CrossRef]
  14. Prasad, J.S.S.; Narayanan, G. Minimization of Grid Current Distortion in Parallel-Connected Converters Through Carrier Interleaving. IEEE Trans. Ind. Electron. 2014, 61, 76–91. [Google Scholar] [CrossRef]
  15. Aguillon-Garcia, J.; Moon, G.W. A High-Efficiency Three-Phase ZVS PWM Converter Utilizing a Positive Double-Star Active Rectifier Stage for Server Power Supply. IEEE Trans. Ind. Electron. 2011, 58, 3317–3329. [Google Scholar] [CrossRef]
  16. Pacas, M. Sensorless Drives in Industrial Applications. IEEE Ind. Electron. Mag. 2011, 5, 16–23. [Google Scholar] [CrossRef]
  17. Green, T.C.; Williams, B.W. Derivation of motor line-current waveforms from the DC-link current of an inverter. IEEE Proc. B Electr. Power Appl. 1989, 136, 196–204. [Google Scholar] [CrossRef]
  18. Yang, S.C. Saliency-Based Position Estimation of Permanent-Magnet Synchronous Machines Using Square-Wave Voltage Injection With a Single Current Sensor. IEEE Trans. Ind. Appl. 2015, 51, 1561–1571. [Google Scholar] [CrossRef]
  19. Blaabjerg, F.; Pedersen, J.K.; Jaeger, U.; Thoegersen, P. Single current sensor technique in the DC link of three-phase PWM-VS inverters: a review and a novel solution. IEEE Trans. Ind. Appl. 1997, 33, 1241–1253. [Google Scholar] [CrossRef]
  20. Lee, W.C.; Hyun, D.S.; Lee, T.K. A novel control method for three-phase PWM rectifiers using a single current sensor. IEEE Trans. Power Electron. 2000, 15, 861–870. [Google Scholar]
  21. Lai, Y.S.; Lin, Y.K.; Chen, C.W. New Hybrid Pulsewidth Modulation Technique to Reduce Current Distortion and Extend Current Reconstruction Range for a Three-Phase Inverter Using Only DC-link Sensor. IEEE Trans. Power Electron. 2013, 28, 1331–1337. [Google Scholar] [CrossRef]
  22. Lee, W.C.; Lee, T.K.; Hyun, D.S. Comparison of single-sensor current control in the DC link for three-phase voltage-source PWM converters. IEEE Trans. Ind. Electron. 2001, 48, 491–505. [Google Scholar]
  23. Saritha, B.; Janakiraman, P.A. Sinusoidal Three-Phase Current Reconstruction and Control Using a DC-Link Current Sensor and a Curve-Fitting Observer. IEEE Trans. Ind. Electron. 2007, 54, 2657–2664. [Google Scholar] [CrossRef]
  24. Gan, C.; Wu, J.; Yang, S.; Hu, Y. Phase Current Reconstruction of Switched Reluctance Motors from DC-link Current under Double High Frequency Pulses Injection. IEEE Trans. Ind. Electron. 2015, 62, 3265–3276. [Google Scholar] [CrossRef]
  25. Gan, C.; Wu, J.; Hu, Y.; Yang, S.; Cao, W.; Kirtley, J.L. Online Sensorless Position Estimation for Switched Reluctance Motors Using One Current Sensor. IEEE Trans. Power Electron. 2016, 31, 7248–7263. [Google Scholar] [CrossRef]
  26. Metidji, B.; Taib, N.; Baghli, L.; Rekioua, T.; Bacha, S. Novel Single Current Sensor Topology for Venturini Controlled Direct Matrix Converters. IEEE Trans. Power Electron. 2013, 28, 3509–3516. [Google Scholar] [CrossRef]
  27. Metidji, B.; Taib, N.; Baghli, L.; Rekioua, T.; Bacha, S. Phase Current Reconstruction Using a Single Current Sensor of Three-Phase AC Motors Fed by SVM-Controlled Direct Matrix Converters. IEEE Trans. Ind. Electron. 2013, 60, 5497–5505. [Google Scholar] [CrossRef]
  28. Kim, H.; Jahns, T.M. Phase Current Reconstruction for AC Motor Drives Using a DC Link Single Current Sensor and Measurement Voltage Vectors. IEEE Trans. Power Electron. 2006, 21, 1413–1419. [Google Scholar] [CrossRef]
  29. Gu, Y.; Ni, F.; Yang, D.; Liu, H. Switching-State Phase Shift Method for Three-Phase-Current Reconstruction With a Single DC-Link Current Sensor. IEEE Trans. Ind. Electron. 2011, 58, 5186–5194. [Google Scholar]
  30. Ha, J.I. Current Prediction in Vector-Controlled PWM Inverters Using Single DC-Link Current Sensor. IEEE Trans. Ind. Electron. 2010, 57, 716–726. [Google Scholar]
  31. Sun, K.; Wei, Q.; Huang, L.; Matsuse, K. An Overmodulation Method for PWM-Inverter-Fed IPMSM Drive With Single Current Sensor. IEEE Trans. Ind. Electron. 2010, 57, 3395–3404. [Google Scholar] [CrossRef]
  32. Lu, H.; Cheng, X.; Qu, W.; Sheng, S.; Li, Y.; Wang, Z. A Three-Phase Current Reconstruction Technique Using Single DC Current Sensor Based on TSPWM. IEEE Trans. Power Electron. 2014, 29, 1542–1550. [Google Scholar]
  33. Hafez, B.; Abdel-Khalik, A.S.; Massoud, A.M.; Ahmed, S.; Lorenz, R.D. Single-Sensor-Based Three-Phase Permanent-Magnet Synchronous Motor Drive System With Luenberger Observers for Motor Line Current Reconstruction. IEEE Trans. Ind. Appl. 2014, 50, 2602–2613. [Google Scholar] [CrossRef]
  34. Xu, Y.; Yan, H.; Zou, J.; Wang, B.; Li, Y. Zero Voltage Vector Sampling Method for PMSM Three-Phase Current Reconstruction Using Single Current Sensor. IEEE Trans. Power Electron. 2016. [Google Scholar] [CrossRef]
Figure 1. The circuit topology of the single DC-link current sensor method.
Energies 09 00853 g001
Figure 2. The normal working area and current reconstruction dead zones using the single DC-link current sensor method.
Energies 09 00853 g002
Figure 3. The schematic diagram of conventional three-phase system using the PWM-VSI.
Energies 09 00853 g003
Figure 4. The circuit topology and sampling points of the novel phase current reconstruction approach. (a) the circuit topology and the installation position of the single hall-effect current sensor; and (b) two sampling points during a PWM period.
Energies 09 00853 g004
Figure 5. The current flow paths during two zero voltage vectors. (a) V 0 (000); and (b) V 7 (111).
Energies 09 00853 g005
Figure 6. The actual current and ideal current in the proposed method.
Energies 09 00853 g006
Figure 7. The reconstruction dead zones of the novel phase current reconstruction approach.
Energies 09 00853 g007
Figure 8. Scheme of the experimental setup.
Energies 09 00853 g008
Figure 9. Photograph of the experimental setup.
Energies 09 00853 g009
Figure 10. PMSM control strategy based on the novel phase current reconstruction method.
Energies 09 00853 g010
Figure 11. The single current sensor outputs; time scale: 20 ms/div.
Energies 09 00853 g011
Figure 12. Sampling points and three-phase PWM signals of the two methods. (a) the single DC-link current sensor method; and (b) the novel phase current reconstruction method.
Energies 09 00853 g012
Figure 13. Actual phase currents by using the two methods. (a) the single DC-link current sensor method; and (b) the novel phase current reconstruction method.
Energies 09 00853 g013
Figure 14. Reconstructed three-phase currents under the proposed phase current reconstruction method; time scale: 10 ms/div.
Energies 09 00853 g014
Figure 15. Actual three-phase currents under the proposed phase current reconstruction method; time scale: 10 ms/div.
Energies 09 00853 g015
Figure 16. Reconstructed and actual measured phase A currents and the current estimation errors under the proposed method; time scale: 10 ms/div. (a) reconstructed and actual measured phase A currents; and (b) current estimation errors.
Energies 09 00853 g016
Figure 17. Actual three-phase currents at different motor speeds; time scale: 20 ms/div. (a) 100 r/min; (b) 200 r/min; and (c) 300 r/min.
Energies 09 00853 g017
Figure 18. Reconstructed and actual measured phase A currents as well as the current estimation errors of phase A at different motor speeds; time scale: 20 ms/div. (a) 100 r/min; (b) 200 r/min; and (c) 300 r/min.
Energies 09 00853 g018
Figure 19. Actual three-phase currents when the motor load is decreasing and increasing; time scale: 200 ms/div. (a) from 5 N·m to 3 N·m; and (b) from 3 N·m to 5 N·m.
Energies 09 00853 g019
Figure 20. Reconstructed and actual measured phase A currents as well as the current estimation errors of phase A at variable load; time scale: 50 ms/div. (a) from 5 N·m to 3 N·m; and (b) from 3 N·m to 5 N·m.
Energies 09 00853 g020
Table 1. Sampling currents of seven current paths during the two zero voltage vectors.
Current PathsSampling Currents at V 0 (000)Sampling Currents at V 7 (111)
0 i b + i c
0 i c
i b + i c 0
i c 0
i a 0
i b 0
i c 0
Table 2. Motor parameters.
ParametersQuantity
Winding resistance ( R a )0.62 Ω
Winding inductance ( L a )0.28 mH
Back EMF coefficient ( K e )0.1103 V/(rad/s)
Moment of inertia (J)0.82 g·m 2
Number of pole pairs (p)4
DC-link voltage ( V d c )80 V
Rated torque ( T N )5 N·m
Rated speed ( n N )300 r/min

