1. Introduction
With the development of national defense technology, space launch and manned space activities, the future direction for development in aircraft motor systems will focus mainly on good control, lower cost, higher safety, reliability and reusability, no pollution to the environment, etc. A hybrid rocket engine, with the many advantages of both solid and liquid rocket engines, has potential advantages to meet these requirements. However, the low regression rate of its solid fuel has been a major challenge to its development. In recent years, many institutions have thus begun research into fuels with higher regression rates, of which the research into paraffin-based fuel is the most remarkable one.
Paraffin-based fuel has almost the same density as hydroxyl-terminated HTPB (polybutadiene) fuel and a little higher heat of combustion than HTPB fuel, but its regression rate is 3–4 times than that of HTPB’s, so paraffin-based fuel is an ideal solid-liquid hybrid rocket engine fuel [
1]. Ground trial run experiments of an engine having paraffin-based fuel, named SP-la, have been conducted more than 300 times at Stanford University with the support of DARPA and NASA Ames Research Centers. In 1999, a paraffin-based hybrid rocket, which was 1.7 m long and 50.8 millimeters in diameter, was launched to the height of 1829 m by Stanford University [
2]. In 2003, two flight tests, with flight heights of 4600 m and 1670 m, respectively, were done by Stanford University and Lockheed Martin Corporation. In 2004, a three-inch-diameter paraffin-based fuel sounding rocket, whose flight height was 2871 m and total impulse 3500 N·s, was designed and manufactured by postgraduate students at Stanford University [
3].
The energy characteristics analysis of paraffin-based fuel is an important prerequisite to guide the formulation selection and the engine design. The energy characteristics of the additives in HTPB fuel were analyzed by Junfeng Wu [
4], and the analysis showed that AP (ammonium perchlorate) and B (boron) can lower the optimal oxidizer-fuel ratio of solid rocket motor; ALH
3 (aluminium hydride) can increase the vacuum-specific impulse significantly, and AL (aluminium) could increase the density-specific impulse. The energy characteristics of solid additives in the HTPB were analyzed by Changbao Liu [
5], and the relationship of solid contents (including AP, RDX (hexogen), AL
etc.) and the theoretical specific impulse of propellant were obtained. There is hardly any oxidizer in paraffin-based fuel, and the heat release rate of the fuel is quite low during thermal degradation and combustion. Experimentation on the thermal degradation characteristics of paraffin-based fuel is an important means of studying its combustion mechanism and revealing the combustion mechanism. The thermal degradation characteristics of HTPB/MA (magnalium alloy) were analyzed by the methods of TG-DTG and DSC by Genwang Mao [
6], and the results showed that the weightlessness rate of propellant increased when the HTPB contents decreased and the MA content increased; the increase of pressure would advance the low temperature decomposition peak and postpone the high temperature decomposition peak of AP, and the heat release of propellant would increase. The thermal degradation characteristics of AP, KP (potassium permanganate) and their mixtures were analyzed by DSC, DTA, TG and DTG methods by Wei Zhang [
7], and the result showed that AP could improve KP’s thermal decomposition reaction in AL and Mg fuel-rich propellant. The thermal degradation characteristics of HTPB/AP composite system were analyzed by the methods of PDSC, TG-DTG and DSC-FTIR by Zhenhao Shi [
8], and the result showed that the increase of pressure and the addition of AL powder could both accelerate the propellant’s thermal decomposition. In the meantime, with the increasing of pressure, multi-peak phenomena would arise in HTPB’s exothermic decomposition reaction, while the phenomena would be inhibited by AL powder.
There is much research on the solid fuel regression rate of the hybrid engines at home and abroad, but the most influential one is the diffusion control theory put forward by Marxman [
9] in the 1960s. The research suggested that the main reason for the promotion of the combustion of solid fuel in a hybrid rocket engine was the heat transfer between the surface of the fuel and the diffusion flame, and then, the relationship between the regression rate and oxidizer flow rate was concluded. Hao Chen [
10] summed up the relationship between the regression rate and the surface temperature of solid fuel by hot-plate heat conduction experiments. By using the coupled simulation on gas-phase combustion and heat transfer in solid fuel, Yuxin Yang [
11] developed a numerical method indicated by the instantaneous regression rate of solid fuel in a hybrid engine and concluded that with the working of the engine, the surface temperature and the regression rate of the solid fuel decreased, while the temperatures and the regression rates of every point on the pyrolysis surface of the fuel along the axial direction of the engine differed from each other, even at the same time.
In this paper, the research mainly focuses on the calculation of the energy characteristics of different paraffin-based fuel and HTPB fuel formulations, the study of the thermal degradation characteristics of pretreated paraffin, paraffin, HTPB and paraffin-based fuel, the testing of the regression rate of paraffin-based fuel in a hybrid engine by the method of a rectangular solid-gas hybrid engine with end-face combustion, the analysis of the effects of different pressure and different heating rates on the regression rate of the fuel, the computation of the chemical kinetics parameters of pretreated paraffin and paraffin-based fuel in an oxygen atmosphere and the study of the relationship among fuel formula, oxidizer mass flow rate and the regression rate.
2. Paraffin-Based Fuel Energy Characteristics Analysis
The thermodynamic calculation of the combustion chamber and exhaust nozzle were performed by the Gibbs free energy minimization method [
12,
13], and some parameters about the energy characteristics of the fuel were obtained. After the comparison of the energy characteristics’ parameters of different fuel components, the suitable fuel formulations were selected, and then, the thermal decomposition characteristic studies and the engine tests were conducted for those. The fuel formulations of the energy characteristics’ calculation are as shown in
Table 1.
The fuel does not ignite easily; however, AP is conductive to combustion, and the fuel has a very small amount of AP, which can be ignorable, so it still belongs to the fuel. Here, we used oxidized paraffin, which was pretreated by hydroxyl, and the molecular formulation is C26H54O.
The energy characteristics’ calculations were performed at these conditions: initial temperature of 300 K, combustion chamber working pressure of 3.4 MPa, nozzle expansion ratio,
Ae/
At, of 70 and the oxidizer-liquid oxygen. With the formulations in
Table 1 as the fuel, the calculation results of the energy characteristics under different O/F (the ratio of oxidant and fuel) are shown in
Table 2.
Table 1.
The fuel formulation.
Table 1.
The fuel formulation.
| Sample (No.) | HTPB (%) | Paraffin (%) | AL (%) | Mg (%) | AP (%) | C (%) |
|---|
| S0 | 73 | 0 | 6 | 6 | 5 | 10 |
| S1 | 58 | 25 | 6 | 6 | 5 | 0 |
| S2 | 48 | 25 | 6 | 6 | 5 | 10 |
| S3 | 42 | 25 | 12 | 6 | 5 | 10 |
| S4 | 58 | 15 | 6 | 6 | 5 | 10 |
| S5 | 38 | 35 | 6 | 6 | 5 | 10 |
| S6 | 41 | 35 | 6 | 6 | 2 | 10 |
Table 2.
Fuel energy characteristics under different O/F.
Table 2.
Fuel energy characteristics under different O/F.
| Sample (No.) | O/F |
|---|
| 1.6 | 1.9 | 2.4 |
|---|
| Tf (K) | Is (N·s/kg) | Tf (K) | Is (N·s/kg) | Tf (K) | Is (N·s/kg) |
|---|
| S0 | 3557.5 | 3314.6 | 3681.0 | 3353.0 | 3697.8 | 3279.5 |
| S1 | 3506.5 | 3307.3 | 3646.0 | 3354.8 | 3672.7 | 3287.5 |
| S2 | 3549.3 | 3278.3 | 3668.4 | 3317.5 | 3680.1 | 3244.2 |
| S3 | 3697.0 | 3309.7 | 3756.0 | 3296.0 | 3733.1 | 3205.7 |
| S4 | 3552.7 | 3292.9 | 3673.6 | 3331.8 | 3687.3 | 3258.4 |
| S5 | 3545.7 | 3263.7 | 3663.0 | 3303.1 | 3672.7 | 3230.0 |
| S6 | 3497.6 | 3249.4 | 3652.1 | 3310.6 | 3682.7 | 3253.3 |
(1) Compared with Sample 2, the Is value of Sample 0 was higher by 36.3 N·s/kg, 35.5 N·s/kg and 35.3 N·s/kg, respectively, under the oxidizer-to-fuel ratios of 1.6, 1.9 and 2.4. This showed that there was little difference between the specific impulse of paraffin-based fuel and that of HTPB fuel.
(2) Compared with Sample 3, the Is value of Sample 2 was lower by 31.4 N·s/kg for the oxidizer-to-fuel ratio of 1.6, while it was higher by 21.5 N·s/kg and 38.5 N·s/kg, respectively, for the oxidizer-to-fuel ratios of 1.9 and 2.4. It can be seen that the increase in AL increased the chamber temperature, but decreased the specific impulse slightly; moreover, adding AL can effectively improve the density-specific impulse, as the density of AL is about two-times that of HTPB.
(3) Compared with Sample 6, the Is value of Sample 5 was higher by 14.3 N·s/kg under the oxidizer-to-fuel ratio of 1.6, while it was lower by 7.5 N·s/kg and 23.3 N·s/kg, respectively, under the oxidizer-to-fuel ratios of 1.9 and 2.4. This showed that the oxygen contents of fuel were increased by adding AP, but the optimal oxidizer-to-fuel ratio and specific impulse were both decreased.
In this paper, the specific impulses of Sample 0 and Sample 5 in
Table 1 were calculated under different oxidizer-to-fuel ratios, and then, the influence of different oxidizer-to-fuel ratios on the fuel energy characteristics was analyzed. The calculation requirements were as follows: initial temperature of 300 K, combustion chamber working pressure of 3.4 MPa, nozzle expansion ratio of
Ae/
At = 70 and liquid oxygen as the oxidant. The characteristic parameters of different formulas changed with the oxygen-to-fuel ratio, as is shown in
Figure 1.
Figure 1 shows that the specific impulse of Sample 0 and Sample 5 fuel reached the maximum value of 3353.0 N·s/kg and 3303.1 N·s/kg, respectively, under the oxidizer-to-fuel ratio of 1.9. This indicated that the optimal oxidizer-to-fuel ratios of Sample 0 and Sample 5 were both 1.9. At an oxidizer-to-fuel ratio lower than the optimum oxidizer-to-fuel ratio, the increase of oxidizer mass flow would result in complete combustion, the heat release would increase and it would result in the increase of engine-specific impulse. When the oxidizer-to-fuel ratio was higher than the optimum oxidizer-to-fuel ratio, the excess oxygen would remain unreacted. There would not be any effect of increasing the oxidizer mass flow rate on the reaction. On the contrary, with the increase of oxygen content, the specific impulse would decrease.
Figure 1.
Is of S0 and S5 follow the O/F changed.
Figure 1.
Is of S0 and S5 follow the O/F changed.
3. Pretreated Paraffin Thermal Degradation Characteristics Analysis
3.1. Experimental Program
In this paper, paraffin, pretreated paraffin and HTPB are chosen as samples. These three experimental samples are put into crucibles and sealed with covers, and then, thermal analysis is carried out by the TG and DSC techniques under an air, nitrogen and oxygen atmosphere. The measurements are made in a dynamic atmosphere with gas flow rate of 30 mL/min. For thermogravimetric analysis, the sample should be less than 3 mg, and for DSC, the sample size should be less than 0.5 mg in the experimental method [
14]. According to the different experimental requirements, the concrete experimental program is as follows:
(1) For the TGA experiment of paraffin, pretreated paraffin and HTPB samples, the heating rate is 20 °C/min under normal pressure and nitrogen atmosphere.
(2) For the DSC experiment of paraffin, pretreated paraffin and HTPB samples, the heating rate is 20 °C/min under normal pressure and air atmosphere.
(3) For the DSC experiment of the pretreated paraffin sample at different pressures, the heating rate is selected to be 20 °C/min under air atmosphere, and the various pressures are 0.1 MPa, 1 MPa and 2 MPa, respectively.
(4) For the DSC experiment of the pretreated paraffin sample at different heating rates, the pressure is selected to be 2 MPa under an oxygen atmosphere, and the various heating rates are 5 °C/min, 10 °C/min and 20 °C/min, respectively.
3.2. Thermogravimetric Analysis
The TG experiments of paraffin, pretreated paraffin and HTPB samples were conducted at the heating rate of 20 °C/min under a nitrogen atmosphere. In
Figure 2, Curves 1, 2 and 3 stand for paraffin, pretreated paraffin and HTPB in TGA, respectively.
Figure 2.
Thermal analysis curves of paraffin, pretreated paraffin and HTPB.
Figure 2.
Thermal analysis curves of paraffin, pretreated paraffin and HTPB.
(1) Paraffin and pretreated paraffin began to decompose at 182 °C and 230 °C, respectively. The initial decomposition temperature of pretreated paraffin is higher than that of the untreated paraffin, which indicates that the pretreatment of paraffin is useful, and the characteristics of pretreated paraffin are different from the untreated one.
(2) HTPB began to decompose at 336 °C, which is much higher than the decomposition temperature of pretreated paraffin. While paraffin-based fuel is a kind of fuel that partially substitutes paraffin for HTPB, advancing the initial reaction temperature lowered the ignition temperature of paraffin-based fuel effectively.
(3) Paraffin decomposed completely at 346 °C, while pretreated paraffin completed its first decomposition at 391 °C, and it had 40% of the weight at this time, which showed that in pretreated paraffin, most of the paraffin reacted with HTPB, but there was still some incomplete reaction.
3.3. DSC Thermal Analysis under Air Atmosphere
For the DSC experiment, the paraffin, pretreated paraffin and HTPB samples were subjected to the heating rate of 20 °C/min under normal pressure and an air atmosphere. In
Figure 3, Curves 1, 2 and 3 stand for paraffin, pretreated paraffin and HTPB in the DSC experiment, respectively.
(1) Pretreated paraffin’s melting temperature was 49.8 °C, and the melting heat absorption was 149.10 J/g, which is lower than 278.42 J/g (melting heat absorption of paraffin). This showed that pretreatment could reduce paraffin’s melting heat absorption.
(2) Paraffin released much heat at 180 °C to 290 °C and reached the maximum exothermic peak at 256 °C. This indicated that paraffin made the oxidative decomposition at 180 °C to 290 °C.
(3) Pretreated paraffin and HTPB achieved the first exothermic peak at 210 °C, which is 46 °C higher compared with that of paraffin, but pretreated paraffin’s heat release was lower than paraffin’s obviously. This indicated that pretreated paraffin’s first exothermic peak was not the result of oxidative decomposition and heat release, but the result of part of HTPB’s decomposition.
(4) Pretreated paraffin and HTPB released much heat at 350 °C to 620 °C. Pretreated paraffin reached the maximum exothermic peak at 386 °C and HTPB at 492 °C, which indicated that pretreated paraffin and HTPB had oxidative decomposition and released much heat at 350 °C to 620 °C.
Figure 3.
The DSC curves of Paraffin, Pretreated paraffin, and HTPB in O2.
Figure 3.
The DSC curves of Paraffin, Pretreated paraffin, and HTPB in O2.
3.4. DSC Thermal Analysis for Pretreated Paraffin under Different Pressures
The DSC experiment of pretreated paraffin was conducted at a heating rate of 20 °C/min under an air atmosphere and at different pressures. In
Figure 4, Curves 1, 2, 3 and 4 stand for the DSC curves of pretreated paraffin under 0.1 M Pa, 1.0 MPa, 2.0 MPa and 3.0 MPa.
Figure 4.
The DSC curves of pretreated paraffin in air with different pressures.
Figure 4.
The DSC curves of pretreated paraffin in air with different pressures.
(1) Pretreated paraffin’s initial reaction temperature dropped, and the exothermic peak of the reaction was reached in advance when the pressure increased from 0.1 MPa to 3 MPa. This indicates that as the pressure increased, the air concentration increased and the active oxygen concentration increased accordingly, which sped up the oxidation reaction and made the maximum exothermic peak advance.
(2) By comparing Curve 1 with Curve 2, it can be concluded that when the pressure increased from 0.1 MPa to 1 MPa, pretreated paraffin’s exothermic heat of reaction increased significantly from 1192.9 J/g to 5860.4 J/g. From Curve 3 and Curve 4, it can be concluded that when the pressure increases from 2 MPa to 3 MPa, pretreated paraffin’s exothermic heat of reaction increases from 8381.1 J/g to 9079.5 J/g, which is not very obvious.
Analysis suggested that pretreated paraffin was in the molten state when its decomposition characteristics were tested by the DSC method. In the beginning, increasing pressure could restrain pretreated paraffin’s volatilization and gasification, thus increasing the rate of the decomposition reaction and increasing heat release. Meanwhile, increasing pressure contributed to the heat transfer, which is detected by the DSC, and so, the increase in the amount of heat released is measured. When the pressure was high enough to inhibit pretreated paraffin’s volatilization and gasification completely, increasing pressure further would not have any effect on the heat of the reaction. Therefore, within certain limits, increasing pressure could improve the combustion efficiency of paraffin-based fuel.
3.5. DSC Thermal Analysis of Pretreated Paraffin under Different Heating Rates
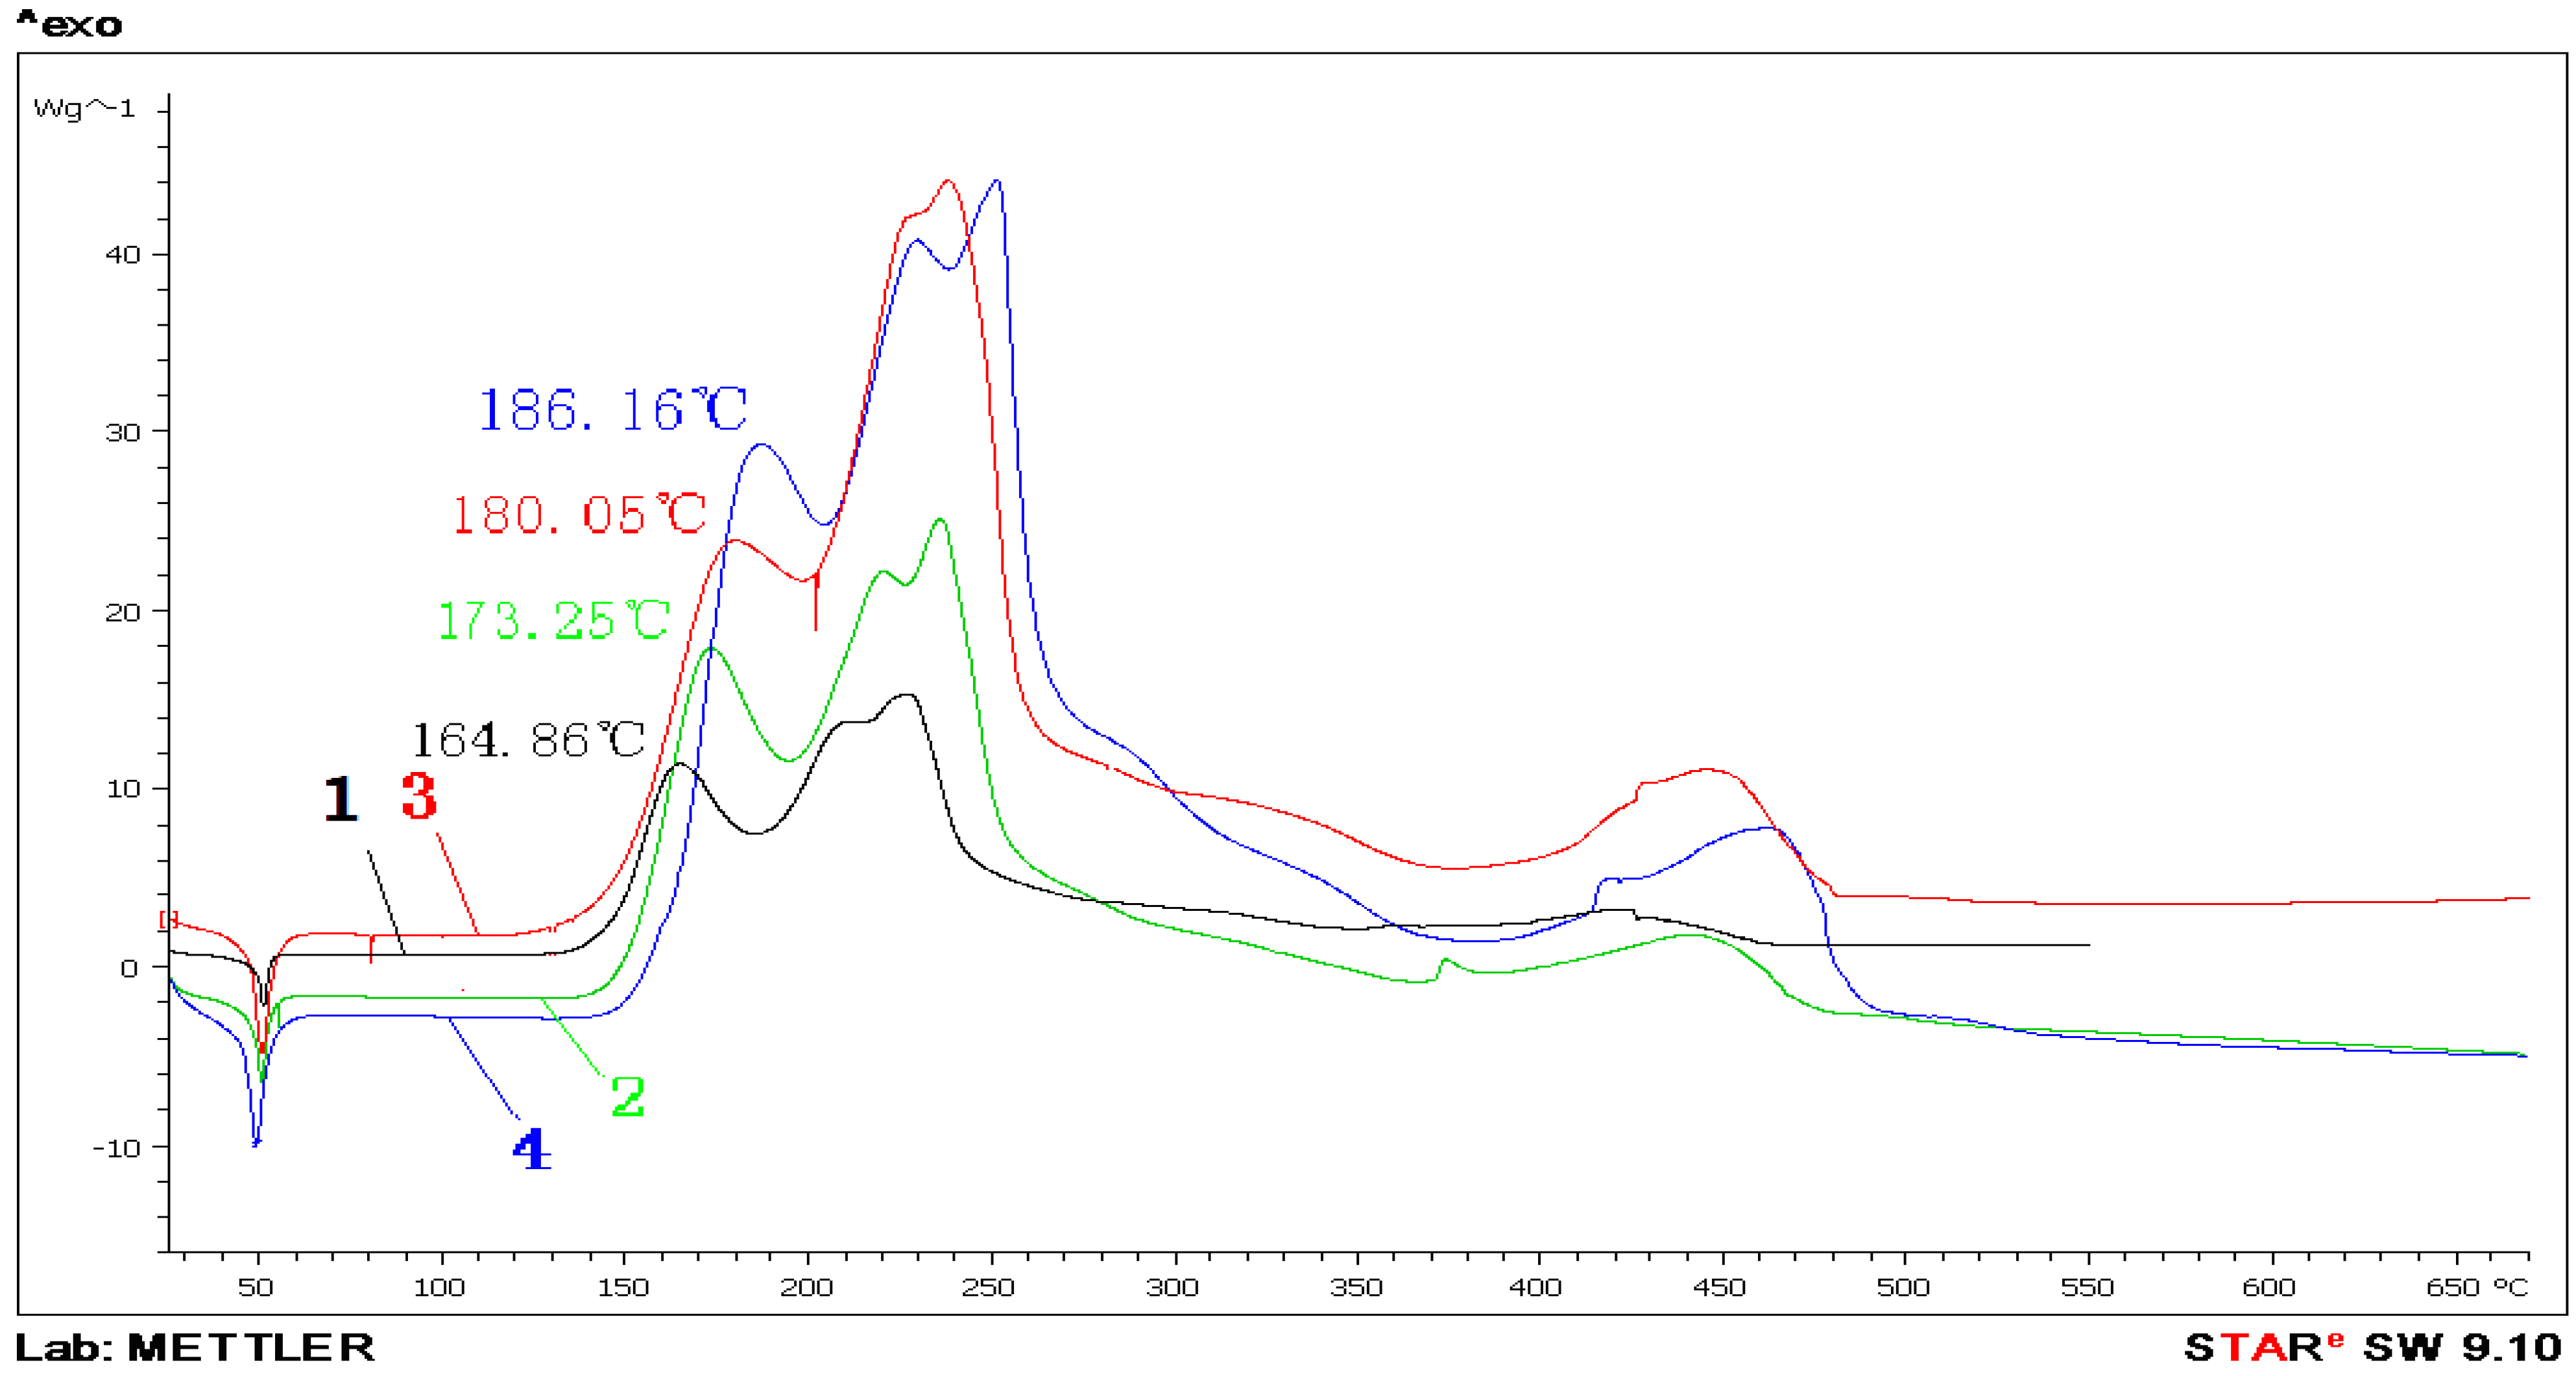
The DSC thermal analysis experiment for pretreated paraffin was made under different heating rates and an oxygen atmosphere. In
Figure 5, Curves 1, 2, 3 and 4 stand for the DSC curves of pretreated paraffin in O
2 under the heating rates of 5 °C/min, 10 °C/min, 15 °C/min and 20 °C/min, respectively.
Figure 5.
The DSC curves of pretreated paraffin in O2 with different heating rates.
Figure 5.
The DSC curves of pretreated paraffin in O2 with different heating rates.
(1) When the heating rate increased from 5 °C/min to 20 °C/min, pretreated paraffin’s endothermic peak temperature dropped from 51.6 °C to 49.8 °C. This shows that increasing the heating rate can bring the initial reaction temperature earlier.
(2) When the heating rate increased from 5 °C/min to 20 °C/min, the first exothermic peak temperature of pretreated paraffin increased from 164.86 °C to 186.16 °C. This showed that increasing the heating rate could delay the exothermic peak of reaction and increase the heat release.
3.6. The Kinetic Parameters of Pretreated Paraffin in an Oxygen Atmosphere
By thermal analysis experiment, the kinetic parameters of pretreated paraffin in an oxygen atmosphere were calculated, and the quantitative relation of the reaction rate constant and reaction temperature was obtained. In
Table 3, the characteristic results of pretreated paraffin at different heating rates by DSC are shown.
Table 3.
The characteristic results of pretreated paraffin in O2 by DSC.
Table 3.
The characteristic results of pretreated paraffin in O2 by DSC.
| β (°C/min) | Tp (K) | 1/Tp | lgβ | ln(β/Tp2) |
|---|
| 5 | 438 | 0.002283 | 0.699 | −10.5549 |
| 10 | 446 | 0.002240 | 1.000 | −9.8998 |
| 15 | 453 | 0.002207 | 1.176 | −9.5246 |
| 20 | 459 | 0.002177 | 1.301 | −9.2637 |
By the Kissinger and Ozawa methods [
15,
16], the relationship between ln(β/
Tp2)~1/
Tp and lgβ~1/
Tp was obtained as the following
Figure 6 and
Figure 7.
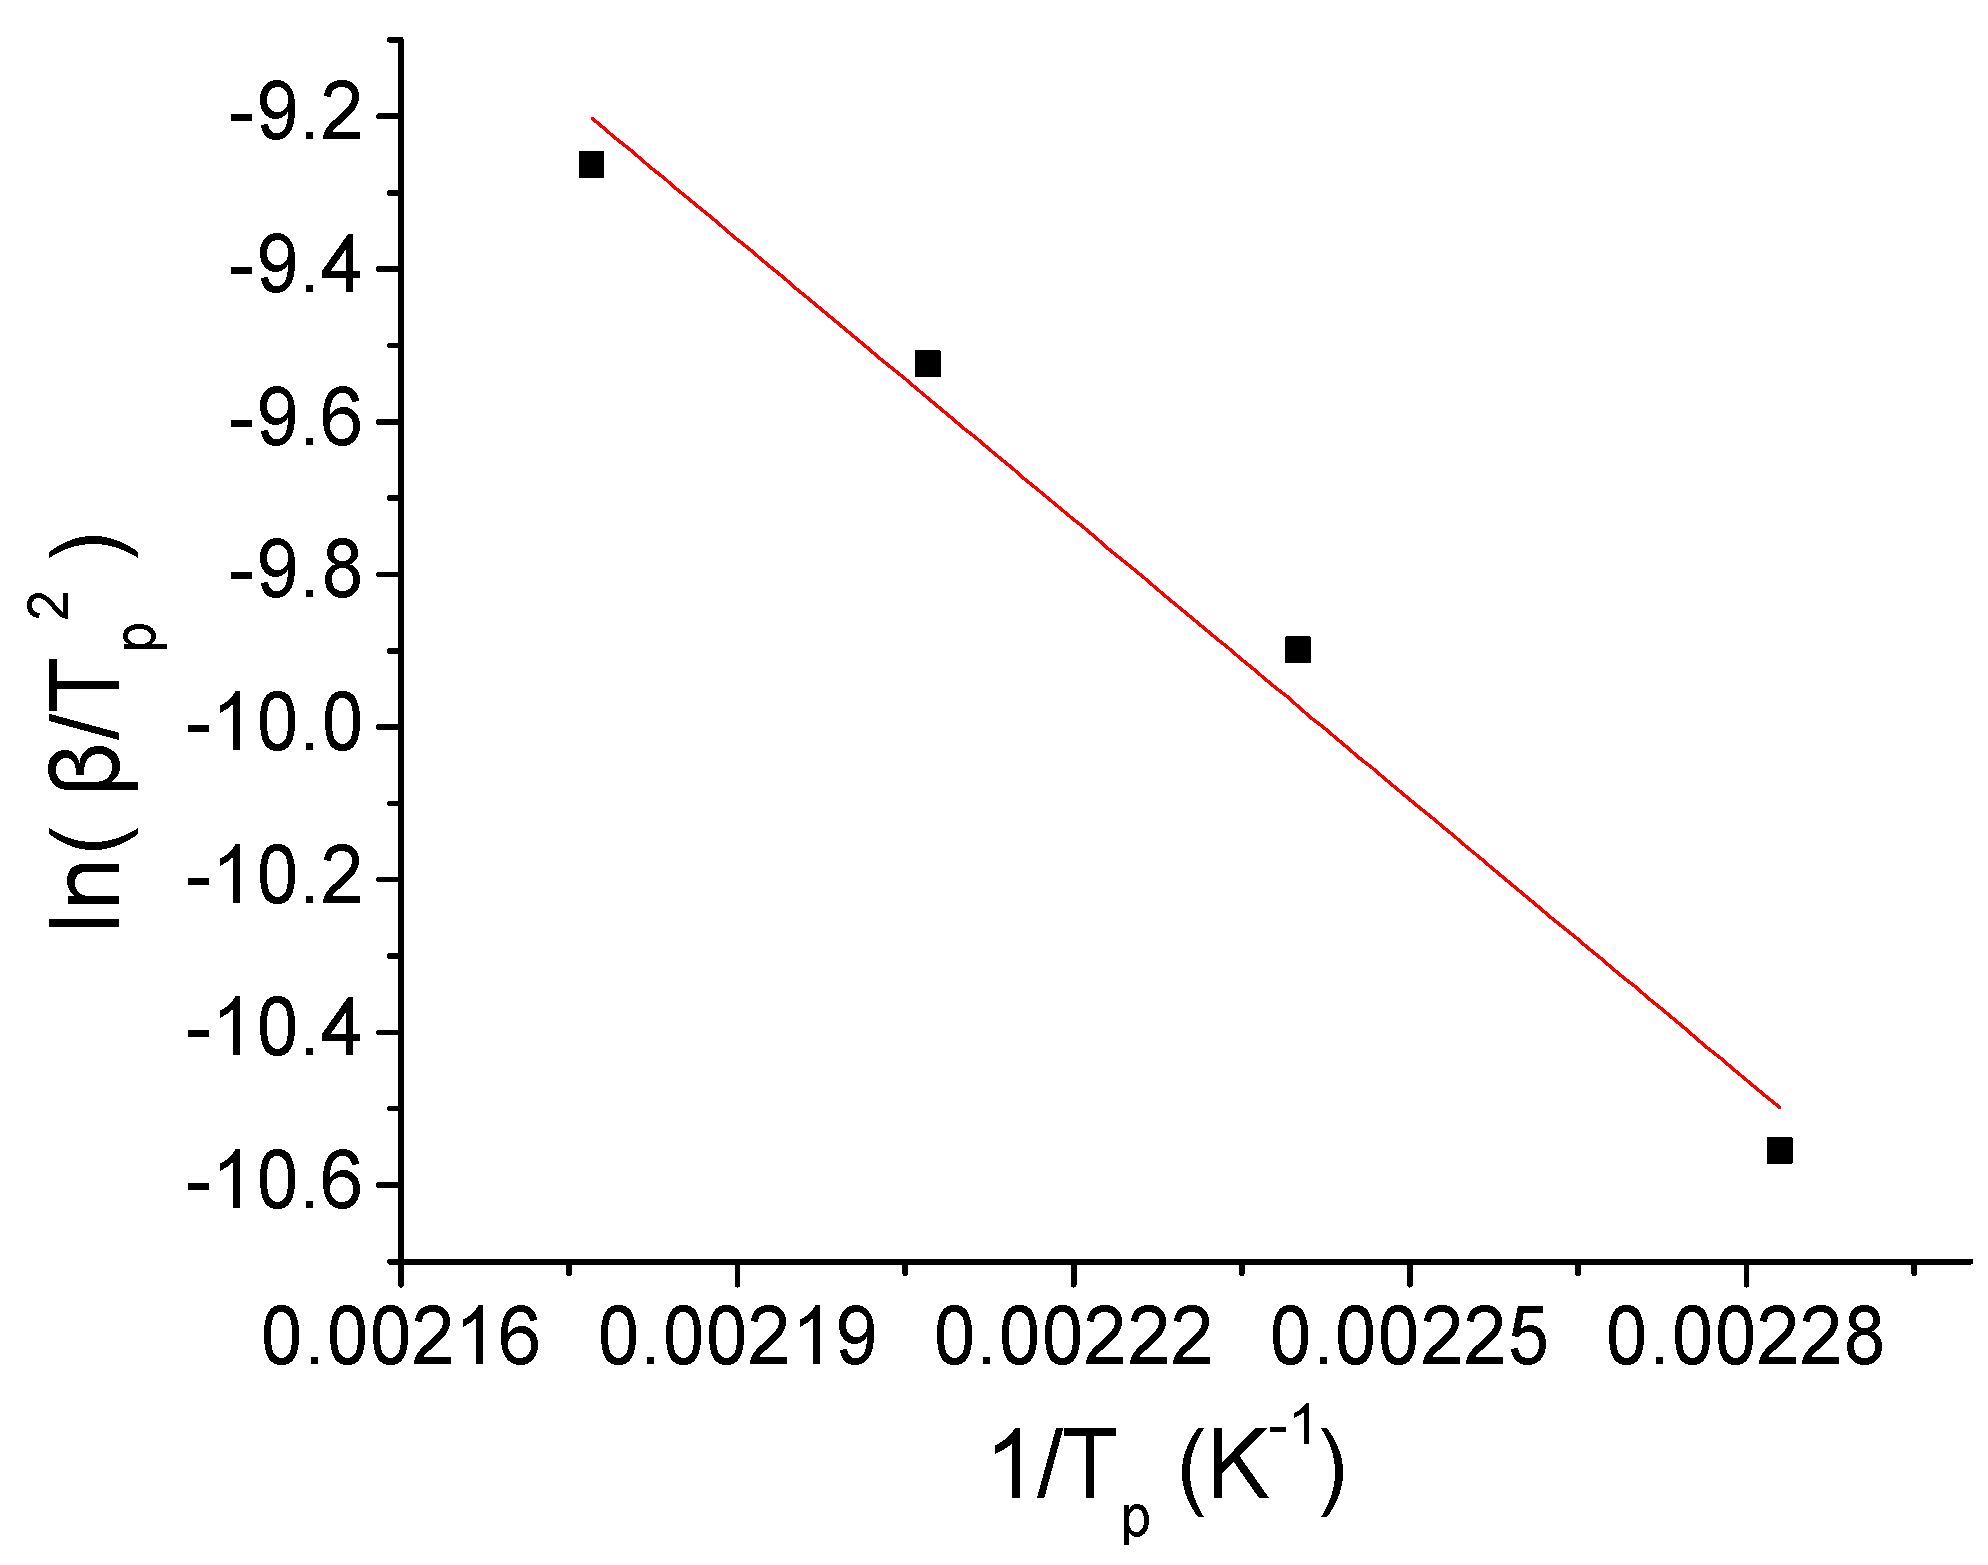
Figure 6.
Relationship between ln(β/Tp2) and 1/Tp.
Figure 6.
Relationship between ln(β/Tp2) and 1/Tp.
The relationship between ln(β/
Tp2) and 1/
Tp obtained by the Kissinger method [
15] can be expressed as the curve equation:
Y = 17.43 − 12233
X; the relationship between lgβ and 1/
Tp obtained by the Ozawa method [
16] can be expressed as the curve equation:
Y = 14.31 − 5955
X. By the slope and intercept of the equations above, the activation energy for the reaction and pre-exponential factor and the correlation coefficient could be calculated. It is shown as
Table 4.
Figure 7.
Relationship between lgβ and 1/Tp.
Figure 7.
Relationship between lgβ and 1/Tp.
Table 4.
Thermal reaction kinetic parameters of pretreated paraffin in O2.
Table 4.
Thermal reaction kinetic parameters of pretreated paraffin in O2.
| Method | E (KJ/mol) | A | R |
|---|
| Kissinger’s | 101.72 | 4.53382 × 10¹¹ | 0.99 |
| Ozawa’s | 108.39 | — | 0.99 |
Table 4 shows that the values of activation energy obtained by the Kissinger method and the Ozawa method are almost in the same order of magnitude, and the correlation coefficients are both 0.99. By the Kissinger method,
E is 101.72 KJ/mol, and pre-exponential factor
A is 4.53382 × 10
11; by the Ozawa method,
E is 108.39 KJ/mol. The activation energy obtained by the Kissinger method is lower than that by the Ozawa method mainly because the Kissinger method provided a reaction mechanism f(
a) = (1 −
a)
n in advance, and the kinetic parameters obtained by this method are relatively consistent with the truth.
4. Paraffin-Based Fuel Thermal Degradation Characteristics Analysis
4.1. Experimental Samples
In this paper, the formulations Sample 0, Sample 2, Sample 4 and Sample 5 of paraffin-based fuel in
Table 1 were chosen as samples. These four experimental samples should be put into the crucibles and sealed with covers, respectively, and then, thermal analysis should be done by the TG and DSC techniques under an atmosphere of air, nitrogen and oxygen. The measurements were made under a dynamic atmosphere with a gas flow rate of 20 mL/min. According to the different experimental requirements, the concrete experimental program was as follows:
(1) The TG experiment was conducted at a heating rate of 25 °C/min under normal pressure and air atmosphere.
(2) The DSC experiment was conducted at a heating rate of 25 °C/min under normal pressure and air atmosphere.
(3) The DSC experiment for Sample 5 paraffin-based fuel was conducted under normal pressure and an air atmosphere at heating rates of 5 °C/min, 10 °C/min, 20 °C/min and 40 °C/min, respectively.
(4) The DSC experiment for Sample 5 paraffin-based fuel was conducted under normal pressure and an oxygen atmosphere at heating rates of 5 °C/min, 10 °C/min, 20 °C/min and 40 °C/min, respectively.
4.2. HTPB Fuel Thermal Analysis
The TG and DSC thermal analysis experiments for Sample 0 HTPB fuel were conducted at a heating rate of 25 °C/min under normal pressure and an air atmosphere. The testing curves are shown in
Figure 8 and
Figure 9.
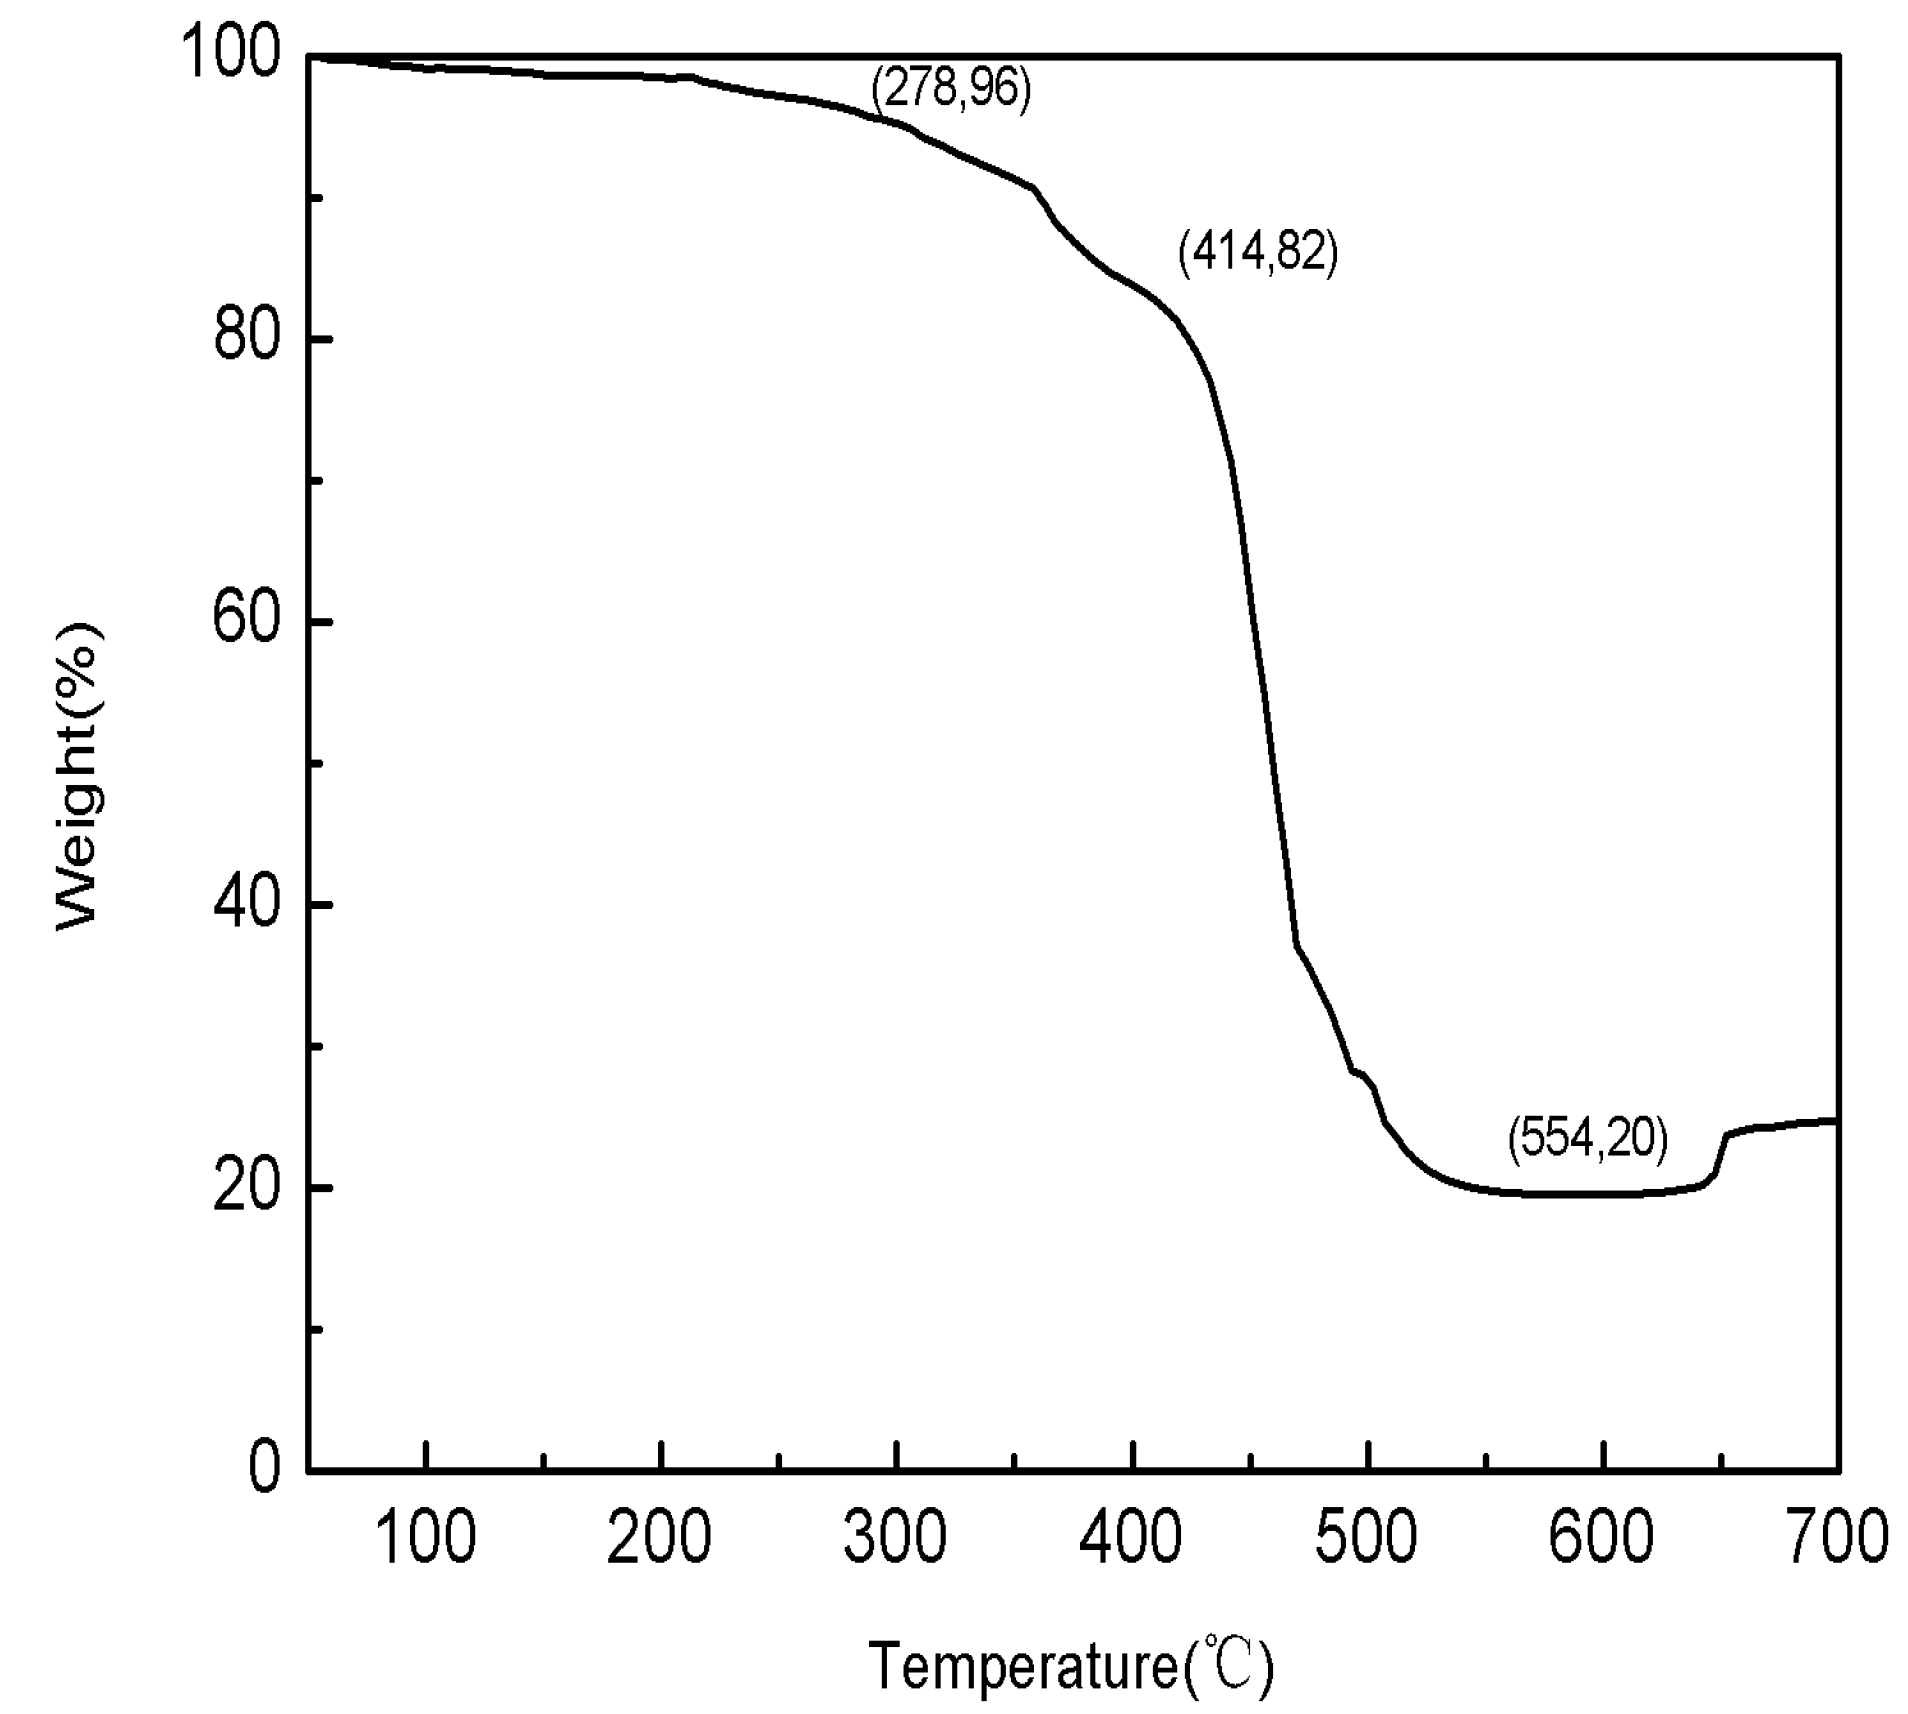
Figure 8.
The TG curve of Sample 0 HTPB fuel.
Figure 8.
The TG curve of Sample 0 HTPB fuel.
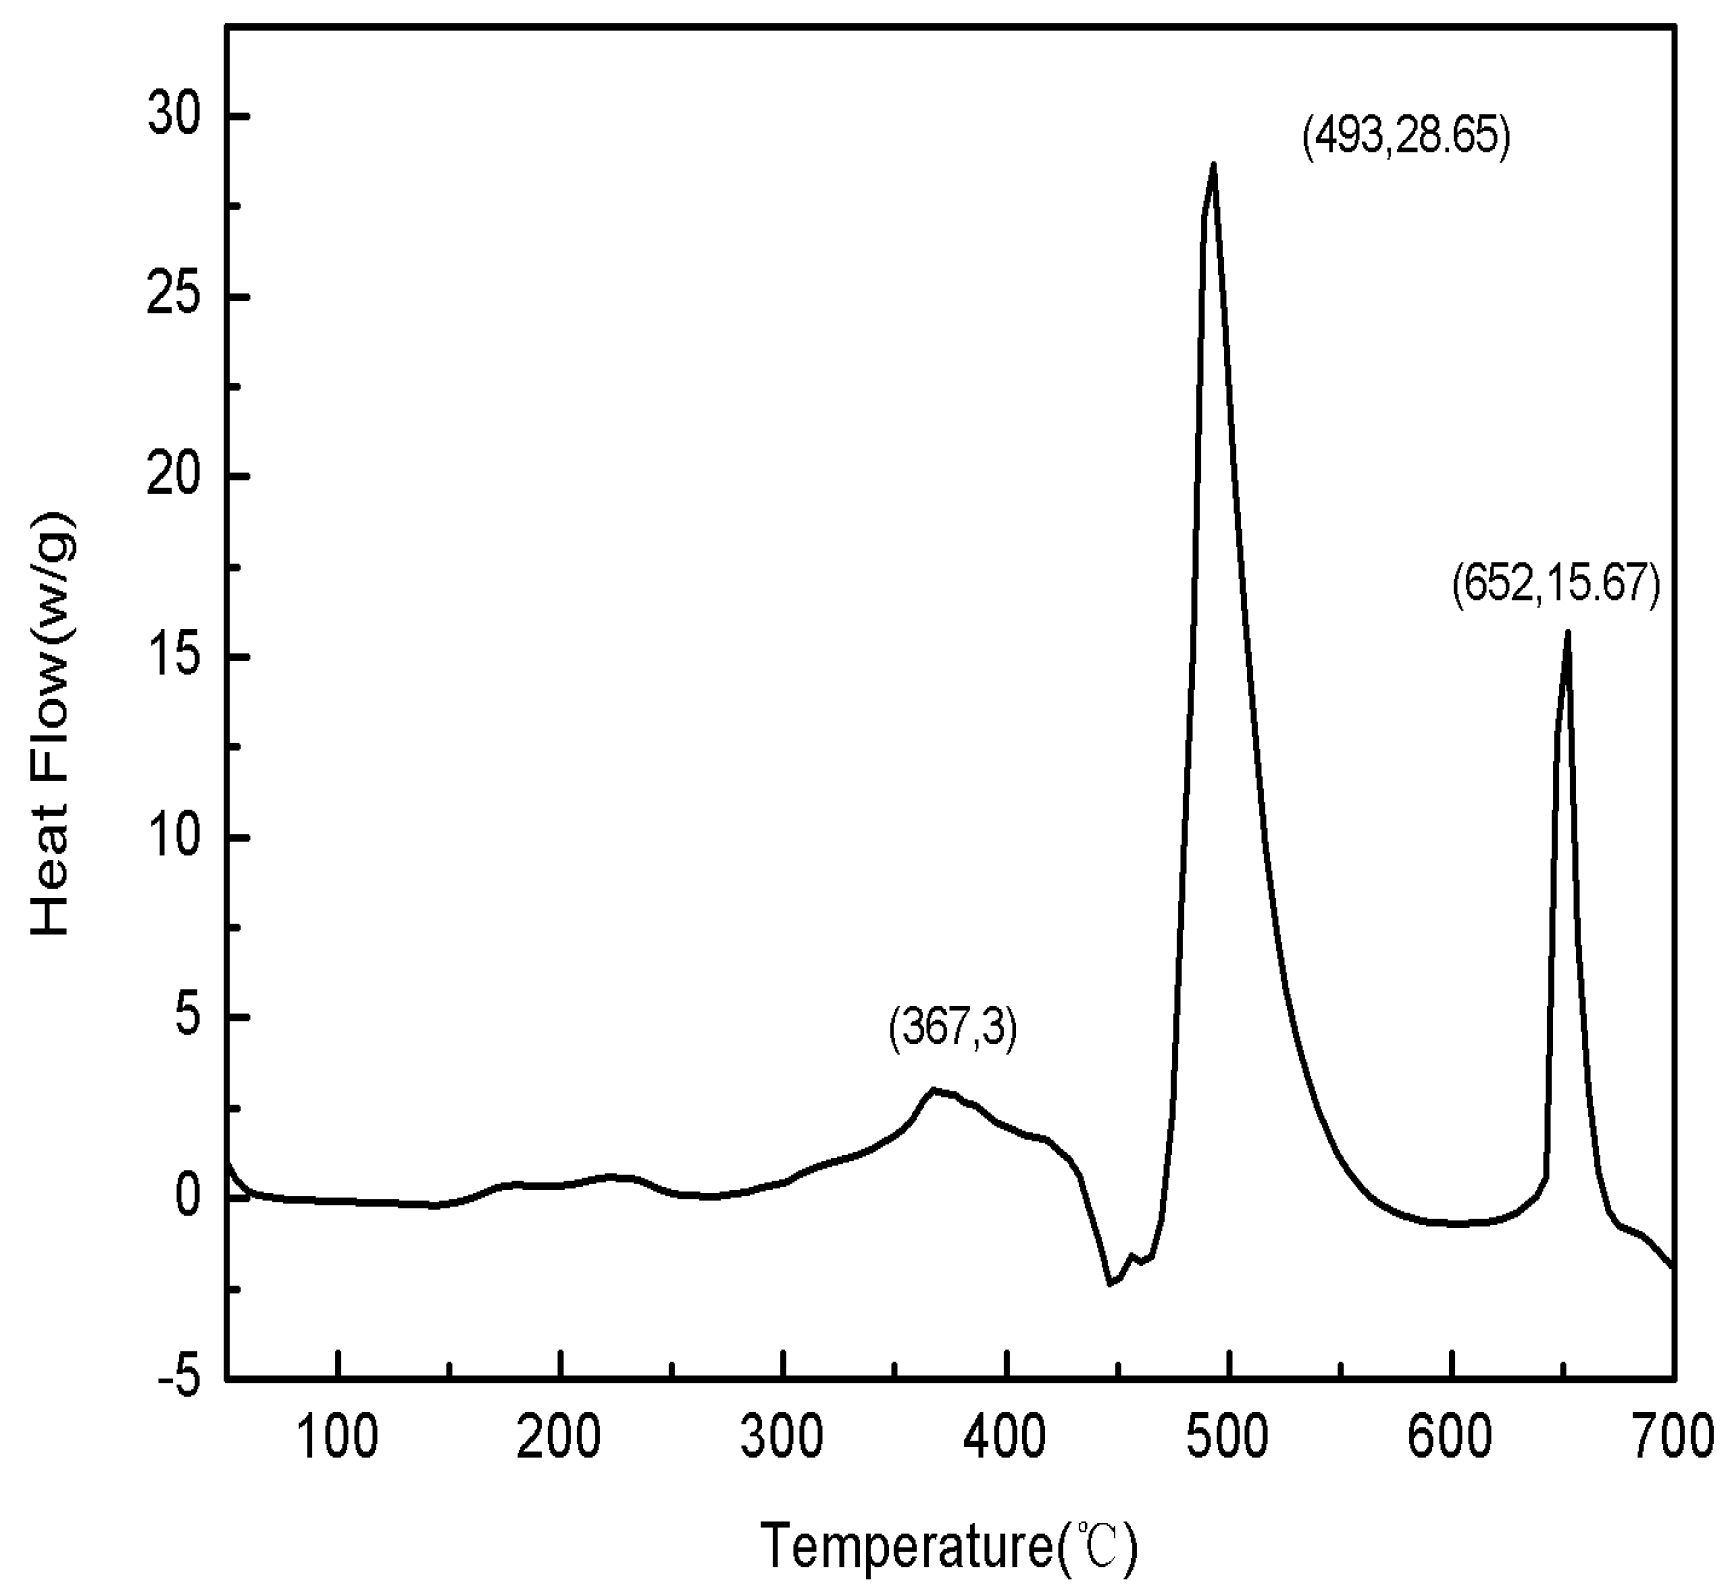
Figure 9.
The DSC curve of Sample 0 HTPB fuel.
Figure 9.
The DSC curve of Sample 0 HTPB fuel.
(1) In an air atmosphere, Sample 0 fuel’s thermal decomposition included three phases: 278–414 °C was the first phase, in which it was mainly the thermal decomposition of AP and low temperature decomposition of HTPB with a weight loss rate of about 14%; 414–550 °C was the second phase, in which it was mainly thermal decomposition of HTPB at a high temperature with a weight loss of about 62%; 640–680 °C was the third phase, in which it was mainly the reaction between Mg and the oxygen in the air with a weight gain rate of about 8%.
(2) In an air atmosphere, Sample 0 fuel’s thermal decomposition mainly had two exothermic decomposition peaks and one oxidation exothermic peak: the first exothermic decomposition peak temperature was 367 °C, and the release heat was about 983 J/g; the second exothermic decomposition peak temperature was 493 °C, and the release heat was about 3226 J/g; the oxidation exothermic peak temperature was 652 °C, and the release heat was about 637 J/g.
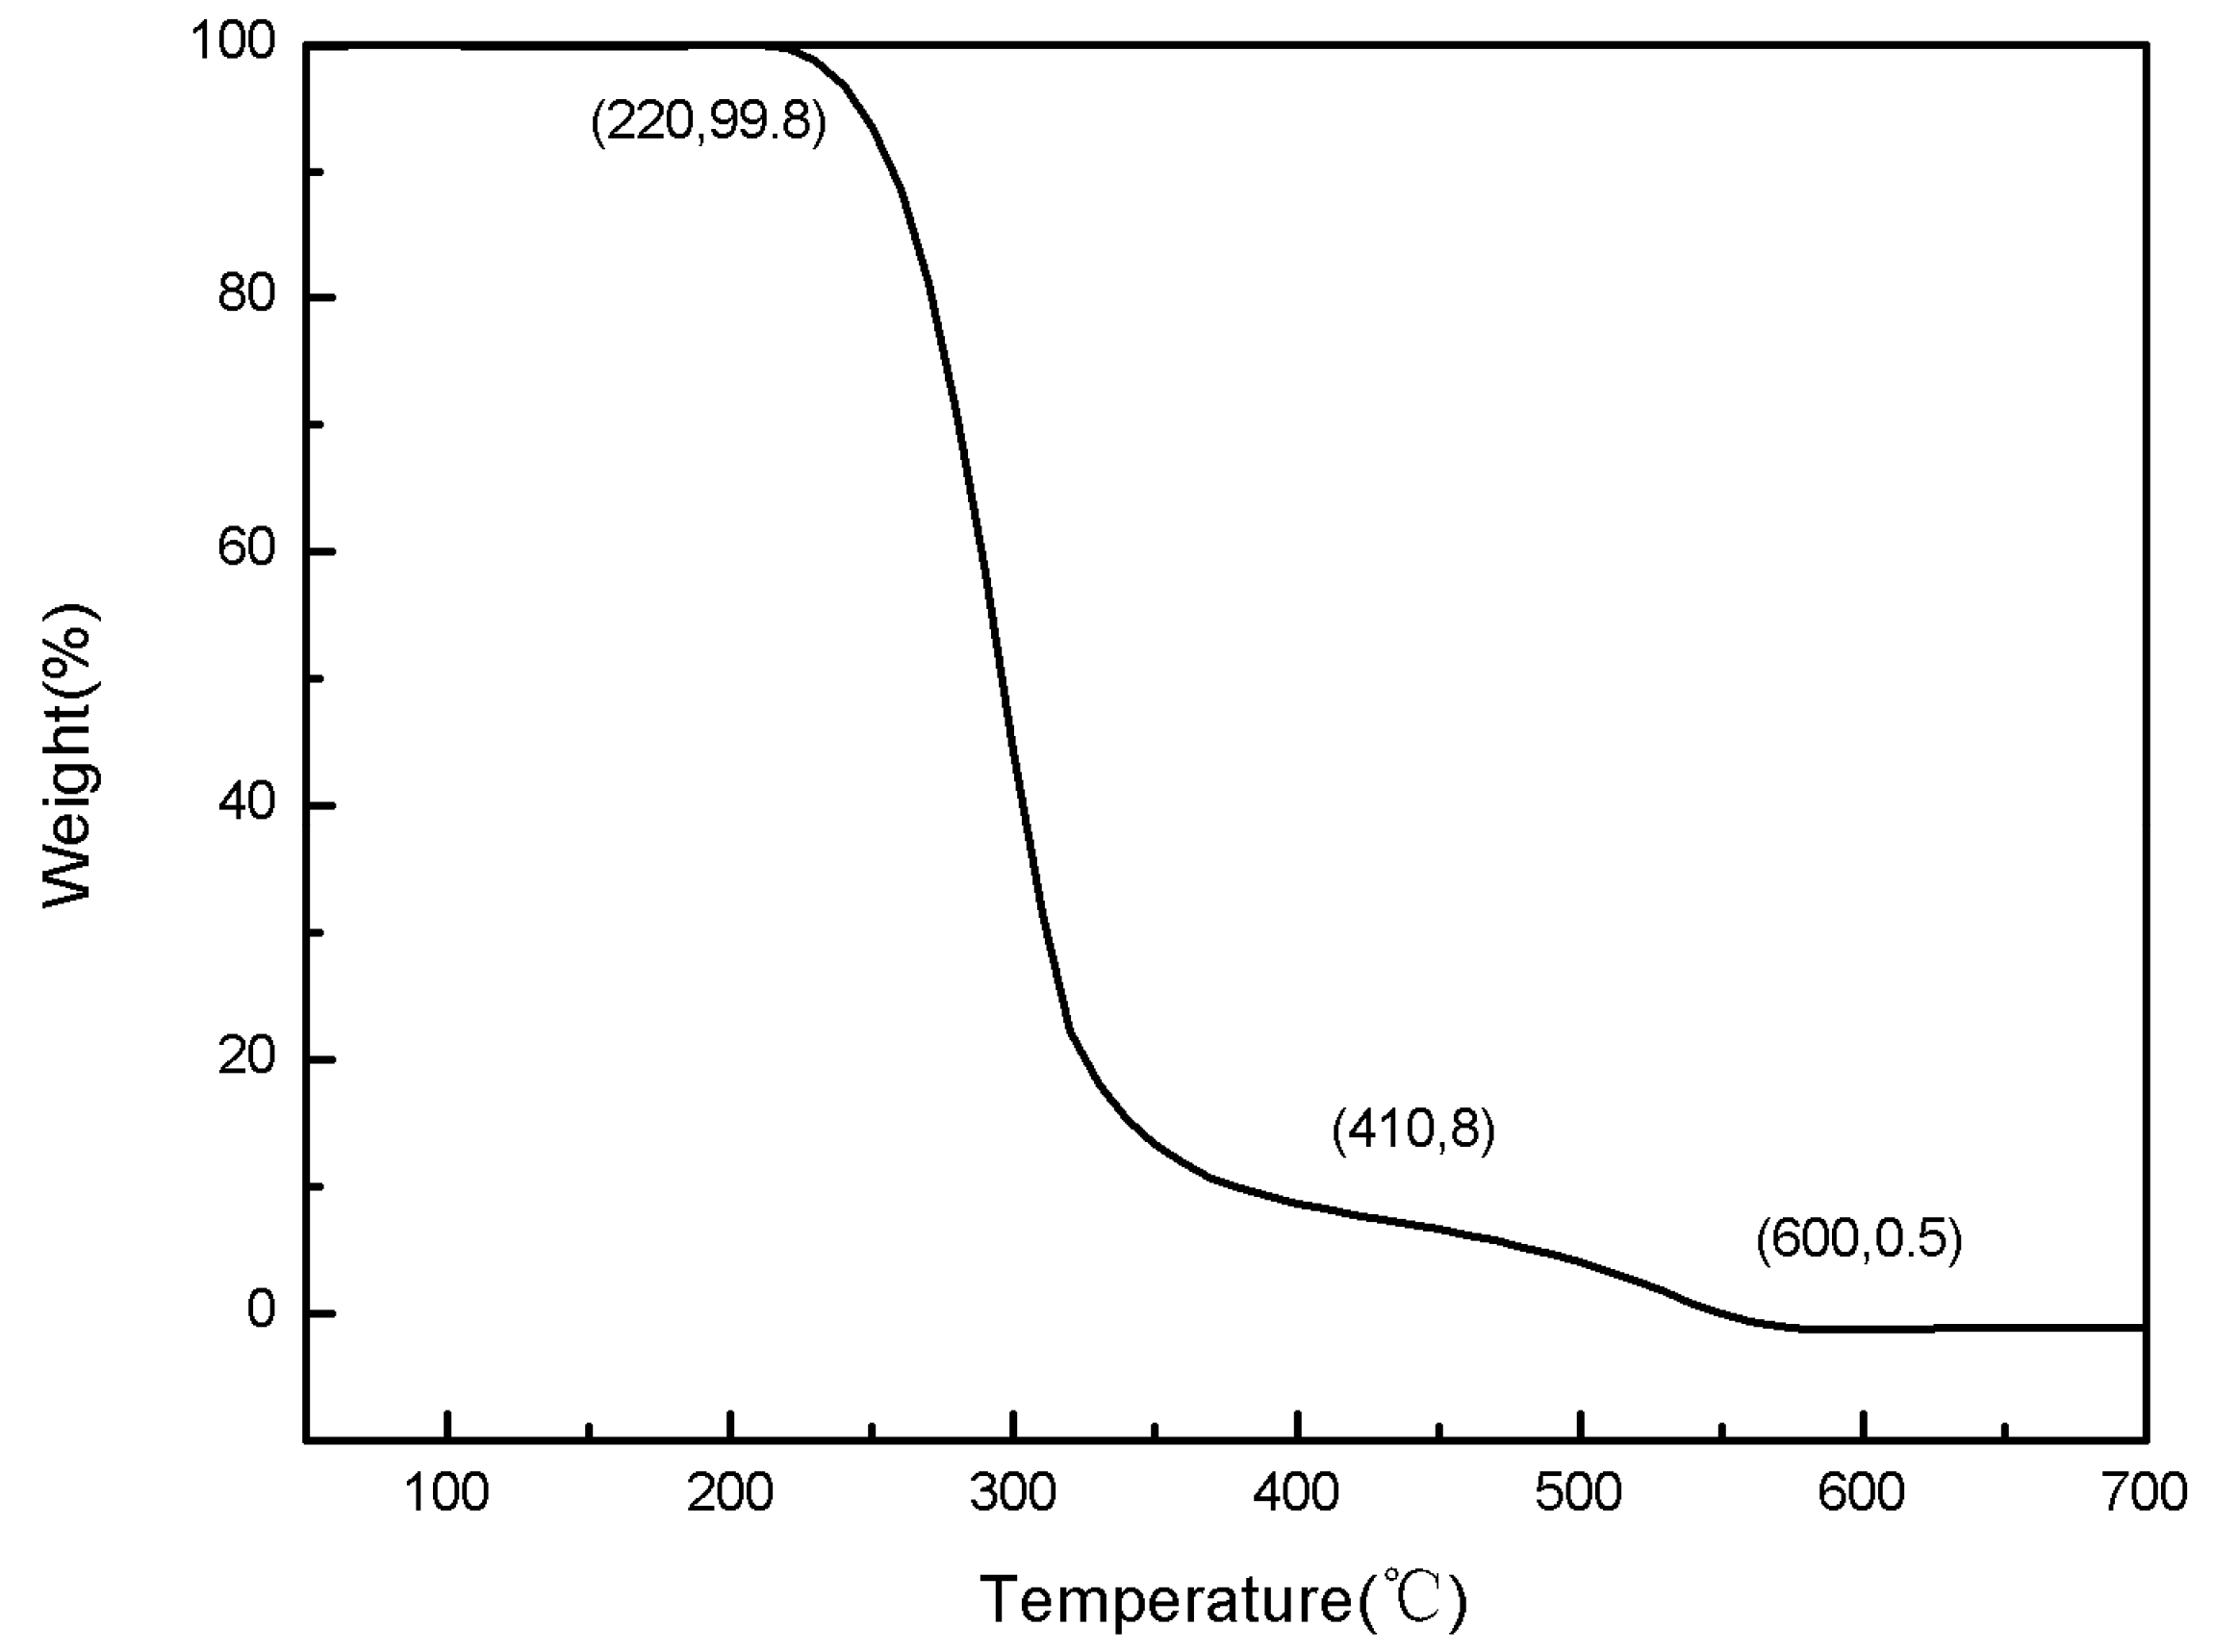
4.3. Paraffin Thermal Analysis
The TG and DSC thermal analysis experiments for paraffin were made at a heating rate of 25 °C/min under normal pressure and an air atmosphere. The testing curves are shown in
Figure 10 and
Figure 11.
Figure 10.
The TG curves of paraffin.
Figure 10.
The TG curves of paraffin.
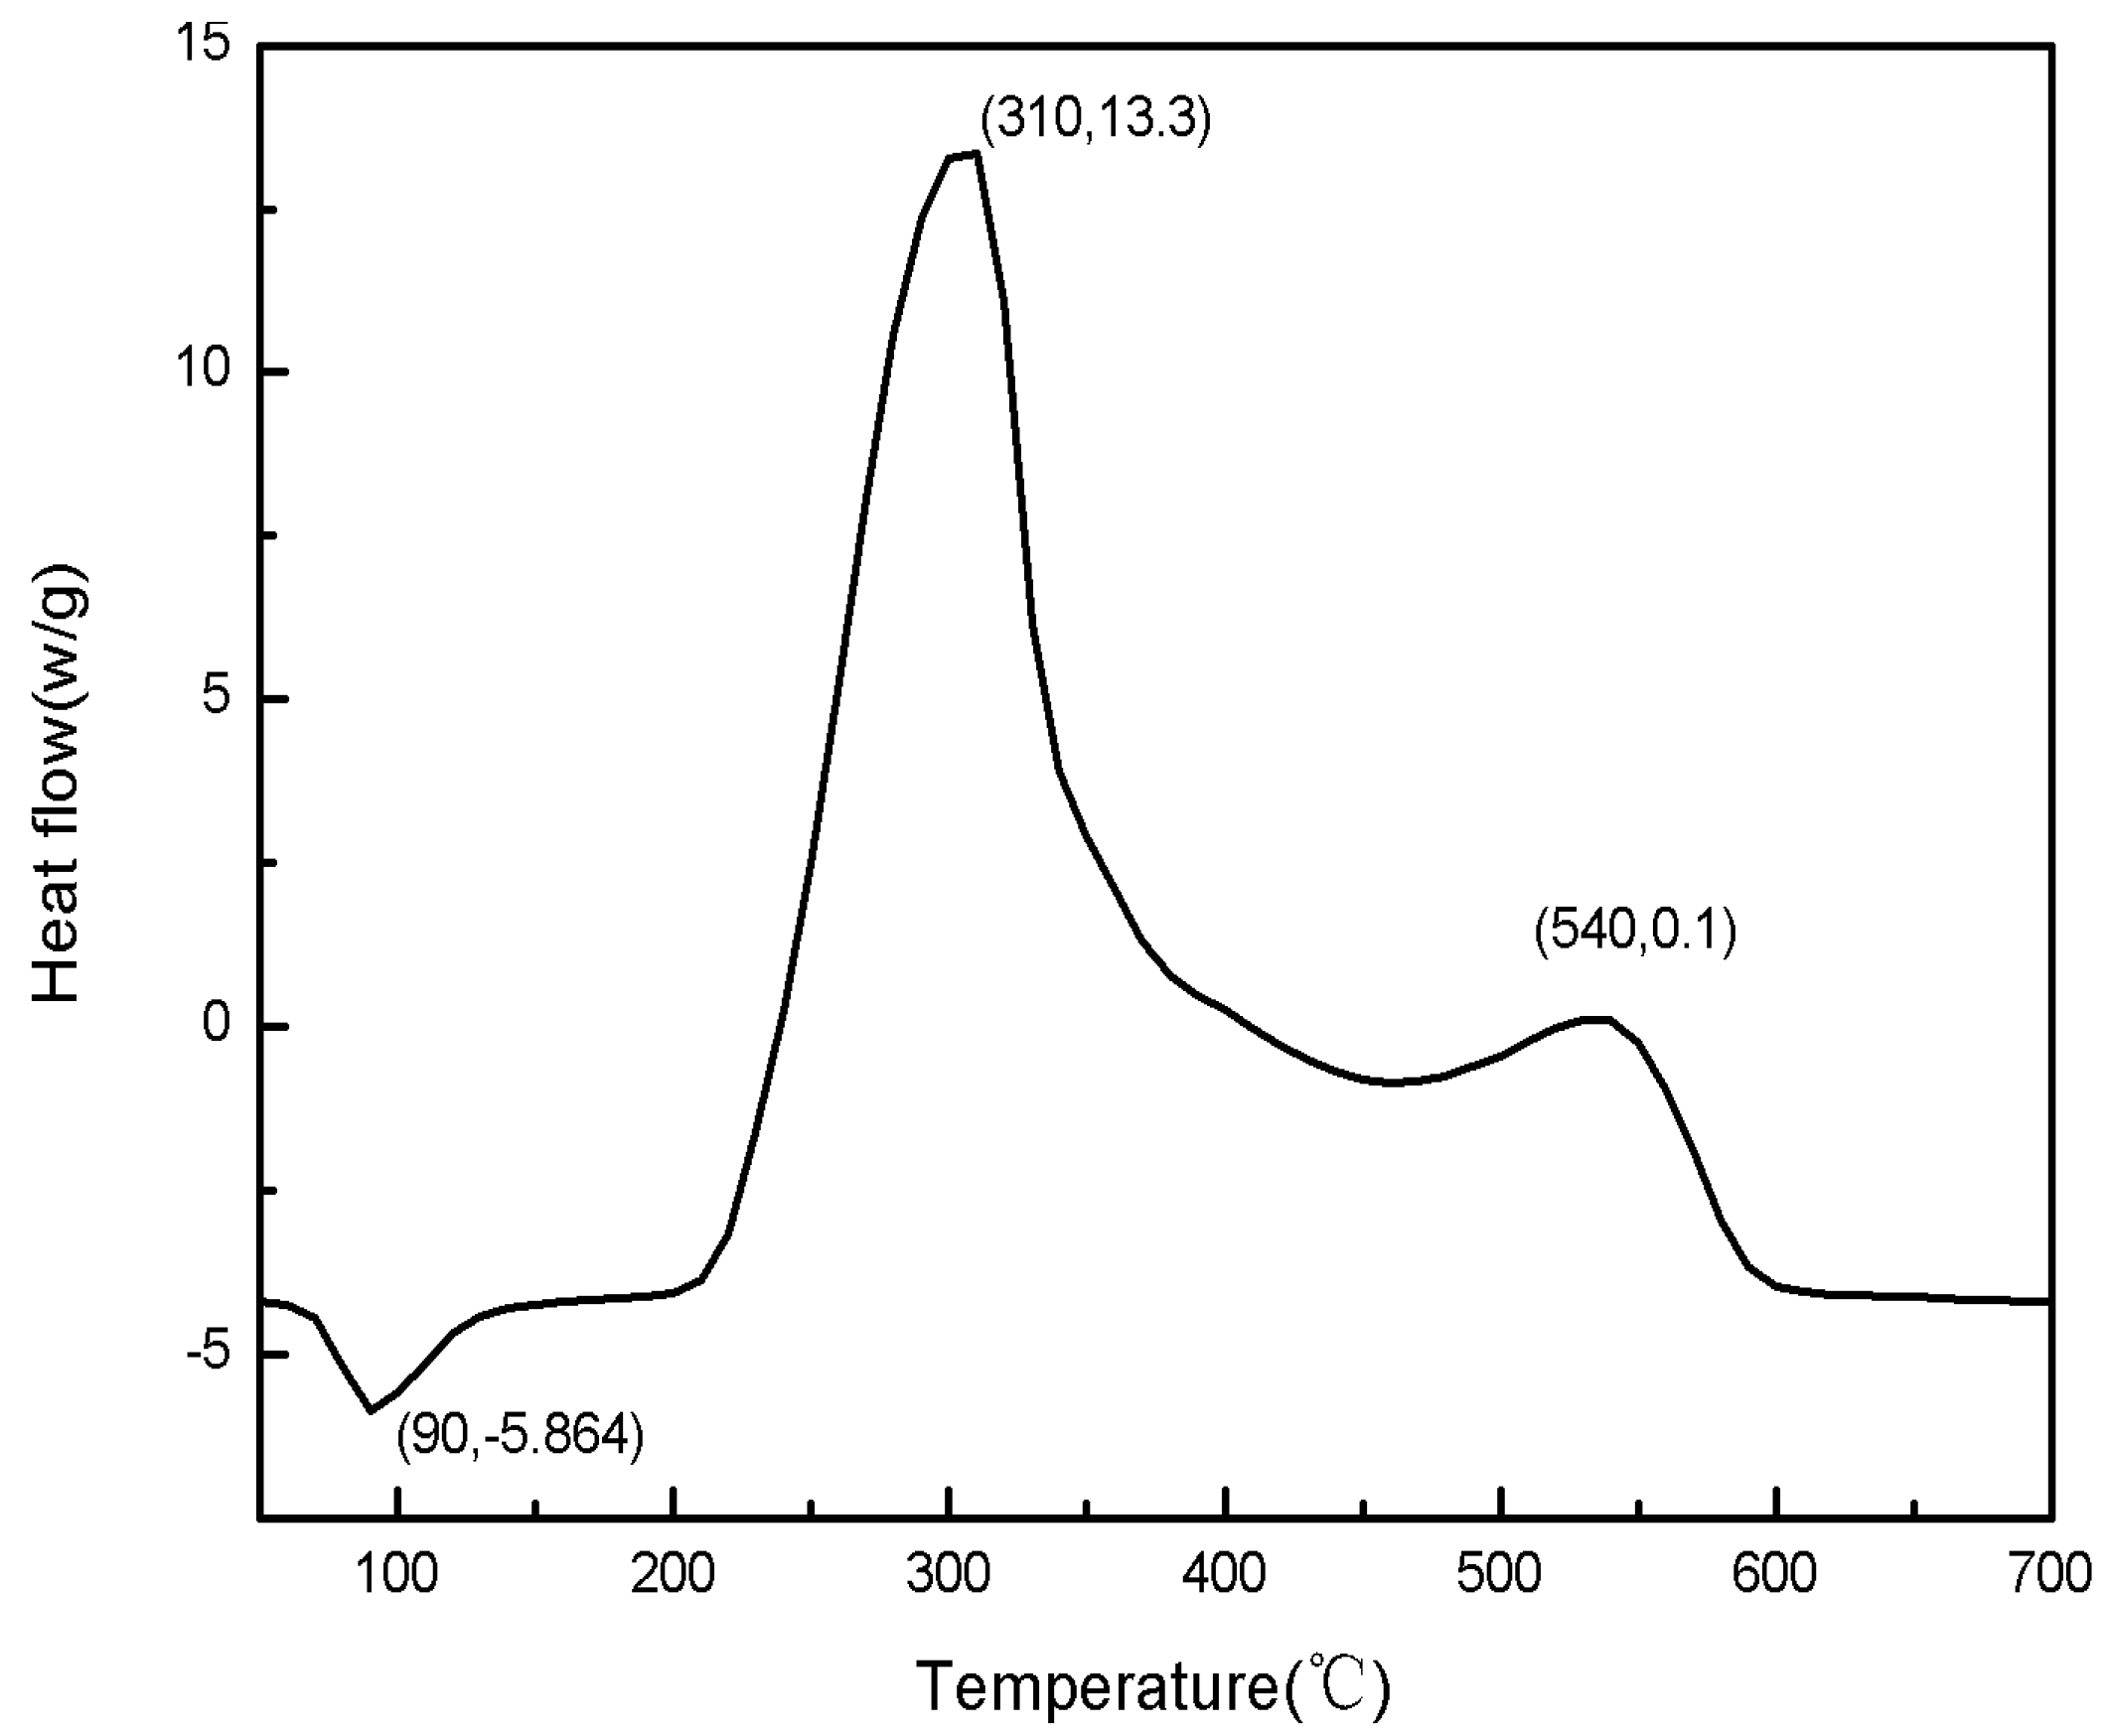
Figure 11.
The DSC curves of paraffin.
Figure 11.
The DSC curves of paraffin.
(1) In an air atmosphere, paraffin’s thermal decomposition included two phases: 220–410 °C was the first phase, in which it was the rapid thermal decomposition of paraffin with a weight loss rate of about 92%; 410–600 °C was the second phase, in which it was the slow thermal decomposition of paraffin with a weight loss rate of about 8%.
(2) In an air atmosphere, paraffin’s thermal decomposition mainly had a melting endothermic peak and two exothermic decomposition peaks: there was an obvious endothermic peak in the DSC curve at 90 °C, while there was no obvious change in the TG curve at the same temperature, and this endothermic peak was paraffin’s melting with about 83 J/g of heat absorption; the first exothermic peak temperature was 310 °C, and the release heat was about 1506 J/g; the second exothermic peak temperature was 540 °C, and the release heat was about 257 J/g.
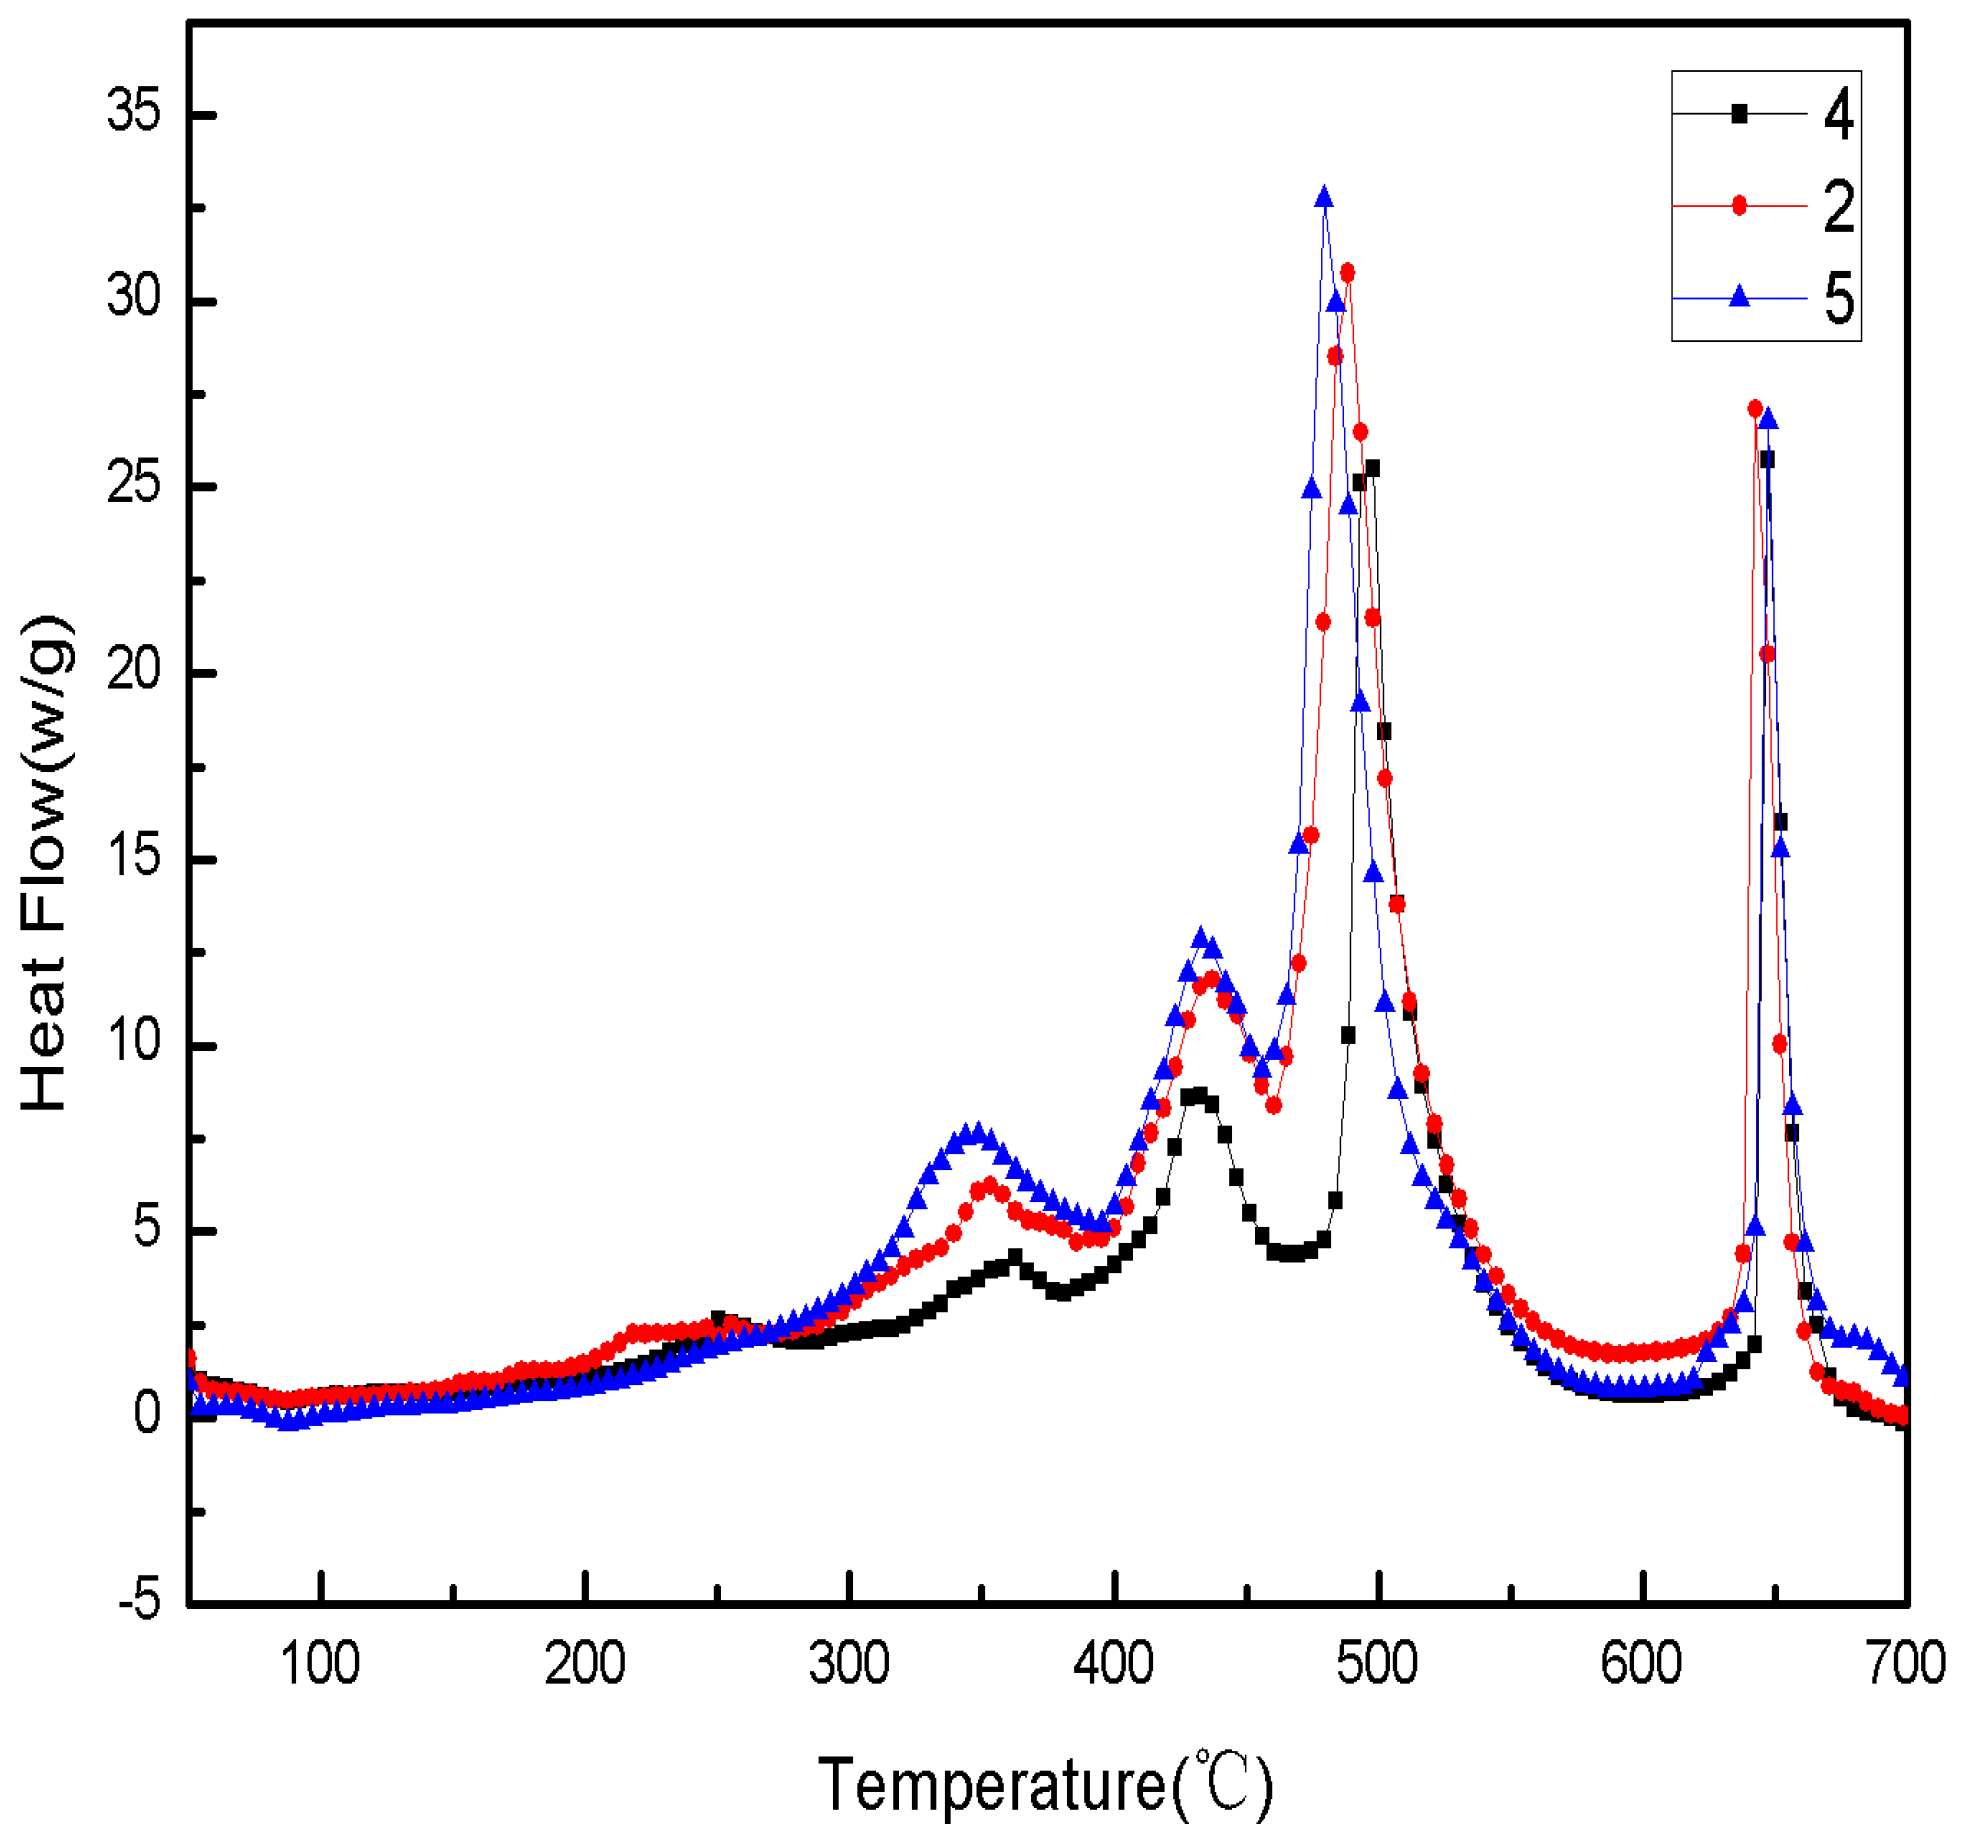
4.4. Different Contents of Paraffin-Based Fuel Thermal Analysis in an Air Atmosphere
The TG and DSC thermal analysis experiments for Sample 4, Sample 2 and Sample 5 paraffin-based fuels samples were conducted, with paraffin contents of 15%, 25% and 35%, respectively, under normal pressure and air atmosphere. The testing curves are shown in
Figure 12 and
Figure 13.
Figure 12.
The TG curves of paraffin-based fuel.
Figure 12.
The TG curves of paraffin-based fuel.
(1) In an air atmosphere, paraffin-based fuel’s thermal decomposition included four phases: 250–400 °C was the first phase, in which it was mainly the low temperature decomposition of paraffin and AP; 400–480 °C was the second phase, in which there was a slow thermal decomposition of paraffin; 480–580 °C was the third phase, in which there was a thermal decomposition of HTPB and paraffin at a high temperature; 630–700 °C was the fourth phase, in which it was the reaction between Mg and the oxygen at a high temperature.
(2) In an air atmosphere, the thermal decomposition of Sample 4, Sample 2 and Sample 5 paraffin-based fuel samples mainly had three exothermic decomposition peaks and one oxidation exothermic peak: the first exothermic decomposition peak temperature was 362 °C, 353 °C and 348 °C, respectively, and the heat release was about 78 J/g, 226 J/g and 320 J/g, respectively; the third exothermic decomposition peak temperature was 498 °C, 488 °C and 479 °C, respectively, and the heat release was about 1178 J/g, 1236 J/g and 1442 J/g. With the increasing of paraffin contents in Sample 4, Sample 2 and Sample 5 paraffin-based fuel, the exothermic peak of the reaction was reached in advance gradually, and the heat release increased continuously. However, the second exothermic decomposition peak and heat release of paraffin-based fuel and the exothermic decomposition peak and heat release from the reaction between Mg and the oxygen changed insignificantly.
Figure 13.
The DSC curves of paraffin-based fuel.
Figure 13.
The DSC curves of paraffin-based fuel.
4.5. DSC Thermal Analysis of Paraffin-Based Fuel at Different Heating Rates
The DSC thermal analysis for Sample 5 paraffin-based fuel was conducted at the heating rate of 5 °C/min, 10 °C/min, 20 °C/min and 40 °C/min under normal pressure and an air atmosphere. The testing curves are shown in
Figure 14.
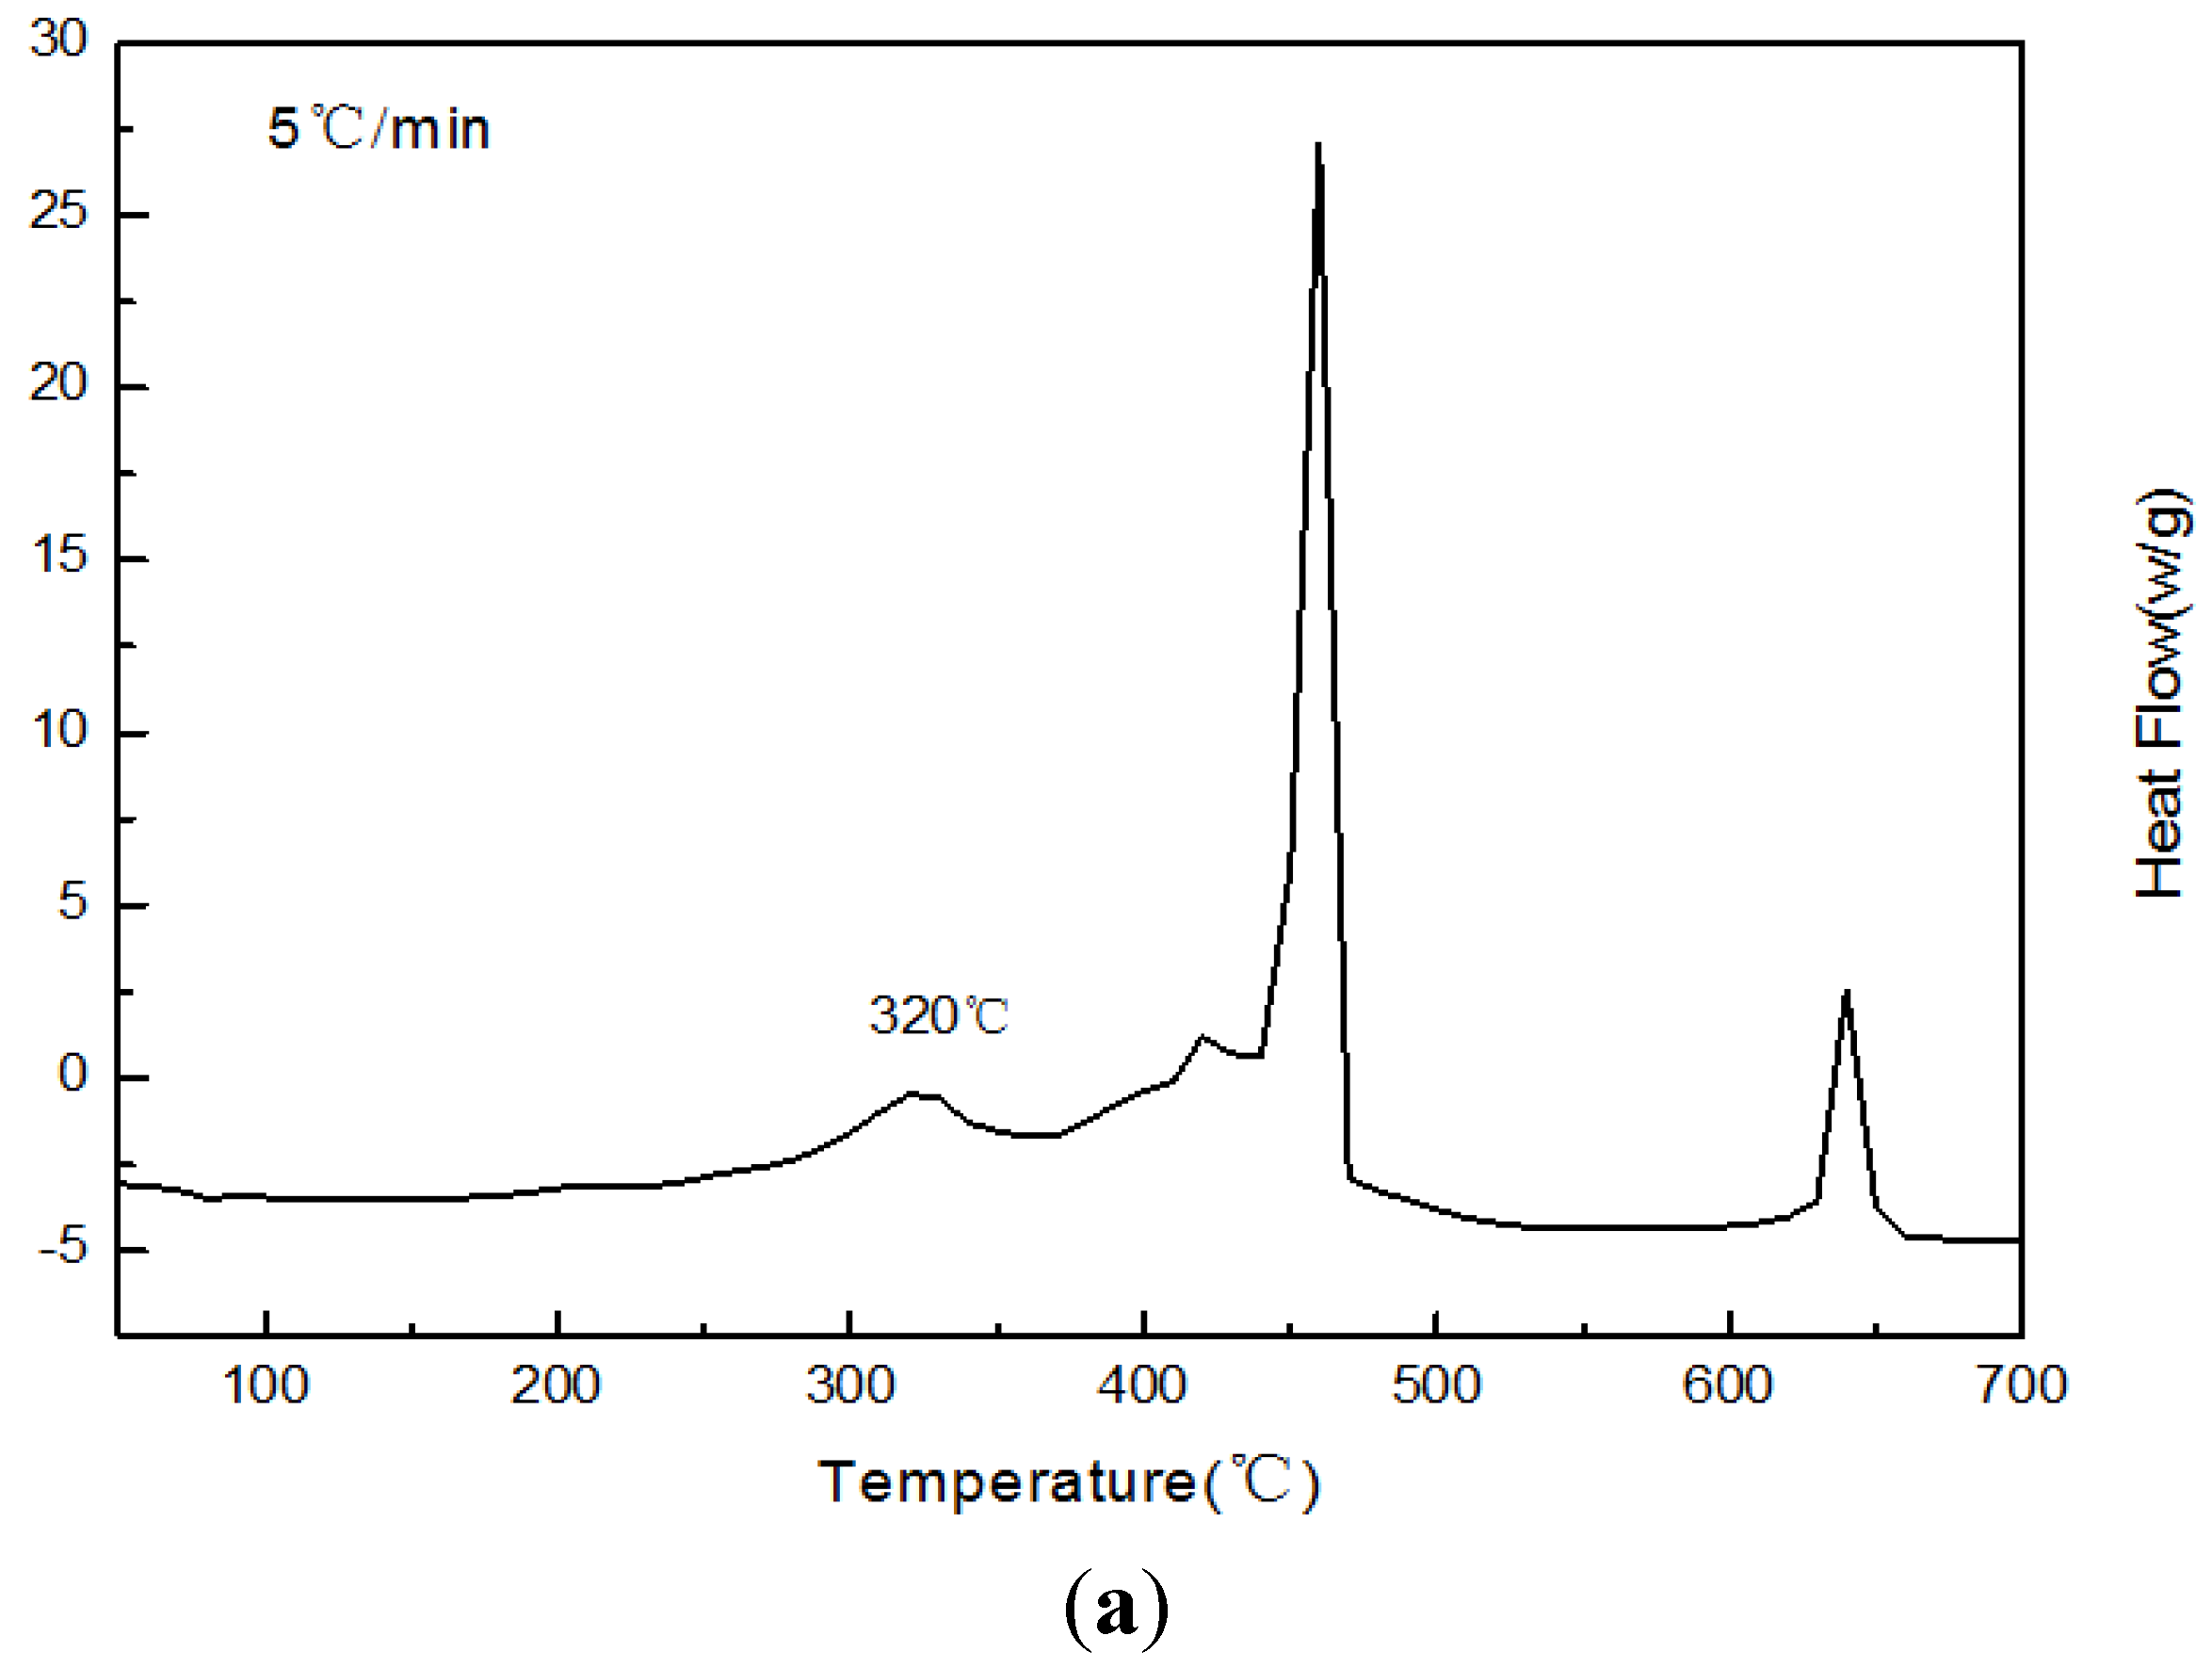
Figure 14.
The DSC curves of Sample 5 paraffin-based fuel in different heating rates. (a) A heating rate of 5 °C/min; (b) a heating rate of 10 °C/min; (c) a heating rate of 20 °C/min; (d) a heating rate of 40 °C/min.
Figure 14.
The DSC curves of Sample 5 paraffin-based fuel in different heating rates. (a) A heating rate of 5 °C/min; (b) a heating rate of 10 °C/min; (c) a heating rate of 20 °C/min; (d) a heating rate of 40 °C/min.
The DSC curves of Sample 5 paraffin-based fuel in
Figure 14 show:
The initial exothermic peak temperature would be 320 °C, 350 °C, 360 °C and 370 °C, respectively, when the heating rate was 5 °C/min, 10 °C/min, 15 °C/min and 20 °C/min. With the increase of the heating rate, the initial exothermic peak of reaction would increase gradually, and the heat release would increase continuously.
4.6. The Kinetic Parameters of Paraffin-Based Fuel in an Oxygen Atmosphere
By thermogravimetric analysis, the kinetic parameters of paraffin-based fuel in an oxygen atmosphere were calculated, and the quantitative relation of the reaction rate constant and reaction temperature was obtained. In
Table 5, the characteristic results of Sample 5 paraffin-based fuel at different heating rates by DSC are shown.
Table 5.
Thermal reaction kinetic parameters of Sample 5 paraffin-based fuel in O2 by DSC.
Table 5.
Thermal reaction kinetic parameters of Sample 5 paraffin-based fuel in O2 by DSC.
| β (°C/min) | Tp (K) | 1/Tp | lgβ | ln(β/Tp2) |
|---|
| 5 | 593 | 0.001686 | 0.699 | −11.1610 |
| 10 | 623 | 0.001605 | 1.000 | −10.5665 |
| 20 | 633 | 0.001580 | 1.301 | −9.9052 |
| 40 | 643 | 0.001555 | 1.602 | −9.2434 |
By the Kissinger and Ozawa methods, the relationship between ln(β/
Tp2)~1/
Tp and lgβ~1/
Tp was obtained as the following
Figure 15 and
Figure 16.
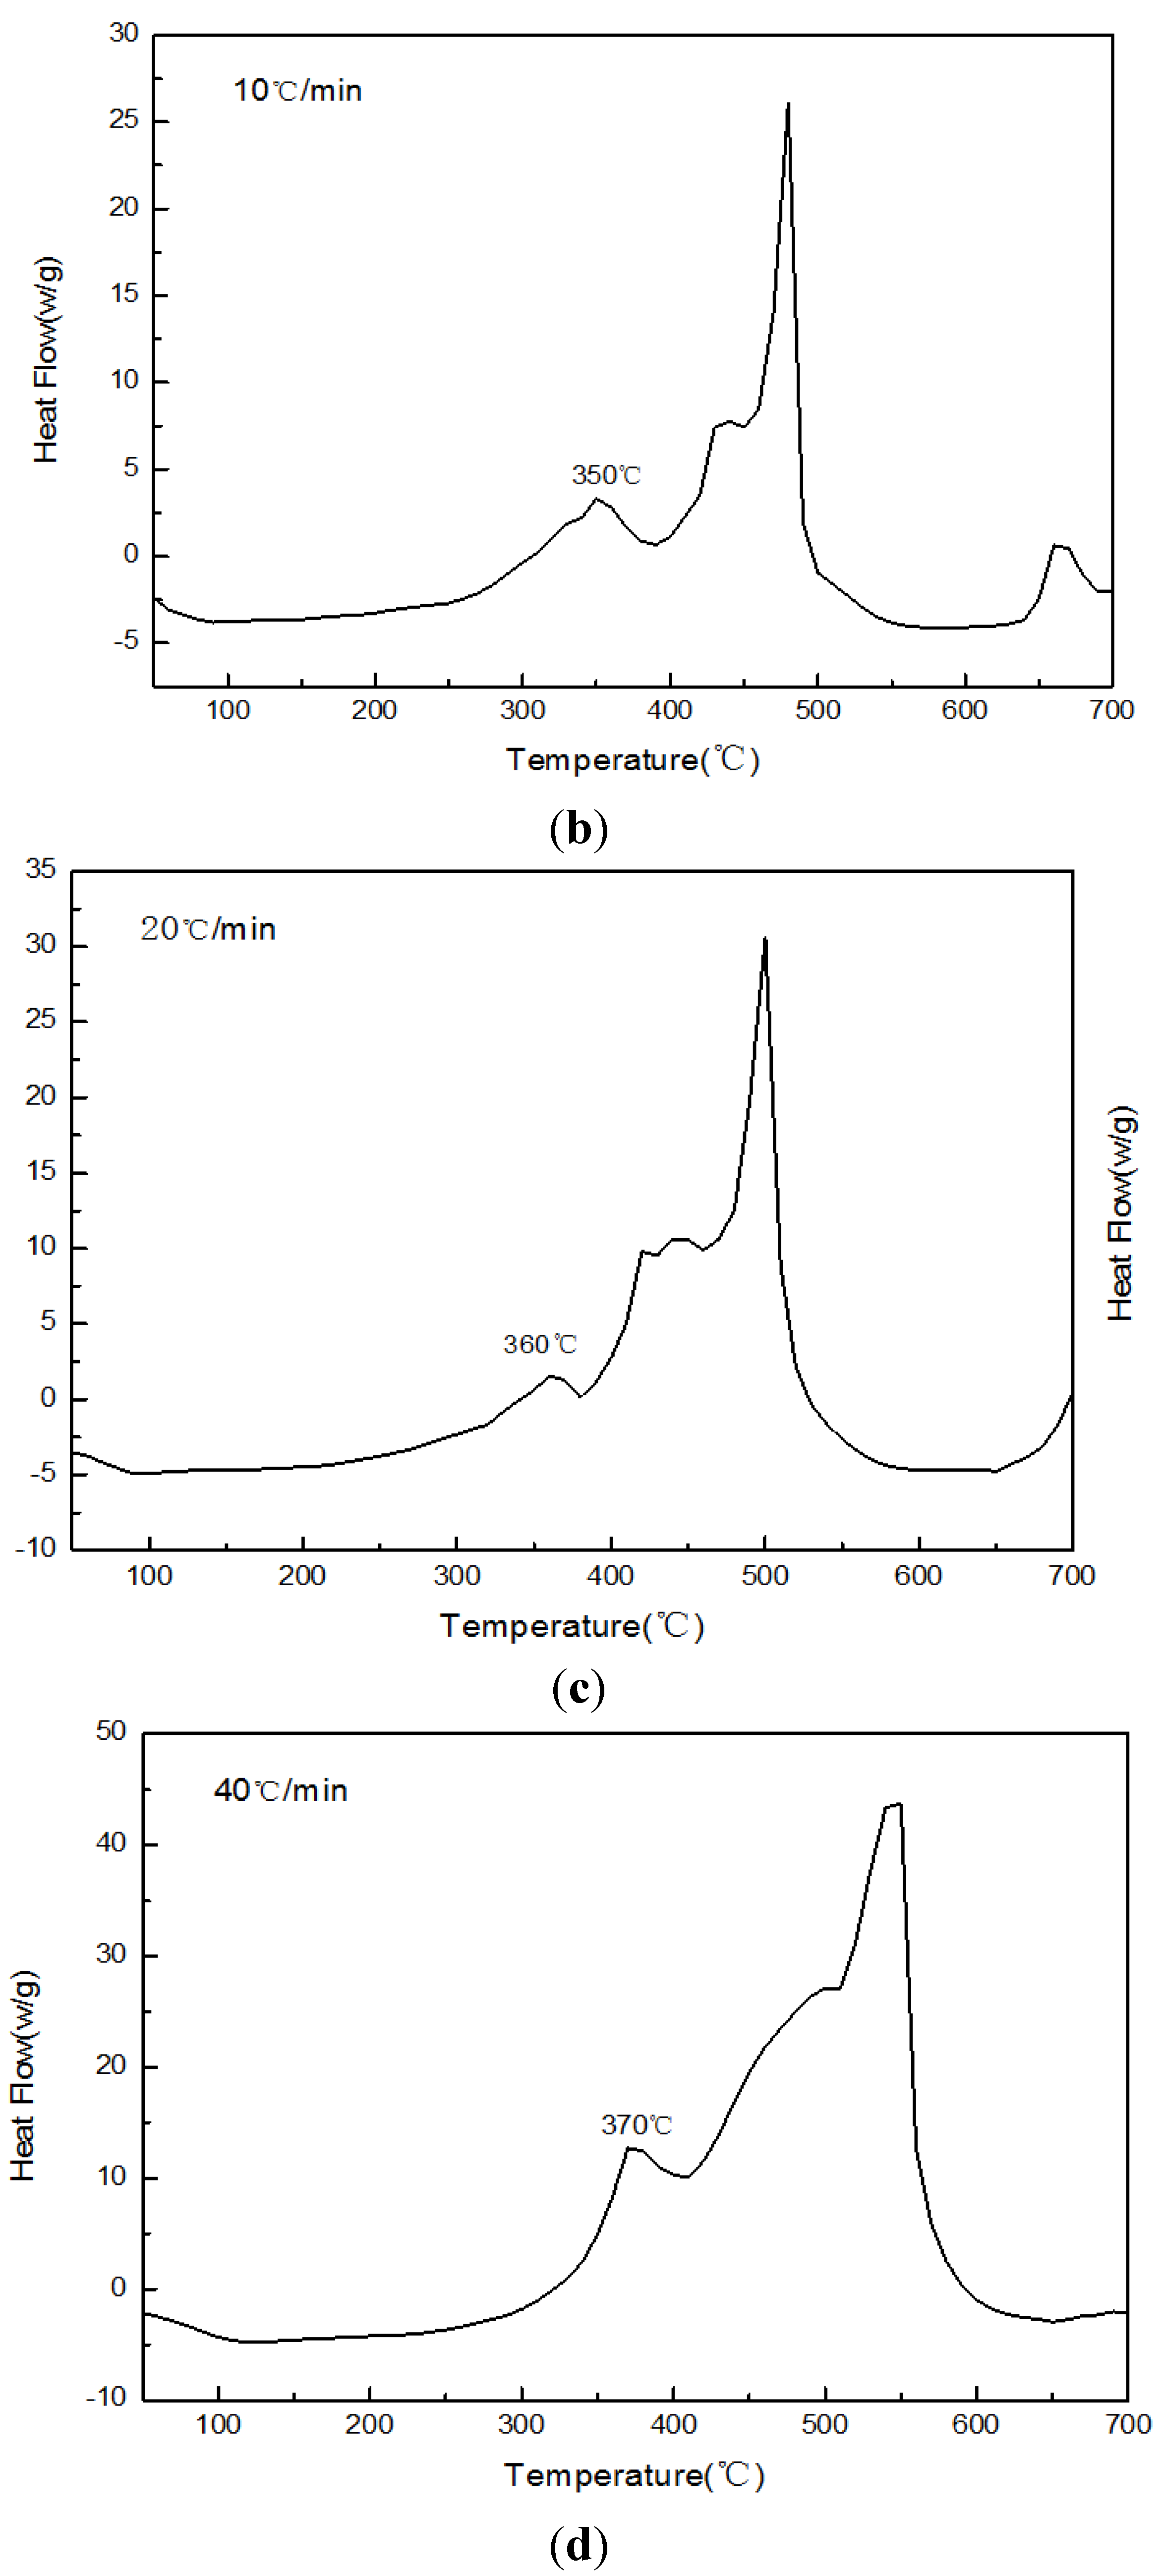
The relationship between ln(β/
Tp2) and 1/
Tp can be expressed as the curve equation:
Y = 11.85 − 13736
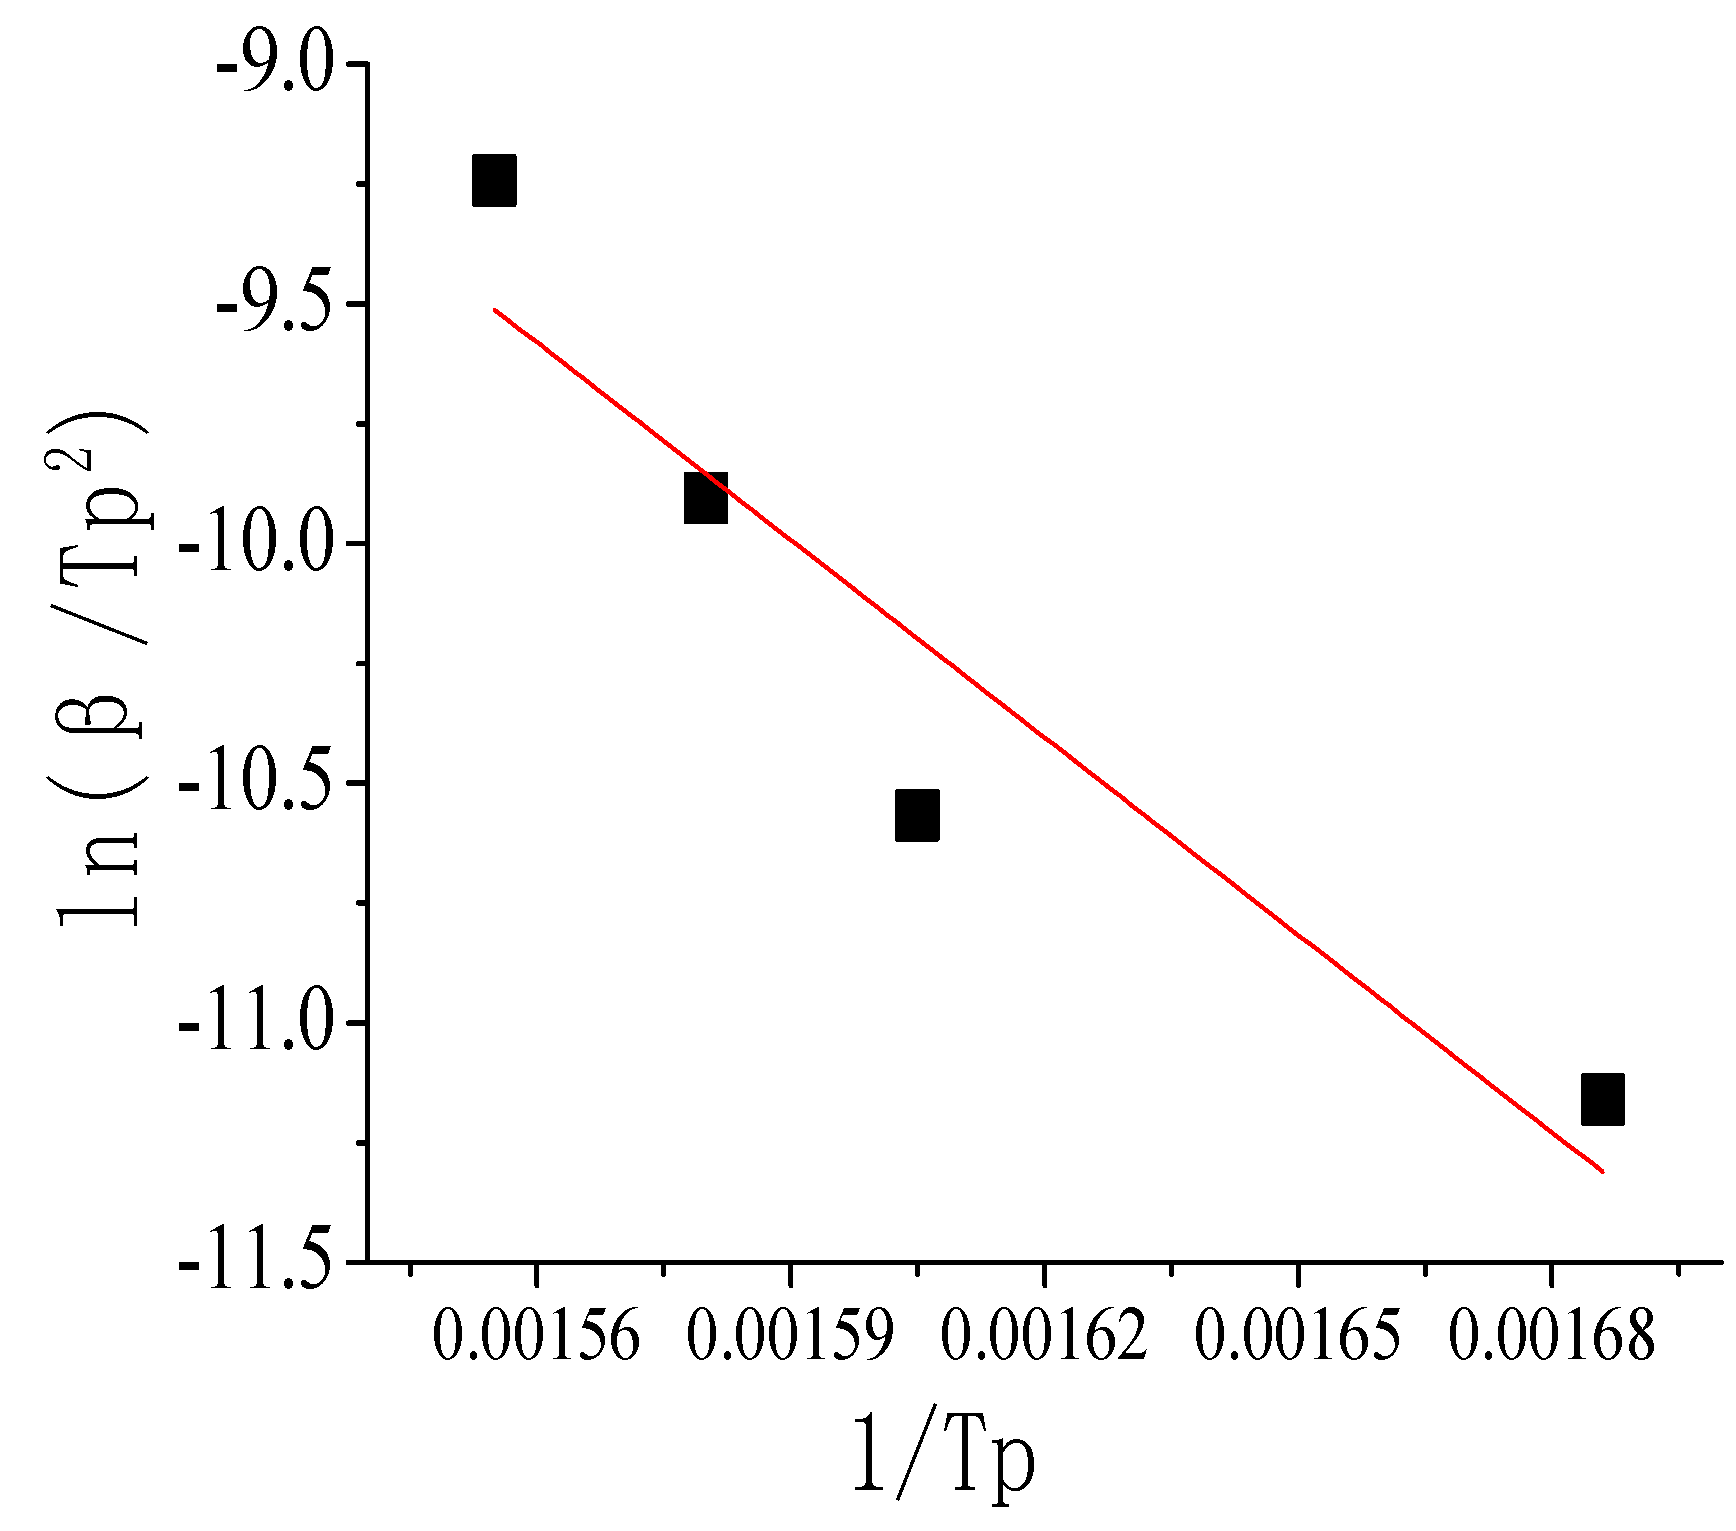
X; the relationship between lgβ and 1/
Tp can be expressed as the curve equation:
Y = 11.59 − 6501
X. By the slope and intercept of the equations above, the reaction activation energy and pre-exponential factor and the correlation coefficient were calculated. The values are shown in
Table 6.
Figure 15.
Relationship between ln(β/Tp2) and 1/Tp.
Figure 15.
Relationship between ln(β/Tp2) and 1/Tp.
Figure 16.
Relationship between lgβ and 1/Tp.
Figure 16.
Relationship between lgβ and 1/Tp.
Table 6.
Thermal reaction kinetic parameters of Sample 5 paraffin-based fuel in O2 atmosphere.
Table 6.
Thermal reaction kinetic parameters of Sample 5 paraffin-based fuel in O2 atmosphere.
| Method | E (kJ/mol) | A | R |
|---|
| Kissinger’s | 114.20 | 1.92×10⁹ | 0.99 |
| Ozawa’s | 118.35 | — | 0.99 |
Table 6 shows that the values of activation energy obtained by the Kissinger method and the Ozawa method are in the same order of magnitude, and the correlation coefficients are both 0.99. By the Kissinger method,
E is 114.20 KJ/mol, and pre-exponential factor
A is 1.92 × 10
9; by the Ozawa method,
E is 118.35 KJ/mol.
5. Fuel Regression Rate Test
5.1. Experiment Devices
In this paper, the regression rate was measured for both paraffin-based fuel and HTPB fuel by the gas-solid rectangular hybrid engine at different oxidizer mass flow rates. The fuel working time was determined by the “pressure-time” curve, and the average regression rate in the current working condition was obtained by the ratio of fuel sample thickness and working time. As shown in
Figure 17, the experimental system mainly included an oxygen cylinder, a pressure-reducing valve, a magnetic valve, a check valve and the flow regulator. The stability of the oxygen mass flow rate during the running of the engine could be ensured by adjusting the pressure-reducing valve and flow regulator.
The drawing of the rectangular engine is shown in
Figure 18a, and the photo of the working engine is shown in
Figure 18b.
As an experimental study, it was not certain whether it would melt or not. Considering that the fuel might be melting, we designed a rectangular configuration for the experiment. In the traditional port-diameter-dependent structure, once melting, the fuel will collapse, which will even cause the explosion of the engine. Compared with this structure, the rectangular engine is very safe for the experiment, because even if the melting happens, the fuel’s burning surface will not be changed.
Figure 17.
The experimental system.
Figure 17.
The experimental system.
Figure 18.
The sketch of the rectangular engine and the photo of the paraffin-based fuel’s ignition experiment. (a) Structure sketch map; (b) working engine.
Figure 18.
The sketch of the rectangular engine and the photo of the paraffin-based fuel’s ignition experiment. (a) Structure sketch map; (b) working engine.
At the start of the experiment, the magnetic valve and the flow regulator should be checked by the computer so that the flow of oxygen into the combustion chamber at the predetermined mass flow rate could be checked. When the oxygen flow rate and combustion chamber pressure are maintained, solid fuel should be ignited by the ignition device. Finally, the pressure and temperature of the combustion chamber should be measured by the pressure transducer and thermocouple.
5.2. Experimental Program
In this experiment, Sample 0 and Sample 5 in
Table 1 were used as the fuel formulas, and the working pressure was 1–2 MPa. In order to reduce the effect of pressure change on the regression rate and to ensure that the average working pressure of the combustion chamber would remain in a certain range, the nozzle with a throat diameter of 8 mm should be used at oxygen mass flow rates of 25 g/s and 30 g/s, and the nozzle with a throat diameter of 10 mm should be used at oxygen mass flow rates of 35 g/s and 40 g/s.
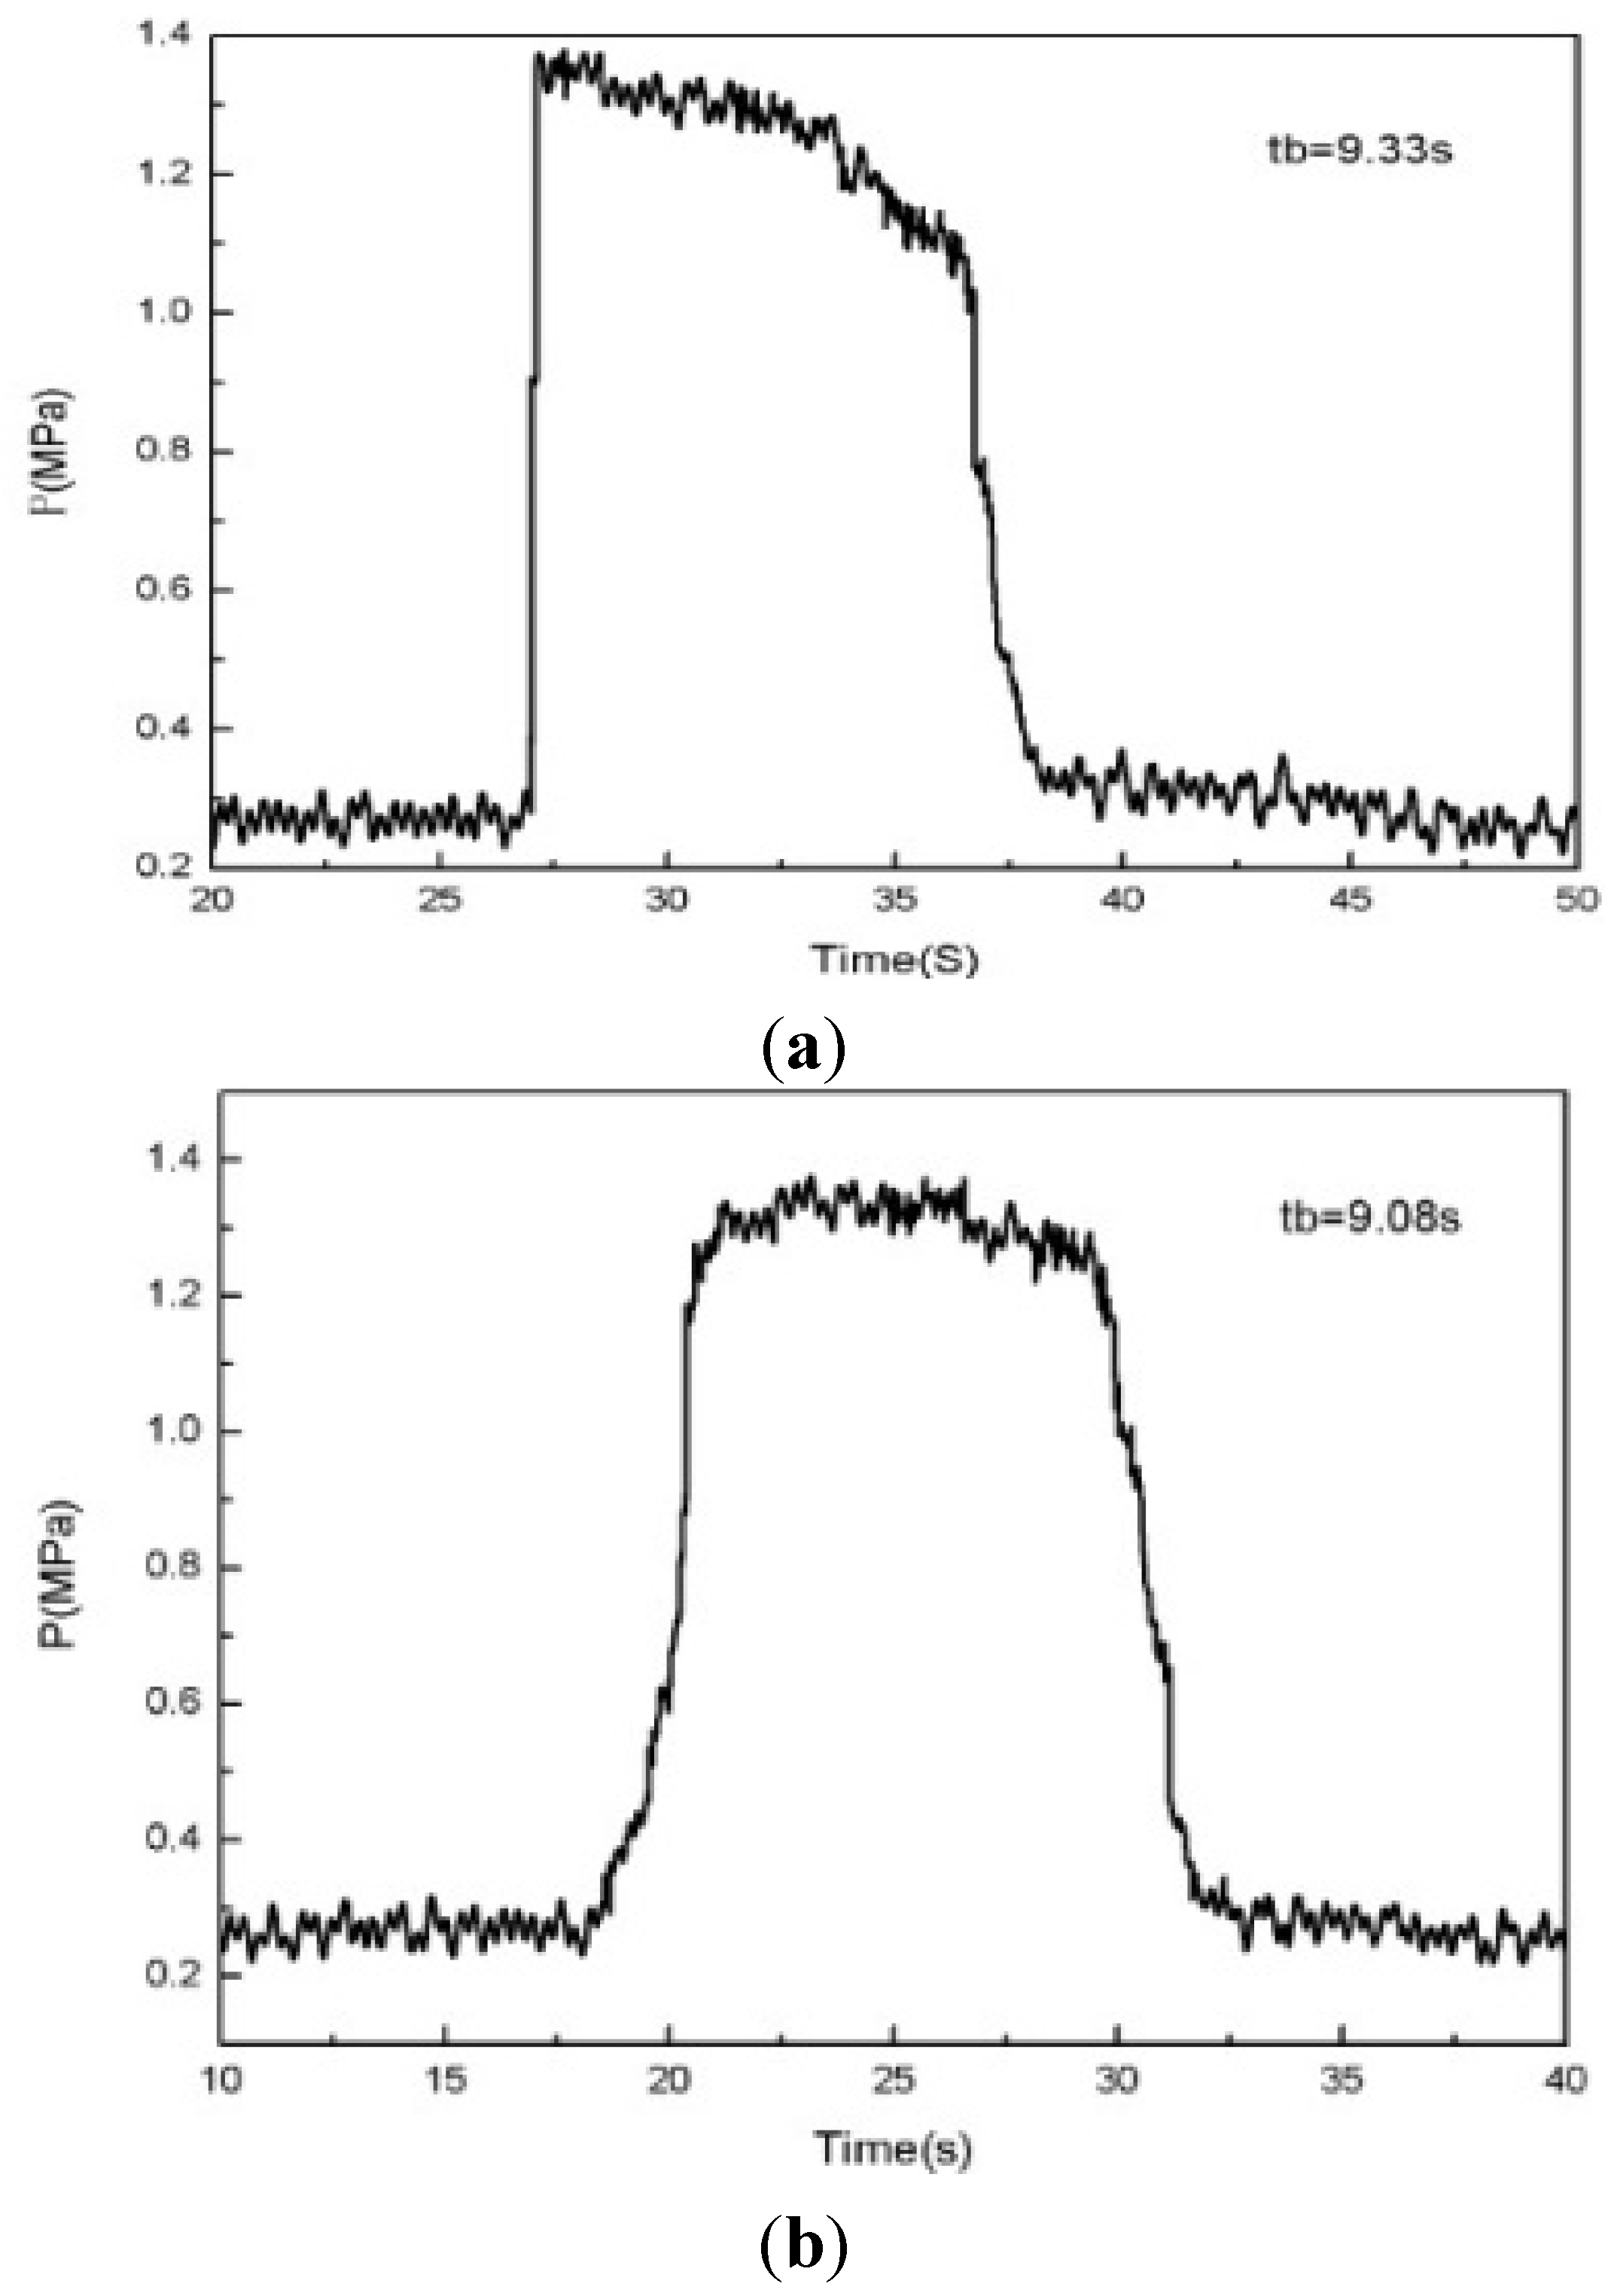
5.3. Experimental Reproducibility Analysis
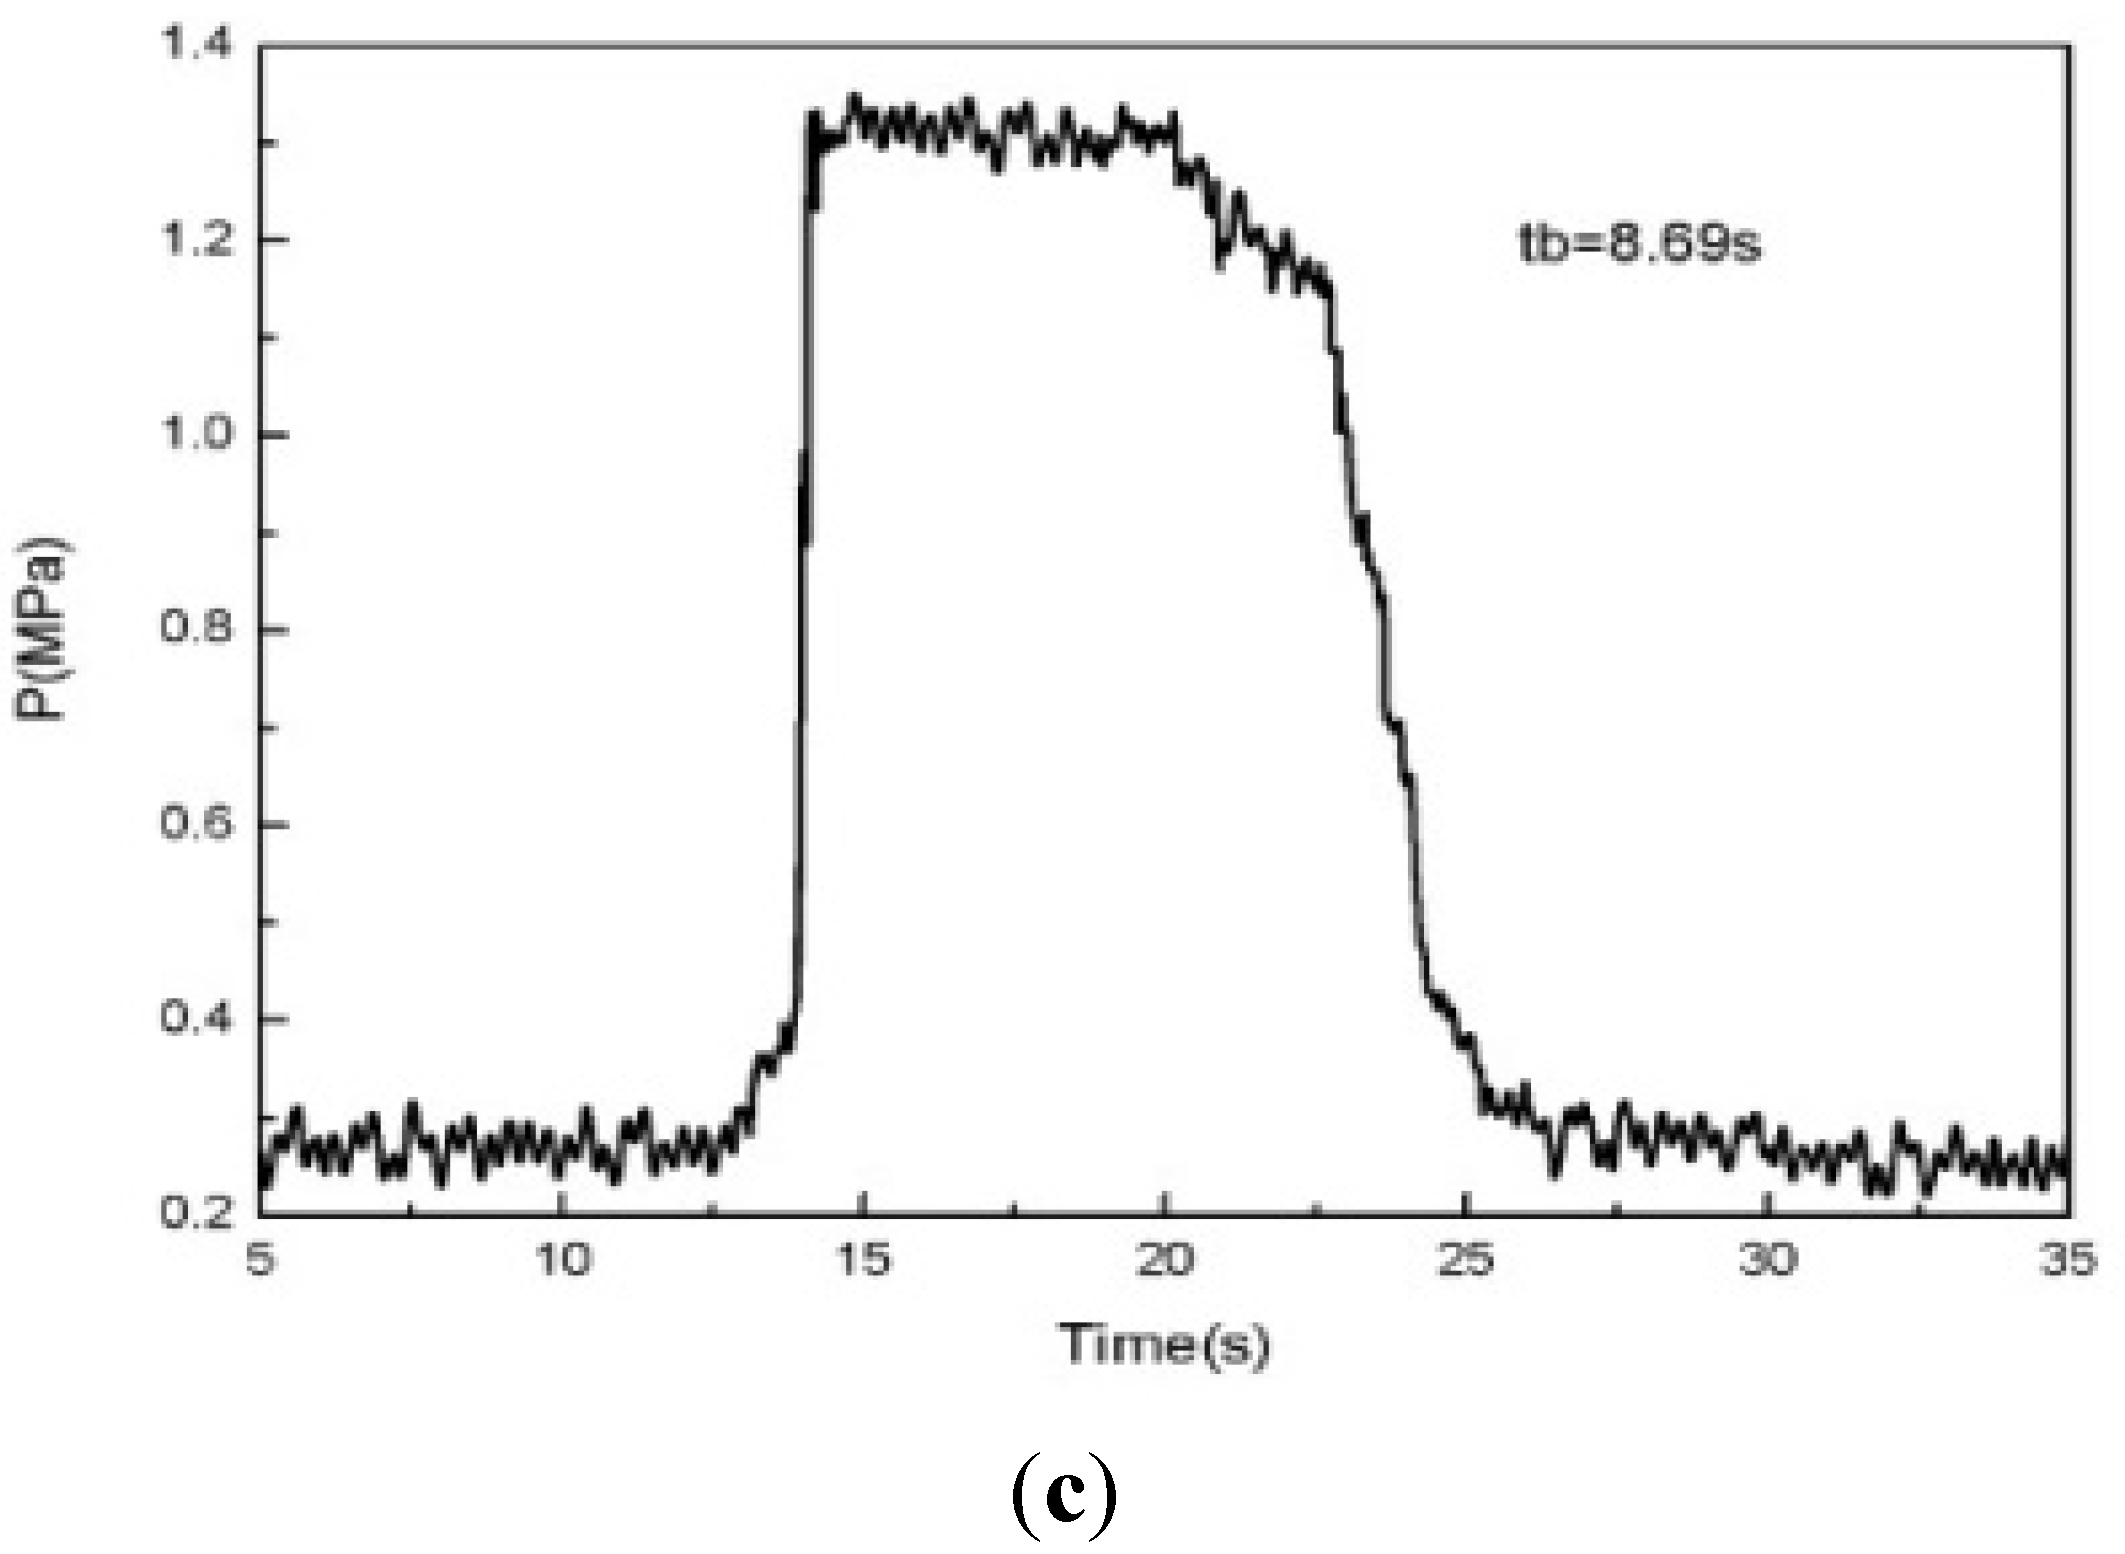
The test fire experiment is repeated for the same paraffin-based fuels to check the regression rate, under an oxygen mass flow rate of 40 g/s and a nozzle throat diameter of 10 mm. The test fire “pressure-time” curves are shown in
Figure 19.
There was not any significant fluctuation in the “pressure-time” curve at the stable phase. The experiments were repeated three times at each working condition. The average value of three regression rates was 1.11 mm/s, and the relative error of the regression rate is 2.70%, 1.80% and 4.50%, respectively. In other words, the experimental results had good reproducibility, stability and reliability.
Figure 19.
Three repeated experimental pressure curve of paraffin-based fuel. (a) P-t curve for the first time; (b) P-t curve for the second time; (c) P-t curve for the third time.
Figure 19.
Three repeated experimental pressure curve of paraffin-based fuel. (a) P-t curve for the first time; (b) P-t curve for the second time; (c) P-t curve for the third time.
5.4. Paraffin’s Impact on the Regression Rate
Four test fire experiments were done for the Sample 0 and Sample 5 fuels, respectively, at different oxygen mass flow rates, and then, the average value of the valid experiments was evaluated. The contrast of the Sample 0 and Sample 5 fuel regression rates is shown in
Table 7.
Table 7.
The contrast of fuel regression rate r in different formulations.
Table 7.
The contrast of fuel regression rate r in different formulations.
| (g/s) | 40 | 35 | 30 | 25 |
|---|
| S0 r (mm/s) | 0.68 | 0.63 | 0.54 | 0.47 |
| S5 r (mm/s) | 1.11 | 1.00 | 0.92 | 0.79 |
| (%) | 63.24 | 58.73 | 70.37 | 68.09 |
The regression rate of Sample 5 fuel increased by 63.24%, 58.73%, 70.37% and 68.09%, respectively, when compared with the regression rate of Sample 0 fuel, at the oxygen mass flow rates of 40 g/s, 35 g/s, 30 g/s and 25 g/s. It could be seen that the regression rate of paraffin-based fuel was higher than that of HTPB fuel under the same oxygen mass flow rate.
During combustion, the oxygen was sprayed into the combustion chamber uniformly by the spray plate, which reacted with the solid fuel to generate a lot of heat, so that the fuel surface was melted into a thin layer of liquid film. Under the action of gas flow on the liquid film surface, the surface of the paraffin-based fuel became unstable and then was atomized into droplets and then entered into the gas phase [
16], while the HTPB fuel could not be atomized [
17]. The paraffin droplets’ atomization greatly enhanced the fuel’s mass transportation; therefore, the regression rate of the fuel surface was improved enormously. The high regression rate is a natural property of the paraffin-based fuel itself.
5.5. Oxygen Mass Flow Rate’s Impact on the Regression Rate
From
Table 7, it can be seen that when the oxidizer mass flow rate was 25 g/s, 30 g/s, 35 g/s and 40 g/s, the regression rate of Sample 5 fuel was 0.79 mm/s, 0.92 mm/s, 1.00 mm/s and 1.11 mm/s, respectively, and the regression rate was increased by 16.46%, 8.70% and 11%, respectively, with the increasing oxidizer mass flow; the regression rate of Sample 0 fuel was 0.47 mm/s, 0.54 mm/s, 0.63 mm/s and 0.68 mm respectively, and the increase in the regression rates was 14.89%, 16.67% and 7.94% with the increase of oxidizer mass flow.
In the gas-solid hybrid engine, with the increase of oxidizer mass flow rate, the combustion gas velocity at the fuel surface improved, and the diffusion of the solid fuel surface was enhanced, which led to the increase of solid fuel surface temperature; the rate of heat transfer increased, which increased the combustion reaction, and the regression rate increased accordingly.
5.6. Data Processing and Analysis
Previous research shows that [
1,
18,
19,
20] the regression rate generally has been less affected by the combustion chamber pressure in the solid-liquid hybrid rocket engine, but greatly affected by the fuel composition, combustion chamber structure and oxidizer mass flow density. The relationship [
9] between regression rate and oxidant mass flow density is:
,
. In the equation,
a and
n are the empirical parameters obtained by experiments, and here,
Ap = 56 cm
2.
According to the experimental data above, the regression rate of Sample 0 HTPB fuel and Sample 5 paraffin-based fuel can be plotted, and the parameters are shown in
Figure 20 and
Table 8.
Figure 20.
The fitting curve of the fuel regression rate and Go.
Figure 20.
The fitting curve of the fuel regression rate and Go.
Table 8.
The regression rate parameters of S0 and S5.
Table 8.
The regression rate parameters of S0 and S5.
| Fuel Formula | a (mm/s) | n | R |
|---|
| S0 | 0.1323 | 0.7822 | 0.988 |
| S5 | 0.2490 | 0.7103 | 0.983 |
It can be seen that the regression rate of fuel increased proportionately with increasing oxidizer mass flow rate; the regression rate of paraffin-based fuel is significantly higher than that of the HTPB fuel.
In this paper, the regression rate of paraffin-based fuel is about two-times that of HTPB, while the regression rate should be up to three-times that of HTPB in the literature; therefore, this needs further study to improve the regression rate of paraffin-based fuel.
6. Conclusions
(1) The Is value of Sample 0 is higher by 36.3 N·s/kg, 35.5 N·s/kg and 35.3 N·s/kg, respectively, than Sample 2 for the oxygen-fuel ratios of 1.6, 1.9 and 2.4, so there is little difference between the specific impulse of paraffin-based fuel and that of HTPB fuel; AL can increase the chamber temperature and decrease the specific impulse slightly, but the density of AL is about two-times that of HTPB, so adding AL can effectively improve the density-specific impulse; the oxygen content of fuel is increased by adding AP, but the optimal oxygen-fuel ratio and specific impulse are both decreased.
(2) The initial decomposition temperature of paraffin, pretreated and HTPB are 182 °C, 230 °C and 336 °C in a nitrogen atmosphere, respectively. The initial decomposition temperature of pretreated paraffin is higher than that of the untreated paraffin, which indicated that the characteristics of pretreated paraffin have changed, and the treatment technology for pretreated paraffin is useful.
(3) In an air atmosphere, the initial reaction exothermic decomposition peak temperature of the paraffin-based fuel with paraffin contents of 15%, 25% and 35% is 362 °C, 353 °C and 348 °C, respectively, and the heat release is about 78 J/g, 226 J/g and 320 J/g, respectively; with the increase of paraffin content in paraffin-based fuel, the initial exothermic peak of reaction is reached in advance gradually, and the heat release increases continuously.
(4) The kinetic parameters of pretreated paraffin and paraffin-based fuel in an oxygen atmosphere under different heating rates can be calculated. By the Kissinger method, for pretreated paraffin, E is 101.72 KJ/mol, and pre-exponential factor A is 4.53382 × 10¹¹; for Sample 5 paraffin-based fuel, E is 114.20 KJ/mol, and pre-exponential factor A is 1.92 × 10⁹; by the Ozawa method, for pretreated paraffin, E is 108.39 KJ/mol; for Sample 5, paraffin-based fuel E is 118.35 KJ/mol.
(5) The regression rate of Sample 5 fuel is increased by 68.09%, 70.37%, 58.73% and 63.24%, respectively, as compared with the regression rate of Sample 0 fuel, in the oxygen mass flow rates of 25 g/s, 30 g/s, 35 g/s and 40 g/s. It could be seen that the regression rate of paraffin-based fuel was higher than that of HTPB fuel under the same oxygen mass flow rate.
(6) With the increase of oxygen mass flow rate, the regression rate of Sample 5 fuel increased 16.46%, 8.70% and 11% respectively; the regression rate of Sample 0 fuel increased 14.89%, 16.67% and 7.94%, respectively. With the same formulation, the regression rate of fuel increases proportionately with increasing oxidizer mass flow rate.


