This section discuss the experimental case studies investigating the control aspects of different microgrid topologies and the potential of optimized control to improve the overall energy efficiency of microgrid.
3.1. Coordinated Control of Hybrid Storage System in Grid-Connected Microgrid
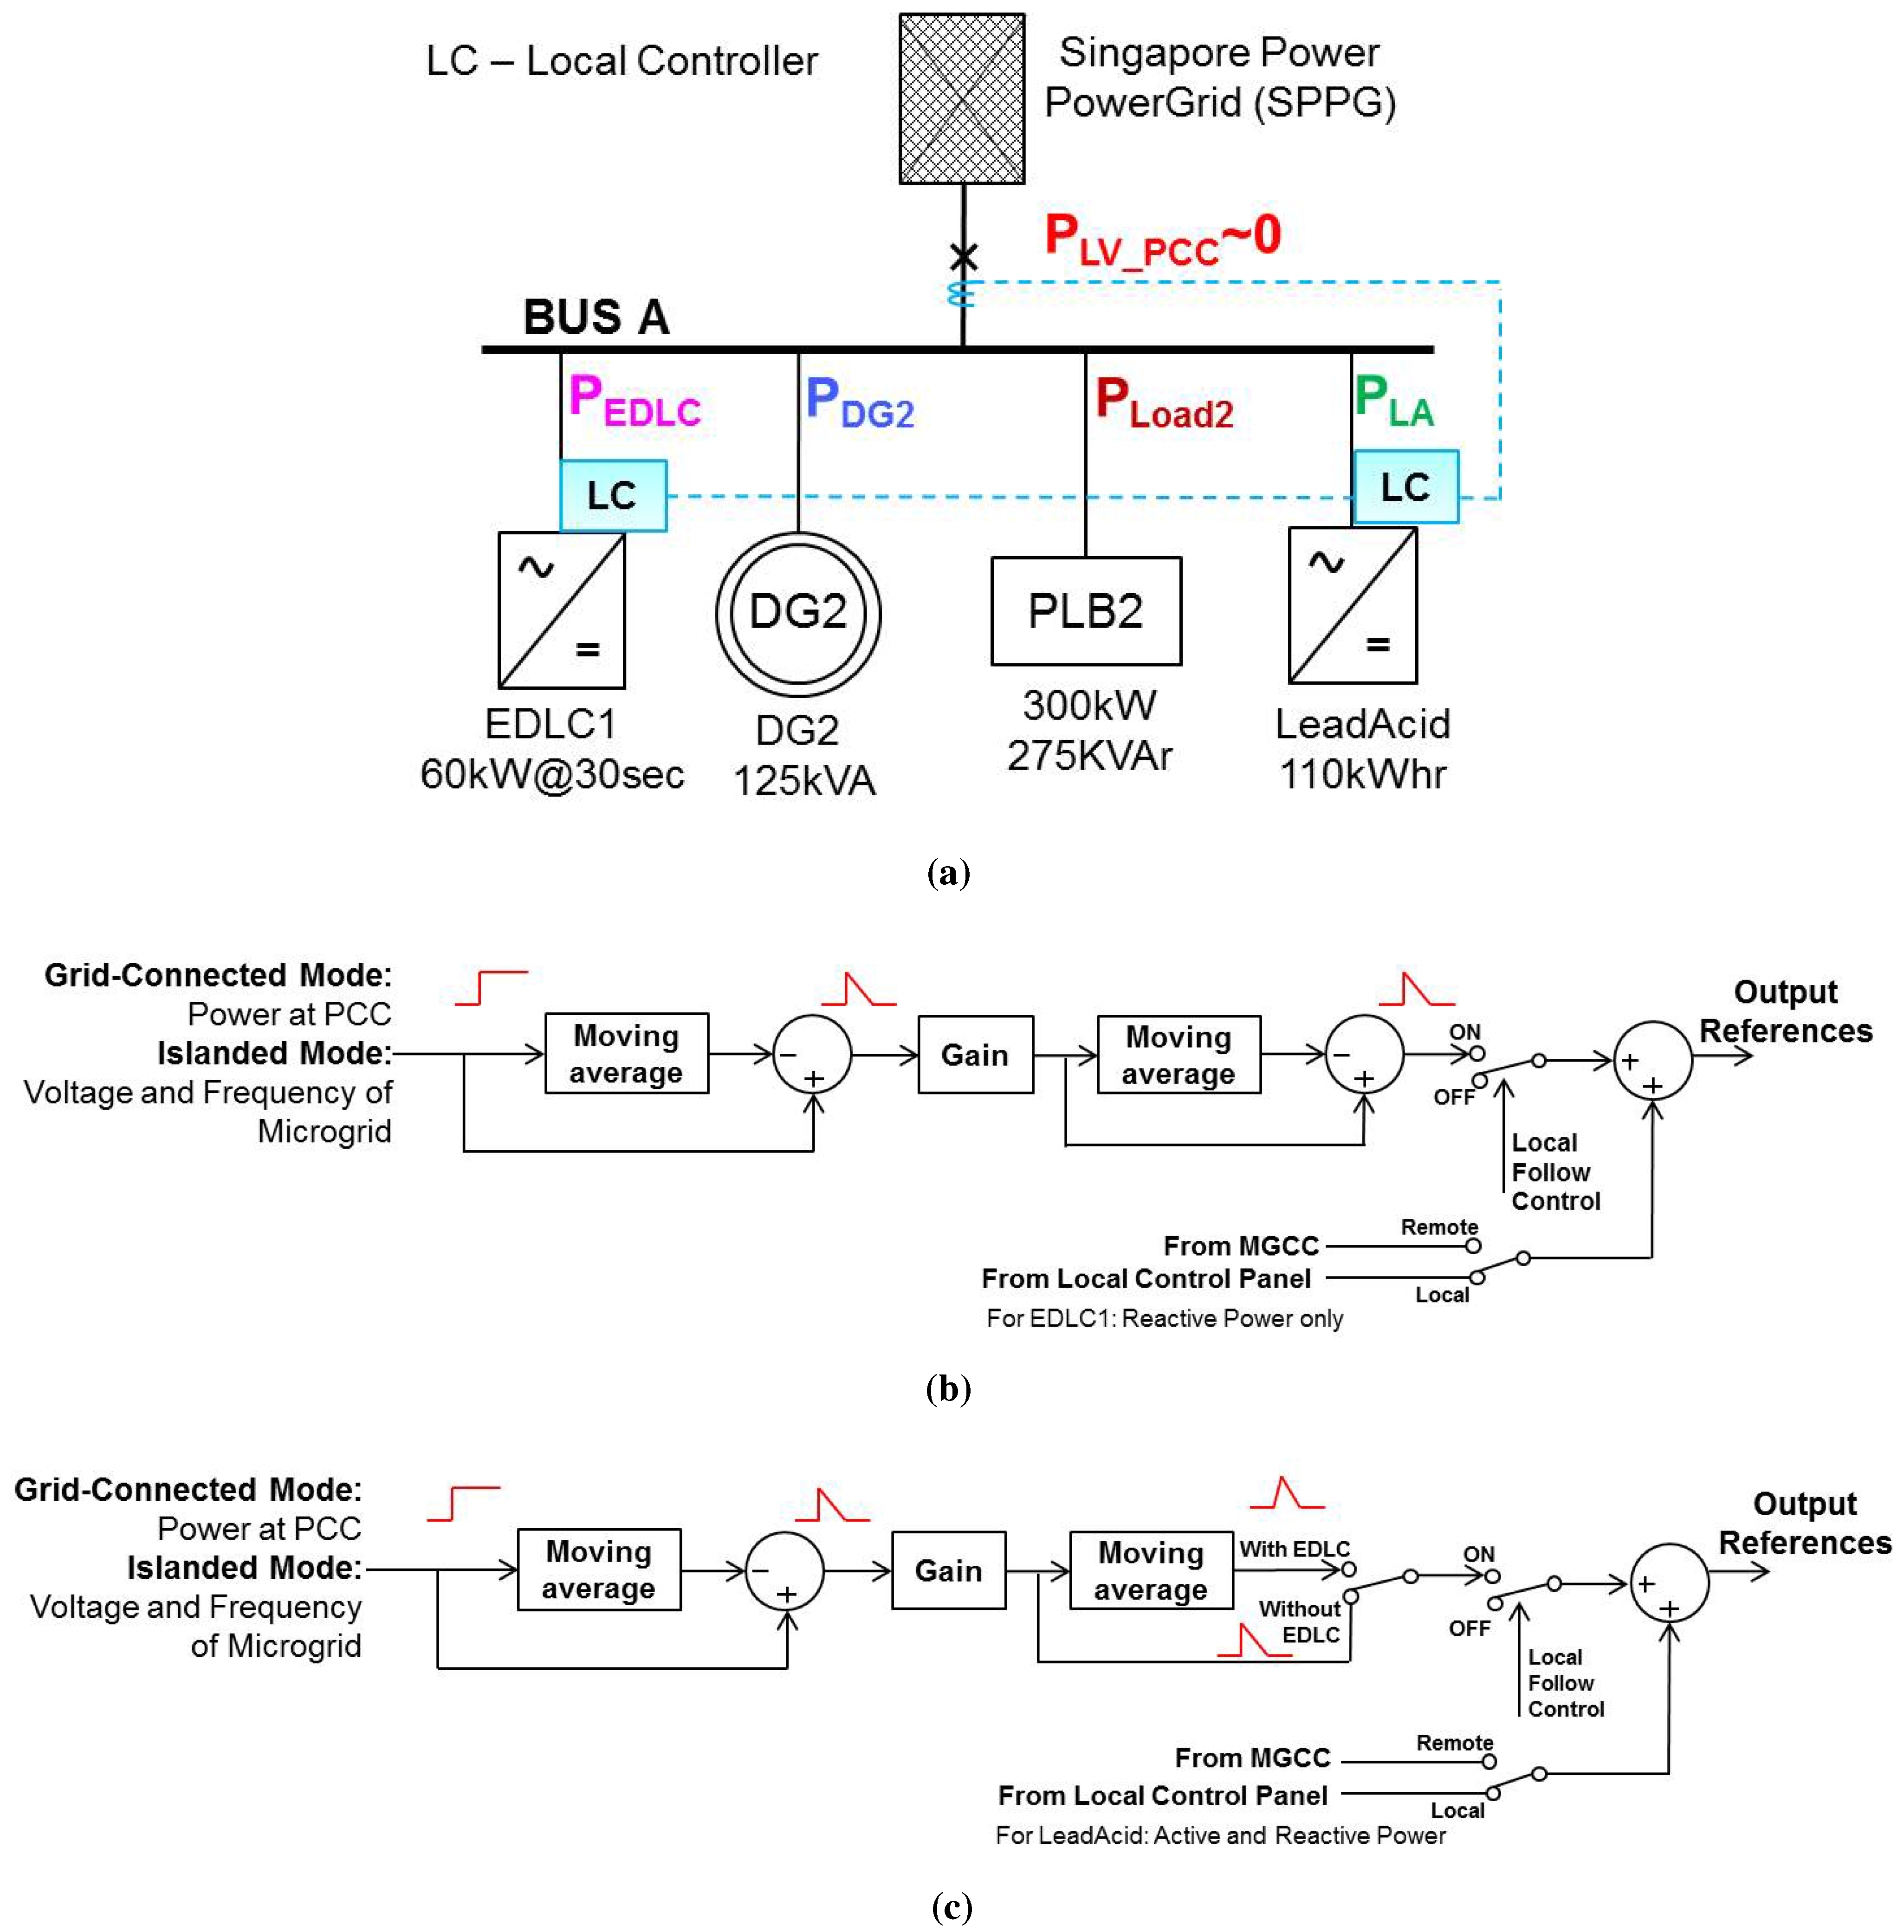
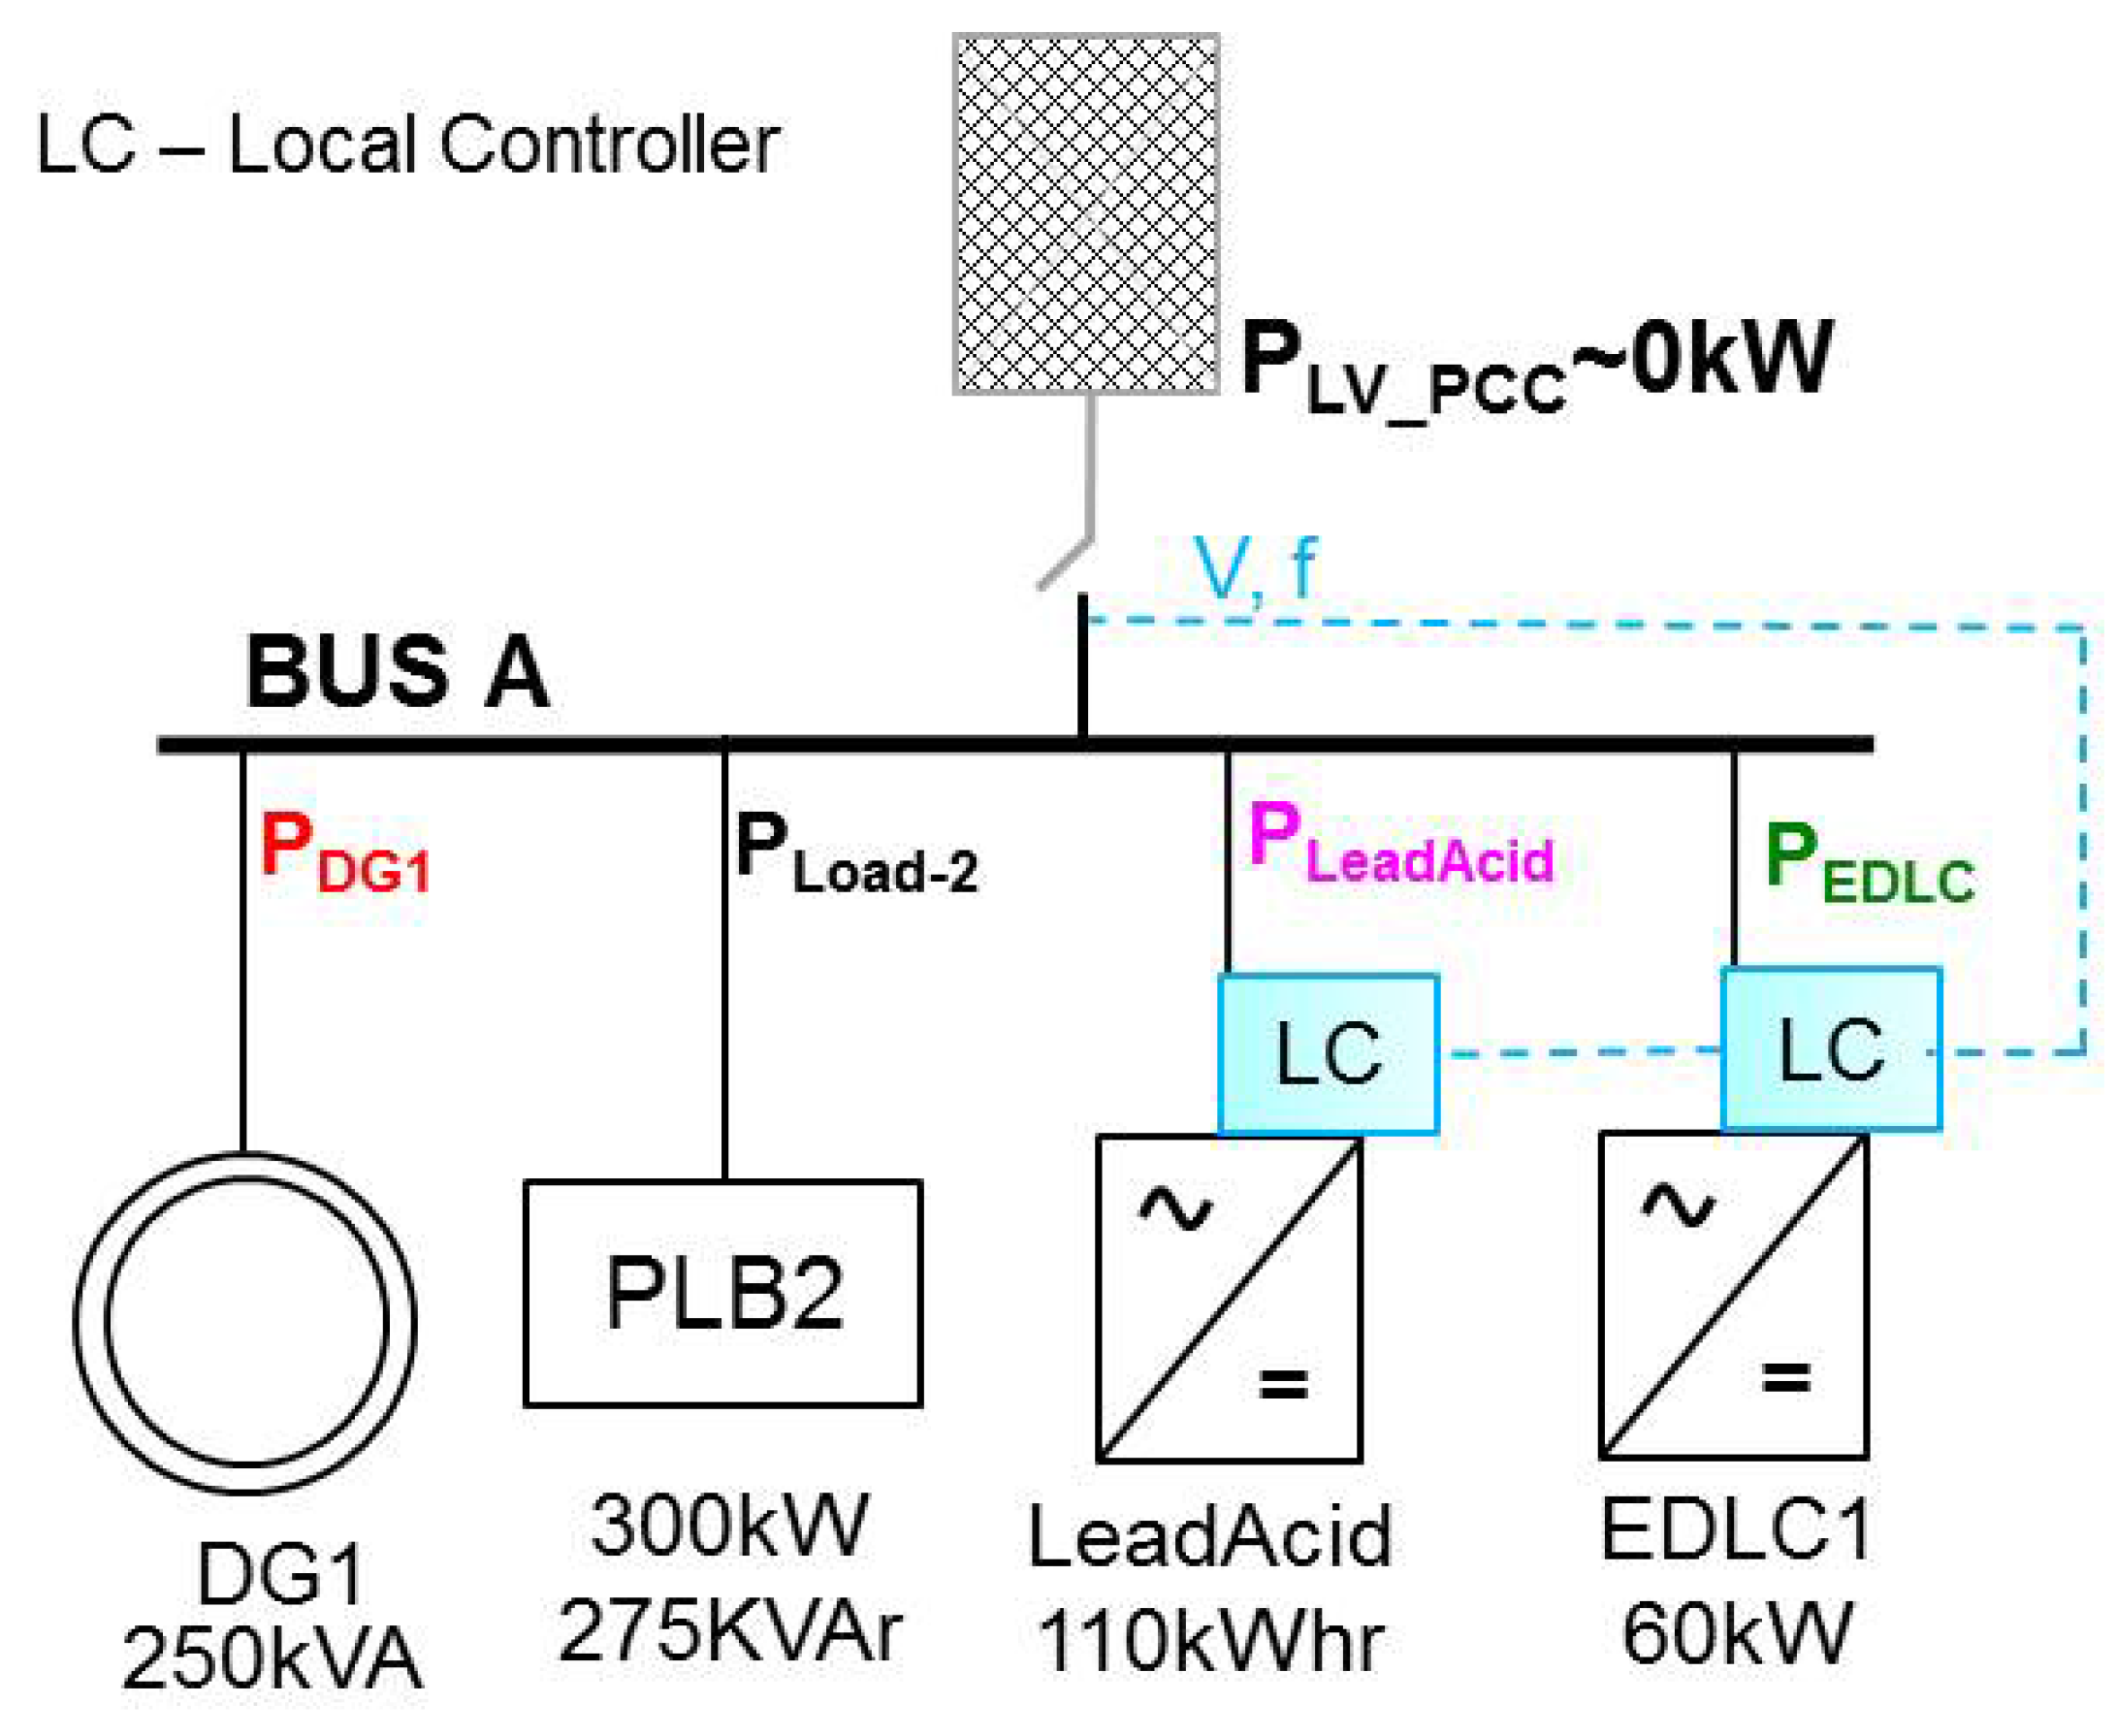
By definition, microgrid is a single controllable entity that can balance its supply and demand locally without causing any disturbance to the utility grid. For the planning and designing of such microgrids and its control, EPGC experimental facility can be used to test and evaluate the performance of different microgrids configurations and control algorithms. Test case in this section demonstrates dynamic coordinated control of two different types of storage systems operating in the microgrid. During the transients, the considered microgrid can balance its supply and demand without causing any disturbance to the utility grid. As shown in
Figure 5a, the microgrid comprises Diesel Generator (DG2), Electric Double-Layer Capacitor (EDLC1), and Programmable Load Bank (PLB2), where power flow control at Point of Common Coupling (PCC) is set equal to zero.
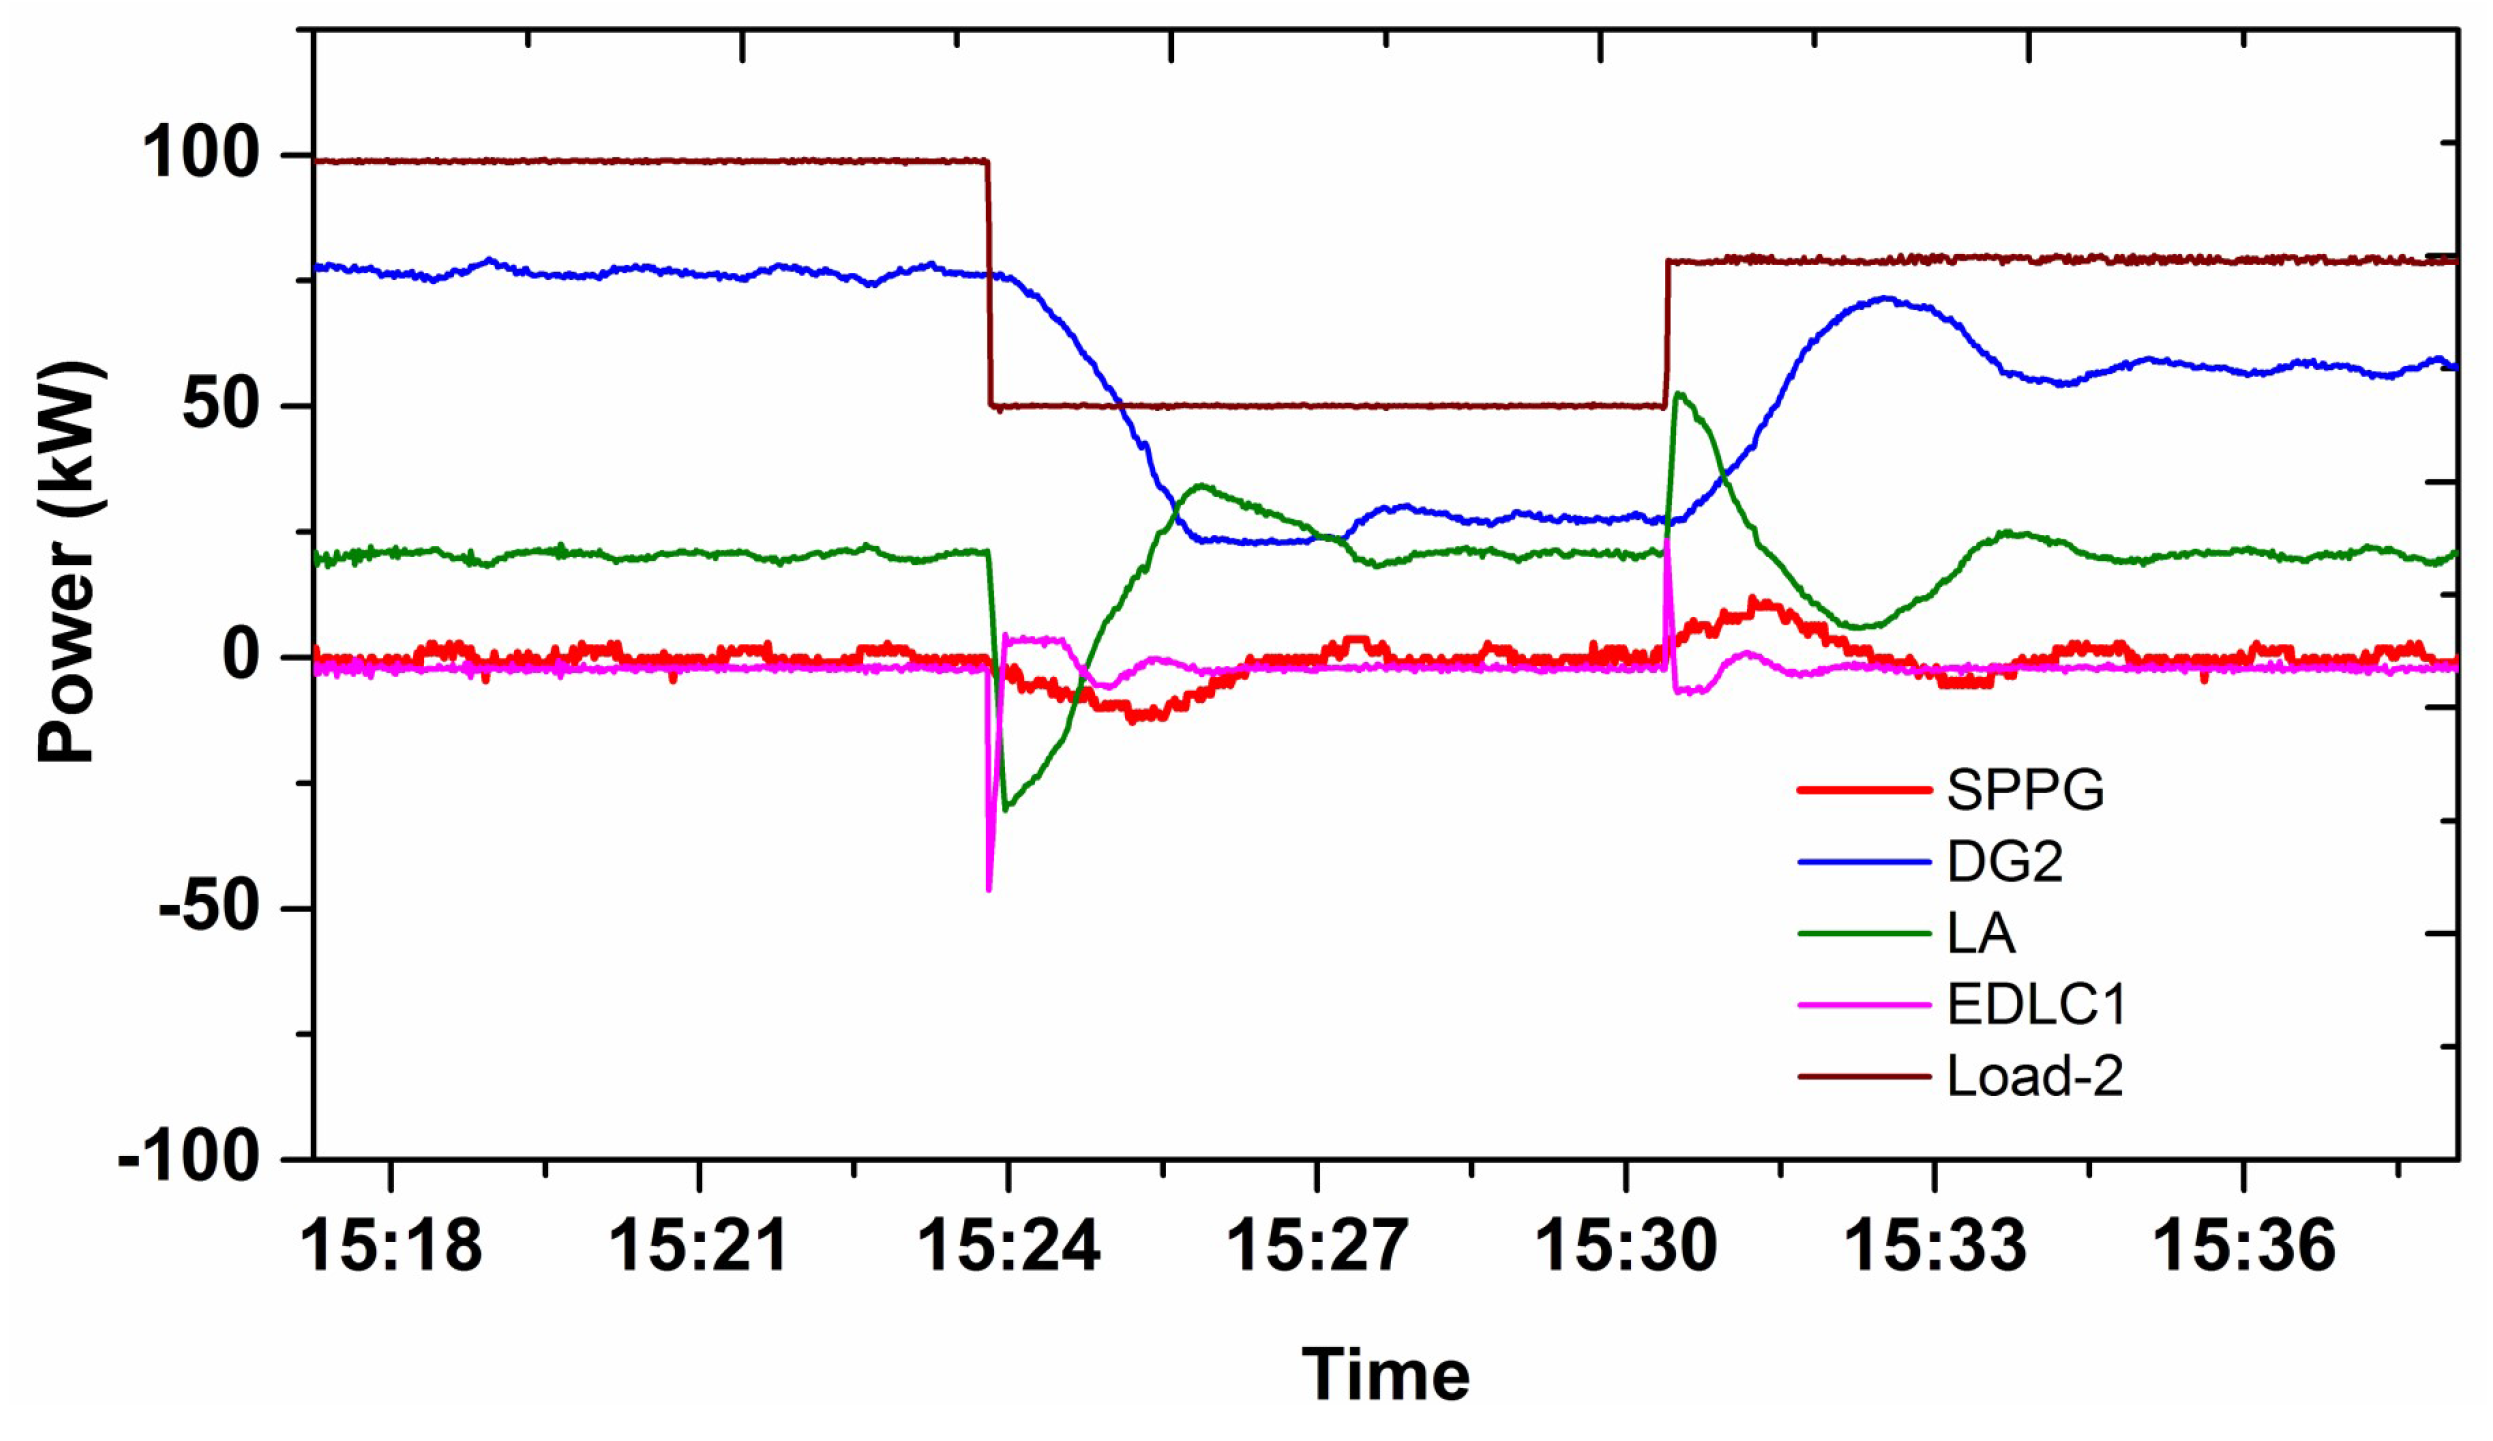
The experimental results for two different cases of load change in the microgrid are shown in
Figure 6. The control mode for EDLC1 is set to ’local follow’ as shown in
Figure 5b and LeadAcid is set to “local follow” and “with EDLC” in order to compensate the rapid change in power at PCC, as shown in
Figure 5b,c. This coordinated control behavior can be witnessed from the experimental results shown in
Figure 6, where EDLC1 promptly responds to the load change at 25:24 s by charging 50 kW power for a short duration. At the same time, LeadAcid storage also responds to the load change, but at the slower rate than EDLC1, which is for obvious reasons. This coordinated dynamic control of two different storage systems allows DG2 to ramp down according to its design characteristics without causing any sudden power fluctuation at the PCC, which is the main objective of this control strategy.
3.2. Microgrid Islanding and Reconnection with Utility Grid
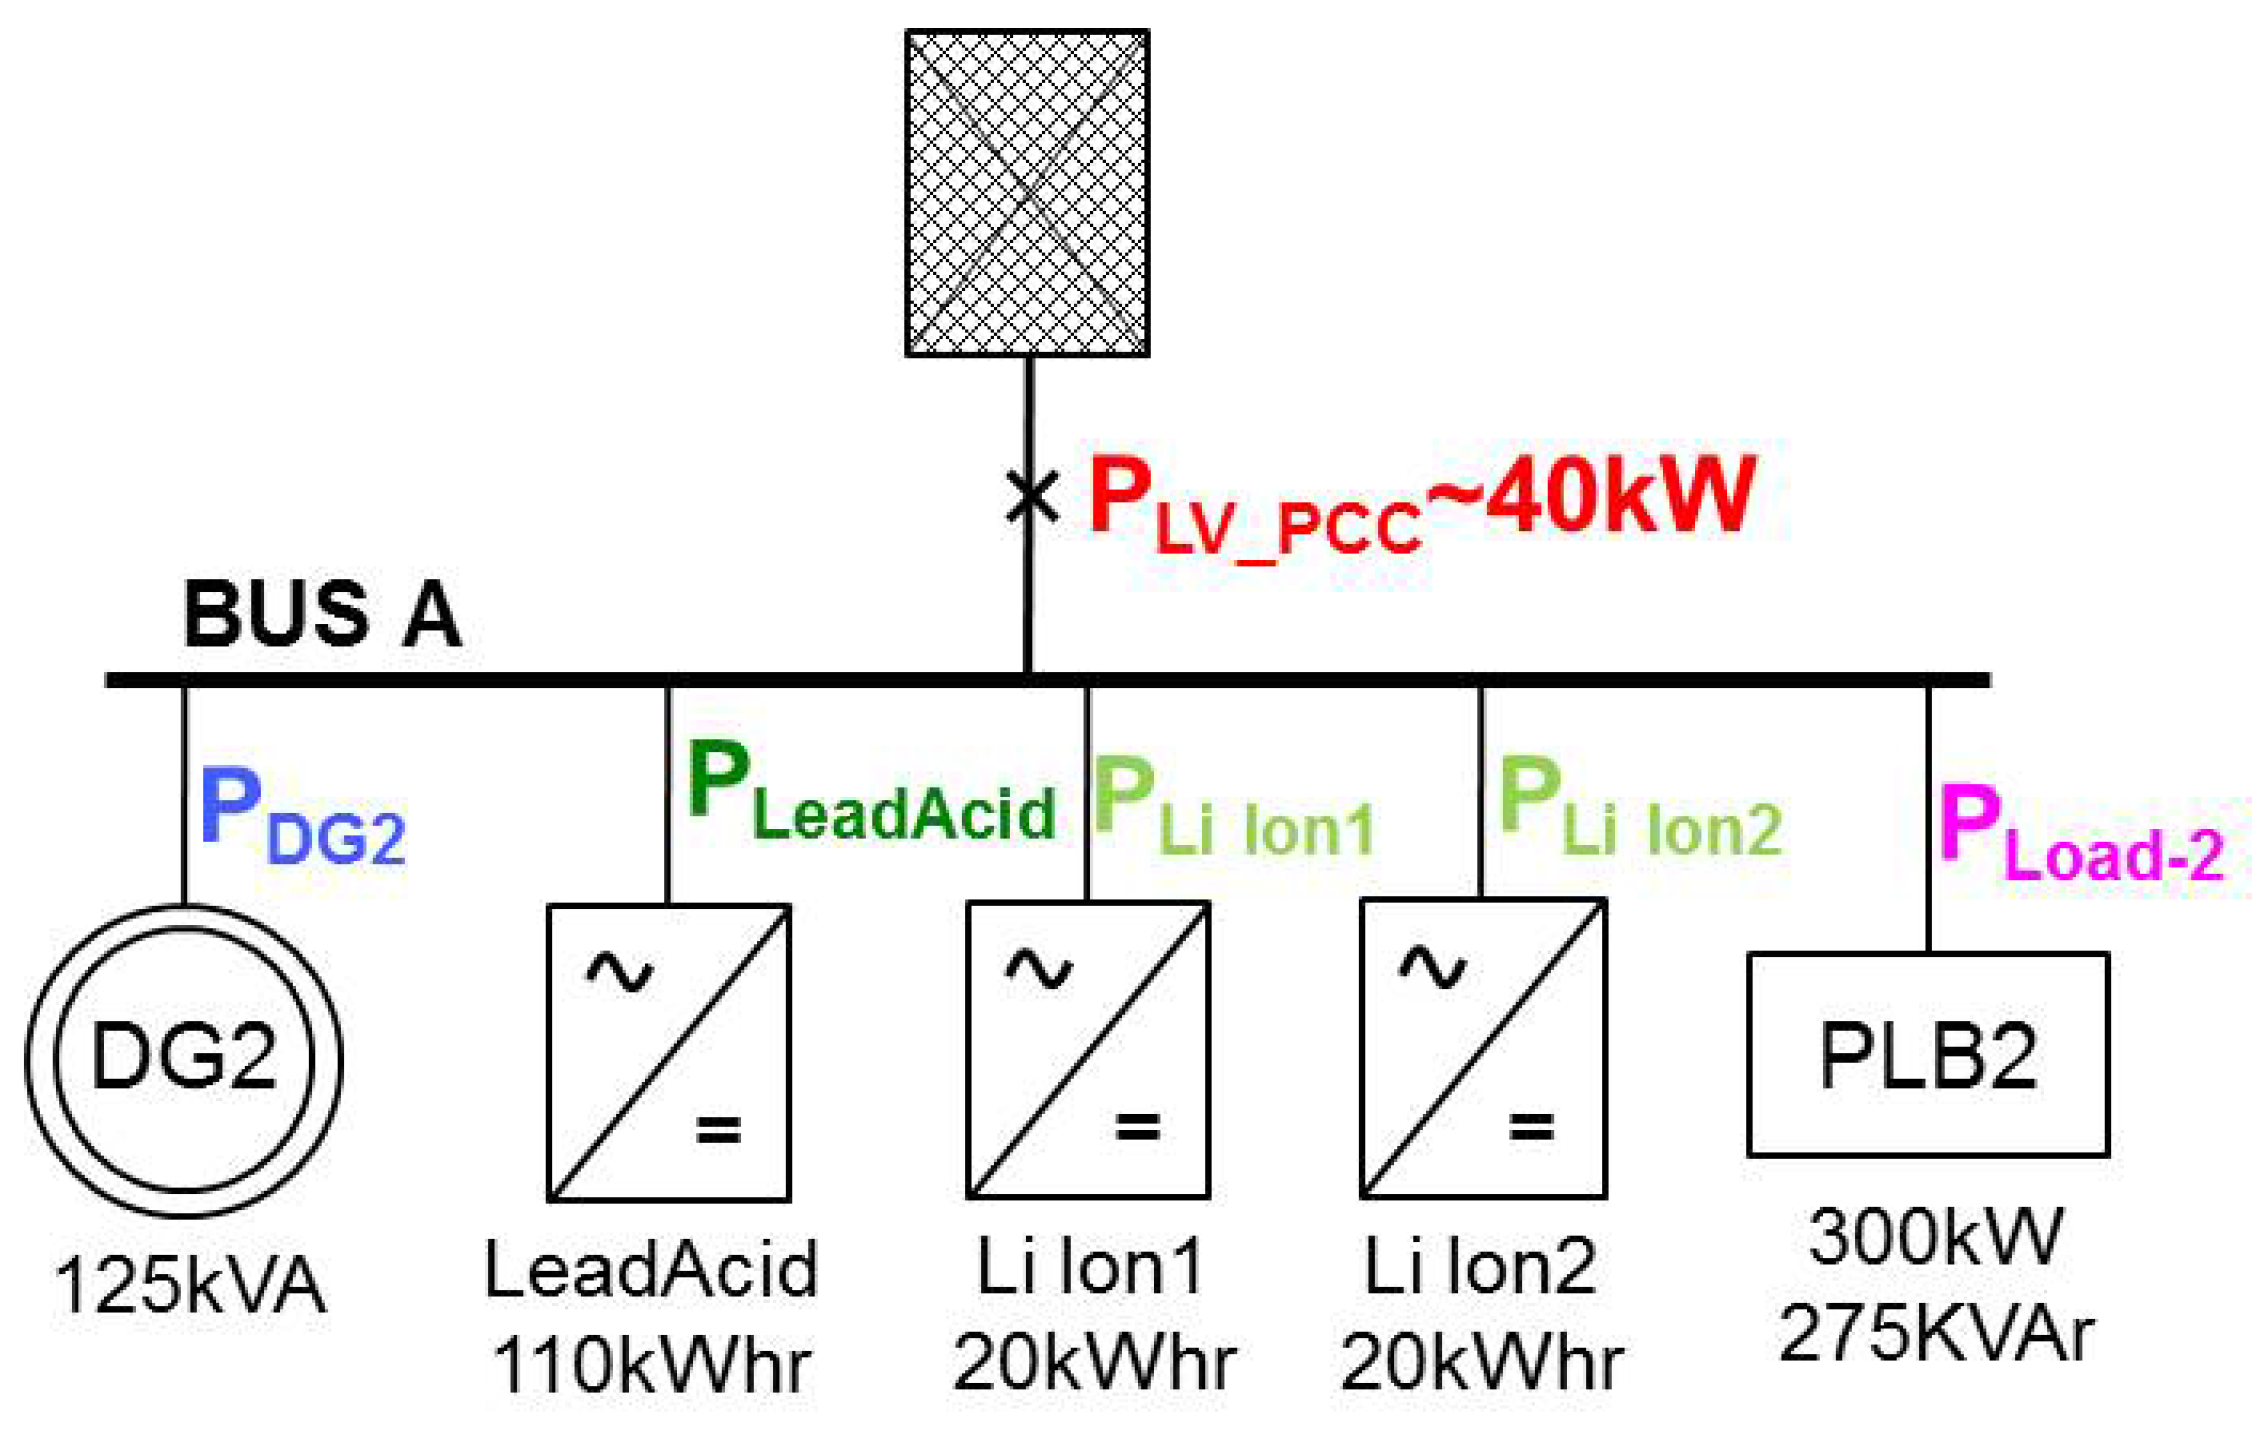
Another desired feature of the practical microgrid is to operate in islanded and grid-connected mode. According to standard 1547, the grid-connected DGs and microgrid shall transition from grid-connected to islanded mode during the grid disturbance and re-connect back once the grid is normal, within specified time duration. This transition shall be smooth such that the islanded microgrid shall continue to balance its supply and demand. EPGC facility is designed to perform anti-islanding tests for the DG and microgrids according to the standard IEEE 1547. This case study demonstrates an example of smooth transition from grid-connected mode to islanded-mode and vice versa, for the configured microgrid shown in
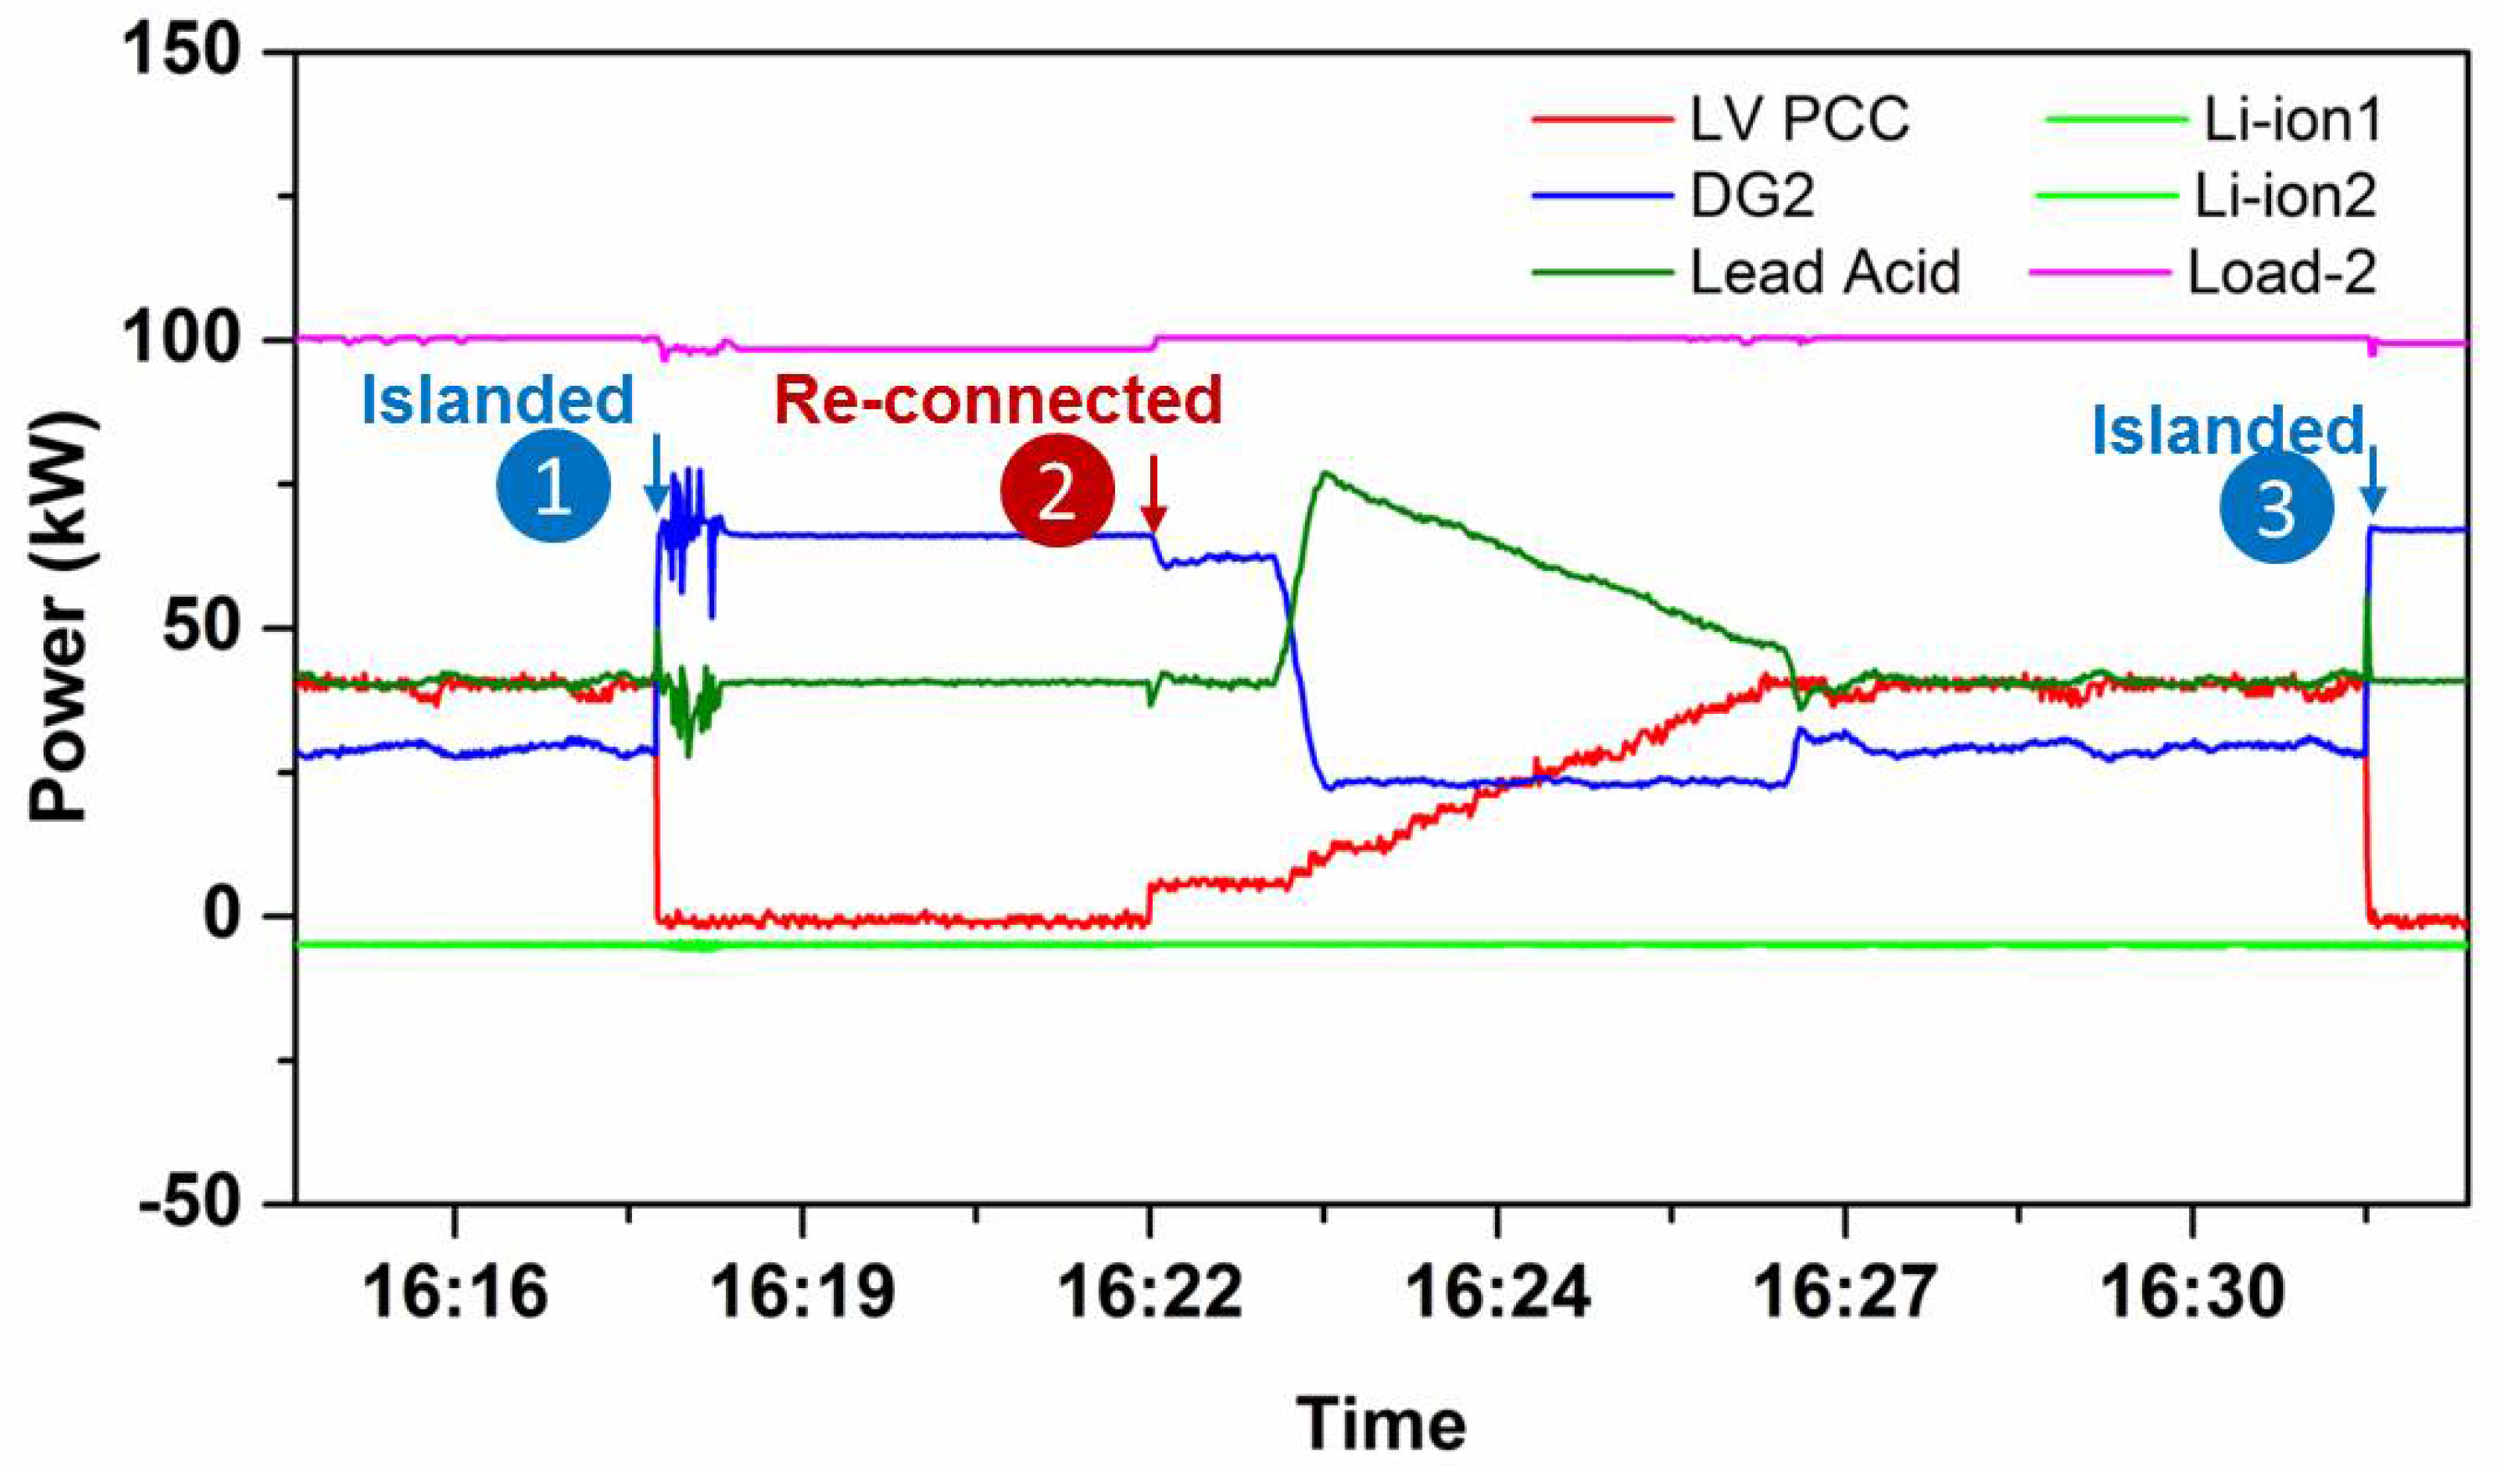
Figure 7. The experimental results for the microgrid islanding and reconnection are shown in
Figure 8. At operating point 1, the microgrid transitions into islanded mode while it is importing contracted power of 40 kW from the utility grid named as “Singapore Power PowerGrid (SPPG)”. The power imbalance due to islanding is compensated by DG2 followed by LeadAcid which is operating in local follow mode.
At operating point 2, the microgrid is commanded to re-connect and synchronize with the utility grid (
i.e., SPPG) to continue importing the contracted power of 40 kW. As shown from the experimental results in
Figure 8, the transition from islanded-mode to grid-connected mode is very smooth, where LeadAcid plays an important role to maintain the steady ramp-rate at PCC point whereby allowing DG2 to ramp down according to its characteristics.
Figure 5.
Microgrid configuration and control schemes during grid-connected and islanded mode operation. (a) Configured microgrid for storage control test; (b) Control scheme for EDLC1; (c) Control scheme for LeadAcid storage.
Figure 5.
Microgrid configuration and control schemes during grid-connected and islanded mode operation. (a) Configured microgrid for storage control test; (b) Control scheme for EDLC1; (c) Control scheme for LeadAcid storage.
Figure 6.
Experimental results showing EDLC1 and LeadAcid coordinated control to maintain PCC power 0 during sudden load change in microgrid.
Figure 6.
Experimental results showing EDLC1 and LeadAcid coordinated control to maintain PCC power 0 during sudden load change in microgrid.
Figure 7.
Configured microgrid for islanding and reconnection test.
Figure 7.
Configured microgrid for islanding and reconnection test.
Figure 8.
Experimental results showing microgrid islanding and reconnection with utility grid while importing 40 kW during grid-connected mode.
Figure 8.
Experimental results showing microgrid islanding and reconnection with utility grid while importing 40 kW during grid-connected mode.
3.3. Storage Application for Frequency and Voltage Regulation in Microgrid
In this case, the islanded microgrid shown in
Figure 9 is tested with and without energy storage. The fast response energy storage system plays important role in maintaining the power quality in the low inertia microgrids, which has been demonstrated through this test case. The test results demonstrate that the frequency and voltage of low inertia microgrid can be regulated with proper control of storage system. The control scheme for LeadAcid and EDLC1 is shown in
Figure 5b,c. With the common objective to improve the voltage and frequency variation during the load change (up and down), three different scenarios are tested as briefly described below,
Figure 9.
Configured islanded microgrid for storage application test.
Figure 9.
Configured islanded microgrid for storage application test.
Scenario 1: LeadAcid only responds to the frequency and voltage change according to the control scheme shown in
Figure 5c.
Scenario 2: EDLC1 only responds to the frequency and voltage change according to the control scheme shown in
Figure 5b.
Scenario 3: Both EDLC1 and LeadAcid respond to the frequency and voltage change, as shown in
Figure 5b,c. In this case, EDLC and LeadAcid response is coordinated, where ELDC lead by providing the faster response and LeadAcid provide slow response while “without EDLC” mode is activated, as shown in
Figure 5c.
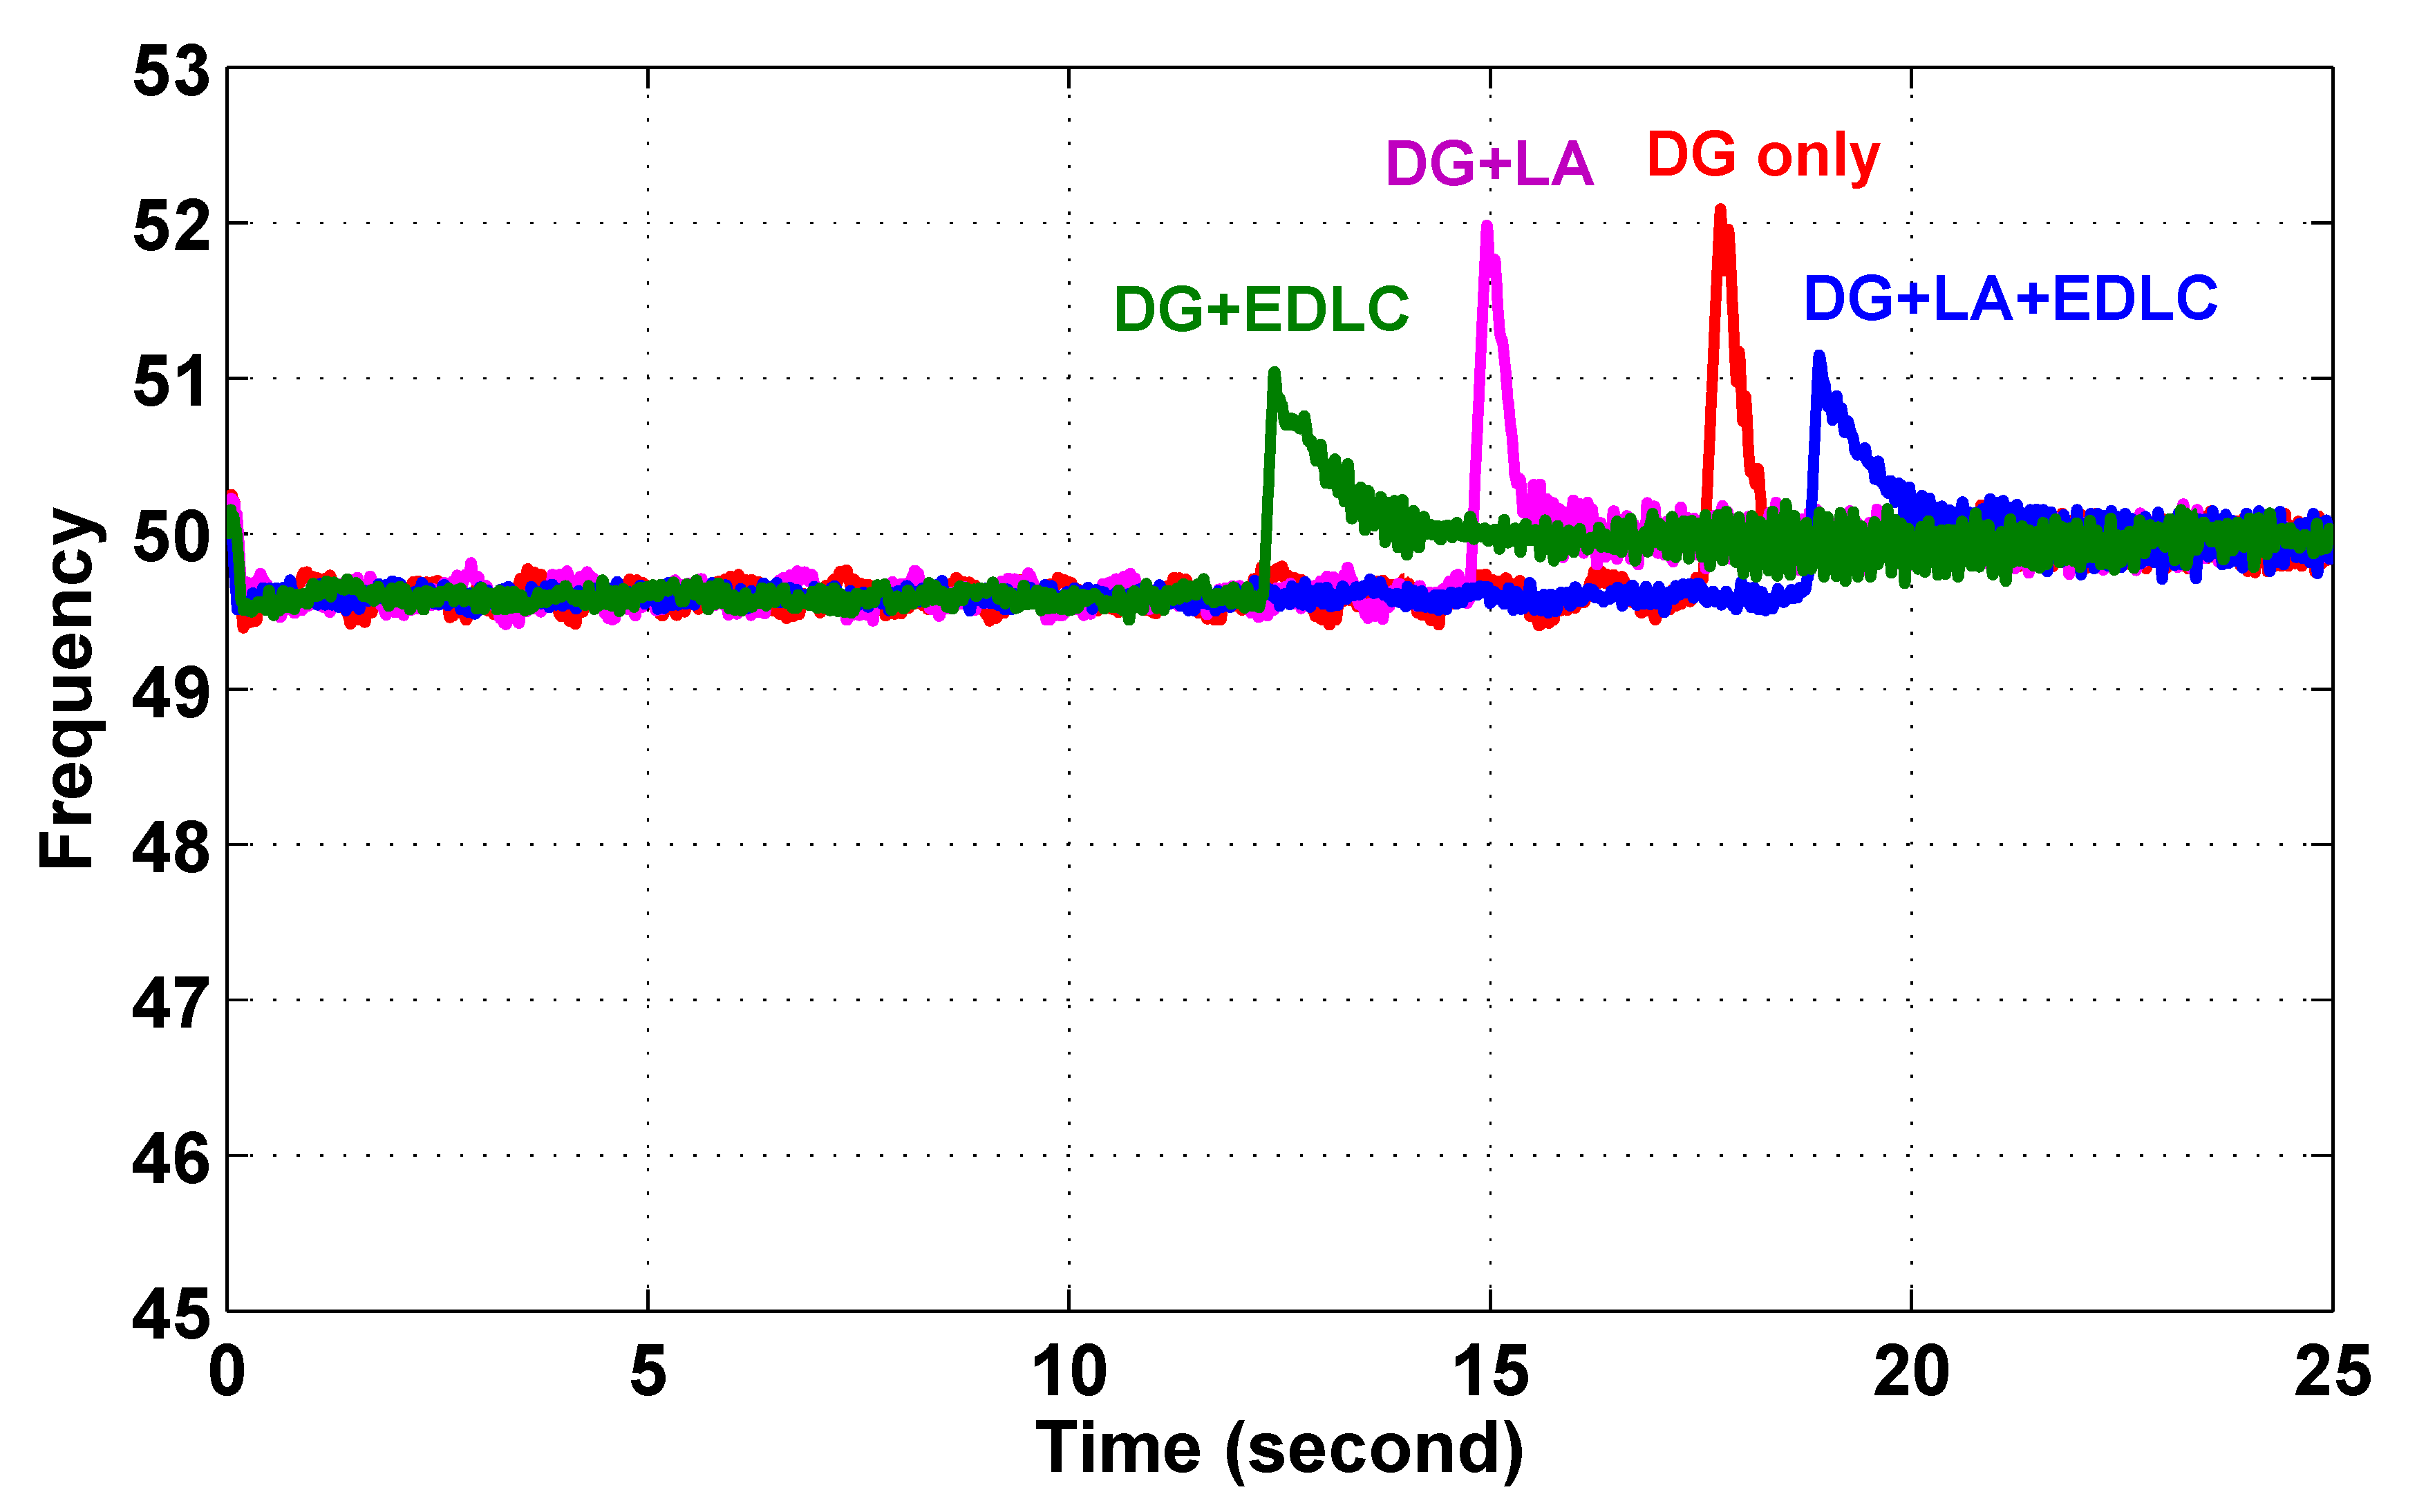
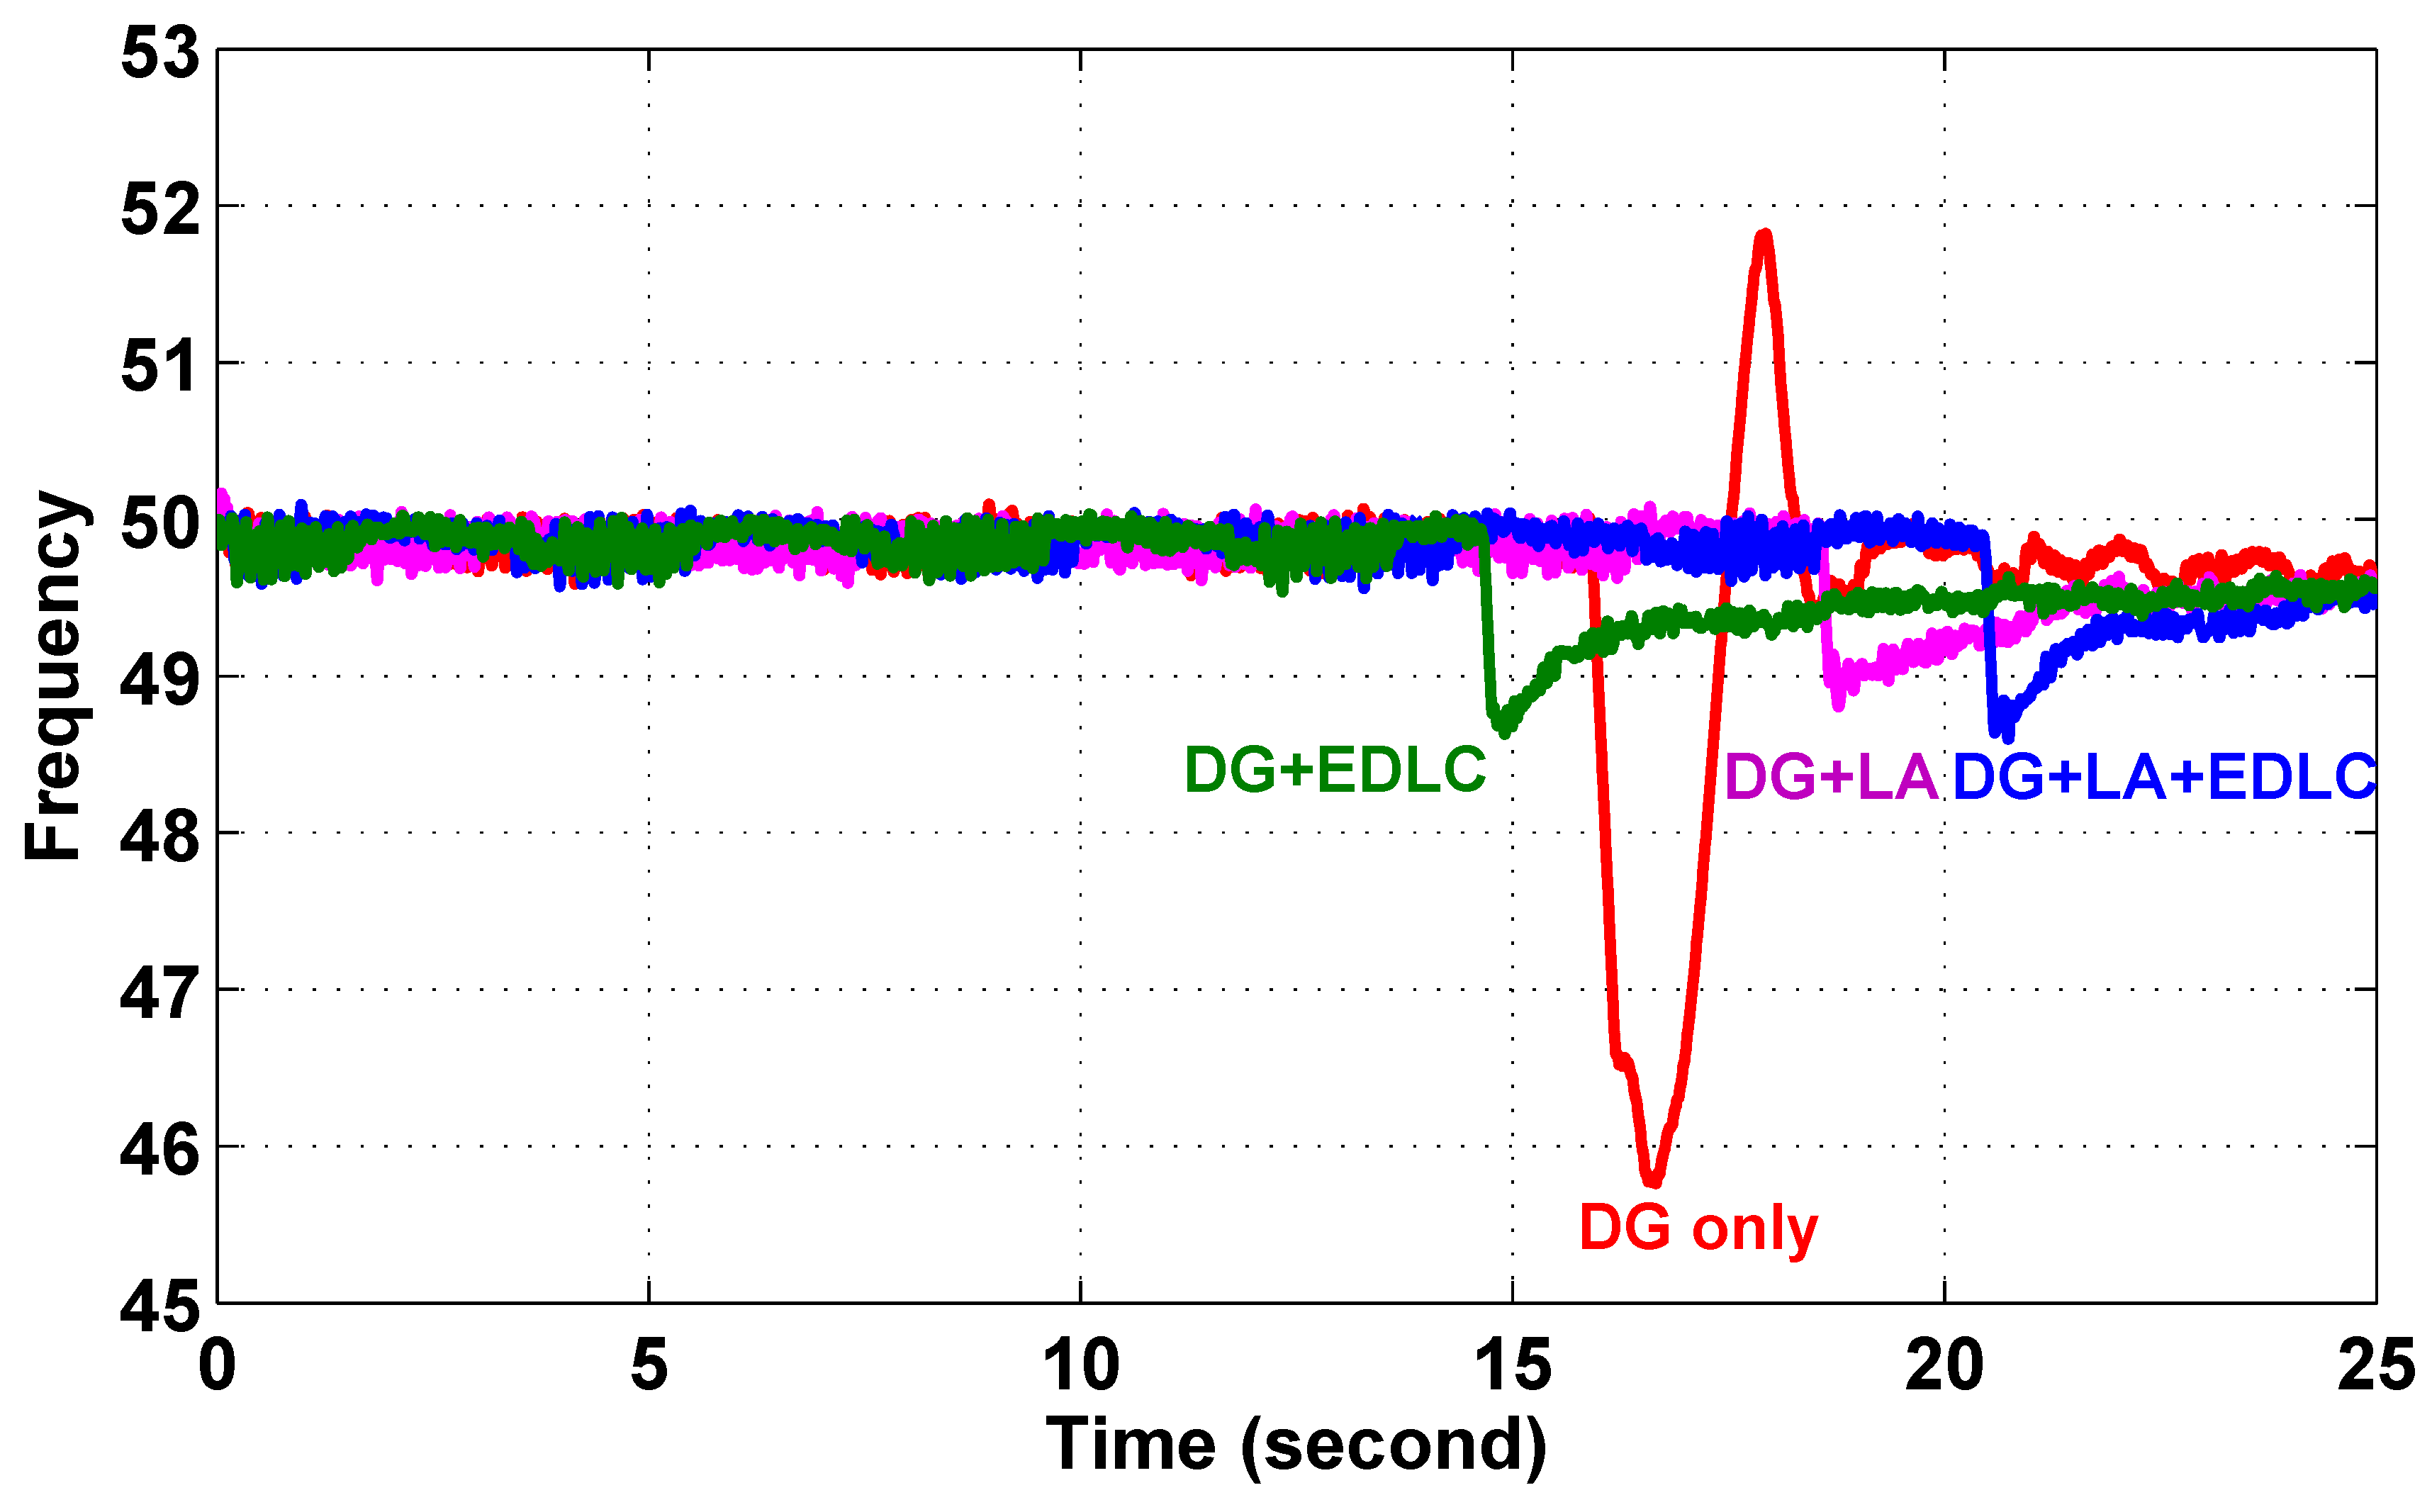
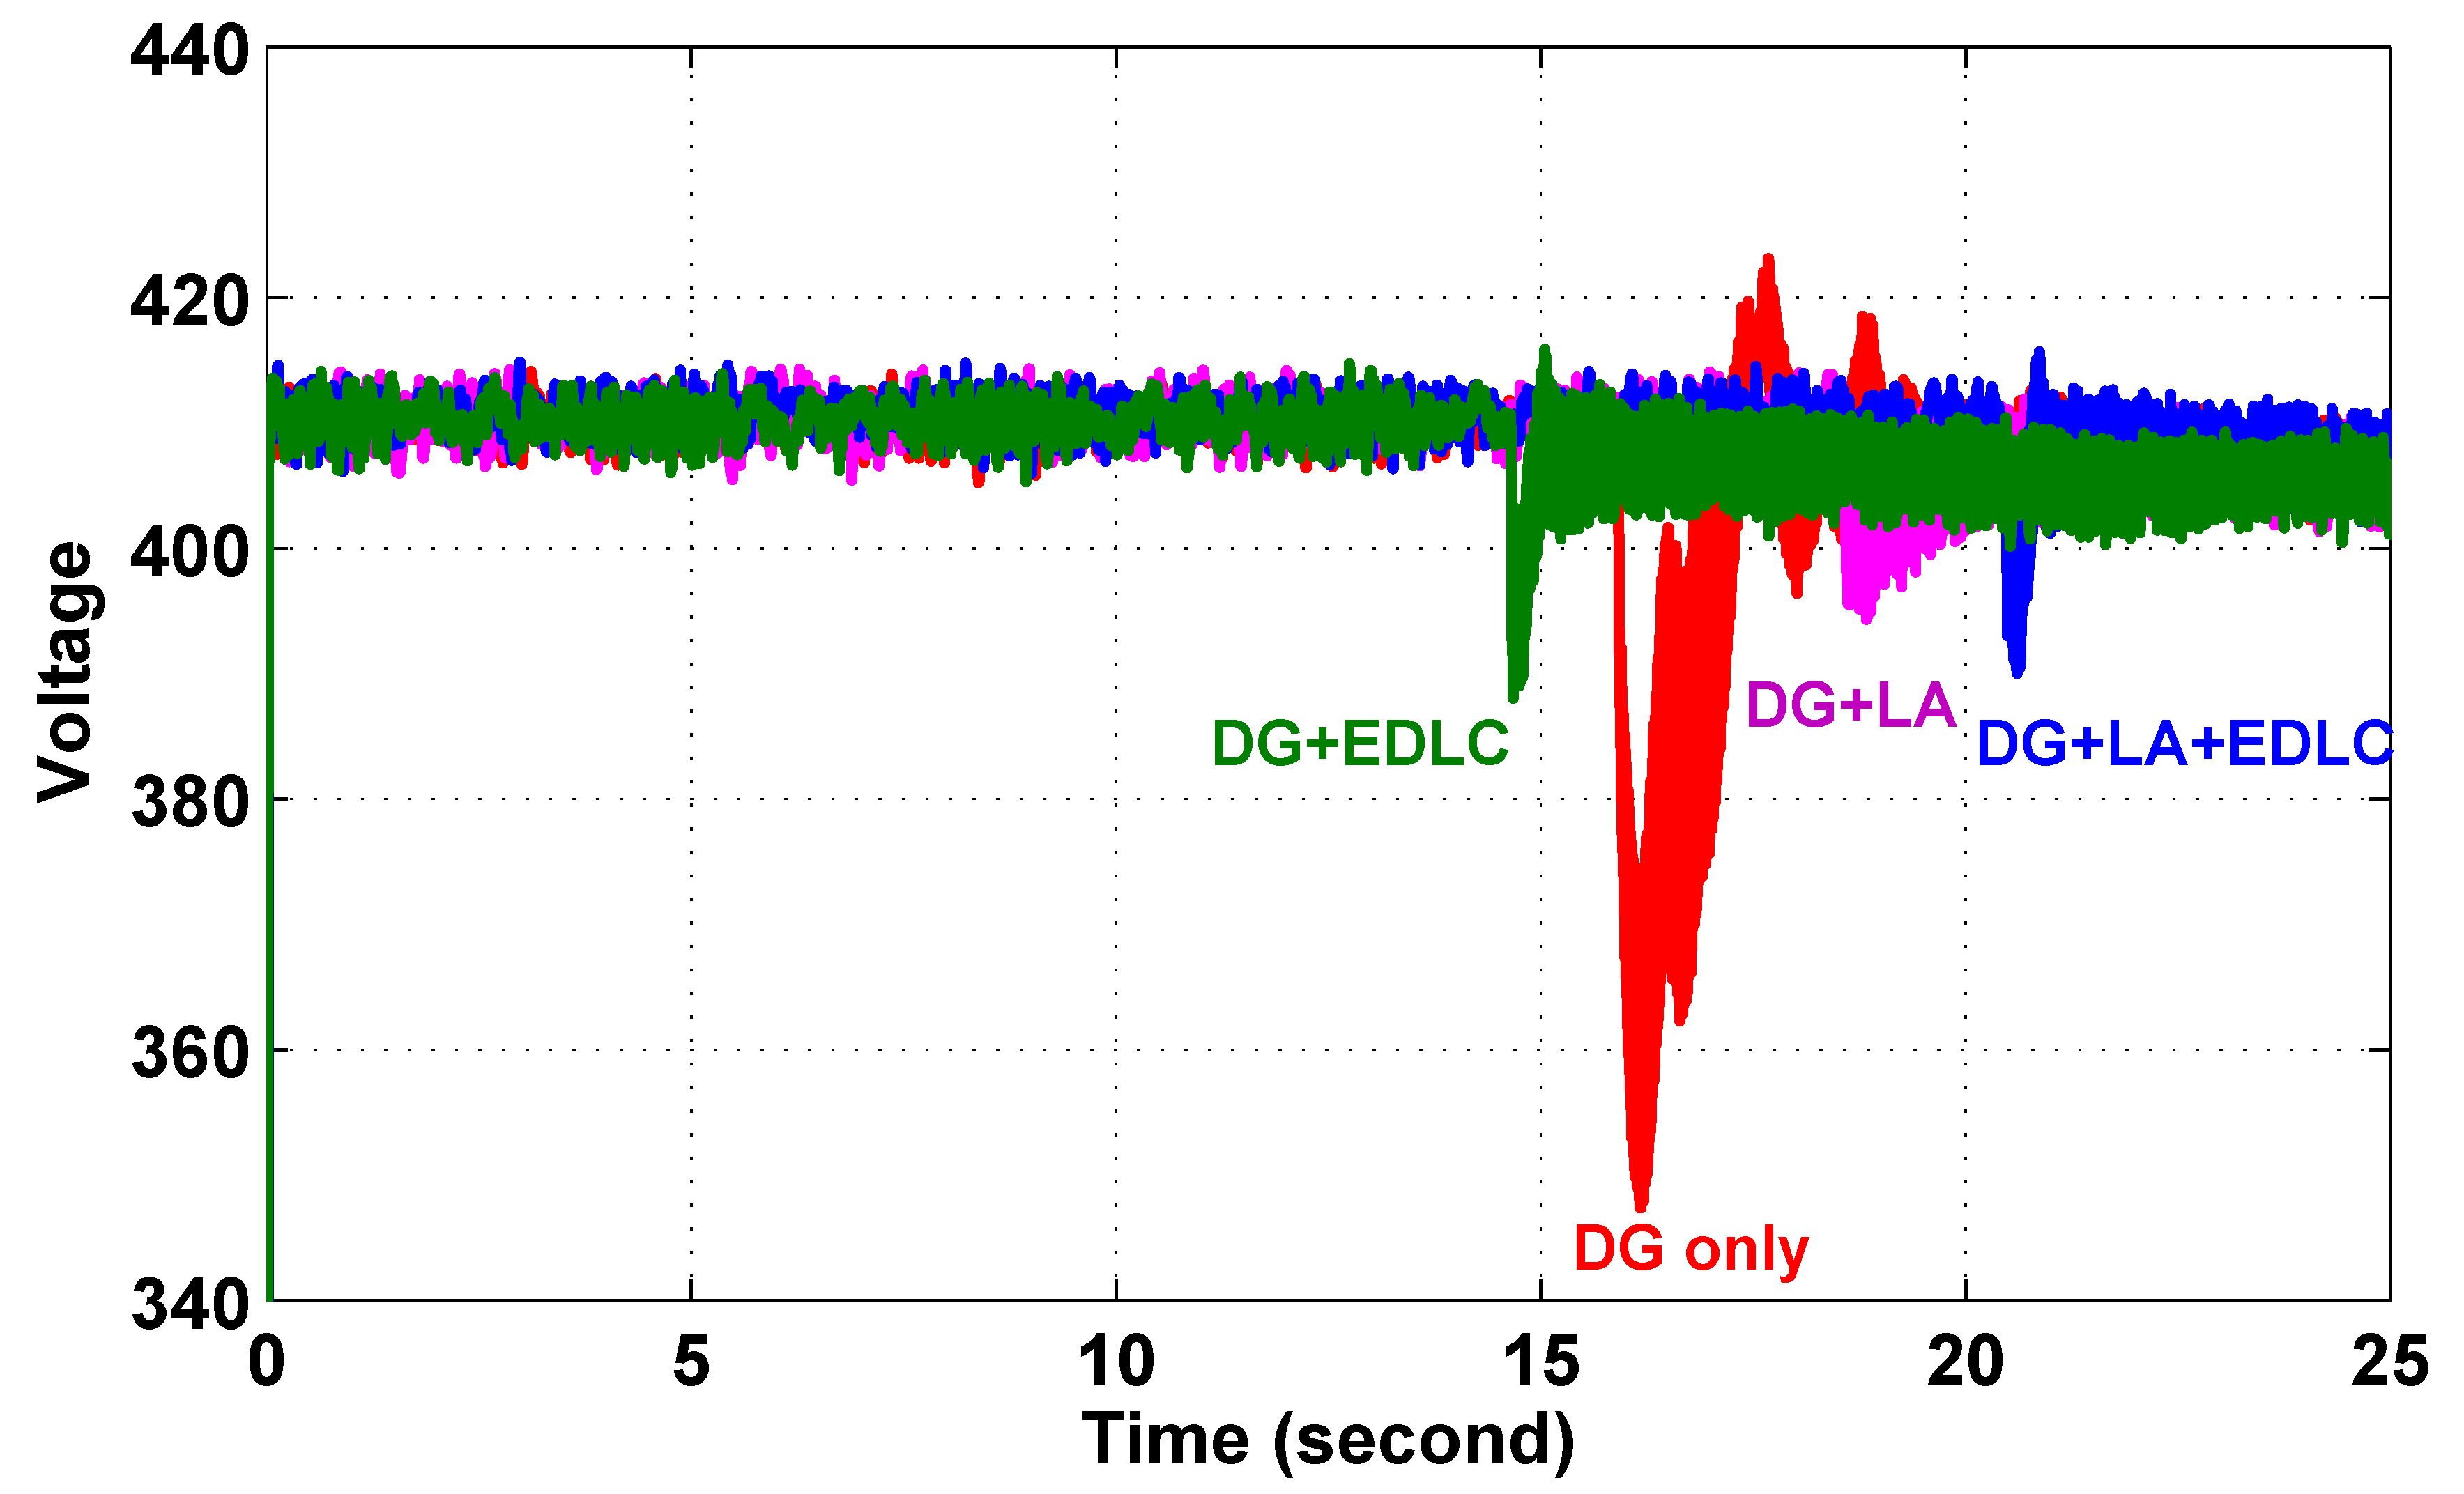
As shown in
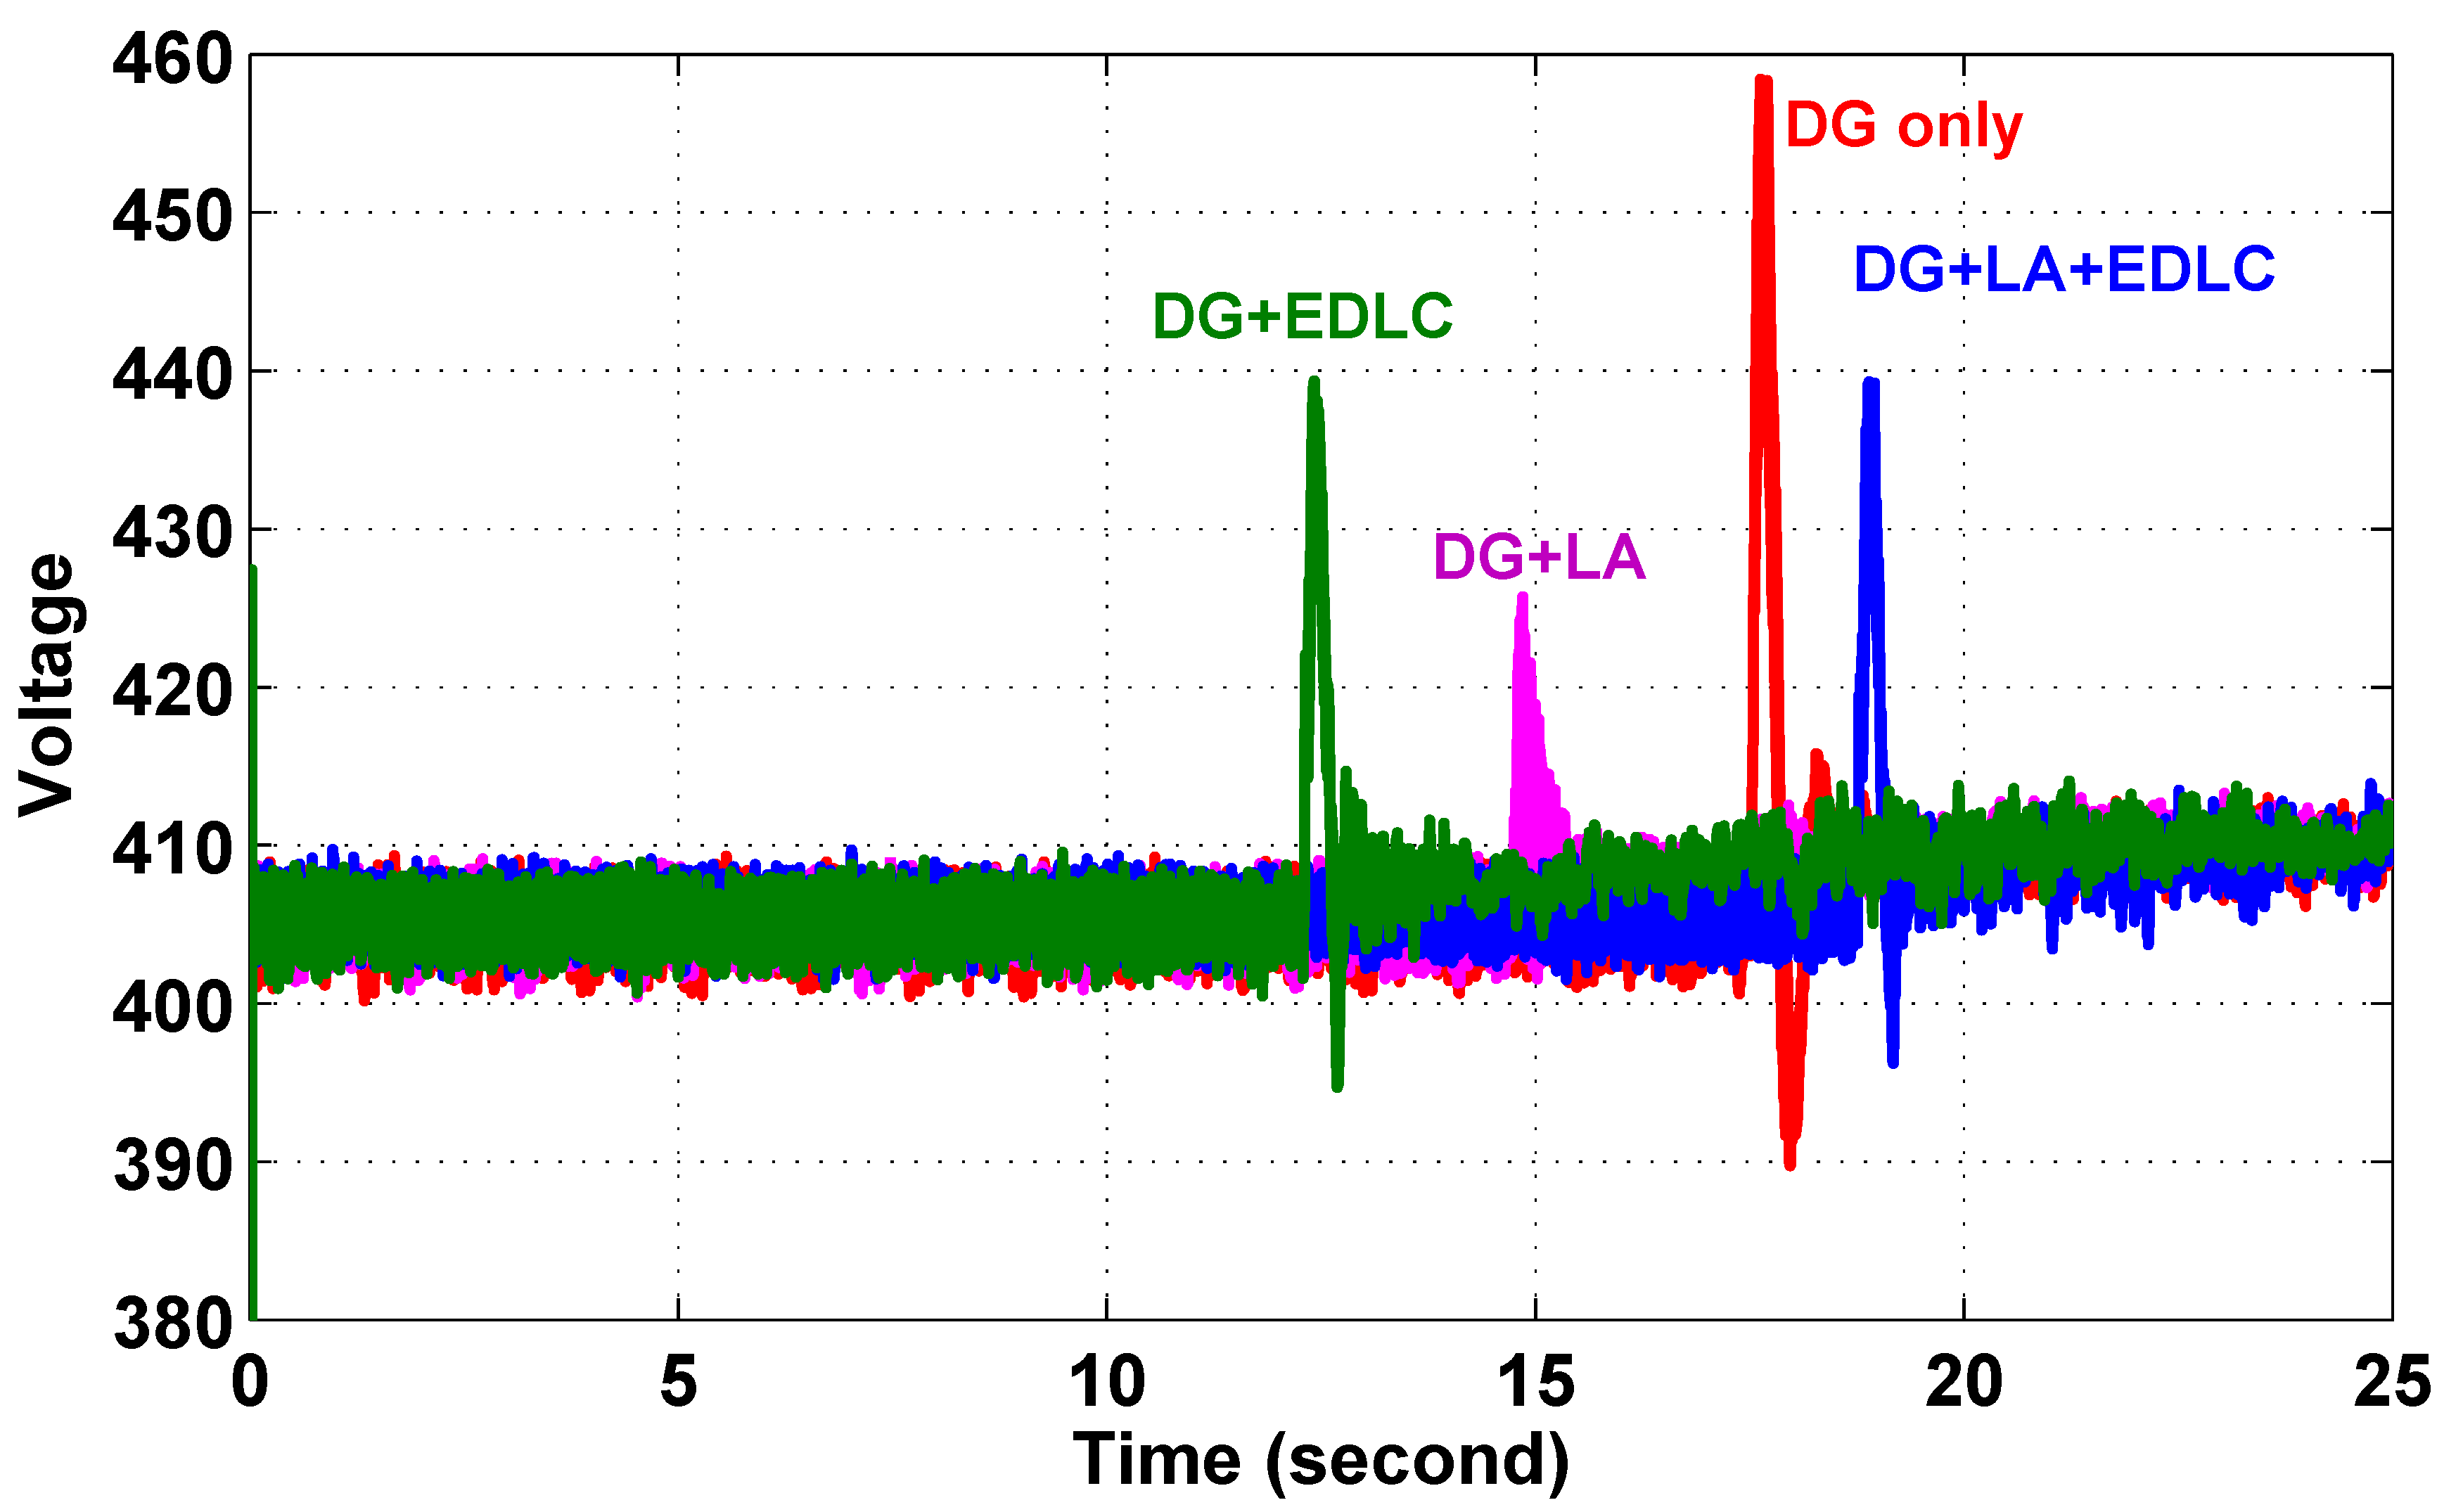
Figure 10, the microgrid frequency varies from 50 to 45.77 Hz (8.5%) and voltage varies from 410 to 347 V (15%) when load changes from 50 kW, 0 kVAr to 150 kW, 50 kVAr during DG2 operation only. The same load change test is then repeated after activating the LeadAcid (LA) storage local follow control, which shows significant improvement in the microgrid frequency and voltage. With DG2 and LA storage, the microgrid frequency varies from 50 to 48.97 Hz (2%) and voltage varies from 410 to 39 5V (3.5%), which is significantly better than without storage. Similarly, the experimental results for the load step-down test also demonstrate the frequency and voltage regulation in the microgrid when storage system local follow control is activated.
Figure 10.
Experimental result showing microgrid frequency with and without storage during load step up from 50 kW, 0 kVAr to 150 kW, 50 kVAr.
Figure 10.
Experimental result showing microgrid frequency with and without storage during load step up from 50 kW, 0 kVAr to 150 kW, 50 kVAr.
Figure 11.
Experimental result showing microgrid voltage with and without storage during load step up from 50 kW, 0 kVAr to 150 kW, 50 kVAr.
Figure 11.
Experimental result showing microgrid voltage with and without storage during load step up from 50 kW, 0 kVAr to 150 kW, 50 kVAr.
Figure 12.
Experimental result showing microgrid frequency with and without storage during load step down from 150 kW, 50 kVAr to 50 kW, 0 kVAr.
Figure 12.
Experimental result showing microgrid frequency with and without storage during load step down from 150 kW, 50 kVAr to 50 kW, 0 kVAr.
Figure 13.
Experimental result showing microgrid voltage with and without storage during load step down from 150 kW, 50 kVAr to 50 kW, 0 kVAr.
Figure 13.
Experimental result showing microgrid voltage with and without storage during load step down from 150 kW, 50 kVAr to 50 kW, 0 kVAr.
Table 3.
Summary of frequency and voltage variation with and without storage during step load change.
Table 3.
Summary of frequency and voltage variation with and without storage during step load change.
| Load Test | Parameter | DG only | DG1+LeadAcid | DG1+LA+EDLC1 | DG1+EDLC1 |
|---|
| Step Up | Frequency | −4.23 to 1.82 Hz | −1.03 Hz | −1.19 Hz | −1.26 Hz |
| Step Down | Frequency | 2.09 Hz | 1.94 Hz | 1.03 Hz | 1.04 Hz |
| Step Up | Voltage | 13.1 to −62.6 V | −14.5 V | 5.7 to −20.0 V | 5.9 to −23.1 V |
| Step Down | Voltage | 56.1 to −12.2 V | 22 V | 34.3 to −7.4 V | 34.7 to −9.6 V |
3.4. Control of Distributed Generators
In simple microgrids, generation sources are often located close to each other. However, as microgrids grow and proliferate around the world, the generation sources within the microgrid can become more distributed. For example, renewable generation sources such as wind sources can be located at one side of the microgrid while main generators are located at the other side. In addition, microgrids can eventually connect with one another for greater reliability and resilience where generation from one microgrid can supply to another in times of need. However, such distributed generation or interconnection between microgrids may cause certain issues to arise especially when the generation sources have different control strategies. In the following experiment, a simple case of 2 generators connected via a line impedance has been used to showcase some problems that may occur in such situations. Even though additional sources and loads could have been easily added to this case, it has been simplified to highlight potential problems in distributed generation systems.
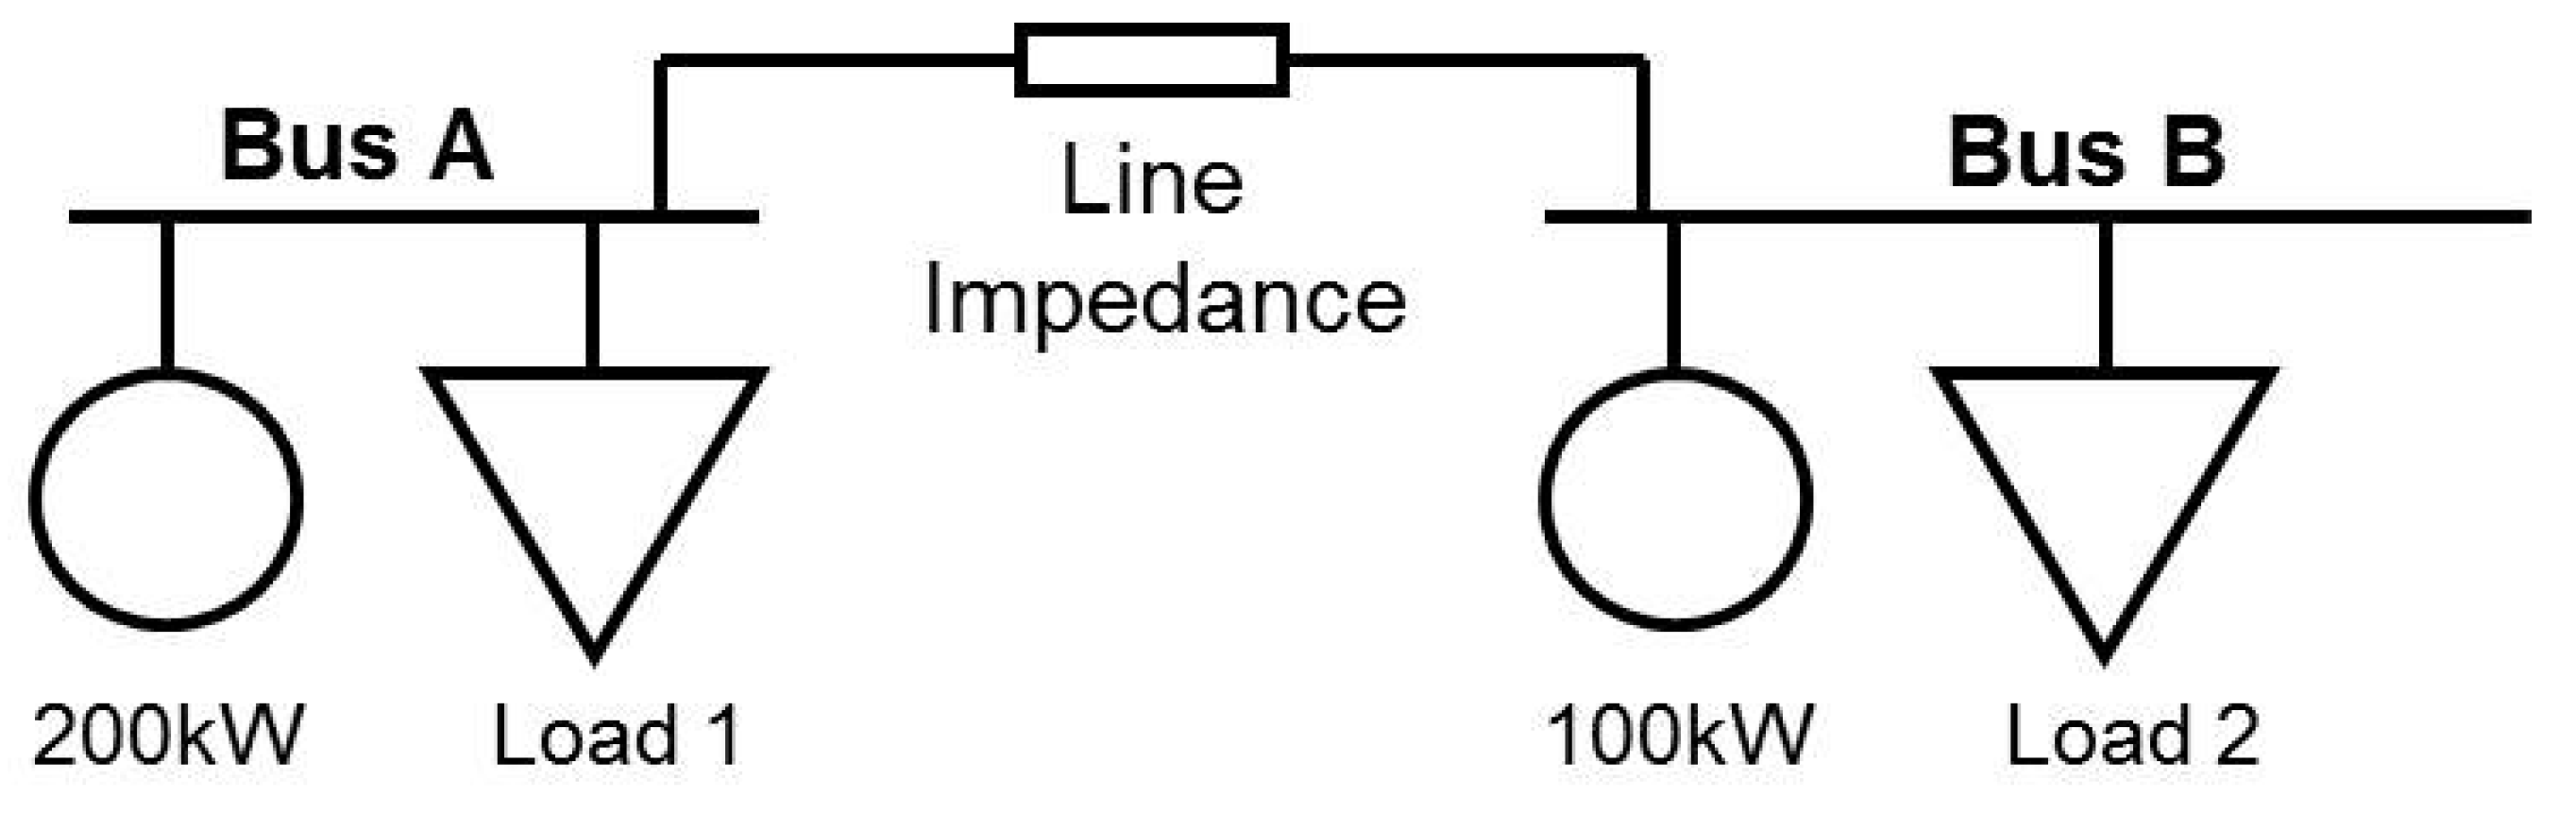
This case study experimentally investigates the workability of different control strategies for distributed generators. In the experimental setup, a 200 kW diesel generator (DG1) is run with a 100 kW diesel generator (DG2) separated by a line impedance of 20 + j33 mΩ as shown in
Figure 14. This line impedance is almost equivalent to 400m line length. This setup emulates a possible distributed generation scenario where sources connect to each other via short lengths of cable or overhead line. An example of such scenarios can occur in college campus microgrids where generation and load centers are distributed across a geographical area.
Figure 14.
Setup of experiment.
Figure 14.
Setup of experiment.
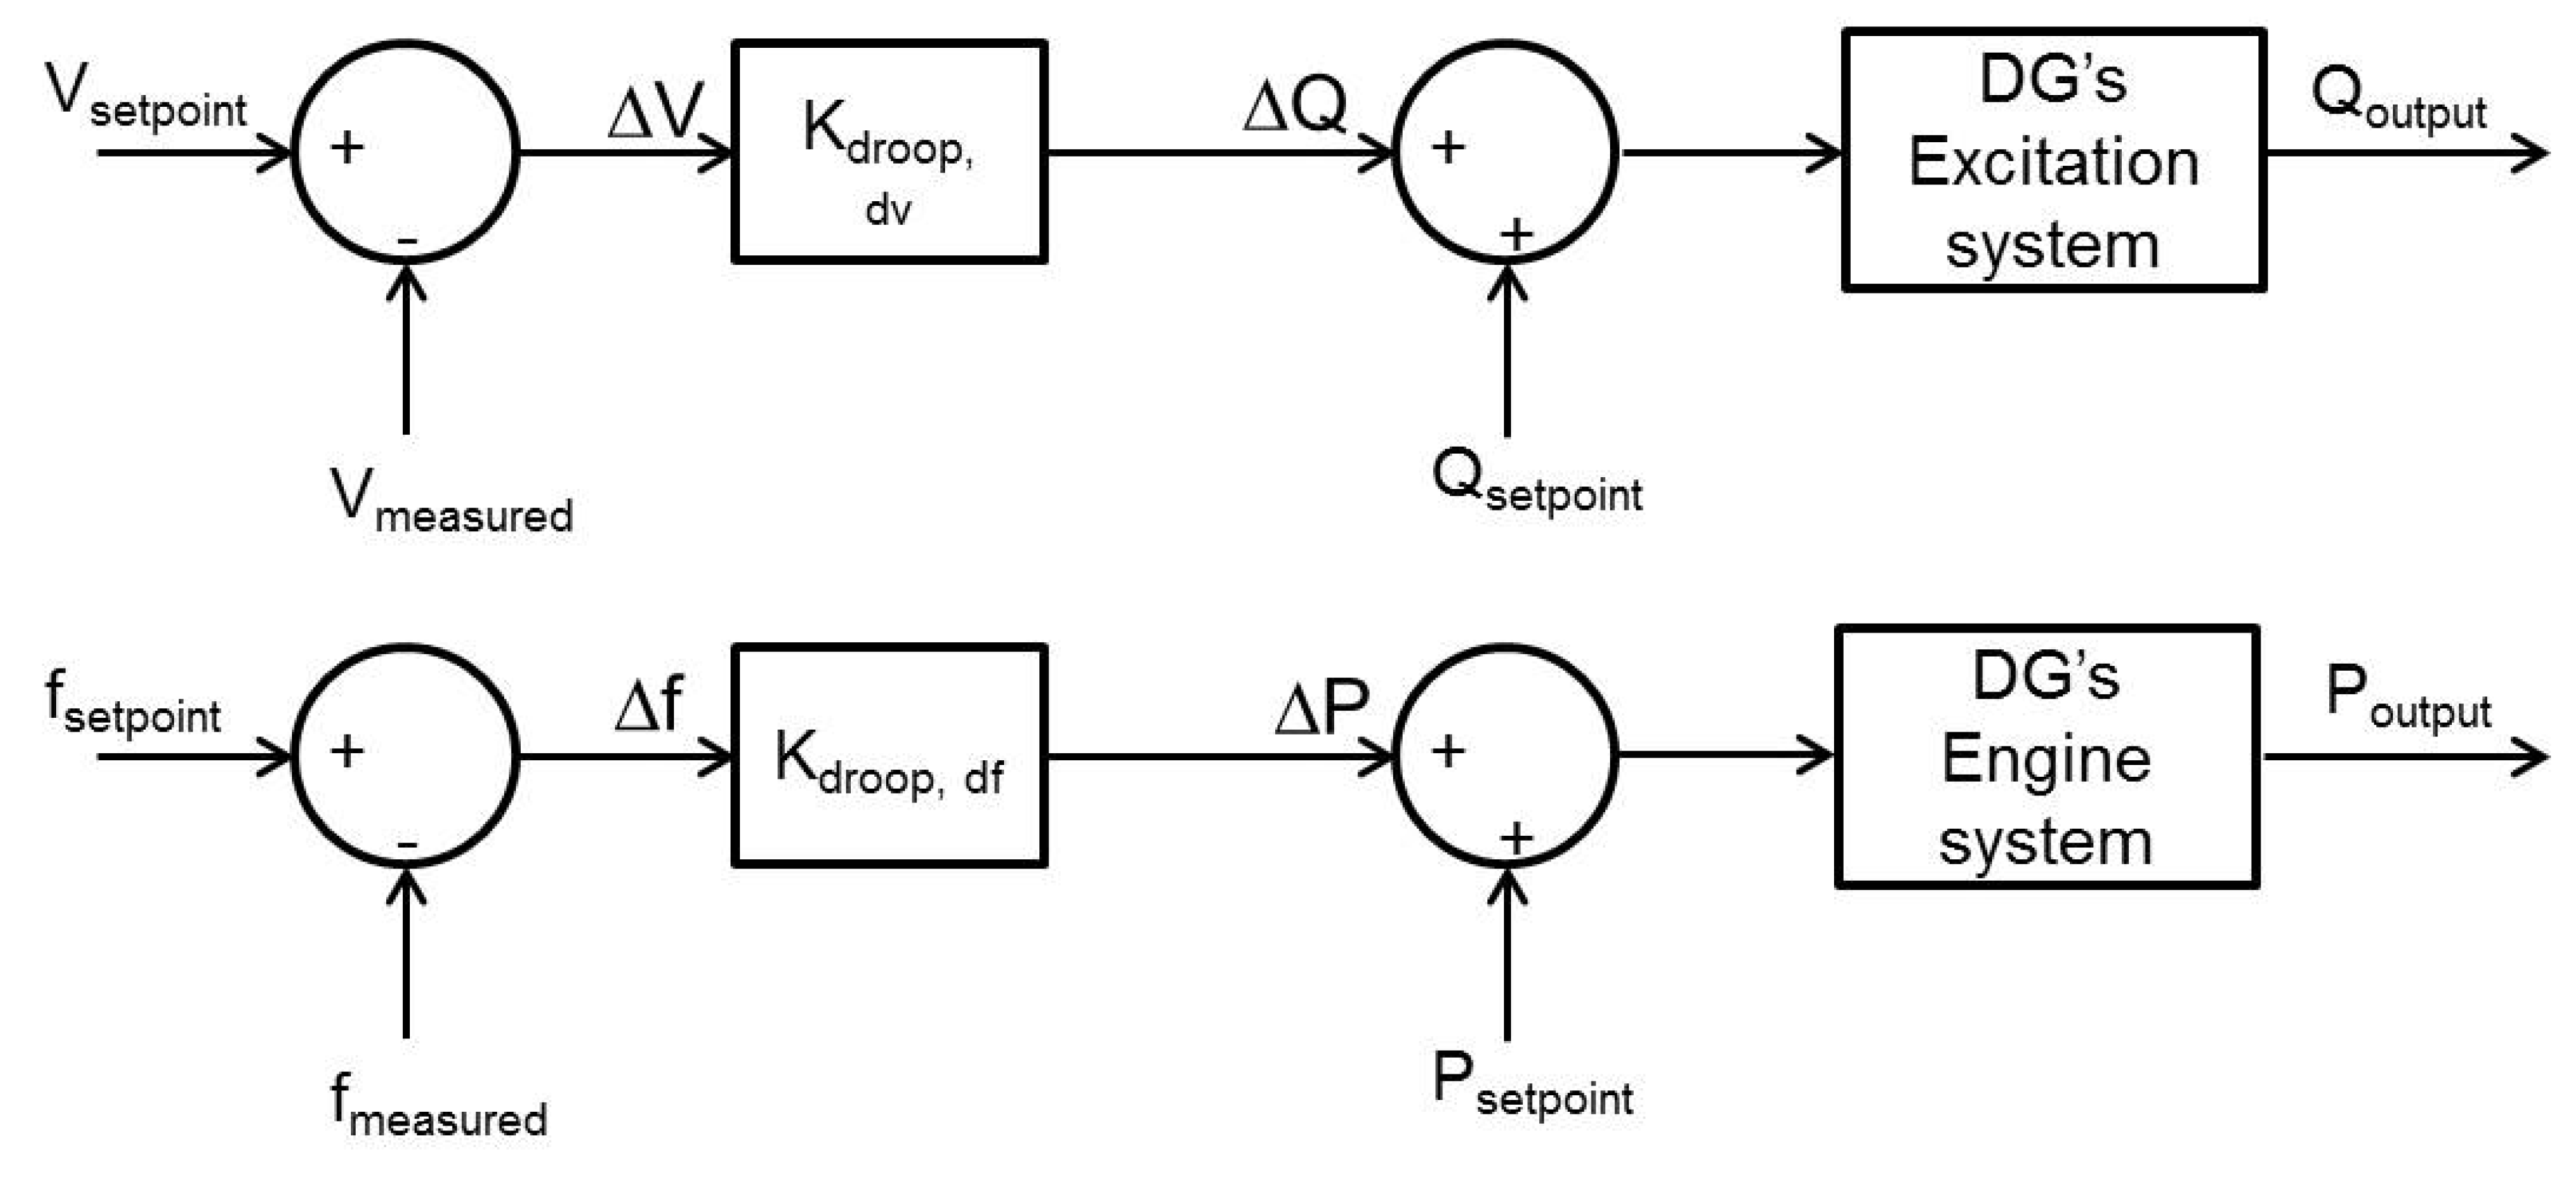
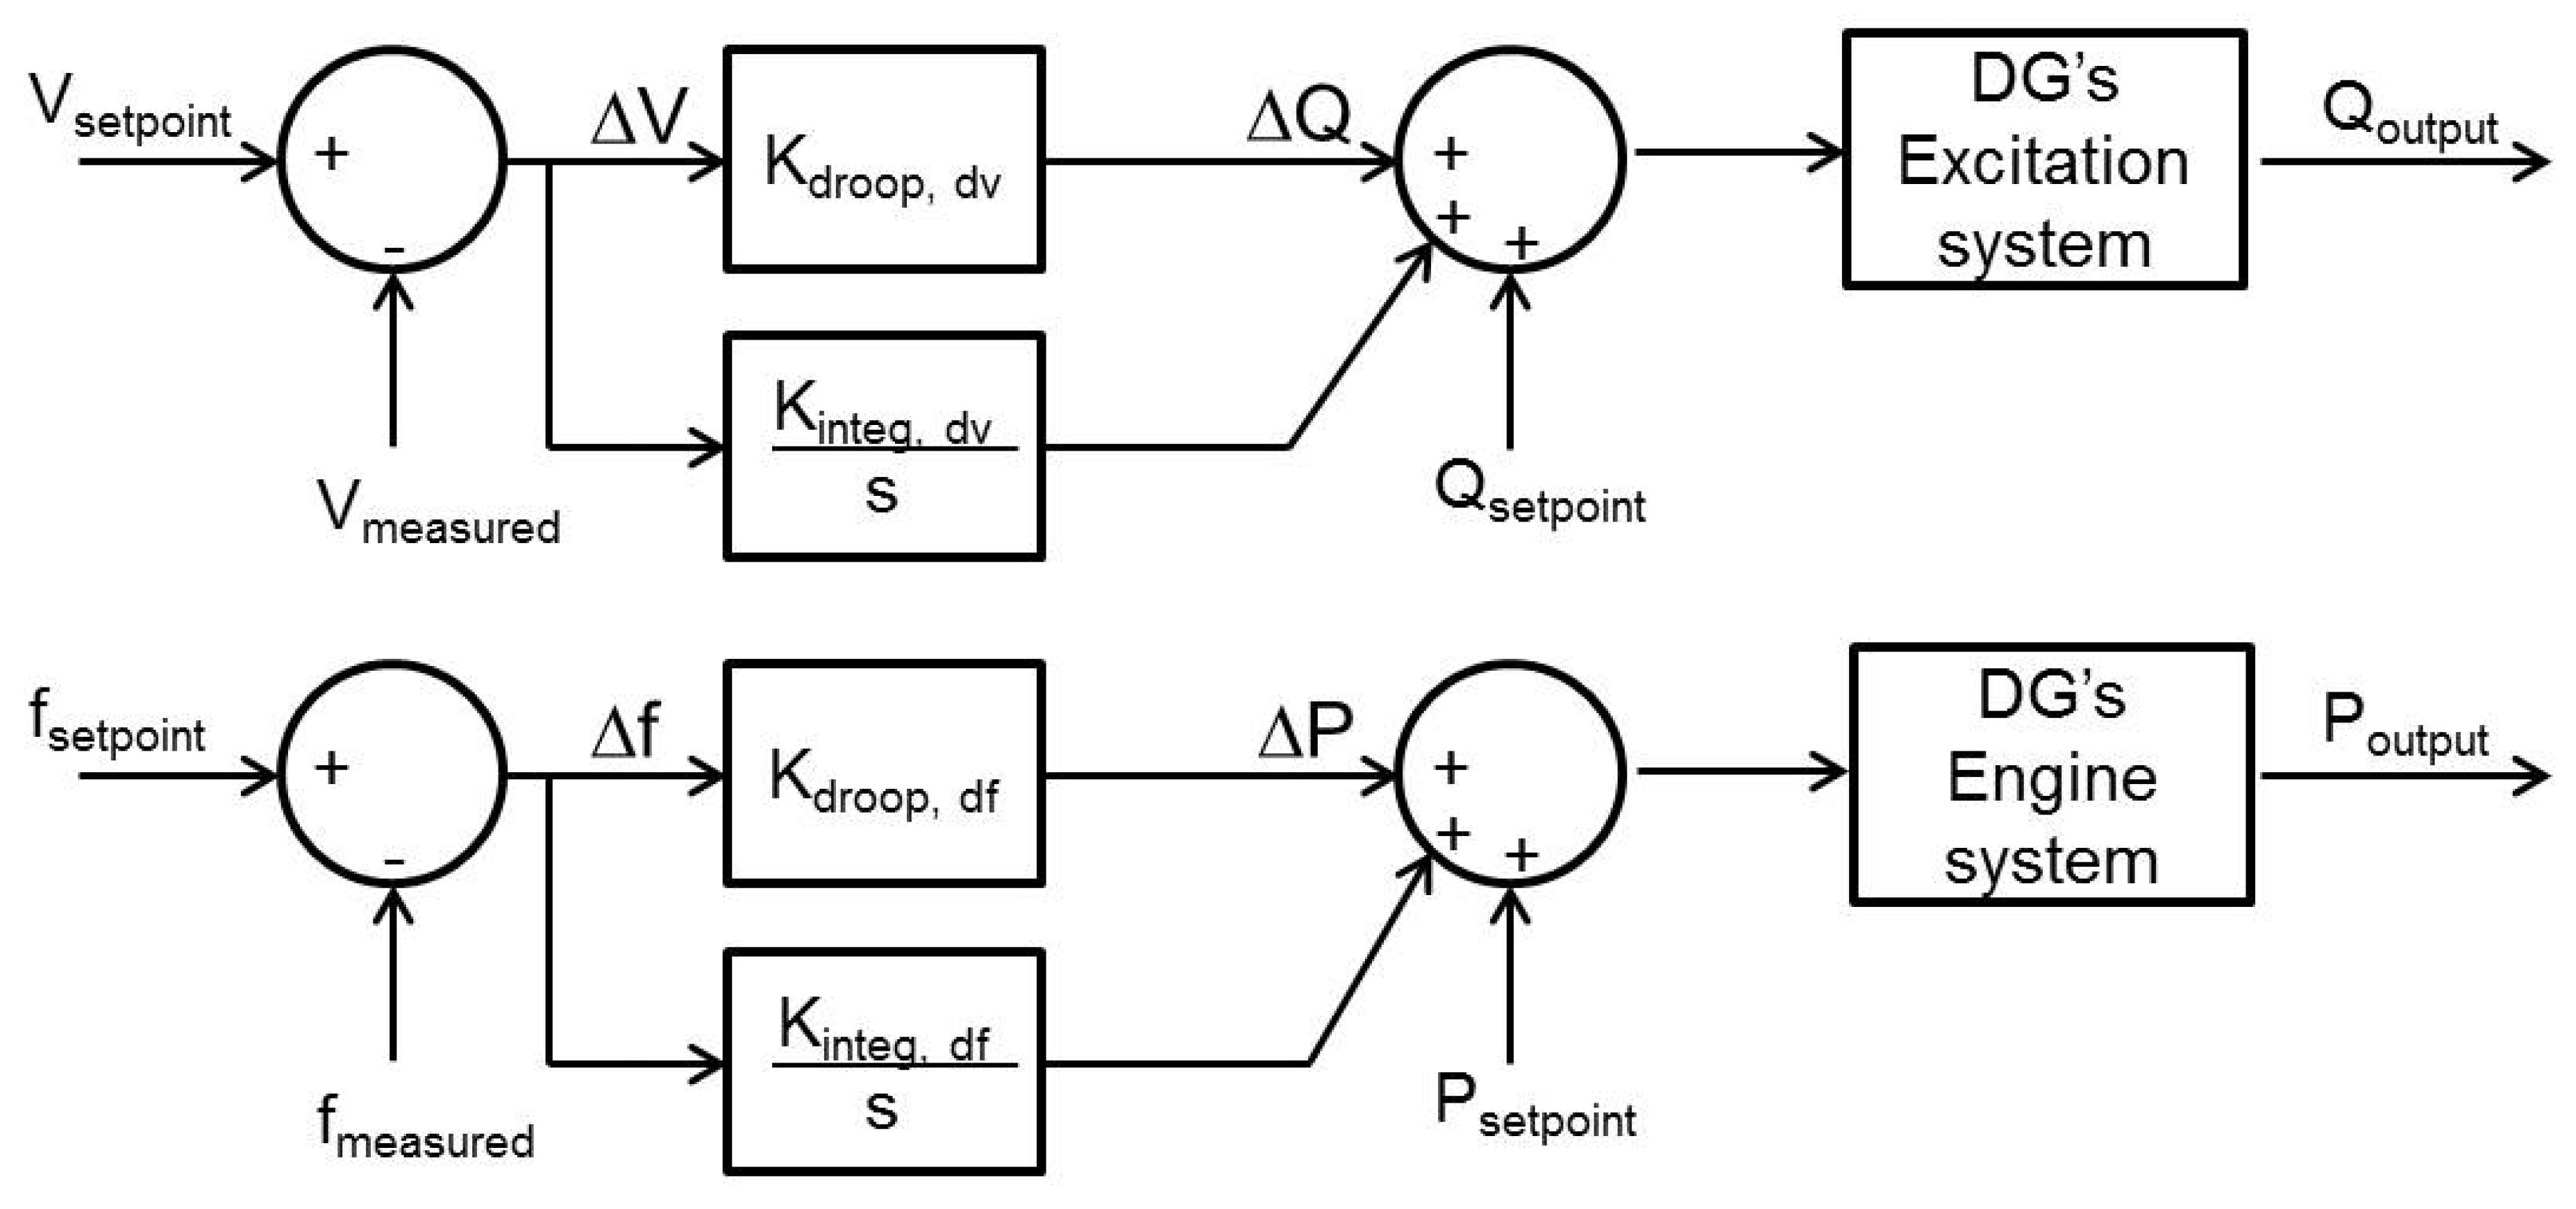
In this experiment, two different control strategies have been examined. In the first control scheme, both DGs run in Power-frequency and Reactive Power-Voltage droop modes. The control block diagrams are shown in
Figure 15. Loads 1 and 2 were then changed according to
Table 4. The active power, reactive power, voltages and frequency were then recorded.
Figure 15.
Droop control block diagrams for both DG1 and DG2.
Figure 15.
Droop control block diagrams for both DG1 and DG2.
Table 4.
Load profile of loads 1 and 2.
Table 4.
Load profile of loads 1 and 2.
| Number | Time (s) | Load 1 (kW) | Load 2 (kW) |
|---|
| 1 | 0 | 50 | 150 |
| 2 | 192 | 50 | 50 |
| 3 | 560 | 150 | 50 |
| 4 | 826 | 150 | 0 |
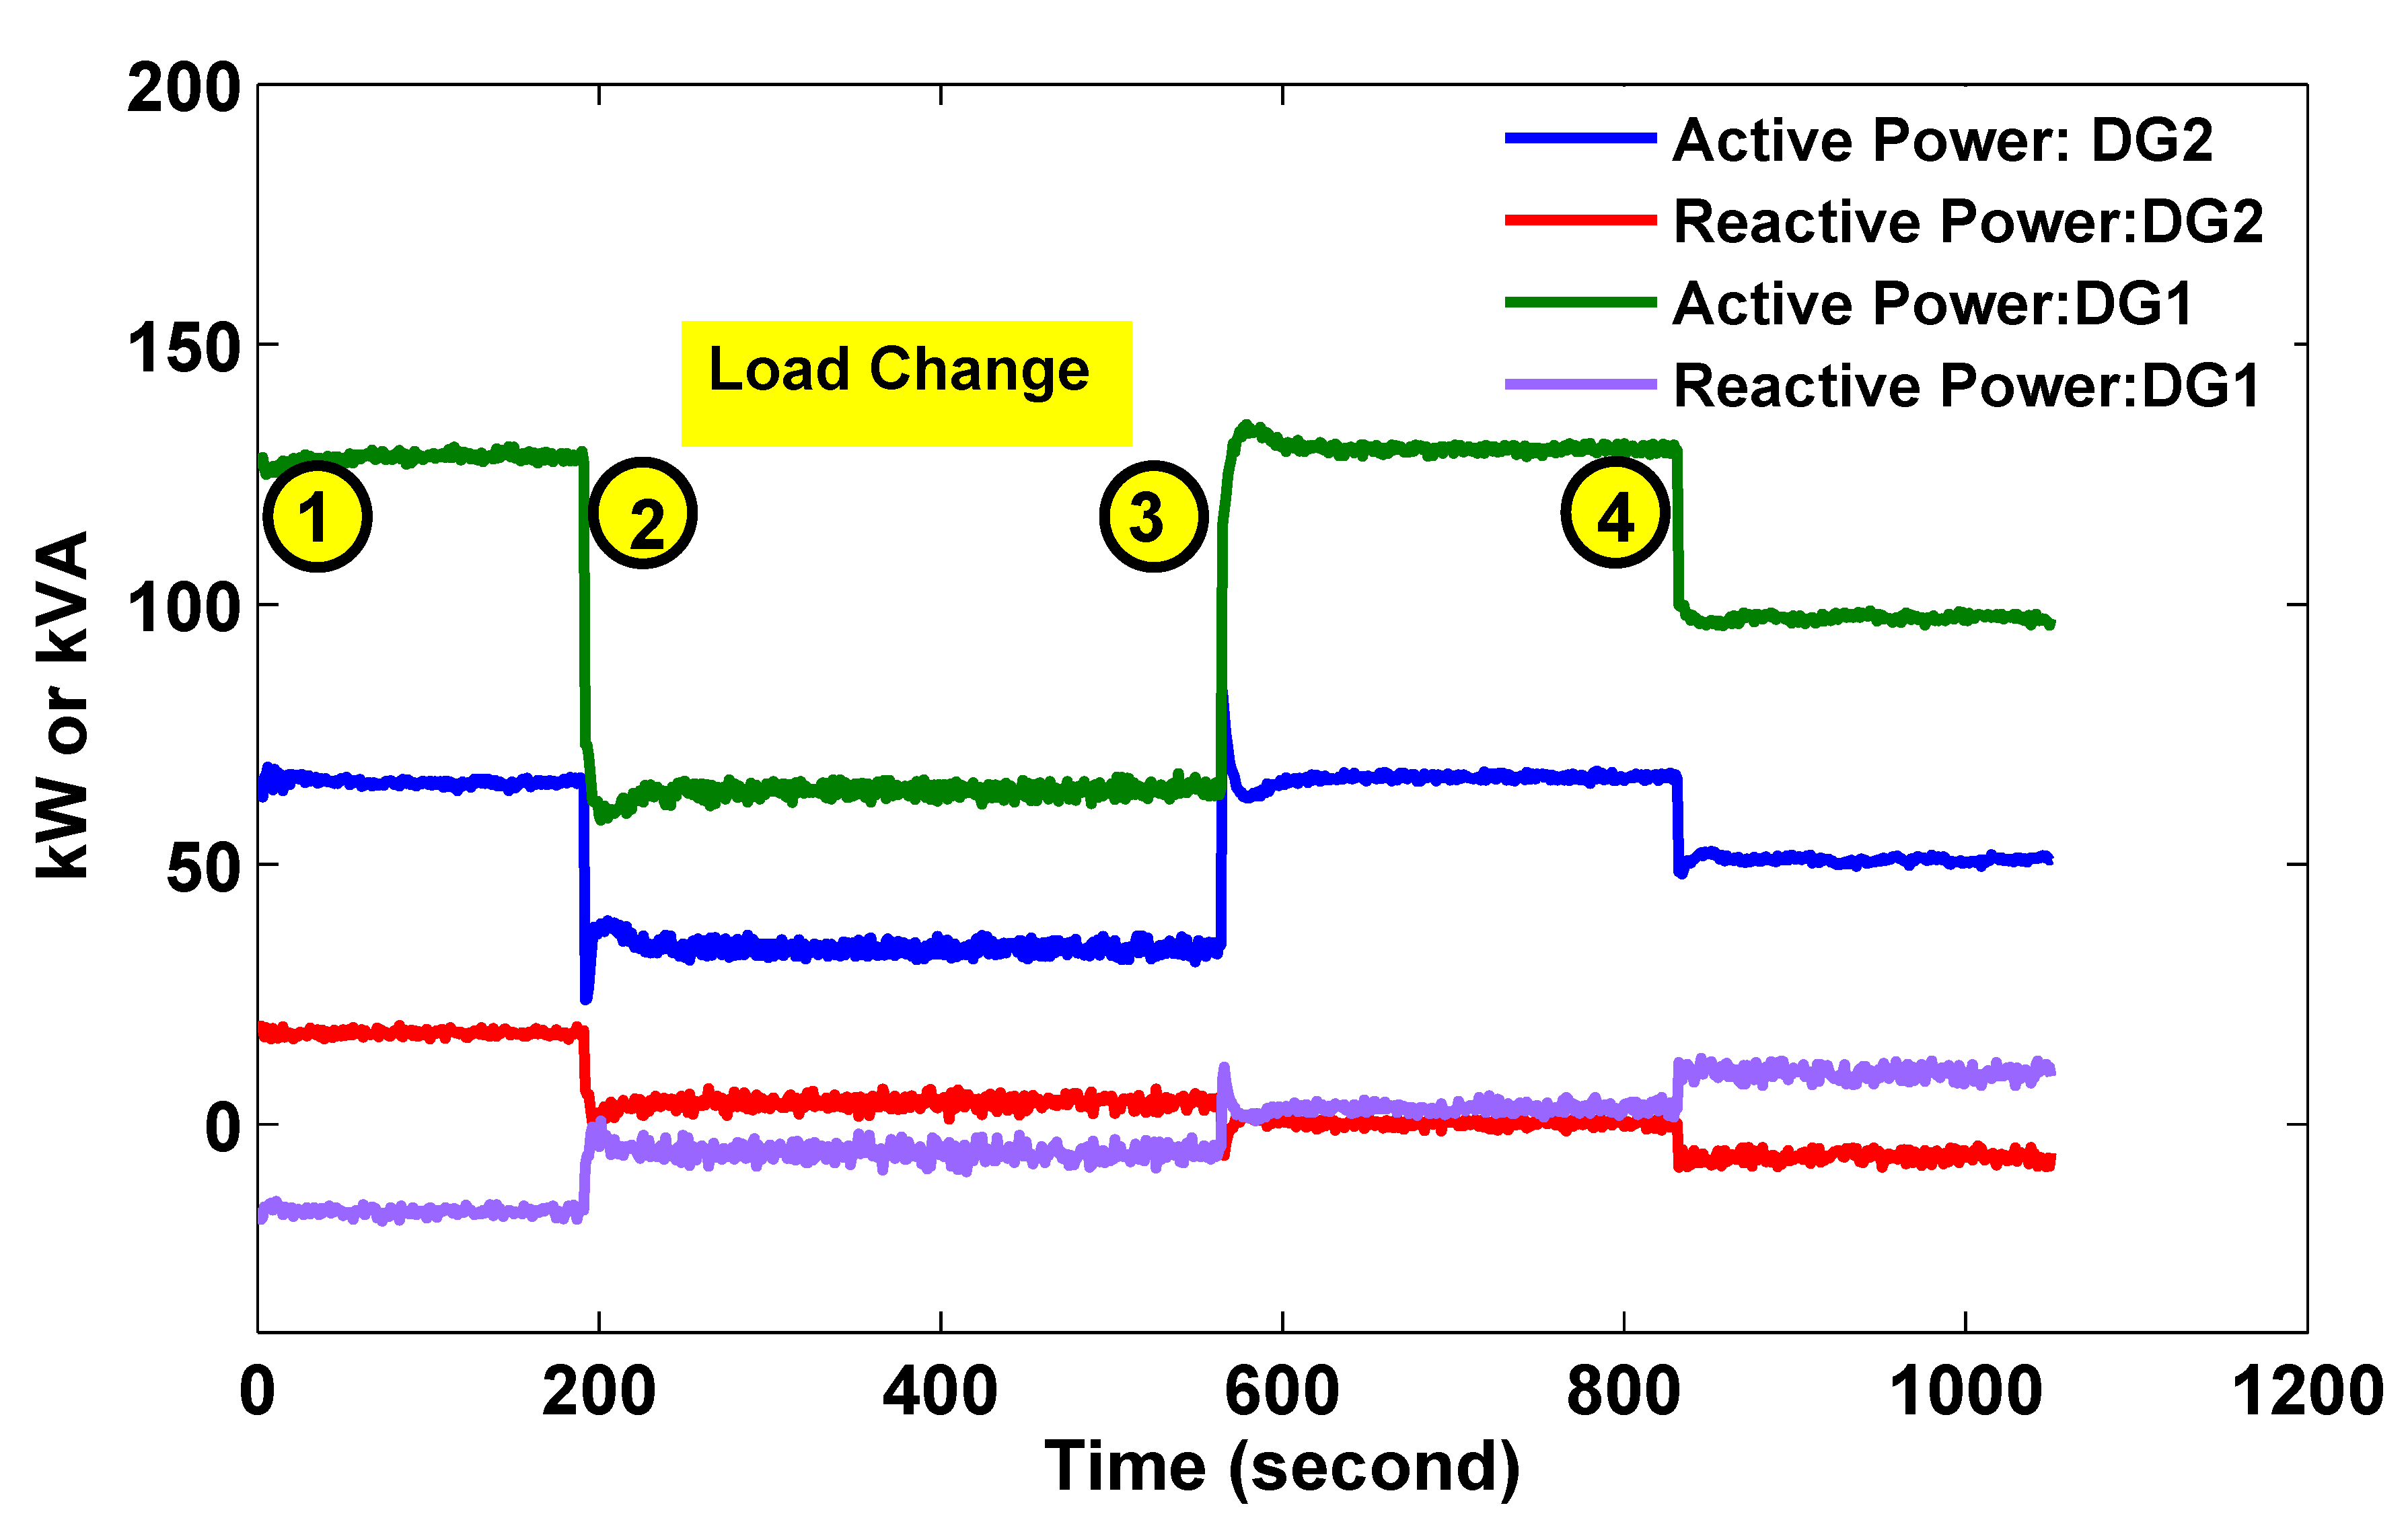
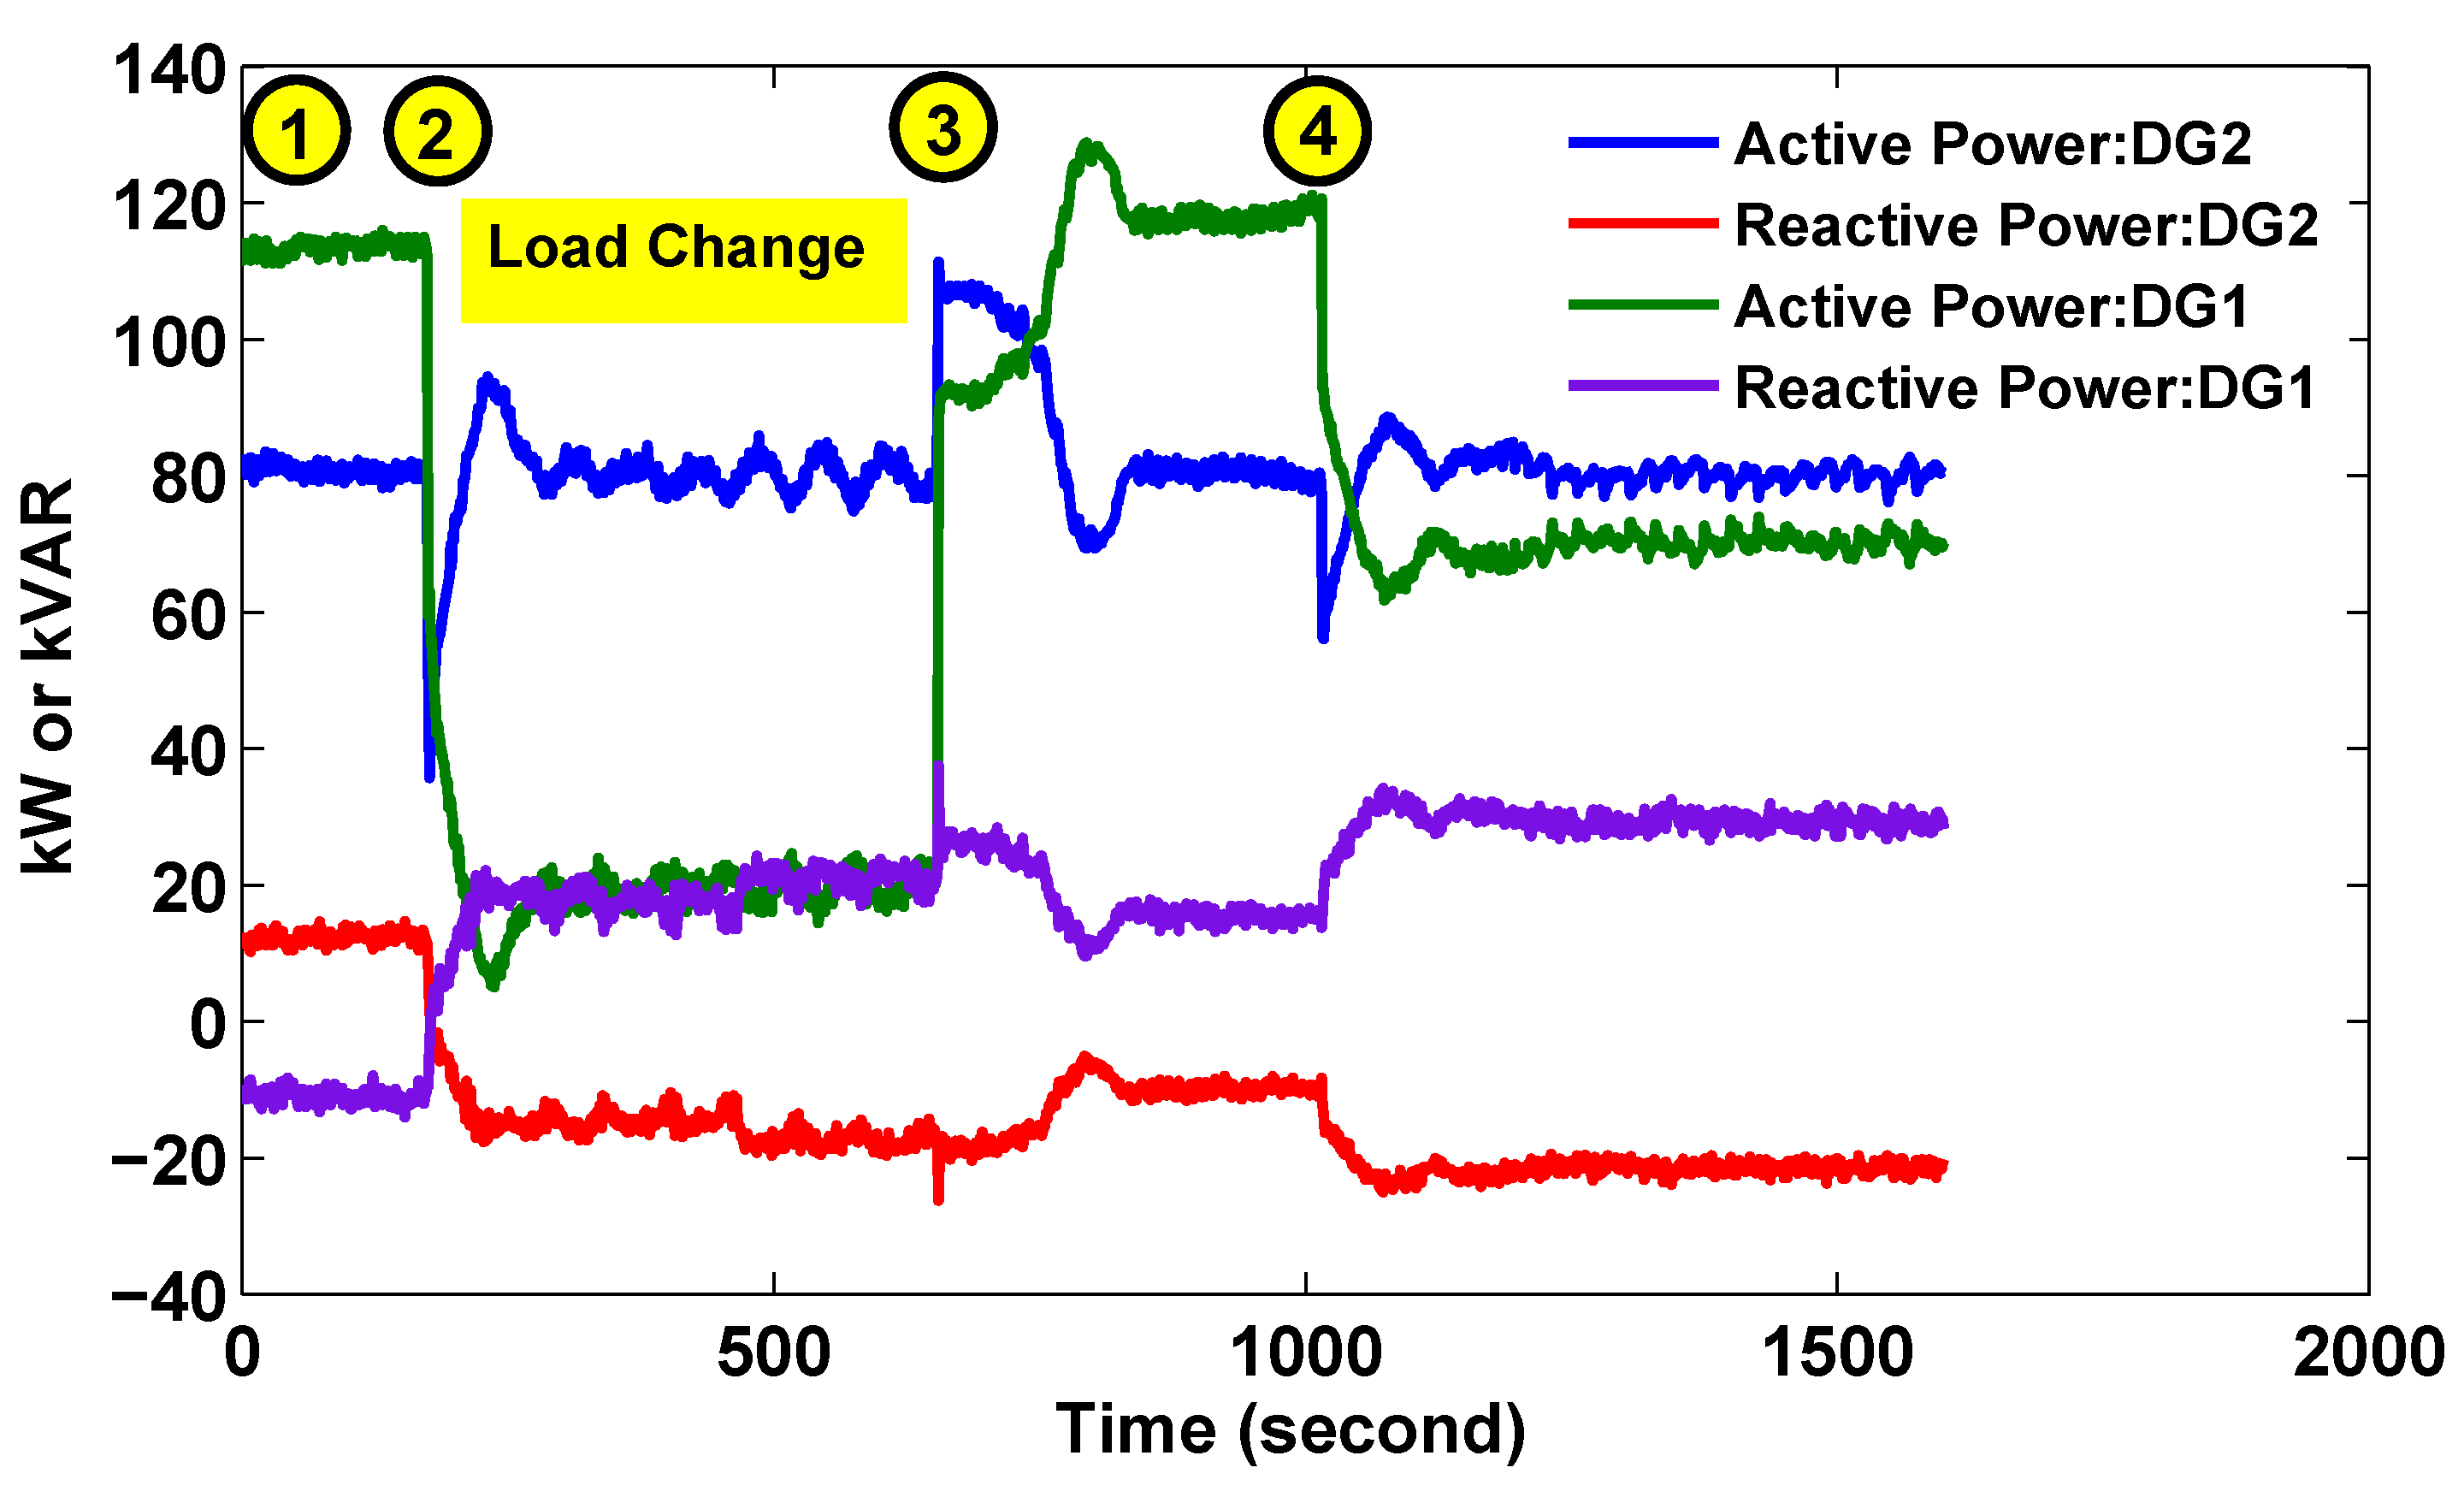
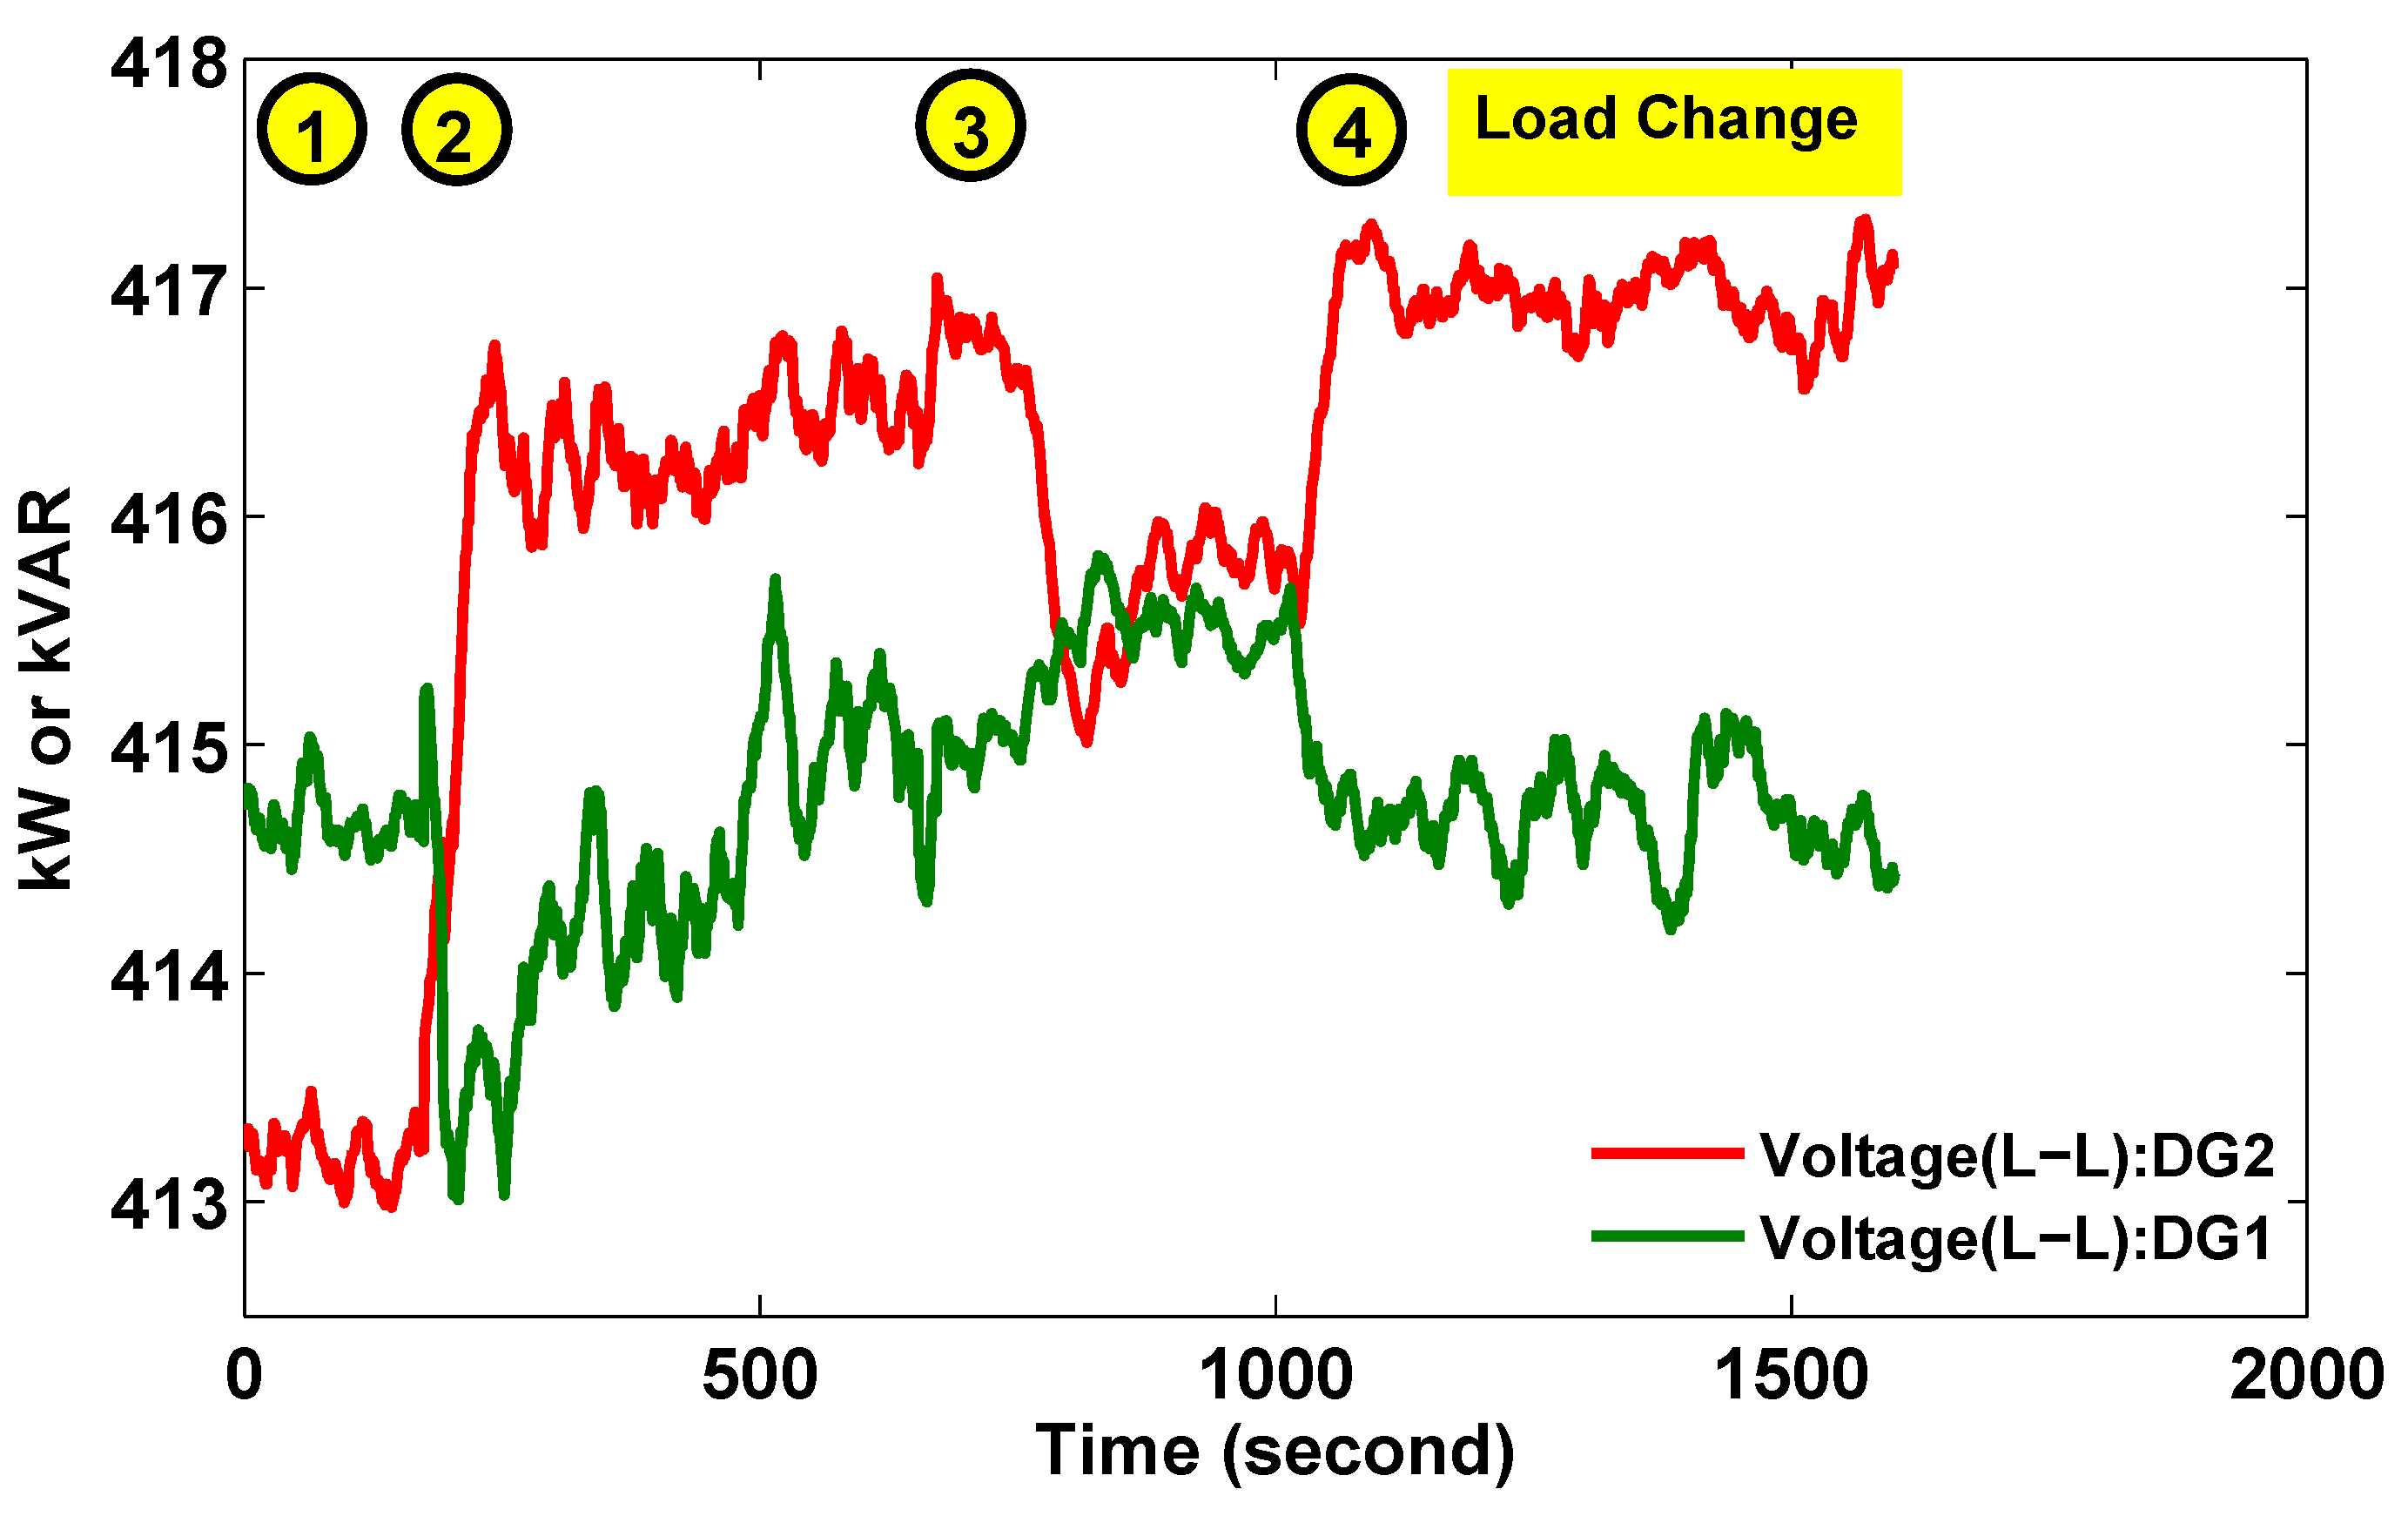
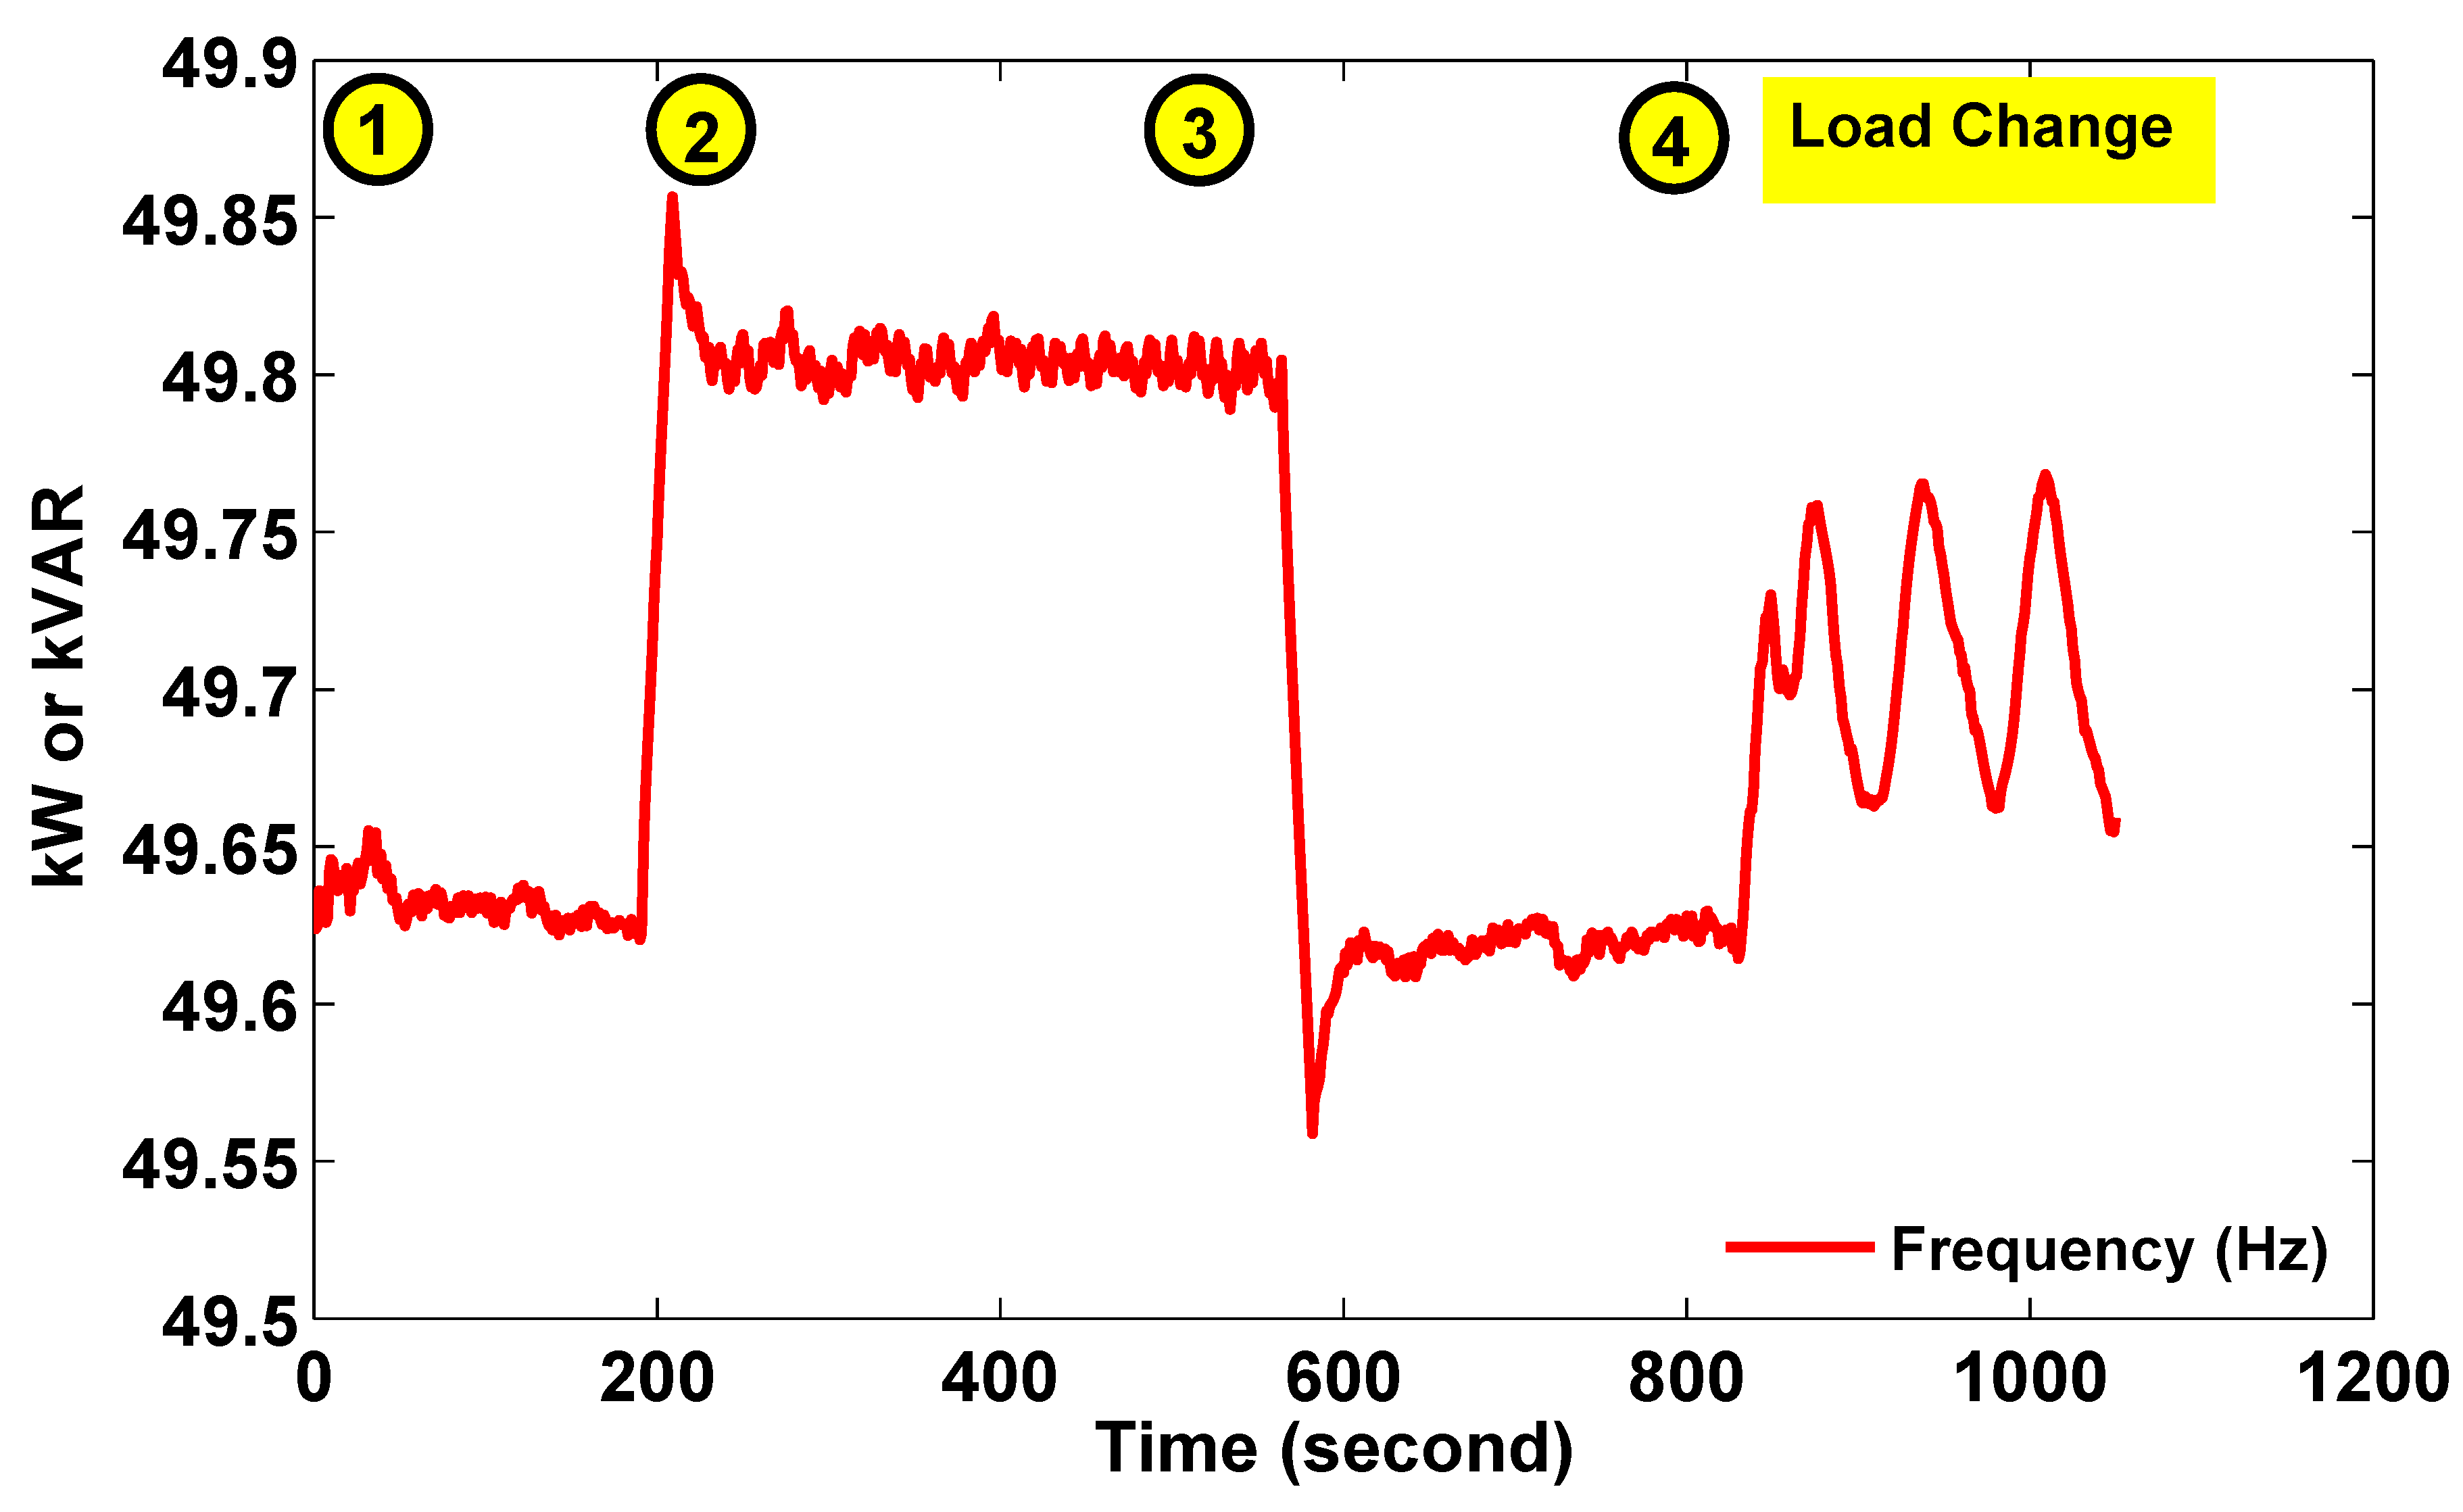
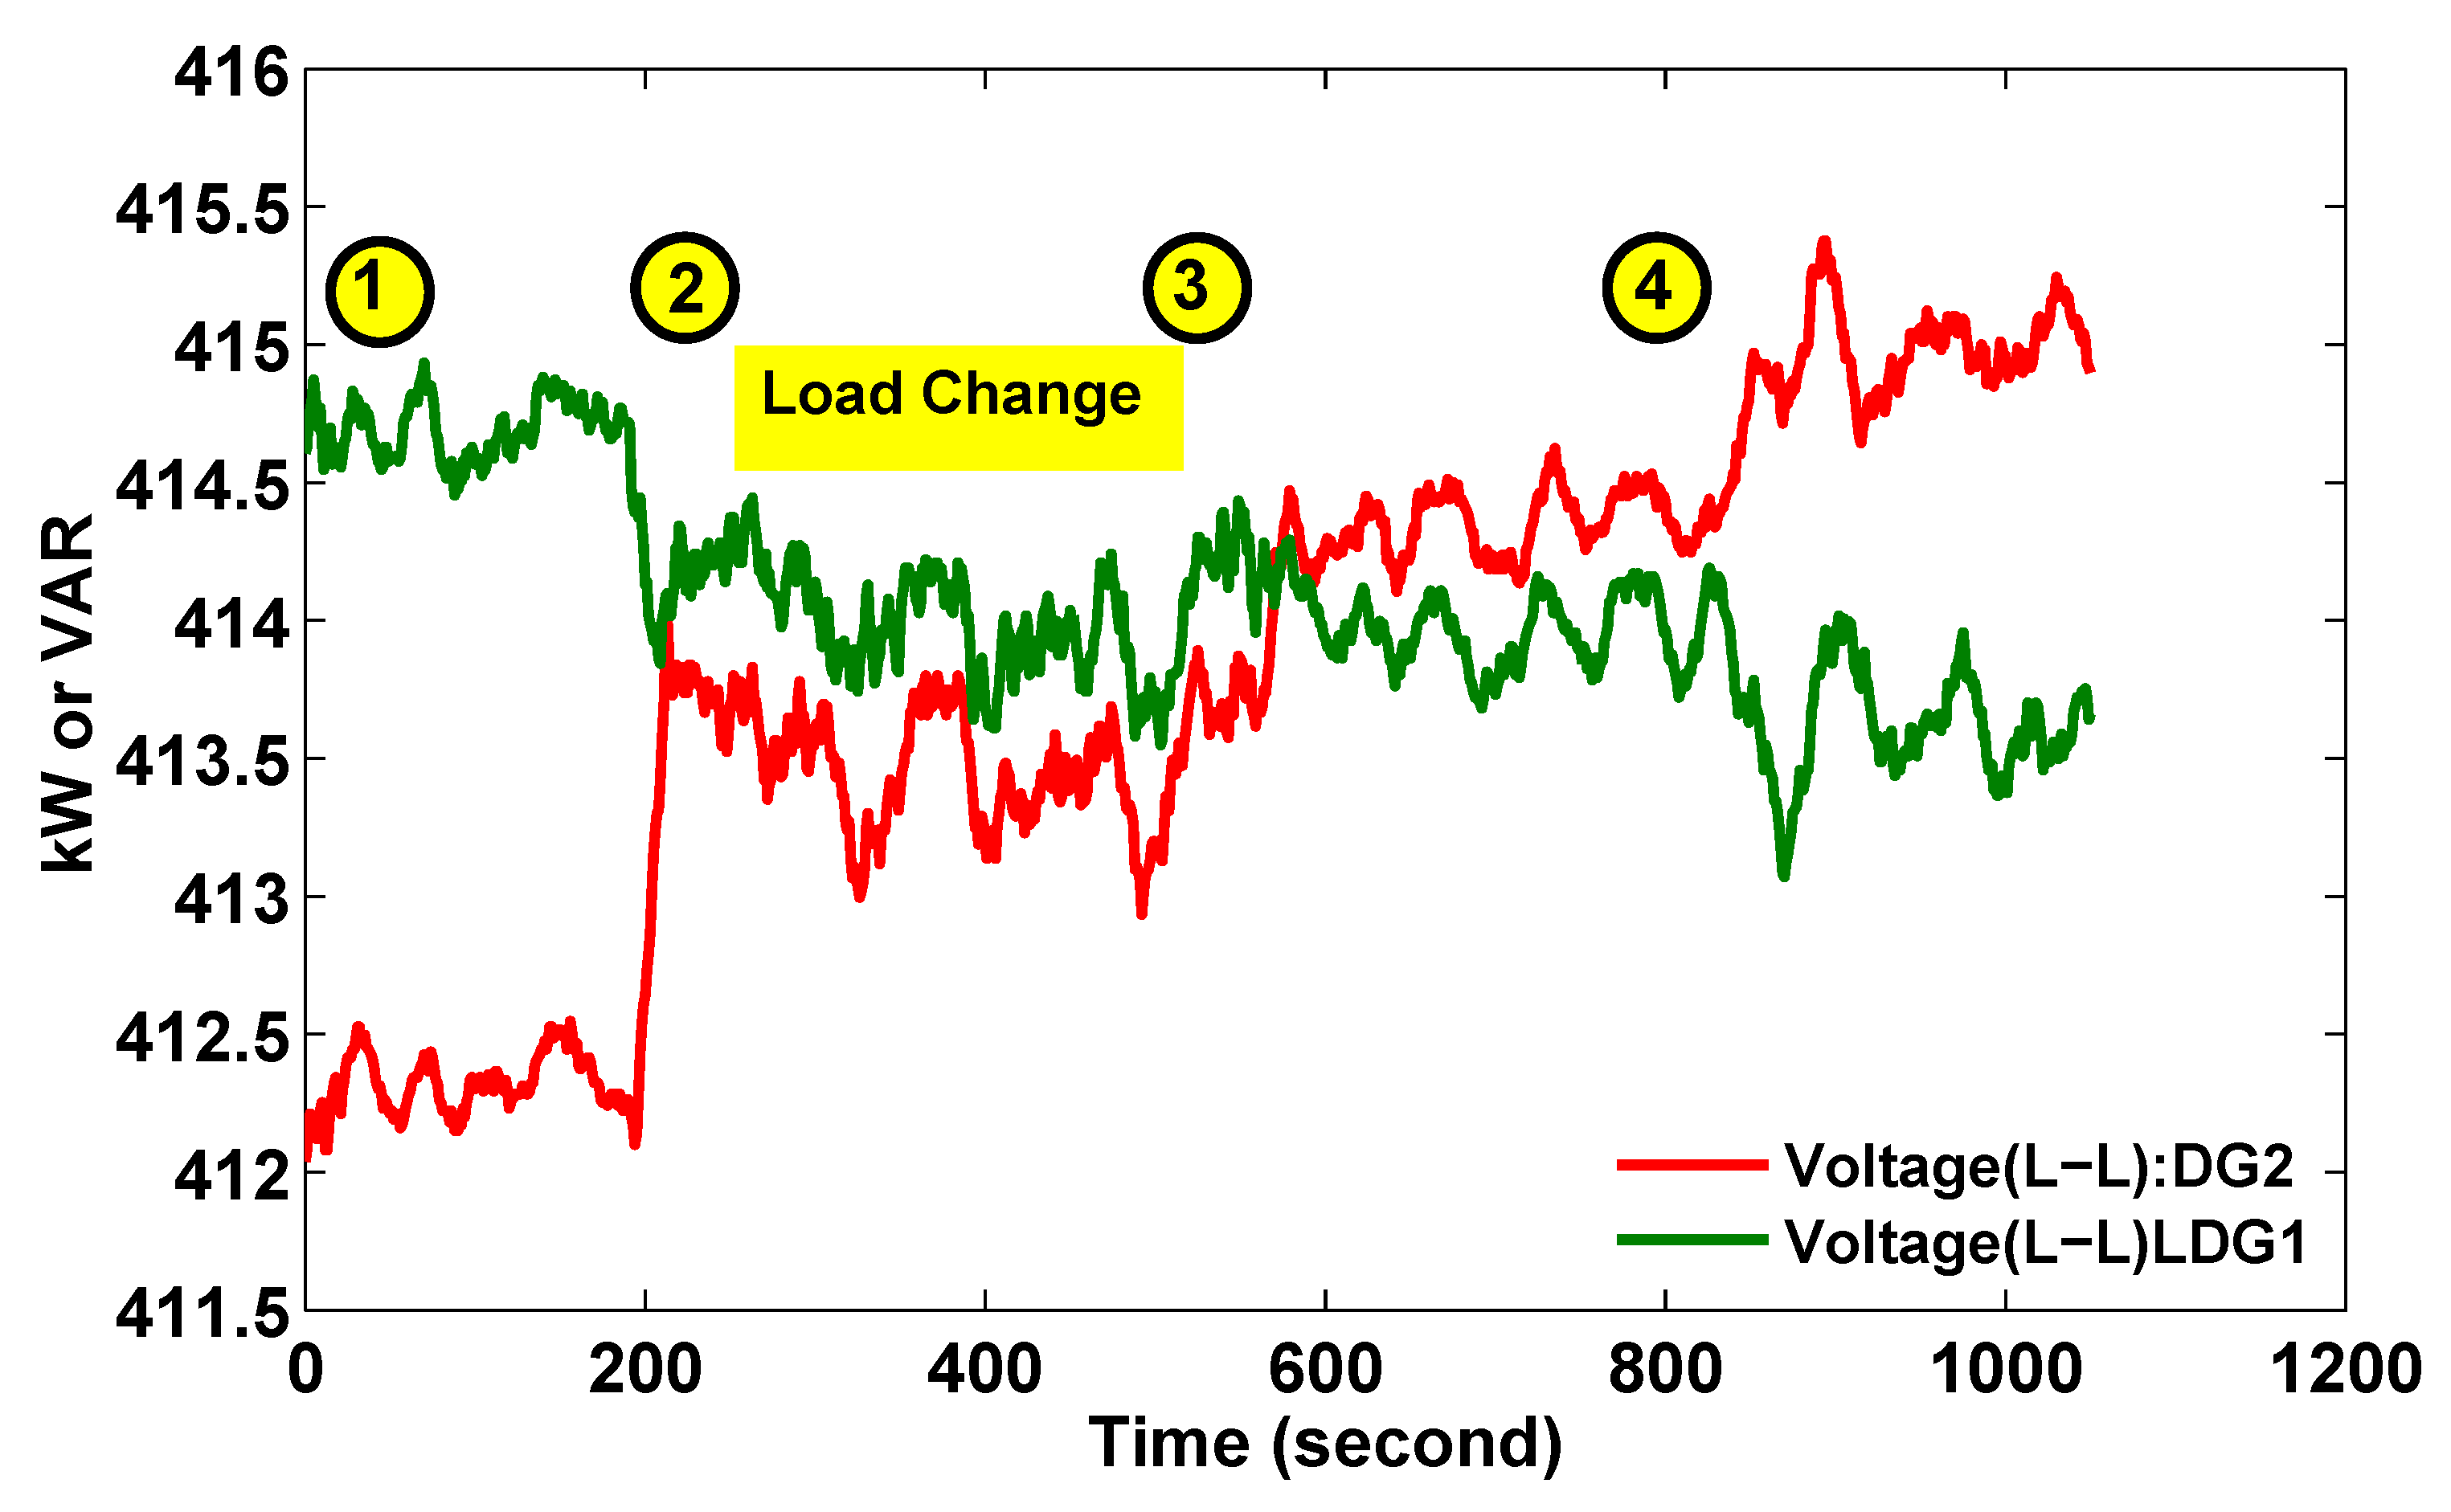
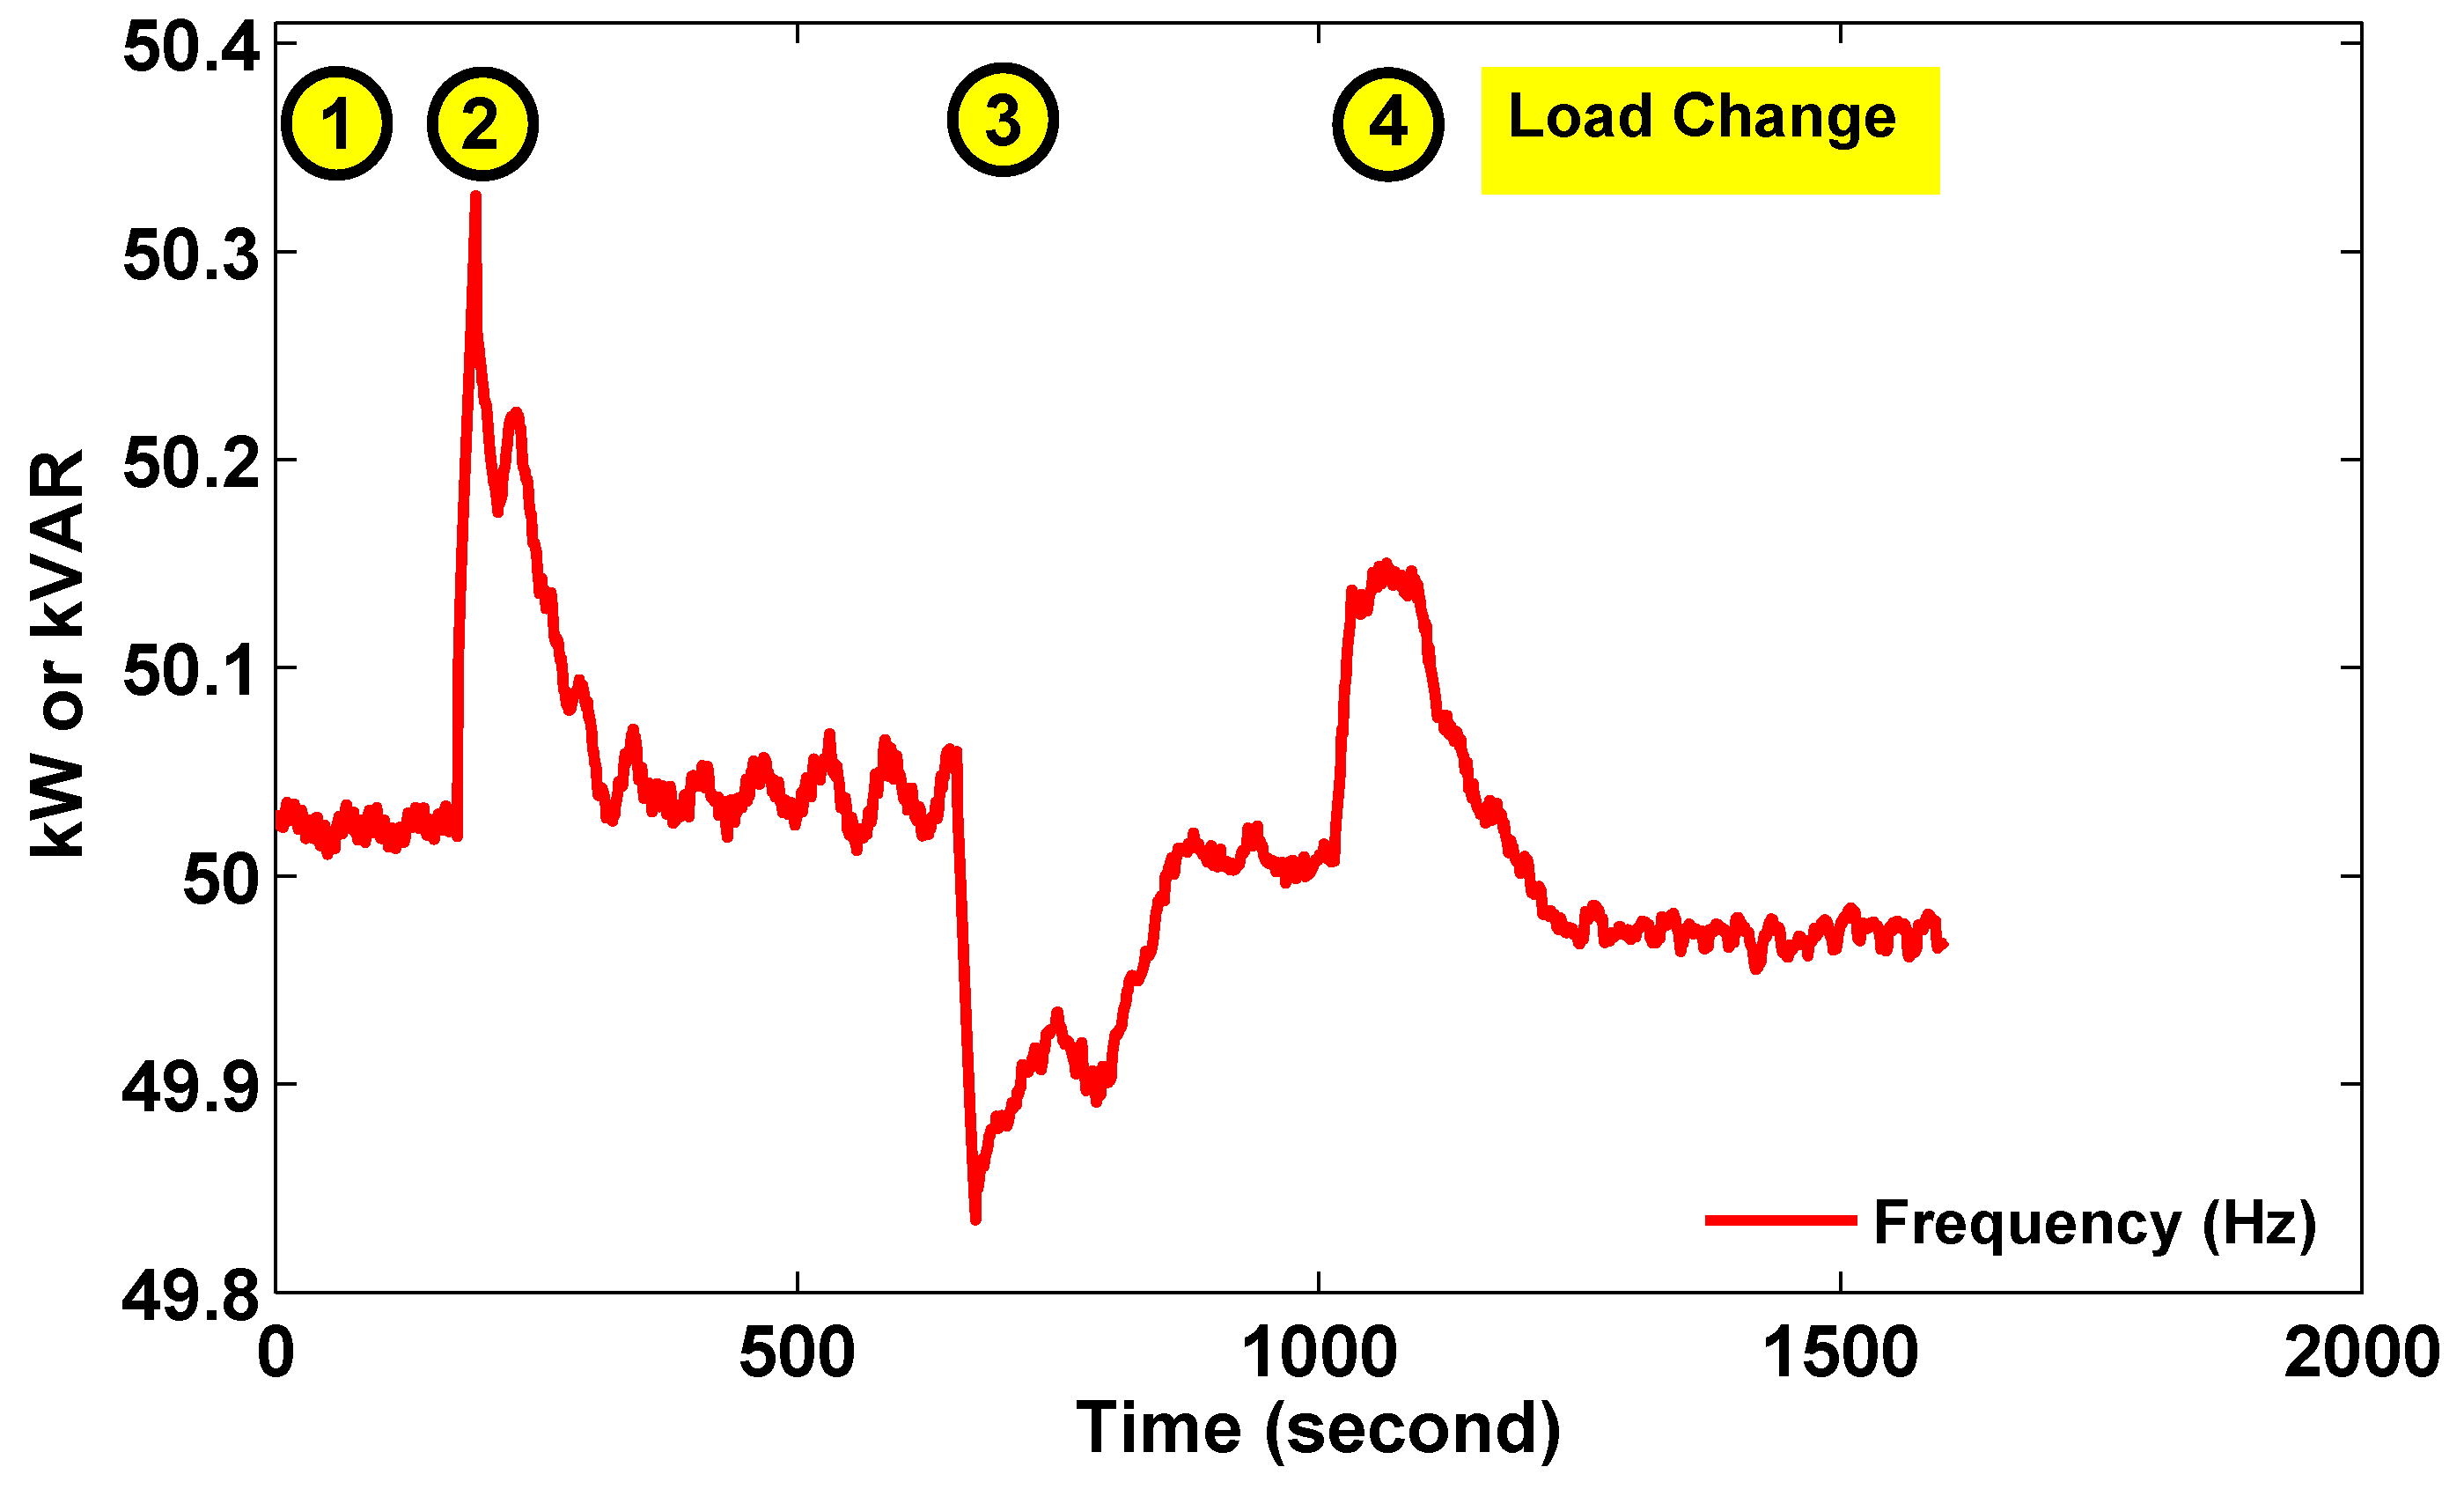
Figure 16,
Figure 17 and
Figure 18 show that the active power varies according to the frequency output while the reactive power varies according to the voltages on the respective buses. The voltages on the buses vary according to the power transfer from Bus A to Bus B and vice versa. It can be noted that there is slight frequency oscillation at a loading of 150 kW on bus A. This can be due to the interaction between the two DG controllers. Another problem that can be noted is due to the voltage droop characteristics, 1 DG would supply reactive power while the other consumes it. This increases the amount of losses in the line due to a higher current flow through the line.
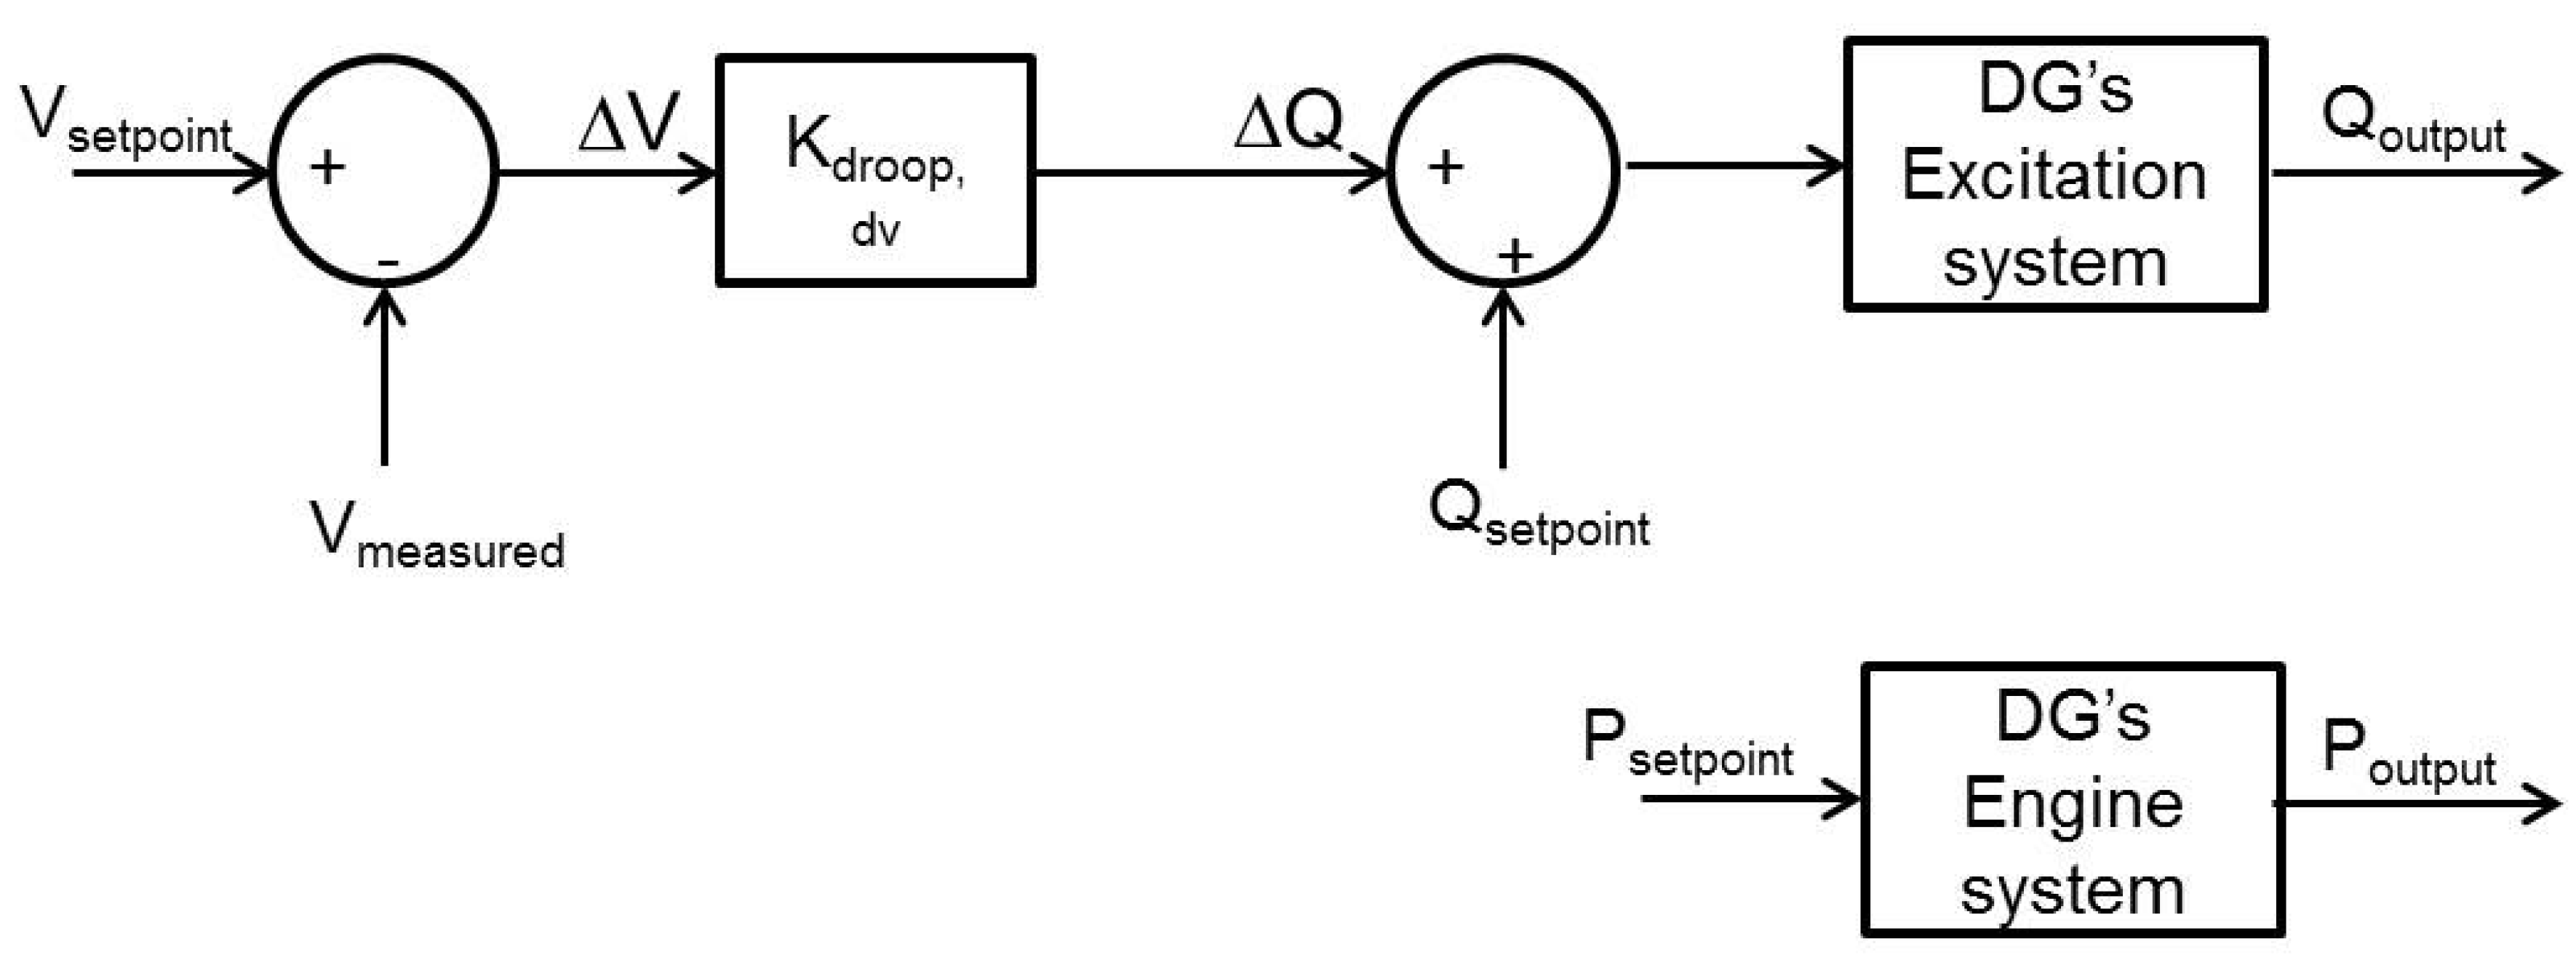
In the second set of experiments, the control strategy has been changed to a Master-slave control scheme in which DG1 maintains the microgrid voltage and frequency to 415 V and 50 Hz respectively. DG2 controls the active power output to a setpoint of 80 kW. The control block diagrams for DG1 and DG2 are shown in
Figure 19 and
Figure 20 respectively. The load changes are similar to that in
Table 4.
Figure 21 shows that the power outputs settle to steady-state in about 100–200 s. In comparison, the settling time for DGs in droop control is about 20–40 s. The slower response time in Master-Slave mode is due to the slow integral control of DG1 to bring the system voltage and frequency back to their normal setpoints. The frequency is brought back close to 50 Hz after each disturbance is shown in
Figure 22. Similarly, the voltage on bus A is maintained closed to 415 V after each disturbance (as shown in
Figure 23). As in previous case, due to the voltage droop characteristics, DG2 consumes reactive power when the voltage is high. This causes DG1 to supply reactive power and hence increases the amount of losses in the line due to a higher current flow through the line. These experiments demonstrate the functionality of EPGC in facilitating testing of grid-related equipment with realistic power magnitudes. It also allows experimental testing of different control strategies and investigation into practical problems that may not be apparent in computer simulated environment.
Figure 16.
Active and Reactive Power Output of DGs in droop control.
Figure 16.
Active and Reactive Power Output of DGs in droop control.
Figure 17.
Frequency of DGs in droop mode.
Figure 17.
Frequency of DGs in droop mode.
Figure 18.
Voltages of DGs in droop mode.
Figure 18.
Voltages of DGs in droop mode.
Figure 19.
Control block diagrams for DG1.
Figure 19.
Control block diagrams for DG1.
Figure 20.
Control block diagrams for DG2.
Figure 20.
Control block diagrams for DG2.
Figure 21.
Active and Reactive Power Output of DGs in Master-Slave Control.
Figure 21.
Active and Reactive Power Output of DGs in Master-Slave Control.
Figure 22.
Frequency of DGs in Master-Slave Control.
Figure 22.
Frequency of DGs in Master-Slave Control.
Figure 23.
Voltages of DGs in Master-Slave Control.
Figure 23.
Voltages of DGs in Master-Slave Control.
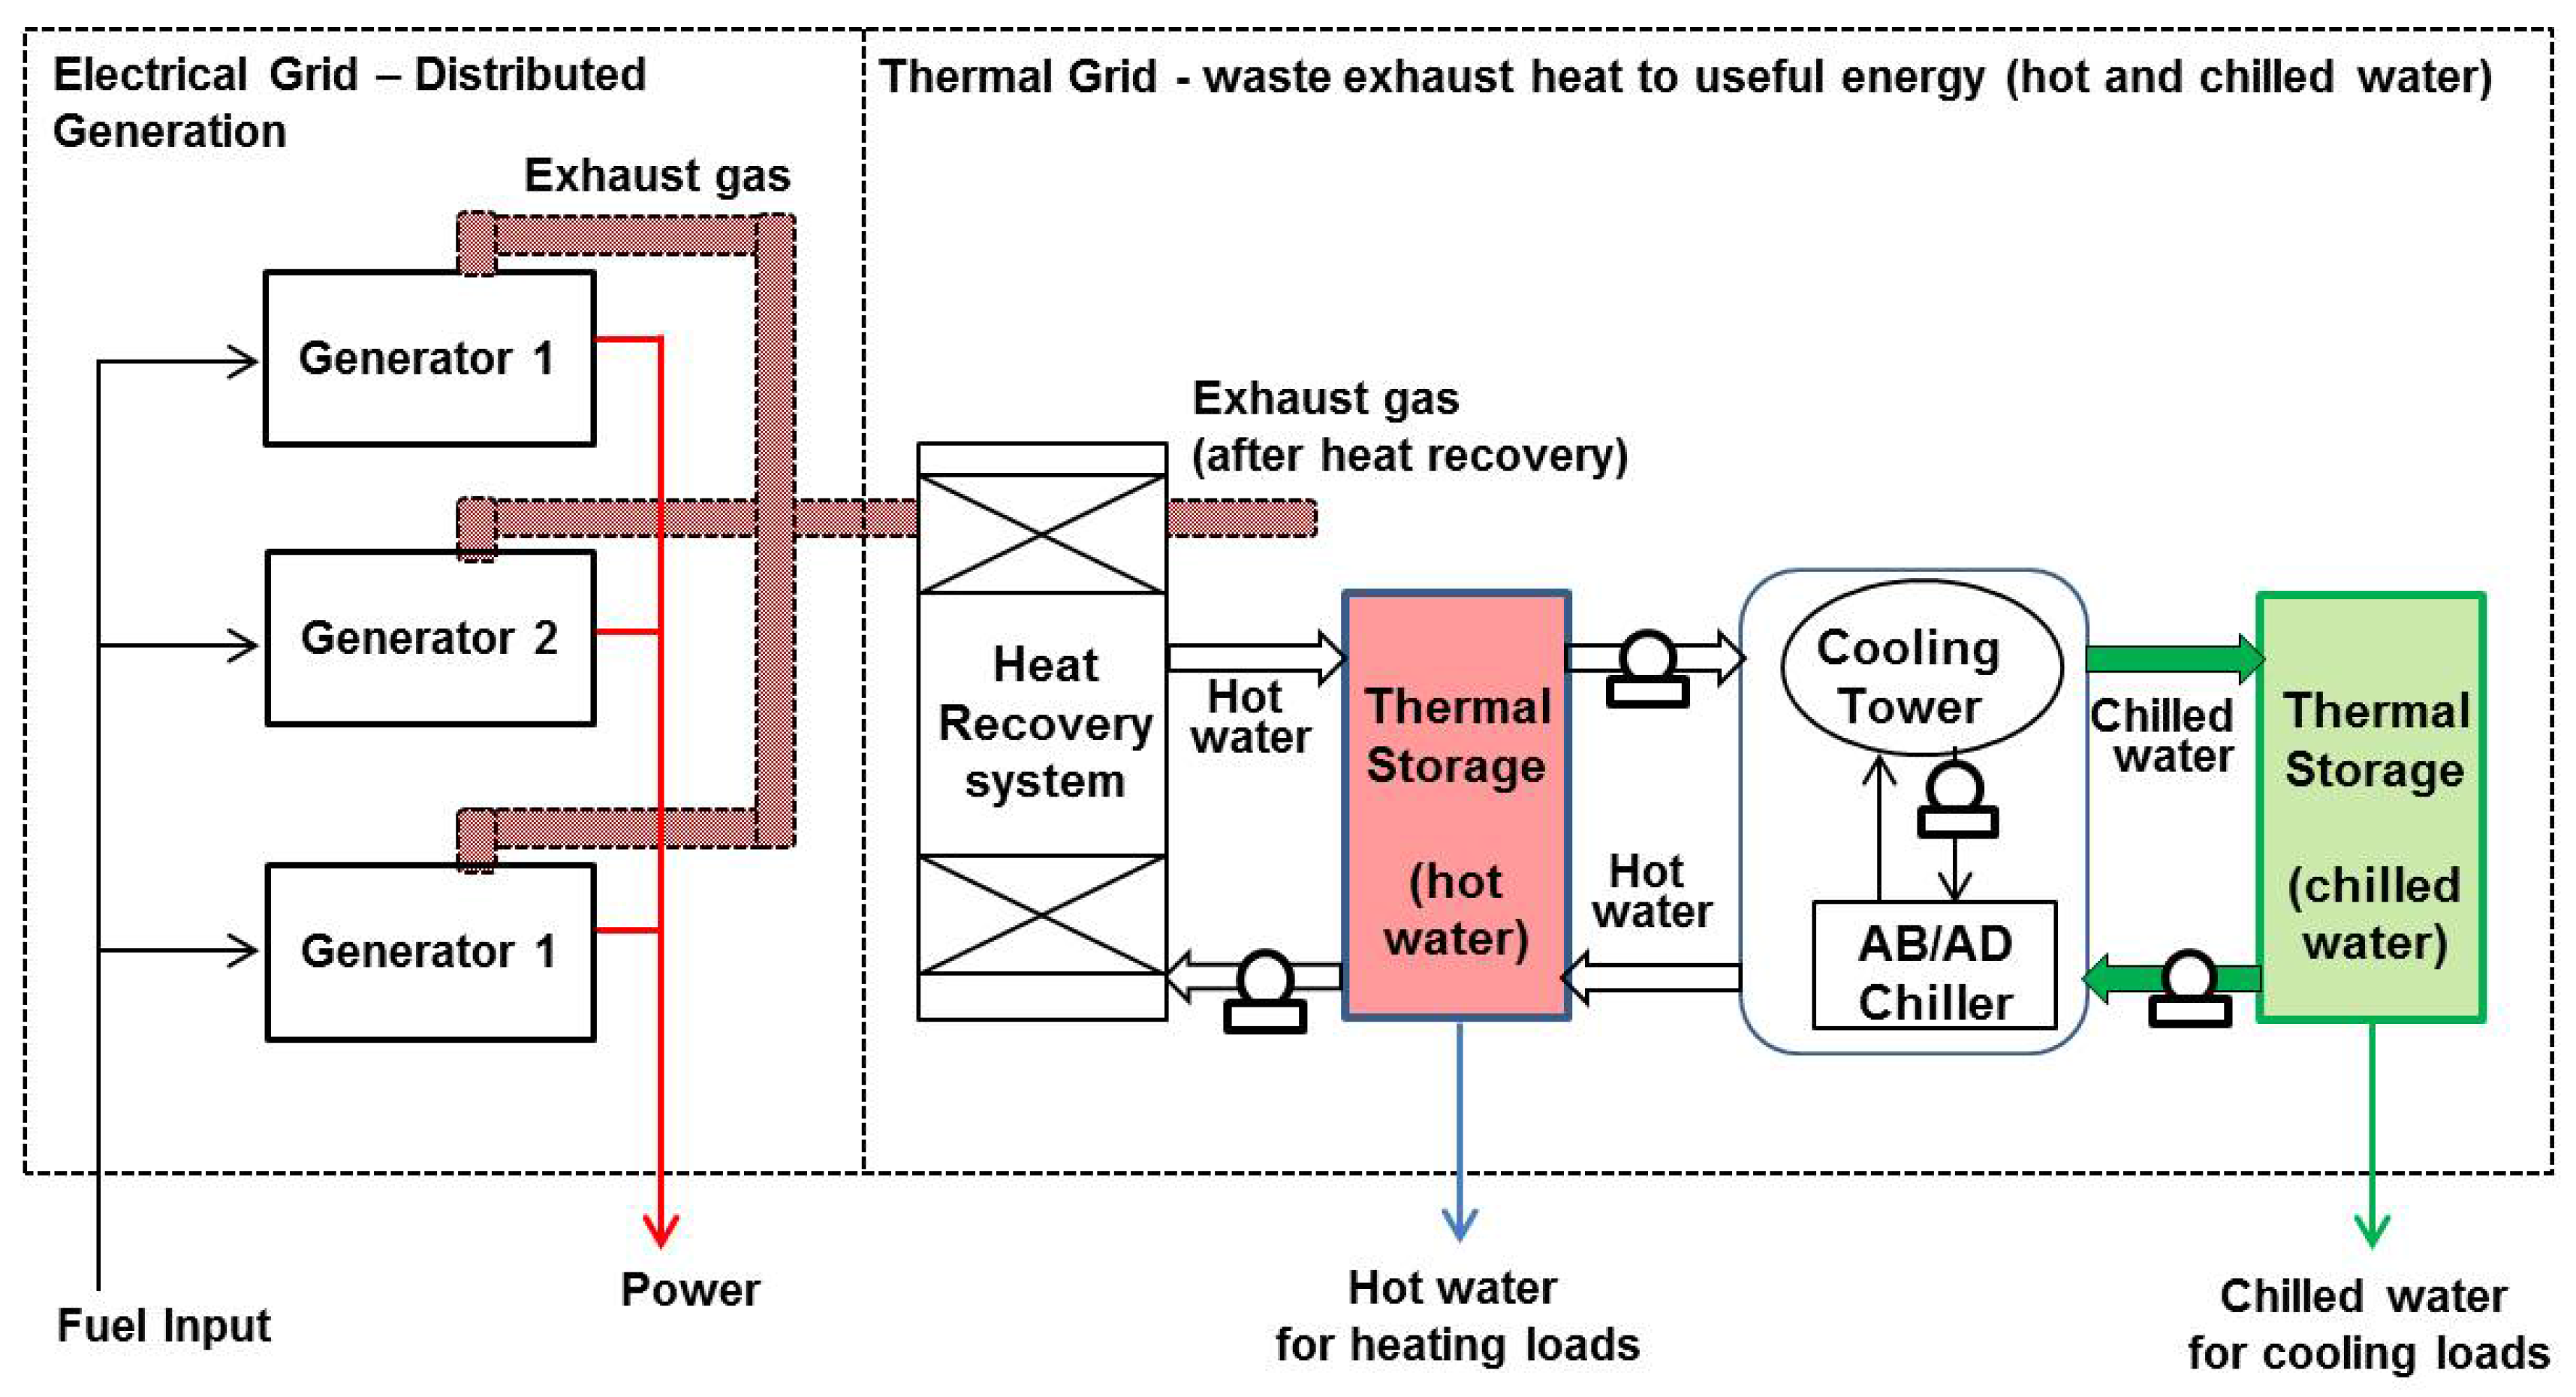
3.5. Energy Efficiency of Integrated Thermal Grid in Microgrid
An electrical microgrid integrated with thermal grid are noticeable to achieve high efficiency in the range of 60%–85% at design condition depending on the type of thermal supply
i.e., steam, hot water or chilled water [
27]. During actual operation, diesel generators follow the electrical load, and any variation in the electrical load will influence the diesel generator operation, which in turn affects the exhaust gas properties and thermal grid performance. A detailed experiment and test is required to investigate the performance of the thermal grid at different part load conditions, which arise in the waste heat generation and thermal loads. This case study investigates the energy efficiency of a thermal grid at different part loads faced by thermal systems.
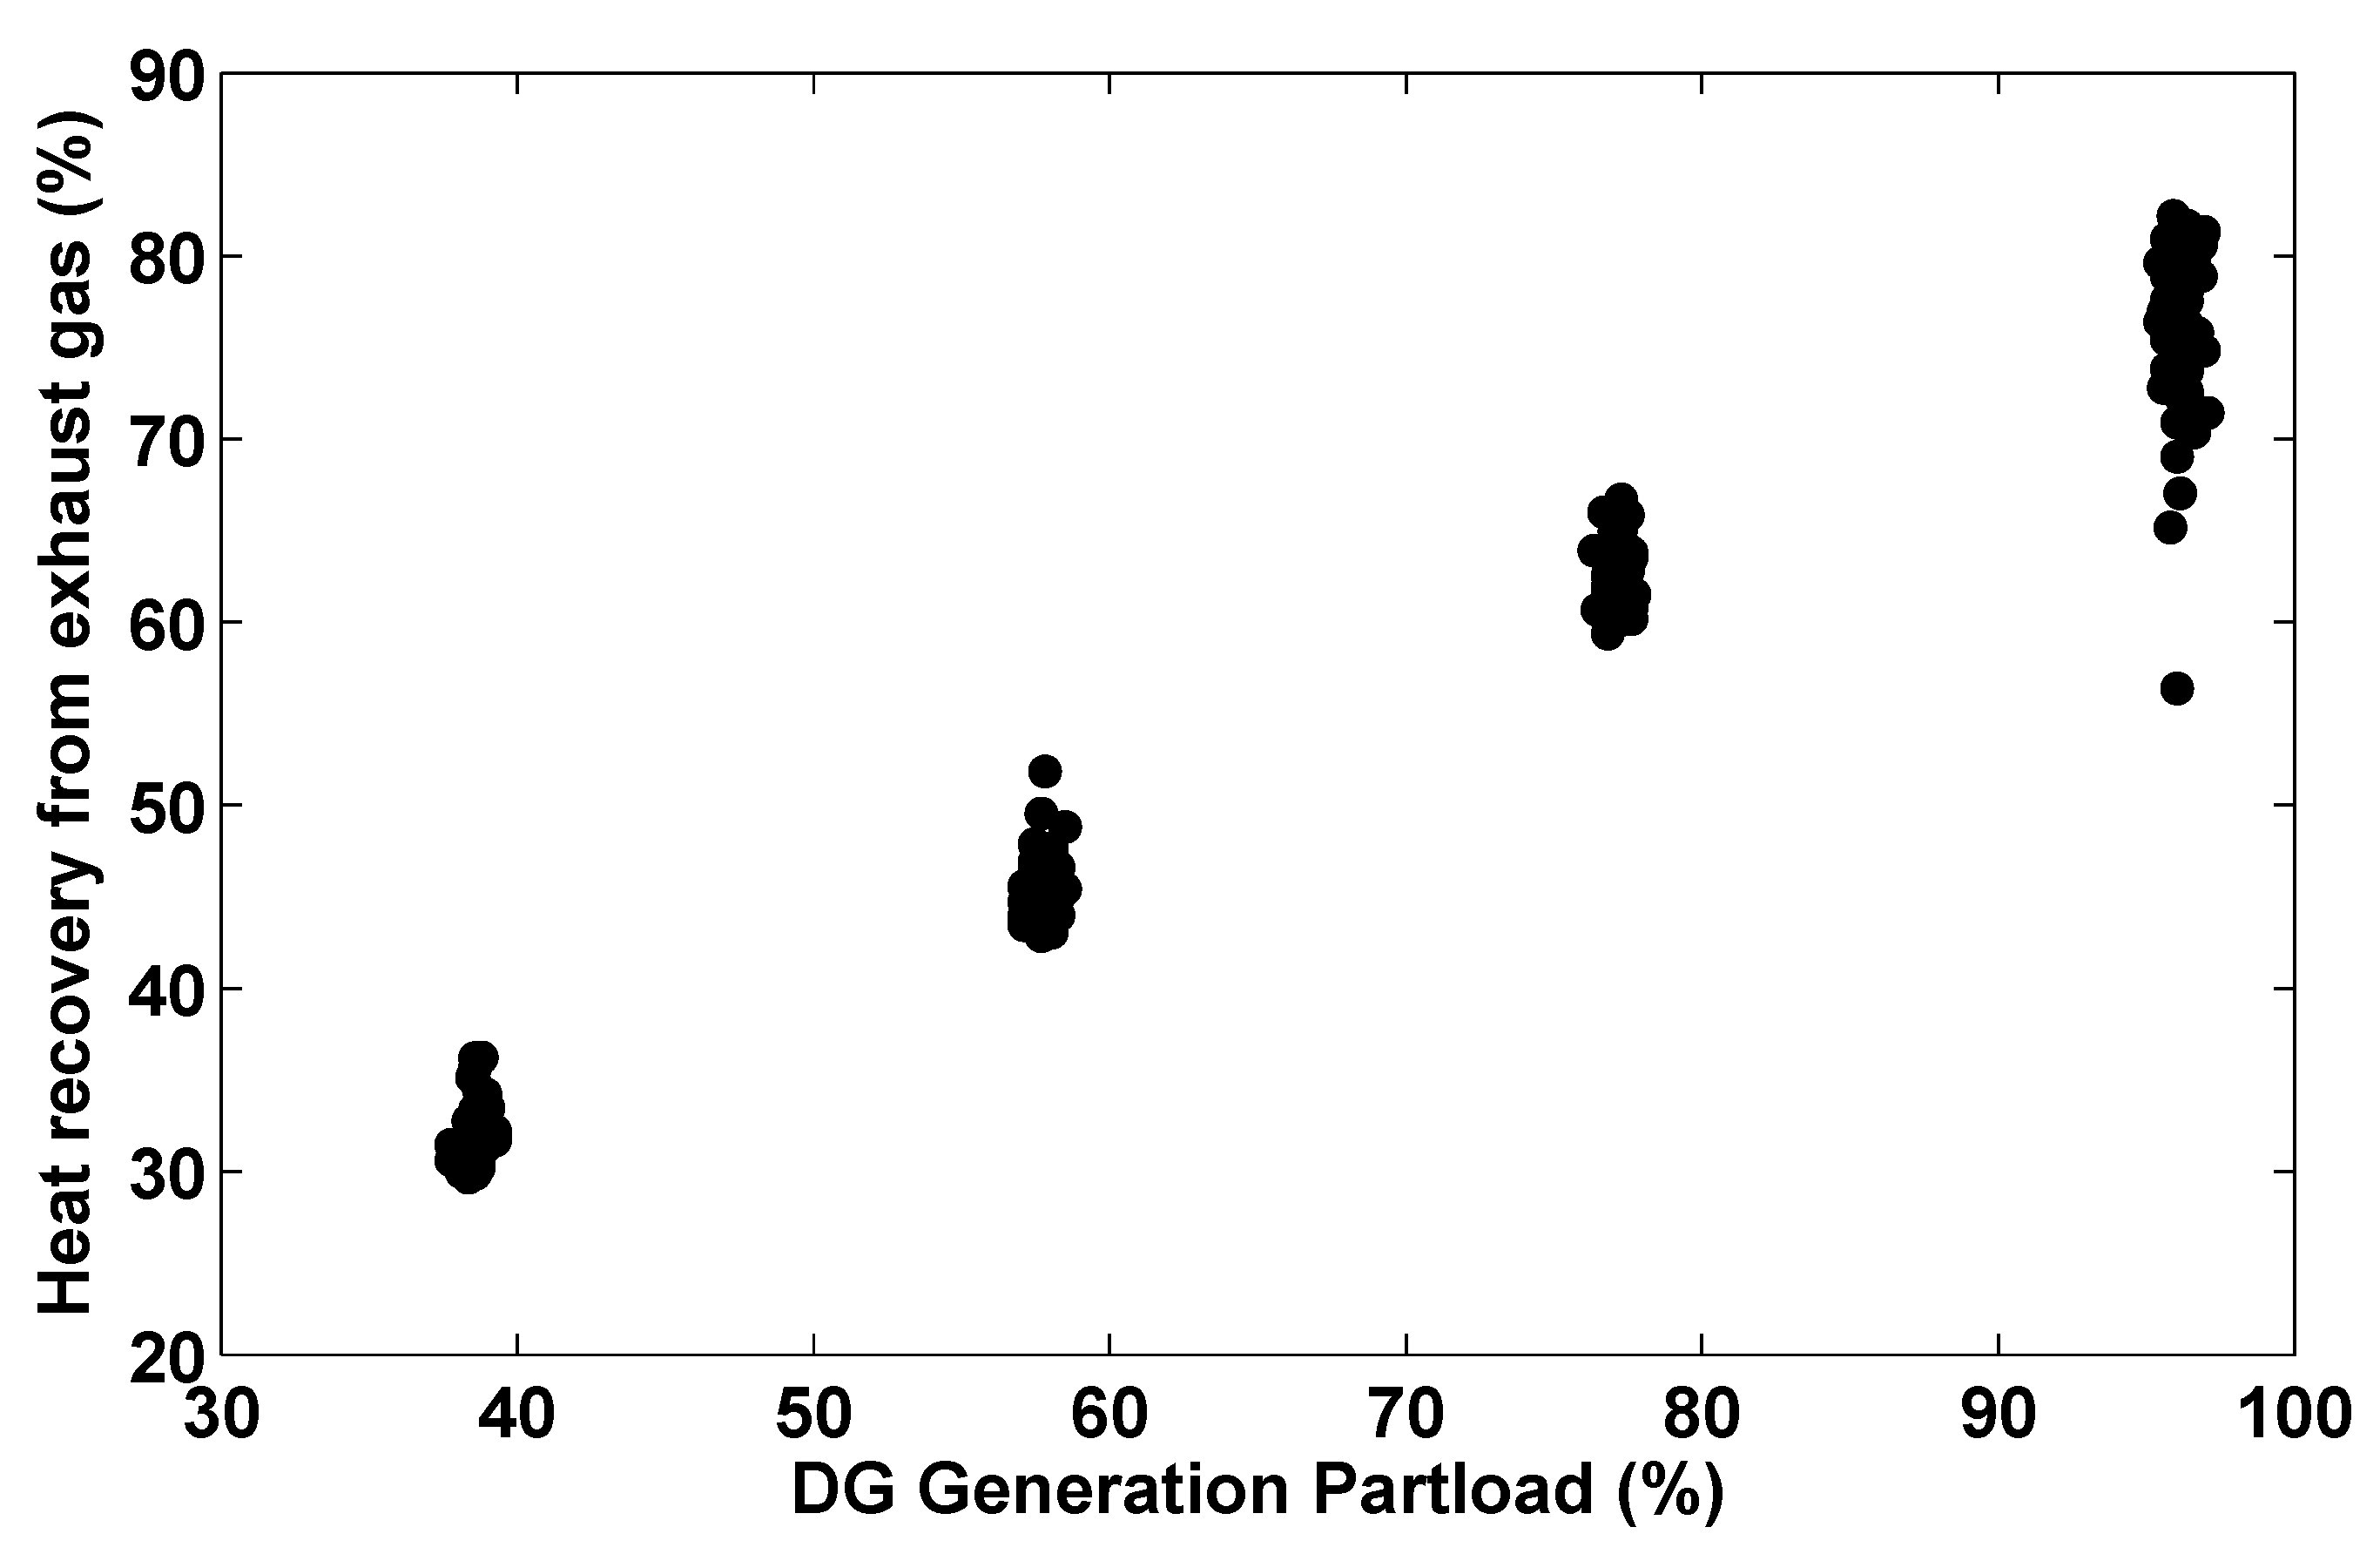
Figure 24 shows the heat recovered from the exhaust gas of a 125 kVA generator using a waste heat recovery system at constant hot water flow. The heat energy recovered is 75% to 85% at full load due to high exhaust flow and temperature. At part loads, the heat energy recovered declines all the way to 30% to 35%.
Figure 24.
Heat recovered from the exhaust gas at different part loads of diesel generator.
Figure 24.
Heat recovered from the exhaust gas at different part loads of diesel generator.
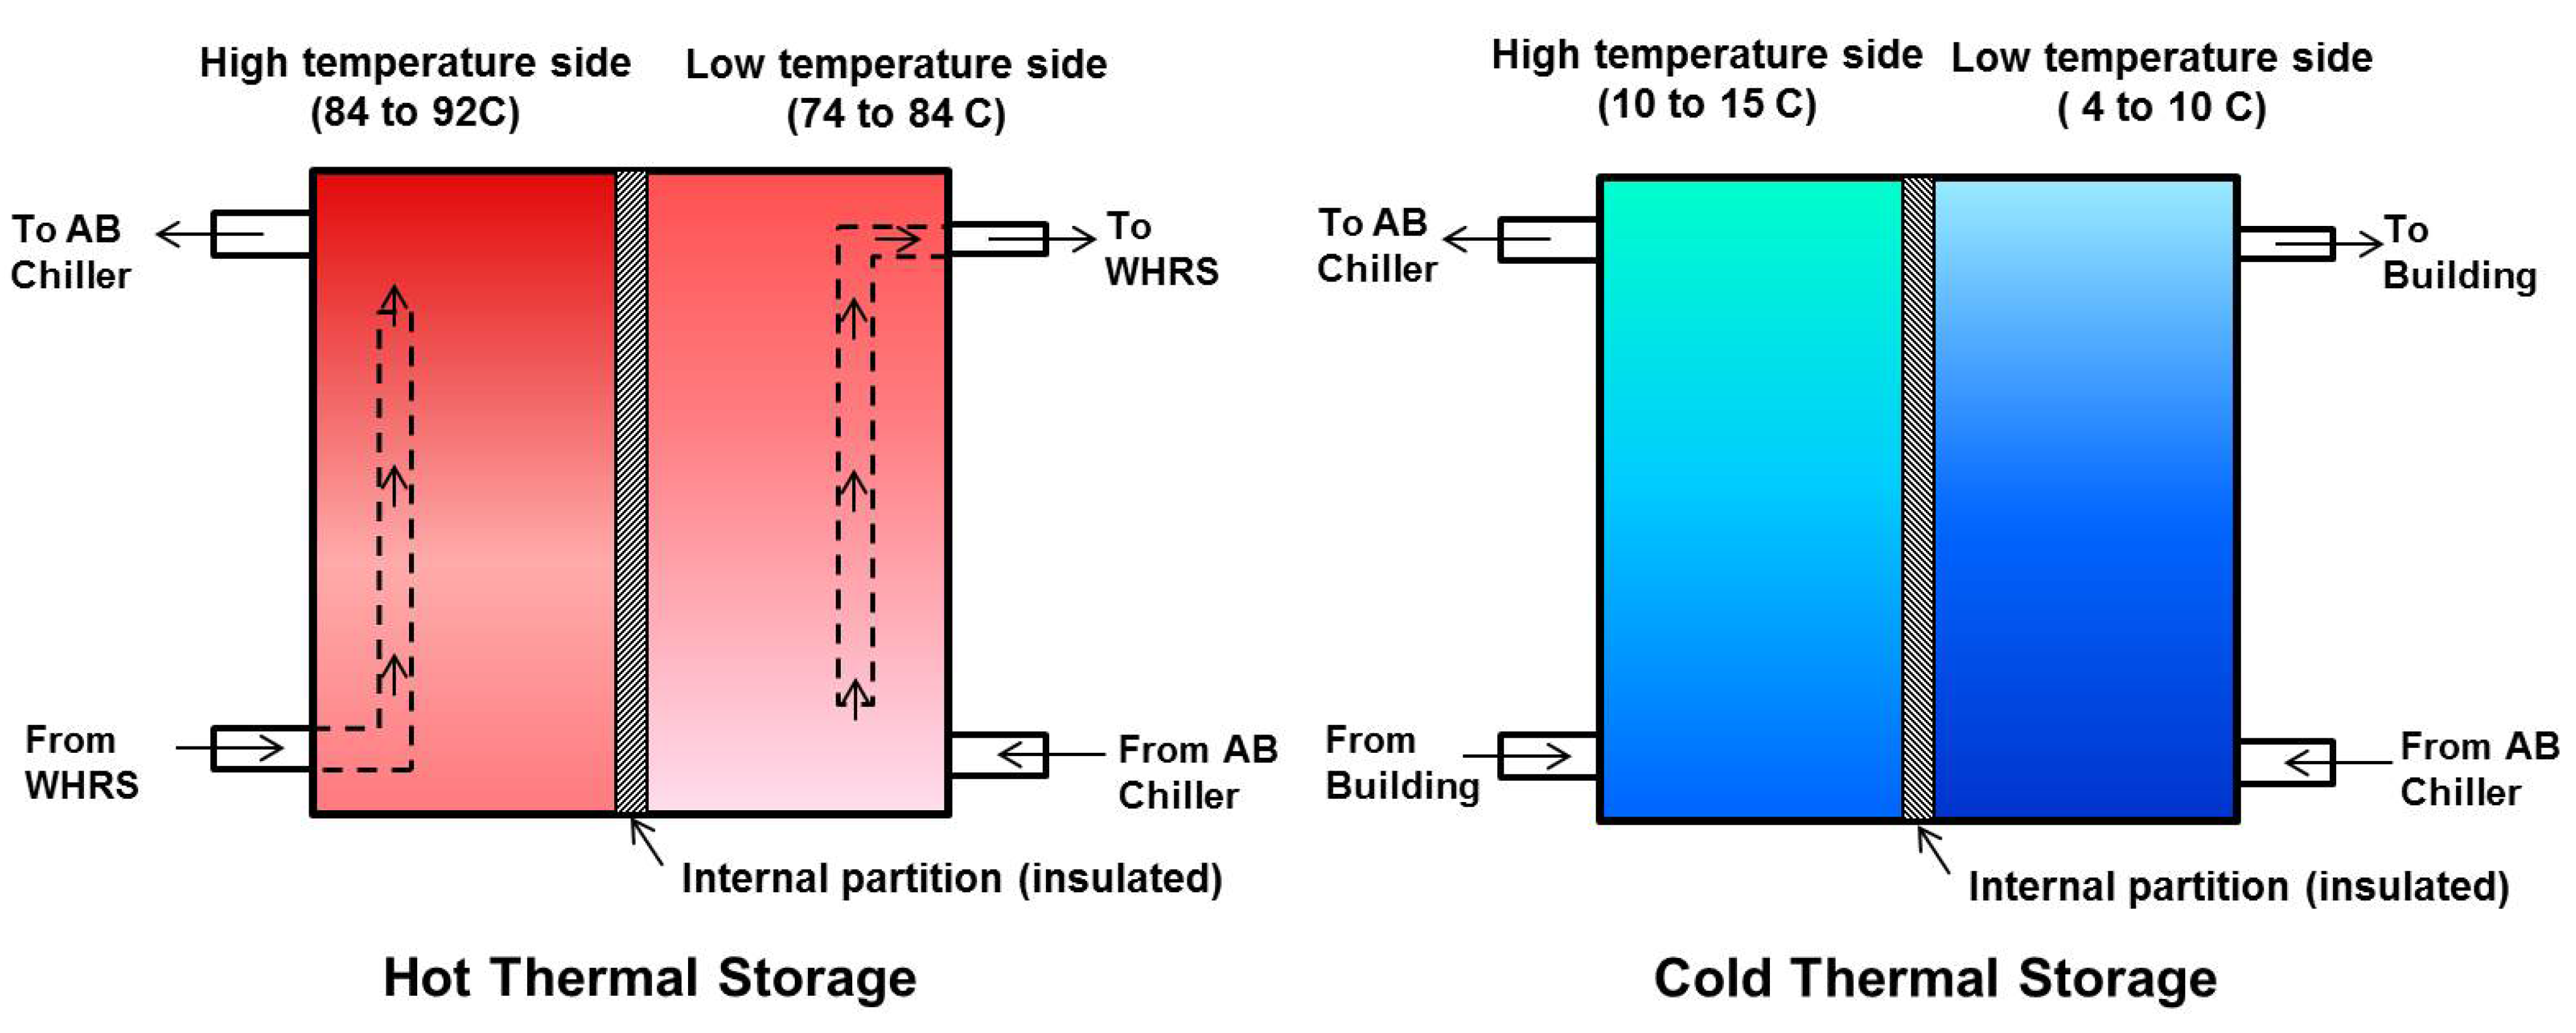
The temperature of hot water generated by WHRS is at around 70 to 90
C which is more suitable for cleaning and cooking purposes. Hot water can also be used to generate chilled water to support air conditioning purpose. By exploiting thermal storage, the excess hot water is stored and used to peak shaving, shifting operation and during unavailability of exhaust gas conditions.
Figure 25 shows the heat availability in the thermal storage, the heat input to the absorption chiller and the cooling capacity generated by the chiller. The heat availability in thermal storage decreases with time because of supplying the hot water to the absorption chiller. The area of heat input and cooling capacity curves shows 30%–50% of heat input is converted to cooling capacity in the chilled water to support air conditioning loads. The range 30%–50% is in agreement for the single-effect hot water driven chiller at part load conditions [
29]. This four cubic meter thermal storage can support chiller operation for more than an hour without WHRS operation. However, the cooling capacity generation is reduced due to a decrease in the heat capacity and heat input.
Figure 25.
Cooling capacity generation and hot water temperature in the thermal storage.
Figure 25.
Cooling capacity generation and hot water temperature in the thermal storage.
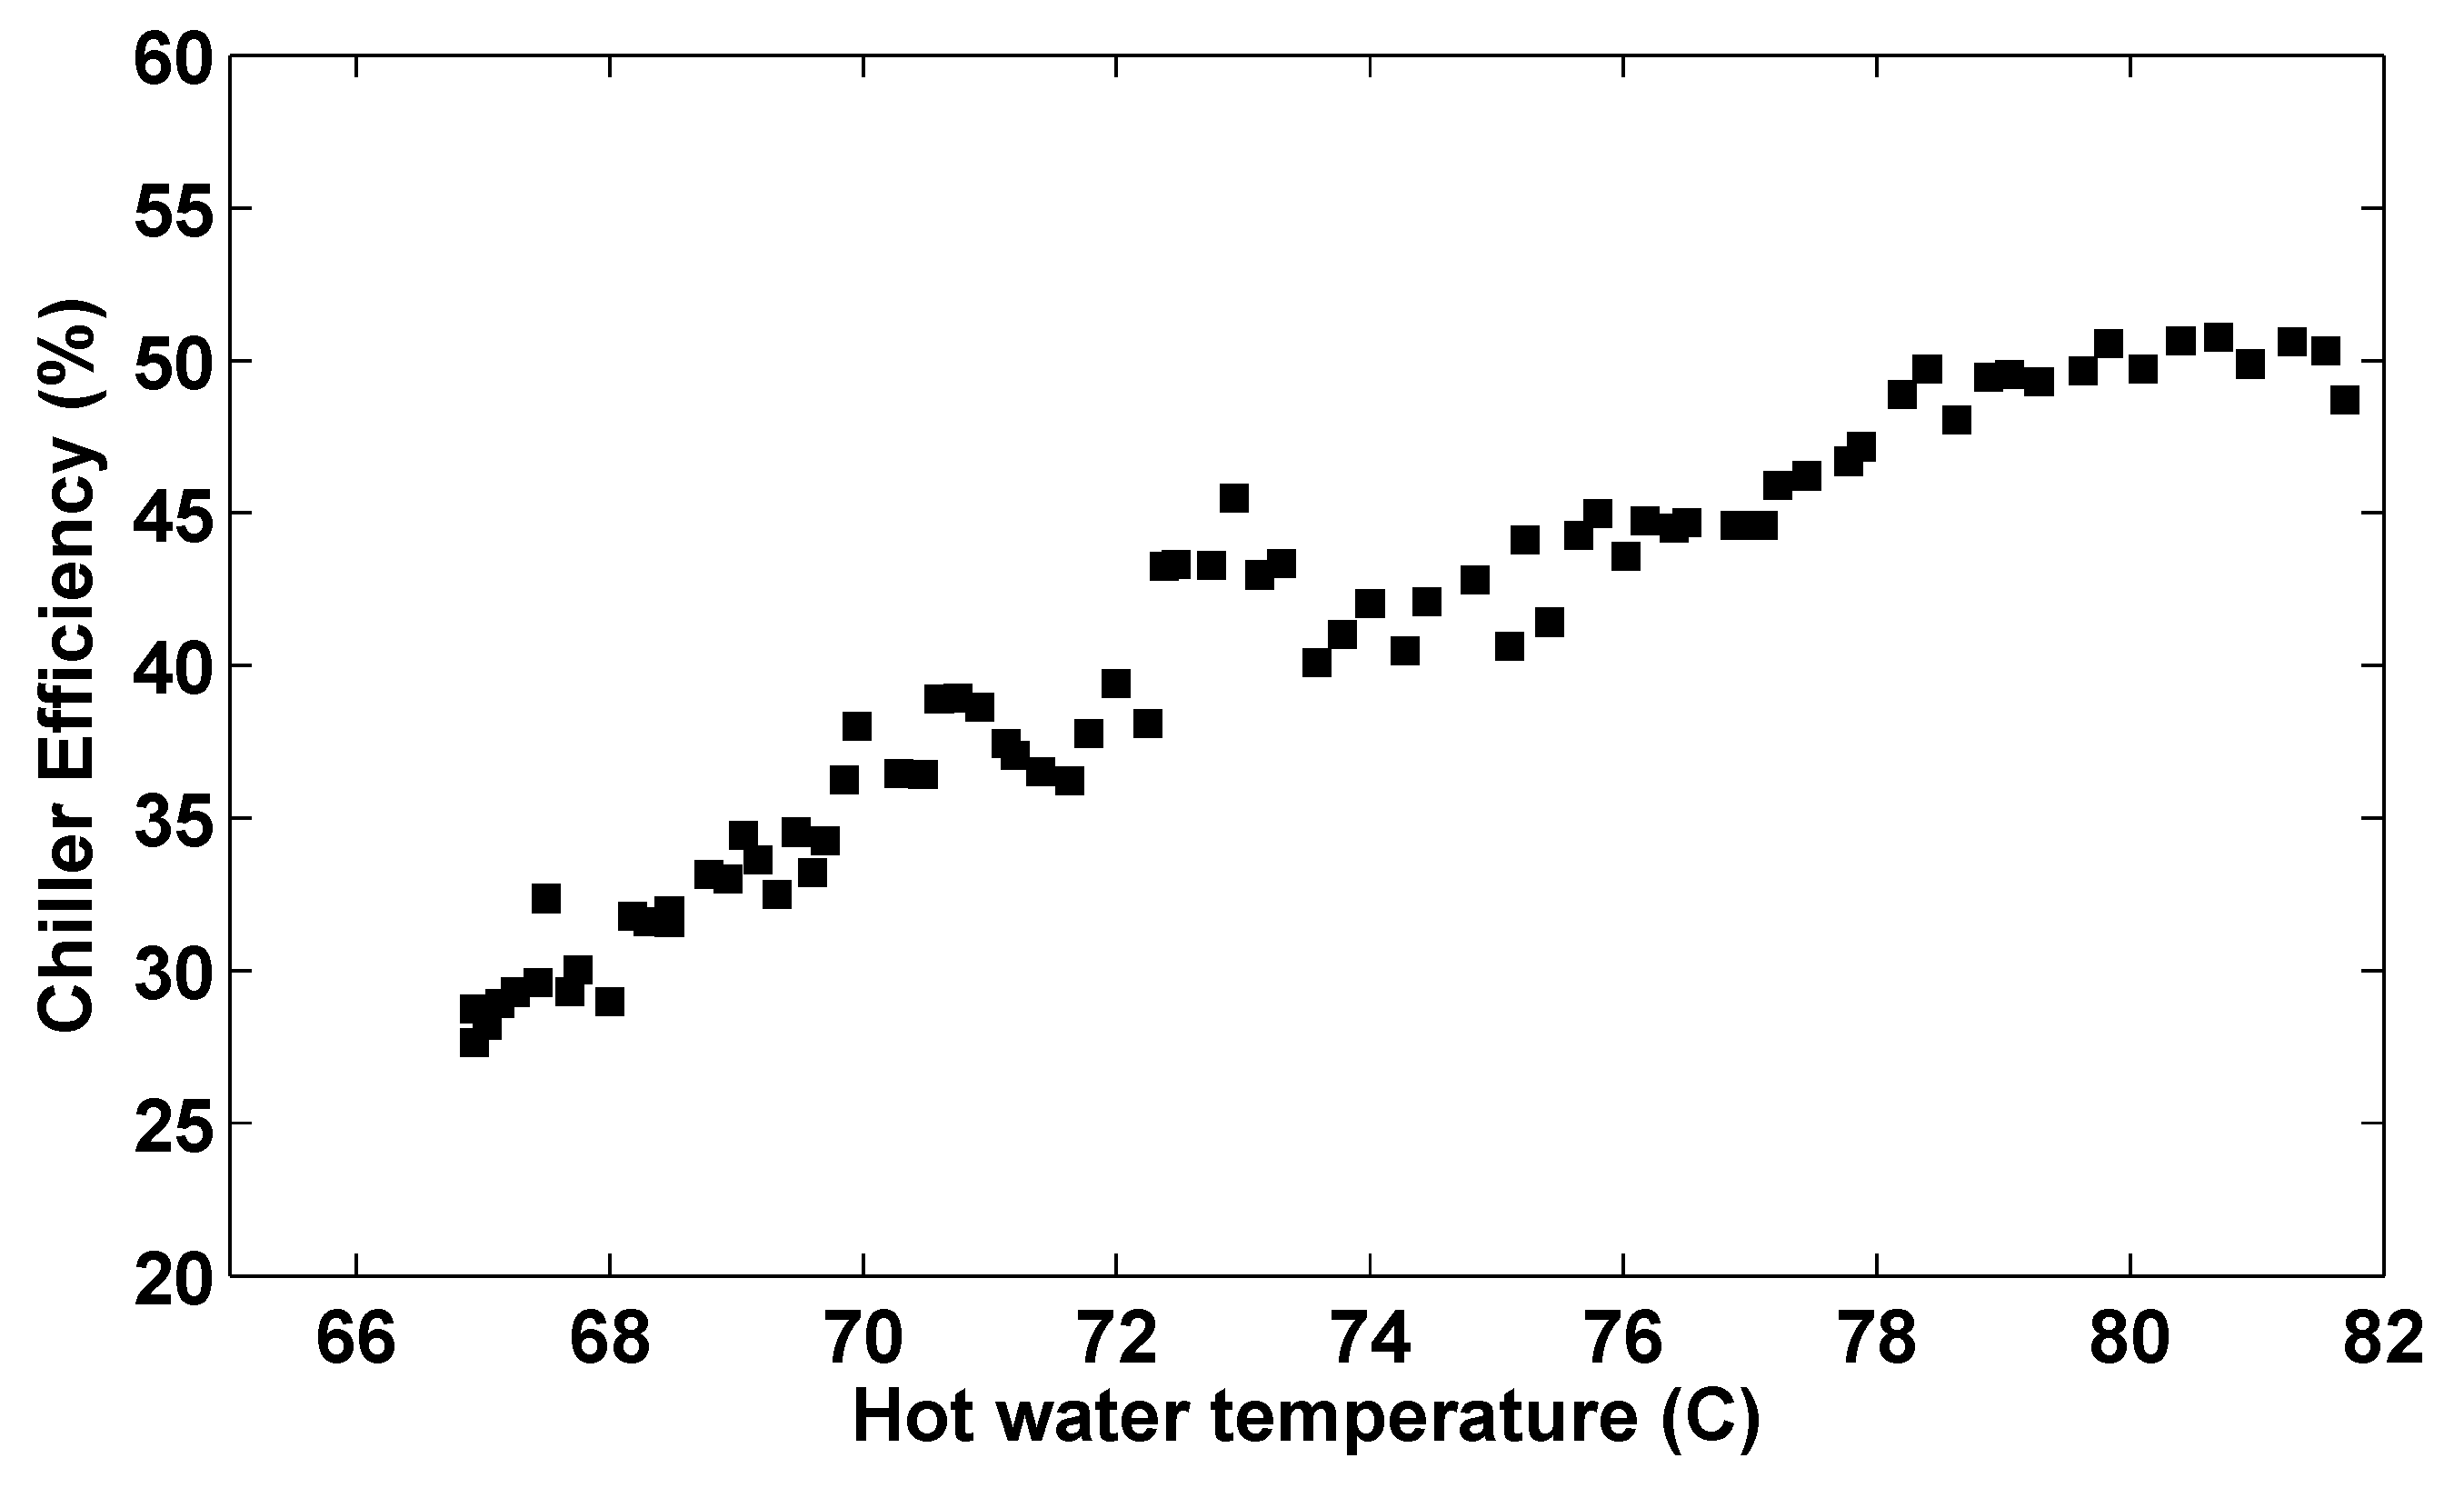
The performance of the absorption chiller is influenced by the hot water, cooling water and chilled water inlet temperature and flow [
30]. At rated condition, the hot water, cooling water and chilled water requirement is 90, 29.5 and 12
C. Any variation in the inlet temperature or flow due to generator operation, thermal loads and weather will affect the chiller performance.
Figure 26 shows the performance of the chiller with the variation in the hot water inlet temperature at constant flow. The decrease in the hot water temperature from the design condition affects the efficiency of the chiller. Similarly chiller efficiency deteriorates when chilled water inlet temperature decreases or cooling water inlet temperature increases from the design value.
Figure 26.
Chiller Efficiency as Coefficient of performance.
Figure 26.
Chiller Efficiency as Coefficient of performance.
Figure 24,
Figure 25 and
Figure 26 confirm that the performance of thermal systems is significantly influenced by the generators, thermal storage, chiller operation and thermal loads. The operational decisions are the key to achieve optimized performance and suppress performance deterioration. An advanced real-time optimized control is developed and implemented to derive optimized operational decisions every 10 to 30 min based on the thermal grid variables, predicted thermal load and weather condition. This advanced control is a remote system connected to the thermal grid energy management system to read the thermal grid variables and write the control decisions respectively.
The developed control system takes the (i) exhaust gas properties, (ii) hot water, chilled water and cooling water temperature and (iii) weather properties as inputs from the thermal grid energy management system and optimizes the thermal grid performance with respect to kWRT (as shown in Equation (
5)). The optimized operational decisions derived are flowrate of hot water, chilled water and cooling water, and the air flow in cooling tower. These decisions are implemented in the testing facility by revising the corresponding setpoints of variable speed drives of hot water pump, chilled water pump, cooling water pump and cooling tower fan. The thermal grid performance is described in (Equation (
5)) as kWRT which is the ratio of power consumption to generate one refrigeration ton of cooling capacity. The power consumption refers to the sum of power consumed by the chiller (P
), cooling tower (P
) and the pumps in hot, chilled and cooling water circuits (P
, P
, P
). The verified thermodynamic model of thermal grid is used in the optimized control to generate the operational decisions.
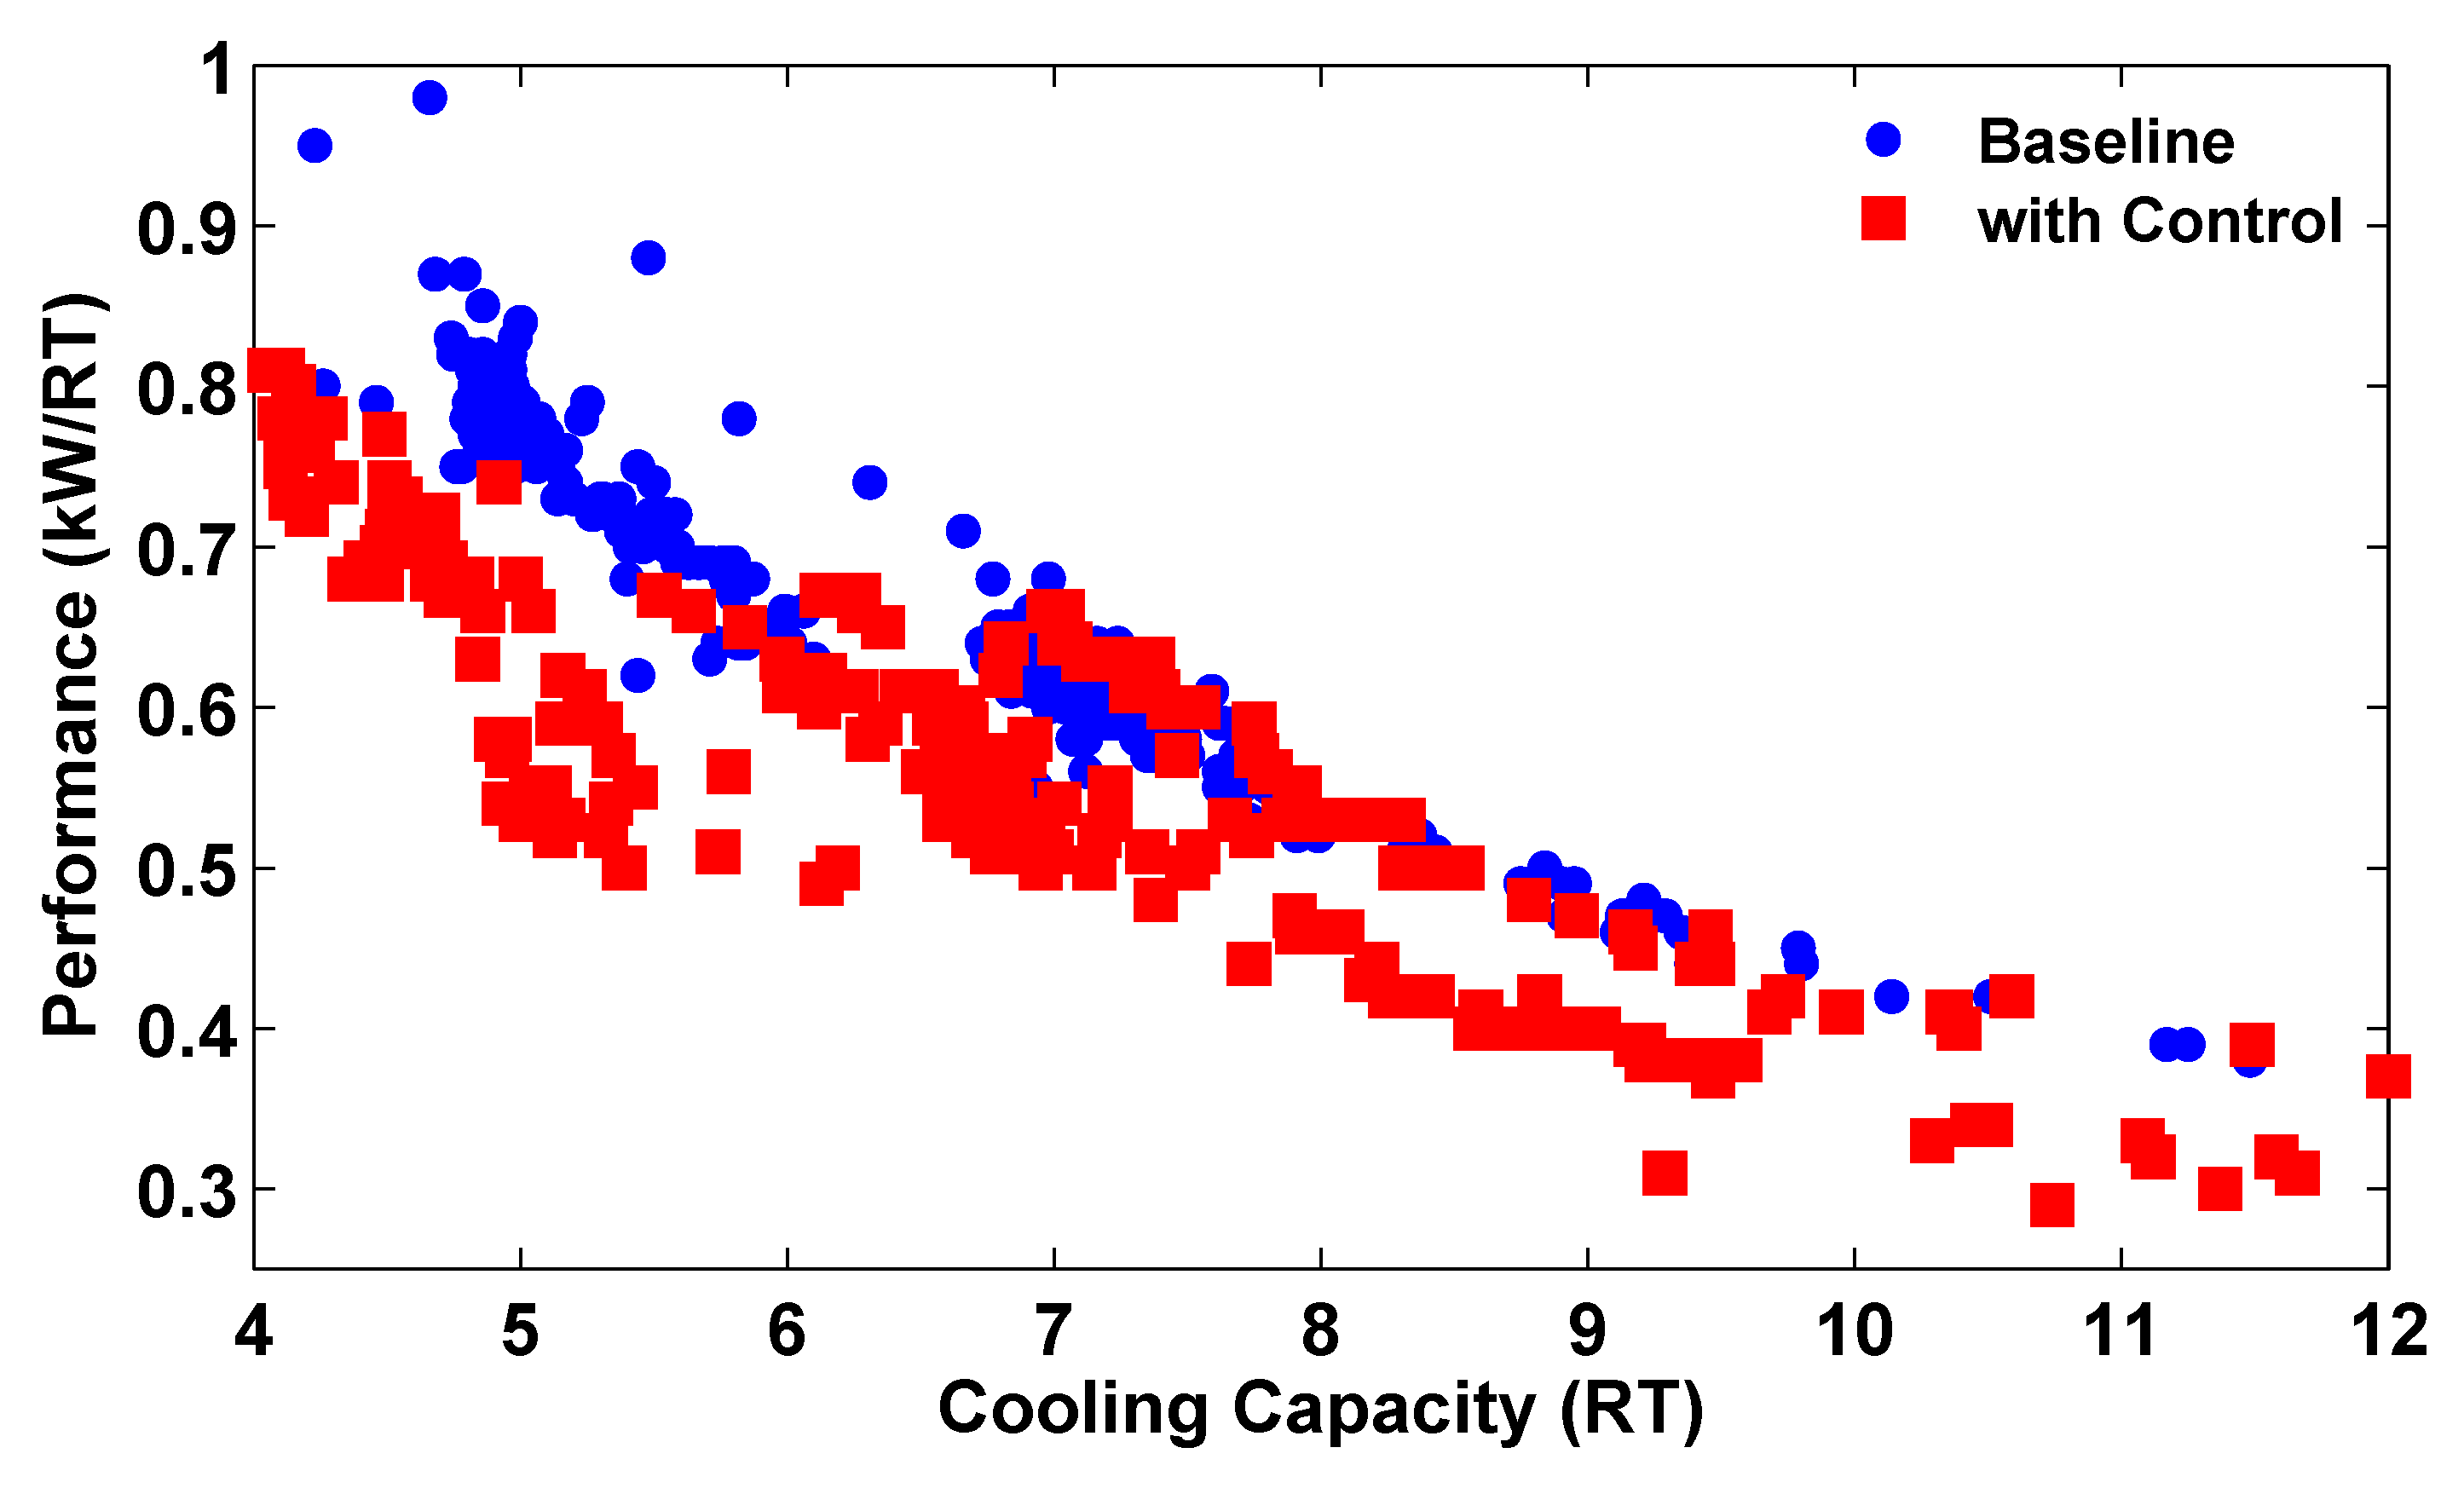
Figure 27 shows the energy efficiency of thermal grid, a high efficiency system achieves a smaller value of kW per ton to generate cooling capacity.
Figure 27 shows the preliminary results of thermal grid performance which show that optimized control scheme have performance benefits of up to 20% at part load conditions. The performance benefits are projected up to 40% in large capacity system in the range of 500 KVA diesel generators [
28]. This thermal grid facility with adequate instrumentation allows system level analysis and validate new optimized control algorithms.
Figure 27.
Thermal grid performance with baseline operation and optimized controller.
Figure 27.
Thermal grid performance with baseline operation and optimized controller.


