1. Introduction
A static synchronous compensator (STATCOM) is a volt-ampere-reactive (VAR)/voltage regulation device that is used in both electric transmission and distribution networks. The STATCOM utilizes a voltage- or current-source converter and can act as either a source or sink of reactive power in the power system. If the STATCOM is connected to a source of power, it can also provide the real power.
Traditionally, STATCOMs have been used to study the stability problem. Wang and Hsiung presented a STATCOM control scheme to enhance the damping of a grid-connected 80 MW offshore wind farm and 40 MW marine-current farm [
1]. The damping controller was designed using modal control theory and has been examined under different operating conditions. Wang and Truong presented a damping controller of the STATCOM by using a pole-assignment approach to ensure adequate damping of the dominant modes of the studied power system [
2]. Beza and Bongiorno presented an adaptive power oscillation damping controller for a STATCOM equipped with an energy storage device [
3]; this was achieved using a signal estimation technique based on a modified recursive least-square algorithm, which supported the adaptive estimation of low-frequency electromechanical oscillations from locally-measured signals during power system disturbances.
Recently, STATCOMs have been also used to deal with the voltage problems in the power system. Wang and Crow developed a feedback linearization controller to regulate bus voltages [
4]. Chen
et al. investigated the use of a STATCOM for system voltage control, during peak solar irradiation, in order to increase the PV installation capacity of a distribution feeder and avoid the voltage violation problem [
5]. Aziz
et al. presented a method for VAR planning with a STATCOM for an industrial system that comprised multiple distributed generation units. The impact of the placement of STATCOM on voltage recovery and the rating of the STATCOM were determined through time-domain simulations [
6]. Xu and Li proposed an adaptive PI control, which can self-adjust the control gains in response to a disturbance such that the desired response is maintained, regardless of any change in the operating conditions [
7].
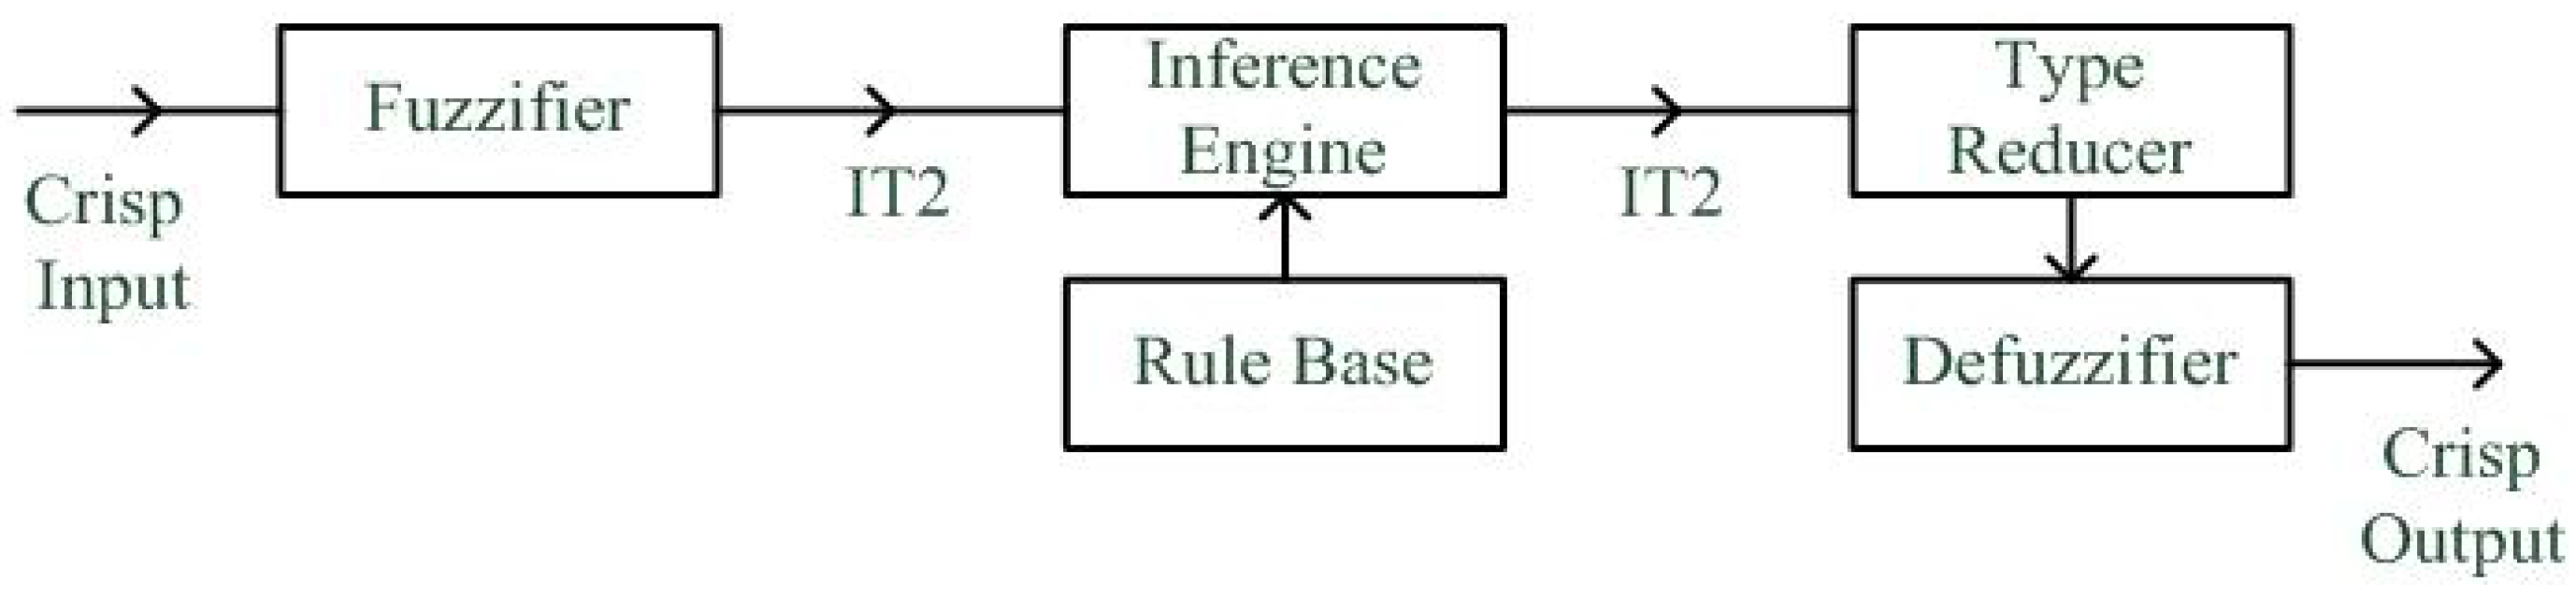
On the other hand, conventional fuzzy rules (also called a type-I (T1) fuzzy logic system) have been used to design controllers and have been found to be effective when the controlled plant is not complex. On the contrary, an interval type-II (IT2) fuzzy logic system outperforms T1 if the system is complex. Zadeh introduced the concept of type-II fuzzy sets, as an extension of type-I fuzzy sets, incorporating an additional dimension that represents uncertainty in degrees of membership [
8]. Liang and Mendel proposed a simplified method to compute the input and antecedent operations for IT2 fuzzy logic systems [
9]. They showed that all of the results that are needed to implement an IT2 fuzzy logic system can be obtained using T1 fuzzy logic mathematics [
10]. Other works have elaborated IT2 fuzzy logic systems, such as [
11,
12,
13,
14]. A tutorial about IT2 fuzzy logic systems is also available in [
15].
Recently, the IT2 fuzzy logic system was applied to solve power system problems. Tripathy and Mishra proposed an IT2 fuzzy logic-based thyristor-controlled series capacitor to improve power system stability. They used the concept of uncertainty bounds for type-reduction to overcome the limitation of the time-consuming iterative method generally used for type reduction [
16]. Khosravi
et al. proposed the application of IT2 fuzzy logic systems to the problem of short-term load forecasting [
17]. Mikkili and Panda proposed a shunt active filter to improve the power quality of the electrical network by mitigating the harmonics with the help of T1 and IT2 fuzzy logic controllers [
18]. Jafarzadeh
et al., proposed T1 and IT2 Takagi-Sugeno-Kang (TSK) fuzzy systems for both modeling and prediction of solar power [
19]. Khosravi and Nahavandi used IT2 fuzzy logic systems for day-ahead load forecasting, which introduced an optimal type reduction algorithm to improve the approximation [
20]. Murthy
et al. addressed that the failure rate and the repair rate of any component of a power system for reliability studies are uncertain; therefore, a membership representation using precise and crisp functions seems practically unreasonable [
21].
In this work, IT2 fuzzy rules are applied to the STATCOM to mitigate voltage variations caused by large load changes and intermittent photovoltaic power. The proposed IT2 fuzzy rule-based STATCOM is more robust than those described elsewhere [
4,
5,
6,
7]. The proposed method is implemented by integrating the NEPLAN software package with MATLAB/Simulink. The NEPLAN software package is utilized to perform a dynamic power flow simulation while MATLAB/Simulink is used to design the IT2 fuzzy rule-based controller and STATCOM.
The rest of this paper is organized as follows.
Section 2 provides the background of IT2 fuzzy logic systems.
Section 3 presents the method based on the IT2 fuzzy rule base for mitigating the voltage variations in the power system.
Section 4 summarizes the simulation results of a six-bus distribution system with PV generation. The conclusions are presented in
Section 5.
3. Proposed Method
A STATCOM can be operated with either current source or voltage source converters; the latter are the more popular. Essentially, the main function of the STATCOM is to regulate voltages by reactive power control unless an additional energy storage system is connected to the DC bus of the STATCOM.
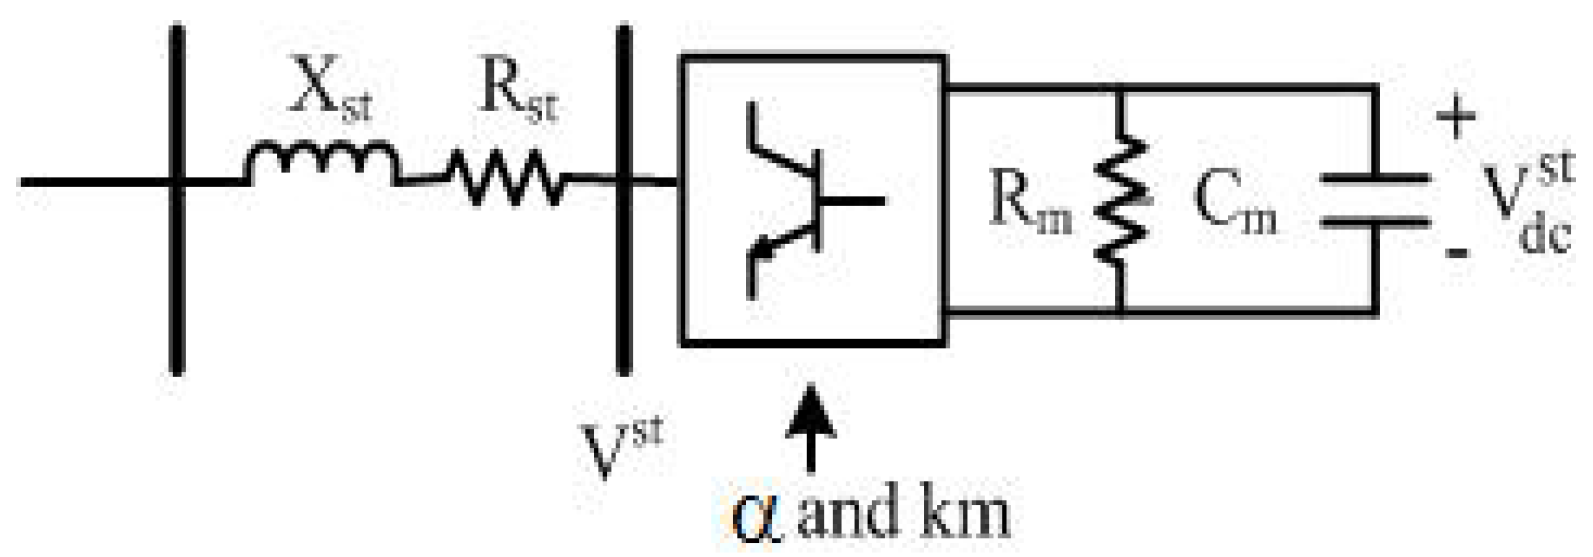
Figure 3 illustrates the model of the STATCOM that is used herein [
1,
2].
Figure 3.
Model of static synchronous compensator (STATCOM).
Figure 3.
Model of static synchronous compensator (STATCOM).
The DC voltage
can be transformed to be the
d- and
q-axis components of the output terminal of the STATCOM as follows [
1,
2].
where θ
bus and
denote the phase angle of the controlled AC bus and the DC voltage across the DC capacitance C
m, respectively The variables km and α are the modulation index and the phase angle of the STATCOM, respectively. From
Figure 3, one can obtain Equations (8) and (9) as follows [
1,
2].
where
is the DC current that flows into the positive terminal of
. R
m is the equivalent resistance of the STATCOM.
and
are the
d- and
q-axis currents that flow into the terminals of the STATCOM, respectively.
3.1. Dynamic Equations of STATCOM
Let V
st be the voltage at the STATCOM and Vd
bus and Vq
bus be the voltages of the
d- and
q-axes at the controlled AC bus, respectively. From the model of the STATCOM, the following dynamic equations are attained. Let the controlled bus voltage magnitude be Vt =
. The following dynamic equations can be obtained:
where Kc and Tc are parameters of the transfer function between Δα and
V
ref is a given voltage reference.
where Ks and Ts are parameters of the transfer function between Δkm and ΔVt
The dynamic phenomenon in the power system can be studied using the above dynamic equations, the swing equations of synchronous machines, and network equations.
3.2. IT2 Fuzzy Rules for Controllers
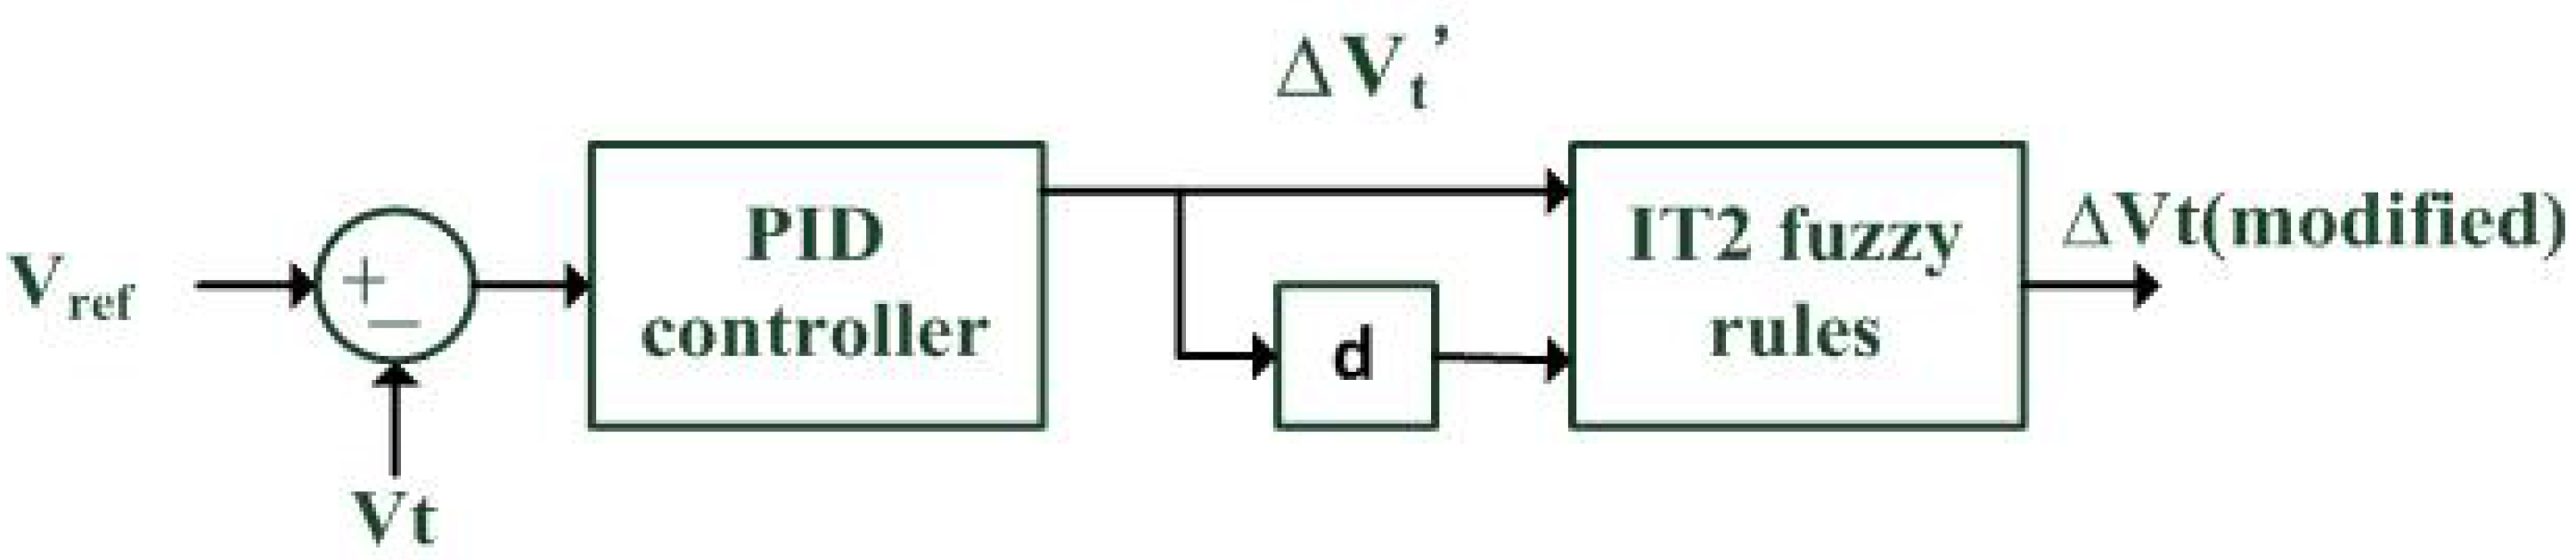
This paper proposes an IT2 fuzzy rule-based controller for mitigating the voltage variation, as shown in
Figure 4. The term V
ref − Vt in Equation (11) will be replaced by the output (modified ∆Vt) of the IT2 fuzzy rule base. The proposed IT2 fuzzy rule is expressed as
where
x1 is the output of the PID controller (denoted as ΔV
t’) and
x2 is the change rate of ΔV
t’. The variable y is the modified ∆Vt, which replaces the term V
ref − Vt in Equation (11).
A total of 25 IT2 fuzzy rules are implemented in the proposed method (
i.e., N = 25), as shown
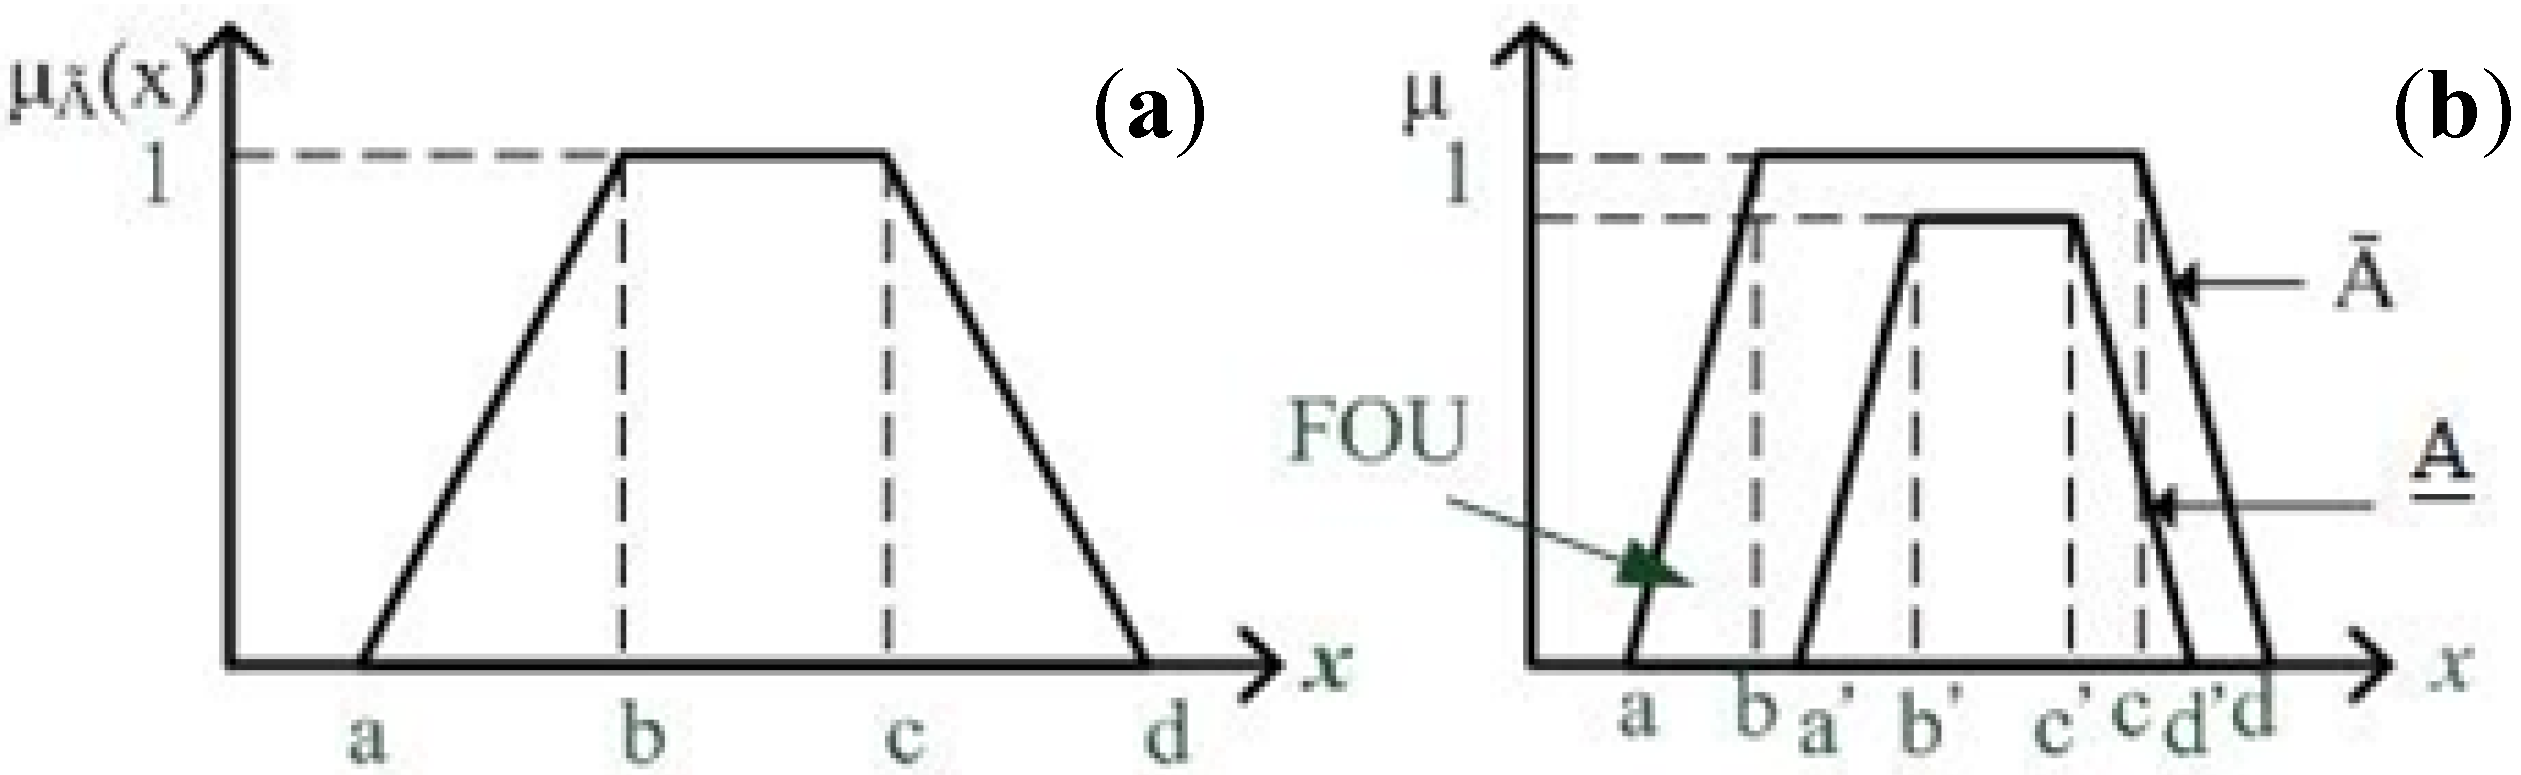
Table 1. The symbols NB, NS, ZR, PS, PB, IB, IS, KV, DS, DB, represent “Negative Big”, “Negative Small”, “Zero”, “Positive Small”, “Positive Big”, “Increasing and Big”, “Increasing and Small”, “Keeping Value”, “Decreasing and Small”, and “Decreasing and Big”, respectively. All UMF and LMF of Ã
1n and Ã
2n are expressed as trapezoid functions. Possible conditions of
x1 and
x2 could be NB, NS, ZR, PS or PB and the consequent actions y could be IB, IS, KV, DS or DB, as shown in
Table 1.
Figure 4.
IT2 fuzzy rule-based controller. (Symbol “d” means “derivative”)
Figure 4.
IT2 fuzzy rule-based controller. (Symbol “d” means “derivative”)
Table 1.
Twenty-five IT2 fuzzy rules.
Table 1.
Twenty-five IT2 fuzzy rules.
| Linguistic Variables of x1 and x2 | x1 = NB | x1 = NS | x1 = ZR | x1 = PS | x1 = PB |
|---|
| x2 = PB | KV | IS | IB | IB | IB |
| x2 = PS | DS | KV | IS | IB | IB |
| x2 = ZR | DB | DS | KV | IS | IB |
| x2 = NS | DB | DB | DS | KV | IS |
| x2 = NB | DB | DB | DB | DS | KV |
3.3. Co-Simulation between NEPLAN and SIMULINK
Two software packages, namely NEPLAN [
24] and MATLAB/Simulink (MathWorks, Natick, MA, USA), are used to implement the proposed method. The NEPLAN software package deals with the dynamic power flow simulation while the IT2 fuzzy rule-based controller and STATCOM are modeled by MATLAB/Simulink, as shown in
Figure 5.
Figure 5.
Co-simulation conducted by integrating NEPLAN with Simulink.
Figure 5.
Co-simulation conducted by integrating NEPLAN with Simulink.
The NEPLAN software package has interfaces for linking with Simulink. The dynamic power flow studies performed in the NEPLAN package are conducted by running a power flow program with varying real and reactive power injections (Pin and Qin). A constant time step for running the power flow program is specified in the NEPLAN package. Vst, Vdbus, and Vqbus, computed by the NEPLAN package, are fed to Simulink.
3.4. Discussions of the Proposed Method
Two comments about the proposed method are discussed as follows:
(1) The proposed method utilized 25 IT2 fuzzy rules to implement the STATCOM controllers. In power system problems many facilities require controllers, which may be realized by different types of fuzzy rules, to stabilize the power system.
Table 2 summarizes eight fuzzy rule-based controllers with their corresponding problems, number of fuzzy rules, types of fuzzy rules, and hardware [
25,
26,
27,
28,
29,
30,
31,
32]. It can be found that the numbers of fuzzy rules are in the range of 16–60. The state-of-the-art DSP chip or CPU is able to accommodate these numbers of fuzzy rules and provide fast calculation for controlling the kW- or MW-scaled facilities in the power system.
(2) The existing STATCOM works, such as References [
4,
5,
6,
7] mentioned in
Section 1, have the following limitations and are less robust than the proposed method. (i) The work of Wang and Crow in [
4] needs to linearize the nonlinear system before applying the feedback linearization transformation. The state feedback matrix needs to be determined by linear control techniques, such as pole assignment. As described in [
4], when an operating point crosses the singular surface of the power system problem, the system matrix becomes ill-conditioned and the trajectory curves are more likely to oscillate dramatically near this point. This may cause unexpected uncontrollability and chaotic behavior in the STATCOM dynamics. (ii) All the control gains in Chen’s work [
5] are fixed and not adaptive to a change of scenarios. (iii) Aziz’s work in [
6] addressed the application of STATCOM at the planning stage. Aziz tuned the PID parameters by taking the step response of the open-loop plant into consideration. The results were verified in the peak load condition only. (iv) The work of Xu and Li lies in three essential parameters: allowed delayed time of response and ideal ratio of K
p over K
i for both current and voltage control loops, where K
p and K
i denote the parameters of proportional and integral gains, respectively. Actually, the “ideal ratio” of K
p over K
i is not well-defined and may depend on the operating conditions of different power systems.
Table 2.
Eight fuzzy rule-based controllers and their corresponding features.
Table 2.
Eight fuzzy rule-based controllers and their corresponding features.
| Problems | Number of Fuzzy Rules | Types of Fuzzy Rules | Hardware | References |
|---|
| Maximum power-point tracker for photovoltaic arrays | 16 | Mamdani | Infineon TriCore TC1796 | [25] |
| Design of wide-area damping controller to damp the inter-area oscillations | 30 | Mamdani | - | [26] |
| Improvement of transient stability using FACTS devices | 30 | Mamdani | - | [27] |
| Improvement of transient stability using bang-bang controller | 49 | Mamdani | - | [28] |
| Control of the inverter for utilization of the wind energy | 49 | Mamdani | PC with DT2821 Data Card | [29] |
| Design of power system stabilizer | 49 | Mamdani | - | [30] |
| Design of power system stabilizer | 49 | Mamdani | - | [31] |
| Power management of energy of storage systems | 60 | Takagi-Sugeno | DSP TMS320F2812 | [32] |
4. Simulation Results
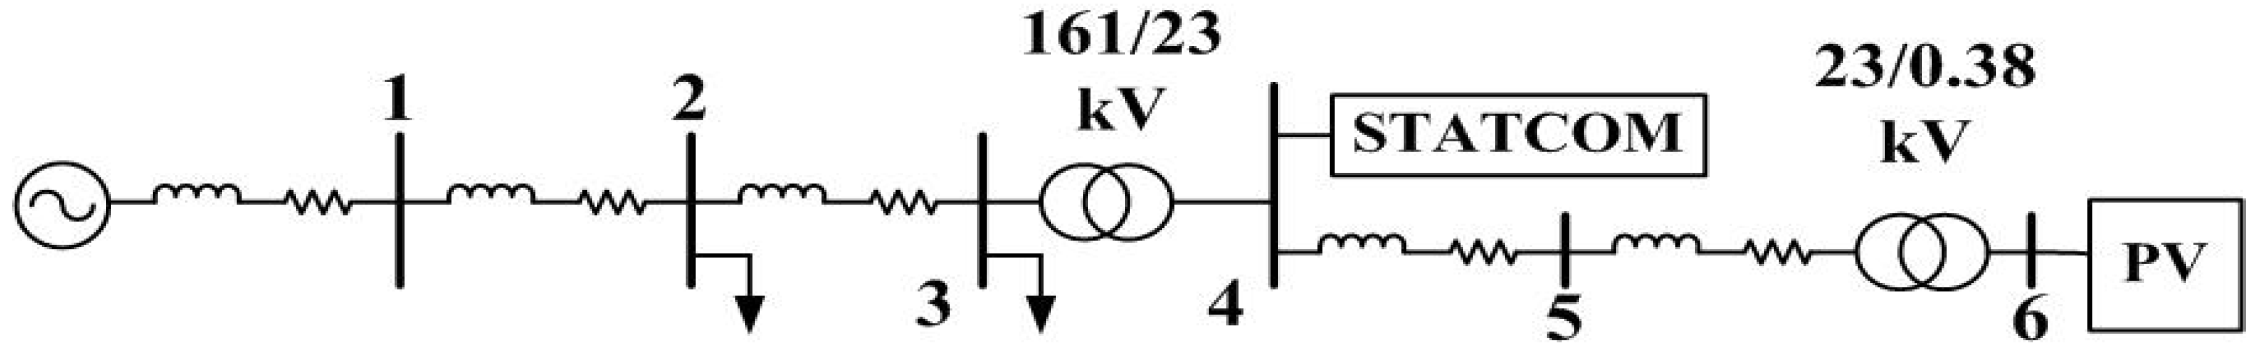
A six-bus power system, as shown in
Figure 6, is studied. The PV farm with a generating capacity of 6.3 MW is located at bus 6. An IT2 rule-based STATCOM is located at bus 4. For comparison, the performance obtained by the traditional fuzzy rule-based (Type I) STATCOM is also provided herein. The values of K
p, K
i and K
d in
Figure 4 are 10, 10 and 0, respectively. Suppose that the variation of irradiation is linear. The MVA base is 100. The
Appendix provides the parameters of IT2 fuzzy rules as well as parameters of the STATCOM model.
Figure 6.
Studied system.
Figure 6.
Studied system.
4.1. Scenario 1: Switching a Heavy Load
The demands of buses 2 and 3 are 30 MW + j20 MVAR and 100 MW + j30 MVAR, respectively. At t = 10 s, an additional heavy load 60 MW + j60 MVAR is switched on at bus 3. The irradiation in this scenario is zero.
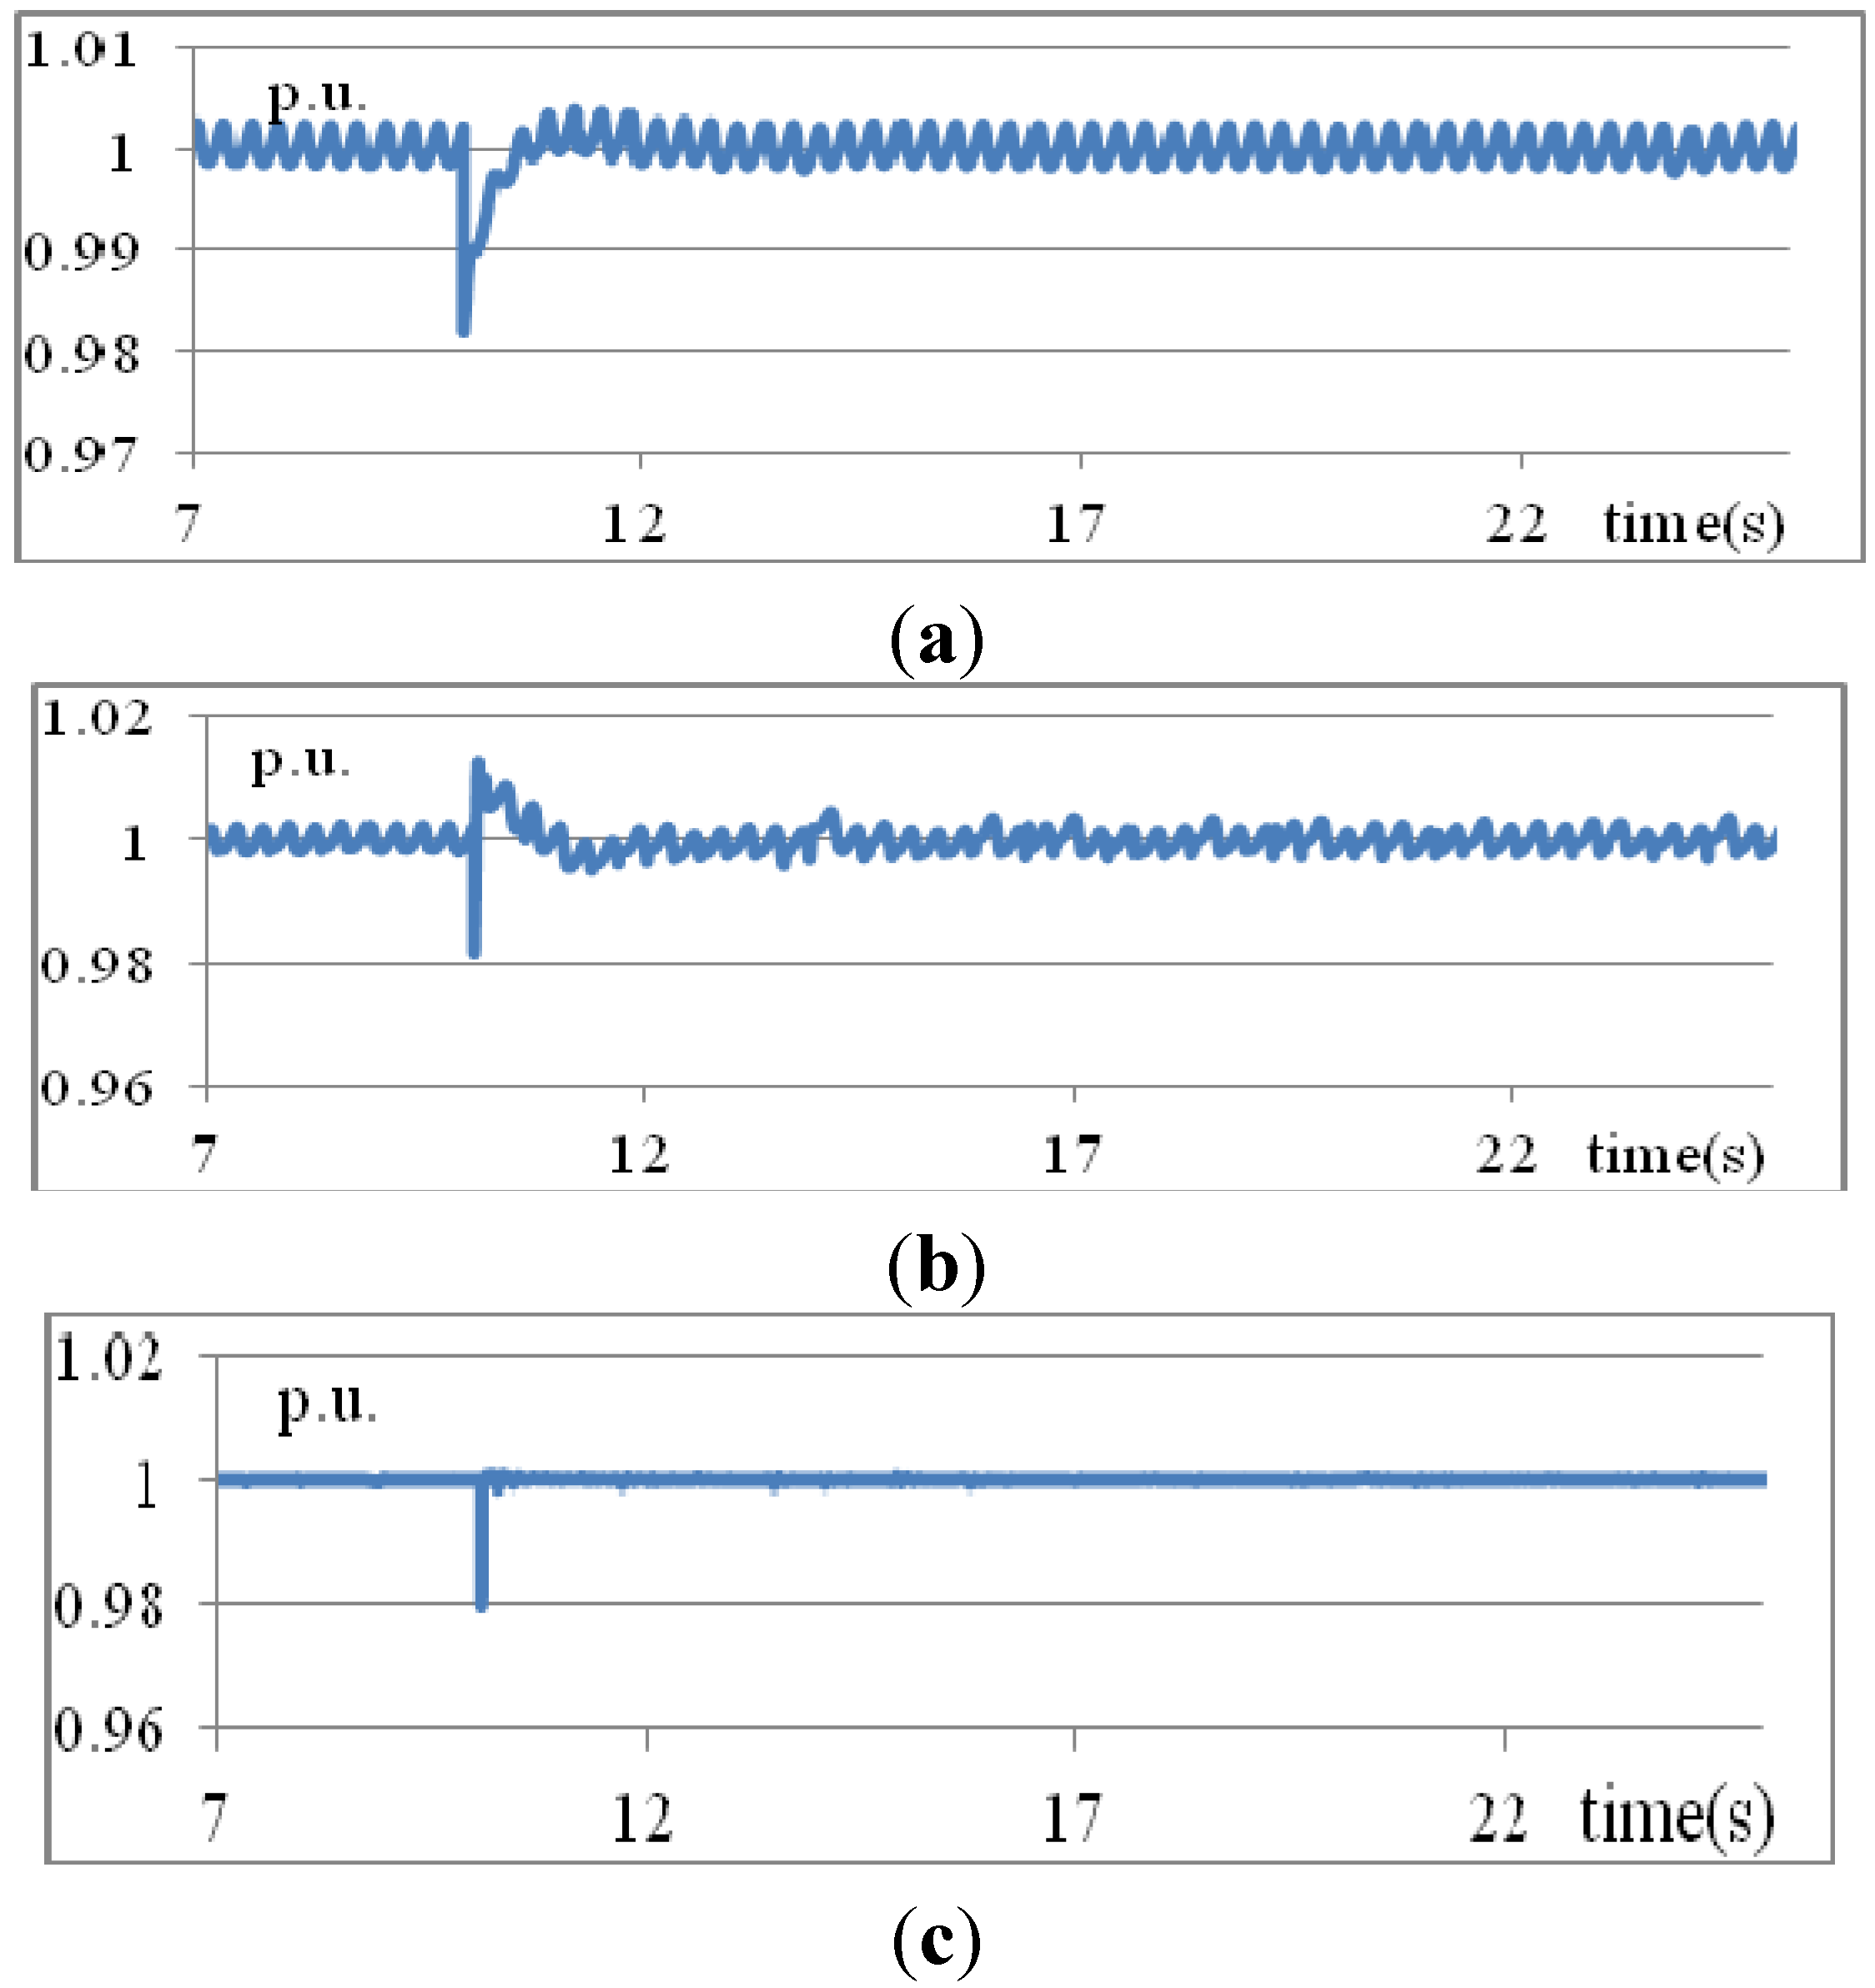
Figure 7 shows the controlled voltage at bus 3 obtained using three different methods—traditional PID, T1 fuzzy rules, and IT2 fuzzy rules. As shown in
Figure 7a, the voltage drops at 10 s and recovers slowly when traditional PID control is used. The steady-state voltage is still oscillating. When T1 fuzzy rules are used, the voltage recovers quickly after dropping but an overshoot occurs, as shown in
Figure 7b. Again, the steady-state voltage is still oscillating. When the proposed IT2 fuzzy rules are used, the rising time and overshoot of the voltage are almost negligible, as shown in
Figure 7c.
Figure 7.
Voltages at bus 3 obtained using three methods: (a) traditional PID; (b) T1 fuzzy rules; (c) IT2 fuzzy rules (Scenario 1).
Figure 7.
Voltages at bus 3 obtained using three methods: (a) traditional PID; (b) T1 fuzzy rules; (c) IT2 fuzzy rules (Scenario 1).
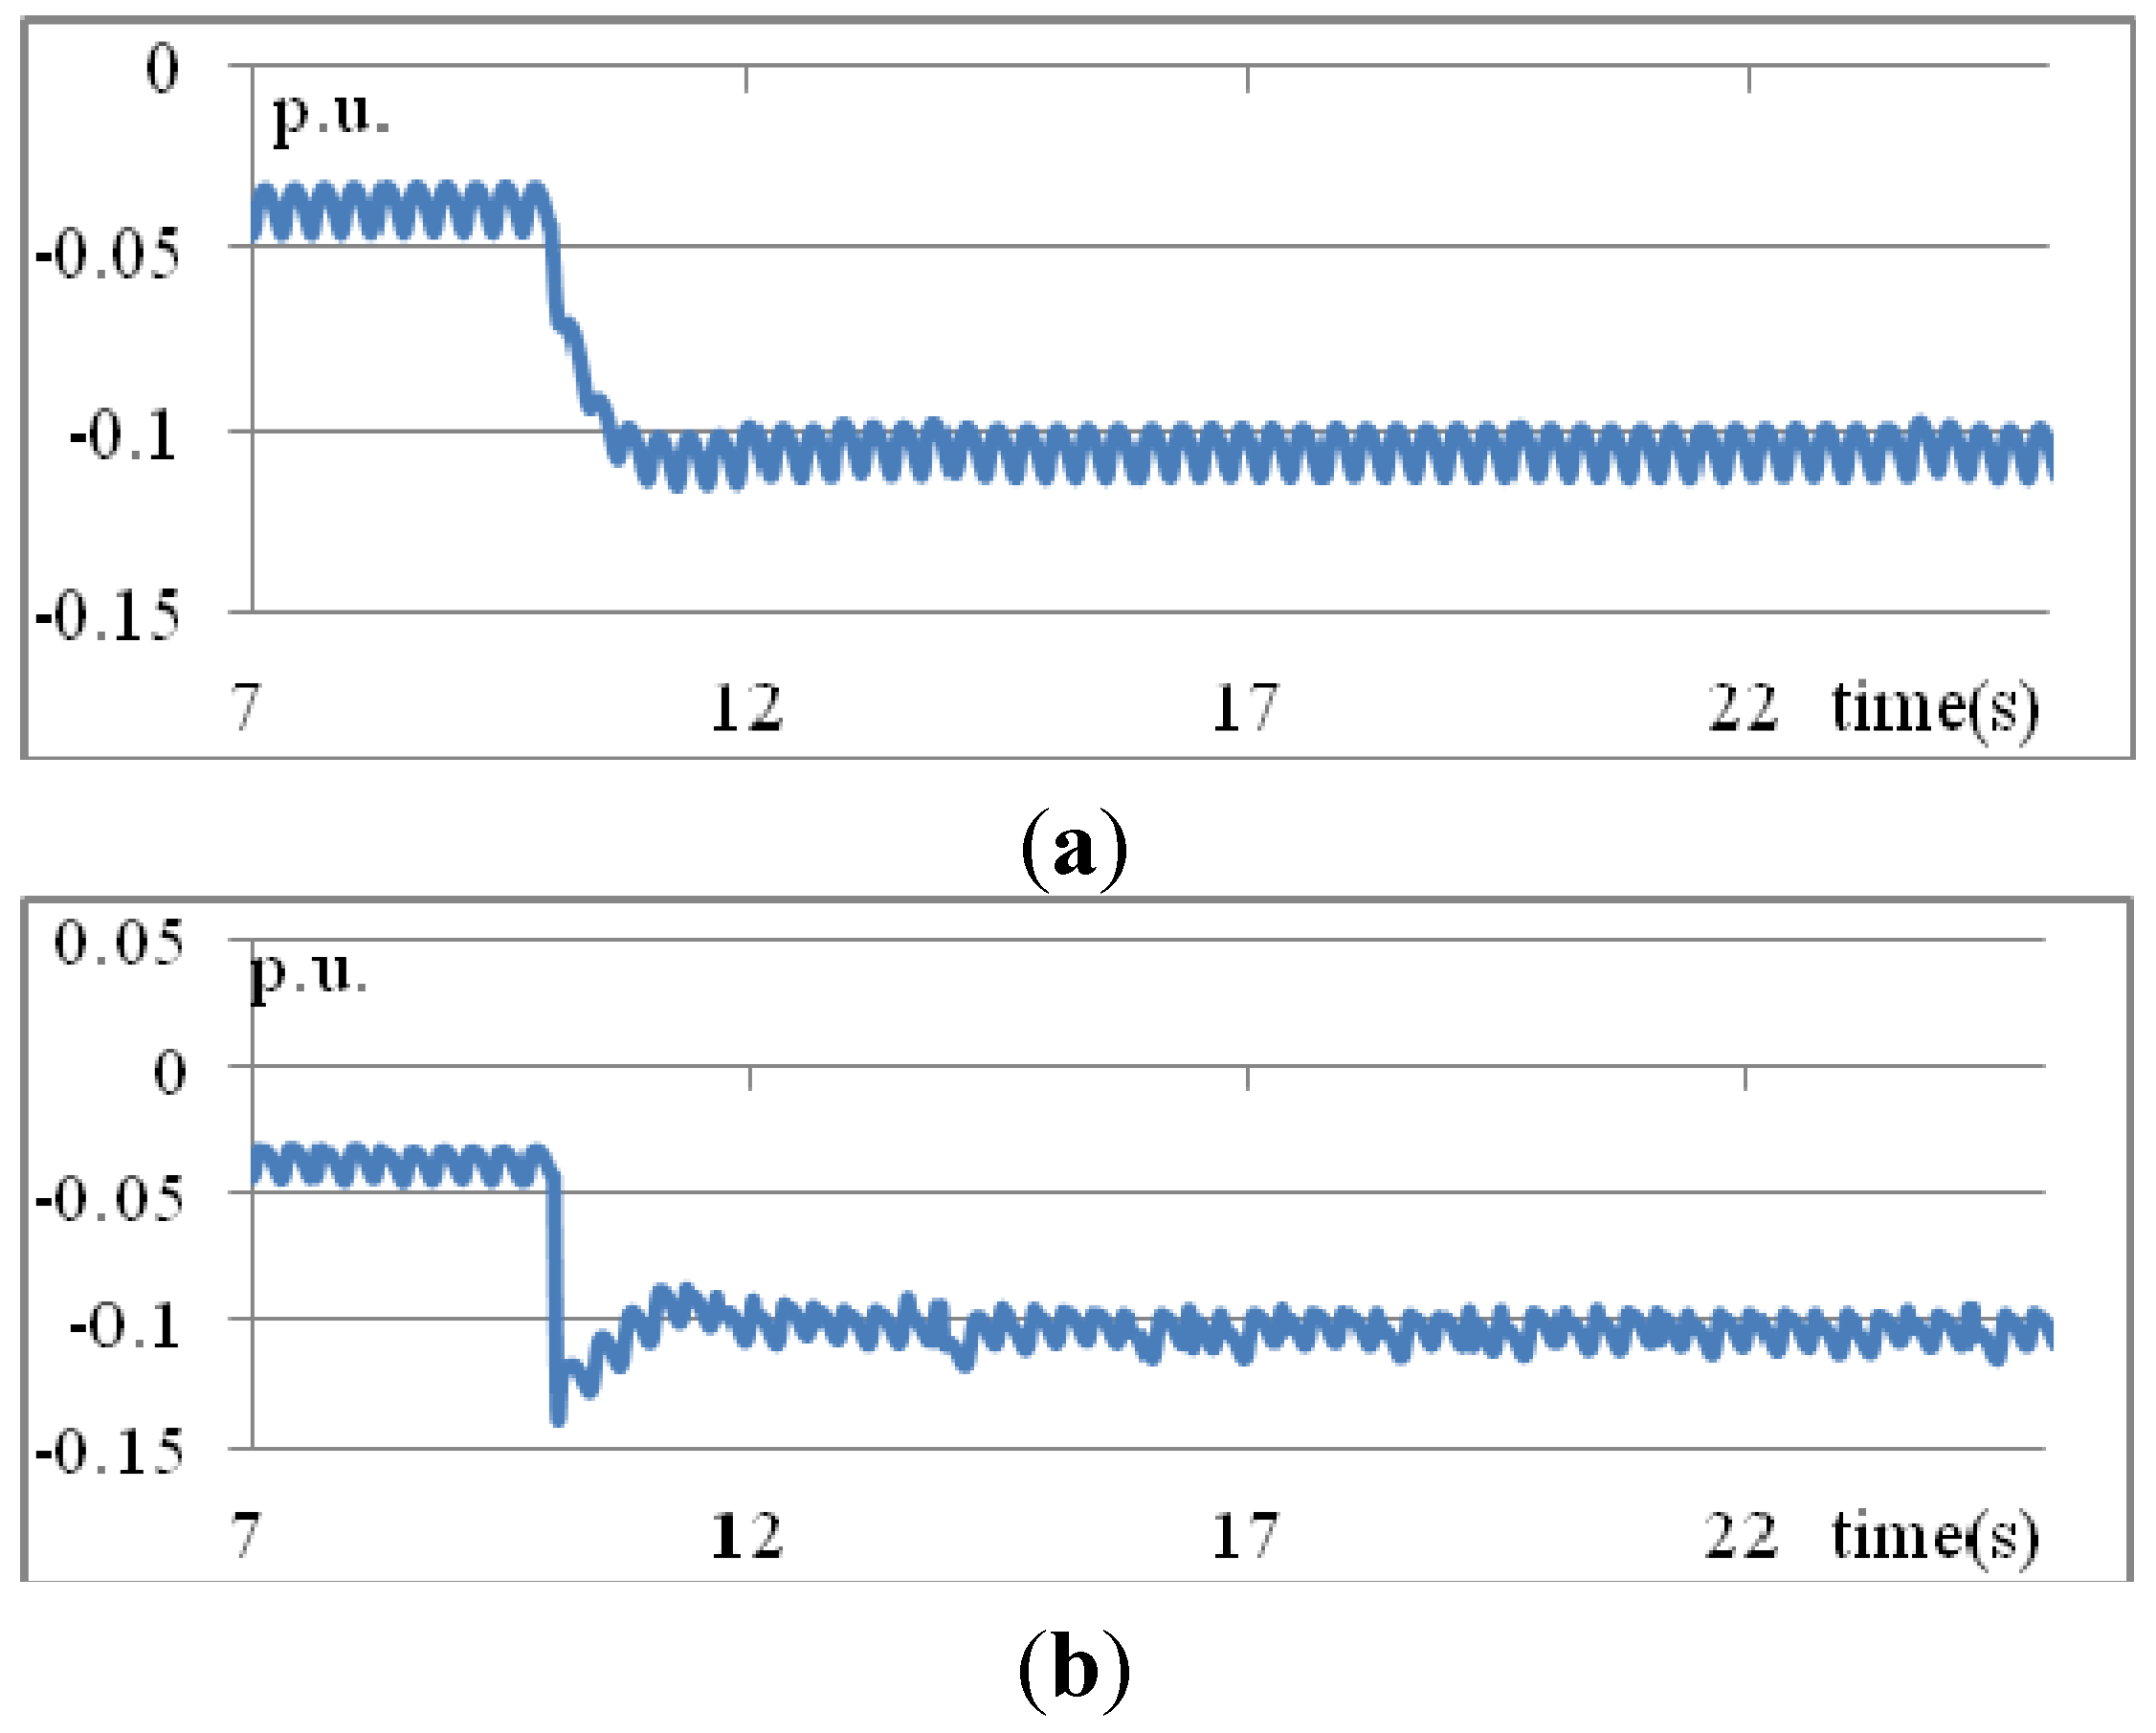
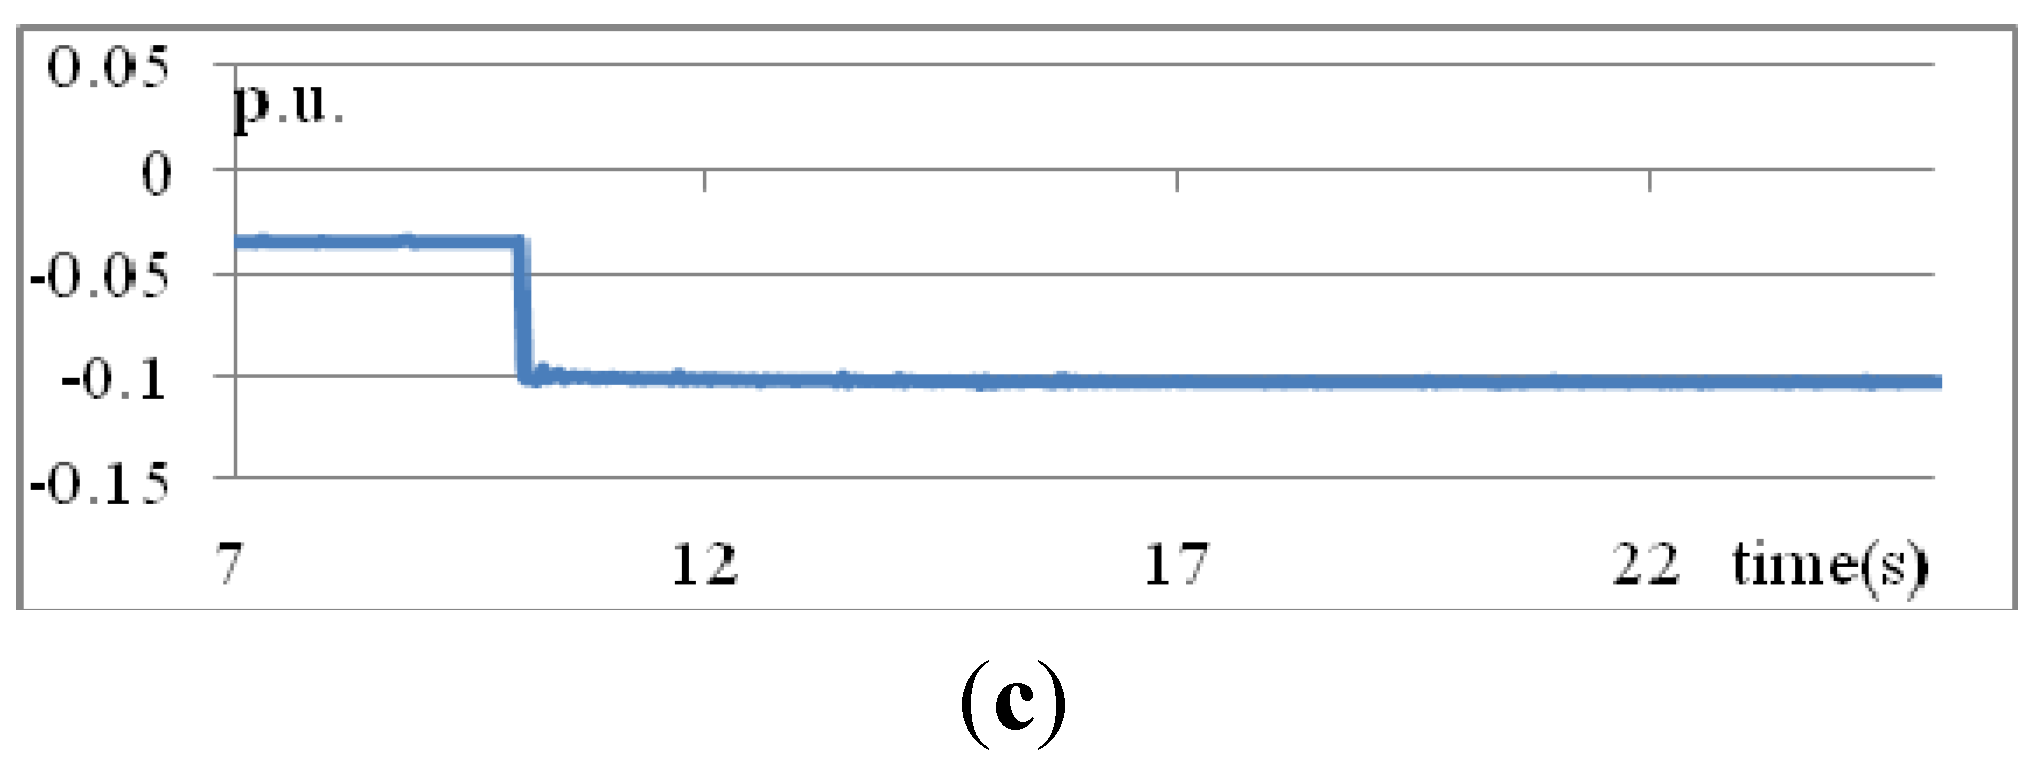
Figure 8 illustrates the reactive power injection from the STATCOM obtained using the three methods. The variations of voltages, shown in
Figure 7, are consistent with those of the reactive powers shown in
Figure 8.
Figure 8.
MVARs from STATCOM obtained using three methods: (a) traditional PID; (b) T1 fuzzy rules; (c) IT2 fuzzy rules (Scenario 1).
Figure 8.
MVARs from STATCOM obtained using three methods: (a) traditional PID; (b) T1 fuzzy rules; (c) IT2 fuzzy rules (Scenario 1).
4.2. Scenario 2: Increasing and then Decreasing Irradiations
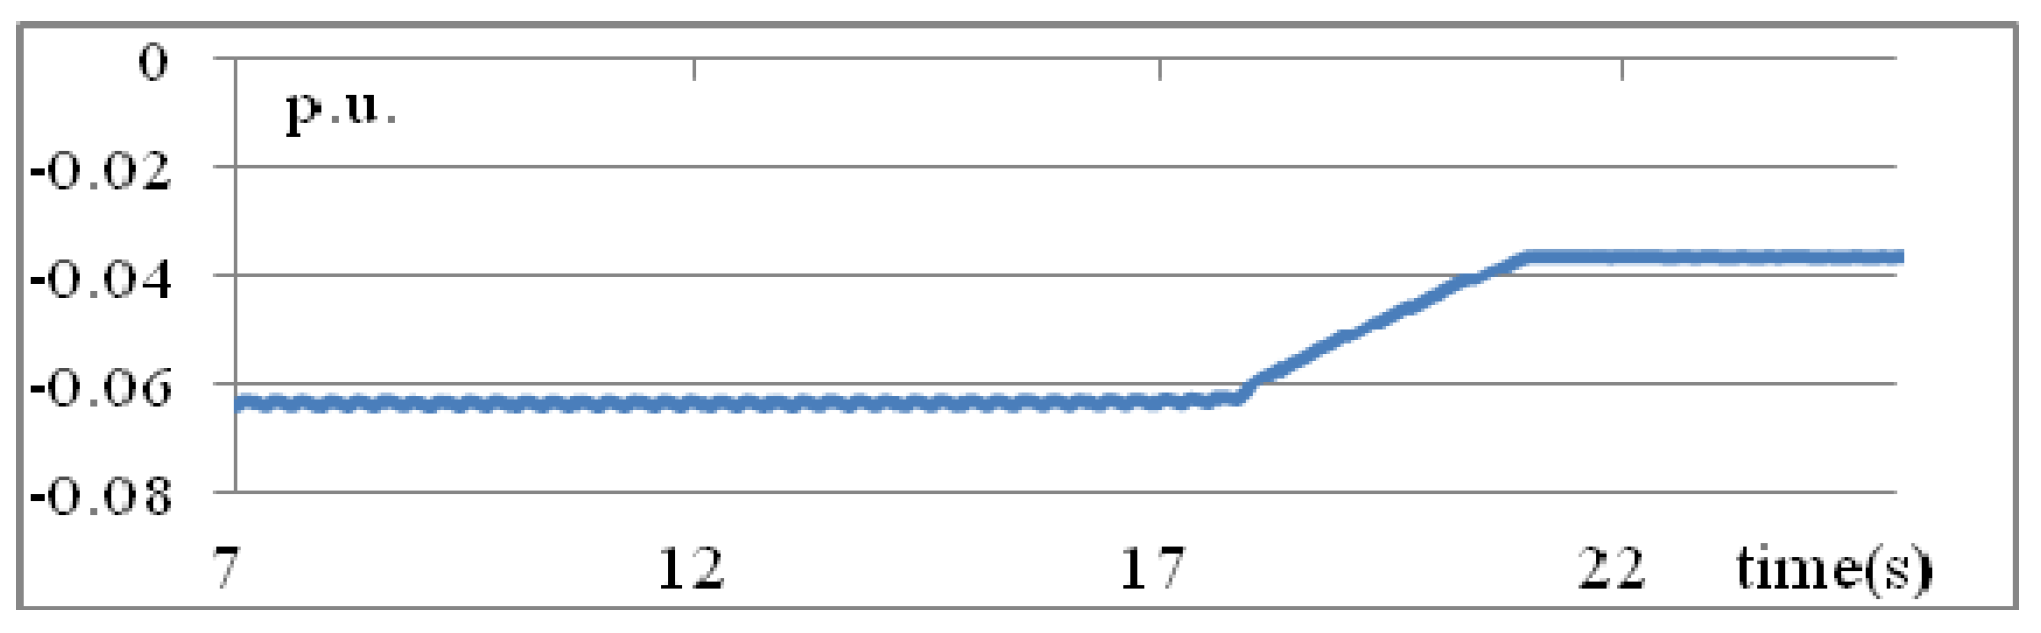
The loads at buses 2 and 3 are 30 MW + j20 MVAR and 10 MW + j3 MVAR, respectively. The irradiation changes linearly. Initially, the MW generation from the PV is 0.063 p.u., as shown in
Figure 9. The MW generation starts to decrease at
t = 17 s and becomes 0.0363 p.u. at
t = 21 s.
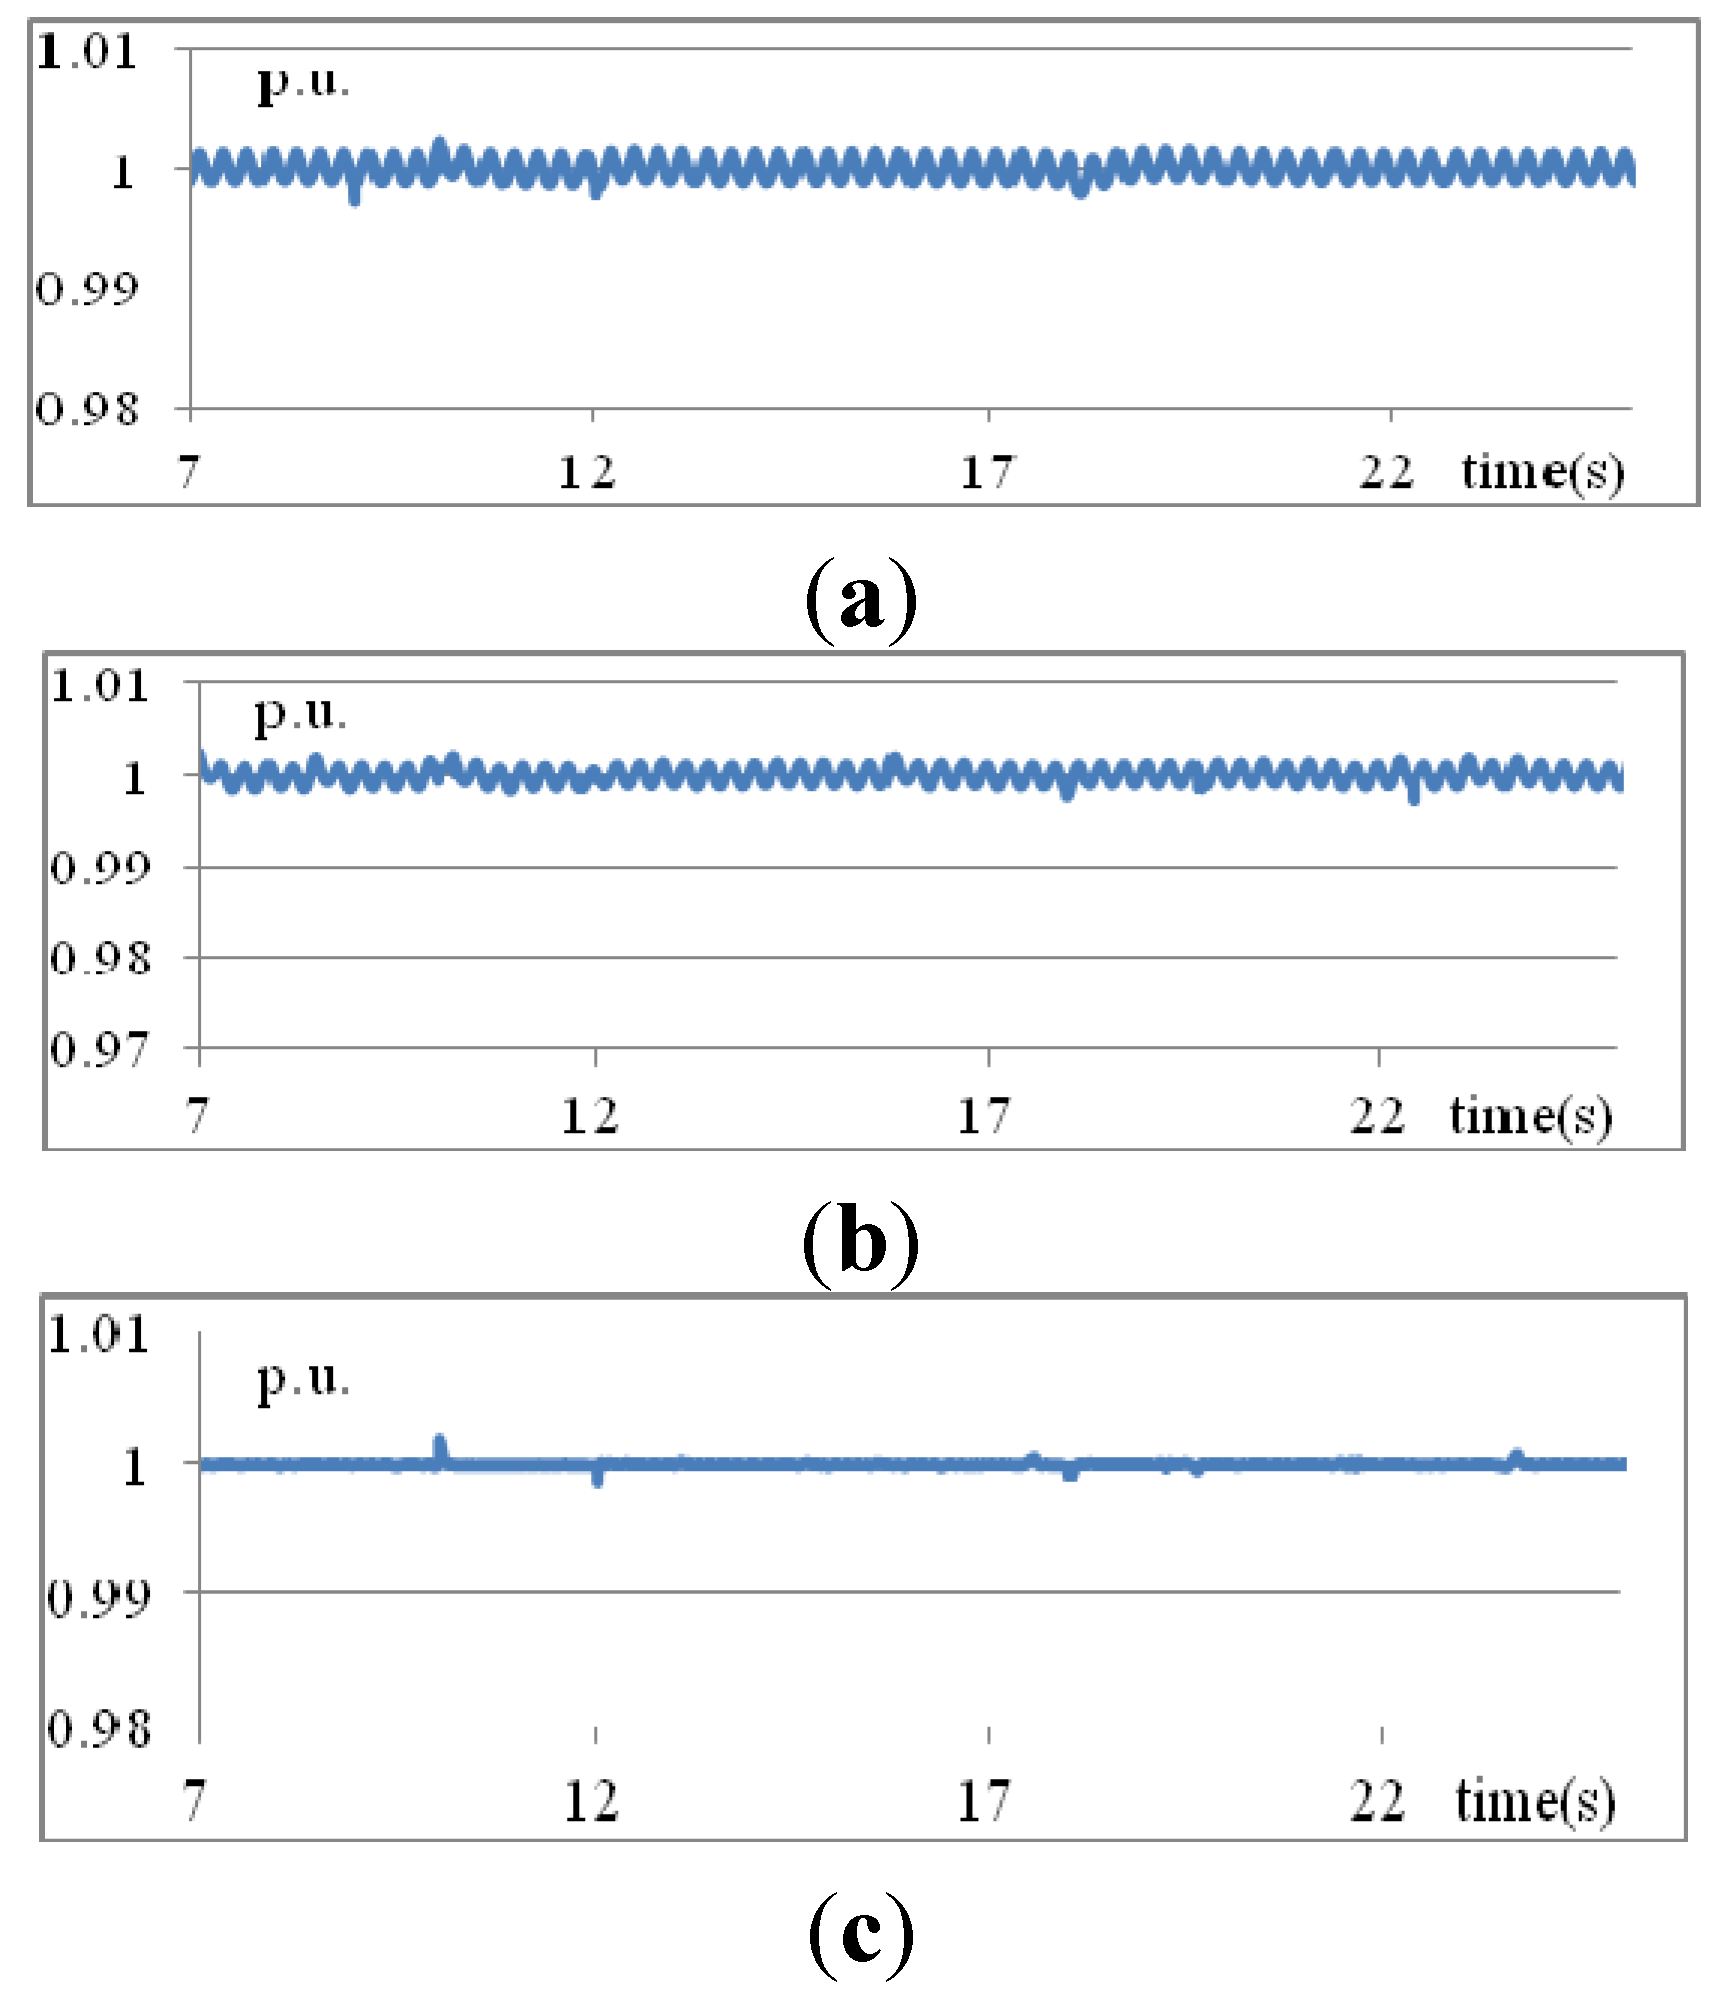
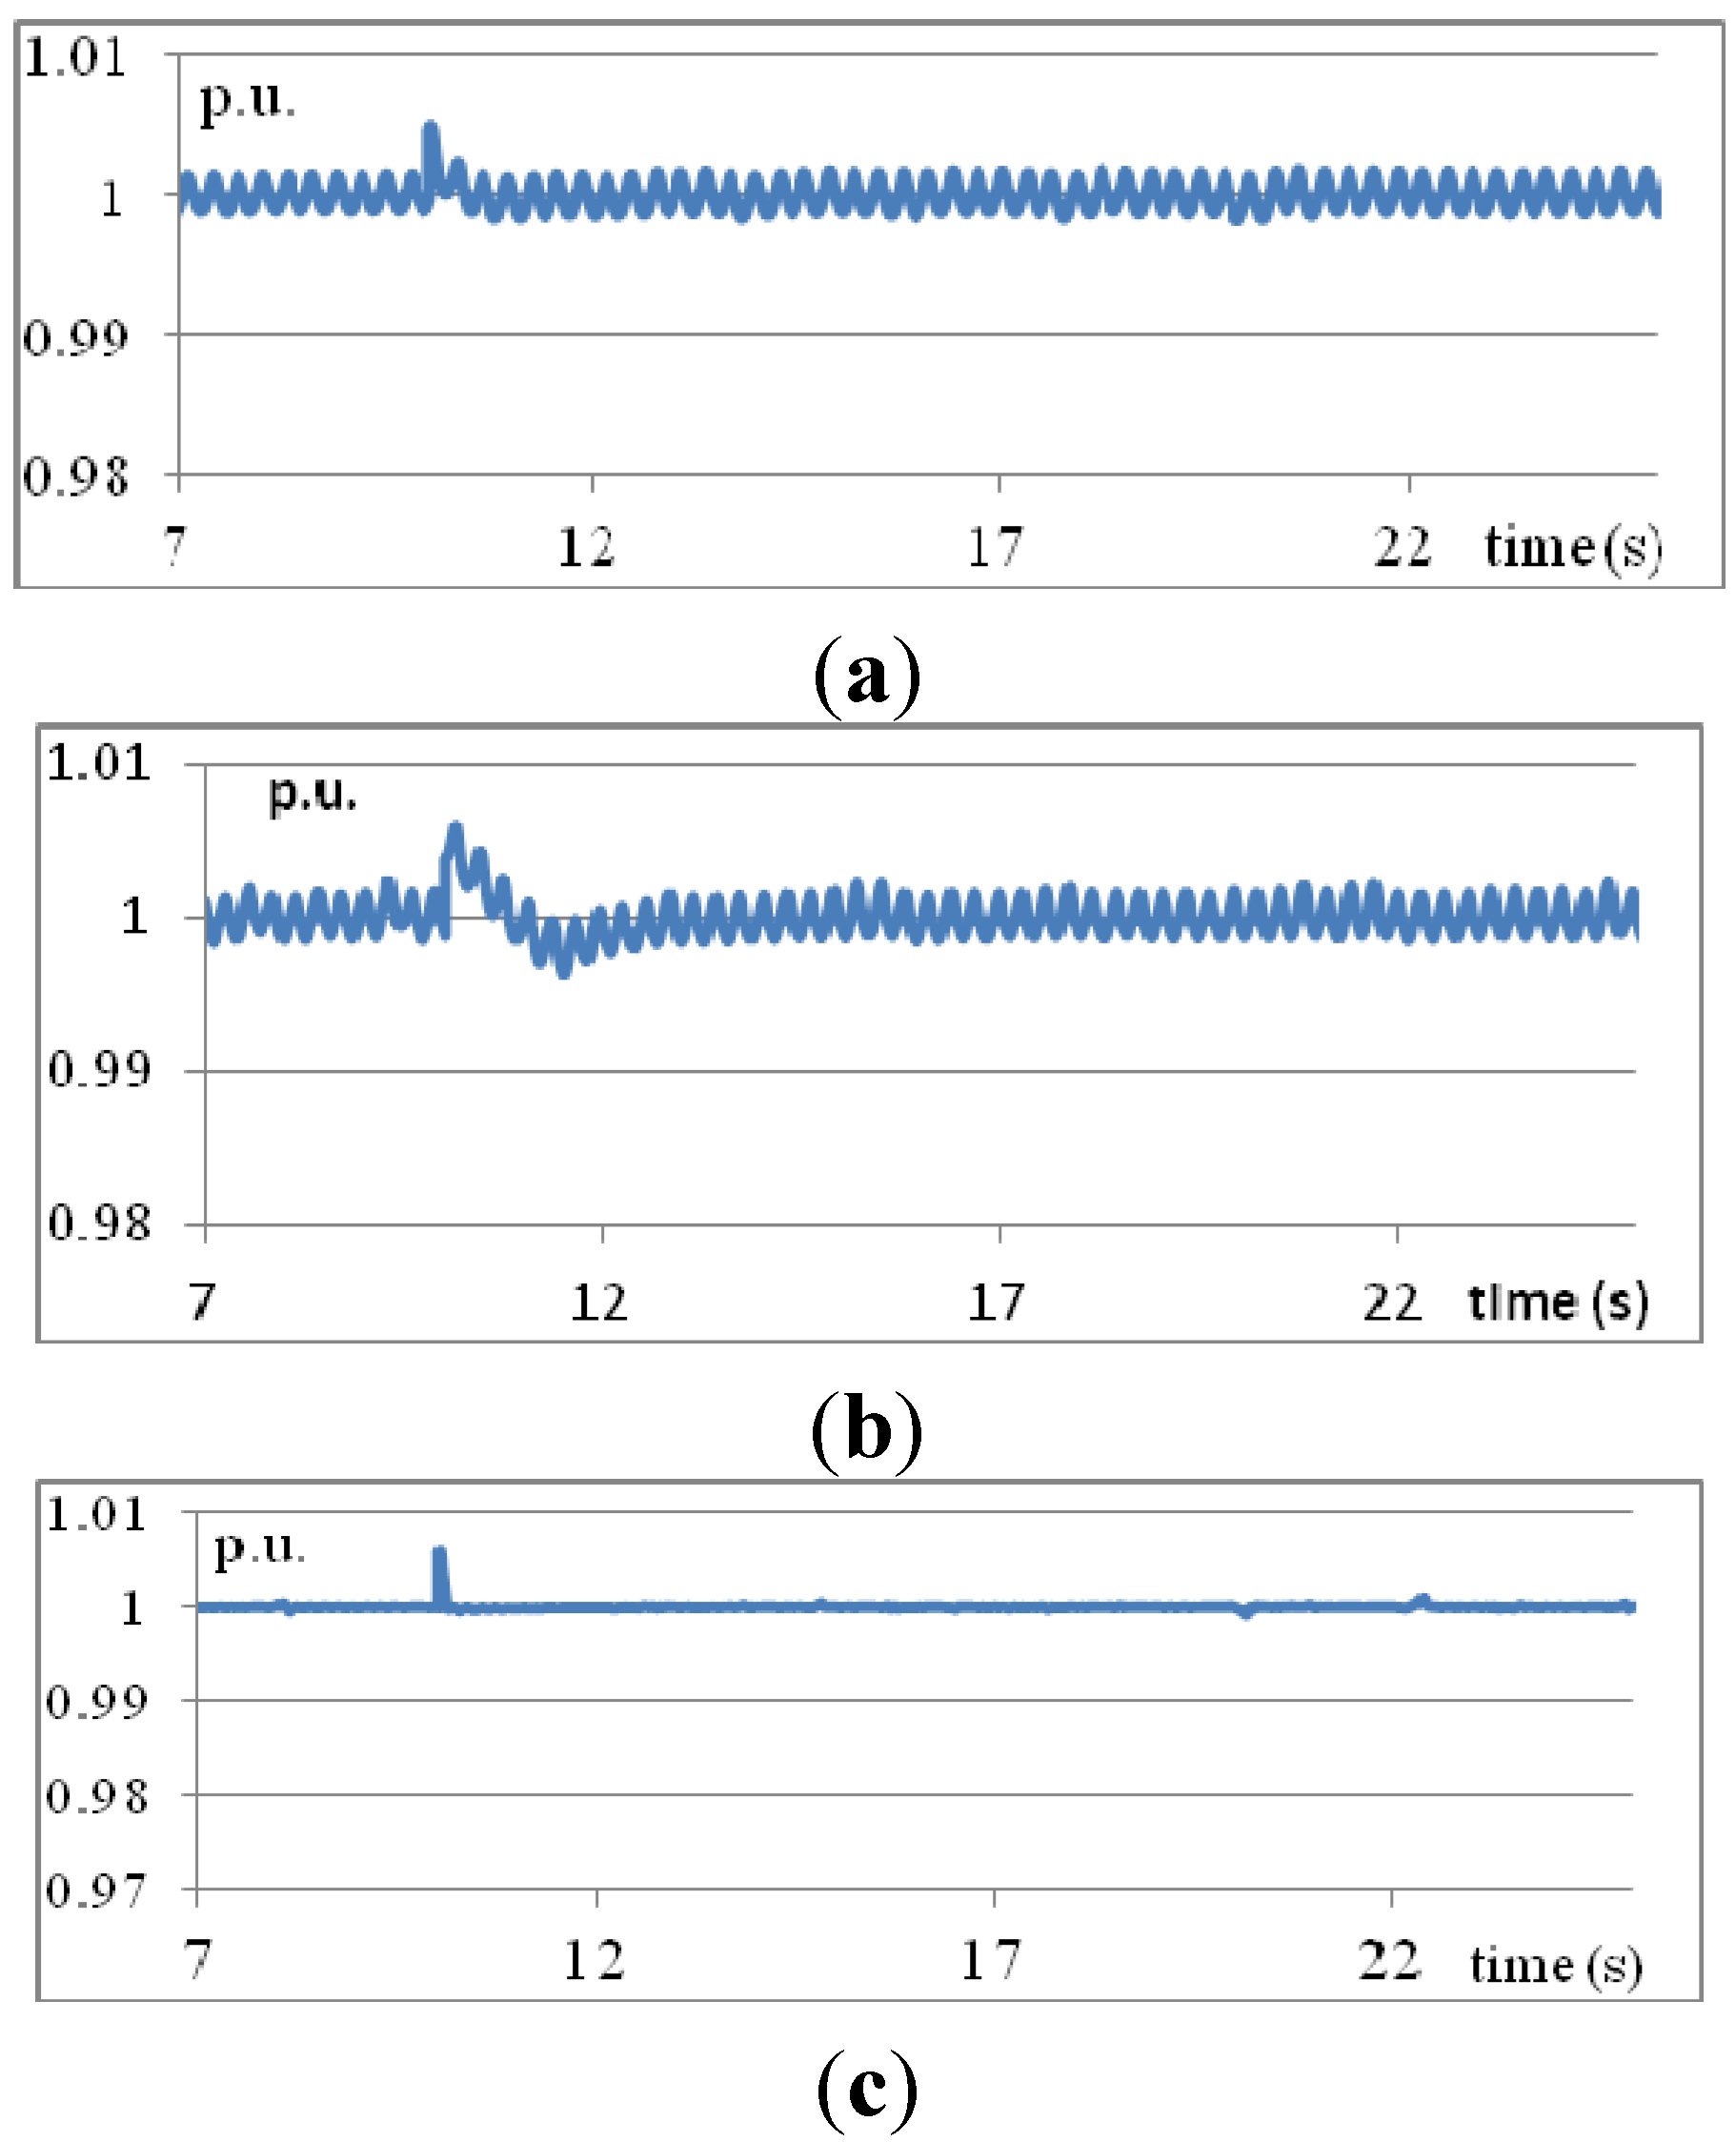
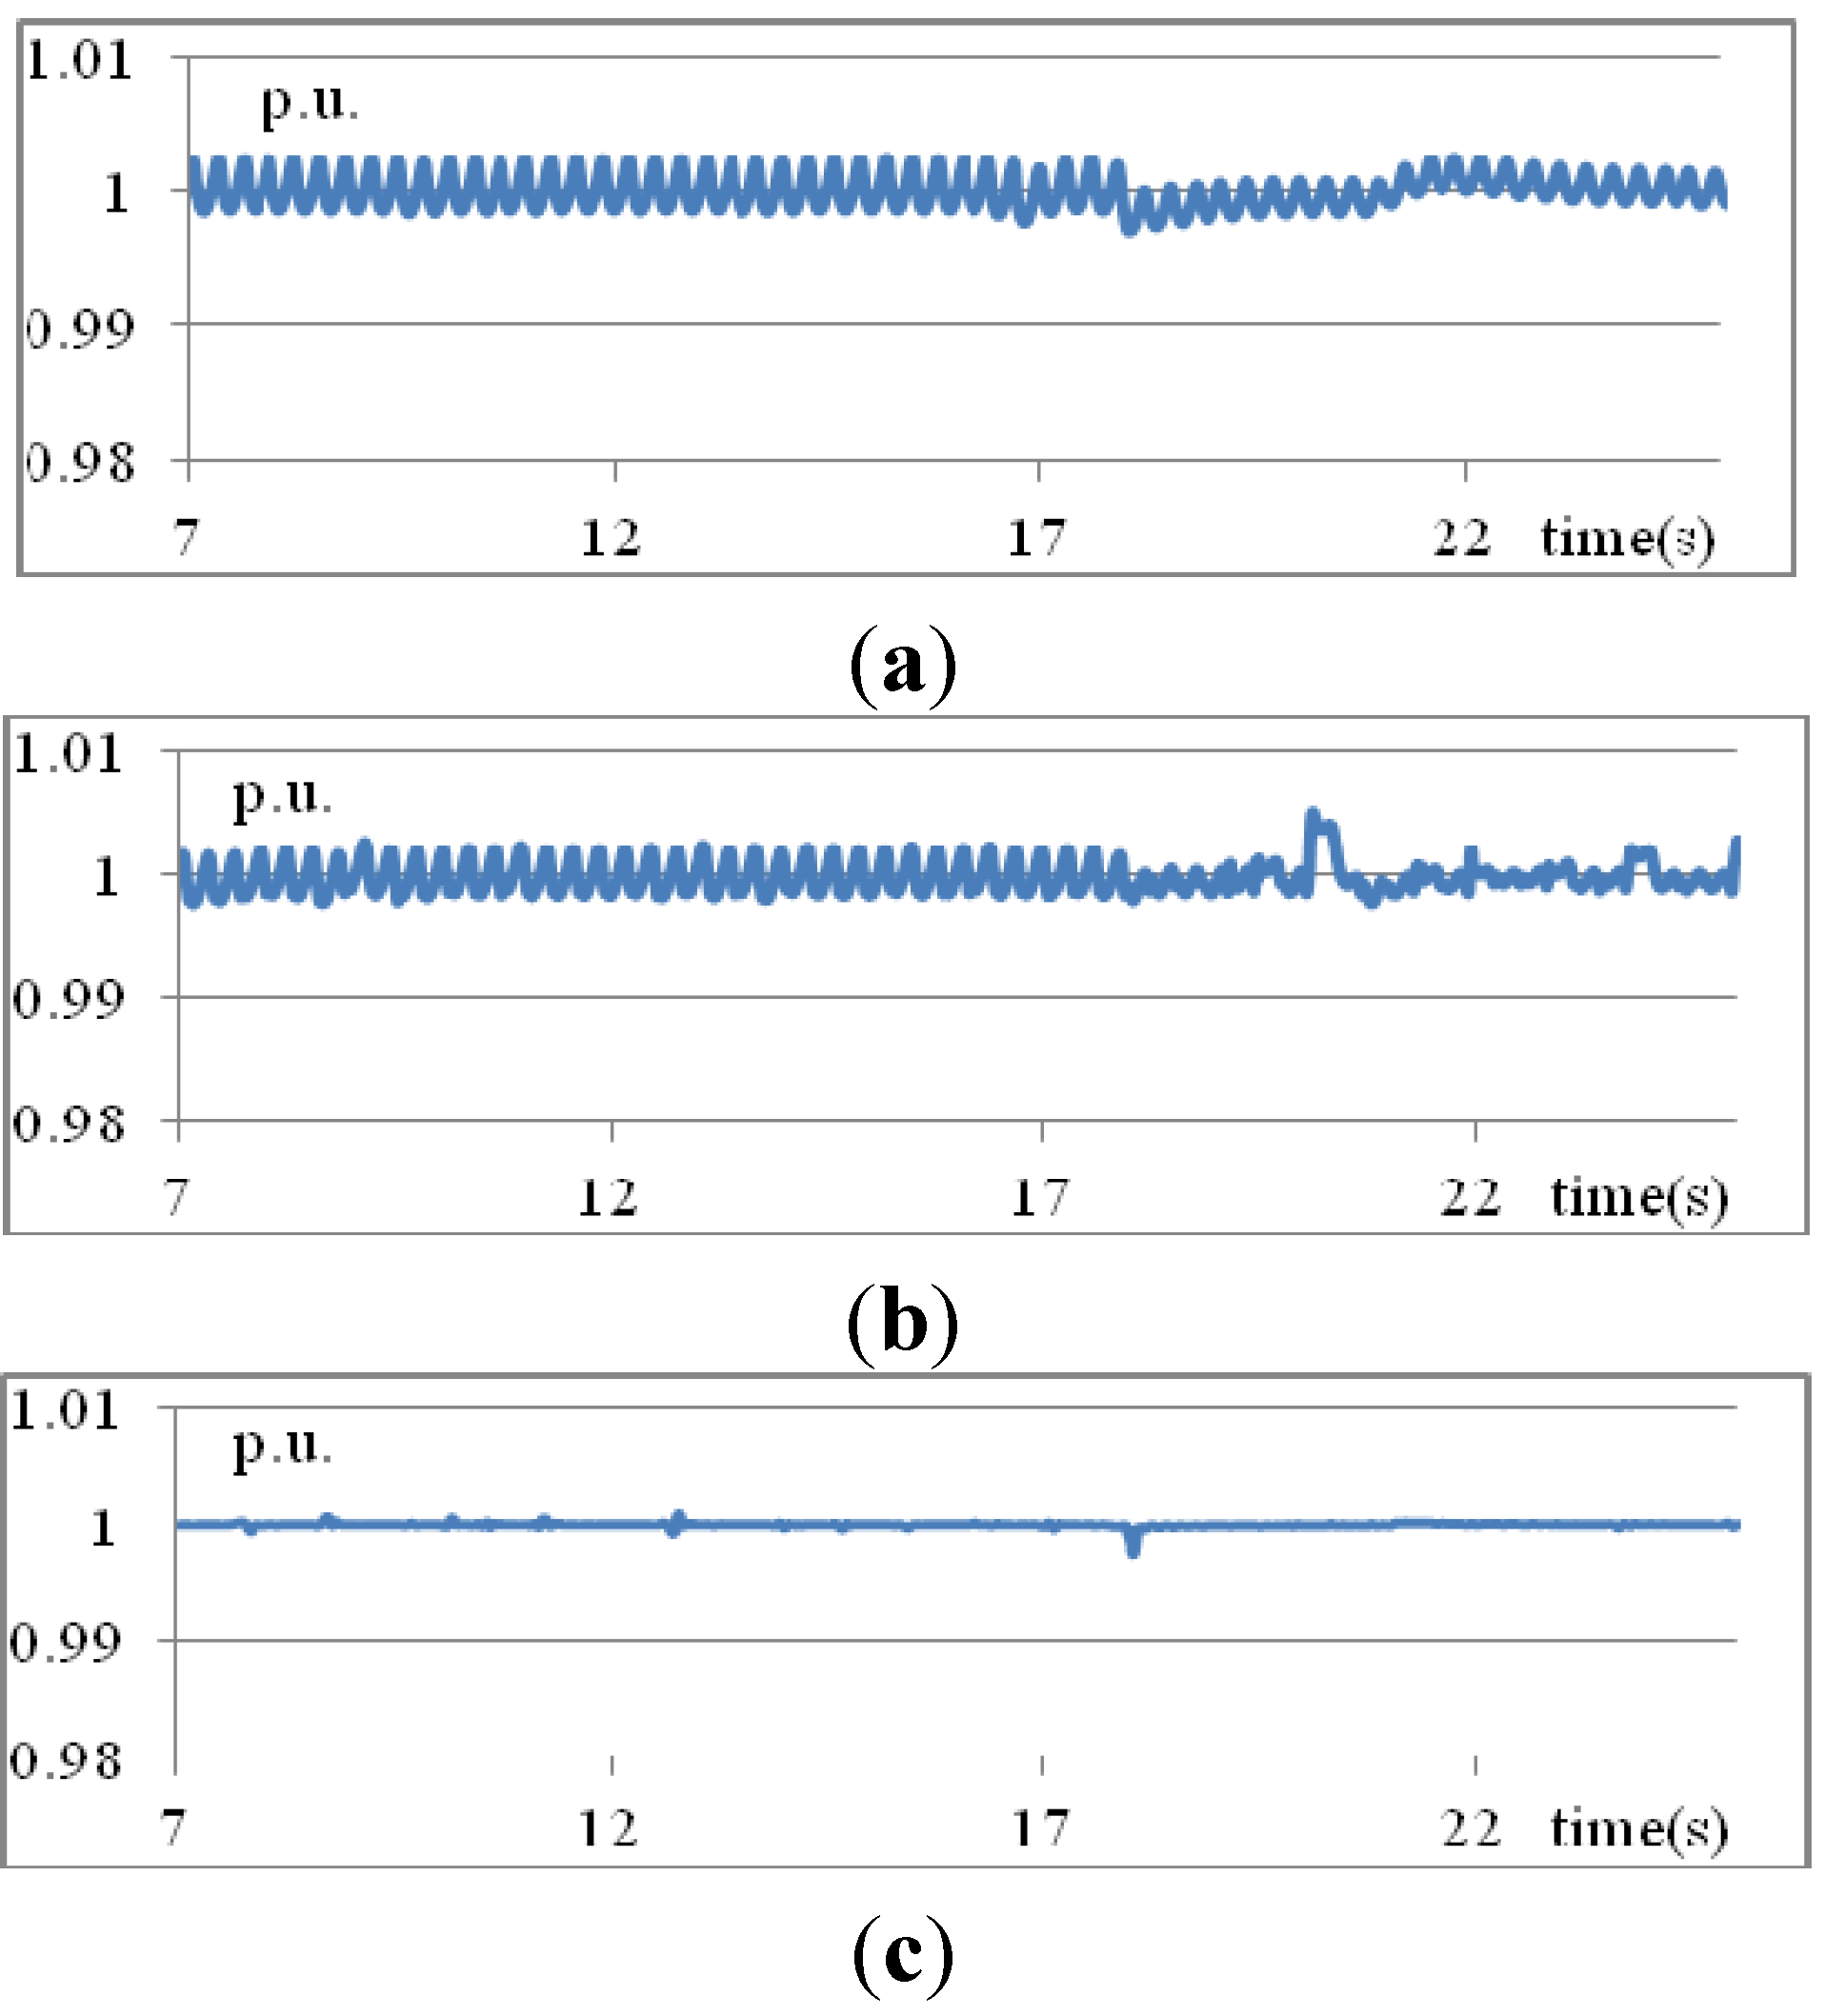
Figure 10 shows the controlled voltage at bus 3 obtained using three methods—traditional PID, T1 fuzzy rules, and IT2 fuzzy rules. As shown in
Figure 10a, the voltage decreases slightly near
t = 18 s and increases back to the nominal value near
t = 21 s. The proposed IT2 fuzzy rules yield the best voltage performance, as shown in
Figure 10c.
Figure 9.
Variations of MW generation from PV (Scenario 2).
Figure 9.
Variations of MW generation from PV (Scenario 2).
Figure 10.
Voltages at bus 3 obtained using three methods: (a) traditional PID; (b) T1 fuzzy rules; and (c) IT2 fuzzy rules (Scenario 2).
Figure 10.
Voltages at bus 3 obtained using three methods: (a) traditional PID; (b) T1 fuzzy rules; and (c) IT2 fuzzy rules (Scenario 2).
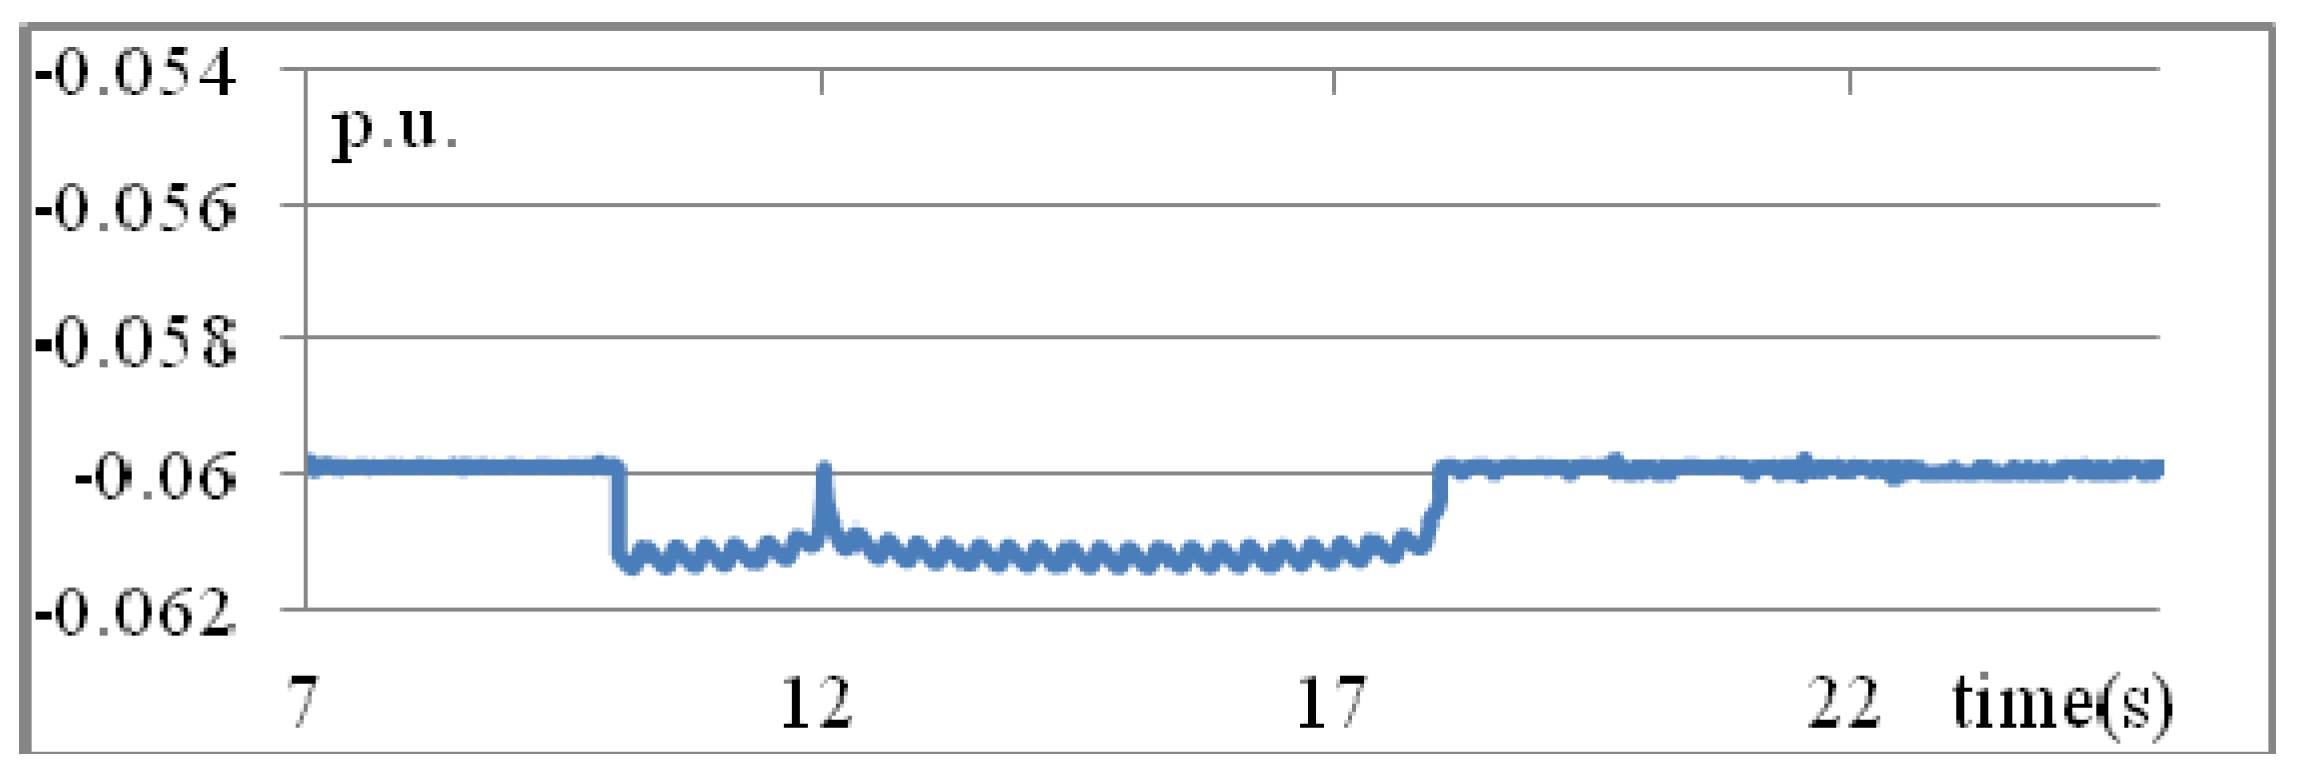
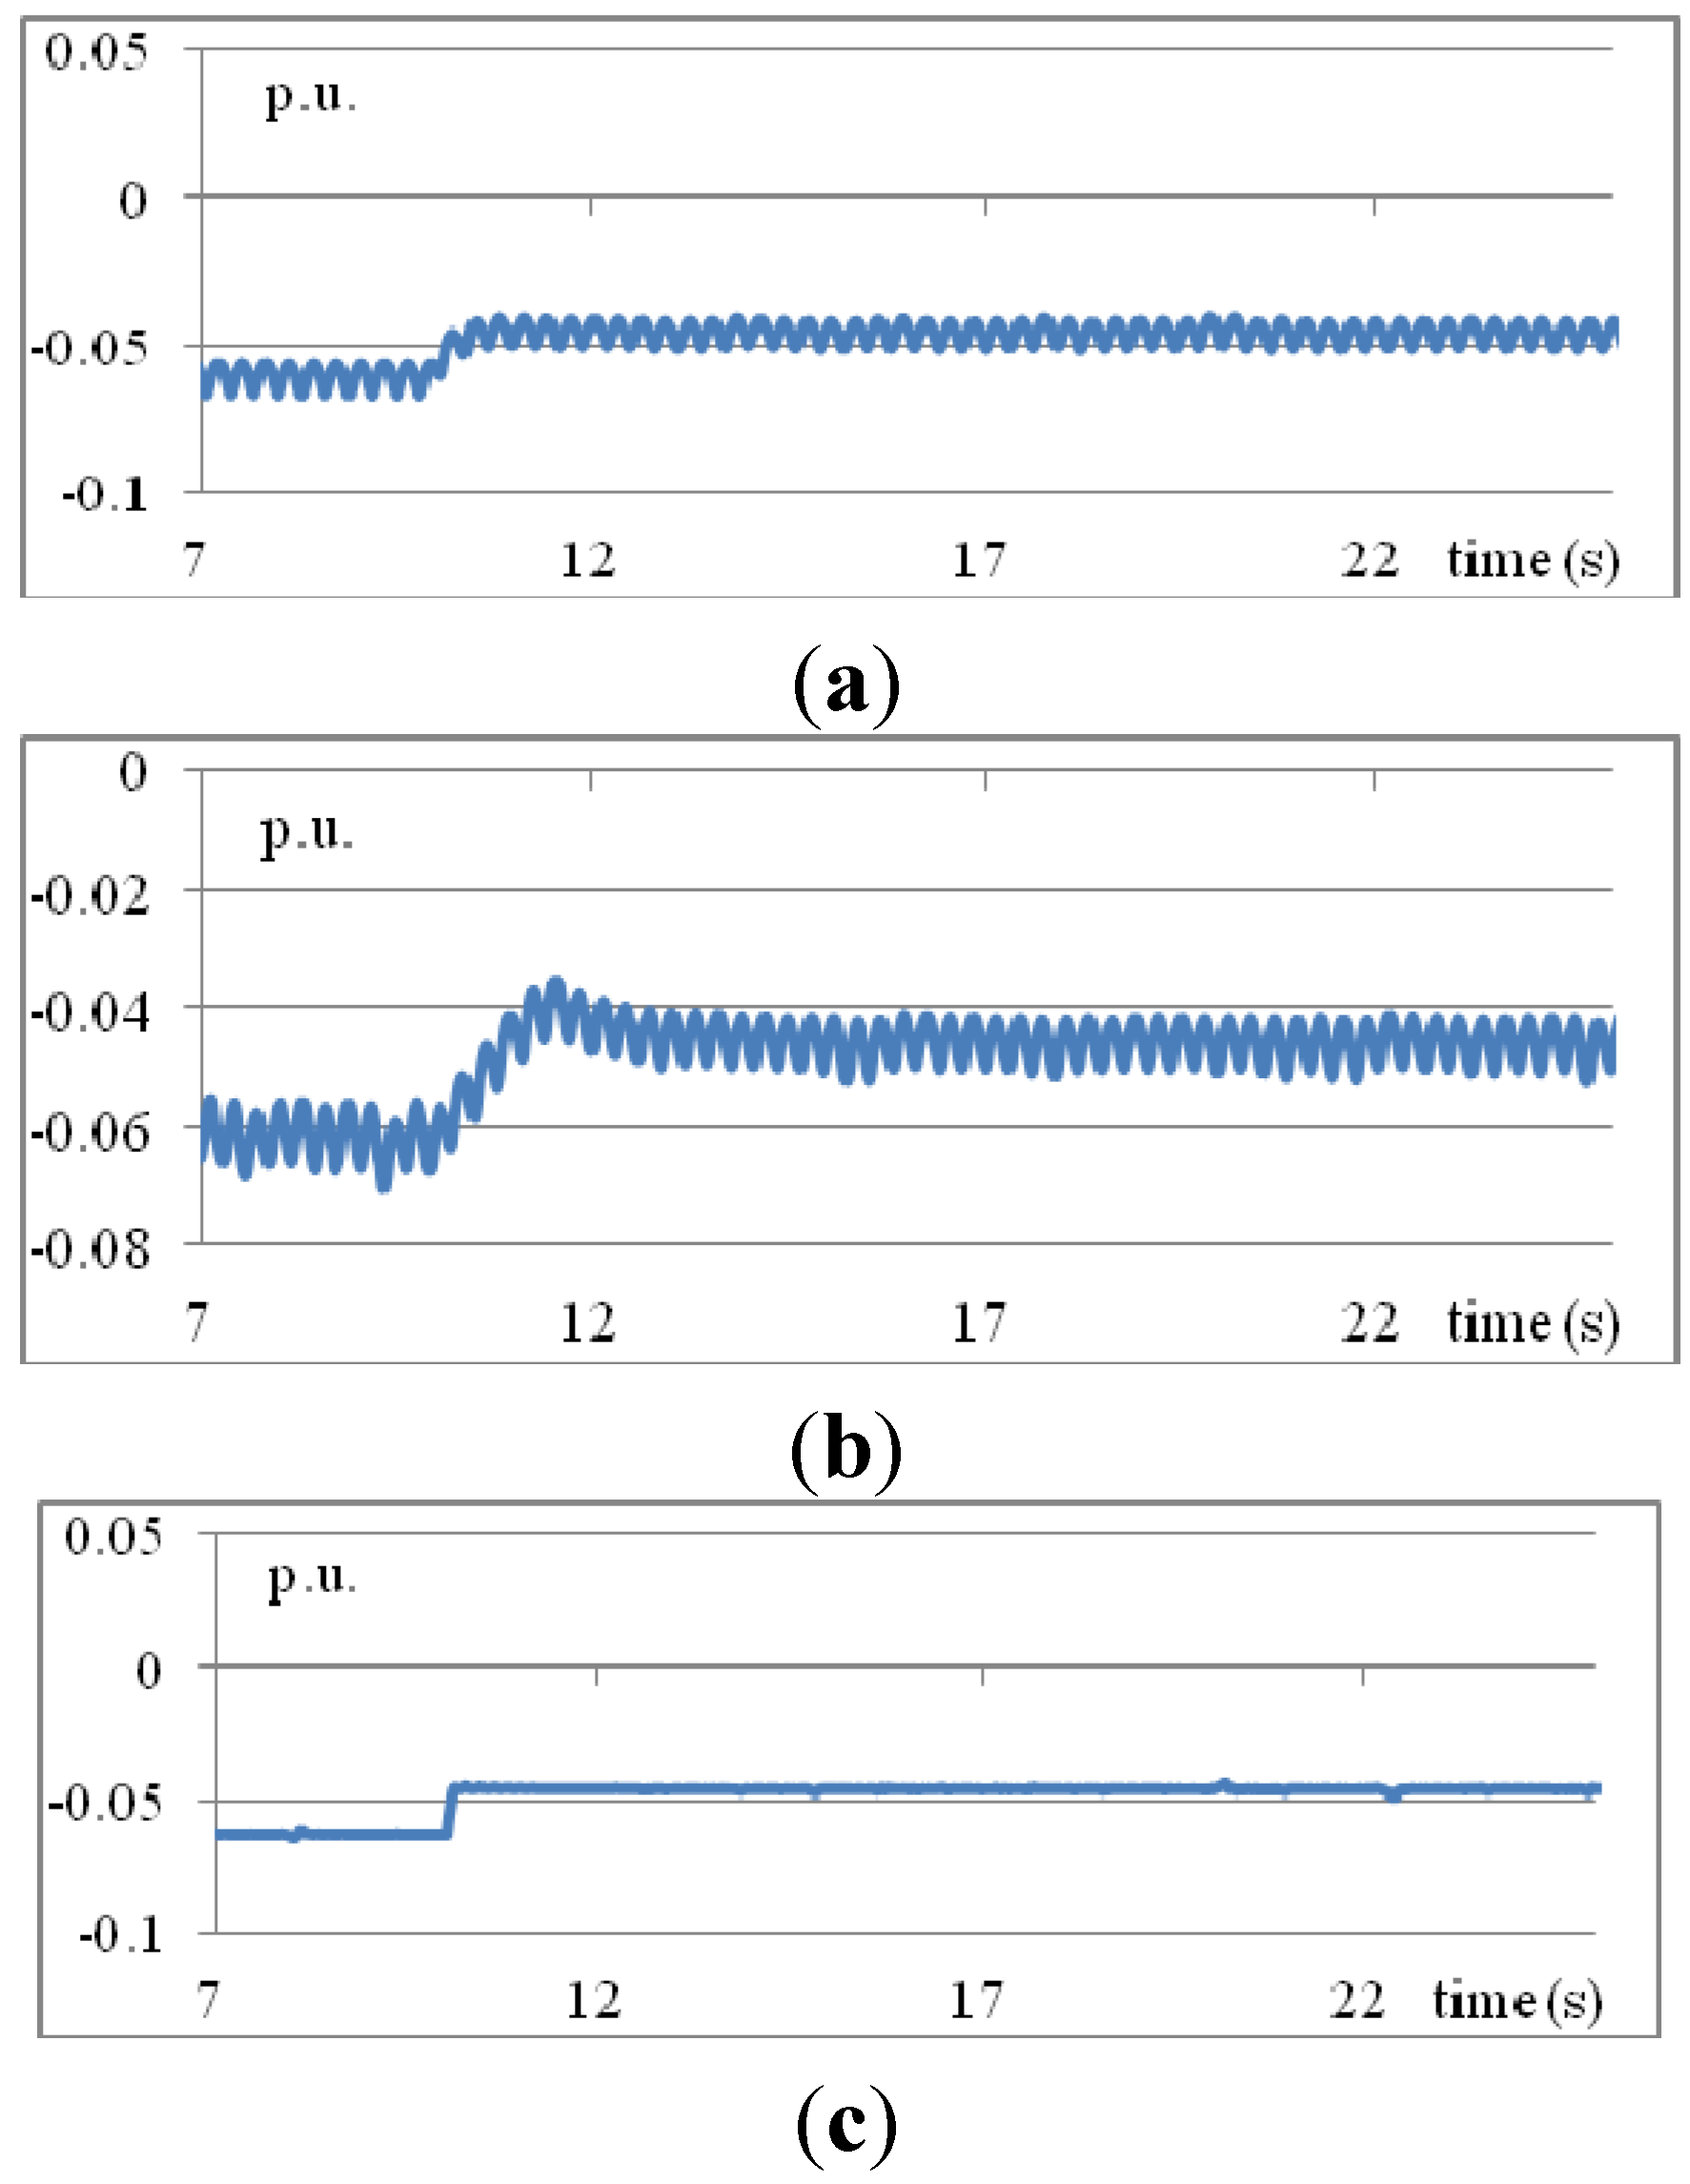
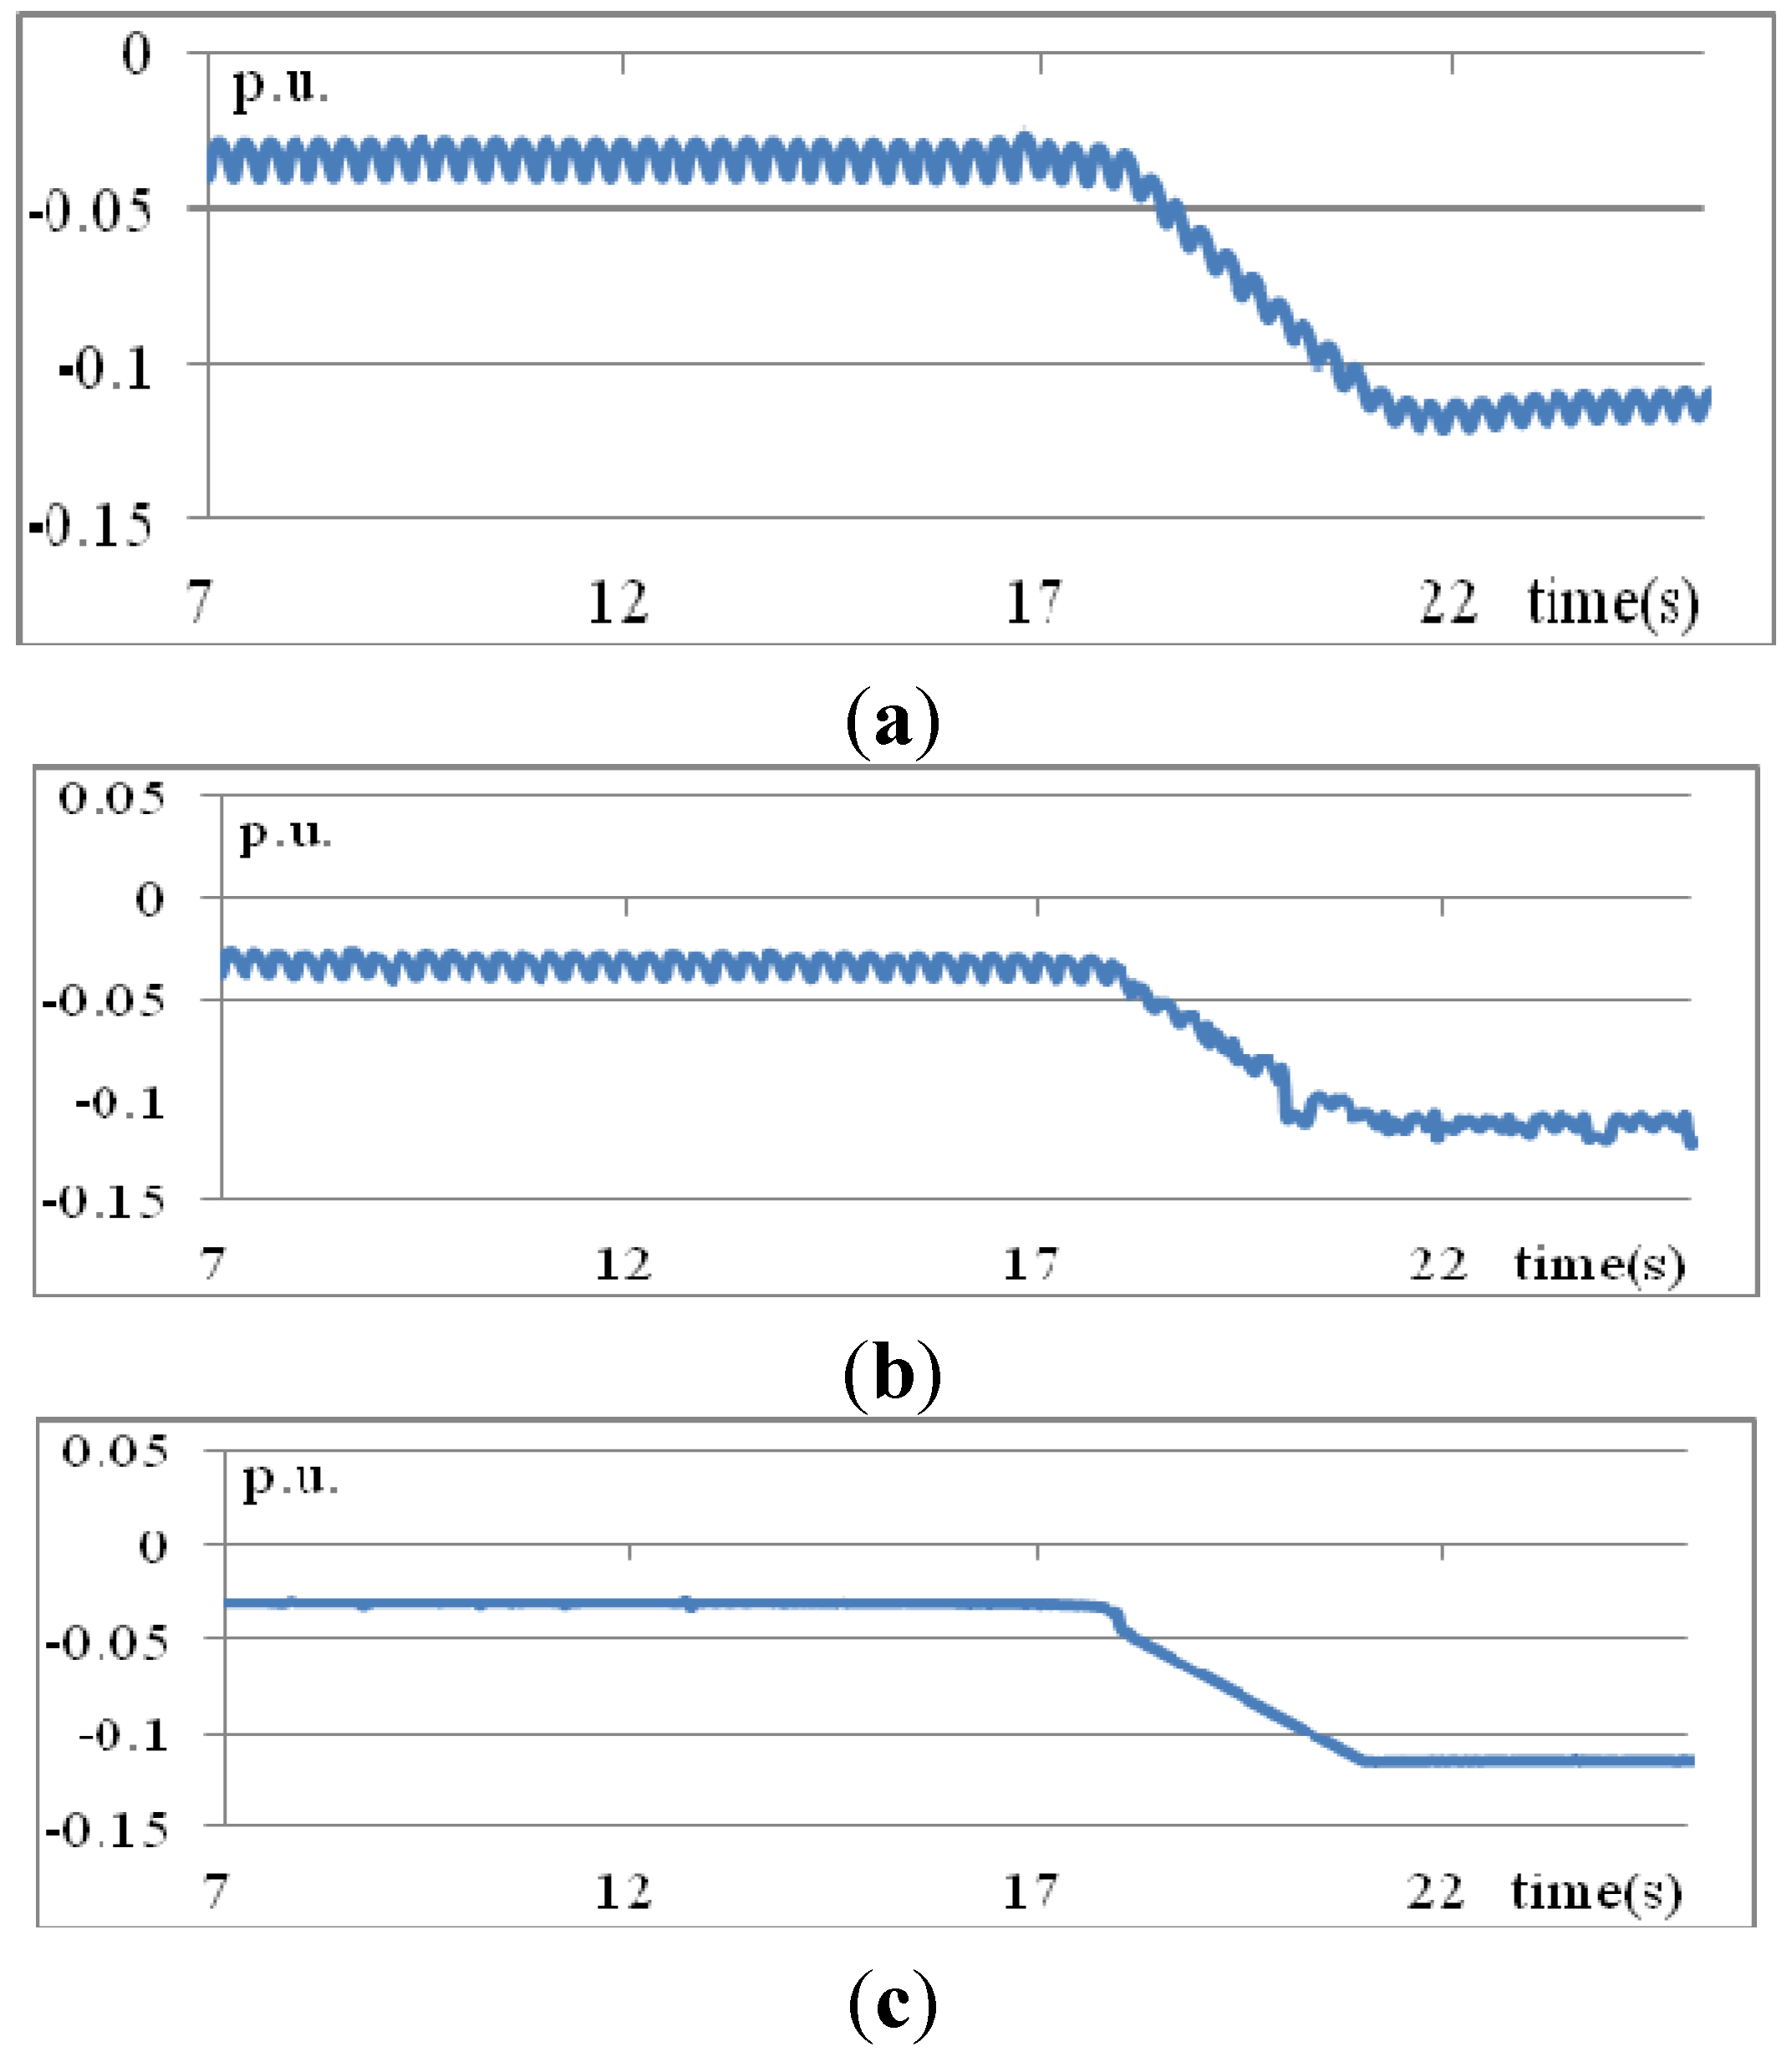
The MVAR injections from the STATCOM increase from 0.031 p.u. close to
t = 17 s to 0.114 p.u. near
t = 21 s, as shown in
Figure 11. Of the three methods, the proposed IT2 fuzzy rule- based method performs best.
Figure 11.
MVARs from STATCOM obtained using three methods: (a) traditional PID; (b) T1 fuzzy rules; and (c) IT2 fuzzy rules (Scenario 2).
Figure 11.
MVARs from STATCOM obtained using three methods: (a) traditional PID; (b) T1 fuzzy rules; and (c) IT2 fuzzy rules (Scenario 2).
4.3. Scenario 3: Varying Irradiations
Buses 2 and 3 have demands of 30 MW + j20 MVAR and 10 MW + j3 MVAR, respectively. The irradiation is 1000 W/m
2 at
t = 0 s. The irradiation increases to 1400 W/m
2 at
t = 10, and thereafter linearly changes to be 1000, 1400, and 1000 W/m
2 at
t = 12, 15 and 18 s, respectively, in the third scenario. The variations of MW generations from PV are shown in
Figure 12.
Figure 12.
Variations of MW generations from PV (Scenario 3).
Figure 12.
Variations of MW generations from PV (Scenario 3).
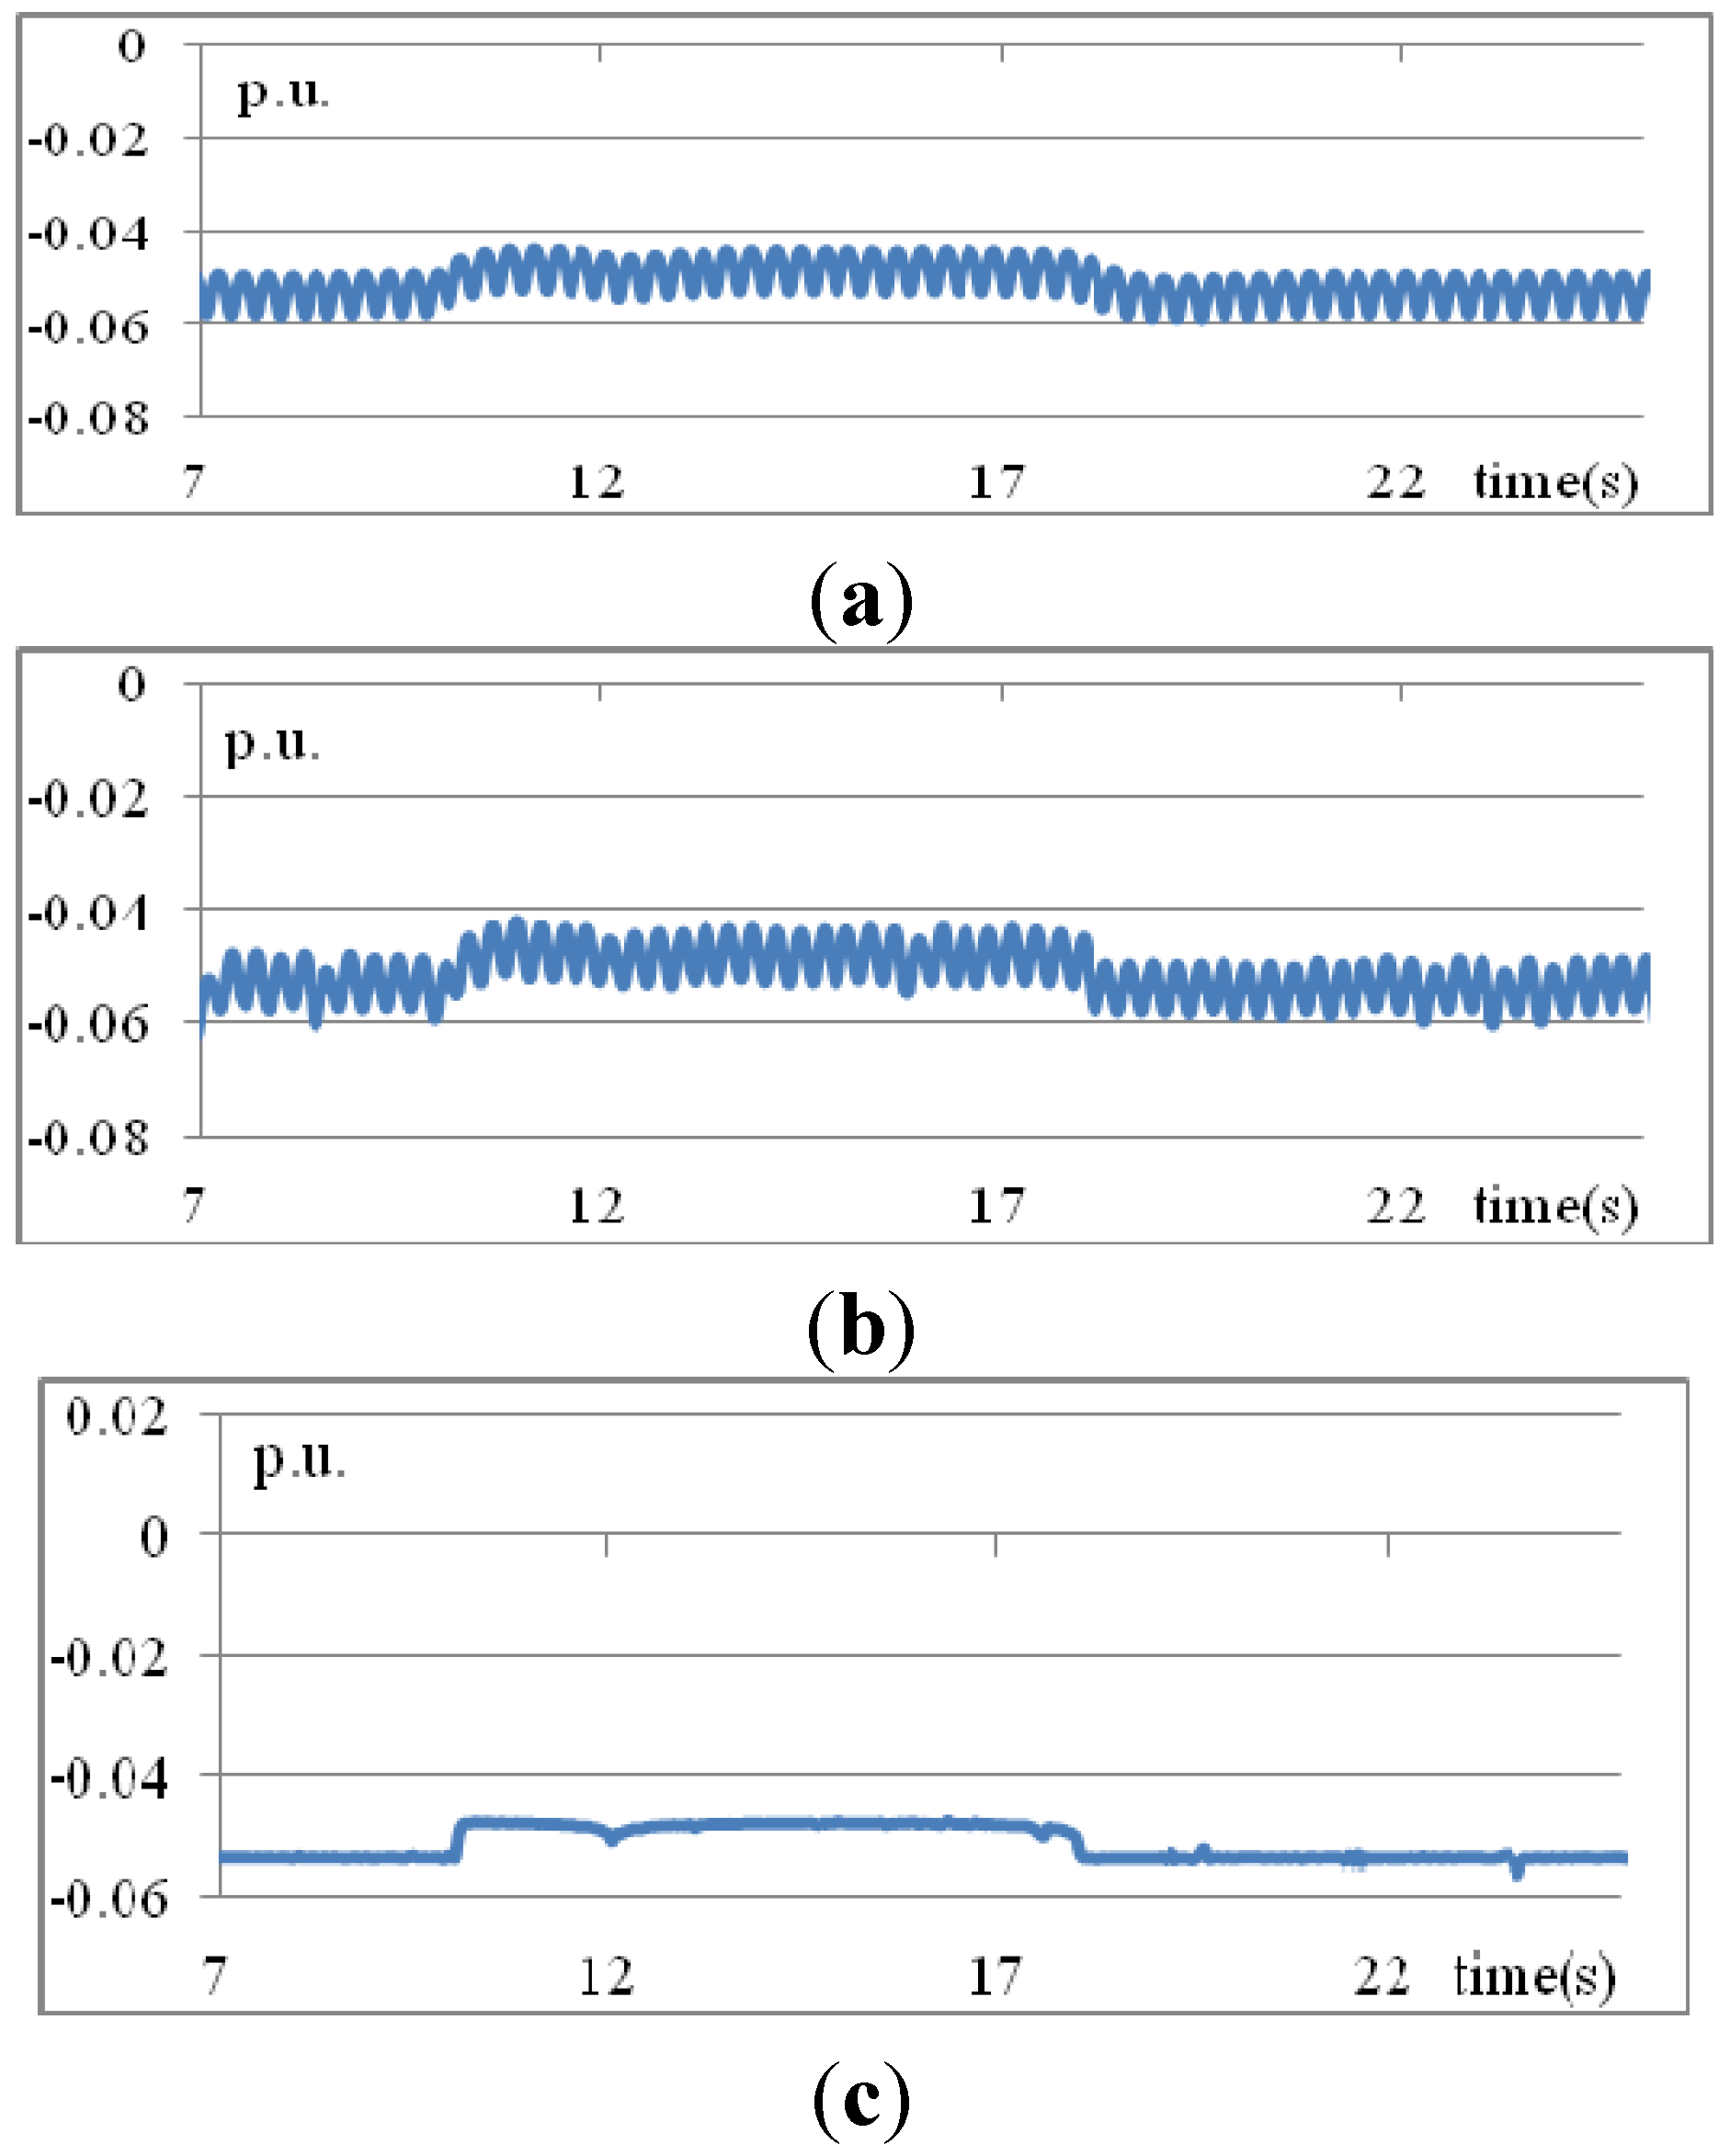
Figure 13 and
Figure 14 plot the controlled voltages and MVAR from the STATCOM, respectively. It can be found that the proposed IT2 fuzzy rule-based method always acquire the most stable performance than traditional PID and T1 fuzzy rule-based methods.
Figure 13.
Voltages at bus 3 using obtained three methods: (a) traditional PID; (b) T1 fuzzy rules; (c) IT2 fuzzy rules (Scenario 3).
Figure 13.
Voltages at bus 3 using obtained three methods: (a) traditional PID; (b) T1 fuzzy rules; (c) IT2 fuzzy rules (Scenario 3).
Figure 14.
MVARs from STATCOM obtained using three methods: (a) traditional PID; (b) T1 fuzzy rules; (c) IT2 fuzzy rules (Scenario 3).
Figure 14.
MVARs from STATCOM obtained using three methods: (a) traditional PID; (b) T1 fuzzy rules; (c) IT2 fuzzy rules (Scenario 3).
4.4. Unscheduled Photovoltaic Outage
In this scenario, an unscheduled PV outage occurs at
t = 10 s.
Figure 15 reveals that the voltage increases rapidly at
t = 10 s. The proposed method attains quickly-damped voltage variations. The dynamic voltage obtained by the T1 fuzzy rules is slowly damped from
t = 10 to 12 s and oscillates as
t approaches infinity. To reduce the voltage at
t = 10 s, the reactive power produced from the STATCOM must be reduced as shown in
Figure 16. The proposed IT2 fuzzy rule-based method outperforms both the traditional PID and T1 fuzzy rule-based methods.
Figure 15.
Voltages at bus 3 obtained using three methods: (a) traditional PID; (b) T1 fuzzy rules; (c) IT2 fuzzy rules (Scenario 4).
Figure 15.
Voltages at bus 3 obtained using three methods: (a) traditional PID; (b) T1 fuzzy rules; (c) IT2 fuzzy rules (Scenario 4).
Figure 16.
MVARs from STATCOM obtained using three methods: (a) traditional PID; (b) T1 fuzzy rules; and (c) IT2 fuzzy rules (Scenario 4).
Figure 16.
MVARs from STATCOM obtained using three methods: (a) traditional PID; (b) T1 fuzzy rules; and (c) IT2 fuzzy rules (Scenario 4).


