
Fluidized-Bed Gasification of Plastic Waste, Wood, and Their Blends with Coal

Abstract
:1. Introduction
2. Experimental Apparatus and Procedure
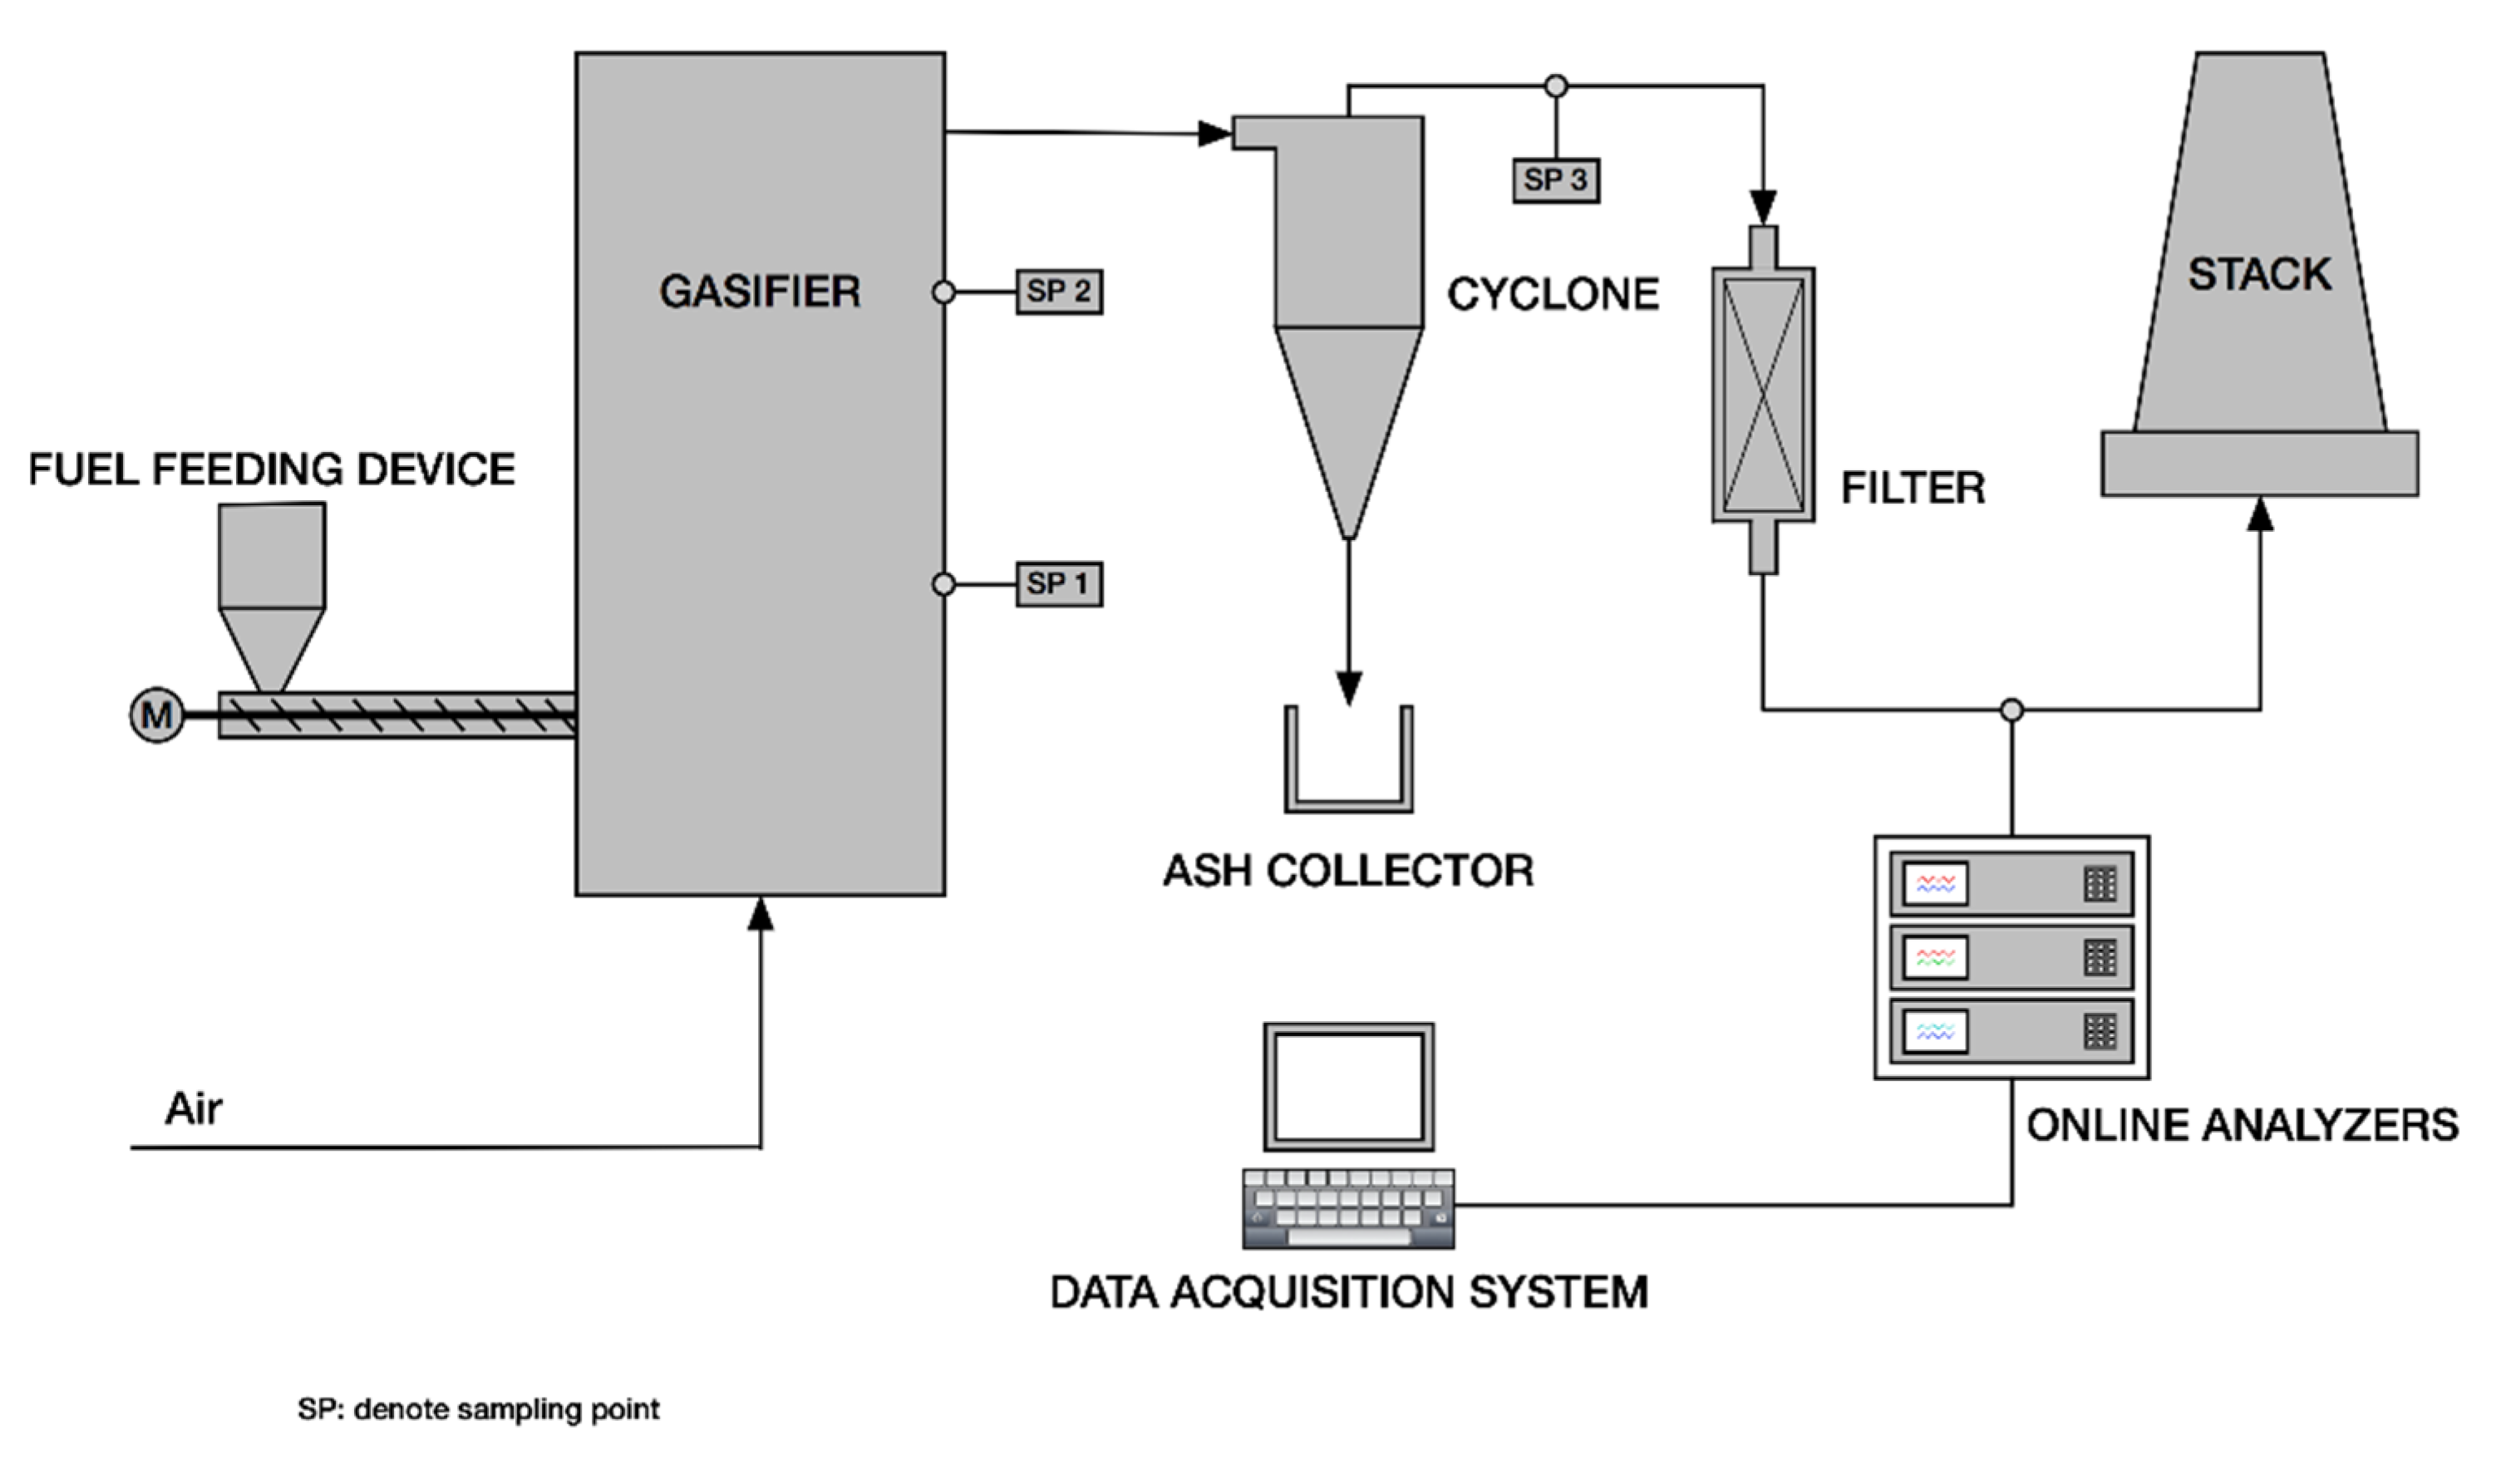
2.1. Experimental Apparatus
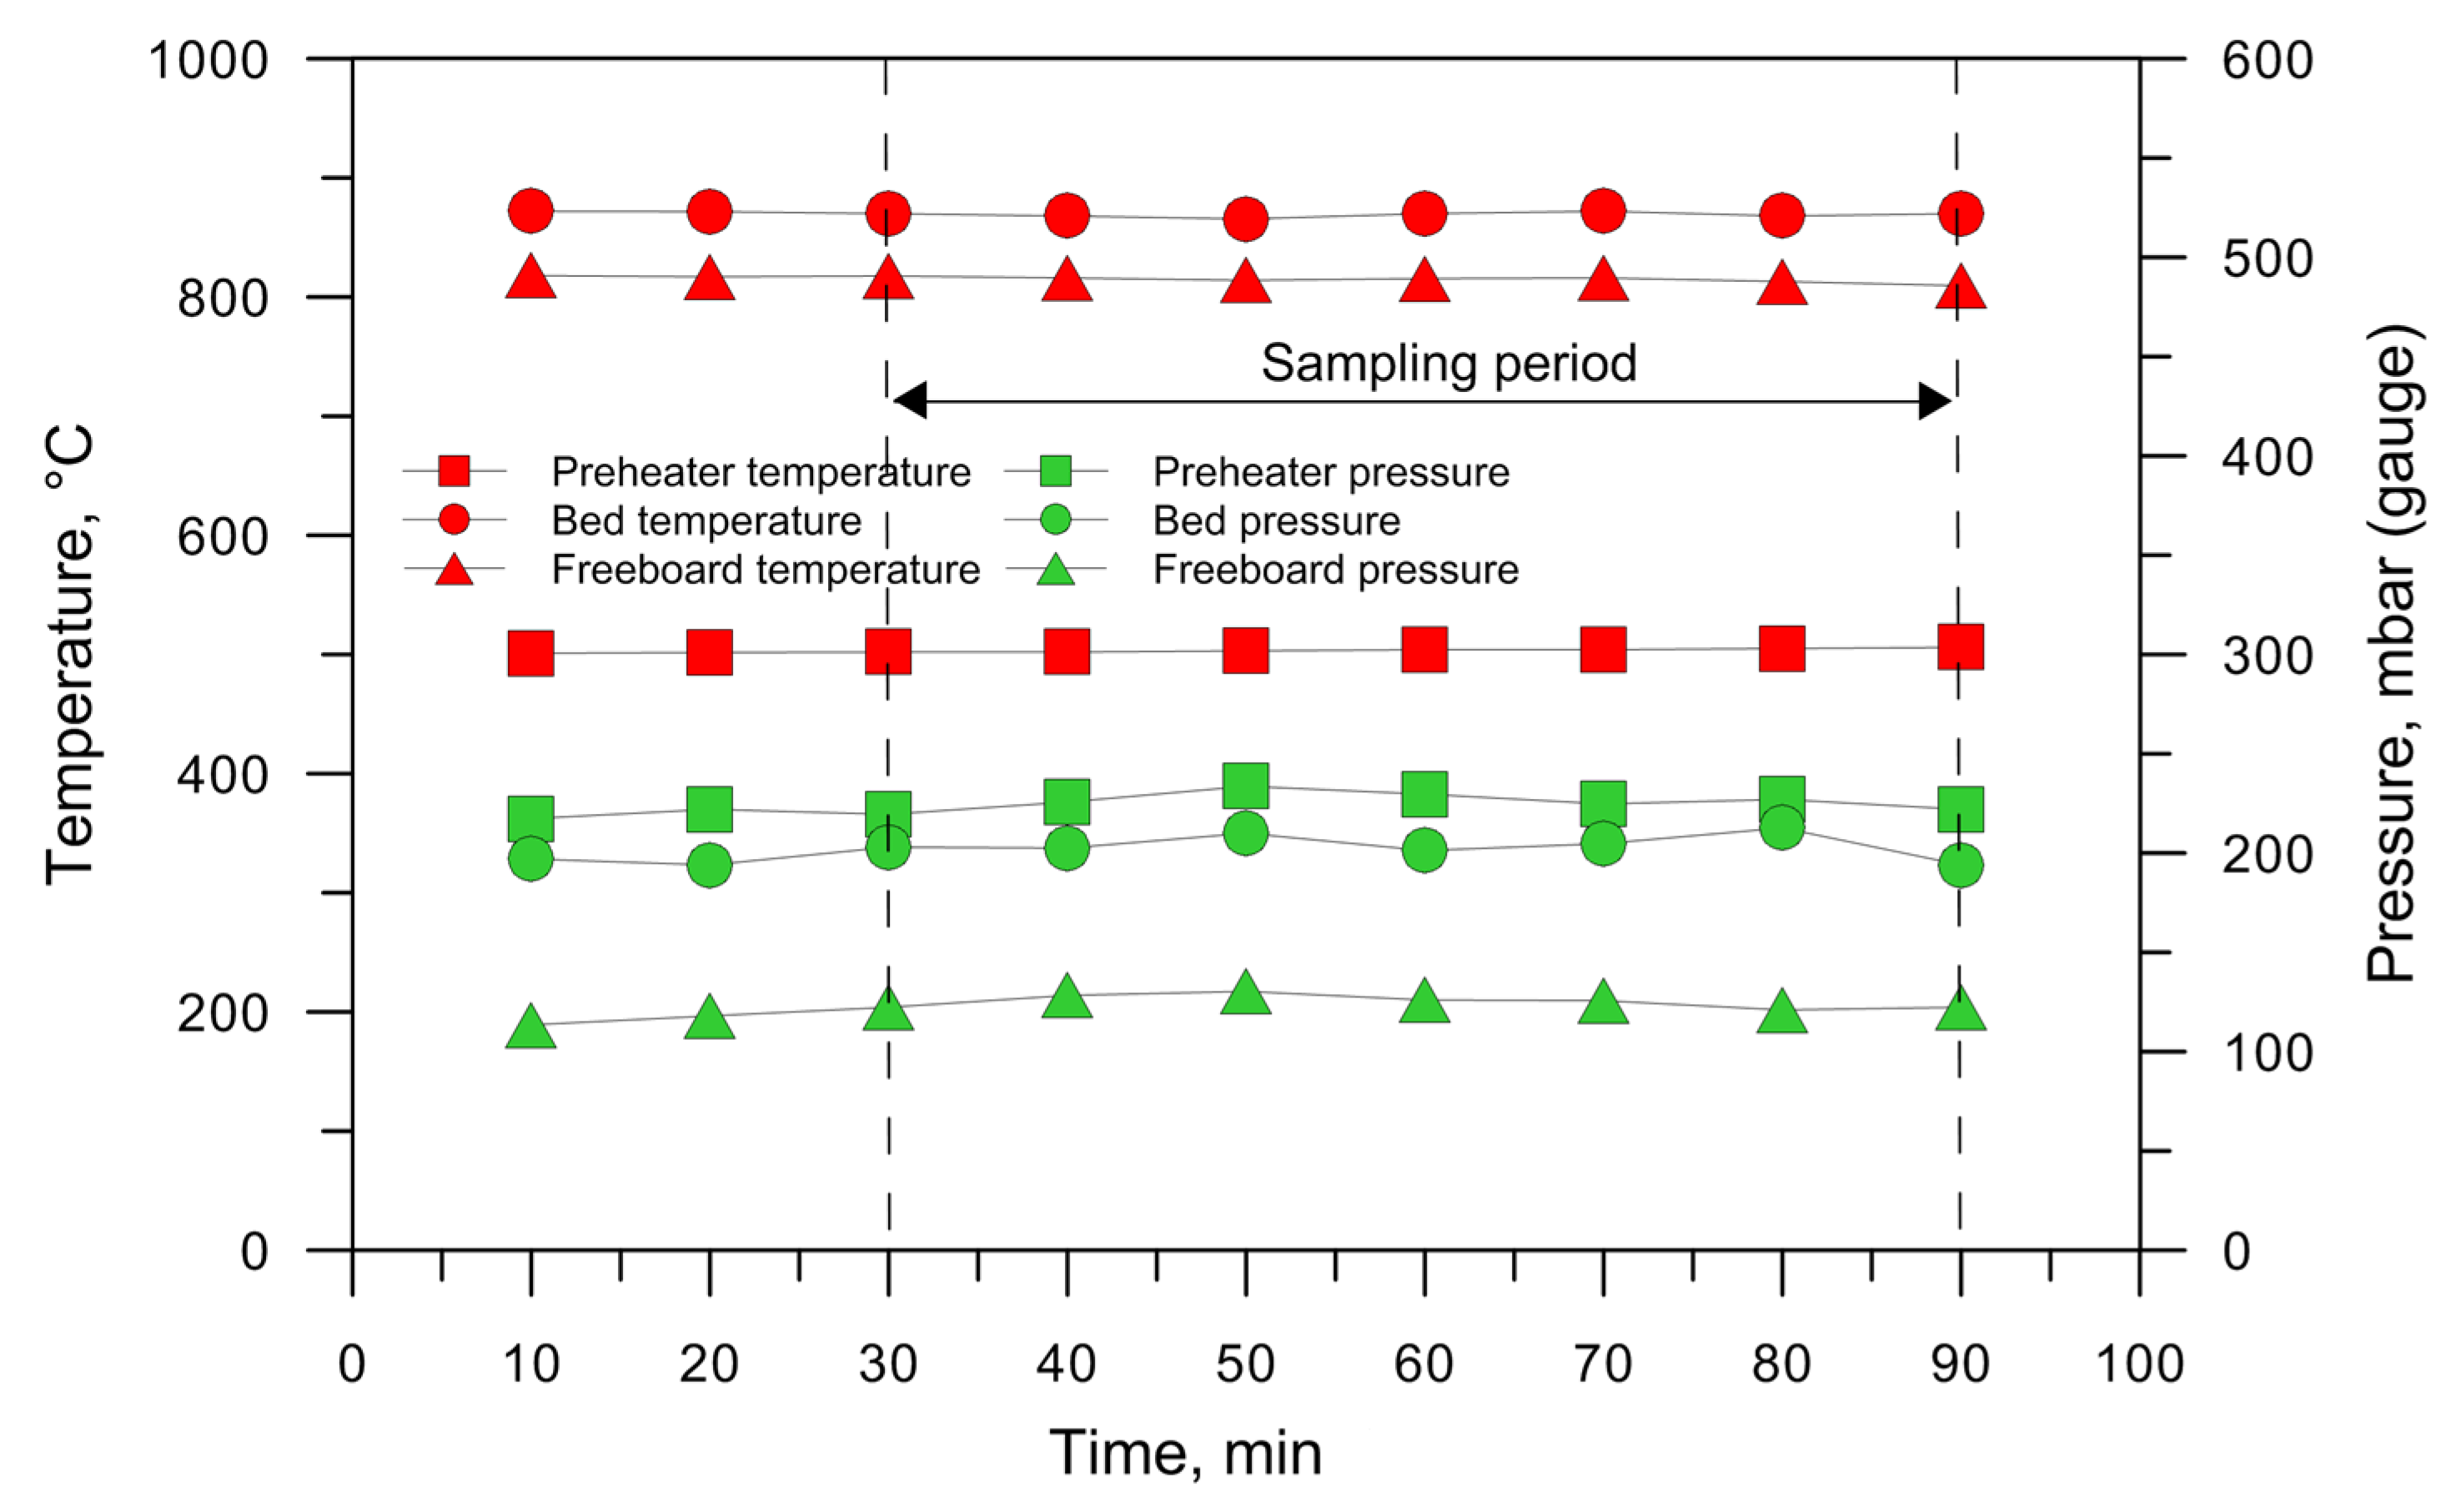
2.2. Operating Conditions

| Fuel | Bed Material | Ug (m/s) | WAir (kg/h) | WFuel (kg/h) | A/F (kgAir/kgFuel) | ER |
|---|---|---|---|---|---|---|
| RP | Silica sand | 0.42 | 3.42 | 1.08 | 3.17 | 0.24 |
| WRP | Silica sand | 0.42 | 3.42 | 1.14 | 2.99 | 0.25 |
| WRPC | Silica sand | 0.42 | 3.43 | 1.56 | 2.20 | 0.25 |
| WC | Silica sand | 0.41 | 3.44 | 2.09 | 1.65 | 0.25 |
| WD | Silica sand | 0.42 | 3.42 | 2.46 | 1.39 | 0.25 |
2.3. Analytical Equipment
2.4. Feedstock
| Items | RP | WRP | WRPC | WC | WD |
|---|---|---|---|---|---|
| Plastic waste, %wb | 100 | 80 | 30 | – | – |
| Wood, %wb | – | 20 | 20 | 40 | 100 |
| Coal, %wb | – | – | 50 | 60 | – |
| Size (diameter and length), mm | Irregular | 6, 20 | 6, 20 | 6, 20 | 6, 20 |
| Bulk density, kg/m3 | 590 | 580 | 615 | 620 | 570 |
| Items | RP | WRP | WRPC | WC | WD |
|---|---|---|---|---|---|
| Proximate analysis, %wb, ar | |||||
| Volatile matter | 94.50 | 92.64 | 68.92 | 59.53 | 86.74 |
| Fixed carbon | 2.89 | 3.42 | 19.14 | 20.82 | 3.12 |
| Moisture | 0.67 | 2.11 | 4.11 | 9.42 | 9.93 |
| Ash | 1.94 | 1.83 | 7.83 | 10.23 | 0.21 |
| Ultimate analysis, %wb, ar | |||||
| C | 79.54 | 73.20 | 62.28 | 51.93 | 45.31 |
| H | 13.06 | 11.15 | 8.11 | 5.44 | 5.59 |
| N | 0.18 | 0.30 | 0.19 | 0.22 | 0.26 |
| S | 0.08 | 0.10 | 0.13 | 0.16 | <0.01 |
| O (by difference) | 4.53 | 11.31 | 17.35 | 22.60 | 38.70 |
| Heating value, MJ/kgFuel | |||||
| HHV adb | 42.69 | 37.45 | 29.35 | 22.00 | 18.40 |
| LHV bar | 36.95 | 32.57 | 25.73 | 19.41 | 15.73 |
3. Results and Discussion
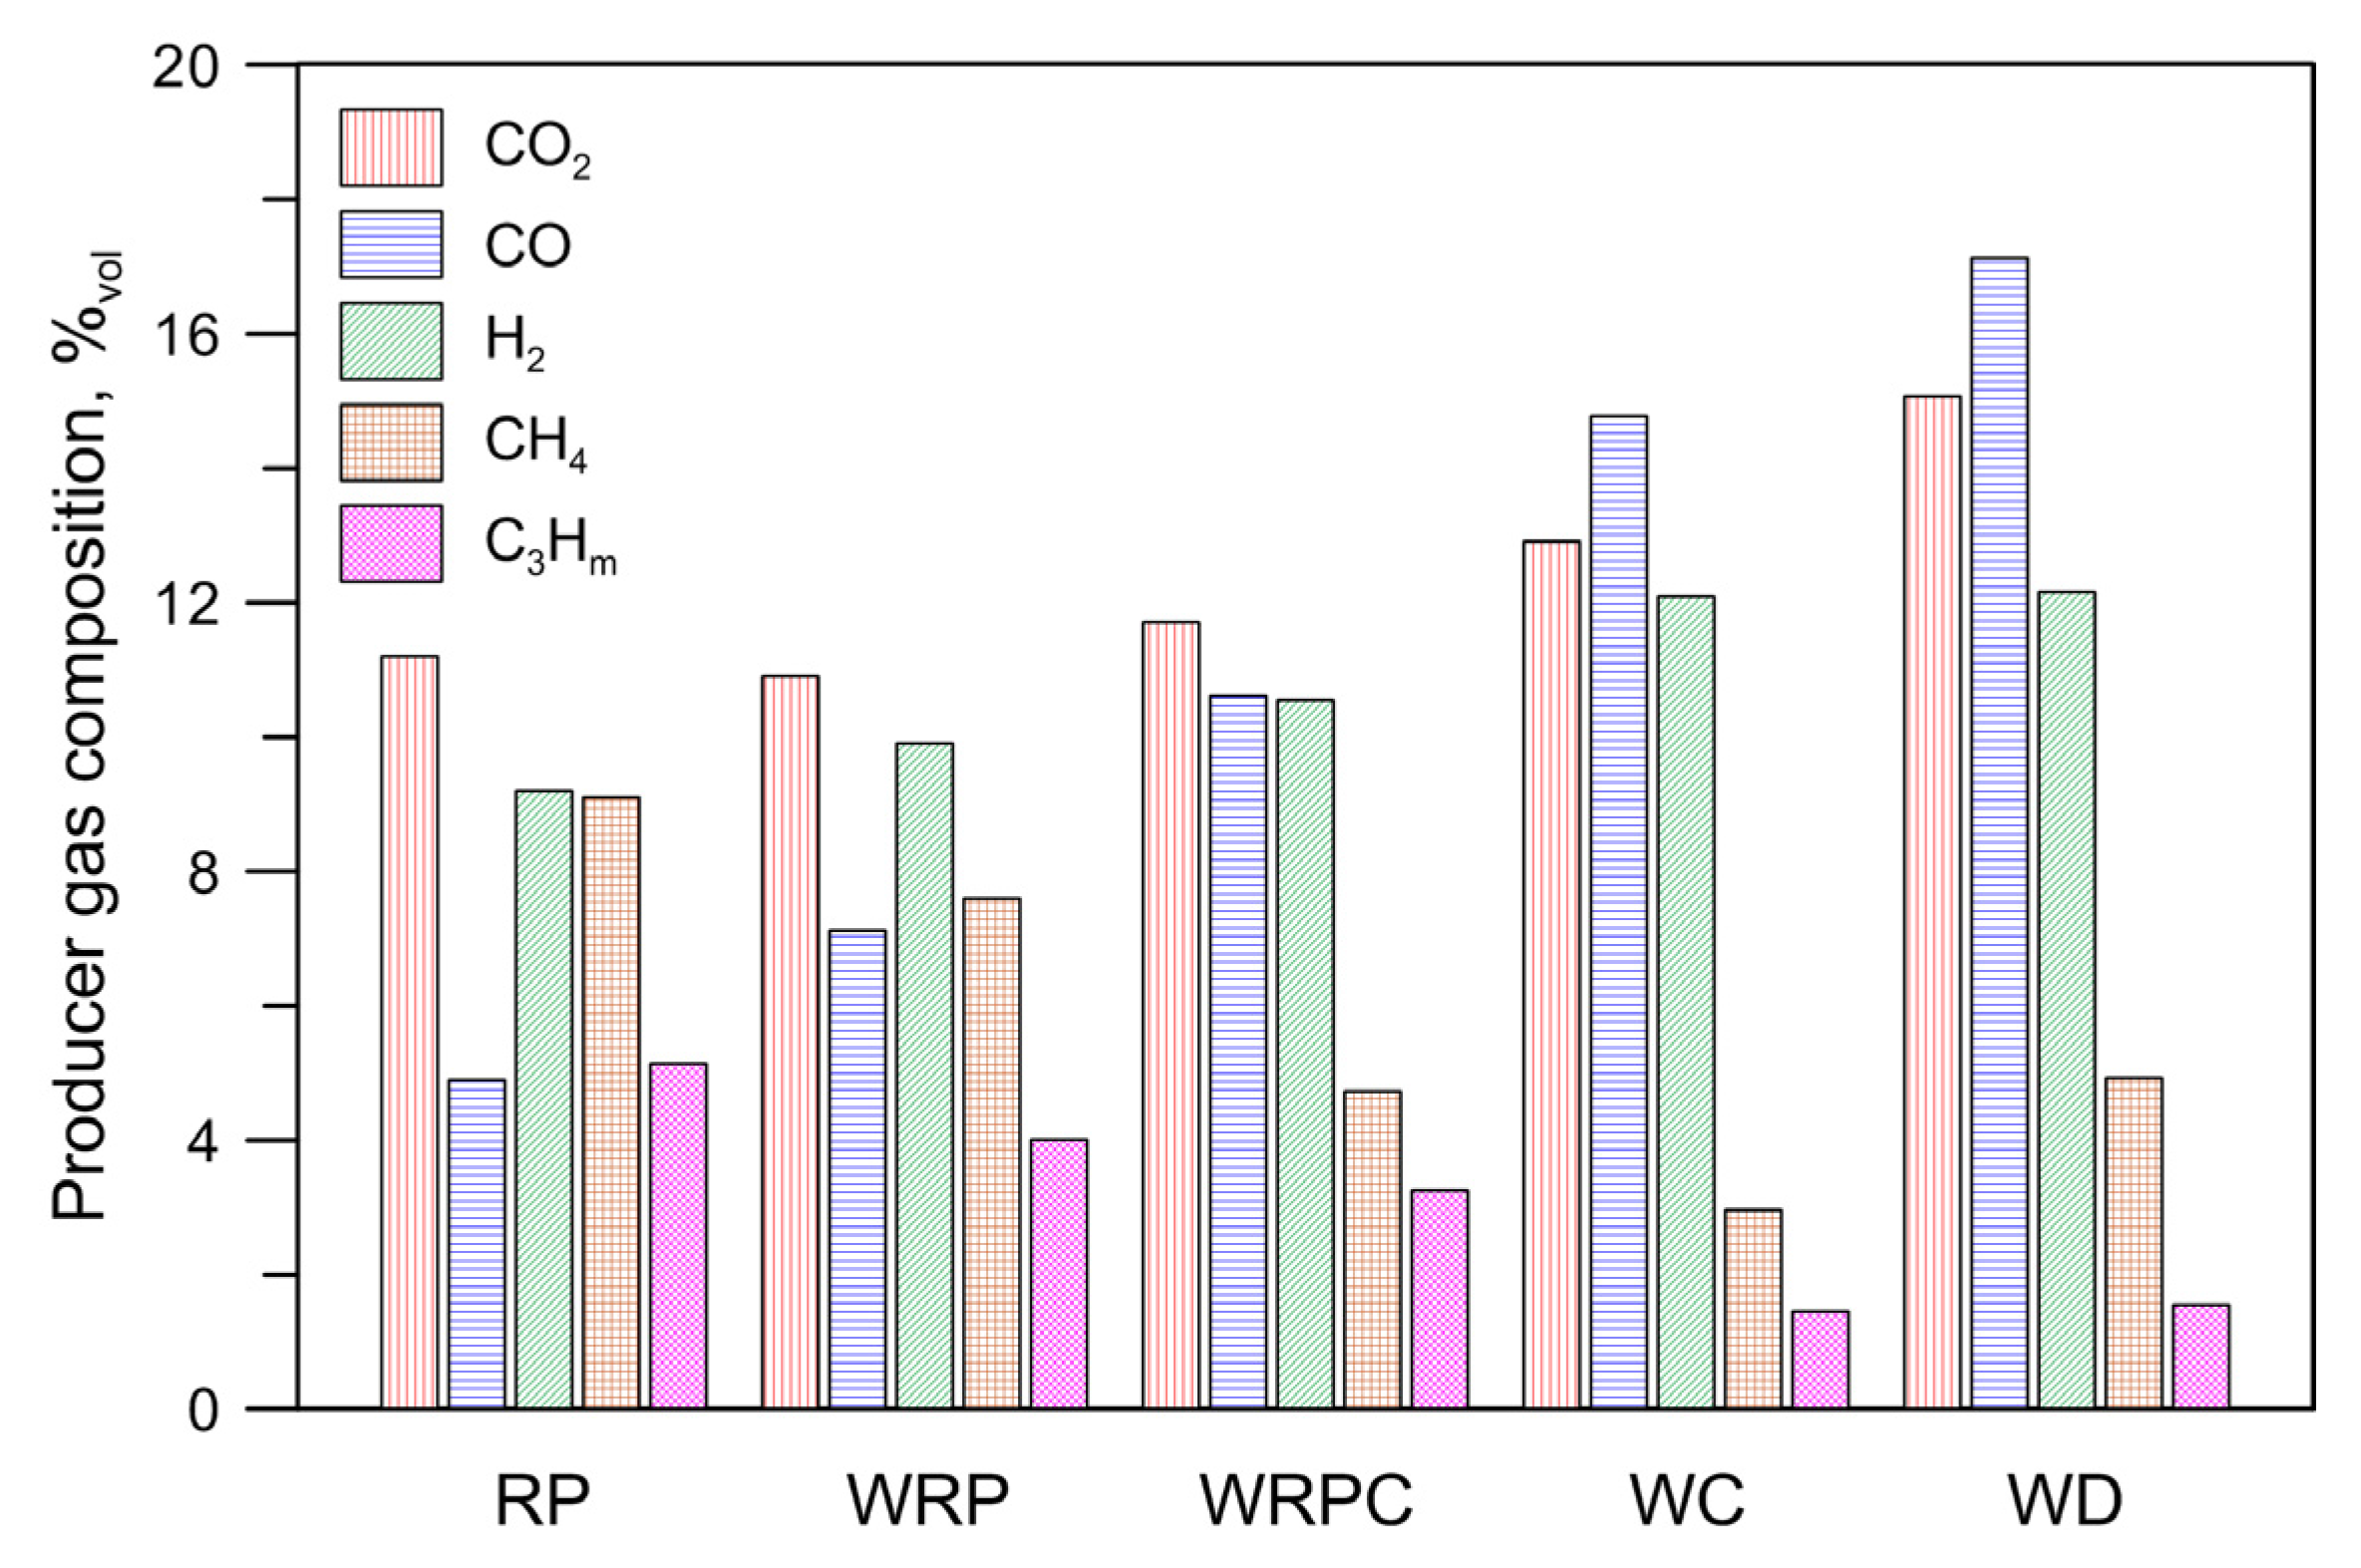
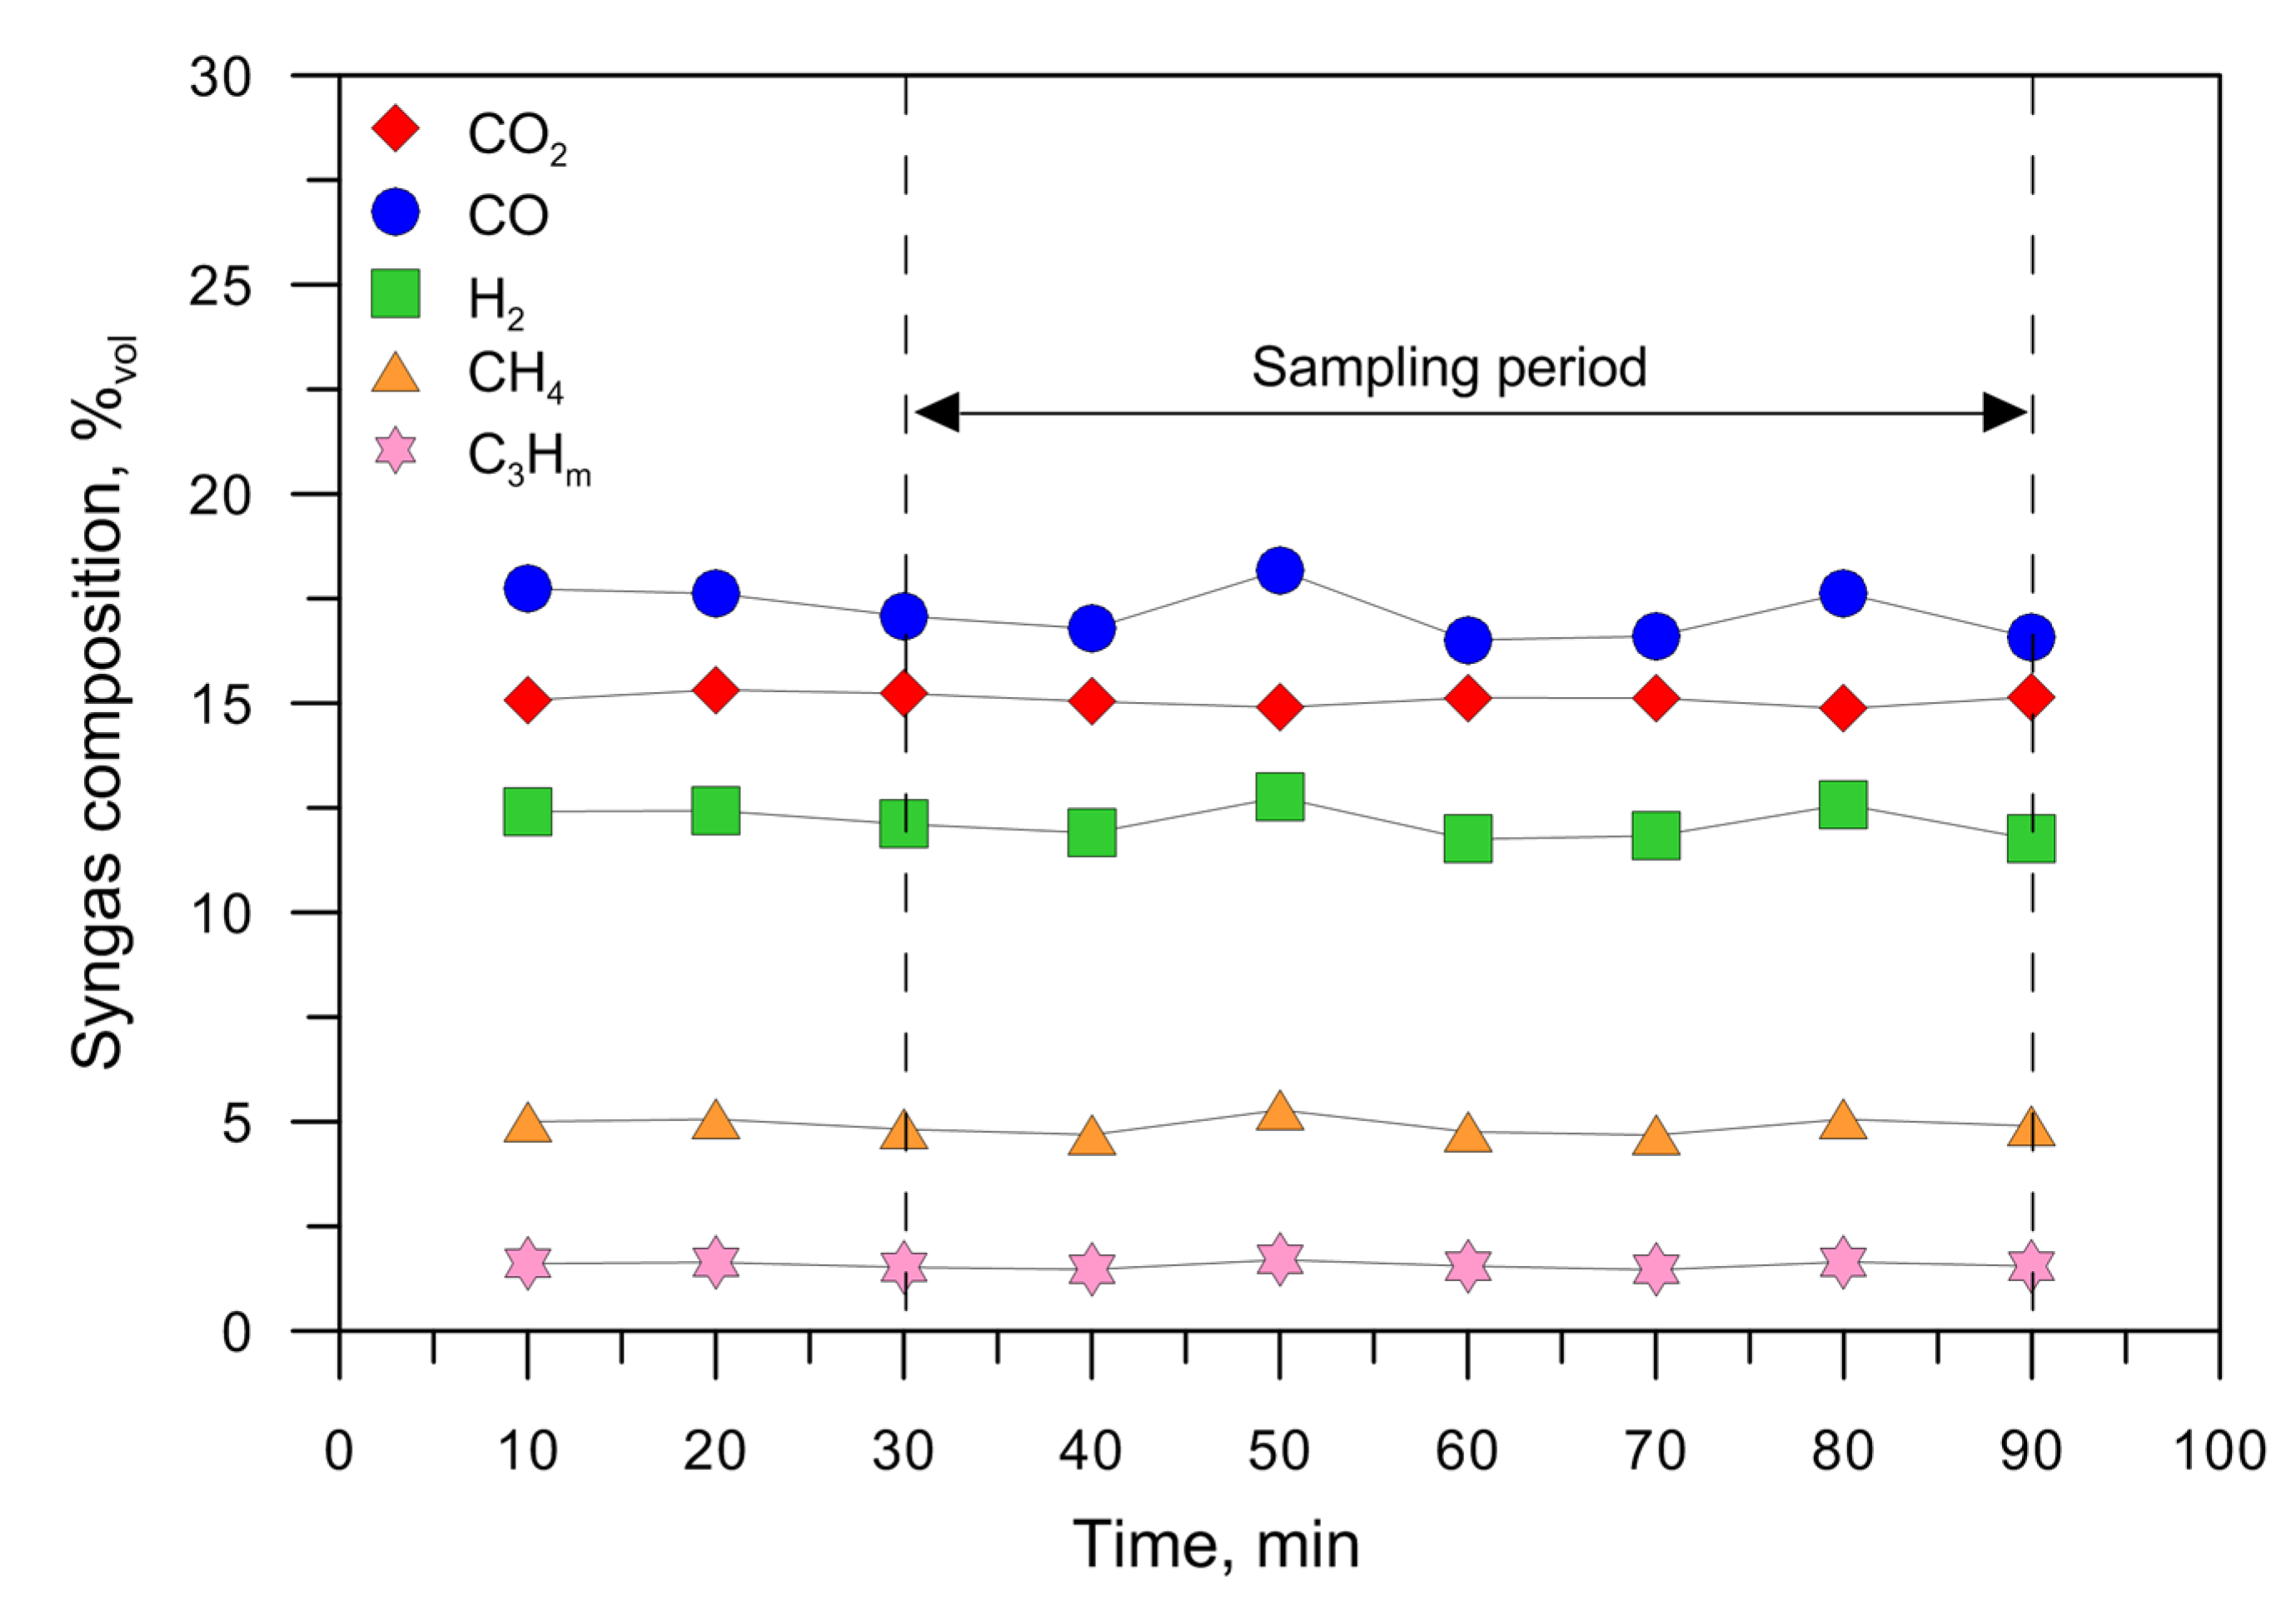
3.1. Producer Gas


| Fuel | T °C | CO2 %Vol | CO %Vol | H2 %Vol | CH4%Vol | C3Hm%Vol | QPG Nm3/h | CEF g/Nm3 | CTar g/Nm3 | LHVPG MJ/Nm3 | SE MJ/kgFuel | HRE | CCE | CGE |
|---|---|---|---|---|---|---|---|---|---|---|---|---|---|---|
| RP | 877 | 11.20 | 4.90 | 9.20 | 9.10 | 5.14 | 3.79 | 0.29 | 46.06 | 7.90 | 27.77 | 0.91 ± 0.03 | 0.84 ± 0.11 | 0.75 ± 0.04 |
| WRP | 872 | 10.90 | 7.12 | 9.91 | 7.60 | 4.01 | 3.86 | 0.67 | 34.24 | 7.06 | 23.84 | 0.90 ± 0.19 | 0.83 ± 0.22 | 0.73 ± 0.15 |
| WRPC | 868 | 11.71 | 10.62 | 10.55 | 4.73 | 3.25 | 4.20 | 10.31 | 41.38 | 6.09 | 16.40 | 0.79 ± 0.23 | 0.78 ± 0.17 | 0.64 ± 0.18 |
| WC | 862 | 12.91 | 14.77 | 12.09 | 2.96 | 1.45 | 4.22 | 43.26 | 71.20 | 5.09 | 10.29 | 0.70 ± 0.22 | 0.70 ± 0.14 | 0.53 ± 0.16 |
| WD | 870 | 15.07 | 17.13 | 12.16 | 4.93 | 1.55 | 4.80 | 15.94 | 6.86 | 6.15 | 12.03 | 0.79 ± 0.10 | 0.93 ± 0.10 | 0.76 ± 0.10 |
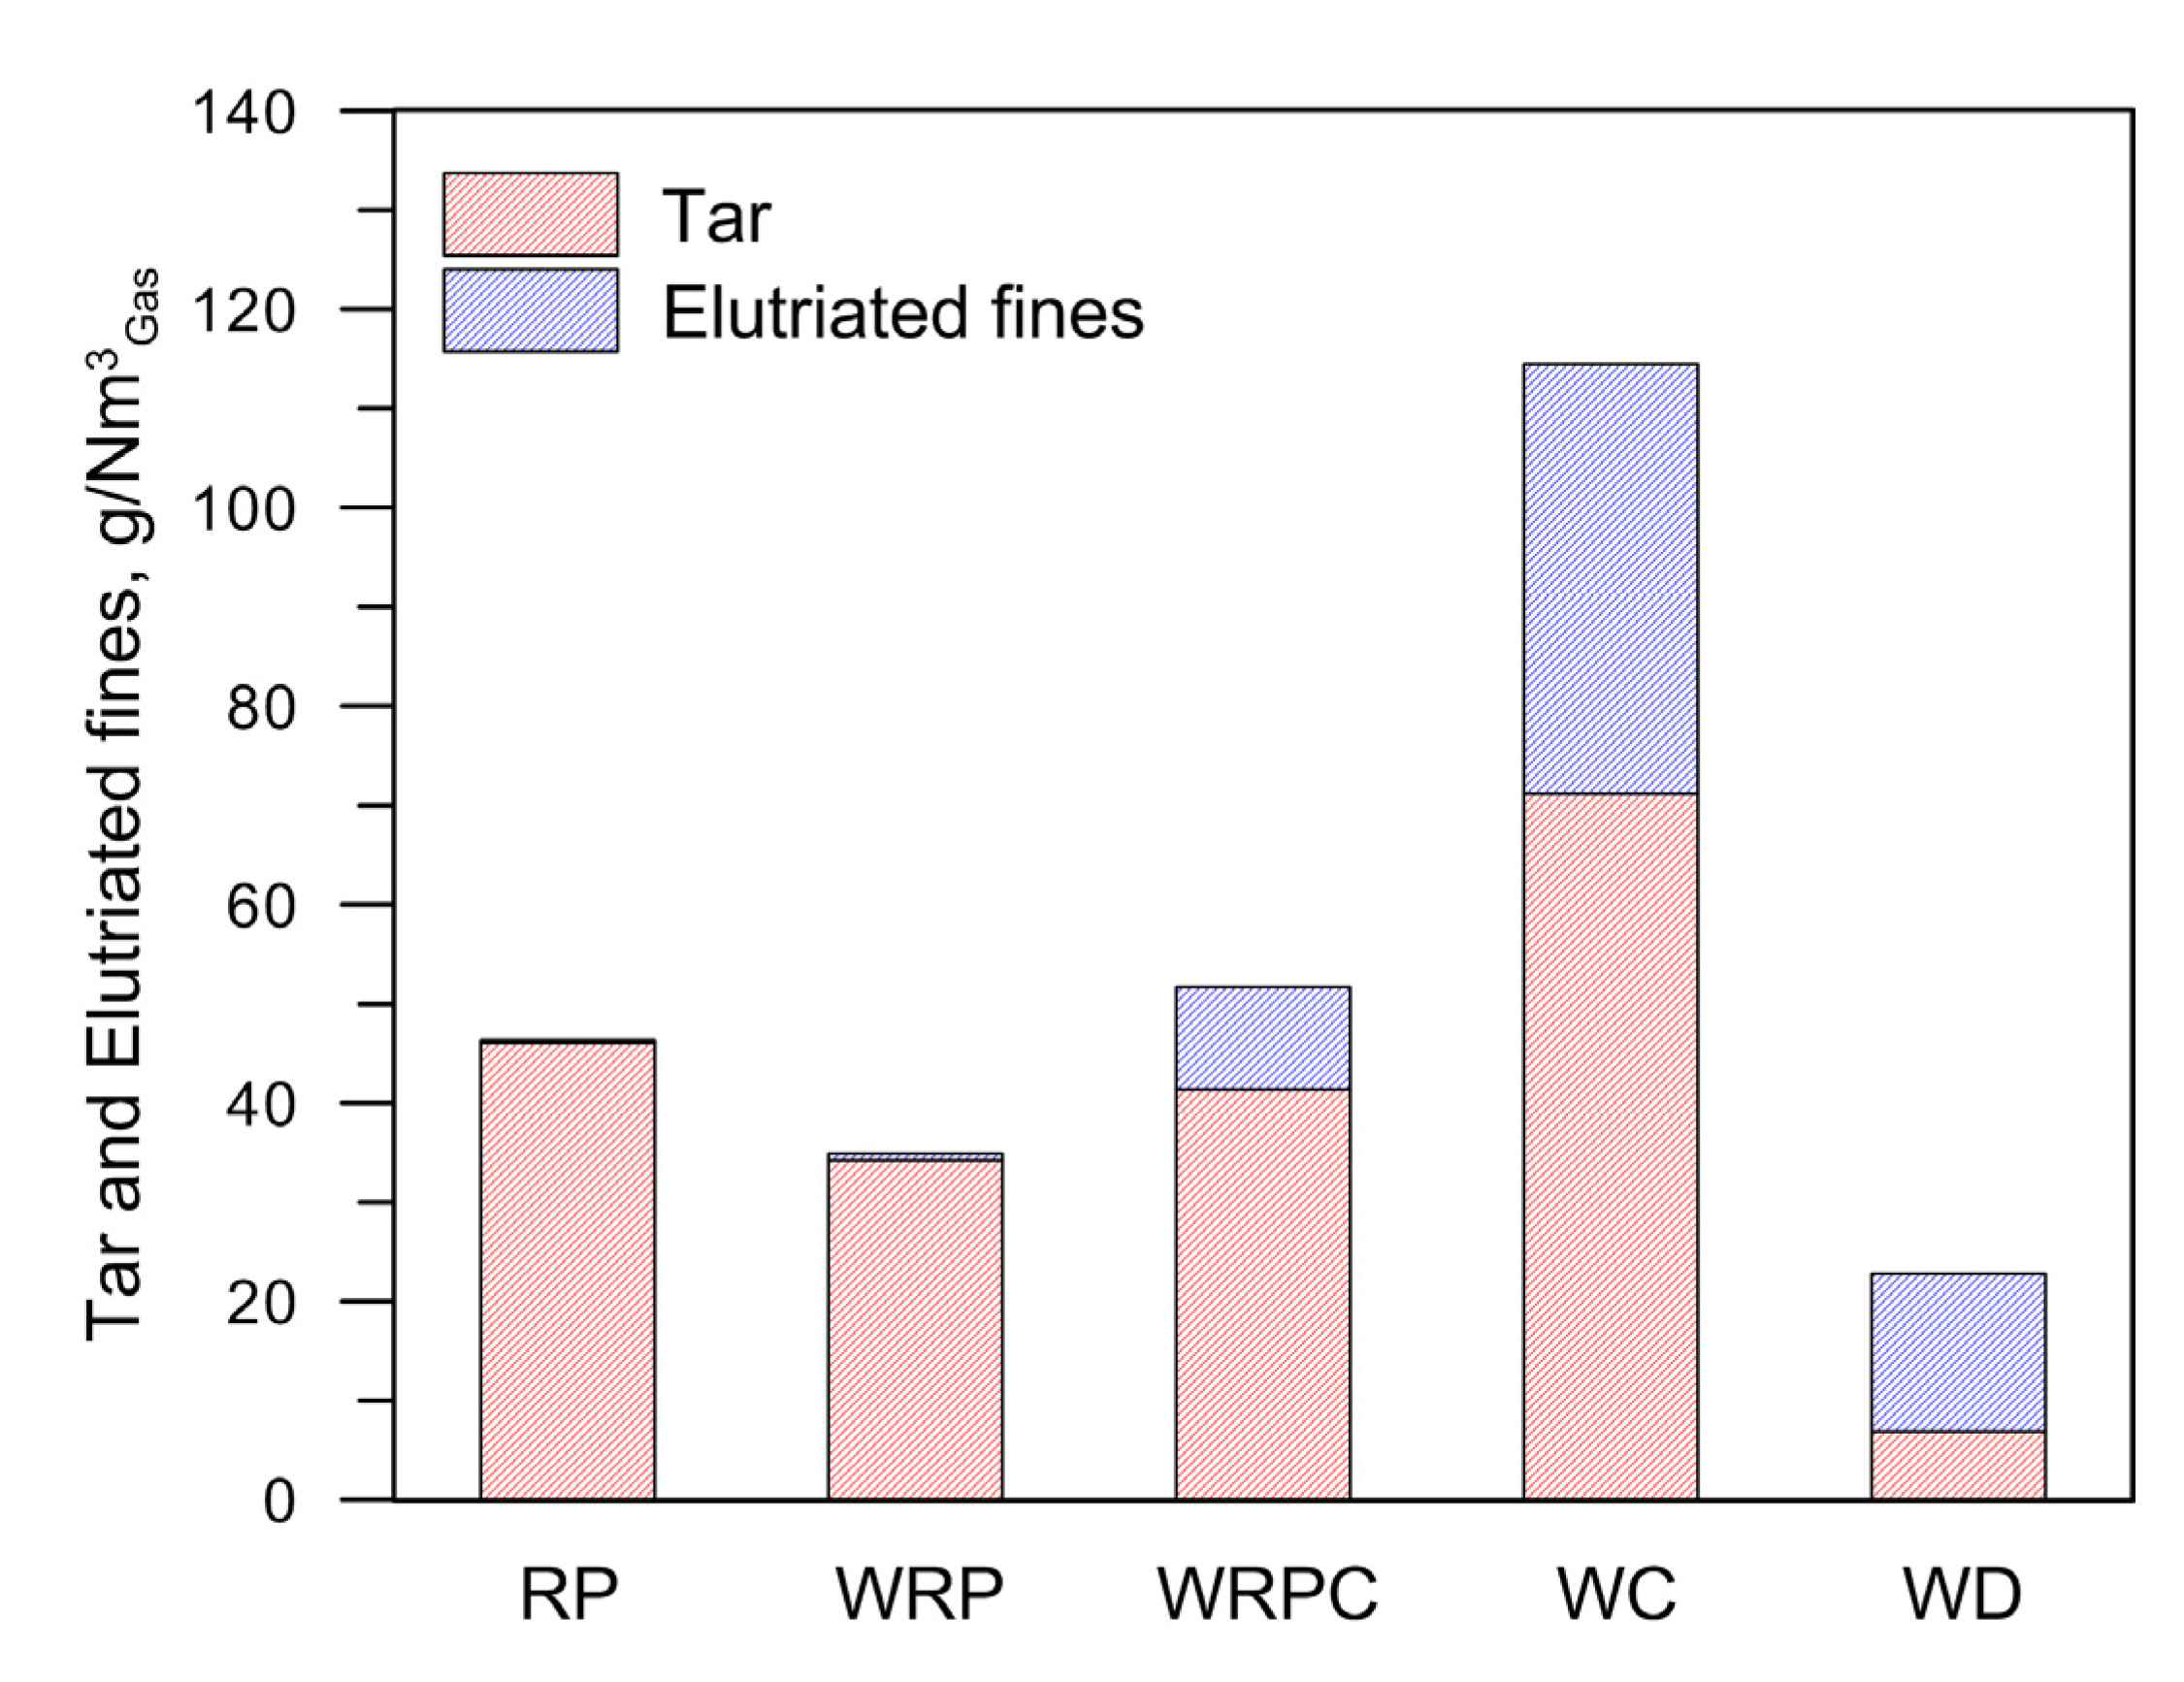
3.2. Mass Balance
| Fuels | Ultimate Analysis, %wb | |||||||||
|---|---|---|---|---|---|---|---|---|---|---|
| C | H | N | O | S | ||||||
| EF | Tar | EF | Tar | EF | Tar | EF | Tar | EF | Tar | |
| RP | 42.80 | 93.25 | 1.80 | 6.17 | <0.01 | <0.01 | <0.01 | <0.01 | <0.01 | <0.01 |
| WRP | 48.10 | 93.34 | 2.00 | 6.00 | <0.01 | <0.01 | <0.01 | <0.01 | <0.01 | <0.01 |
| WRPC | 39.70 | 94.13 | 0.90 | 5.85 | 0.50 | <0.01 | <0.01 | 0.01 | 0.16 | <0.01 |
| WC | 49.70 | 93.49 | 0.80 | 6.08 | 0.71 | <0.01 | <0.01 | 0.02 | 0.59 | <0.01 |
| WD | 65.45 | 93.82 | 1.10 | 6.15 | 0.39 | <0.01 | <0.01 | 0.02 | <0.01 | <0.01 |
| Item | Input, kg/h | Item | Output, kg/h | ||||||||
|---|---|---|---|---|---|---|---|---|---|---|---|
| Mass | C | H | O | N | Mass | C | H | O | N | ||
| Fuel, RP | 1.08 | 0.86 | 0.14 | 0.05 | <0.01 | Dry gas | 4.45 | 0.72 | 0.13 | 0.74 | 2.86 |
| Air | 3.42 | – | – | 0.80 | 2.62 | Water | 0.01 | – | <0.01 | 0.01 | – |
| Nitrogen purge | 0.32 | – | – | – | 0.32 | Elutriated fines | <0.01 | <0.01 | <0.01 | – | <0.01 |
| – | – | – | – | – | – | Tar | 0.17 | 0.16 | 0.01 | 0.00 | <0.01 |
| Total | 4.82 | 0.86 | 0.14 | 0.85 | 2.95 | Total | 4.64 | 0.86 | 0.14 | 0.75 | 2.86 |
| Mass balance, % | 96.28 | – | – | – | – | – | – | ||||
| Fuel, WRP | 1.14 | 0.84 | 0.13 | 0.13 | <0.01 | Dry gas | 4.52 | 0.70 | 0.12 | 0.80 | 2.92 |
| Air | 3.42 | – | – | 0.80 | 2.62 | Water | 0.03 | – | <0.01 | 0.03 | – |
| Nitrogen purge | 0.32 | – | – | – | 0.32 | Elutriated fines | <0.01 | <0.01 | <0.01 | – | <0.01 |
| – | – | – | – | – | – | Tar | 0.13 | 0.12 | 0.01 | 0.00 | 0.00 |
| Total | 4.88 | 0.84 | 0.13 | 0.93 | 2.95 | Total | 4.69 | 0.82 | 0.13 | 0.83 | 2.92 |
| Mass balance, % | 96.08 | – | – | – | – | – | – | ||||
| Fuel, WRPC | 1.56 | 0.97 | 0.13 | 0.27 | <0.01 | Dry gas | 4.98 | 0.75 | 0.10 | 1.02 | 3.10 |
| Air | 3.43 | – | – | 0.80 | 2.63 | Water | 0.10 | – | 0.01 | 0.09 | – |
| Nitrogen purge | 0.32 | – | – | – | 0.32 | Elutriated fines | 0.04 | 0.02 | <0.01 | – | <0.01 |
| – | – | – | – | – | – | Tar | 0.17 | 0.16 | 0.01 | <0.01 | 0.00 |
| Total | 5.31 | 0.97 | 0.13 | 1.07 | 2.95 | Total | 5.30 | 0.94 | 0.12 | 1.11 | 3.10 |
| Mass balance, % | 99.75 | – | – | – | – | – | – | ||||
| Fuel, WC | 2.09 | 1.08 | 0.11 | 0.47 | <0.01 | Dry gas | 5.00 | 0.76 | 0.08 | 1.22 | 2.94 |
| Air | 3.44 | – | – | 0.80 | 2.64 | Water | 0.13 | – | 0.01 | 0.11 | – |
| Nitrogen purge | 0.32 | – | – | – | 0.32 | Elutriated fines | 0.18 | 0.09 | <0.01 | – | <0.01 |
| – | – | – | – | – | – | Tar | 0.30 | 0.28 | 0.02 | <0.01 | <0.01 |
| Total | 5.85 | 1.08 | 0.11 | 1.27 | 2.96 | Total | 5.62 | 1.13 | 0.11 | 1.33 | 2.94 |
| Mass balance, % | 96.06 | – | – | – | – | – | – | ||||
| Fuel, WD | 2.46 | 1.11 | 0.14 | 0.95 | 0.01 | Dry gas | 5.71 | 1.03 | 0.11 | 1.62 | 2.95 |
| Air | 3.42 | – | – | 0.80 | 2.62 | Water | 0.21 | – | 0.02 | 0.19 | – |
| Nitrogen purge | 0.32 | – | – | – | 0.32 | Elutriated fines | 0.08 | 0.05 | <0.01 | – | <0.01 |
| – | – | – | – | – | – | Tar | 0.03 | 0.03 | <0.01 | <0.01 | <0.01 |
| Total | 6.20 | 1.11 | 0.14 | 1.75 | 2.95 | Total | 6.03 | 1.11 | 0.13 | 1.81 | 2.95 |
| Mass balance, % | 97.33 | – | – | – | – | – | – | ||||
3.3. Energy Balance
| Item | Input, MJ/kgFuel | Item | Output, MJ/kgFuel | ||||||||
|---|---|---|---|---|---|---|---|---|---|---|---|
| RP | WRP | WRPC | WC | WD | RP | WRP | WRPC | WC | WD | ||
| Fuel | 36.95 | 32.57 | 25.73 | 19.41 | 15.73 | Dry syngas | 27.77 | 23.84 | 16.40 | 10.29 | 12.03 |
| Air | – | – | – | – | – | Water | – | – | – | – | – |
| Nitrogen purge | – | – | – | – | – | Elutriated fines | 0.02 | 0.04 | 0.38 | 1.49 | 0.72 |
| – | – | – | – | – | – | Tar | 4.92 | 3.52 | 3.39 | 4.38 | 0.41 |
| Total | 36.95 | 32.57 | 25.73 | 19.41 | 15.73 | Total | 32.71 | 27.40 | 20.17 | 16.15 | 13.15 |
| Energy balance, % | 88.51 | 84.11 | 78.40 | 83.25 | 83.60 | – | – | – | – | – | – |
4. Conclusions
Acknowledgments
Author Contributions
Conflicts of Interest
Nomenclature
| BFBG | bubbling fluidized bed gasifier |
| CCE | carbon conversion efficiency |
| CE | chemical enthalpy |
| CGE | cold gas efficiency |
| EF | chemical enthalpy |
| GC-MS | gas chromatograph-mass spectrometer |
| GL | gasification loss |
| GSY | gas specific yield |
| HHV | higher heating value |
| HRE | hydrogen recovery efficiency |
| kgFuel | kilogram of fuel on wet basis |
| LHV | lower heating value |
| mC,i | carbon mass flow rate of the constituent i |
| mH,i | hydrogen mass flow rate of the constituent i |
| mi | volume or mass flow rate of the constituent i |
| micro-GC | micro gas chromatograph |
| Nm3 | cubic meters under normal conditions (0 °C and 1 atm) |
| PG | producer gas |
| Qi | volumetric flow rate of the producer gas |
| RP | recycled plastic |
| SE | specific energy |
| Wi | mass flow rate of the fuel |
| WD | virgin wood |
| WC | mixture of virgin wood and brown coal |
| WRP | mixture of recycled plastic and virgin wood |
| WRPC | mixture of recycled polyethylene, virgin wood and brown coal |
References
- Mastellone, M.L.; Zaccariello, L.; Santoro, D.; Arena, U. The O2-enriched air gasification of coal, plastics and wood in a fluidized bed reactor. Waste Manag. 2012, 32, 733–742. [Google Scholar] [CrossRef] [PubMed]
- Li, K.; Zhang, R.; Bi, J. Experimental study on syngas production by co-gasification of coal and biomass in a fluidized bed. Int. J. Hydrog. Energy 2010, 35, 2722–2726. [Google Scholar] [CrossRef]
- Pinto, F.; Franco, C.; André, R.N.; Tavares, C.; Dias, M.; Gulyurtlu, I.; Cabrita, I. Effect of experimental conditions on co-gasification of coal, biomass and plastics wastes with air/steam mixtures in a fluidized bed system. Fuel 2003, 82, 1967–1976. [Google Scholar] [CrossRef]
- Minkova, V.; Marinov, S.P.; Zanzi, R.; Björnbom, E.; Budinova, T.; Stefanova, M.; Lakov, L. Thermochemical treatment of biomass in a flow of steam or in a mixture of steam and carbon dioxide. Fuel Process. Technol. 2000, 62, 45–52. [Google Scholar] [CrossRef]
- Mastellone, M.L.; Zaccariello, L. Metals flow analysis applied to the hydrogen production by catalytic gasification of plastics. Int. J. Hydrog. Energy 2013, 38, 3621–3629. [Google Scholar] [CrossRef]
- Arena, U.; Zaccariello, L.; Mastellone, M.L. Gasification of natural and waste biomass in a pilot scale fluidized bed reactor. Combust. Sci. Technol. 2010, 182, 625–639. [Google Scholar] [CrossRef]
- Devi, L.; Ptasinski, K.J.; Janssen, F.J.J.G. Pretreated olivine as tar removal catalyst for biomass gasifiers: investigation using naphthalene as model biomass tar. Fuel Process. Technol. 2005, 86, 707–730. [Google Scholar] [CrossRef]
- Corella, J.; Toledo, J.M.; Padilla, R. Olivine or dolomite as in-bed additive in biomass gasification with air in a fluidized bed: Which is better? Energy Fuels 2004, 18, 713–720. [Google Scholar] [CrossRef]
- Pfeifer, C.; Rauch, R.; Hofbauer, H. In-bed catalytic tar reduction in a dual fluidized bed biomass steam gasifier. Ind. Eng. Chem. Res. 2004, 43, 1634–1640. [Google Scholar] [CrossRef]
- Rapagnà, S.; Jand, N.; Kiennemann, A.; Foscolo, P.U. Steam-gasification of biomass in a fluidised-bed of olivine particles. Biomass Bioenergy 2000, 19, 187–197. [Google Scholar] [CrossRef]
- Mastellone, M.L.; Zaccariello, L. Gasification of polyethylene in a bubbling fluidized bed operated with the air staging. Fuel 2013, 106, 226–233. [Google Scholar] [CrossRef]
- Aznar, M.P.; Caballero, M.A.; Sancho, J.A.; Francés, E. Plastic waste elimination by co-gasification with coal and biomass in fluidized bed with air in pilot plant. Fuel Process. Technol. 2006, 87, 409–420. [Google Scholar] [CrossRef]
- Pan, Y.G.; Roca, X.; Velo, E.; Puigjaner, L. Removal of tar by secondary air in fluidised bed gasification of residual biomass and coal. Fuel 1999, 78, 1703–1709. [Google Scholar] [CrossRef]
- Narváez, I.; Orío, A.; Aznar, M.P.; Corella, J. Biomass gasification with air in an atmospheric bubbling fluidized bed. Effect of six operational variables on the quality of produced raw gas. Ind. Eng. Chem. Res. 1996, 35, 2110–2120. [Google Scholar] [CrossRef]
- Wilk, V.; Schmid, J.C.; Hofbauer, H. Influence of fuel feeding positions on gasification in dual fluidized bed gasifiers. Biomass Bioenergy 2013, 54, 46–58. [Google Scholar] [CrossRef]
- Kern, S.; Pfeifer, C.; Hofbauer, H. Gasification of wood in a dual fluidized bed gasifier: Influence of fuel feeding on process performance. Chem. Eng. Sci. 2013, 90, 284–298. [Google Scholar] [CrossRef]
- Corella, J.; Herguido, J.; Alday, F. Pyrolysis and steam gasification of biomass in fluidized beds. Influence of the type and location of the biomass feeding point on the product distribution. In Research in Thermochemical Biomass Conversion; Bridgwater, A.V., Kuester, J.L., Eds.; Springer: Dordrecht, The Netherlands, 1988; pp. 384–398. [Google Scholar]
- Wilk, V.; Hofbauer, H. Co-gasification of plastics and biomass in a dual fluidized-bed steam gasifier: Possible interactions of fuels. Energy Fuels 2013, 27, 3261–3273. [Google Scholar] [CrossRef]
- Saw, W.L.; Pang, S. Co-gasification of blended lignite and wood pellets in a 100 kW dual fluidised bed steam gasifier: The influence of lignite ratio on producer gas composition and tar content. Fuel 2013, 112, 117–124. [Google Scholar] [CrossRef]
- Fermoso, J.; Arias, B.; Plaza, M.G.; Pevida, C.; Rubiera, F.; Pis, J.J.; García-Peña, F.; Casero, P. High-pressure co-gasification of coal with biomass and petroleum coke. Fuel Process. Technol. 2009, 90, 926–932. [Google Scholar] [CrossRef]
- Kumabe, K.; Hanaoka, T.; Fujimoto, S.; Minowa, T.; Sakanishi, K. Co-gasification of woody biomass and coal with air and steam. Fuel 2007, 86, 684–689. [Google Scholar] [CrossRef]
- Aigner, I.; Pfeifer, C.; Hofbauer, H. Co-gasification of coal and wood in a dual fluidized bed gasifier. Fuel 2011, 90, 2404–2412. [Google Scholar] [CrossRef]
- Howaniec, N.; Smolinski, A.; Stanczyk, K.; Pichlak, M. Steam co-gasification of coal and biomass derived chars with synergy effect as an innovative way of hydrogen-rich gas production. Int. J. Hydrog. Energy 2011, 36, 14455–14463. [Google Scholar] [CrossRef]
- Sjöström, K.; Chen, G.; Yu, Q.; Brage, C.; Rosén, C. Promoted reactivity of char in co-gasification of biomass and coal: Synergies in the thermochemical process. Fuel 1999, 78, 1189–1194. [Google Scholar] [CrossRef]
- Channiwala, S.A.; Parikh, P.P. A unified correlation for estimating HHV for solid, liquid and gaseous fuel. Fuel 2002, 81, 1051–1063. [Google Scholar] [CrossRef]
- Pinto, F.; Franco, C.; André, R.N.; Miranda, M.; Gulyurtlu, I.; Cabrita, I. Co-gasification study of biomass mixed with plastic wastes. Fuel 2002, 81, 291–297. [Google Scholar] [CrossRef]
- Mastellone, M.L.; Zaccariello, L.; Arena, U. Co-gasification of coal, plastic waste and wood in a bubbling fluidized bed reactor. Fuel 2010, 89, 2991–3000. [Google Scholar] [CrossRef]
- Ahmed, I.I.; Nipattummakul, N.; Gupta, A.K. Characteristics of syngas from co-gasification of polyethylene and woodchips. Appl. Energy 2011, 88, 165–174. [Google Scholar] [CrossRef]
- Pinto, F.; André, R.N.; Franco, C.; Lopes, H.; Gulyurtlu, I.; Cabrita, I. Co-gasification of coal and wastes in a pilot-scale installation 1: Effect of catalysts in syngas treatment to achieve tar abatement. Fuel 2009, 88, 2392–2402. [Google Scholar] [CrossRef]
© 2015 by the authors; licensee MDPI, Basel, Switzerland. This article is an open access article distributed under the terms and conditions of the Creative Commons Attribution license (http://creativecommons.org/licenses/by/4.0/).
Share and Cite
Zaccariello, L.; Mastellone, M.L. Fluidized-Bed Gasification of Plastic Waste, Wood, and Their Blends with Coal. Energies 2015, 8, 8052-8068. https://doi.org/10.3390/en8088052
Zaccariello L, Mastellone ML. Fluidized-Bed Gasification of Plastic Waste, Wood, and Their Blends with Coal. Energies. 2015; 8(8):8052-8068. https://doi.org/10.3390/en8088052
Chicago/Turabian StyleZaccariello, Lucio, and Maria Laura Mastellone. 2015. "Fluidized-Bed Gasification of Plastic Waste, Wood, and Their Blends with Coal" Energies 8, no. 8: 8052-8068. https://doi.org/10.3390/en8088052