3.1. Extracellular Polymeric Substance (EPS) Elution and Granule Disintegration in the Presence of High-Concentration Sulfur Compounds
Dissolution experiments were performed to examine whether or not the presence of reduced sulfur compounds (sulfide, methanethiol, DMS, DMDS) makes an elution of EPS from the granules. First of all, the EPS extracted from the granule using CER method was as follows: protein 13.2 ± 2.5 mg/g-SS, and carbohydrate 42.8 ± 3.6 mg/g-SS. These values were at similar levels to those of anaerobic granules obtained by other researchers [
29].
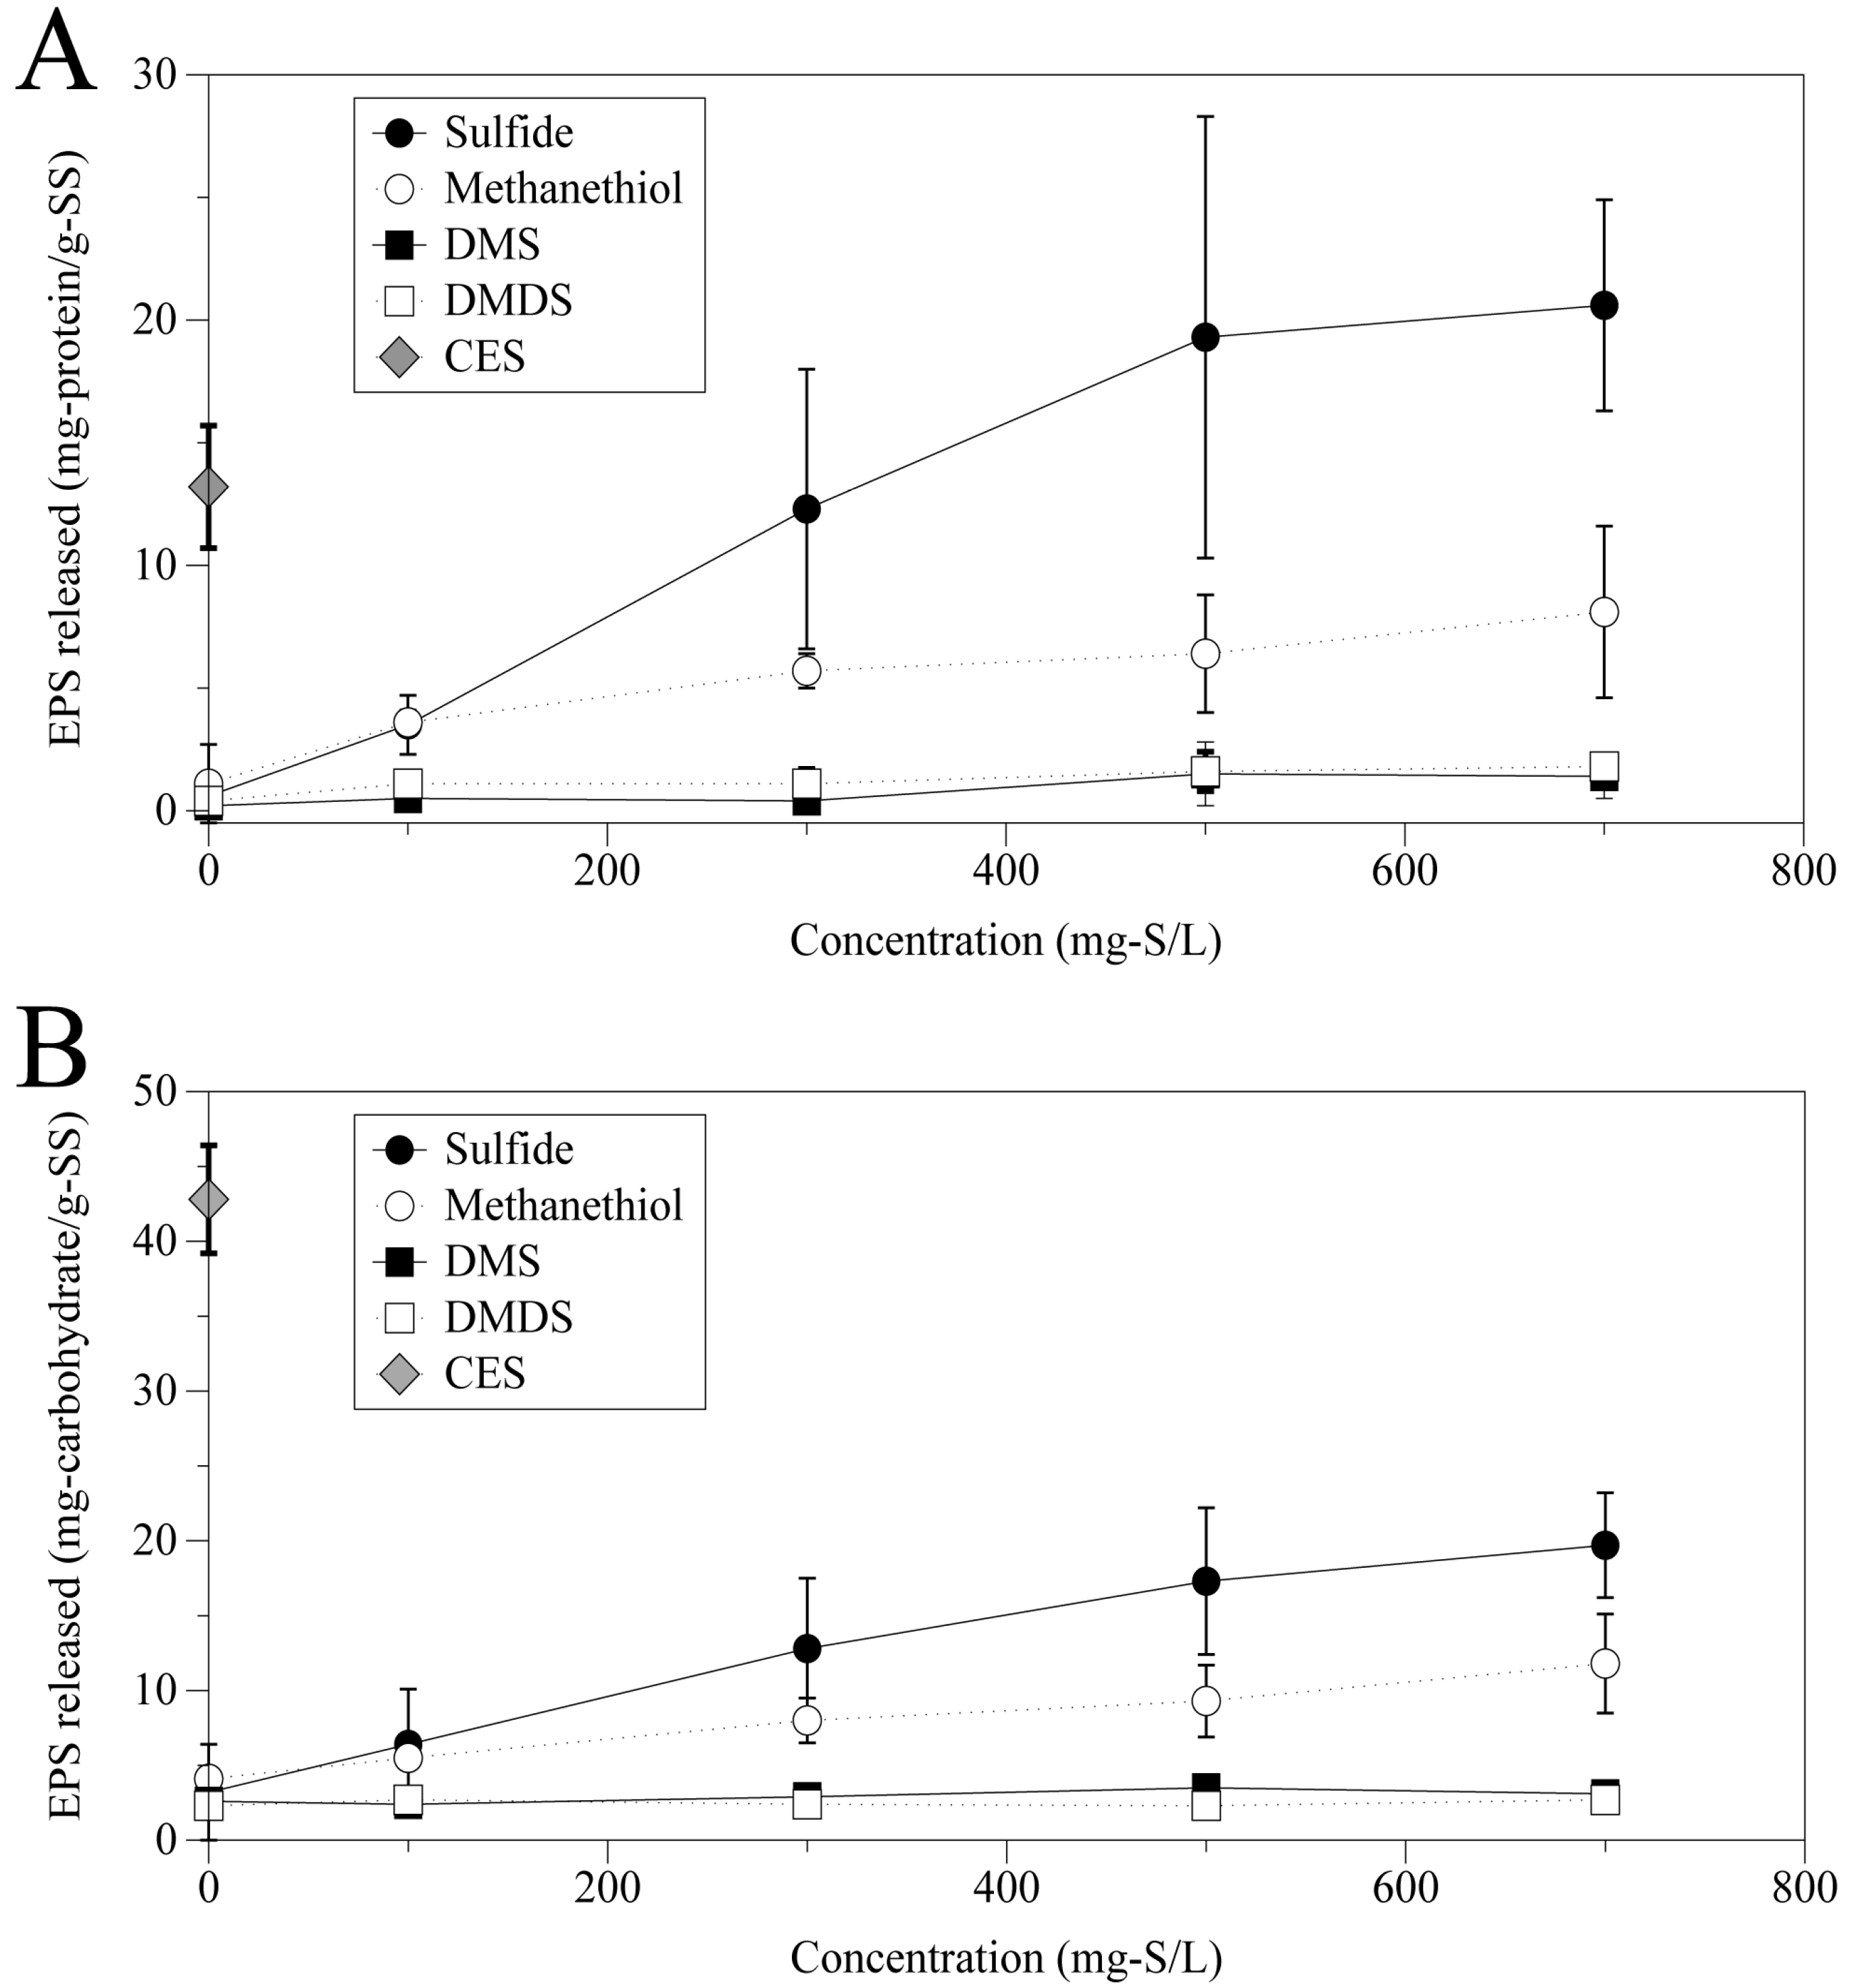
Figure 2 summarizes the protein and carbohydrate released from the granules after 3 h shaking at 35 °C. From these results, it was found that DMS and DMDS, which did not form a precipitate, had no significant effect on the elution of EPS regardless of the concentration. On the contrary,
Figure 2 clearly indicates that sulfide and methanethiol, which are relatively easy to dissolve in water and to make metal salts, caused an elution of EPS protein and carbohydrate. The amount of EPS dissolution increased with concentrations of sulfide and methanethiol in the range of 0 mg-S/L to 700 mg-S/L. Sulfide had the most powerful influence in dissolution of EPS among the four sulfur compounds investigated.
Figure 2.
Protein (A) and carbohydrate (B) released from the granules at different concentrations of sulfur compounds.
Figure 2.
Protein (A) and carbohydrate (B) released from the granules at different concentrations of sulfur compounds.
The trace metal concentrations of the fresh granules taken from the full-scale plant were as follows (mg/g-dry wt.): Al 0.64 ± 0.09; Ca 5.67 ± 1.02; Co 0.04 ± 0.01; Cu 0.05 ± 0.01; Fe 12.7 ± 1.6; Mg 1.32 ± 0.27; Mn 0.09 ± 0.01; Ni 0.05 ± 0.01; Zn 0.17 ± 0.02; and Mo 0.04 ± 0.00. The composition of trace metals in the anaerobic granules widely varied depending on wastewater types [
30]. In this study, measurement results clearly suggest that Fe and Ca were the main trace element and they seemed to play important roles in the biofilm structure forming cation-EPS bounds. EPS integrates microbial flocs in a three-dimensional matrix due to bindings with bivalent cations and hydrophobic interactions [
31]. To destroy the matrix and elute EPS in water, therefore, the extraction method using CER depends on chemical removal of divalent cations such as Ca
2+ binding with EPS [
31]. In a similar way, the sulfide and methanethiol were likely to play an important role in removal of metal cations such as Fe
2+ from the liquid phase and granules by forming insoluble iron salts. After the experiment using sulfide (0–700 mg-S/L), for each granule sample, only particles greater than 0.5 mm to remove FeS precipitate were carefully washed with water, and exchangeable cations were extracted with 1 M ammonium acetate.
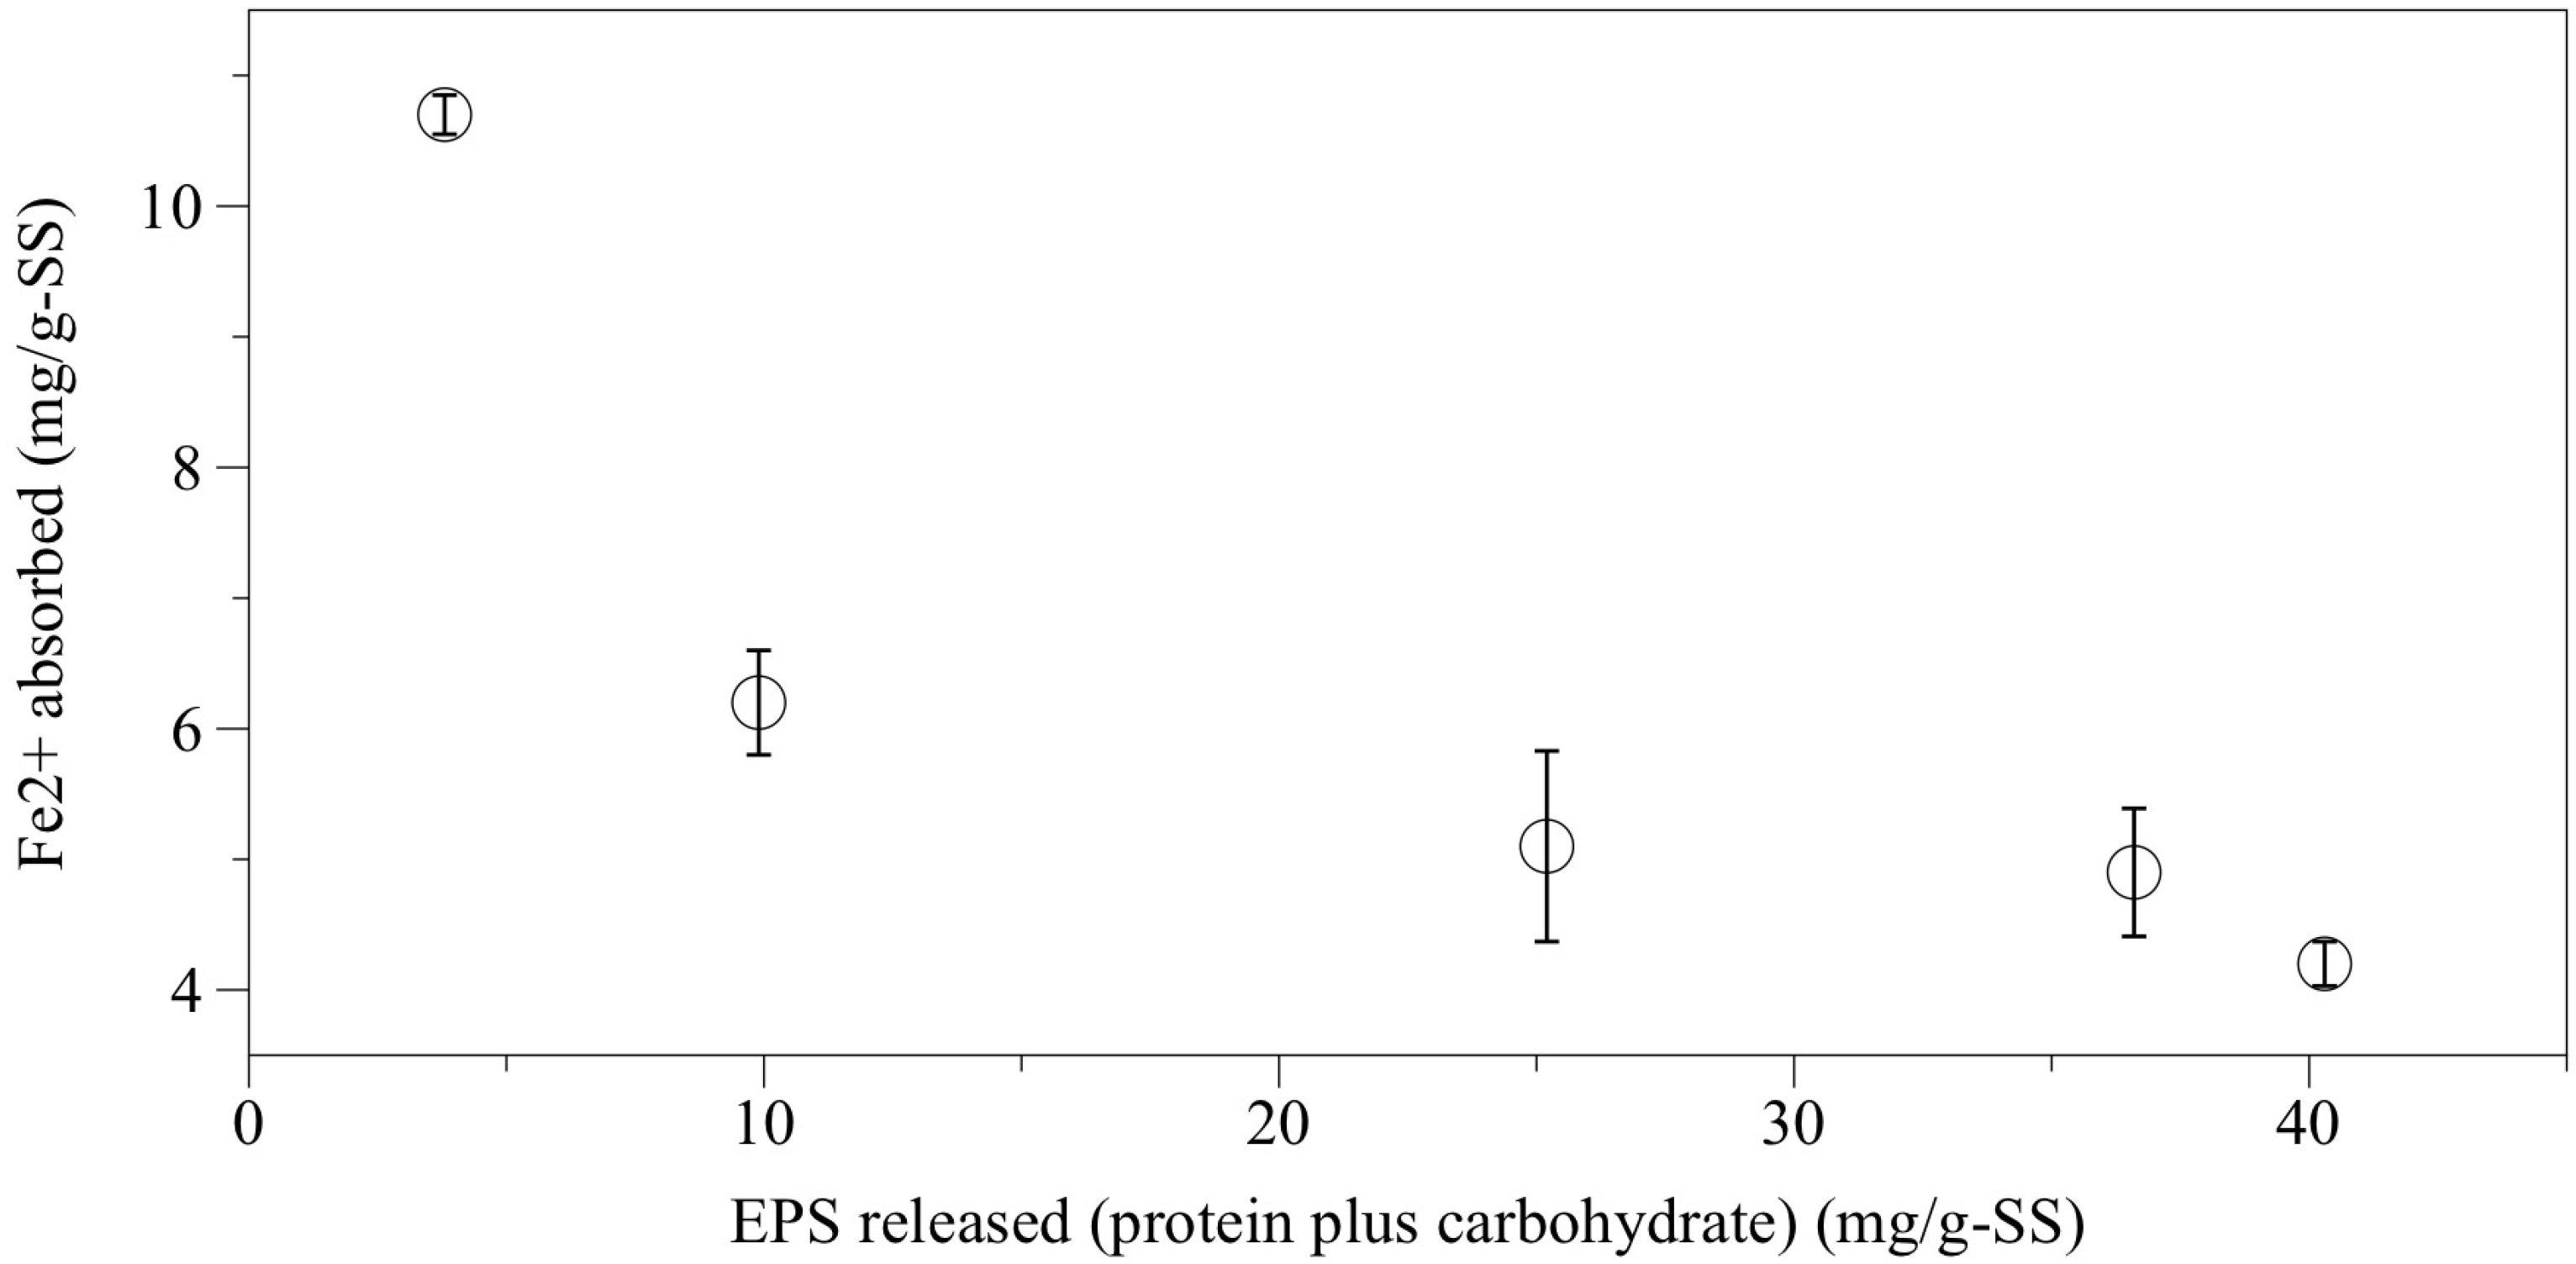
Figure 3 shows a relationship between extracted Fe
2+ ion and EPS released. Part of the Fe
2+ ion seems to be responsible for cation-EPS-cell matrix. This figure clearly suggests that there is a negative correlation between the absorbed Fe
2+ and EPS release. Thus, the more Fe
2+ is removed from the granules, the more EPS is released. This result supports the discussions above. It should be noted that the EPS protein concentration obtained at 700 mg-S/L sulfide was 20.6 mg/g-SS ± 4.3 mg/g-SS, which was 1.6 times larger than the extracted one via the CER method in the first experiment. Such a large amount of EPS released by sulfide suggests that Fe
2+ contributed much to help EPS to form the matrix structure due to the major divalent metal ion in the granule. On the other hand, the carbohydrate released with sulfide was at a lower level than that using CER. As other researchers pointed out, each extraction method might target at different types of EPS in biofilm structure. For example, CER is highly selective for Ca
2+ and Mg
2+-bound EPS [
32], while sulfide might be for Fe
2+-bound EPS. Perhaps, in this research case, Ca
2+- and Mg
2+-bound EPS was rich in carbohydrate not in protein, and
vice versa for Fe
2+-bound EPS. From the results of dissolution experiments, it was found that a large amount of EPS could be eluted from the granules in the presence of sulfide and methanethiol.
Figure 3.
Relationship between Fe2+ absorbed to granules and the extracellular polymeric substance (EPS) released after the batch experiment with sulfide (0–700 mg-S/L).
Figure 3.
Relationship between Fe2+ absorbed to granules and the extracellular polymeric substance (EPS) released after the batch experiment with sulfide (0–700 mg-S/L).
Subsequently, temporal change of granule size distribution in the presence of a high concentration of sulfide, which had the strongest influence in EPS elution, was monitored.
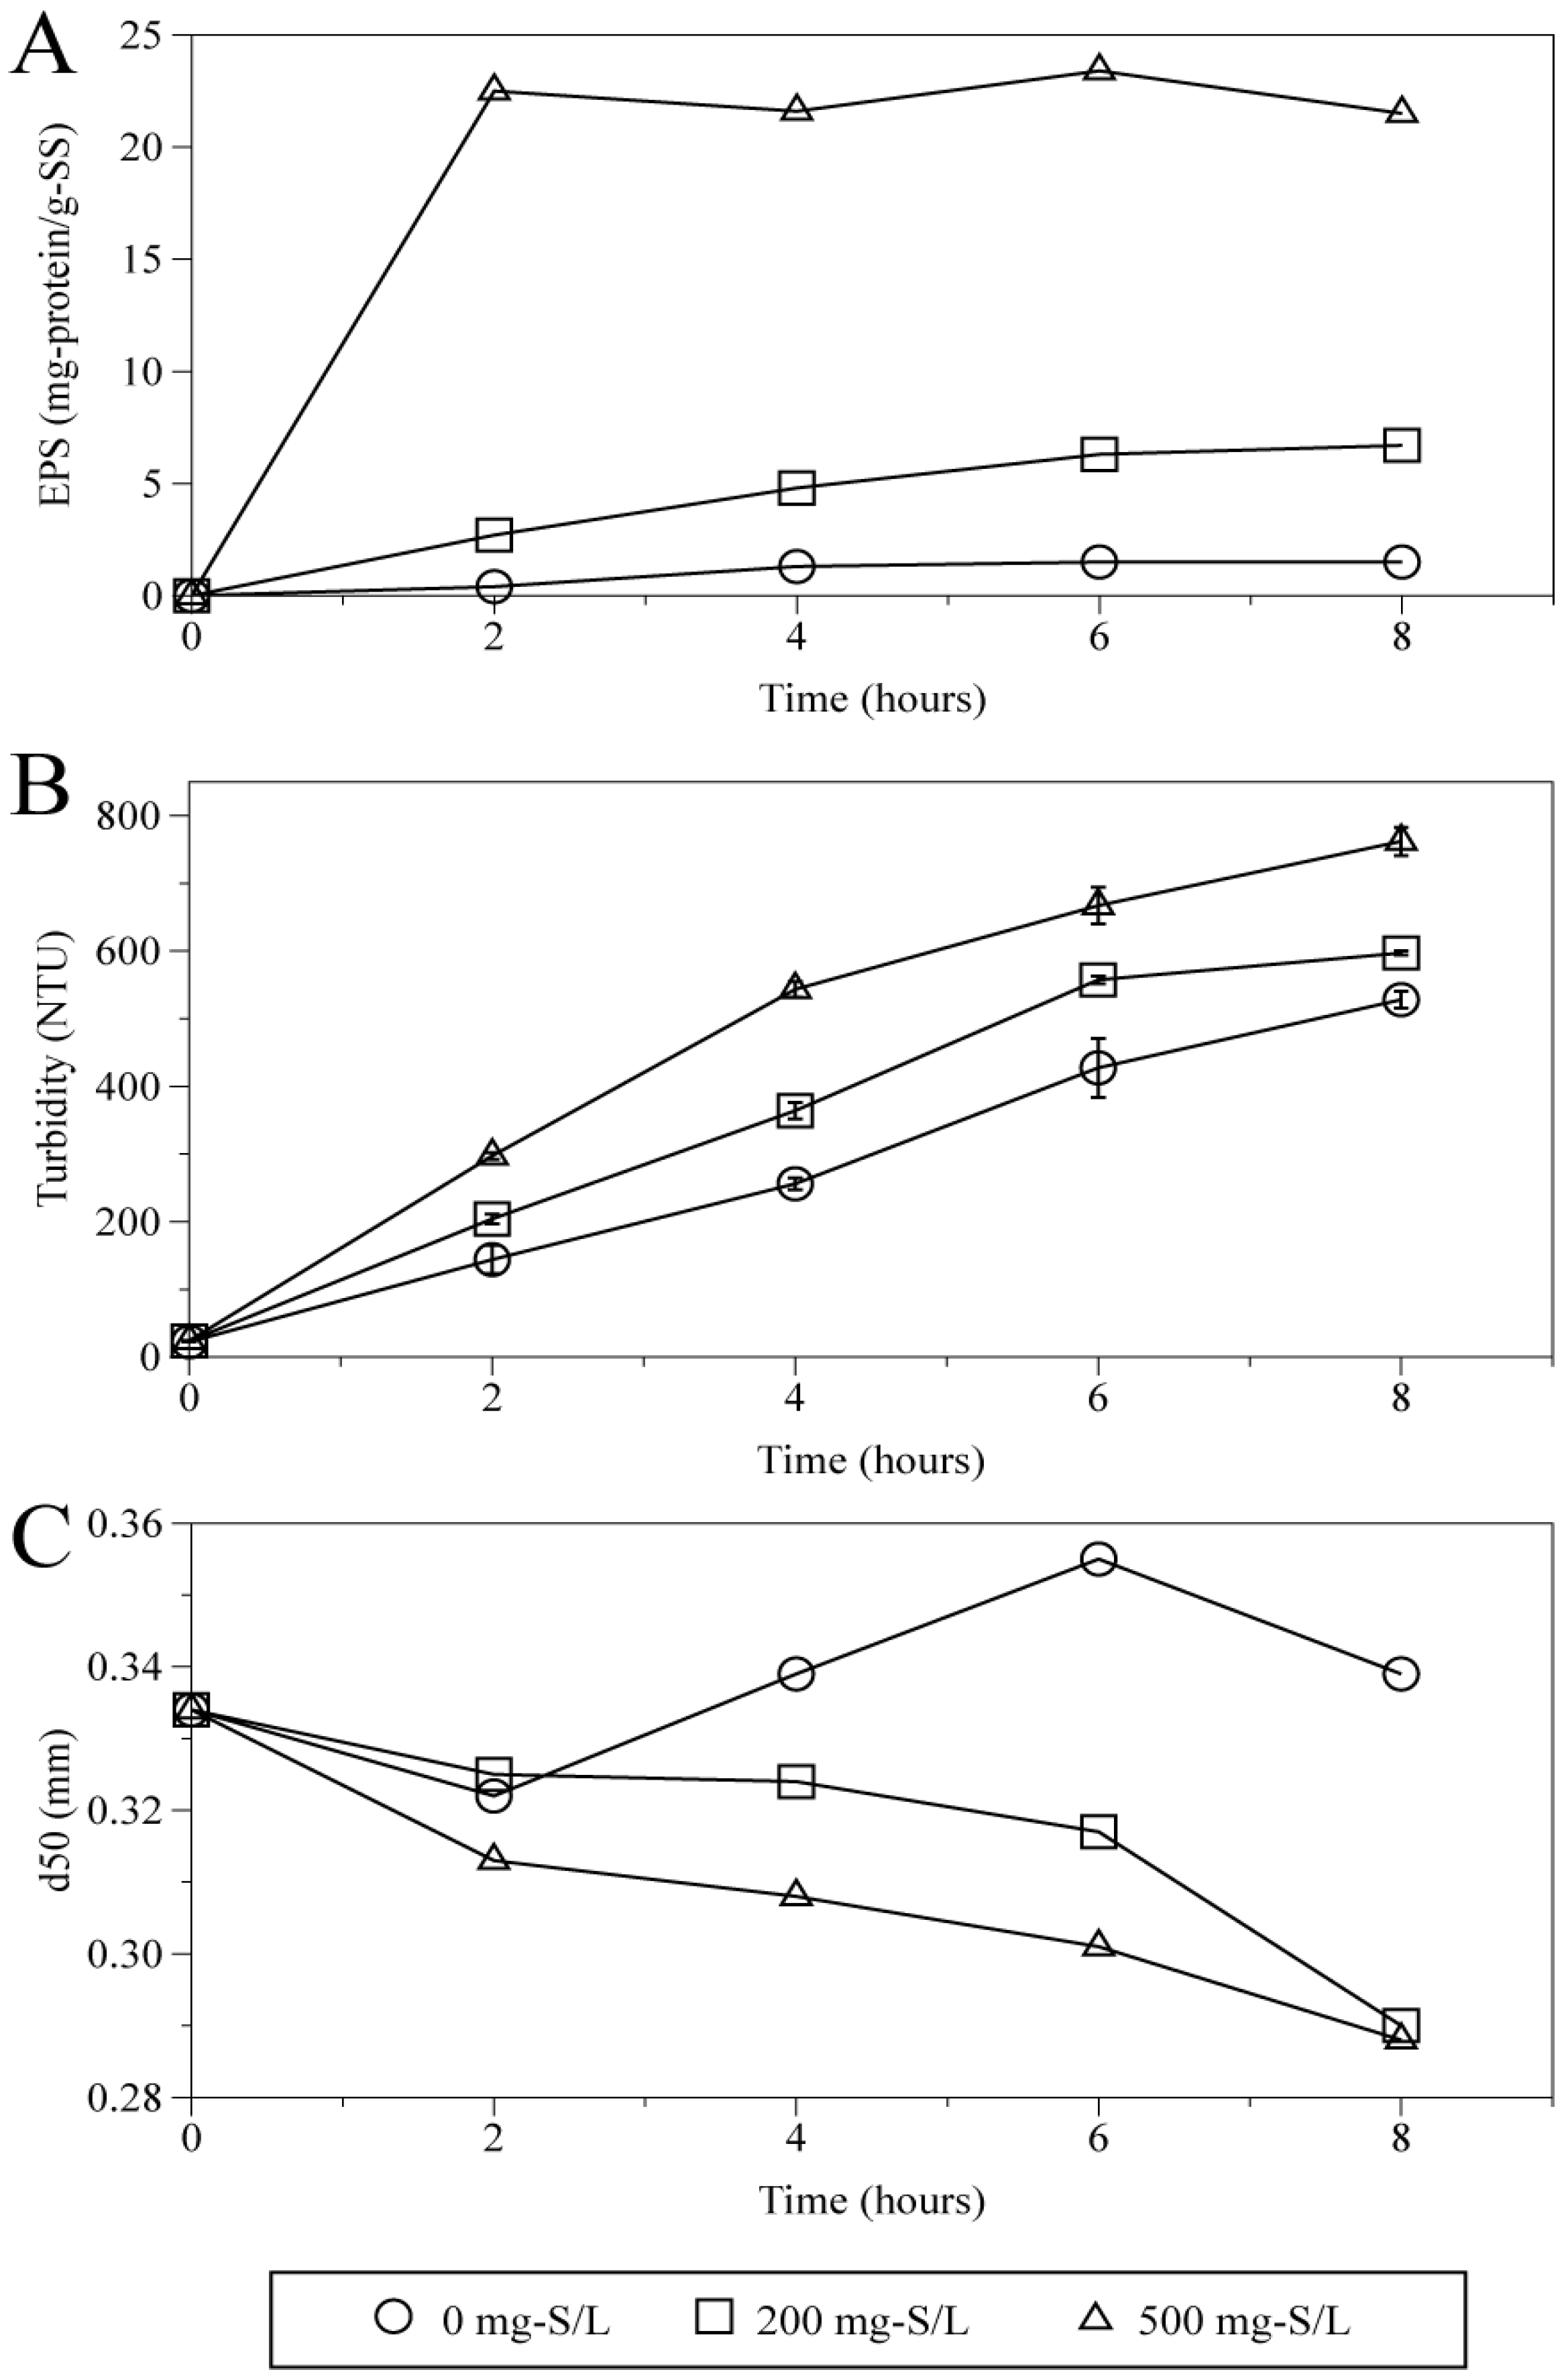
Figure 4 shows the time courses of EPS protein released from granules (
Figure 4A), turbidity (
Figure 4B) and median diameter d50 (
Figure 4C) within the particle distributions of sludge (>0.1 mm) at sulfide concentrations of 0, 200, 500 mg-S/L. Turbidity is a common parameter showing amount of granule break-up [
33,
34]. During eight hours shaking at 35 °C, it was clearly indicated that increase in EPS release, turbidity and decrease in d50 occurred. The rapid release of EPS protein was observed: the release of EPS protein was saturated within the first 2 h at 500 mg-S/L while granules at 0 mg-S/L and 200 mg-S/L showed slight increase with time. Even after 8 h, the amount of EPS protein released without sulfide addition was only 7% of that at 500 mg-S/L. This implies the presence of sulfide had a much greater impact on EPS elution than the mechanical shear stress. Many different kinds of physical and chemical methods for EPS extraction have been investigated [
29,
30]. D’Abzac
et al. [
30] reported that physical methods including centrifugation, sonication and heating had less extraction yield than chemical methods including formaldehyde, NaOH, ethanol and ethylenediaminetetraacetic acid (EDTA).
Figure 4.
Time course of EPS protein released from the granules (A), turbidity (B) and median diameter of particles (>0.1 mm) (C) at different concentrations of sulfide.
Figure 4.
Time course of EPS protein released from the granules (A), turbidity (B) and median diameter of particles (>0.1 mm) (C) at different concentrations of sulfide.
For example, EPS obtained in sonication treatments was only 7%–30% of that in EDTA treatment [
30]. However, the fact remains that sonication induces considerable break-up of granules [
33,
34]. This means that destruction of granules does not always depend on absence of EPS. Nevertheless, a combination of physical stress and EPS release is likely to promote granule destruction. As time went on, the contents of the bottle with higher sulfide concentration became turbid and scattered earlier. The increasing rate of turbidity was clearly dependent on sulfide concentration. For example, the increase in turbidity reached similar levels around 600 NTU within 4, 6, 8 h (0 mg-S/L). However, the fact that all the samples showed significant increase in turbidity suggested that the increase partially depended on shear force caused by the shaking. It has been known that shear force causes cell erosion and deflocculation of anaerobic flocs, and consequently increases dispersed particles in solution [
35]. Thus, that kind of dispersed particles contributed to increasing turbidity. Sheng
et al. [
35] suggested that even small amount of EPS (10–15 mg/g-SS) glued most of the dispersed particles and had a significant effect on the floc stability against shear stress, and furthermore, they proposed a multi-layer structural model, in which sludge flocs consists of stability part and dispersible part. The outer region of flocs is the dispersible part, which is loosely glued by EPS and can be eluted by shear force. By contrast, the stability part is so tight that it cannot be dispersed by shear under normal conditions. As such, EPS elusion caused by the presence of sulfide is thought to accelerate dispersion of so-called dispersible part of the granules. From the results obtained, it can be concluded that exposure to very high concentration of sulfide negatively affected the EPS-related complex matrix and promoted the dispersion of the small particles.
Figure 4C indicates that there was apparent difference in median diameters between granules with and without sulfide. While the d50 maintained above 3.2 mm at 0 mg-S/L, those were gradually decreased to below 3.0 mm after 8 h in the presence of 200 mg-S/L and 500 mg-S/L sulfide. Although there was little difference in d50 between the conditions of 200 mg-S/L and 500 mg-S/L, the size distribution appeared rather different.
Figure 5 shows the size distribution of granules at each sulfide concentration after 8 h. The distributions of three samples clearly consisted of smaller particles than that of raw granule sample. Approximately 30% of the raw granules were within the range of 0.5–3 mm. The cumulative frequency curves represent very small fraction less than 0.15 mm in diameter occupied the large part (14%) of the granules at 500 mg-S/L unlike other conditions. Although similar distributions were observed in the range of 0.10 mm to 0.25 mm between 0 mg-S/L and 200 mg-S/L conditions, there were more large granules at 0 mg-S/L. Granules of above 0.5 mm in diameter accounted for approximately 20% (0 mg-S/L) and 12% (200 mg-S/L), respectively.
Figure 5.
Size distributions of the particles (>0.1 mm) after 8 h of the experiment at different concentrations of sulfide.
Figure 5.
Size distributions of the particles (>0.1 mm) after 8 h of the experiment at different concentrations of sulfide.
These results pointed out the possibility that the presence of sulfide promoted decline in size of granules during the experiment, which was likely due to decrease in strength caused by EPS elution, leading to disintegration of granules. There has been a report that decrease in EPS content led to the strength of granules [
16]. Ismail
et al. [
16] suggested that a high concentration of sodium ion (20 g/L) caused EPS release from the granule, and this led to decrease in strength. The mechanism of EPS release of their works was similar to our findings: cation exchange driven by the high concentrations of Na
+ removed Ca
2+ bound to EPS and loosened the binding of EPS. Moreover, it was thought that the displacement of Ca
2+ from the EPS resulted in a swollen granule structure due to repulsive electrostatic forces, which might be why granule size increased after long-term exposure to high salinity. In this respect, there was a little difference between our findings and the previous report on exposure of high salinity because decrease in size was predominant in the presence of sulfide. On the other hand, Grotenhuis
et al. [
36] reported that calcium removal by addition of the calcium-specific chelant EGTA provided EPS release and decrease in median diameter of the anaerobic granules. Bruus
et al. [
37] also pointed out that Ca
2+ extraction from activated sludge resulted in an increase in the number of small particles, turbidity and subsequently an increase in the specific resistance to filtration. The finding of this study is consistent with Grotenhuis and Bruus’s works. Probably, the difference depends on the granule properties since granules developed by feeding of methanol-based wastewater consists of coccus-shaped cells [
38], while the granules used by Ismail
et al. [
16] consist of complicatedly entangled filamentous cells. A filamentous cell-based granule seems to maintain the adhered structure without cohesion of EPS. Since the substrate Ismail
et al. [
16] used involved acetate, gelatin and starch, microbial community structure was different between this study and theirs, and it was likely to affect granule structure.
3.2. Effect of High Concentration of Sulfide on Performance of Up-Flow Anaerobic Sludge Blanket (UASB) Process in a Continuous Experiment
The continuous operation using three UASB reactors fed with different concentrations of sulfide (10, 200, 500 mg-S/L) was investigated for about 90 days to clarify the effect of the presence of high concentration sulfide on operation performance and sludge retention.
Figure 6 illustrates the time course of methane production rate, SS concentration and soluble protein in the effluent. During the experiment, entire three reactors operated successfully with a suitable pH range (7.4–7.8) and no volatile fatty acid detected. However, compared to the lower sulfide conditions (10 mg-S/L, 200 mg-S/L), the reactor at 500 mg-S/L showed around 5%–10% lower methane production rate. The gas production rate was gradually increased with shortening HRT from four-day (2.5 kg-COD/m
3/d of organic loading rate (OLR)) to one-day (10 kg-COD/m
3/d of OLR) loading rate. The composition of biogas was within the range from 70%–80% methane, 19%–27% CO
2, 0.1%–4% N
2 in each reactor. There was a large variation in H
2S concentration in the biogas: 3–100 ppm (10 mg-S/L); 700–5000 ppm (200 mg-S/L); and 10,000–20,000 ppm (500 mg-S/L). The average methane production rates at a HRT of one day were 3.4 ± 0.2, 3.5 ± 0.1, 3.0 ± 0.4 L/L-reactor/d, respectively. The COD removal efficiency showed a slight decrease with increase in sulfide fed: the COD concentrations in the effluent were 396 ± 227, 550 ± 324, 946 ± 747 mg/L and the removal efficiencies were 96.9% ± 1.0%, 94.4% ± 3.3%, 90.9% ± 7.3%. To understand specific methanogenic activity per unit volume of microorganisms, batch activity tests were conducted during continuous operation at a HRT of one day. The activities of the reactor sludges were as follows: 23.5 ± 13.7, 19.3 ± 4.6, 11.5 ± 1.1 mL/h/g-VSS (500 mg-S/L).
Figure 6.
Performance evolutions during the continuous operation of up-flow anaerobic sludge blanket (UASB) reactors at different concentrations of sulfide in the influent wastewater: methane production rate from a unit volume of reactor (A), suspended solids (SS) concentration in the effluent (B), and EPS protein in the effluent (C).
As the results show, the microorganisms in the control reactor had the highest activity and those in the highly sulfide-fed reactor were considerably inhibited. Visser
et al. [
39] reported that 50% inhibition in methanogenic activity of granular sludge occurred around 300 mg/L total sulfide concentration at pH 7.1–7.3 and 400 mg/L at 8.1–8.3. At 500 mg-S/L condition, the total sulfide concentration except H
2S gas outflowed in the liquid phase was around 300 mg/L. This is within the inhibitory range described above. Our finding was consisted with the previous study. However, most studies dealt with sulfate-containing wastewater as influent, and inhibition of methanogens resulted in sharp decrease in methane content due to substrate competition between methanogens and SRB [
40,
41,
42]. In the present study, the reactors maintained over 90% of methane conversion based on influent COD. These values were similar to the results of long-term (over one year) operation of methanol-based wastewater treatment using the similar UASB reactors and feeding, but with a little sulfur compounds, reporting more than 90% COD to methane conversion [
38]. This is likely due to absence of the competition between methanogen and SRB because the reactors fed with sulfate recorded only 67%–70% of COD to methane conversion with the feeding of 200–333 mg-S/L sulfate [
42]. There are two possible reasons for the low activity in the presence of high concentration sulfide: (1) reduction of bioavailability of metal ions precipitated as insoluble salts of Co, Ni and Fe [
43]; and (2) toxicity of sulfide to microorganism [
41]. The equilibrium calculation suggested that in 200 and 500 mg-S/L sulfide-containing influent wastewaters, over 99.7% of Fe, Ni, Co were present in the forms of solid (inert sulfide salt) at 35 °C and pH 7.8. As such, not only toxicity but also limited metal availability could be a possible inhibitory factor in the continuous experiment. These findings presented above revealed that the operational performance was slightly negatively affected by the presence of high concentration sulfide; however, the negative impact was likely smaller than that caused in the treatment of highly sulfate-containing wastewater.
As shown in
Figure 6B, highly sulfide-fed reactors (200 mg-S/L and 500 mg-S/L) showed higher levels of SS concentration in the effluent during the experiments. The effluent of the two reactors contained a lot of small black particles while that of control reactor with 0 mg-S/L feeding was relatively clear and only a few particles were observed. Since large granules sometimes floated up and flowed out from the reactor, the sulfide-fed reactors showed sharp increases in SS to over 1 g/L in the effluent. The average SS concentrations in the effluent were 245 ± 146, 592 ± 826, and 976 ± 993 mg/L, respectively. This indicates the outflow of sludge increased according to sulfide concentration in the influent.
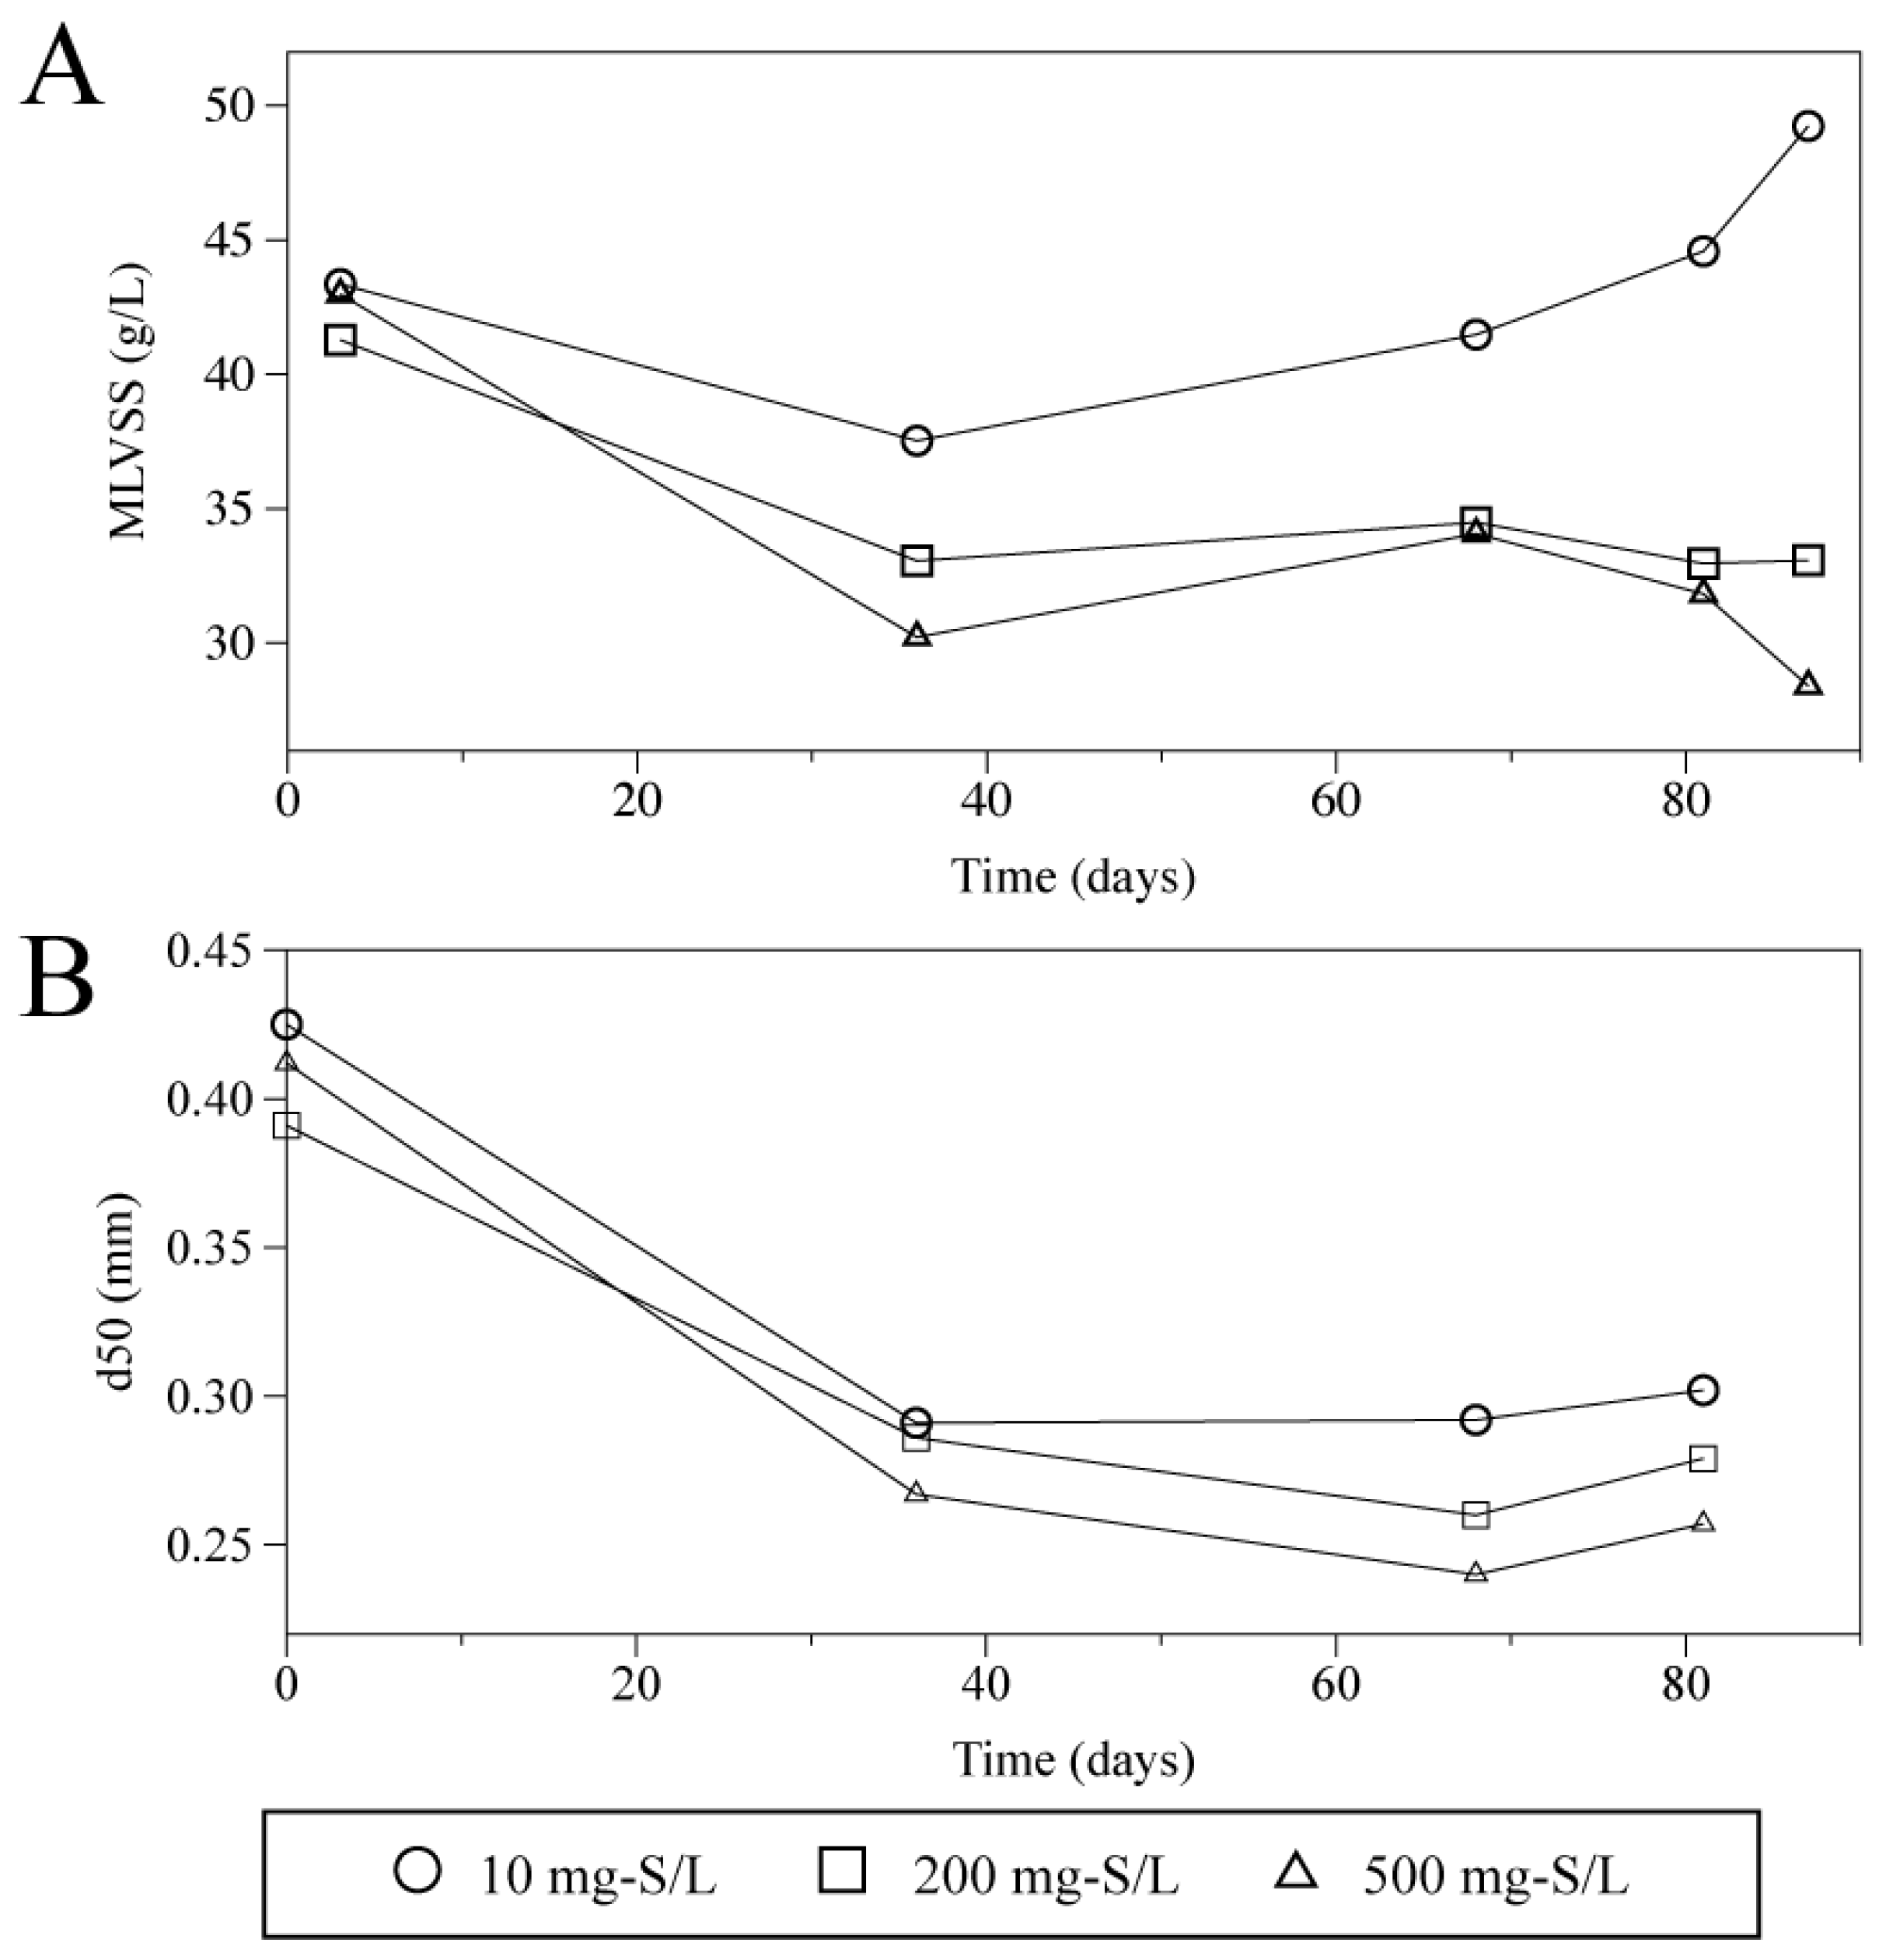
Figure 7 indicates the mixed liquor volatile suspended solids (MLVSS) concentration in the reactors (
Figure 7A) and the median diameter of the granules taken from the middle part of each reactor (port 5). MLVSS concentrations were average values calculated using those of sludge obtained from the eight sampling ports.
Figure 7A shows that there was a clear difference between the reactors with and without high concentration sulfide. The height of sludge bed of the reactors with 200 and 500 mg-S/L sulfide-feeding decreased during the 90 days of operation. The height of sludge bed was around 50 cm initially. However, the MLVSS concentrations mainly in the upper part were decreased with time in the presence of high concentration of sulfide. The MLVSS from ports 1 to 4 (above 48 cm from the bottom) were within 7.9–32 g/L at the beginning, and those after 90 days were 40–63, 3.3–7.3, and 2.1–2.9 g/L (500 mg-S/L), respectively. This is likely due to the outflow of sludge, as suggested in the effluent SS (
Figure 6B). Moreover,
Figure 7B indicates decrease in diameter of the granules inside the reactors. This is likely one of the reasons for flotation and washout of sludge from the reactor, resulting in the reduced sludge concentration. It was also noted that despite of seeding relatively larger granule selectively, all the reactors including the control ones showed significant decrease in median diameter of granules. As the previous study suggested [
38], a continuous treatment of methanol-based wastewater reduces granule sizes. For this reason, in this case, the reduction in granule sizes would depend on not only high concentration sulfide, but also substrate type. Even so, the data implies high concentration sulfide contributed more to the decrease in granule sizes.
Figure 7.
Time courses of the mixed liquor volatile suspended solids (MLVSS) of sludge in UASB reactors (A) and median diameter of the particles obtained from the middle part of the UASB reactor (B).
Figure 7.
Time courses of the mixed liquor volatile suspended solids (MLVSS) of sludge in UASB reactors (A) and median diameter of the particles obtained from the middle part of the UASB reactor (B).
The increase in soluble protein concentration in the effluent observed in highly sulfide-fed reactors pointed out the possibility that high concentration sulfide eluted EPS and destroy granules in the similar way to the batch experiments described above.
Figure 6C clearly illustrates that the two reactors showed rather higher ranges of protein (8.9–14.2 mg/L at 500mg-S/L; 2.1–9.4 mg/L at 200 mg-S/L) than the control reactor; however, slight decreases were observed during the latter part of the operation duration. The average soluble protein concentrations of each reactor were 2.2 ± 1.9, 5.1 ± 2.0, and 10.5 ± 1.4 mg/L, respectively, showing a gradual increase in accordance with the sulfide concentration. These are similar results obtained from the dissolution experiments. The cumulative soluble protein flowed out from the reactor was calculated using the average concentration. The cumulative sum was at most 3.1 g during the 90 days operation at 500 mg-S/L. This could be expressed as 14.8 mg per g-SS of seeded granules. The value was less than that obtained from the dissolution experiment for only 3 h. From this estimation, it was found that the release of EPS from a UASB reactor in continuous operation seemed to be very slow. Jeison
et al. [
44] and Ismail
et al. [
16] also noticed the change in EPS content and granule size distribution as a result of high saline conditions after long-term continuous operations over 150 days. The difference in duration required to release EPS between the batch and continuous experiments is likely due to the effect of shear force. As discussed above, shear force is a major factor dispersing small particles and EPS gluing them [
35]. The continuous experiment in this study had the lower up-flow liquid velocity (below 0.1 m/h) than those of full-scale UASB plants (around 1 m/h), creating a weaker shear force than that of the batch test with a mechanical shaking. On the other hand, the too low up-flow liquid velocity of laboratory reactor might negatively affect granule stability since the importance of moderate hydrodynamic shear force caused by up-flow velocity in the granule stability has been pointed out, while the granule structure tends to become a heterogeneous, porous and weaker structure when the shear force is too weak [
45]. In addition, the actual sulfide concentration in the UASB reactor was lower than the bottles used for dissolution experiments. In the UASB reactor, about 30% (200 mg-S/L) and 60% (500 mg-S/L) of the influent sulfide was outflowed as H
2S gas based on average biogas production and H
2S concentrations, and therefore, the sulfide was actually reduced. As mentioned above, most Fe was likely to be in the form of FeS solids in the reactor, and Fe
2+ responsible for good granulation. Actually, the Fe
2+ concentration was always below 0.2 mg/L in the two reactors (200 mg-S/L and 500 mg-S/L) while that was 1–9 mg/L in the control reactor. In the work of Liu
et al. [
46], enhancement in granulation was observed at a Fe
2+ level around 60 mg/L. Compered to the proper level, Fe
2+ concentrations in this study were very low. Moreover, Mg, Ca, and Al, which help granulation, were at rather lower level in the influent than the optimal levels (300–700 mg/L) [
21,
23,
24]. As such, metal supply was severely limited in the reactors of the present study in terms of not only microbial nutrients but also granulation. Since there was a report that Ca
2+ addition stabilized granules owing to EPS elution [
16], metal supplementation might reduce EPS release and enhance granules retention. Further research is needed to stabilize granule in the system investigated in this study.

