Article

Design and Experimental Analysis of an Exhaust Air Energy Recovery Wind Turbine Generator

1
Department of Mechanical Engineering, Faculty of Engineering, University of Malaya, 50603 Kuala Lumpur, Malaysia
2
UM Power Energy Dedicated Advanced Centre, University of Malaya, Level 4, Wisma R&D, Jalan Pantai Baharu, 59990 Kuala Lumpur, Malaysia
*
Author to whom correspondence should be addressed.
Energies 2015, 8(7), 6566-6584; https://doi.org/10.3390/en8076566
Submission received: 5 May 2015 / Revised: 12 June 2015 / Accepted: 17 June 2015 / Published: 30 June 2015
(This article belongs to the Special Issue Energy Conservation in Infrastructures)

Abstract

:
A vertical axis wind turbine (VAWT) was positioned at the discharge outlet of a cooling tower electricity generator. To avoid a negative impact on the performance of the cooling tower and to optimize the turbine performance, the determination of the VAWT position in the discharge wind stream was conducted by experiment. The preferable VAWT position is where the higher wind velocity matches the positive torque area of the turbine rotation. With the proper matching among the VAWT configurations (blade number, airfoil type, operating tip-speed-ratio, etc.) and exhaust air profile, the turbine system was not only able to recover the wasted kinetic energy, it also reduced the fan motor power consumption by 4.5% and increased the cooling tower intake air flow-rate by 11%. The VAWT had a free running rotational speed of 479 rpm, power coefficient of 10.6%, and tip-speed-ratio of 1.88. The double multiple stream tube theory was used to explain the VAWT behavior in the non-uniform wind stream. For the actual size of a cooling tower with a 2.4 m outlet diameter and powered by a 7.5 kW fan motor, it was estimated that a system with two VAWTs (side-by-side) can generate 1 kW of power which is equivalent to 13% of energy recovery.

Graphical Abstract

1. Introduction

By the end of the year 2014, one of the primary sources of energy, i.e., crude oil was showing a reduction trend in price which was thought could lead to a reduction of the electricity price [1]. According to the Organization of the Petroleum Exporting Countries (OPEC), this declining trend is likely to continue throughout 2015 [2]. At the moment, energy security is not only evaluated in economic perspective, but becomes more complex as it covers emerging global challenges, such as energy resource depletion, climate change, and geopolitical tension [3,4]. The limited capacity of the world to cope with the pollution caused by fossil fuels is one of the major considerations that has forced the world to seek alternative energy systems [5]. More than 90% of the energy related greenhouse gases emission is a result of the CO2 emissions from fuel combustion globally [6]. Currently, the increase in the concentration of greenhouse gases emission has caused a notable rise of temperature in the earth’s atmosphere (global warming) and thus widespread melting of snow and ice at the polar ice caps [7]. Due to the concerns on environmental issues, the development and application of renewable and clean new energy are certainly expected [8].
For this reason, generating energy from renewable sources remains highly relevant, to be implemented and explored. To meet the energy demand without damaging the planet, energy generation from renewable sources is becoming more widespread. Wind energy is known to be the fastest growing renewable energy resource in the world with an annual growth rate of 30% [9]. However, the uncertainty of wind energy is the main problem in matching the increasing demand for renewable energy. The operation of wind power is susceptible to changing wind patterns resulting from climate change [10]. The idea of bringing a wind energy system into urban areas is more challenging because of limited available space and the adaptation of the wind turbine to the existing infrastructure. Many researchers have proposed ideas of wind energy systems that can possibly be installed in urban settings for local energy generation [11,12,13,14]. These systems feature additional augmentation systems, either utilizing the building geometry or retrofitted onto the building or a combination of these. However, the wind quality remains the concern in siting wind turbines in urban areas. Thus, an efficient method is very much required to harness the uncertain wind energy.
Besides turning to available alternative resources for generating clean energy, energy recovery from wastes such as heat sink, exhaust air, etc. also has great potential in helping to address the global energy issue. Energy saving and emission reducing technologies consist of three types, i.e., resource conservation, energy economy, and environment-friendly [15]. The available wind source can be divided into natural wind and man-made wind. Man-made wind is considered as unnatural, that is available from man-made systems or operations such as a cooling tower, exhaust air, etc. The high-speed, consistent and predictable wind produced by these systems is suitable to be recovered into a useful form of energy. Thus, this paper proposes the concept of an energy recovery system on a cooling tower by using commercially available wind turbines. It is an energy recovery system which might reduce the energy demand by generating energy from waste. This system enables the low wind speed countries especially in urban areas to harness wind energy from exhaust air resources which are consistent and predictable. Design and experimental study in determining the optimum position of the turbine at the discharge outlet is presented. The aerodynamical behavior of the wind turbine is then studied via a semi-empirical approach by applying double multiple stream tube (DMST) theory. This theory is preferable because the wind stream is divided into several tubes perpendicular to the wind turbine swept plane. It allows the influence of a non-uniform wind velocity profile from the wind source to be included in the analysis. This is a novel application of the DMST theory.

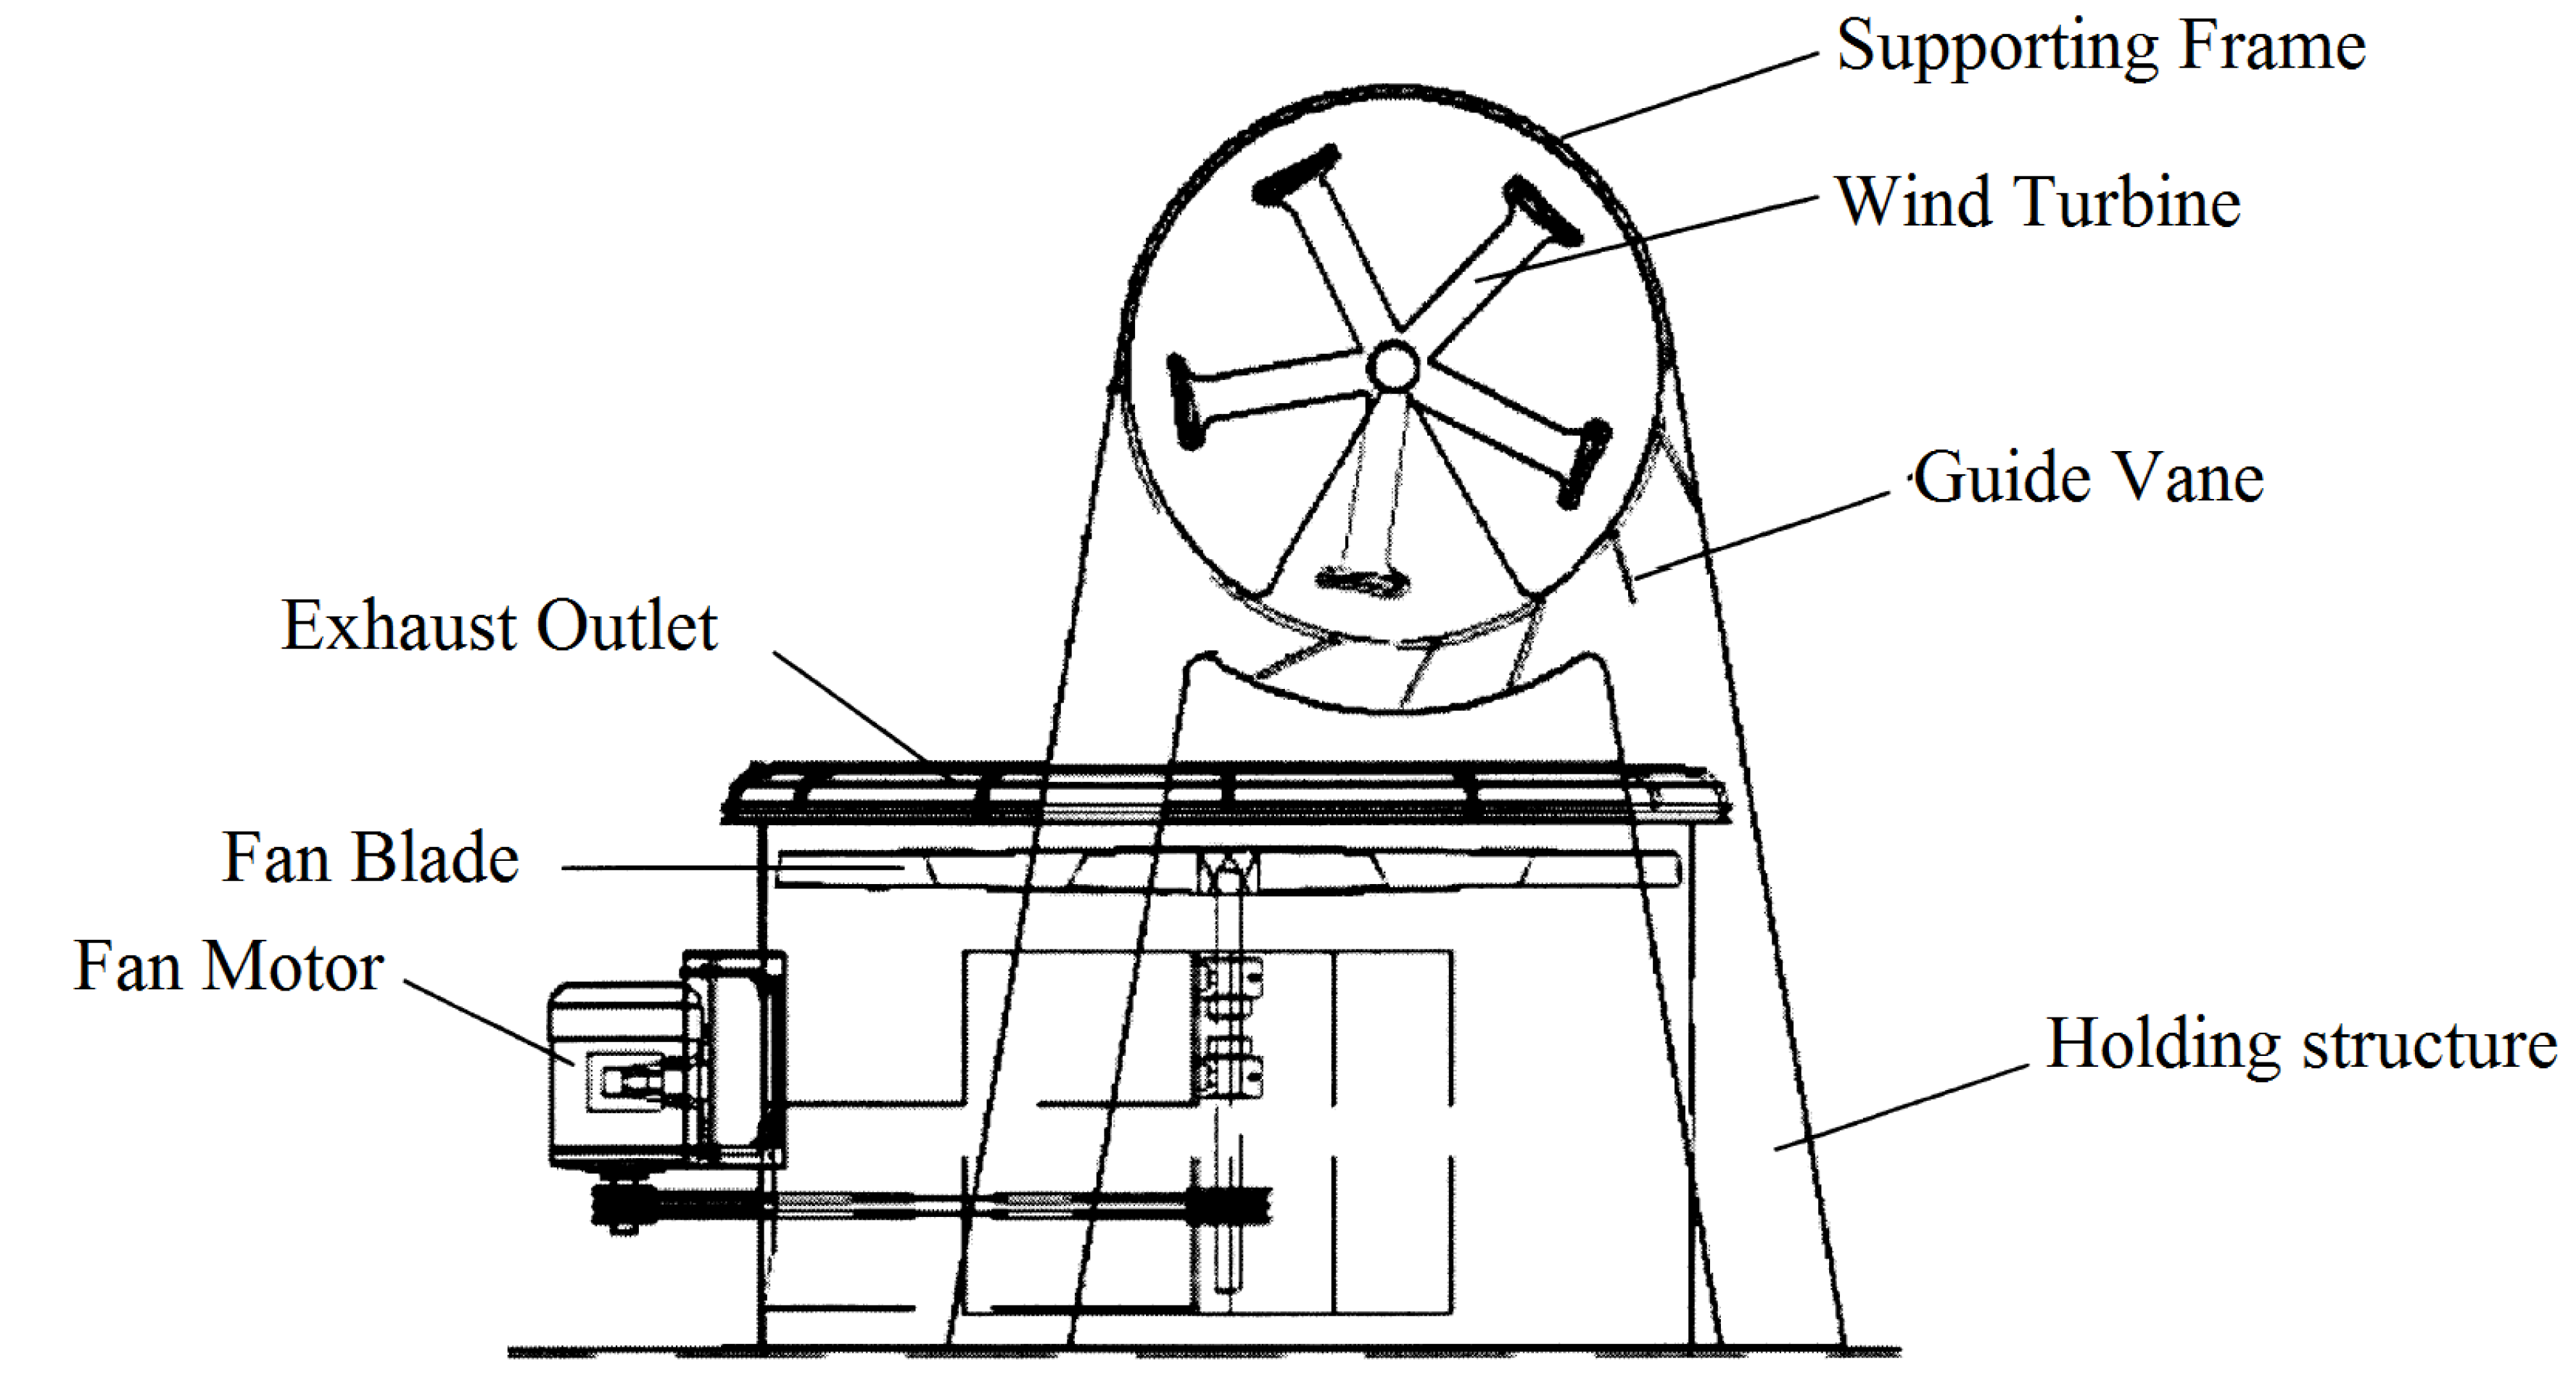
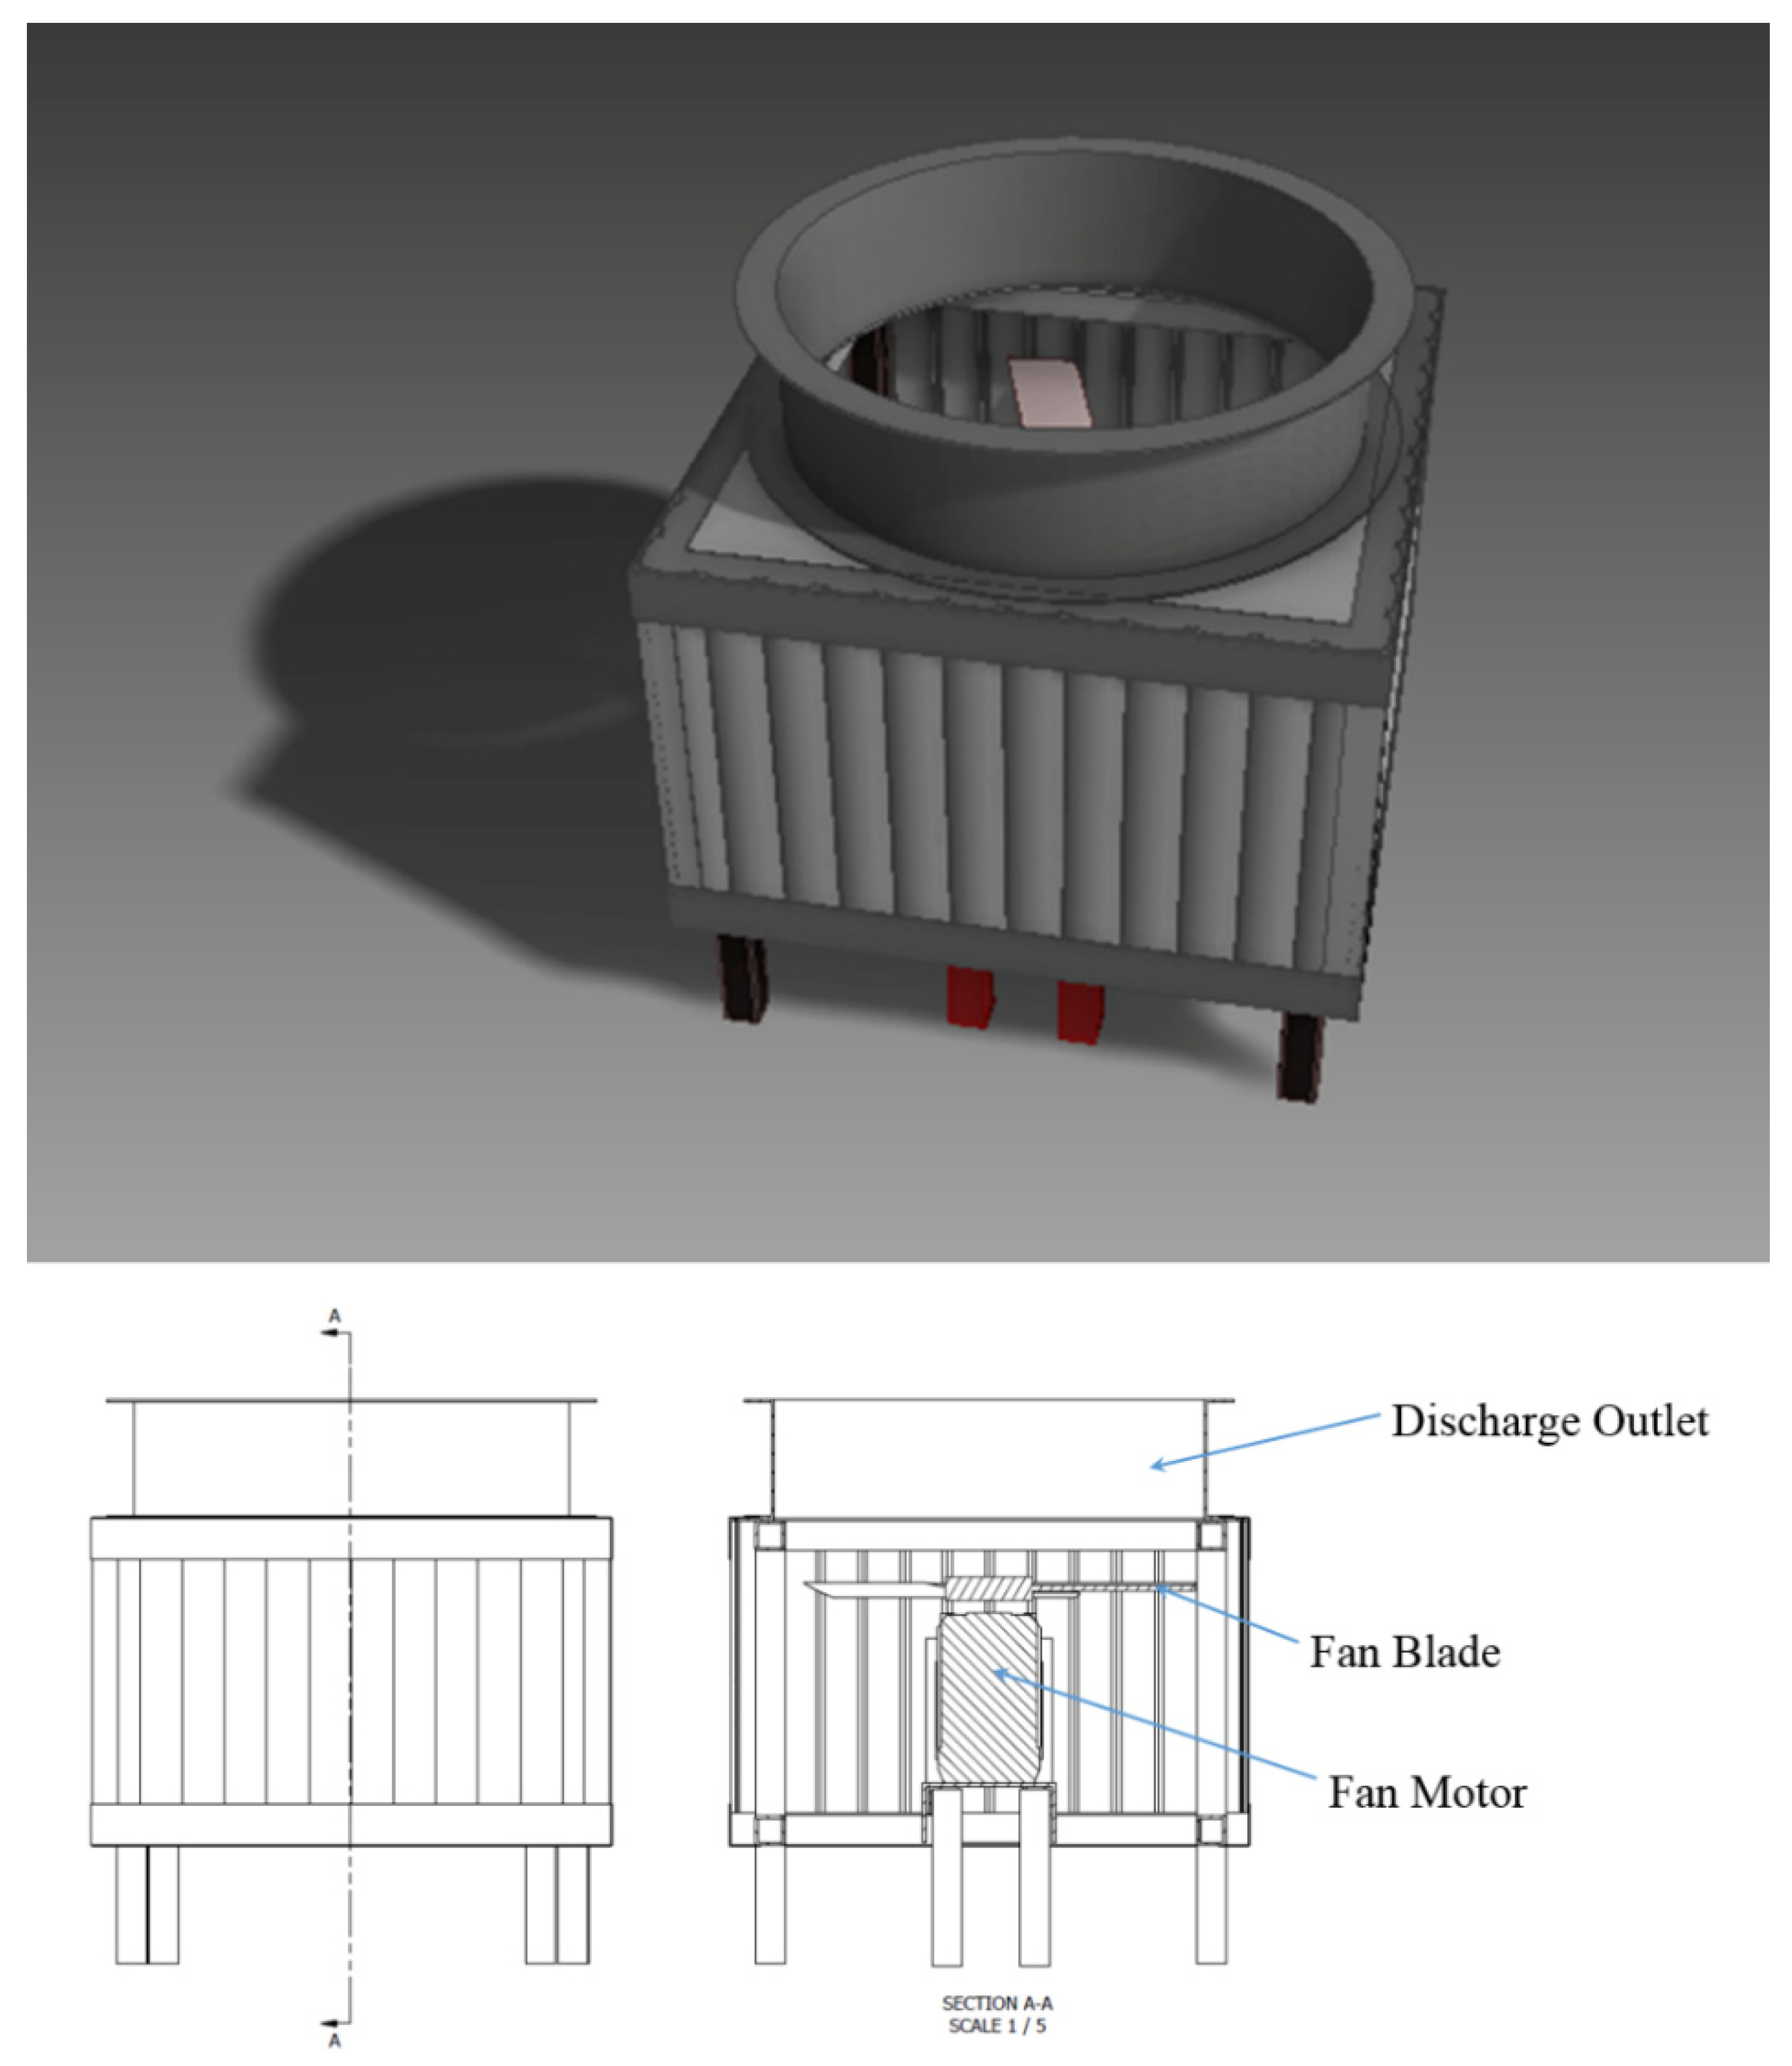
2. Design Description of the Novel Exhaust Air Energy Recovery Wind Turbine Generator

The exhaust air energy recovery turbine generator was filed as a patent in 2011 [16]. It is a system that reuses exhaust air from any exhaust outlet to generate electricity and/or mechanical power. The general arrangement of the system is depicted in Figure 1. The system comprises a turbine rotor assembly mounted on a supportive frame and is able to rotate about a horizontal shaft where the turbine rotor assembly is positioned. The turbine that is used in this system is a vertical axis wind turbine (VAWT), but operated in cross-wind orientation. It could be any type of VAWT such as H-rotor, Darrieus, and Helical. More than one turbine can be utilized for this system, depending on the size of the exhaust air outlet and its matching to the wind turbine. Based on the patent description, there is at least one guide vane between the outlet and the turbine rotor assembly to direct the air flow towards the turbine rotor assembly at a predetermined angle.
Figure 1. General arrangement of the exhaust air energy recovery turbine generator, reprinted with permission from [16]. Copyright 2011 WIPO.
Energies 08 06566 g001
One of the most common exhaust air systems that can be found almost anywhere in the world is the cooling tower. A cooling tower is a heat removal device that transfers heat from a process system through an evaporation process whereby some of the water is evaporated into the moving air stream drawn by the cooling tower [17]. Cooling towers are commonly used to dissipate heat from water-cooled refrigeration, air-conditioning systems, and industrial process systems [18]. For an induced draft cooling tower, the normal discharged air velocity is about 9 m/s in order to sufficiently reject the heat to the environment [19]. Since there is a defined amount of discharged air flow from a cooling tower, VAWTs are mounted on top of the cooling tower to utilize the discharged air kinetic energy which is higher and more consistent compared to natural wind. The waste high speed exhaust air discharged from the cooling tower is harvested by positioning a wind turbine in the stream for energy recovery.

3. Methodology

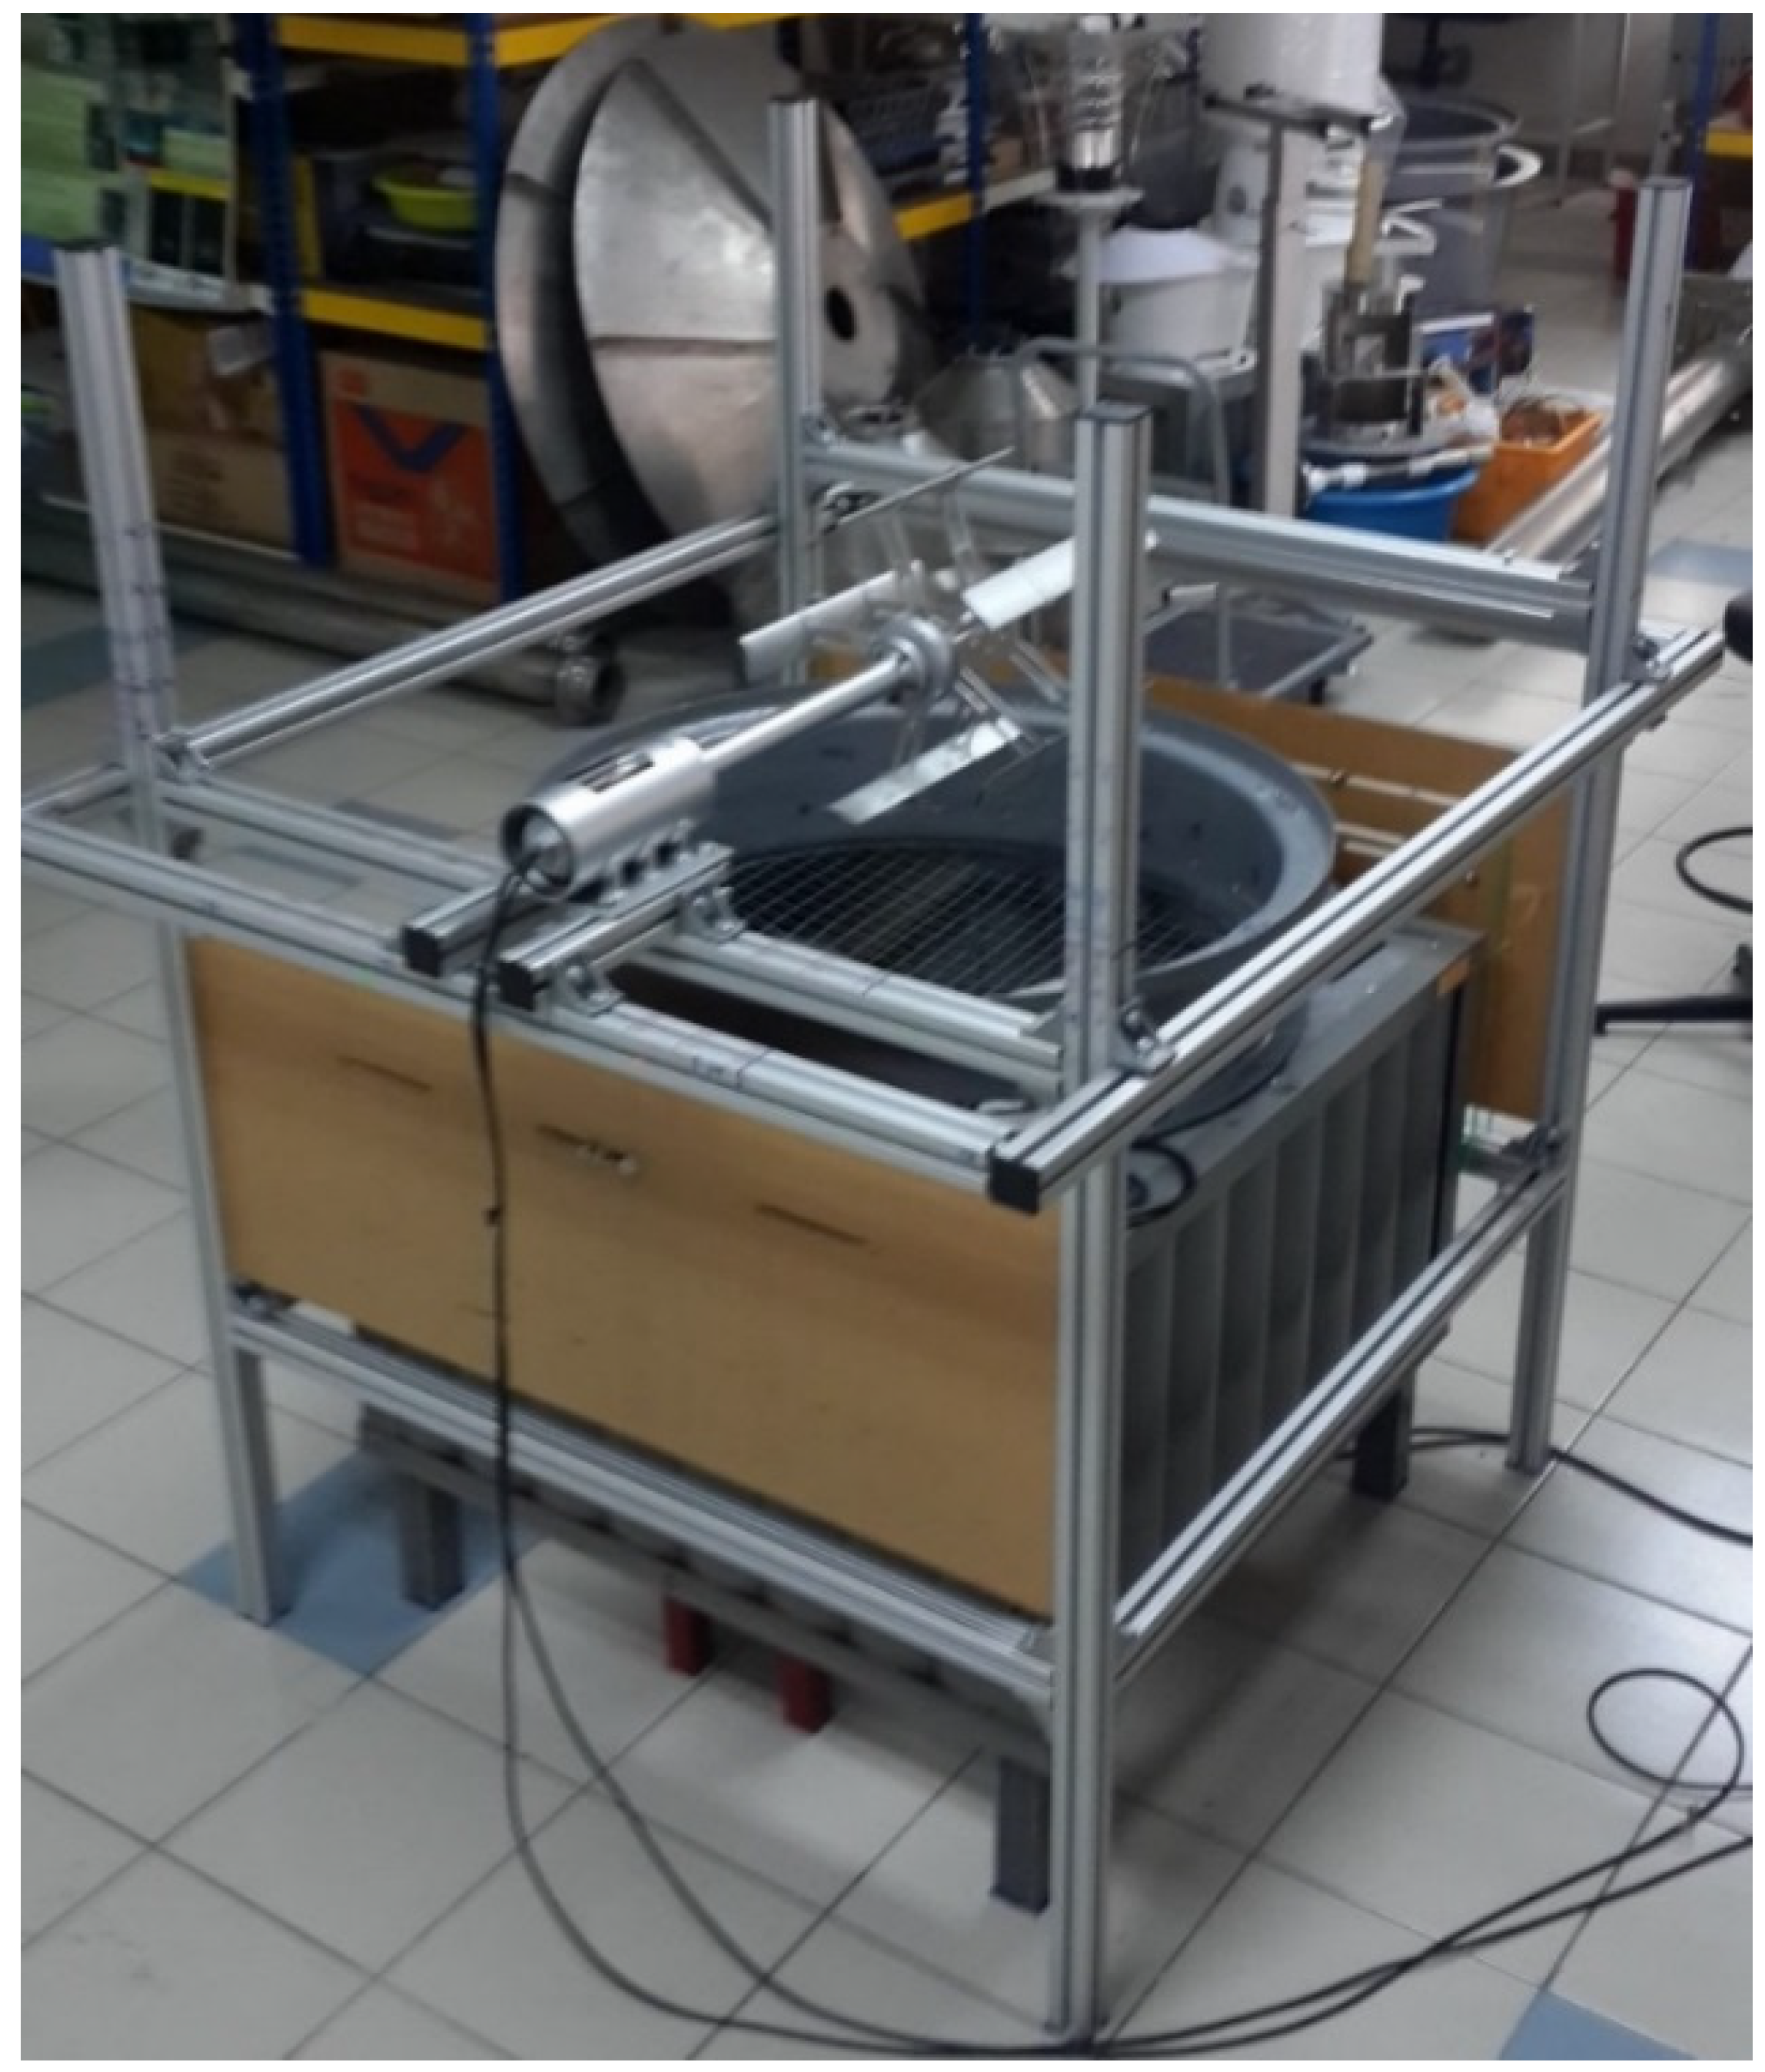
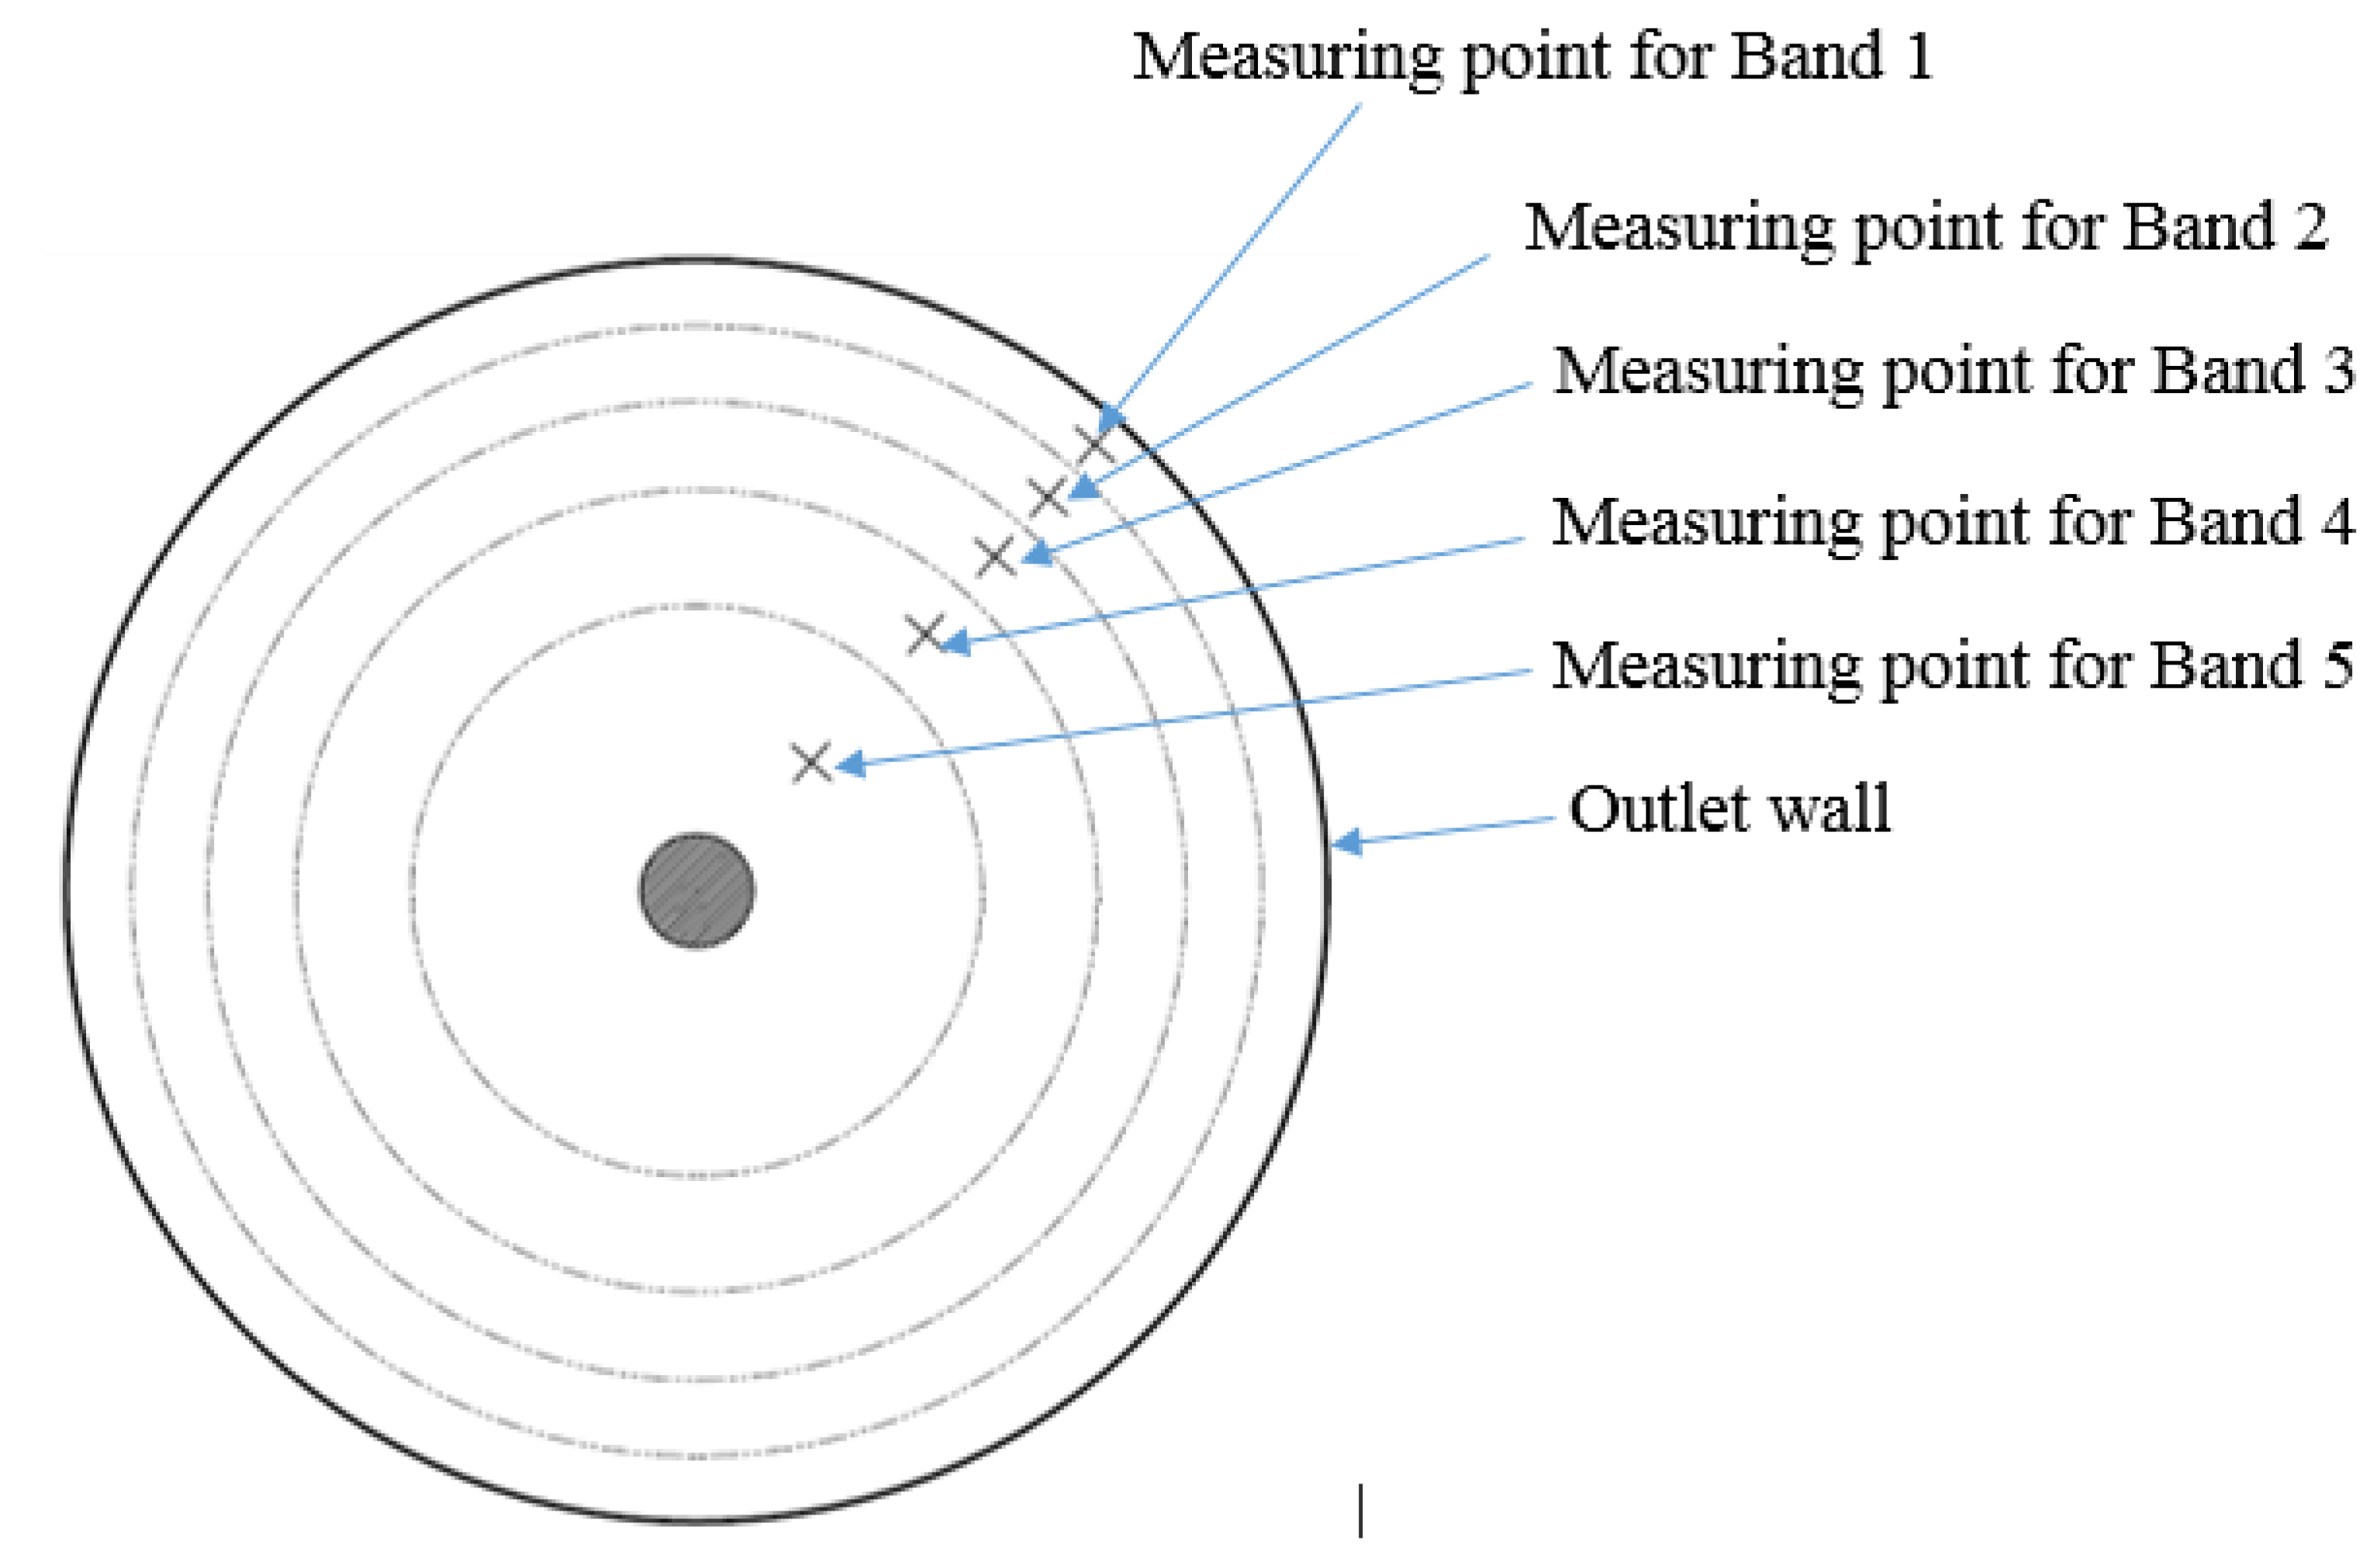
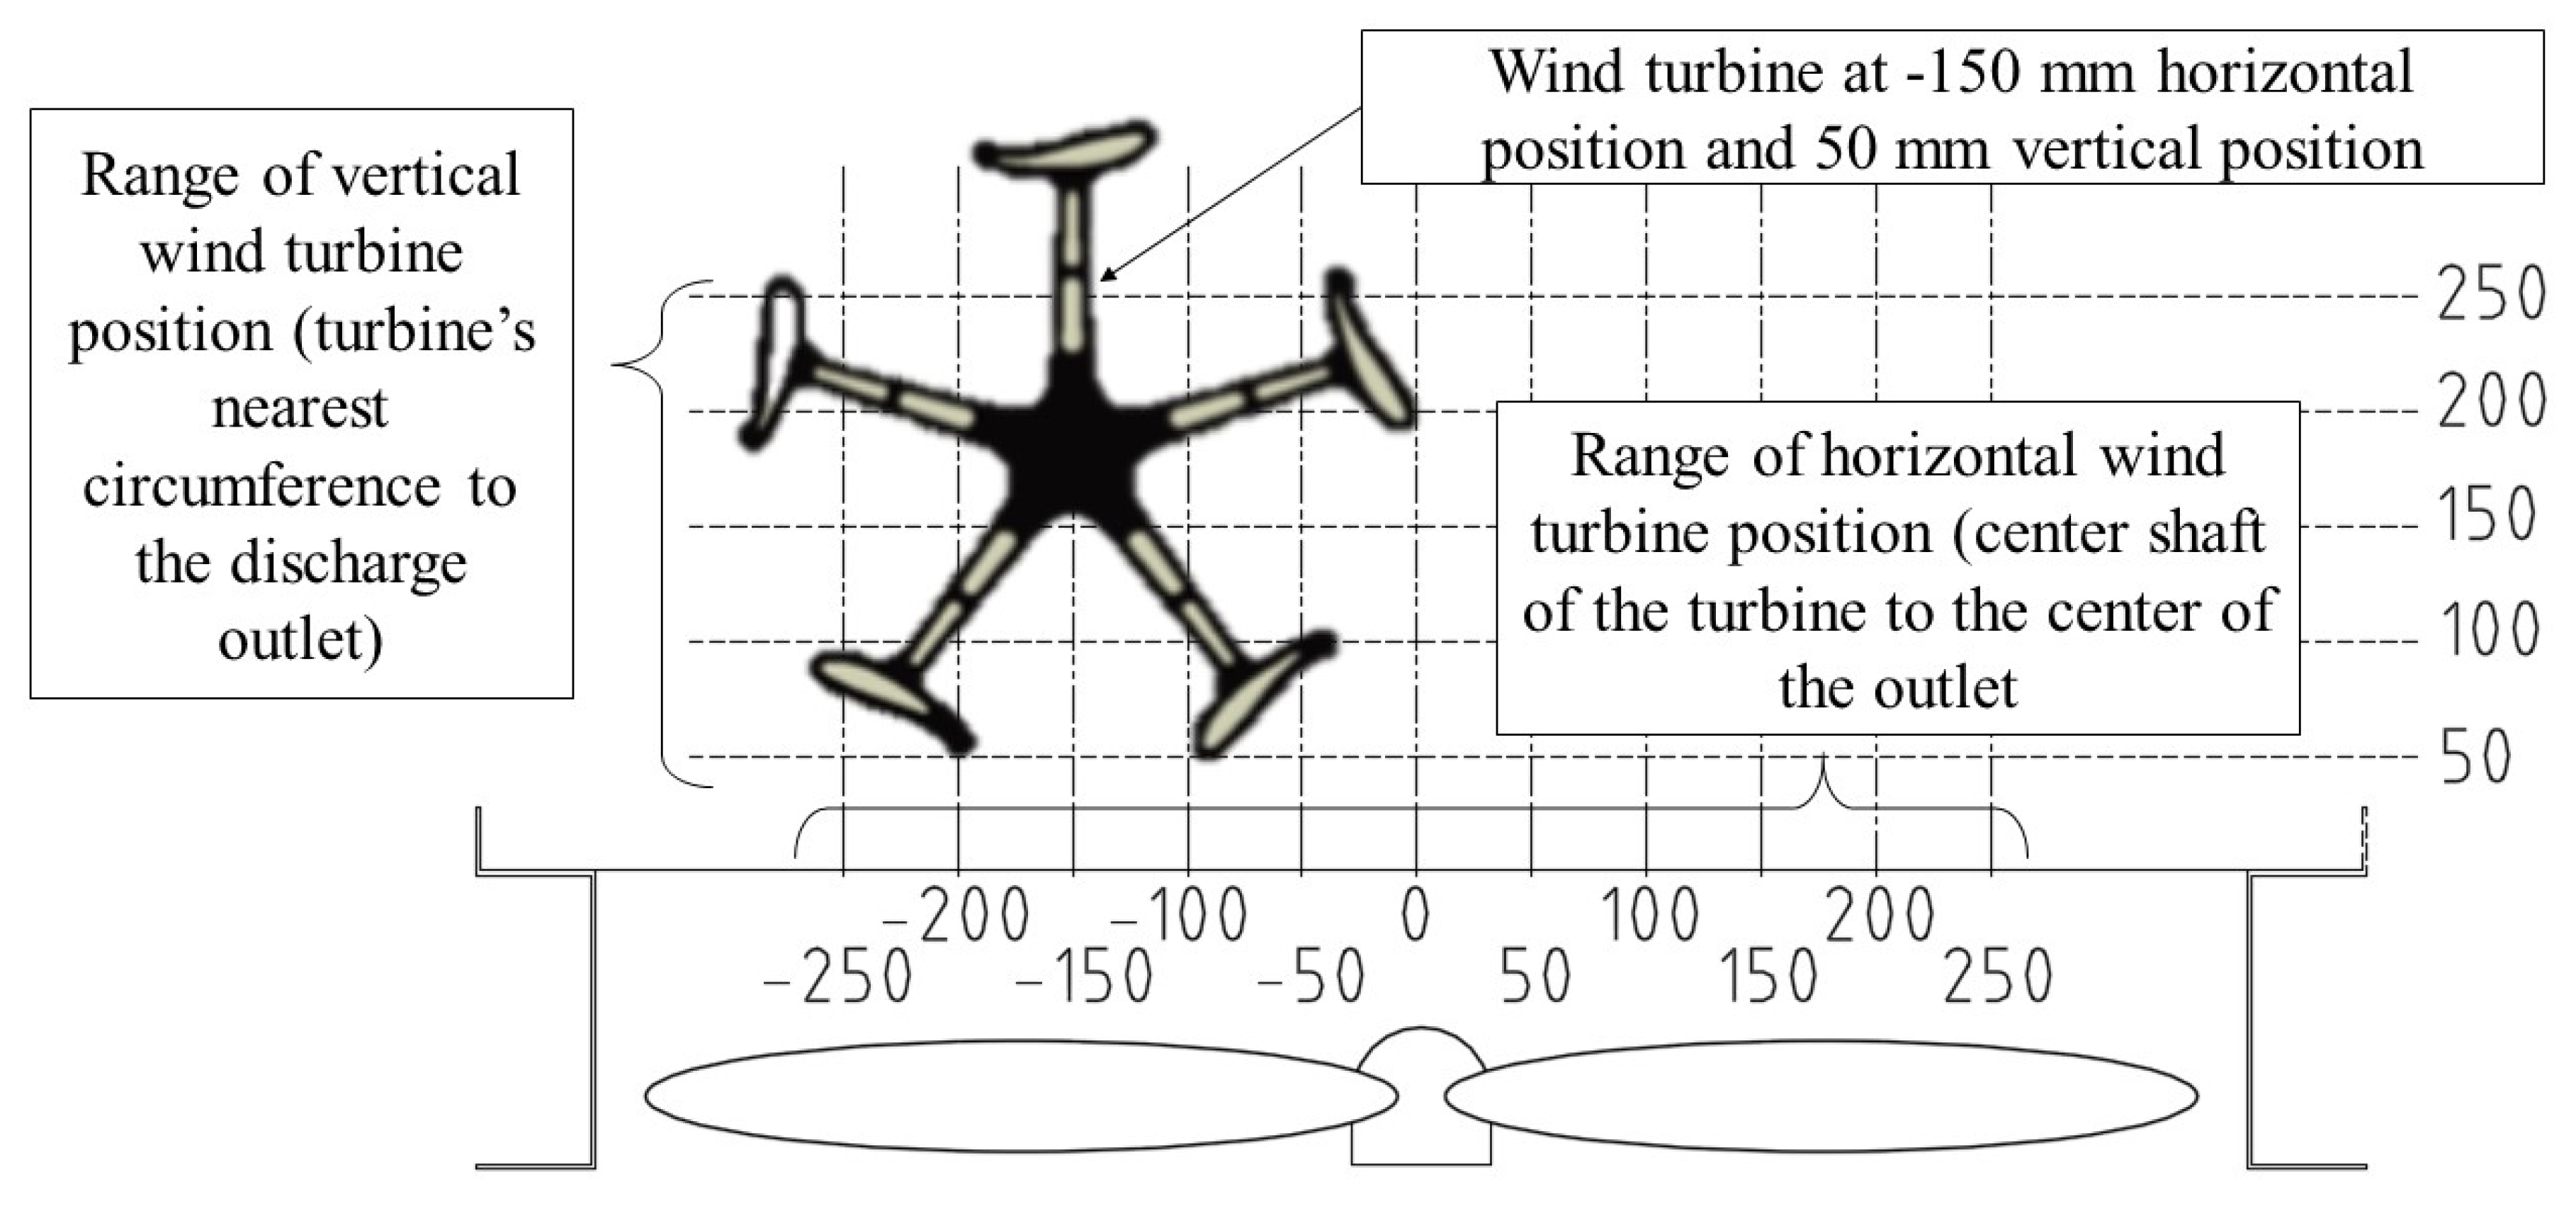
3.1. Experimental Setup

The purpose of this experiment was to determine the optimum position to place a wind turbine at the outlet of an exhaust air system. A scaled cooling tower model was fabricated to represent an exhaust air system. The model consists of a 5-bladed axial flow fan, the body, and an outlet duct which is similar to the common counter-flow cooling tower. This 780 mm diameter fan is powered by a 0.75 kW rated motor. Figure 2 illustrates several views of the cooling tower model. For the model, there are openings with 200 mm distance to the floor at all sides for the air inlet. The air is discharged through the cylindrical outlet duct with a diameter of 730 mm. The fan mechanism is inside the box of the cooling tower model (Figure 2).
Figure 2. Perspective, side, and cross-section view of the cooling tower model.
Energies 08 06566 g002
The bare cooling tower model performance is evaluated by the air flow rate and the power consumption by the fan motor. The air flow rate is obtained by multiplication of the average air velocity and area at the inlet of the model. The average inlet air velocity is calculated by averaging measured air velocities from all sides of the model. These measurements are conducted using a vane-type anemometer. Power consumption by the fan motor is measured using a power analyzer (Fluke 435 Series II). A suitable method for measuring air velocity of a circular duct is by dividing the area into several concentric parts of equal area with velocities taken at every quarter of the circle [20]. In order to determine the points for the measurement, the area of the discharge outlet is divided into five equal concentric areas and the radius to the center of each area is obtained. Each of these concentric areas is named as a band where the bands are numbered as shown in Figure 3. These discharge velocities are plotted onto a graph to determine the discharge air distribution profile. The performance of the bare cooling tower model is the benchmark for the entire experiment.
Figure 3. Measuring points for each band at the discharge outlet.
Energies 08 06566 g003
For the case of a cooling tower with turbine, a supporting frame for the wind turbine and controller was constructed as shown in Figure 4. To determine the optimum wind turbine position at the outlet of the cooling tower, several positions were set and the wind turbine performance as well as the cooling tower model airflow performance collected at all positions. Taking the center of the turbine as a reference, the turbine position was vertically varied from 200 mm to 400 mm range to the cooling tower discharge outlet. For horizontal position variation, the center of the discharge outlet (also the center of the fan) was taken as the reference. The turbine was moved in the range −250 mm to 250 mm with a distance of every position of 50 mm. Figure 5 illustrates the wind turbine position setting.
The wind turbine performance was logged using the controller system. The parameters recorded are the rotational speed, voltage, current, and electrical power. All the parameters taken from the bare cooling tower model were also recorded for the cooling tower with the wind turbine at the outlet. This was to compare the cooling tower performance between all configurations. The outlet air velocity measurement was to determine the outlet air flow rate and wind velocity profile.
Figure 4. Test rig, consisting of cooling tower model, wind turbine, generator, and supporting frame.
Energies 08 06566 g004
Figure 5. Horizontal and vertical range for turbine positioning experiment.
Energies 08 06566 g005

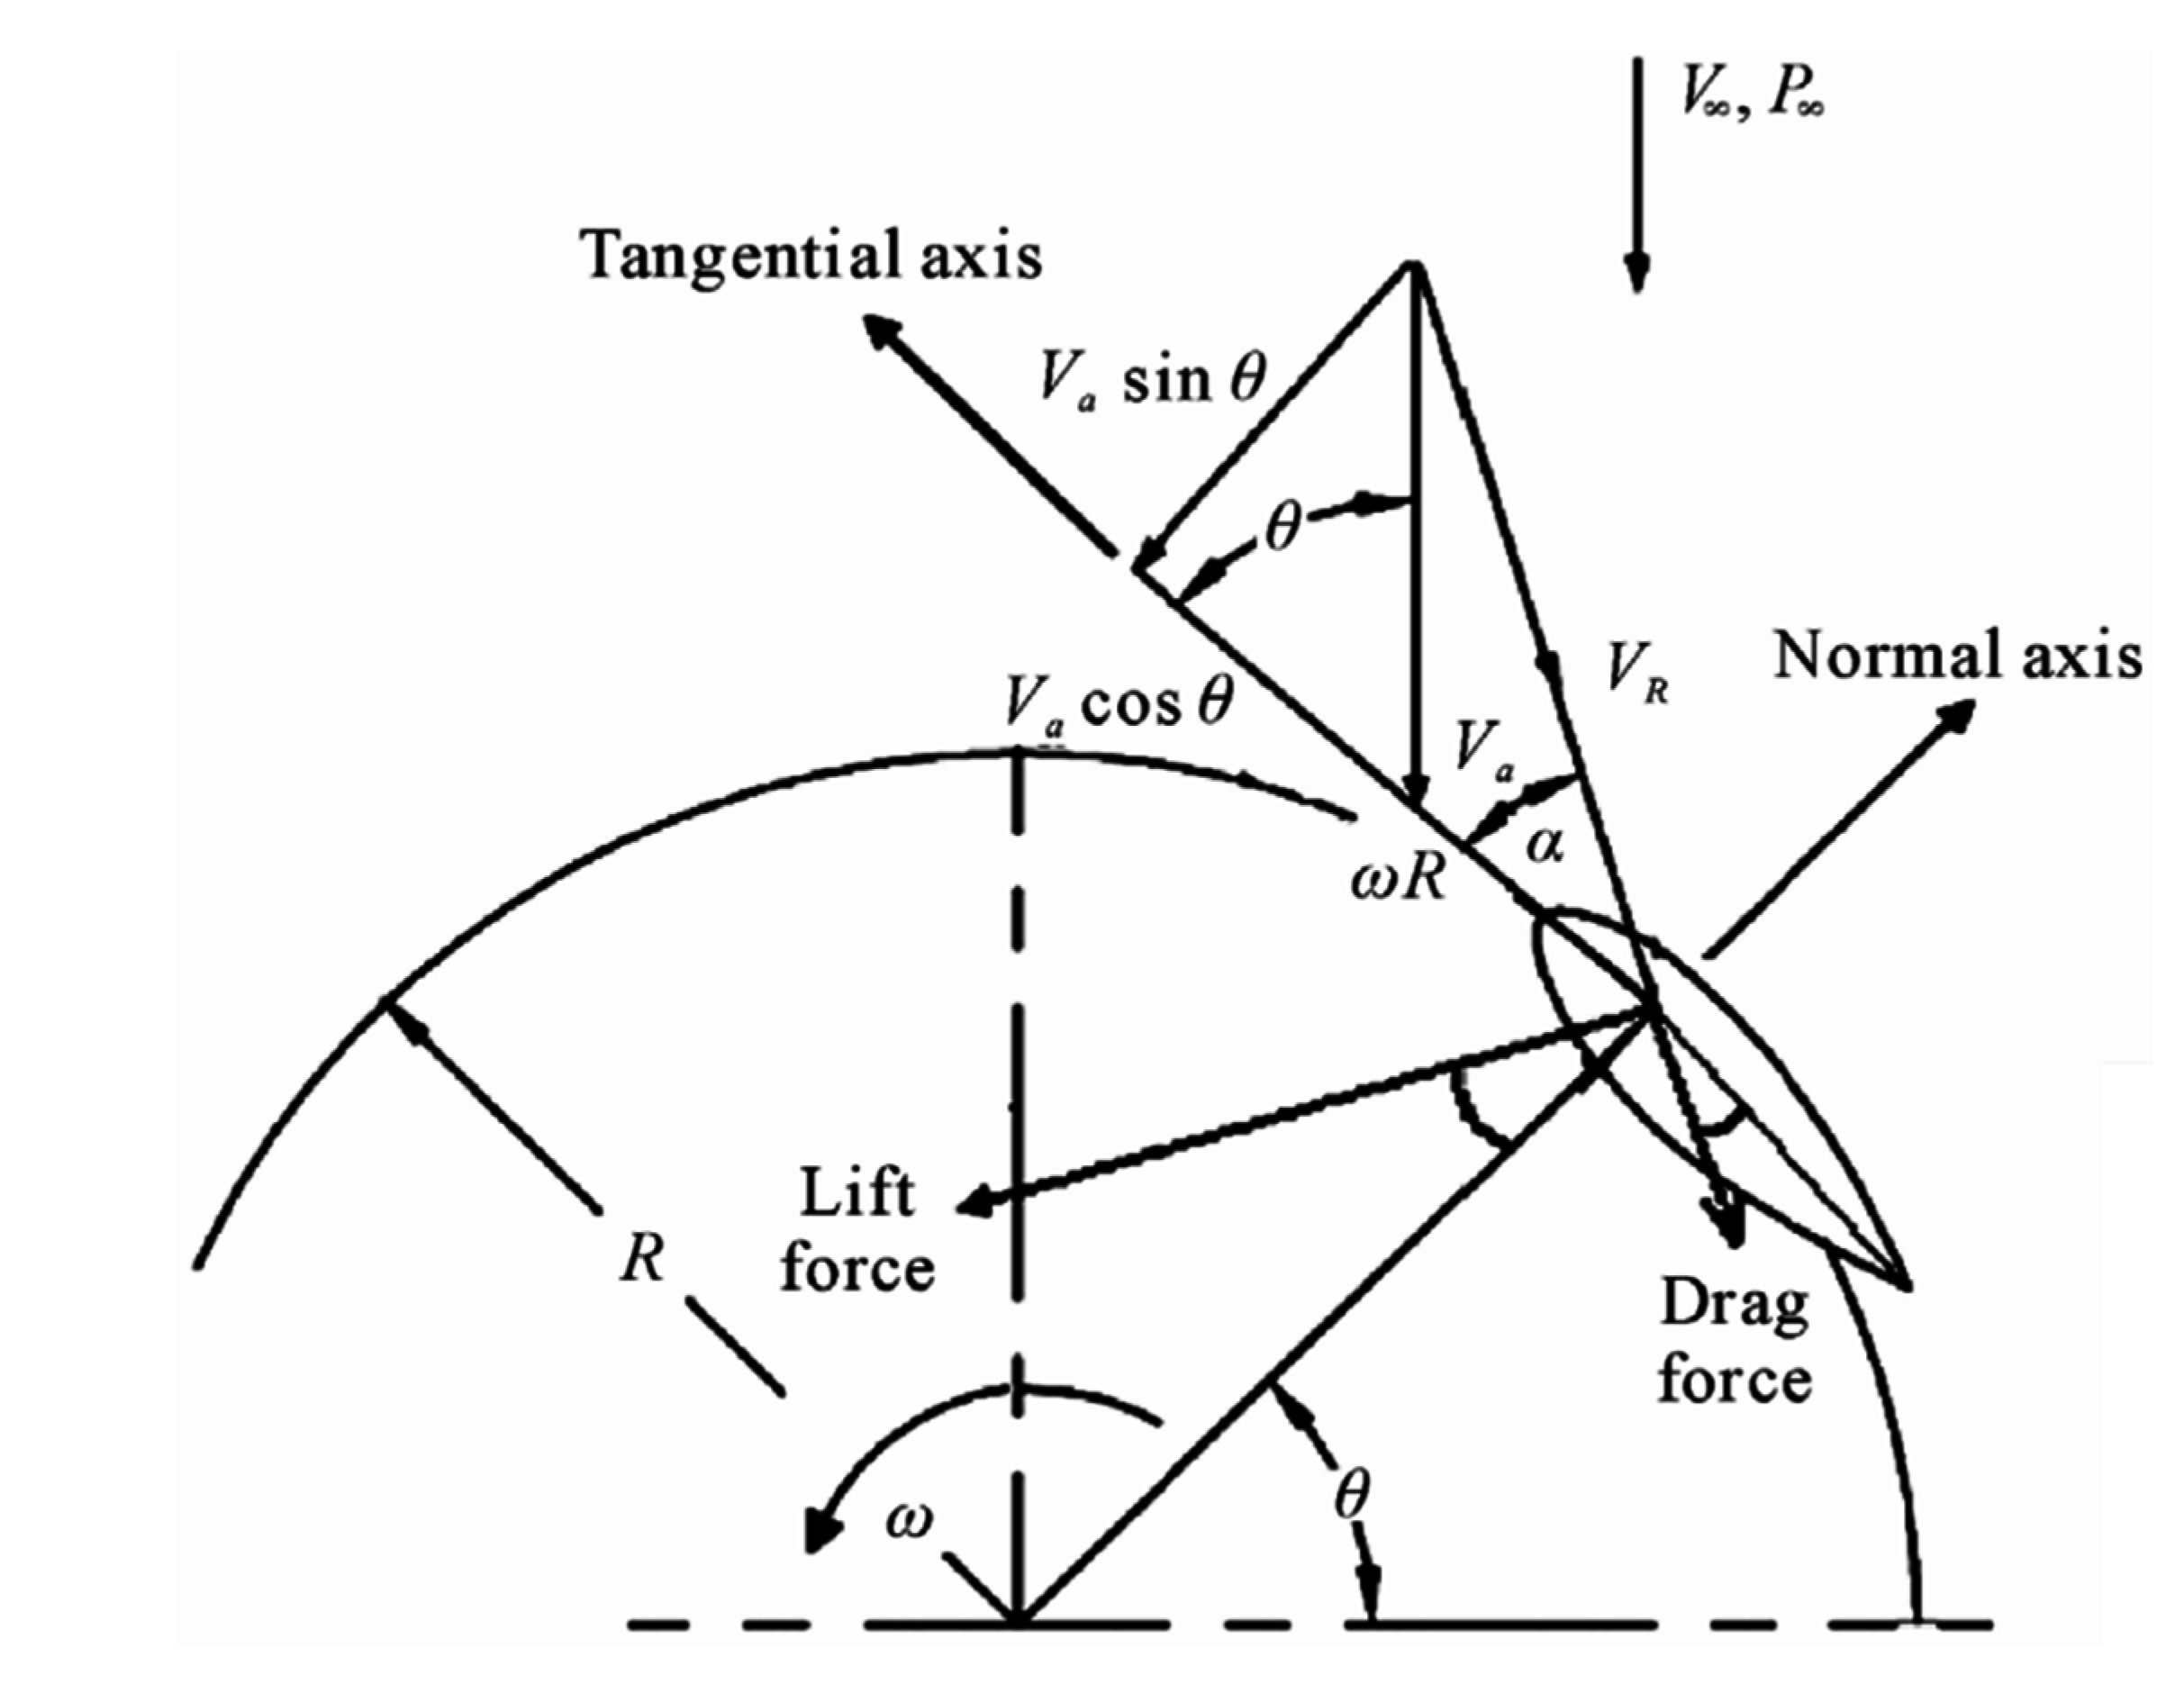
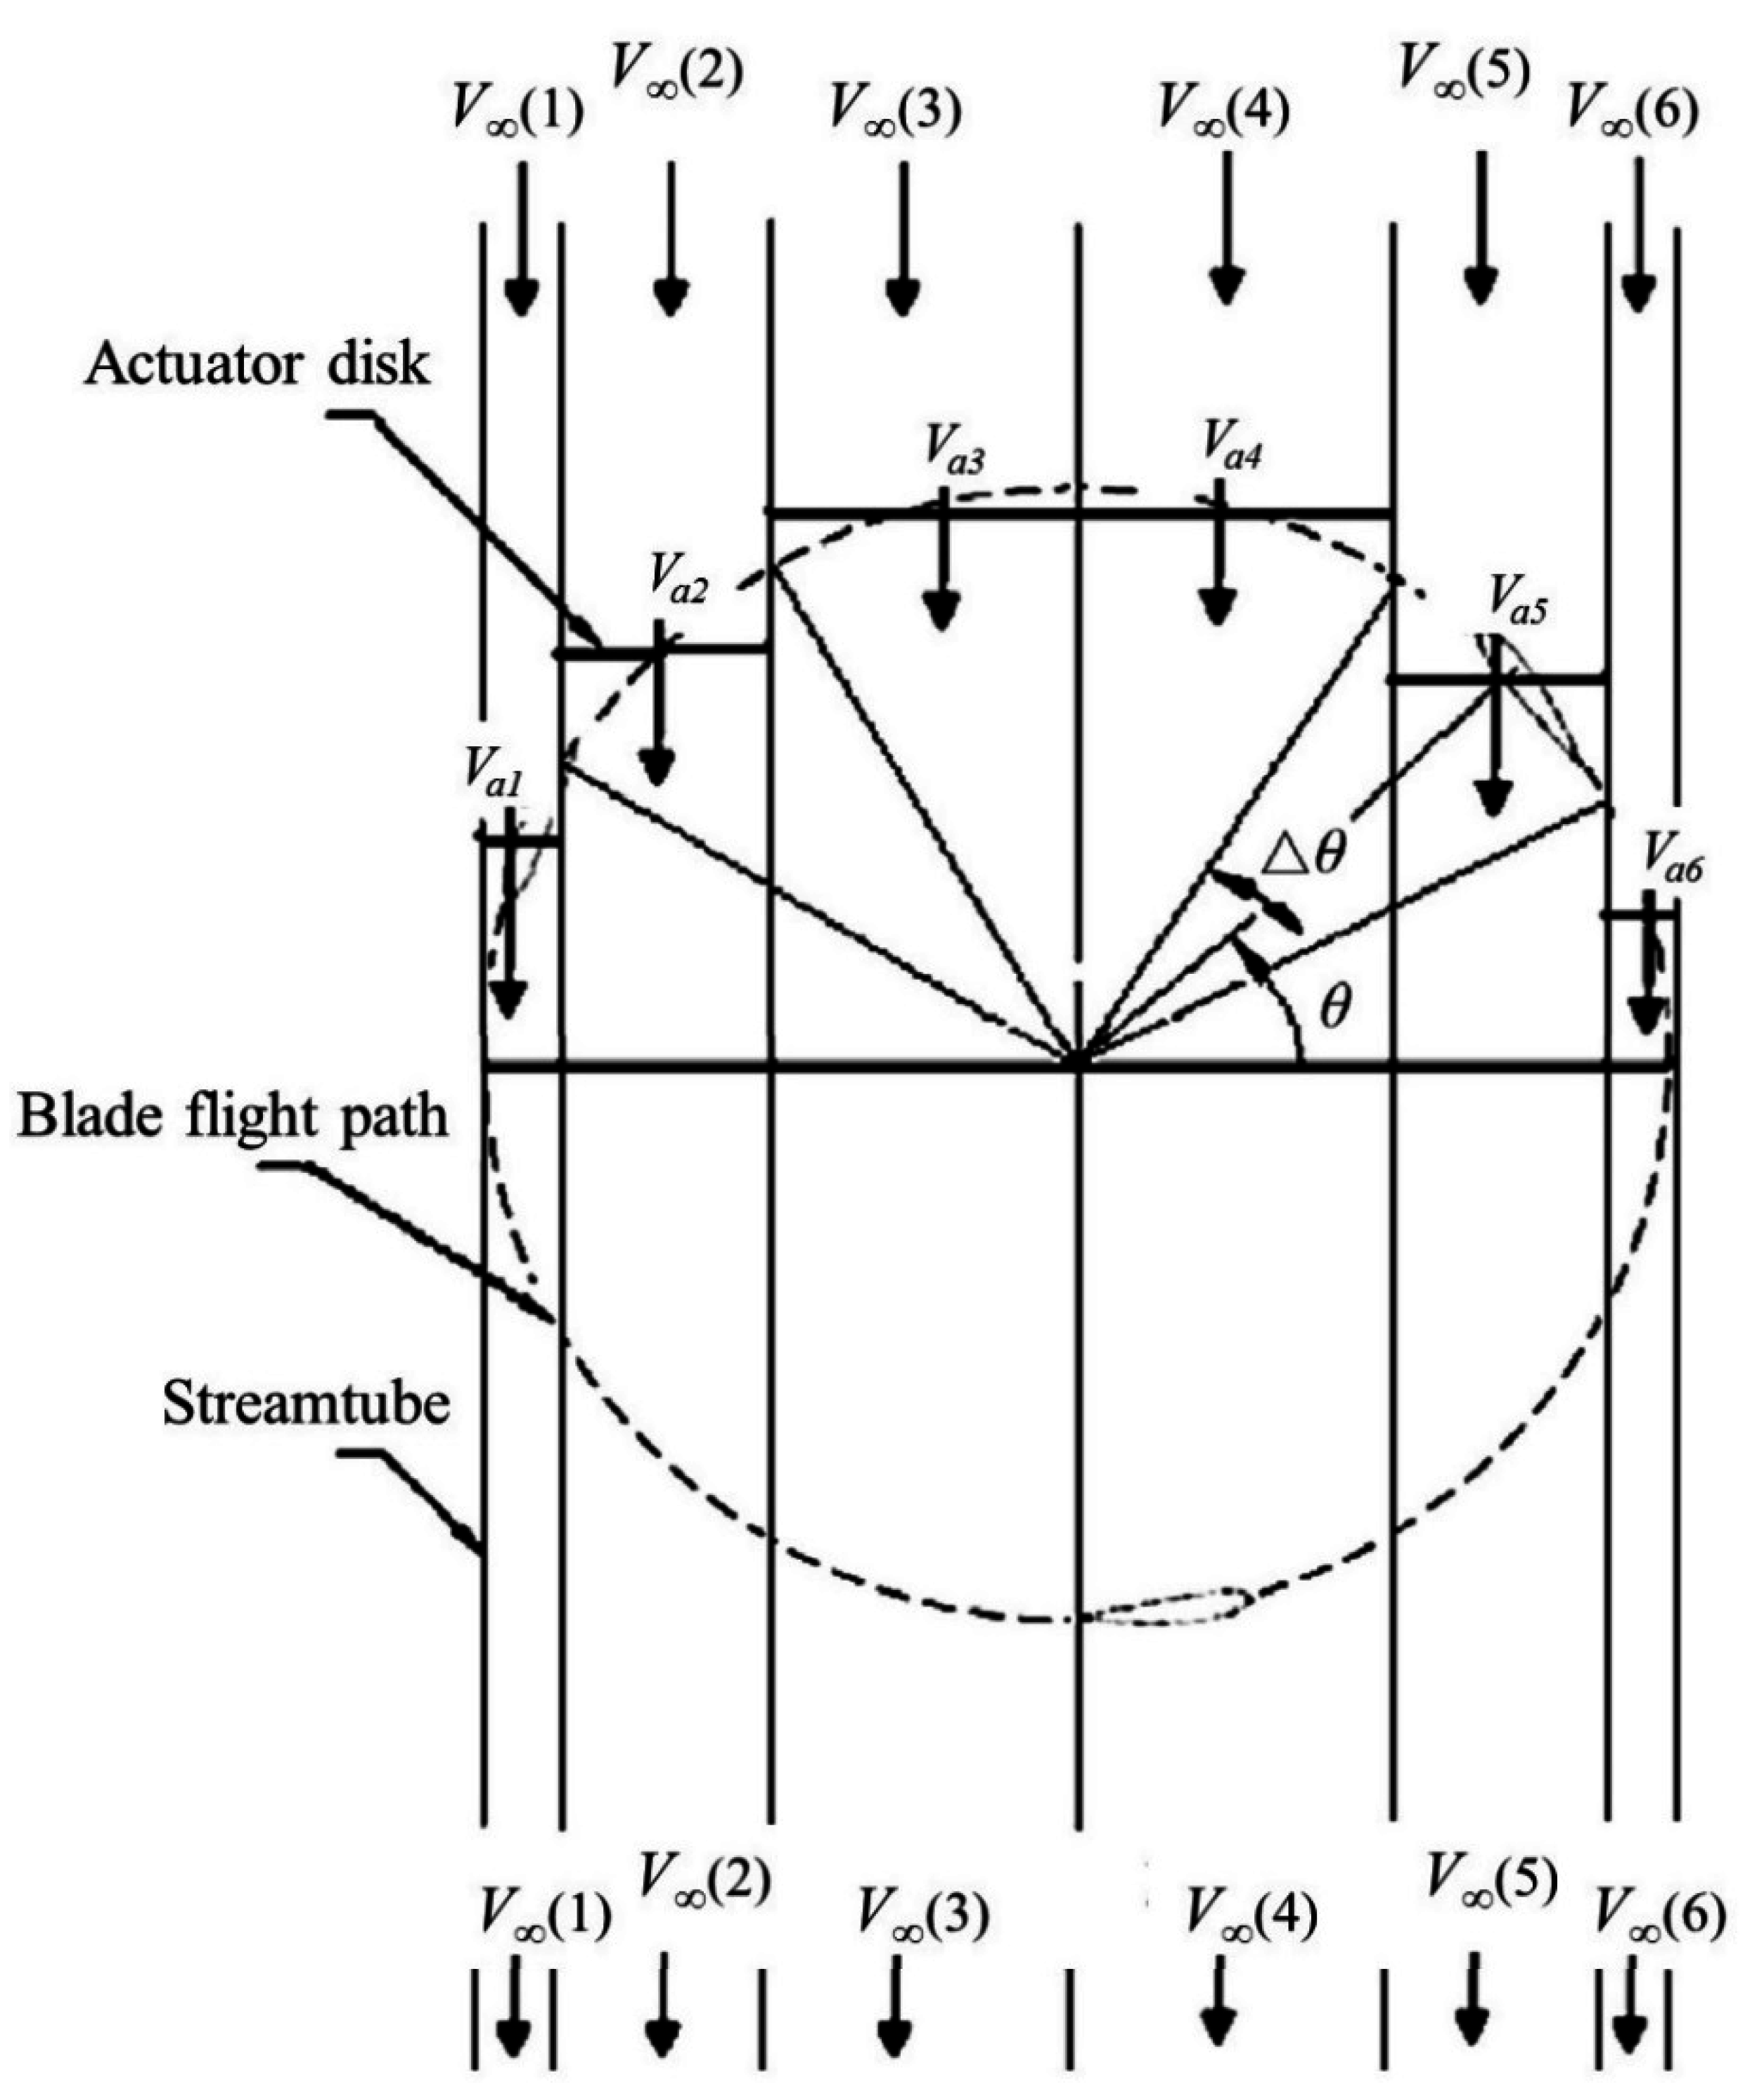
3.2. Double Multiple Stream Tube Theory

The air that is blown from a fan produces a non-uniform wind velocity profile. To explain the aerodynamic behavior, double multiple stream tube (DMST) theory was used for the analysis. The DMST theory is introduced by Paraschiviou based on the blade element momentum model by Betz (1926) [21]. The general expressions for the analysis on the turbine airfoil blade refer to Figure 6.
Figure 6. Airfoil velocity and force diagram, reprinted with permission from [22]. Copyright 2011 Scientific Research.
Energies 08 06566 g006
From the Figure, θ represents the azimuth angle, ω is the rotational velocity in rad/s, α is the angle of attack, Va is the induced velocity, VR is the relative velocity component, and R is the radius of the turbine. The symbol a represent the axial induction factor where the induced velocity is the reduced velocity from the free-stream approaching the turbine blade with the formula Va = V (1 − a). Subscript represents the free stream condition. The derived expressions are as below:
α = tan 1 [ ( 1 a ) sin θ ( 1 a ) cos θ + T S R ]
C n = C L cos α + C D sin α
C t = C L sin α C D cos α
T i = 1 2 ρ V R 2 ( h c ) ( C t cos θ C n sin θ )
Q i = 1 2 ρ V R 2 ( h c ) C T R
where α is the angle of attack, ρ is the density of air, h is the blade height, c is the blade chord length, Ti is the instantaneous thrust force and Qi is the instantaneous torque. TSR is the tip speed ratio which represents the ratio between the tangential speed of the tip of a blade and the free-stream wind velocity (TSR = ωR/V). CL and CD are the lift coefficient and drag coefficient respectively.
In the DMST model, the calculation is done separately for the upstream and downstream half cycles of the turbine. At each level of the rotor, the induced velocities at upstream and downstream are obtained using the principle of two actuator discs in tandem. Figure 7 depicts the schematic of the DMST. It considers the swept volume of the turbine as a series of adjacent stream tubes with variation of induced velocity in the vertical direction and the stream tubes are extracted into upstream and downstream half cycles. The induced velocities for the upstream and downstream are differentiated by the subscripts au and ad respectively. Ve represents the equilibrium velocity between upstream and downstream.
Figure 7. Principle of multiple stream tube model with 6 stream tubes divided by uniform angle Δθ, reprinted with permission from [22]. Copyright 2011 Scientific Research.
Energies 08 06566 g007
The turbine interactions with the wind in the upwind and downwind, passes the blades separately. The assumption was made that the wake from the upwind pass is fully expanded and the ultimate wake velocity has been reached before the interaction with the blades in the downwind pass. The downwind blades therefore see a reduced “free-stream” velocity. This approach more accurately represents the variation in flow through the turbine. Each stream tube in the DMST model intersects the airfoil path twice; once on the upwind pass, and again on the downwind pass. At these intersections we imagine the turbine replaced by a tandem pair of actuator discs, upon which the flow may exert a force. The DMST model simultaneously solves two equations for the stream-wise force at the actuator disk; one obtained by conservation of momentum and the other based on the aerodynamic coefficients of the airfoil (lift and drag) and the local wind velocity. These equations are solved twice; for the up-wind and for the downwind part of the rotor.
For the case of wind from an exhaust air outlet where the wind velocity profile is not uniform, different wind streams in each of the stream tubes are used in the DMST theory. This is a novel application of the theory. A semi-empirical approach is applied in this theoretical study where the parameter of wind velocities and rotor rotational speeds is taken from the experiment. In order to proceed for the computation of the performance of the turbine, the lift and drag coefficients of the airfoil section are needed. The data was obtained from the online airfoil database (Airfoil Investigation Database) at Reynolds number 25,000 [23]. However, the data is limited only to a small range of angle of attack since most of the airfoil studies are focused on aircraft wing application. To get a complete range of angle of attack (±180°), an extrapolation model developed by Montgomerie [24] was applied.
For the computations, the axial induction factor, a, was assumed as 1/3 at all conditions. The turbine was divided into 18 stream tubes (each of upwind and downwind) where the size of each tube was 10°. The velocity for each stream tube was taken based on the measured velocity profile at the outlet of the cooling tower model. The stream and induced velocity was assumed as perpendicular to the turbine swept plane and the effect of gravity was neglected.

4. Results and Discussions

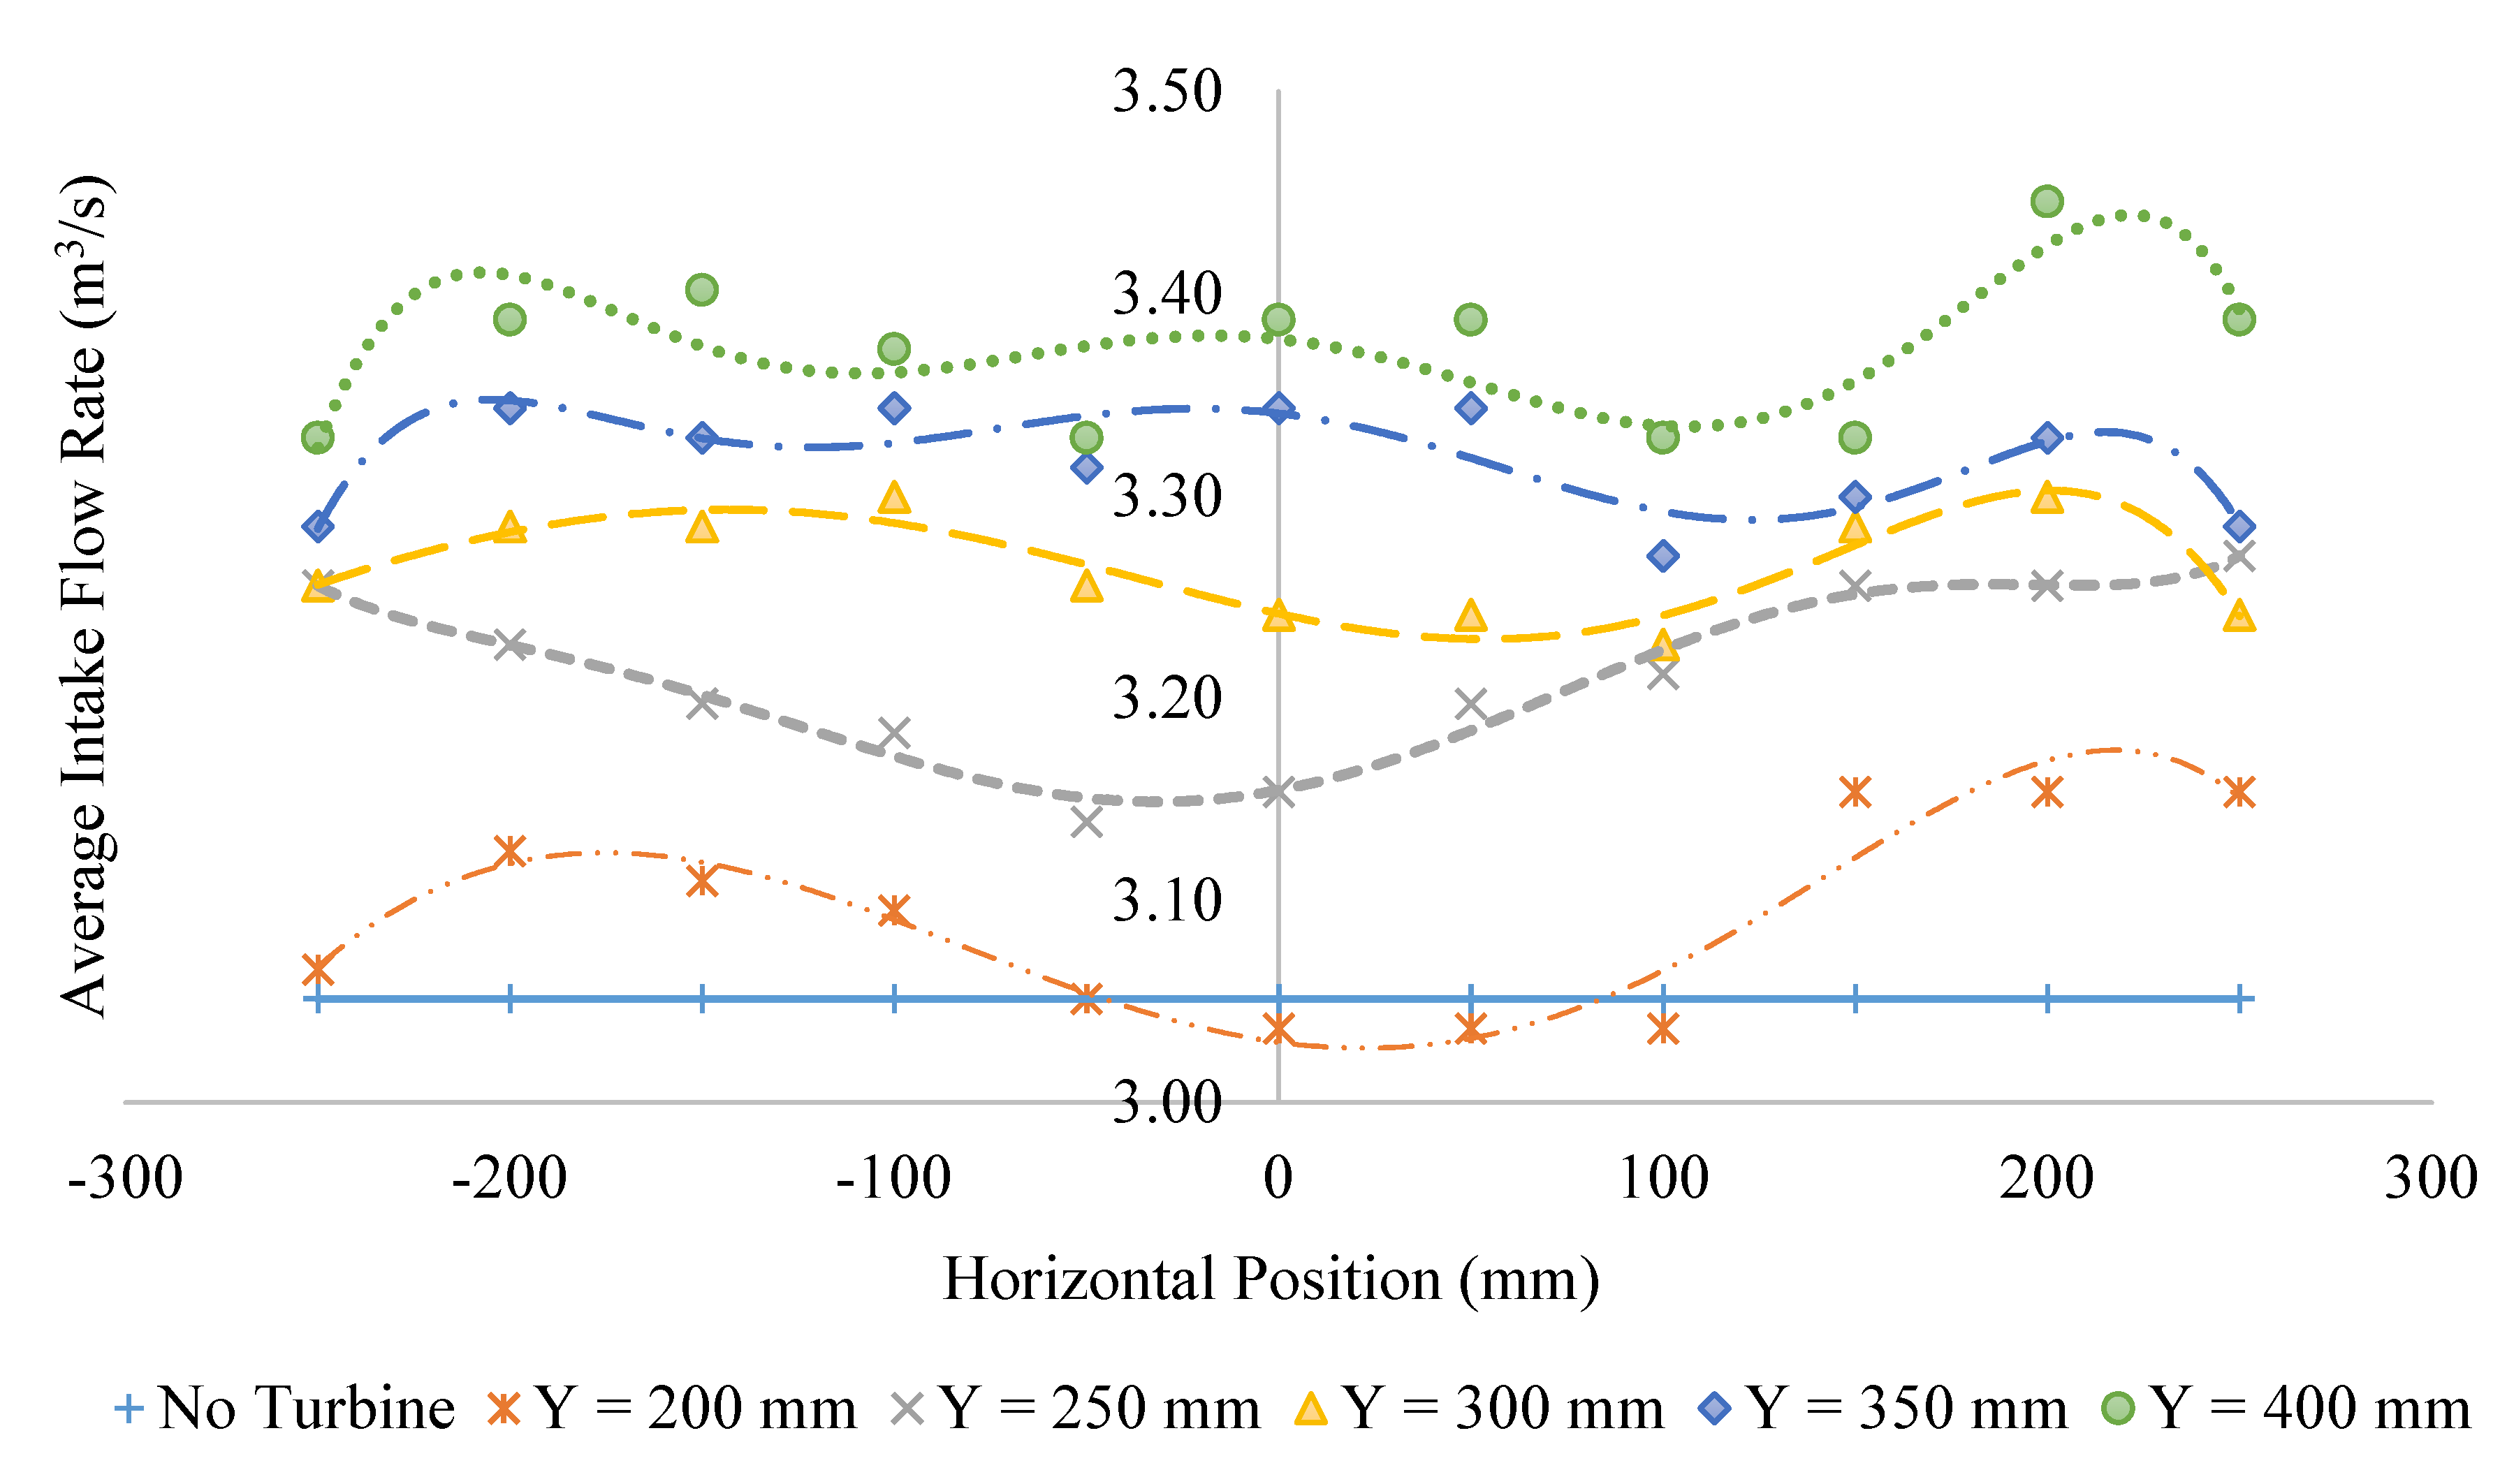
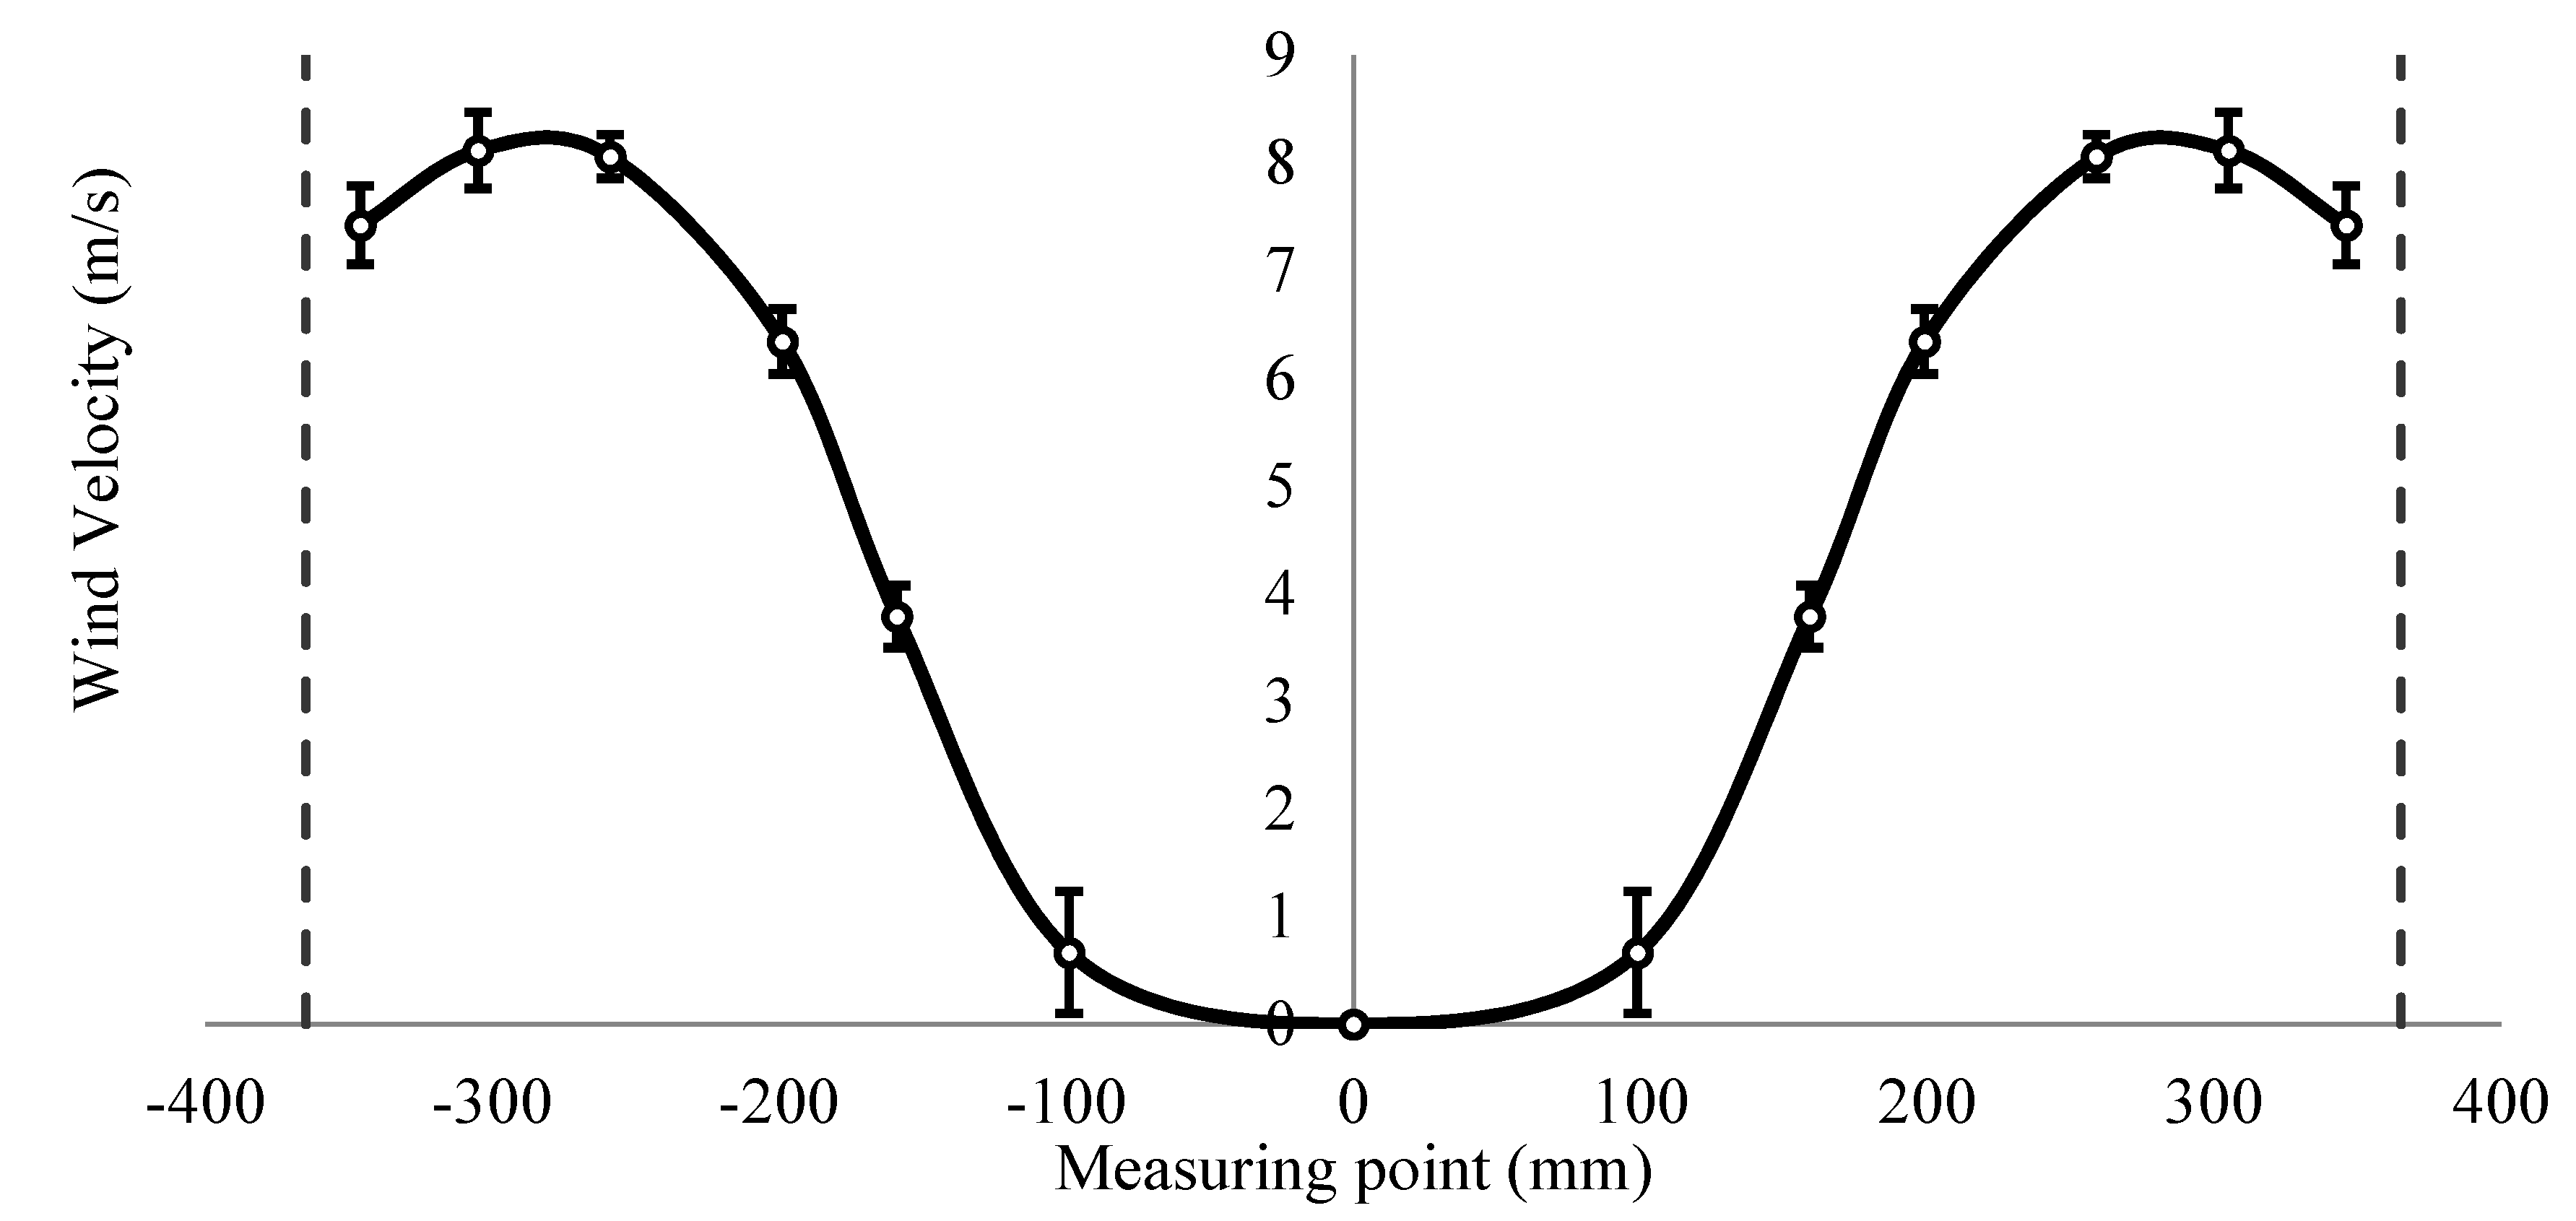
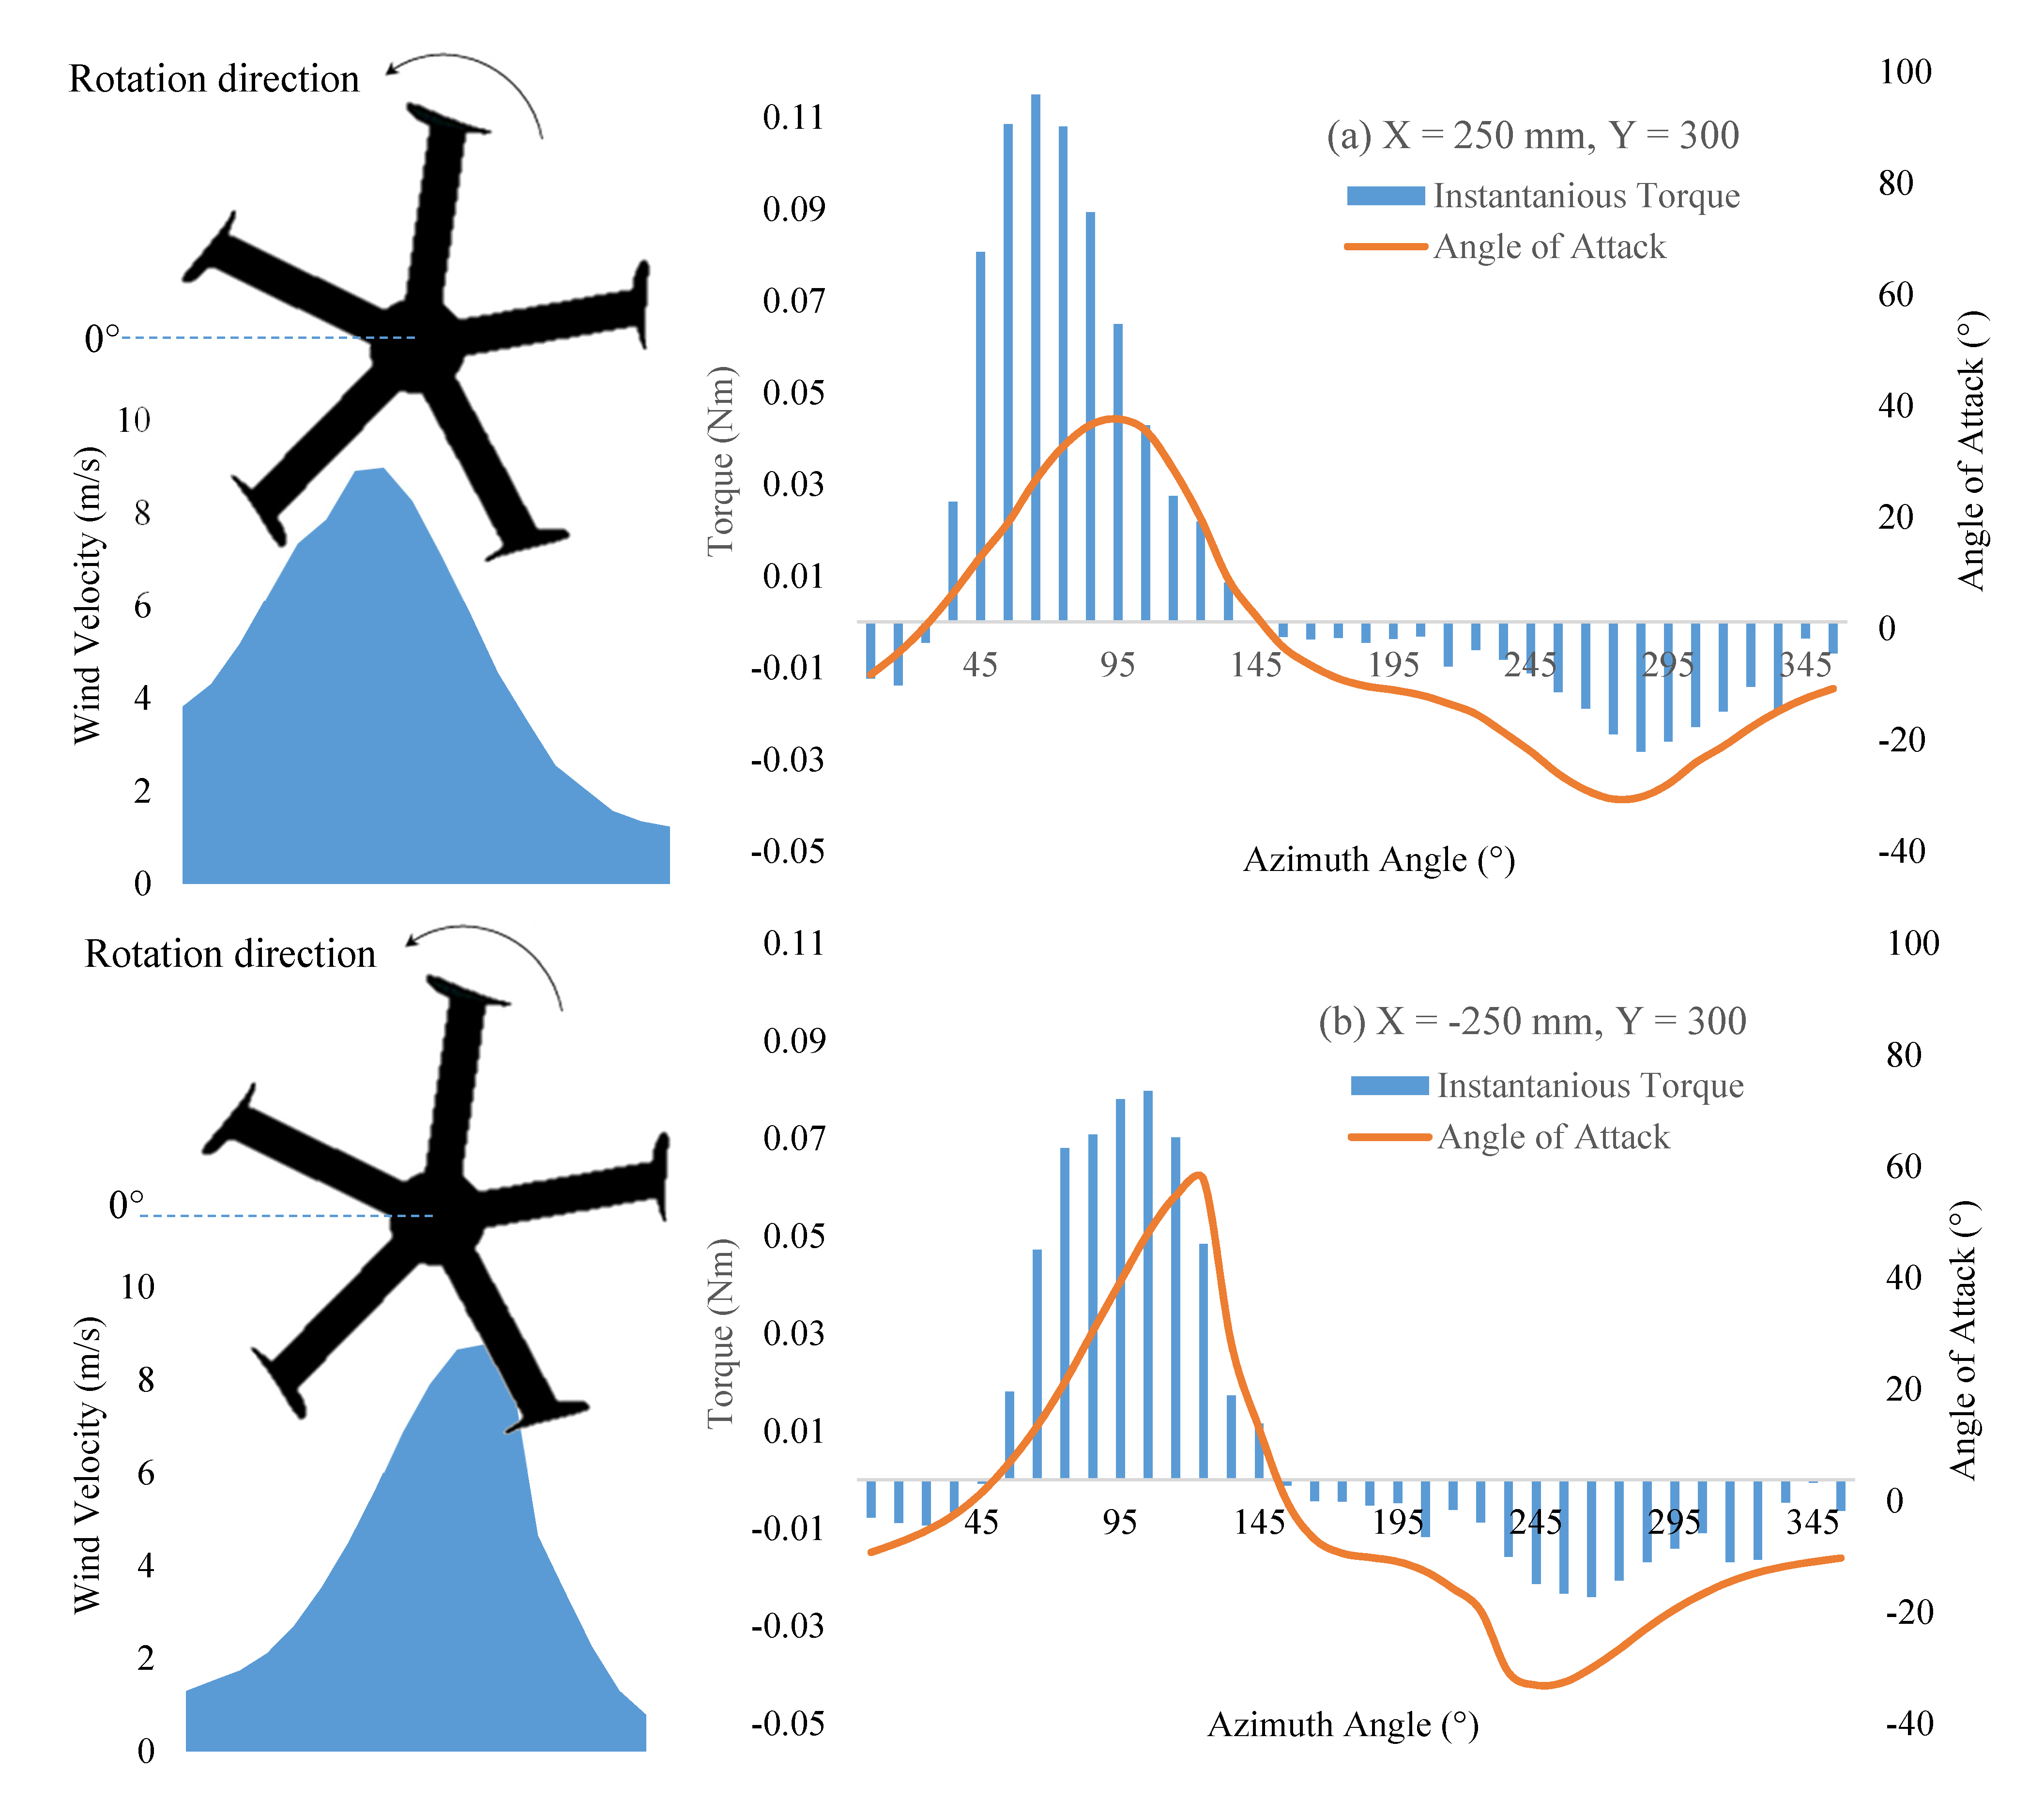
4.1. Velocity Profile

Different configurations of exhaust air systems produce different profiles of outlet wind. Thus, wind turbine matching has to be made according to wind velocity profile. The mean velocity profiles for all configurations (with and without turbine) are plotted in Figure 8. The radius of the fan duct is 365 mm which is represented by the dashed line and the wind velocity distribution is assumed as symmetrical with the center of the outlet as X = 0. Since there is a fan blade hub at the center of the outlet and the measured velocity is zero, the graph is assumed to cross the y-axis at 0 m/s. From the figure, the wind velocities gradually increase along the outlet radius until a maximum at about 300 mm distance to the center at the outlet before slightly decreasing close to the outlet wall. There is low error on the readings where the standard deviations are less than 0.6, and the highest standard deviation occurs close to the outlet center.
Figure 8. Mean wind velocity of at the outlet of the cooling tower model.
Energies 08 06566 g008

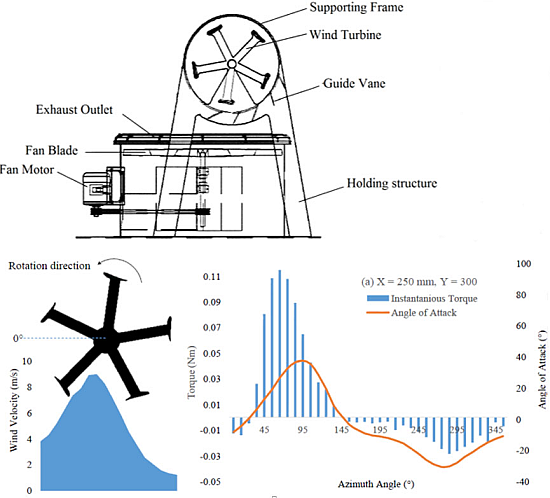
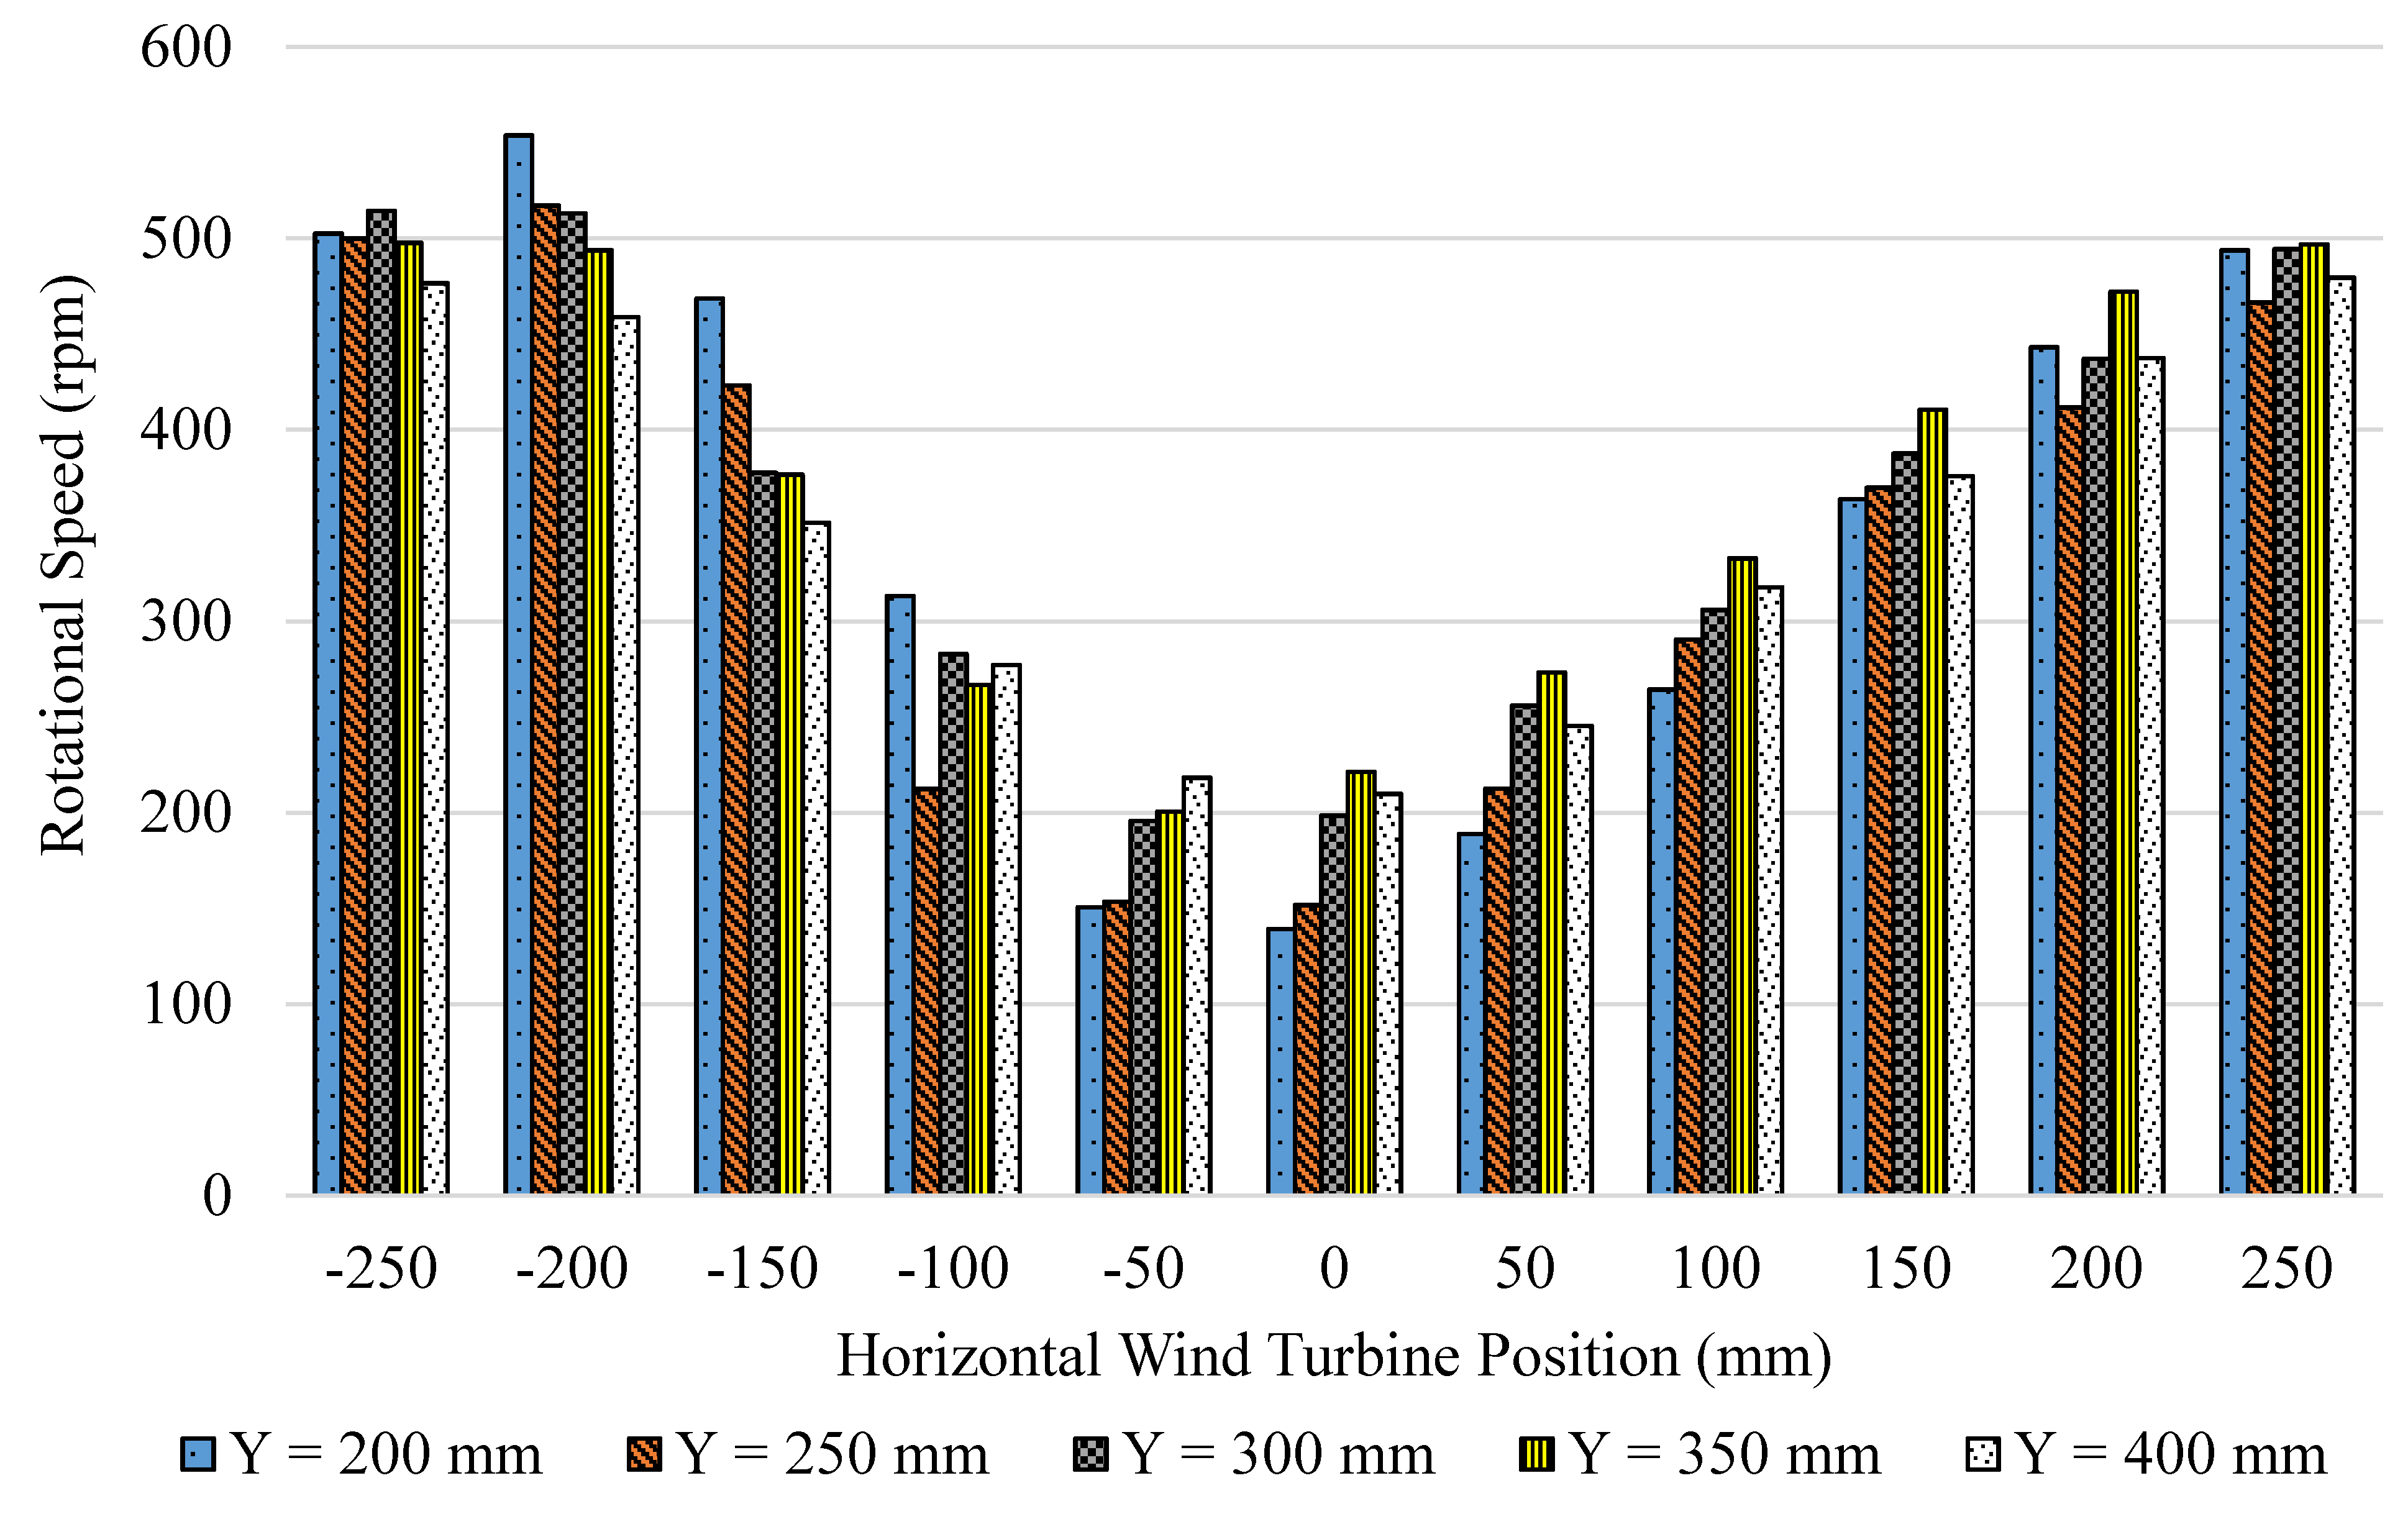
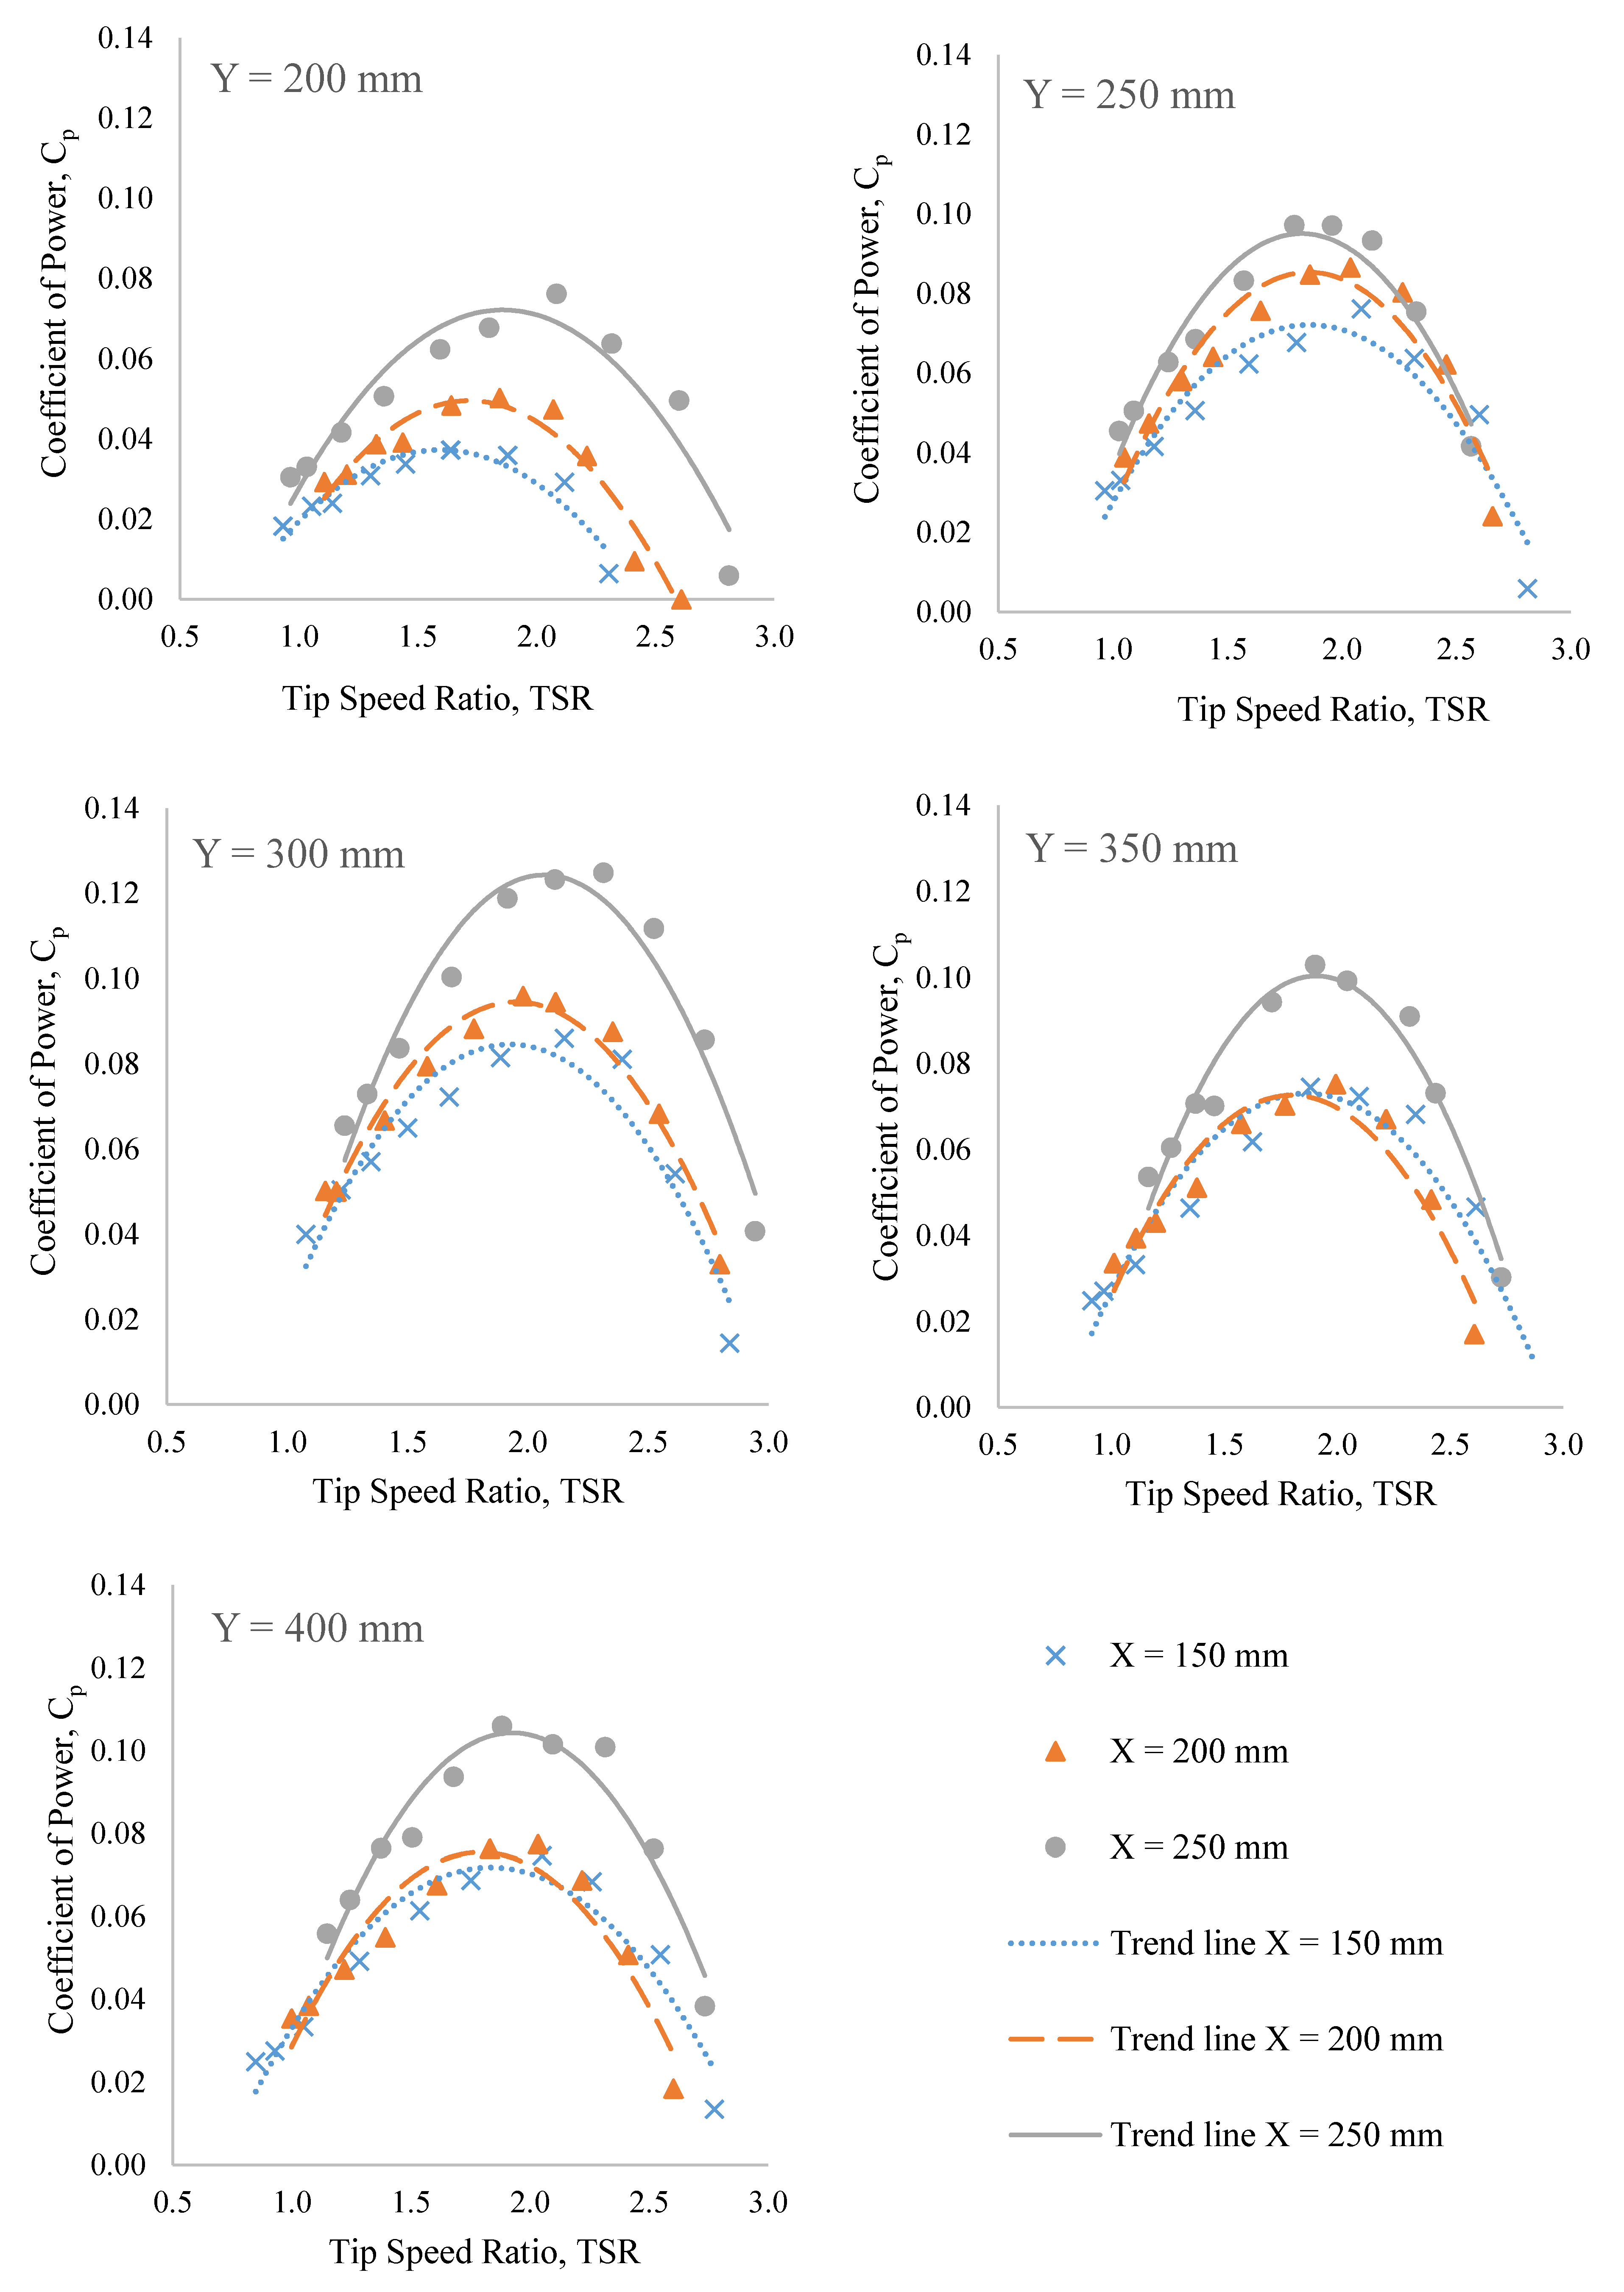
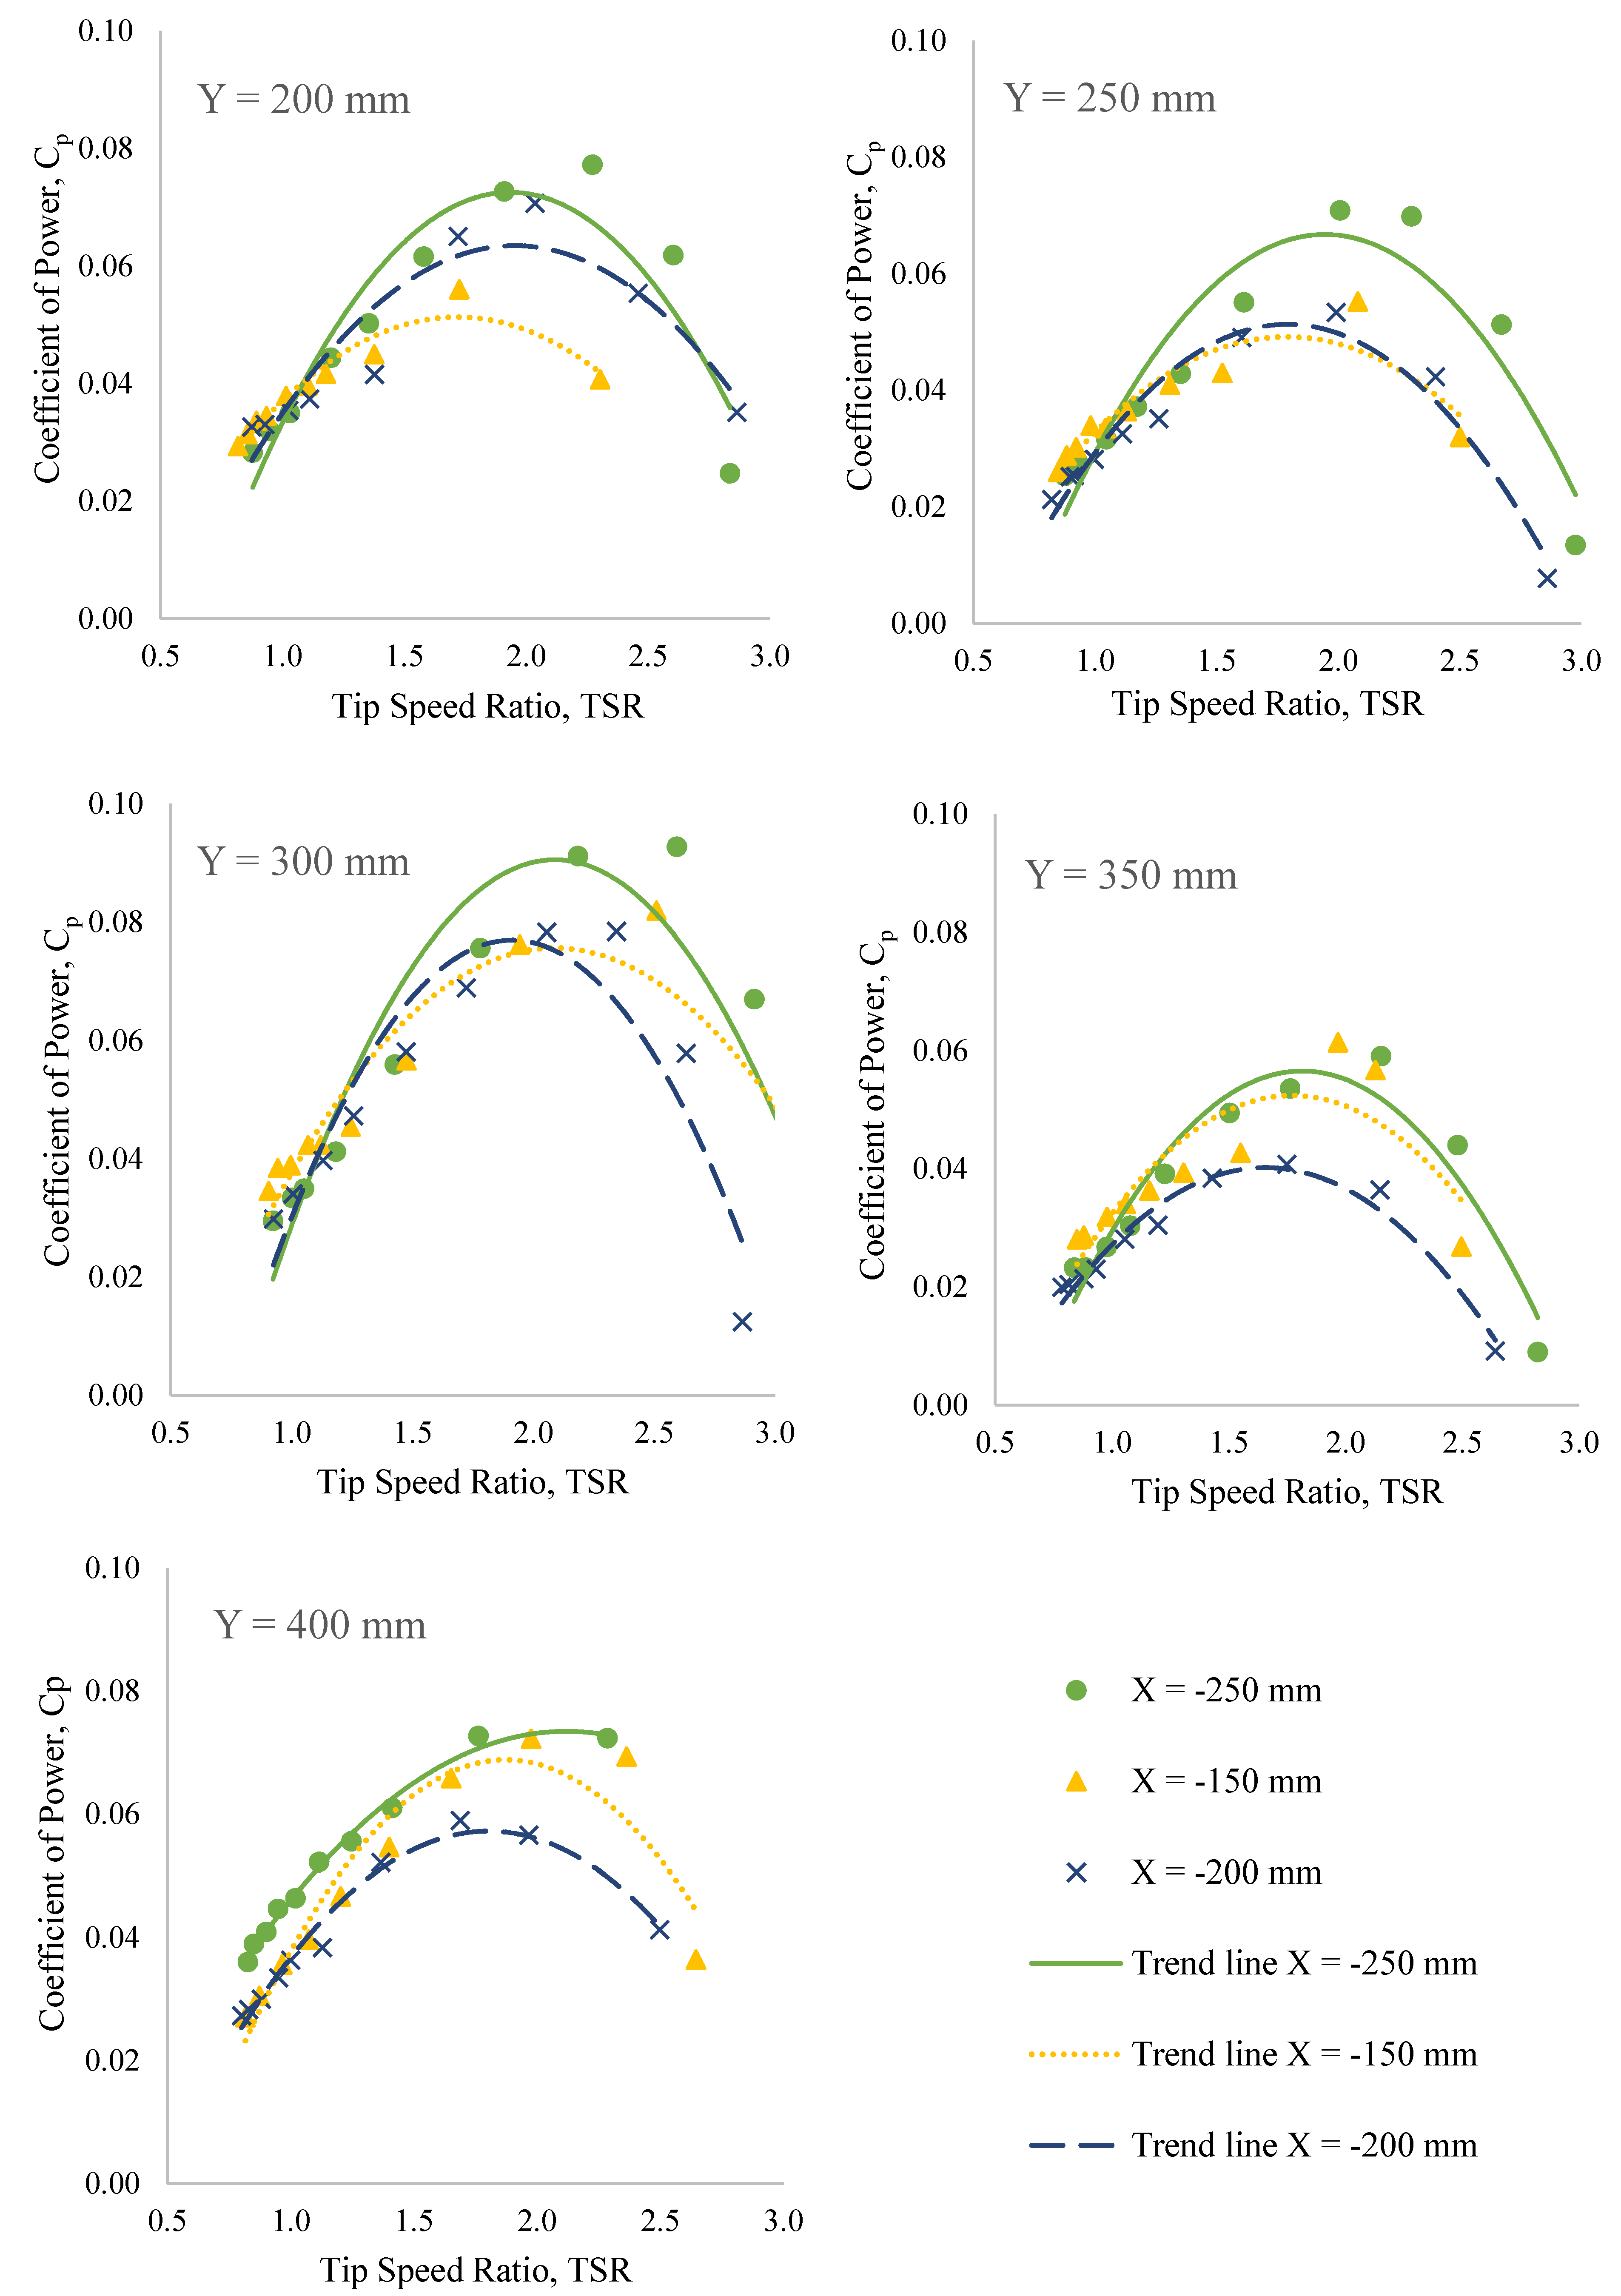
4.2. Wind Turbine Performance

Figure 9 depicts the rotational speed of the free running wind turbine in various configurations. It can be seen that the rotational speeds are higher (more than 350 rpm) when the turbine is placed close to the outer radius of the discharge outlet. This is because according to Figure 8, the wind velocity is higher in this region and decreases until zero towards the center. Thus, the turbine at horizontal positions of −250 mm, −200 mm, −150 mm, 150 mm, 200 mm, and 250 mm at all vertical turbine positions was considered for further analysis.
Figure 9. Rotational speed of wind turbine at various positions.
Energies 08 06566 g009
Since there is a non-uniform wind profile, the turbine at each position experiences a different wind velocity and hence different amounts of available wind energy to be extracted. The wind velocity is considered by averaging the wind velocity from Figure 8 at every 10° of azimuth angle upstream of the turbine. The Cp versus TSR graphs for the considered wind turbine configurations are tabulated in Figure 10 and Figure 11. The coefficient of power, Cp is defined as 2P/(ρAV3), where ρ is the air density and A is the frontal swept area of the turbine. The power generated by the turbine, P is measured by a controller which consists of a rectifier and resistive dump load. AC voltage from the generator is rectified to DC for current and voltage measurements and dumped to resistive load inside the controller. Low power generation is expected according to the previous study that utilized the same wind turbine model, the turbine producing much less than 1 W at wind velocity lower than 8.5 m/s [25]. It was also reported that the maximum Cp was 0.03 at a TSR of 0.98 and wind velocity of 8.5 m/s.
Figure 10. Coefficient of power against tip speed ratio for X = 150 mm, 200 mm, and 250 mm at all vertical wind turbine positions.
Energies 08 06566 g010
Figure 11. Coefficient of power against tip speed ratio for X = −150 mm, −200 mm, and −250 mm at all vertical wind turbine positions.
Energies 08 06566 g011
First, we discuss the coefficient of power for the turbine at the positive side of the horizontal position. All the graphs in Figure 10 show similar trends where X = 250 mm has the highest Cp followed by X = 200 mm and 150 mm. Comparing the vertical position, Y = 200 mm demonstrates the lowest Cp where the maximum Cp for the three X position occurs at TSR of about 1.75. The low Cp values for wind turbine at this configuration are due to the turbine being too close to the discharge outlet, possibly causing a backflow. The backflow will cause a blockage that negatively affects the exhaust air system performance [26]. It also reduces the power generation by the turbine. The coefficient of power continues to increase until its peak at Y = 300 mm before starting to decrease. Y = 300 mm is where the distance of the turbine’s nearest circumference to the outlet is equal to the radius of the rotor. The highest coefficient of power for X = 250 mm, 200 mm, and 150 mm is 0.124 at TSR 2.3, 0.096 at TSR 2.0 and 0.086 at TSR 2.15. For the negative side of the horizontal position (Figure 11), X = −250 mm produces the highest Cp for all vertical wind turbine positions. However, for X = −200 mm and −150 mm, the trends are inconsistent. Overall, the maximum Cp values for the negative side of the wind turbine horizontal positions are lower than in the positive positions.
For an explanation of the wind turbine and non-uniform wind profile interaction, the exhaust air energy recovery system at Y = 300 mm is taken as an example. The analysis is based on non-uniform velocity application of the DMST theory. Figure 12 illustrates the turbine position against the wind stream, power against the azimuth angle and angle of attack versus the azimuth angle at the horizontal positions of X = 250 mm and X = −250 mm respectively. At X = 250 mm, the turbine is at the highest wind velocity area of the positive side of the horizontal position. In the non-uniform profile, the highest incoming wind speed interacts with the first quarter of the turbine (0° to 90° azimuth angle) with respect to the wind turbine rotation direction. This is the area with the best angle of attacks which in turn produces the highest torque where its peak is at about 65° azimuth angle (as calculated using the DMST theory). Thus, for this configuration, the turbine experiences the highest coefficient of power. On the other hand, the highest wind velocity area for the negative side of the horizontal wind turbine position is at X = −250 mm. In this setting, the highest wind velocity matches the second quarter of the wind turbine with respect to the rotation direction. Based on DMST theory analysis, the angle of attacks at this quarter of turbine rotation are very high which cause a lower amount of torque to be generated thus lowering the coefficient of power of the turbine. The airfoil blades for this turbine have the highest lift force at an angle of attack of 12°, and start to stall after that [23]. Having the blades interact with the wind at better angle of attacks will significantly improve the wind turbine performance [27]. To conclude, with respect to the wind turbine rotation direction which is counter-clockwise, it is more preferable to place the wind turbine with the highest wind velocity at its first quarter, i.e., at the positive side of the wind turbine horizontal position.
Figure 12. Turbine position against wind stream, power against azimuth angle, and angle of attack versus azimuth angle at horizontal positions of X = 250 mm and X = −250 mm.
Energies 08 06566 g012

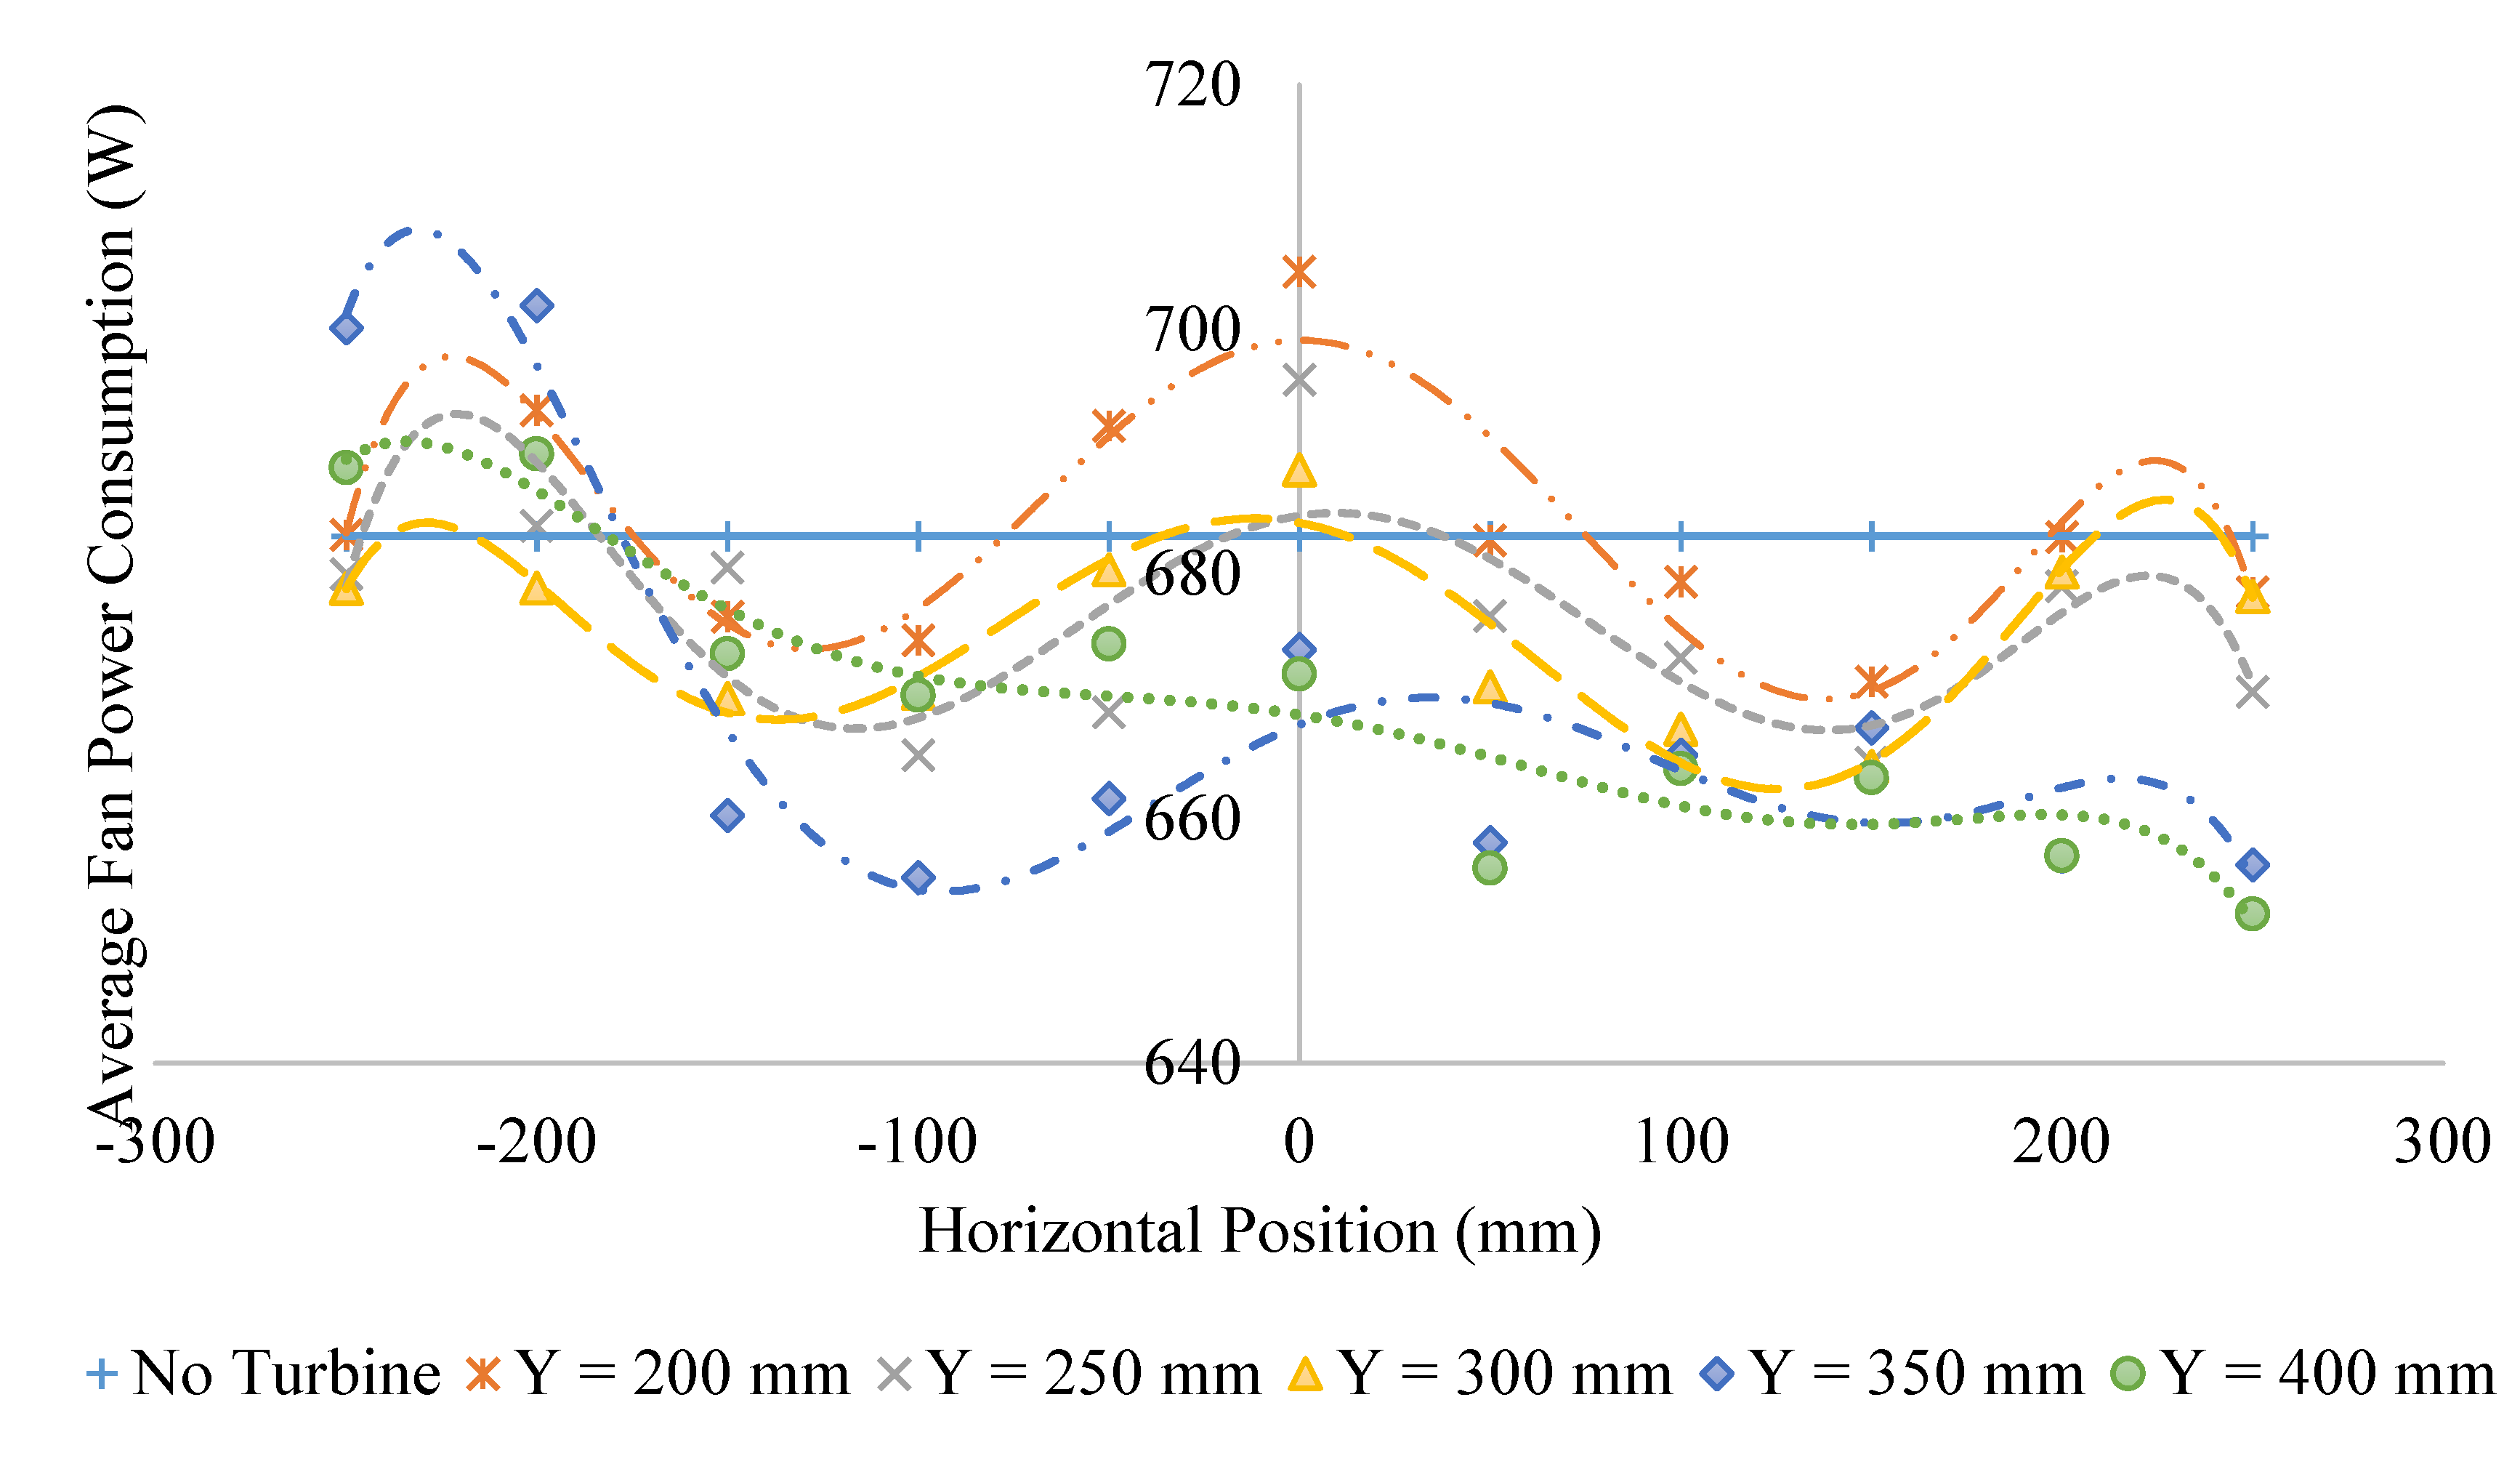
4.3. Cooling Tower Model Performance

Assessment of the air flow rate of the cooling tower with the various configurations is shown in Figure 13. The intake flow rates are obtained by multiplying the average intake velocity with the intake area which is equal to 0.584 m2. The flow rate of the original operation of the cooling tower model at 3.05 m3/s is the benchmark for the assessment. A flow rate lower than the benchmark value represents a negative effect to the cooling tower model while a higher flow rate represents improvement of its air flow. From the Figure, at all wind turbine positions at the outlet of the cooling tower, the air flow rates of the cooling tower show greater values than the cooling tower without the wind turbine except certain conditions at 200 mm wind turbine distance. When the wind turbine is spinning at a high rotational speed, a low pressure region is created and hence possibly creates a suction effect which improves the air flow. Comparing the vertical positions of the wind turbine, the further the distance between the turbine and the outlet, the higher the flow rate, with the wind turbine at 400 mm distance having the highest flow rate.
Figure 13. Average flow rate of the cooling tower model with various configurations.
Energies 08 06566 g013
The fan motor of the cooling tower power consumption is plotted in Figure 14. The trends show that the power consumption is higher at the negative side of the horizontal position for all wind turbine distances to the outlet. Since the configuration without wind turbine is the benchmark for the experiment, the wind turbine at distances of 350 mm and 400 mm are preferable at all horizontal positions except at X = −200 mm and −250 mm. This result shows that the existence of the wind turbine at the correct position is able to improve the cooling tower air flow rate and reduce the motor power consumption. Thus, the efficiency of the cooling tower can be improved.
Figure 14. Average fan motor power consumption of the cooling tower model with various configurations.
Energies 08 06566 g014

4.4. Overall Performance Evaluation

Three parameters that are taken into account in determining the optimum configuration of the exhaust air energy recovery turbine generator are the intake air flow rate, the fan motor power consumption, and the wind turbine performance. Based on sub-sections 4.2 and 4.3, the preferable positions for the turbine are when the turbine is spinning clockwise at the right side, i.e., X = 150 mm, 200 mm, and 250 mm for all horizontal distances. The evaluation is tabulated in Table 1. Based on the presented data, the configuration of the horizontal position, Y = 400 mm and X = 250 mm has a superior advantage over the others. It was chosen because at this configuration, the wind turbine performance is among the best and the cooling tower performance improvement is the highest. On the cooling tower performance, the fan motor power consumption is reduced by 4.5% and the air flow rate is improved by 11%. The turbine also achieves 10.6% of coefficient of power at a TSR of 1.88. With this, the performance of the cooling tower model is improved and at the same time the turbine generates energy.
Table 1. Comparative performance of cooling tower and wind turbine compared to bare cooling tower.
ConfigurationCooling TowerWind Turbine
Y (mm)X (mm)Intake Flow RateFan Motor ConsumptionFree Running Rotational Speed (RPM)Maximum CpTSR at Maximum Cp
Velocity (m/s)% DifferenceInput Power (W)% Difference
2001505.403.3%671−1.7%3640.0361.88
2005.403.3%6830.0%4430.0501.85
2505.403.3%679−0.7%4940.0762.08
2501505.606.7%665−2.7%3700.0742.08
2005.586.7%679−0.6%4120.0872.04
2505.587.2%670−1.9%4670.0971.96
3001505.557.7%664−2.8%3880.0862.15
2005.658.1%680−0.4%4370.0961.98
2505.636.2%678−0.7%4940.1252.31
3501505.638.1%667−2.3%4100.0751.88
2005.709.1%656−3.8%4720.0751.99
2505.657.7%656−3.9%4970.1031.90
4001505.809.1%663−2.9%3760.0752.05
2005.9012.9%657−3.8%4370.0772.03
2505.7011.0%652−4.5%4790.1061.88
No Wind Turbine5.23-683----
As mentioned in the design description section, an exhaust air energy recovery wind turbine generator system can consist of more than one wind turbine. Based on the outlet area of the cooling tower and the size of the turbine used in this experiment, it is possible to place two turbines. Considering the best turbine position as suggested in the previous paragraph (Y = 400 mm and X = 250 mm), and the cooling tower performance remains the same as in this configuration, if two wind turbines are in place, the system doubles the energy recovery percentage. Measurement on an actual cooling tower with 2.4 m diameter and powered by a 7.5 kW fan motor revealed that the discharge wind velocity is about 13 m/s. Matching to the size of the cooling tower outlet, two units of 500 W VAWT can be placed to recover the energy. Since the discharge speed is approximately the same as the turbine’s rated speed, 1 kW power is expected to be generated by both turbines which is equivalent to 13% of energy recovery.

5. Conclusions

The experiment shows that it is possible to recover energy in air that is being discharged from an exhaust system without negatively affecting its performance. The discharged air from the system has the quality of being able to generate steady and predictable energy. With the correct wind turbine positioning and size matching, an optimum amount of energy recovery can be obtained. Based on the result, when the turbine is spinning at a high rotational speed, the cooling tower model experiences an increment in air flow rate and a reduction in fan motor power consumption. Thus, the exhaust air energy recovery turbine generator is capable of improving the cooling tower performance.
This system is retrofitable and safe to be used for any existing exhaust air systems. For safety enhancement, an enclosure can be mounted to surround the wind turbine to eliminate the possibility of blade fly-off in case of turbine failure. The procedure presented in this paper can be utilized for wind turbine position determination for any kind of exhaust air system configuration. It is understood that different configurations of exhaust systems (variation in fan type, duct geometry, etc.) may produce different flow patterns of the discharge air. However, the procedure is universal. This study focuses on experimental analysis of the placement of a wind turbine facing the outlet of an exhaust air system. Further study will be conducted on the aerodynamic analysis of the system. The analysis will be different to conventional wind turbine aerodynamic analysis since the wind that blows onto the turbine is not uniform in profile. It will be conducted by a semi-empirical approach.

Acknowledgments

The authors would like to thank the University of Malaya for the assistance provided in the patent application of this design (PCT/MY2012/000274) and the research grant allocated for this project, i.e., University of Malaya Research Grant (RP015C-13AET) and Postgraduate Research Grant (PG047-2012B). Sincere gratitude is also dedicated to the Ministry of Education Malaysia for the Fundamental Research Grant Scheme (FP053-2013B) awarded to this project.

Author Contributions

Ahmad Fazlizan developed the test rig and conducted the experiment under the supervision of Wen Tong Chong. Sook Yee Yip developed the data acquisition system from the wind turbine under the supervision of Wooi Ping Hew. Sin Chew Poh reviewed the final work and provided useful suggestions for publication. All authors contributed to writing the paper.

Conflicts of Interest

The authors declare no conflict of interest.

References

  1. Chen, D.C.; Gong, X.; Raju Huidrom, E.; Vashakmadze, J.Z.; Zhao, T. Understanding the Plunge in Oil Prices: Sources and Implications; The World Bank: Washington, DC, USA, 2015. [Google Scholar]
  2. Organization of the Petroleum Exporting Countries (OPEC). OPEC Monthly Oil Market Report; OPEC: Vienna, Austria, 2014. [Google Scholar]
  3. Prambudia, Y.; Nakano, M. Integrated simulation model for energy security evaluation. Energies 2012, 5, 5086–5110. [Google Scholar] [CrossRef]
  4. Mirchi, A.; Hadian, S.; Madani, K.; Rouhani, O.M.; Rouhani, A.M. World energy balance outlook and opec production capacity: Implications for global oil security. Energies 2012, 5, 2626–2651. [Google Scholar] [CrossRef]
  5. Chauhan, S.; Singh, R. Design of domestic helix vertical axis wind turbine to extract energy from exhaust fans. Innov. Syst. Des. Eng. 2014, 5, 23–28. [Google Scholar]
  6. Ahmad, S.; Ab Kadir, M.Z.A.; Shafie, S. Current perspective of the renewable energy development in Malaysia. Renew. Sustain. Energy Rev. 2011, 15, 897–904. [Google Scholar] [CrossRef]
  7. Solomon, S.; Qin, D.; Manning, M.; Chen, Z.; Marquis, M.; Averyt, K.B.; Tignor, M.; Miller, H.L. Climate Change 2007: The Physical Science Basis; International Governmental Panel on Climate Change: New York, NY, USA, 2007. [Google Scholar]
  8. Ohya, Y.; Karasudani, T. A shrouded wind turbine generating high output power with wind-lens technology. Energies 2010, 3, 634–649. [Google Scholar] [CrossRef]
  9. Kalantar, M.; Mousavi G., S.M. Dynamic behavior of a stand-alone hybrid power generation system of wind turbine, microturbine, solar array and battery storage. Appl. Energy 2010, 87, 3051–3064. [Google Scholar] [CrossRef]
  10. Schaeffer, R.; Szklo, A.S.; Pereira de Lucena, A.F.; Moreira Cesar Borba, B.S.; Pupo Nogueira, L.P.; Fleming, F.P.; Troccoli, A.; Harrison, M.; Boulahya, M.S. Energy sector vulnerability to climate change: A review. Energy 2012, 38, 1–12. [Google Scholar] [CrossRef]
  11. Chong, W.T.; Pan, K.C.; Poh, S.C.; Fazlizan, A.; Oon, C.S.; Badarudin, A.; Nik-Ghazali, N. Performance investigation of a power augmented vertical axis wind turbine for urban high-rise application. Renew. Energy 2013, 51, 388–397. [Google Scholar] [CrossRef]
  12. Sharpe, T.; Proven, G. Crossflex: Concept and early development of a true building integrated wind turbine. Energy Build. 2010, 42, 2365–2375. [Google Scholar] [CrossRef]
  13. Wang, W.-X.; Matsubara, T.; Hu, J.; Odahara, S.; Nagai, T.; Karasutani, T.; Ohya, Y. Experimental investigation into the influence of the flanged diffuser on the dynamic behavior of CFRP blade of a shrouded wind turbine. Renew. Energy 2015, 78, 386–397. [Google Scholar] [CrossRef]
  14. Müller, G.; Jentsch, M.F.; Stoddart, E. Vertical axis resistance type wind turbines for use in buildings. Renew. Energy 2009, 34, 1407–1412. [Google Scholar] [CrossRef]
  15. Shan, Z.; Qin, S.; Liu, Q.; Liu, F. Key manufacturing technology & equipment for energy saving and emissions reduction in mechanical equipment industry. Int. J. Precis. Eng. Manuf. 2012, 13, 1095–1100. [Google Scholar]
  16. Chong, W.T.; Kong, Y.Y.; Fazlizan, A. Wind and Exhaust Air Energy Recovery System. WO2013073930 A1, 16 November 2012. [Google Scholar]
  17. Chong, W.T.; Hew, W.P.; Yip, S.Y.; Fazlizan, A.; Poh, S.C.; Tan, C.J.; Ong, H.C. The experimental study on the wind turbine’s guide-vanes and diffuser of an exhaust air energy recovery system integrated with the cooling tower. Energy Convers. Manag. 2014, 87, 145–155. [Google Scholar] [CrossRef]
  18. Jeong, H.M.; Chung, H.S.; Bae, K.Y.; Kim, S.H.; Shin, Y.S. Water cooling characteristics in an enclosed vacuum tank by water driven ejector. J. Mech. Sci. Technol. 2005, 19, 164–172. [Google Scholar] [CrossRef]
  19. Hensley, J.C. Cooling Tower Fundamental, 2nd ed.; SPX Cooling Technologies Inc.: Overland Park, KS, USA, 2009. [Google Scholar]
  20. Herrman, D.D. Field Tests of Fan Performance on Induced Draft Cooling Towers; Cooling Tower Institute: Houston, TX, USA, 1962. [Google Scholar]
  21. Paraschivoiu, I. Double-Multiple Streamtube Model for Darrieus in Turbines; Lewis Research Center Wind Turbine Dynamics: Hampton, NH, USA, 1981; pp. 19–25. [Google Scholar]
  22. Beri, H.; Yao, Y. Double Multiple Streamtube Model and Numerical Analysis of Vertical Axis Wind Turbine. Energy Power Eng. 2011, 3, 262–270. [Google Scholar] [CrossRef]
  23. AID Airfoil Investigation Database. Available online: http://www.airfoildb.com/foils/481 (accessed on 27 April 2015).
  24. Montgomerie, B. Methods for Root Effects, Tip Effects and Extending the Angle of Attack Range to ±180, with Application to Aerodynamics for Blades on Wind Turbines and Propellers; Swedish Defense Research Agency: Stockholm, Sweden, 2004. [Google Scholar]
  25. Kim, D.; Gharib, M. Efficiency improvement of straight-bladed vertical-axis wind turbines with an upstream deflector. J. Wind Eng. Ind. Aerodyn. 2013, 115, 48–52. [Google Scholar] [CrossRef]
  26. Chen, S.Q.; Wang, H.Q.; Cheng, J.L. Experimental investigation on the energy-saving diffuser of a main fan. J. Coal Sci. Eng. China 2012, 18, 108–112. [Google Scholar] [CrossRef]
  27. Chong, W.T.; Fazlizan, A.; Poh, S.C.; Pan, K.C.; Hew, W.P.; Hsiao, F.B. The design, simulation and testing of an urban vertical axis wind turbine with the omni-direction-guide-vane. Appl. Energy 2013, 112, 601–609. [Google Scholar] [CrossRef]

