Article

Congestion Control Algorithm in Distribution Feeders: Integration in a Distribution Management System

1
Department of Electrical Energy, Systems & Automation, Ghent University, Technologiepark-Zwijnaarde 913, 9052 Gent, Belgium
2
Eandis, Guldensporenpark 52, 9820 Merelbeke, Belgium
*
Author to whom correspondence should be addressed.
Energies 2015, 8(6), 6013-6032; https://doi.org/10.3390/en8066013
Submission received: 11 February 2015 / Revised: 22 March 2015 / Accepted: 8 June 2015 / Published: 18 June 2015
(This article belongs to the Special Issue Microgrids)

Abstract

:
The increasing share of distributed energy resources poses a challenge to the distribution network operator (DNO) to maintain the current availability of the system while limiting the investment costs. Related to this, there is a clear trend in DNOs trying to better monitor their grid by installing a distribution management system (DMS). This DMS enables the DNOs to remotely switch their network or better localize and solve faults. Moreover, the DMS can be used to centrally control the grid assets. Therefore, in this paper, a control strategy is discussed that can be implemented in the DMS for solving current congestion problems posed by the increasing share of renewables in the grid. This control strategy controls wind turbines in order to avoid congestion while mitigating the required investment costs in order to achieve a global cost-efficient solution. Next to the application and objective of the control, the parameter tuning of the control algorithm is discussed.

1. Introduction

The amount of distributed generation (DG) in the electric power system has been increasing significantly in the last few years due to the technical, economic and environmental benefits they offer. However, the distribution networks are not designed to cope with large amounts of generation, as in the past, only loads were connected to them, and large power plants were connected to the transmission network. This gives rise to many challenges, such as dealing with current congestion and voltage problems in the feeders and bi-directional power flows that change, e.g., protection device requirements. To deal with these issues, more flexibility is needed in the distribution network. Some concepts that focus on providing flexibility are the microgrid concept, assisting the grid in a bottom-up approach, and the smart grid concept, assisting the grid by means of more metering, sensing and communication.
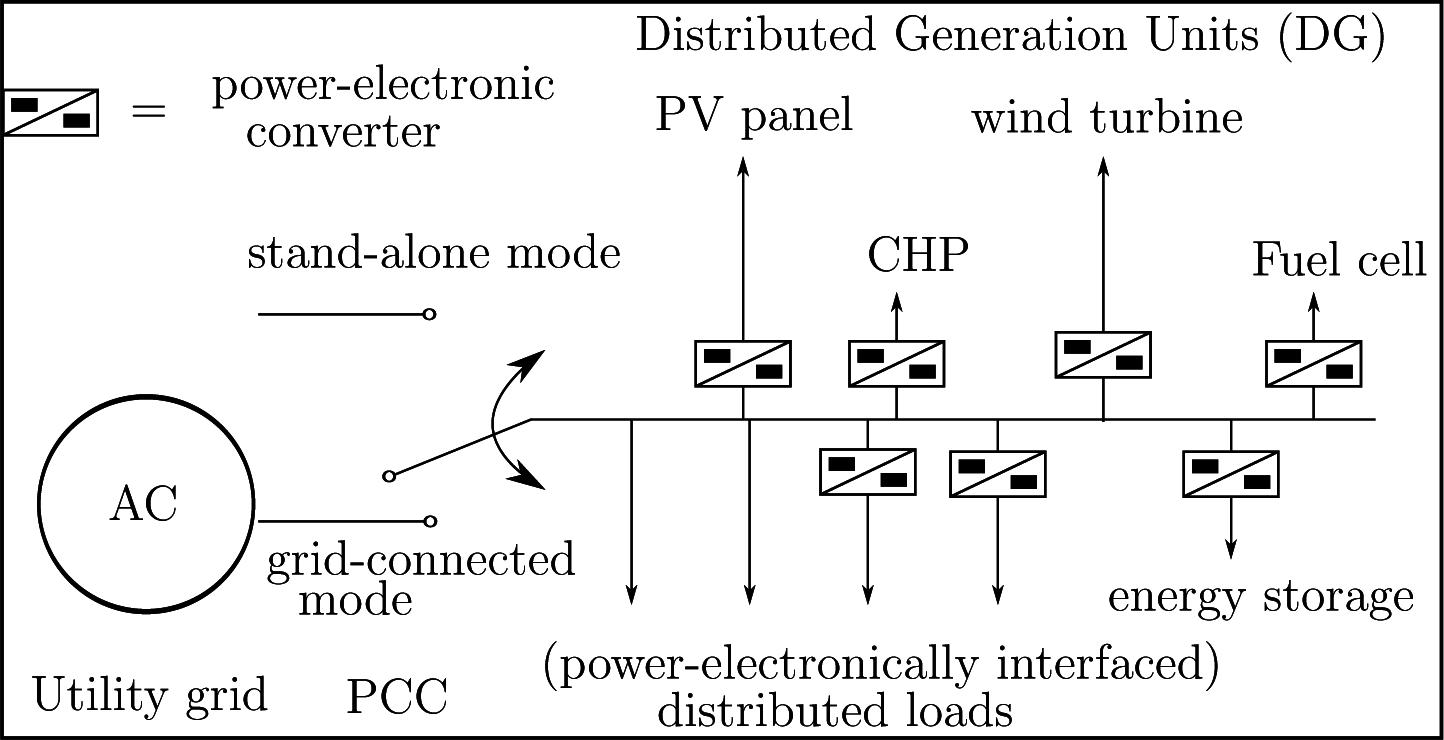
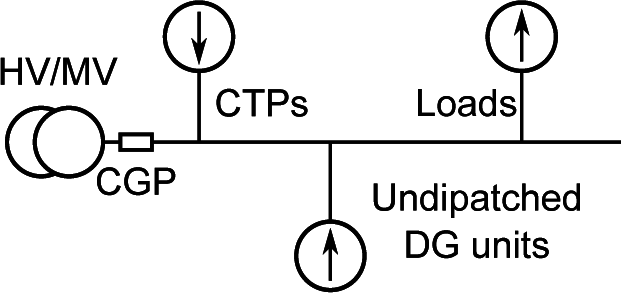
A microgrid consists of an aggregation of generators, loads and storage elements, as depicted in Figure 1, that can deliver both electrical and heating power and cooperate in order to achieve certain goals. These goals can differ depending on the type of microgrid. For instance, a microgrid can benefit from market participation by flattening the load profile, which lowers the electricity tariffs [1,2]. The main advantages of microgrids are that they achieve a coordinated integration of distributed generation (DG) units in the electric power system, improve the reliability of the grid, enable a more efficient usage of energy and become a controllable entity in the power system. Specific for microgrids is that they have clearly-defined electrical boundaries, e.g., with one point of common coupling (PCC) with the electric power system. Furthermore, many of the microgrid assets are power-electronically interfaced with the grid.
In the current and future evolutions of the electric power system, often, the smart grid concept is highlighted. Smart grids add extra communication, measurements and control to the system for a more efficient and better operation. A smarter exploitation of the grid aims at avoiding the large investments required to cope with the increasing grid loads, the integration of new (renewable) production units and the sometimes aged infrastructure. It is not realistic that the smart grid will emerge from a revolution, but rather, a gradual evolution to an increasingly smarter grid is expected [3,4]. Because of their flexibility and scalability, microgrids are likely to play a primordial role in the evolution of the smart grid [5], with smart microgrids as pilot versions or building blocks of the future electricity system [6]. Instead of investing in extra smart grid facilities on a large scale, investing in smart microgrids at critical locations will be achieved more quickly and more cost efficiently. The smart grid will therefore probably consist of integrated smart microgrids [3]. In essence, the aim of microgrids and smart grids is equal, i.e., cost minimization, coping with the increasing demand, integration of renewable power sources, maximizing the asset utilization and increasing the efficiency of the power system.
In microgrid research, much attention has been given to the primary control of microgrids [2,712] and developing a hierarchical control structure [1317]. However, an important aspect of microgrids is delivering ancillary services to the electric power system. For example, microgrids can mitigate the required costs for increasing the penetration of renewable DG units in the electric power system by allowing for the theoretical occurrence of congestion in the planning stage, but solving the actual congestion issues (i.e., voltage and current congestion) in the operational stage of the system. In this paper, current congestion in a microgrid feeder is solved by controlling the DG units. By controlling the DG units, the considered distribution network feeder is more flexible, with flexibility given in a bottom-up approach. This shows an initial case for integrating microgrid operation in the conventional electric power system, as microgrids are expected to emerge step by step in a gradual evolution of the traditional power system [3].
Many distribution network operators (DNOs) are facing the challenge of an increasing share of distributed generation (DG) units in their networks. Simultaneously and related to this, a clear trend for the DNOs is to achieve a better monitoring of their network by using different metering infrastructures coupled to advanced supervisory control and data acquisition (SCADA) systems and high-speed data communication [18]. The evolution of power distribution networks towards so-called active distribution networks (ADNs) requires the availability of a suitable distribution management system (DMS) to achieve specific operation objectives, such as an optimal voltage/line-congestion control, fault detection and localization, post-fault management, local load balancing and network loss minimization [1921]. Many papers, such as [22,23], have dealt with the functionalities of a DMS; however, in practice, generally, only the basic functionalities are being exploited at this time, such as the monitoring and remote switching of the system. The DMS system is often also capable of programming control algorithms and sending various control set points to the grid assets. However, these capabilities are generally not yet effectively used.
Because many DG units are power-electronically interfaced to the electric power system, they can control the output current at their terminals swiftly. Hence, the next step towards fully-active distribution networks is to couple the control functions of the DMS system with those of the available DG units. Many DNOs have the clear vision of strivingtowards a global cost-effective solution to integrate DG units in the network. The hosting capacity of the distribution networks towards DG units is limited because of several challenges, such as dealing with voltage and current congestion problems. Hence, next to investing in the grid assets, smart control strategies for coordinating the DG units can be used as an alternative in order to tackle these challenges if this proves to be more cost effective in the long run. If only network investments and flexibility provision by DG units are taken into account for dealing with current and voltage congestion, depending on the network investment costs and the cost of the loss of renewable energy capturing, a decision between these two methods can be made in the planning stage. Often, the last option proves to be more cost effective. Both feeder and substation transformer congestion can be tackled with this control.
In the European FP7 project INCREASE (Increasing the penetration of renewable energy sources in the distribution grid by developing control strategies and using ancillary services) [24], a hierarchical control, consisting of a local and an overlaying control, for low- and medium-voltage networks is investigated. The local control is responsible for voltage control and unbalance mitigation without inter-unit communication. The voltage control is based on the P/V droop control [25], and the unbalance mitigation is based on the damping control strategy of [26]. The damping control can also assist in power quality improvements of the power system via voltage dip mitigation [27]. The overlaying central control level optimizes the outputs of the local control strategies and handles issues, such as current congestion, which are not sensed locally by the DG units. For the overlaying control, either a multi-agent system (MAS) [28,29] or a central control system (such as the DMS) can be used in the case of low-voltage networks. In medium-voltage networks, an overlaying DMS control, i.e., a central control, is more appropriate than in low-voltage networks, because of the huge amount of small assets in the latter.
In this paper, the DMS system of the DNO is used to centrally control wind turbines in case of line current congestion on the local distribution network. The wind turbines connected to the medium-voltage (MV) networks, which are in the MW range, are generally capable of receiving set points from a remote control system and controlling their active power generation towards this set point. By centrally curtailing these wind turbines: (1) they can be connected more quickly to the grid than when asset investments and the necessary changes in the lines and transformers of the involved feeders need to be made; and (2) investment costs can be delayed or even canceled. For the curtailment, the control strategy has three main requirements: (1) securely operating the grid; (2) limiting the (unnecessary) curtailment; and (3) being generic enough to be easily extended to other feeders.
In this paper, in Section 2, some characteristics with respect to the control strategy are discussed. In Section 3, different options for implementing the congestion control in a DMS system are compared with respect to the unnecessary curtailment and the over-current. In Section 4, the implementation of the control algorithm in the DMS is discussed.

2. Congestion Control: General Strategy

2.1. State-of-the-Art

This section describes the state-of-the-art regarding voltage and current control in low- and medium-voltage networks. For voltage problems, several solutions exist [30]. These are qualitatively compared in Table 1. Historically, only the first two options, i.e., investing in the grid assets, such as the lines, substations and installing dedicated devices, were considered. Dedicated devices include flexible AC transmission systems (FACTS), such as static varcompensators (SVCs) and capacitor banks with controlled reactive power injections. These are generally located at the primary substations. Reactive power control is less effective for voltage control in low- (and medium) voltage networks due to the non-negligible R/X ratio of the network lines, requiring active power management in addition to reactive power control [19,31,32]. The MV/LV (medium voltage/low voltage) transformers located in the primary substations could traditionally only be manually changed with respect to the tap position [33]. However, on-load tap changing transformers (OLTCs) could significantly increase the penetration of DG, as the taps can be changed more frequently in order to deal with alternate high amounts of production and consumption. The traditional control system of a tap changer-based voltage regulator measures the voltage and load current, estimates the voltage at a remote point and triggers the tap change when the estimated voltage is out of the boundary. More advanced methods use a communication infrastructure to measure the voltage at several key points in the distribution feeder. Energy storage [34] can also be used to mitigate voltage problems, e.g., in combination with an OLTC, such as in [35]. A more cost-effective manner is often to control the DG units, i.e., to curtail them in the case of voltage problems, whereas now, they would fully turn off in the case of voltage problems [36].
Several solutions to deal with current congestion problems are listed in Table 2. Many of the solutions are similar to voltage control. Again, by actively controlling the inverters of the DG units, current congestion problems can be dealt with by these units. For current congestion control, a central control algorithm is required in order to minimize the curtailed power, because the DG units cannot locally measure the current congestion in the feeder, and hence, a local controller is not able to fairly share the curtailment among different DG units.
The tables show that centrally controlling the DG units should be considered, already at the planning stage, as a valuable alternative for investing in the grid assets or for increasing the allowed penetration, i.e., the hosting capacity, of DG units on the feeders. In [24], a hierarchical control based on a multi-agent system (MAS) approach is used for centrally dealing with grid current issues in distribution feeders. This is an interesting approach when a lot of small assets have an impact on the grid current, i.e., in low-voltage networks. By using a MAS, using one central location for the congestion control is avoided. In the medium-voltage networks considered in this paper, the number of assets is significantly lower. Furthermore, the distribution management system (DMS) of the distribution network operator measures the state of the medium-voltage network, which is rarely the case for the low-voltage networks. Hence, using a central control algorithm is beneficial in medium-voltage distribution feeders. In [37], a distributed control algorithm, based on congestion control algorithms used for the Internet, which offers best-effort services to elastic applications that back off in the case of congestion, is presented in order to control electrical vehicles charging times for avoiding congestion on the feeders. This can be extended for application in DG units; however, as opposed to the presented control algorithm, it is more suitable for dealing with networks with large amounts of small units, hence low-voltage networks.

2.2. Presented Control Algorithm

For congestion control, congestion points (CGPs) and control points (CTPs) have been identified. A CGP is a location where current congestion is possible, and the CTPs are the wind turbines downstream of the CGP.

2.2.1. Allowable Cable Ampacity

A cable allows a cyclic and a permanent current depending on whether the load profile of the cable is cyclic or permanent. In a permanent regime, the XLPE 240 cable can endure 360 A, while in a cyclic regime, 390 A is tolerable, as depicted in Table 3. Whether or not the load profile in the CGP is cyclic or permanent depends on whether the load factor (LF) is lower or higher than 0.8, respectively. The LF is defined as the average load divided by the peak load in a specified time period. This allowable current is not an absolute limit, but a current value that can be allowed for an unlimited amount of time without cable damage.

2.2.2. Overview of Control Strategy

The general control architecture is depicted in Figure 2. The CTPs (i.e., wind turbines (WTs)) have their own CTP controller, which is generally of the PI type, such that these CTPs follow a set point without steady-state error. This set point is delivered by the DMS system, thus by the control strategy discussed hereafter. A measurement of the current in the CGP activates the DMS control.

2.2.3. Congestion Management Initiator Function

The decision of whether or not to start calculating set points for the CTPs is made by the congestion management initiator function shown in Figure 3.
When the current is low and increases, the set point calculation remains inactive, i.e., the set points of the CTPs are not changed until the current in the CGP exceeds the threshold value. In Figure 3, the threshold value is denoted as the current limit. If the current exceeds this threshold value, a set point is calculated in order to force the CGP current back to the control point. This set point remains valid until the current in the CGP again increases above the threshold value, such that a lower set point is calculated.
When the current drops below the back value, different possibilities to determine the higher set points are possible, as discussed further.
The control strategy proposed here is based on the hysteresis-type of control, which is also used for other applications, such as AGC (automatic generation control) in the grid and the PWM (pulse-width modulation) control of inverters [38,39]. The usage of this hysteresis band for initiating the control solves several issues, such as: (1) continuously varying set points sent to the CTPs can be avoided and normal load variations (noise) do not lead to new set points of CTPs; (2) without this band, a pure proportional-integral-derivative (PID) controller cannot be used, as the current in the CGP has no set point, only an upper limit (e.g., the cyclic current in the cable); and (3) extended system knowledge (where the system varies in time) is not required for tuning the controller. Therefore, the control point should be somewhat lower than the threshold value. The control should also account for measurement noise.
The width of the hysteresis band, equal to the threshold value minus the back value, has a significant impact. A trade-off should be made. On the one hand, the hysteresis band needs to be as large as possible in order to avoid significant set point changes sent to the wind turbines. On the other hand, it should be as low as possible for avoiding the loss in renewable energy. The simulations below show the effect of different widths of this hysteresis band.

3. Test System

This section discusses the set-up of the system considered and the requirements to keep the operation of the simulated test setup within the bounds.

3.1. Feeder Data

Grid current congestion is a local issue occurring at specific locations among the distribution network feeders, as opposed to grid frequency issues, which are global, as the grid frequency has the same value everywhere in an interconnected power system. Therefore, a distribution network feeder is used for analyzing the control algorithm.
In this paper, the measured data of a feeder with wind turbines are used for simulating and discussing the control strategy and its parameters. The feeder consists of loads and controlled DG units, i.e., CTPs, as shown in Figure 4. The profile of the current in a CGP is measured, as is the output of a CTP. This wind profile is upscaled in order to emulate congestion problems for an increasing share of wind turbines in the distribution network.
In the case without the activation of the congestion control strategy, thus when the current limit in the feeder is exceeded without curtailing the wind turbines, the wind profile and the upscaled measurement in the CGP are depicted in Figure 5. The data captured here have a sampling rate of 15 min, and measurements are obtained during a year (hence, 35,040 measurement points). As the control strategy that will be implemented here operates with a one-minute sampling rate, for the rest of this paper, it will be assumed as if these measurements are sampled with this rate, as well.
In this paper, the maximum change of active power equals 33% of the nominal power per minute. For a 2.2-MW wind turbine connected to a 15-kV network, this implies a maximum change of 38 A output current per minute.
Note that the congestion management control strategy is here applied to distribution feeders and can by implemented by the distribution system operator. The control strategy can also be used for transmission system congestion management by implementing it through the transmission system operator. However, as transmission systems are a meshed network, the influence of power changes of the generators and the current at the congestion point are not in a direct relationship and can change over time, as this depends on the current state of the power system.

3.2. Threshold Value: Timing

For determining when current congestion occurs, the value of the maximal allowed current in the feeder needs to be set, above which the control strategy takes action to lower the feeder current. For this reason, the cyclic current is defined as the maximum allowed current in the distribution feeder in the case of a cyclic feeder profile, as discussed further. The cyclic current is not an instantaneous limit, but this current can be maintained for a certain amount of time before damaging the cables because of too high temperatures. Furthermore, as temperature changes are significantly slower than variations in the feeder current and the cyclic limit is already a safe measure, the threshold value in the congestion management initiator function of Figure 3 can be equal to the cyclic current of Table 3 when the feeder profile is cyclic. For a permanent profile, this should be the permanent current. Therefore, the best option for the threshold value is to use a dynamic value based on the load factor (LF). As the LF determines whether a cyclic (LF < 0.8) or permanent (LF ≥ 0.8) current profile is present in the feeder, the threshold value becomes dependent on the LF.
  • threshold value = cyclic current if LF < 0.8
  • threshold value = permanent current if LF ≥ 0.8

3.3. Timing

A hysteresis function for triggering the control strategy is used, and the threshold value equals the cyclic/permanent current. This implies that for a certain amount of time, the feeder current can exceed the threshold value. The timing of this depends on the settling time of the controllers and on the installed feeder power. The actual limit in the cables is not the current, but the temperature. The cyclic/permanent current in the cables is defined as the current for which the cables can reach a temperature of 90 °C. Most studies take into account that 110 °C is the temperature leading to possible damage in the cables; hence, for safety reasons, it is here considered that 100 °C should be maintained as the absolute maximum. This means that the maximum temperature rise in the cables equals 10 °C. Note that in this study, absolute cable temperatures are not taken into account, but relative ones; as for calculating the cyclic/permanent current, already some safety margins are taken into account with respect to the 90 °C temperature.
The installed power on the feeder is directly linked to the settling time of the control algorithm and the temperature rise in the cables. In Table 4, the simulation results are shown for obtaining the time required for a temperature rise of 10 °C, starting from 90 °C with earth conductance ρ = 1 Km/W for two different cables. It is shown that for 130% installed power (compared to the cyclic limit), when a simultaneity factor of one arises, it would take 30 min to reach a temperature rise of 10 °C in the lines. This implies that the control strategy should be able to cancel the over-current in 15 min in order to allow for sufficient temperature drop in the cable.
Hence, the installed power in the system needs to be limited corresponding to the maximum settling time of the overall control algorithm.

4. Congestion Management: Parameter Determination

In this section, how to implement the congestion management strategy is discussed, and the choices concerning the parameters are clarified. First, the theoretical curtailment is discussed in Section 4.1, meaning that the control strategy operates infinitely quickly and accurately to lower the current below the current limit. However, as discussed in Section 3.2, an immediate response is not required, as congestion is a temperature issue, rather than a current issue. Therefore, the presented control algorithm works with a hysteresis band. The width of this band should be tuned, which is discussed in Section 4.3. In Section 4.2, different ways of lowering the curtailment of the wind turbines are discussed. Next, the hysteresis controller can be of the proportional (P) or proportional-derivative (PD) control type, as discussed in Section 4.4. Finally, the value of the threshold value is discussed in Section 4.5.

4.1. Theoretical Curtailment as a Function of Installed Power

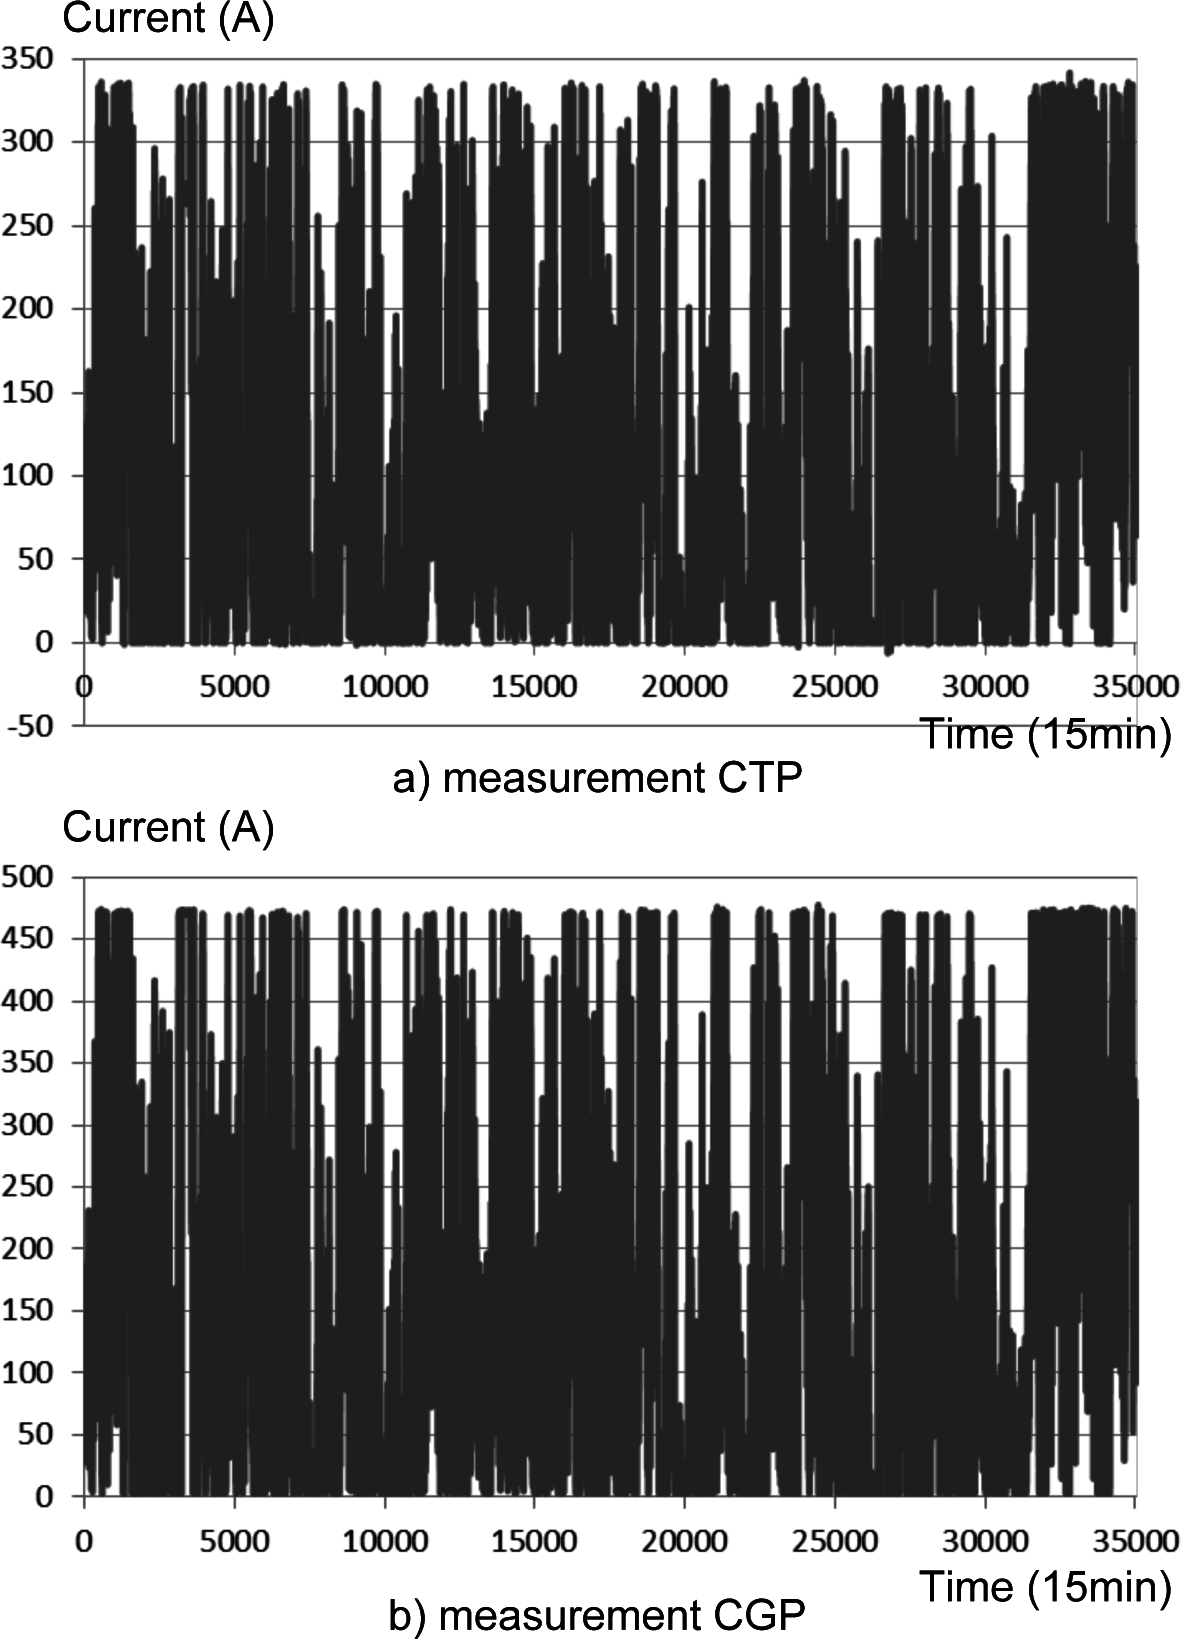
Theoretically, thus with perfect controllers without delay times, the renewable energy capturing in the considered system is compared for different values of the power installed (from 93% to 130% of the 360-A cyclic current limit). This is also done for different threshold values (TVs) (360 A, or permanent current limit versus 390 A, or cyclic current limit in the considered feeder) in Table 5. With the upscaled wind profile used in the following simulations, the installed power of the wind turbines equals 93% of the cyclic current limit. Still, congestion occurs, as there are other traditional, i.e., uncontrolled DG units that are not flexible connected to the system. For this wind turbine penetration level, only 93.2% of the current is allowable in the CGP when the threshold value is the cyclic value. This drops to 89.6% in the case of the permanent value for the threshold value. The result of 93% is the reference point for further simulations. Here, a rather low energy capturing is obtained, as in the feeder, the traditional DG output is already significantly upscaled. For increasing penetration of wind turbines up to 130%, it is shown that the renewable energy capturing relatively drops less than the increase of wind turbine penetration. Therefore, with the presented control algorithm, a relatively large wind turbine penetration in the system is allowed with minimal energy loss due to curtailment.

4.2. Relief of Curtailment

Below, several possibilities to implement the hysteresis control in the DMS are compared, for a threshold value of 360 A (the permanent current).
When the current in the CGP drops below the back value and the CTPs are being curtailed, higher set points need to be sent to the CTPs. For this, several possibilities are discussed with respect to the control algorithm and the effect on the captured energy and the congestion control results:
  • full relief of set point, i.e., sending 100% to the CTP
  • stepwise reliefuntil the CGP measurement is close to the control point
  • reliefcalculated until the CGP measurement equals the control point (discussed above)
The different strategies for relieving the curtailment are only applied when there is sufficient wind; when the CGP measurement does not increase after sending set points, a 100% set point is sent, and the curtailment is stopped.

4.2.1. Full Relief

When the current in the CGP drops below the back value, the curtailment of the wind turbine is fully stopped; hence, a set point of 100% is sent to the turbine. If the CGP is under its back limit because the load has increased, the wind turbine output will increase. This may lead again to an over-current condition and the calculation of a new set point (now with less curtailment of the wind output) to the wind turbines. Hence, this strategy is beneficial for the capturing of renewable energy, but not for the safeguarding of the CGP.
A full relief has the following characteristics:
  • easy to implement
  • when current in CGP drops below the back value because the wind has dropped; full relief of control has no effect, as the output of the CTP will not change
  • lower loss in the capturing of the available renewable energy
  • more exceeding of the TV is possible
In Table 6, the results of this strategy implemented with different hysteresis bands are compared for a TV of 360 A. Note that a comparison between different hysteresis band widths is made in the next paragraph. The value “set point control” signifies the percentage of time that the DMS sends a set point to the wind turbines. The value “current above the threshold value” is the percentage of the available current that is still above the threshold value. This is an intrinsic feature of the control strategy, as it only starts acting on currents that are above this limit, and the sampling time equals one minute. From Table 6, it is clear that the “full relief” strategy leads to a higher renewable energy capturing compared to the case with controlled relief of curtailment; at the cost of more current in the CGP above the TV. Therefore, a controlled relief is more beneficial with respect to safeguarding the thermal limits of the distribution lines.

4.2.2. Stepwise Relief

Another methodology for relieving the congestion control is by including a stepwise relief of the curtailment. If the current in the CGP is lower than the back value, the set point, i.e., the upper limit of the output of the wind turbine, is increased by a value that is here referred to as the “step”. When the wind output is lower than the set point, the curtailment is omitted, and 100% is sent to the CTP.
In Table 7, for a hysteresis band of 20 A, the simulation results for different values of the parameter step are compared. The case where the step is in between 38 and 500 A is the same as the case with full relief. The reason is that the wind turbine output changes are limited to 38 A per minute, thus per step. Hence, the step needs to be less than the rate limit; otherwise, the control action needs to wait for the wind turbine to react.
The table shows that this leads to unnecessary delays in the control and a significantly disadvantageous effect on the wind energy capturing.

4.2.3. Controlled Relief

The “controlled relief” strategy is implemented in such way that when the current in the CGP drops below the back value, a new set point is calculated for the CTPs in order to increase this current back to the control point if sufficient wind is available.
Another way of relieving the control strategy is doing so by using the controlled relief strategy. A controlled relief of the settling points is included. The “controlled relief” strategy is implemented in such way that when the current in the CGP drops below the back value, a new set point is calculated for the CTPs in order to increase this current back to the control point if sufficient wind is available. A disadvantage of this strategy is that set points can be increased to a significant extent in one step, whereas in the previous sections, set points were increased more slowly. The main advantage is that it is similar to the way for curtailing the wind turbine. The results are presented in Table 8. Again, the effect of different hysteresis band widths is discussed further in Section 4.3.
In conclusion, it is the best strategy to relieving the curtailment set point. The wind energy capturing is significantly higher than that in case of the stepwise relief. Furthermore, the current above the TV is lower than in the case of the full relief of control action, as this control strategy calculates a new maximal power output, i.e., a set point for avoiding current congestion, while the full relief omits the curtailment, which may lead to the current again increasing above the TV.

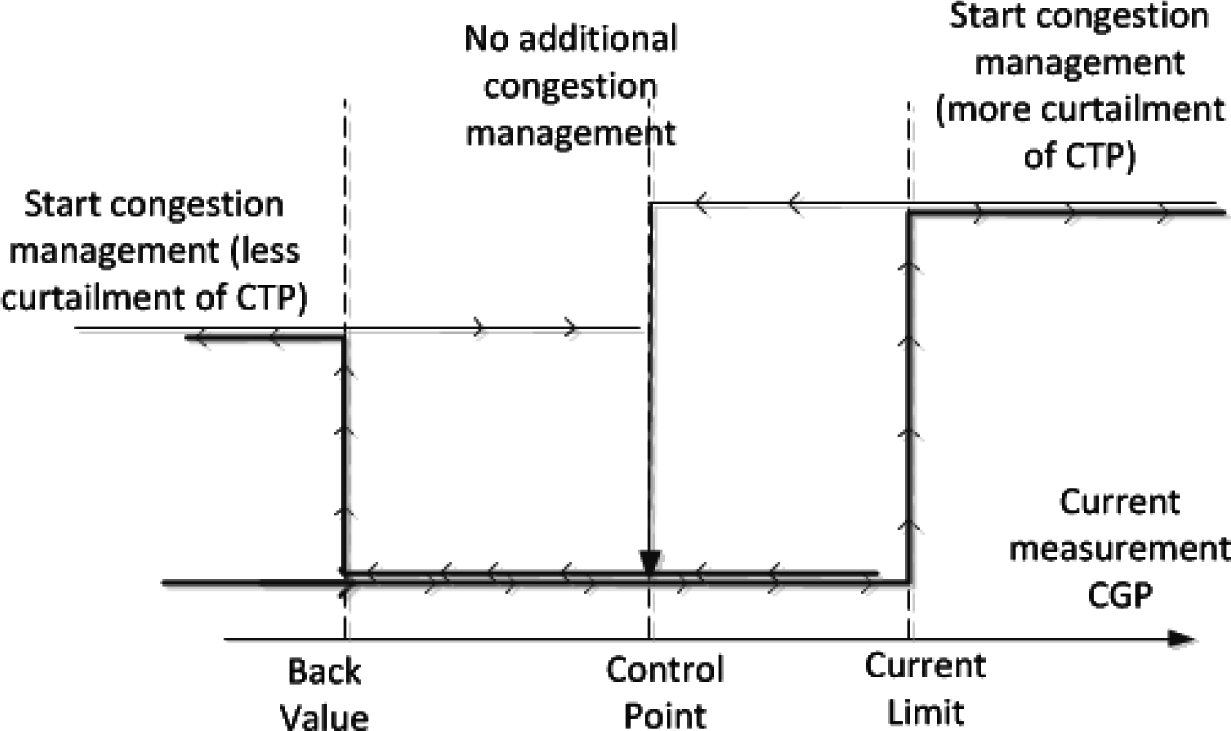
4.3. Hysteresis Band

In this section, again, a TV of 360 A is assumed.
Here, the effect of the width of the hysteresis band (i.e., the threshold value minus the back value) is investigated. In the control, the reaction time of the CTPs is taken into account before sending new set points. A controlled relief of the settling points is included.
Table 8 shows the results of this simulation. From the theoretical results, already a highly congested line is studied (only wind capturing of 93% in this theoretical case, because of the upscaling of the wind and other traditional DG output). The table shows that during around 12% of the time, a set point is sent to the CTPs (set point control). Around 0.5% of the current in the CGP is above the threshold value (TV), and about 3%–5% of the current, depending on the width of the hysteresis band, in the CGP is in between the back value and the TV, while a set point is being sent to the CTP. The wind turbine is curtailed for about 12%–15% of the current in the CTP. The simulations show that using a hysteresis band has a slight effect on the wind capturing; however, this is limited and the advantages of:
  • avoiding frequent set point changes to the CTP
  • allowing some load variations
  • dealing with measurement error (good current measurements in the distribution network obtain a measurement error of about 3%)
  • dealing with slight load variations without resending set points to the CTPs
outweigh this. Hence, a hysteresis band of 20 A or 6% of the 360 A TV is a good compromise. If the hysteresis band equals 20 A, the back value equals 340 A and the control point is 350 A. Furthermore, the captured wind is close to its theoretical value, so that only minor benefits can be realized from investing in more advanced control options, such as model-based predictive control. For very small hysteresis band widths, slightly more than the theoretical wind capturing is obtained. This increased capturing is because the threshold value is chosen to be equal to the permanent current, and with the studied control algorithm, this value is exceeded for short amounts of time. This is allowed in practice, as temperature, rather than current, is the critical factor, whereas in the theoretical case, this current is not exceeded.

4.4. PD Action

In this section, a PD action (see further in Figure 6) on the measurement of the CGP is turned on in order to anticipate fast changes in the CGP current, while still calculating the value for relieving the control action. The input for the limiter depends on the measurement of CGP (ICGP,k) at the present time, as well as on this at the previous time step (ICGP,k1):
I CGP,k 1 + α ( I CGP,k I CGP,k 1 )
Depending on the value of the mitigation parameter α, the D (Derivative) action is changed, which has an effect on the results, as depicted in Table 9.
The case with α = 1 is the same as the one without D action. This shows that the D action can improve the capturing of renewable energy; however, this leads to more current above the TV.

4.5. Threshold Value: Results

For variable amounts of installed CTP power, the wind energy capturing (% of available current) and the percentages of ICGP above the 360/390 A or iCGP,360 and iCGP,390 are compared in Table 10 for the control strategy with controlled relief of the control action without D action. The one with 360–390 A shows the results for when the threshold value depends on the load factor. The results of this are very close to the results of when the cyclic current defines the TV, meaning that the wind profile is mostly cyclical.
For comparison, the theoretical wind capture (without control) results are depicted in Table 11.
Hence, the control captures approximately 97% of the allowed wind power.

5. Implementation in the DMS

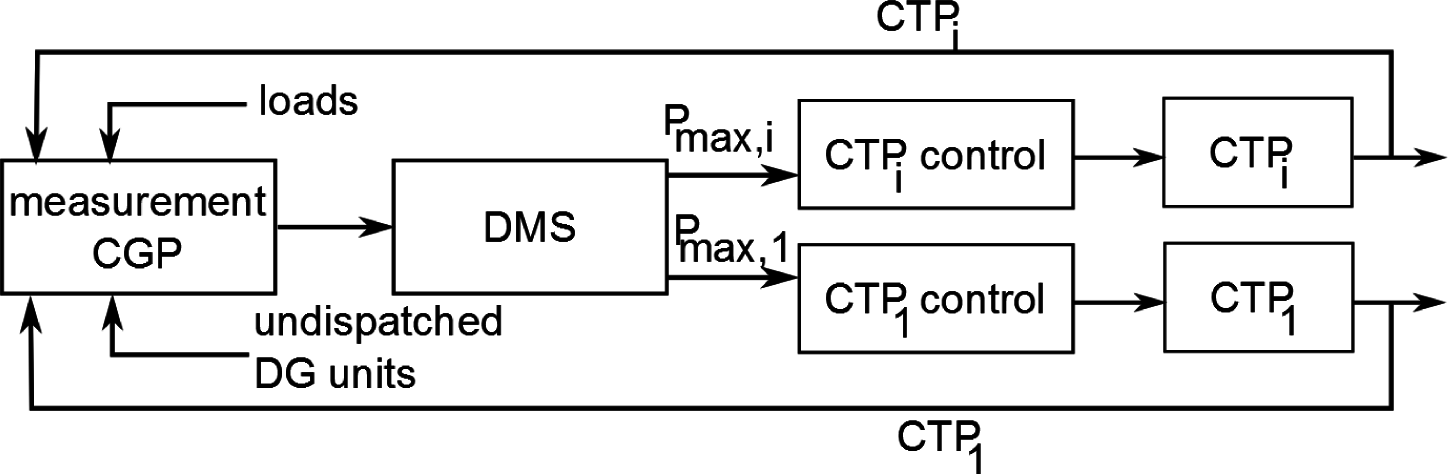
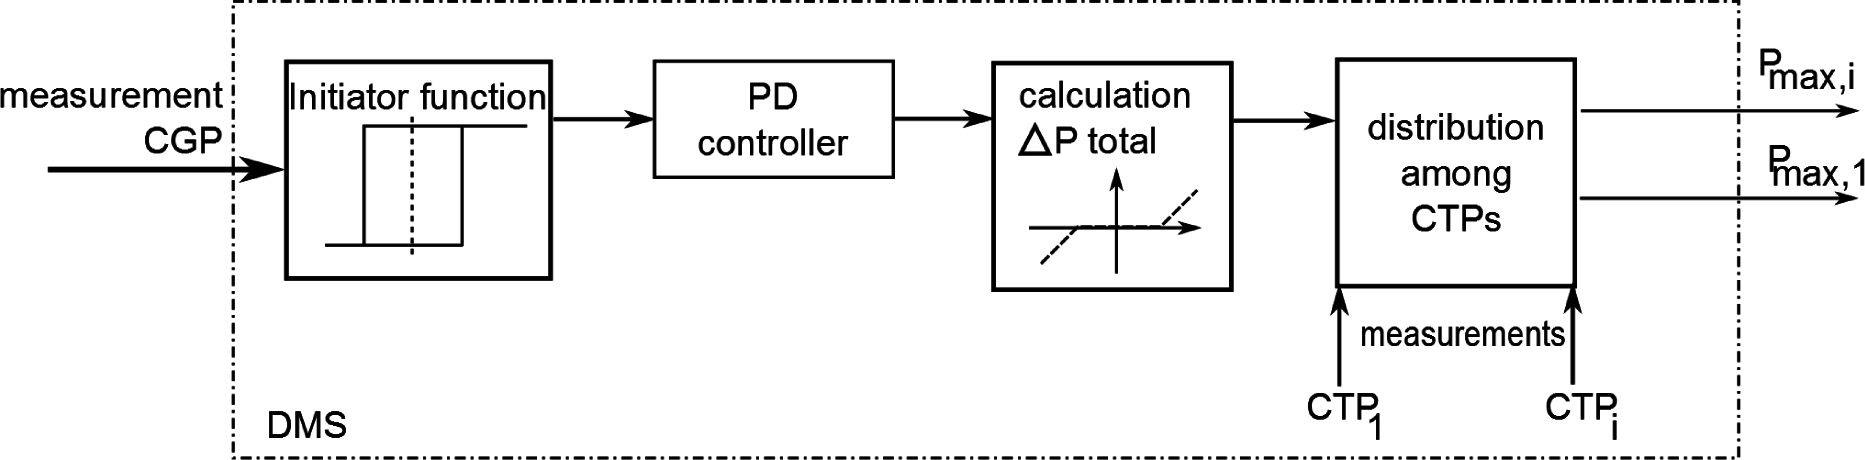
The DMS controller has as input a measurement in the CGP as depicted in Figure 6. The operation of the control strategy is triggered by a comparison of this CGP measurement with the congestion management initiator function (“trigger”). Hereafter, a PD controller can be included. The D-action can anticipate a fast change of the current in the CGP. The internal controller (“distribution over CTPs”) distributes the total amount of power to be changed in the CGP ΔP among the CTPs. For this, a tracing of the feeder is performed in order to determine which assets on the feeder are CTPs, i.e., flexible distributed generation units. For the distribution of the curtailment on multiple CTPs, different strategies can be followed, such as LIFO (last in first out) or pro rata [40]. In pro rata, each CTP is curtailed proportionally to its ratings, while in LIFO, first, the units that are most recently connected to the system are curtailed. In this project, pro rata curtailment is assumed. In a pro rata strategy, each CTP receives the same set point Pmax. Recalculation is required when: (1) it is a priori known that the CTP will not react (e.g., because of insufficient wind to increase the output power); or (2) ex post the congestion issue in the CGP is not yet solved after sending set points to the CTPs.
Note that a set point of active power for a wind turbine denotes an upper limit of active power.

6. Conclusions

This paper discusses the implementation of a congestion control algorithm in a microgrid with a large penetration of wind turbines. With the distribution management system, the distribution network operator sends appropriate set points to the wind turbines in order to solve the congestion problem. In the algorithm, a congestion management initiator function is used for which the values of two parameters are investigated. The threshold value and width of the hysteresis band have an impact on the wind capture and on the time the current in the congestion point exceeds a certain current threshold, but this remains tolerable. Hence, a trade-off between those properties always needs to be made. It is shown that the controller with controllable relief of the control action, with a hysteresis band of 6% (20 A) and with a load factor-dependent threshold value, attains the most beneficial results.

Acknowledgments

The research has been (partly) funded by the Interuniversity Attractive Poles Programme initiated by the Belgian Science Policy Office (BELSPO). The research of Tine Vandoorn is funded by the Special Research Fund of Ghent University (Belgium). The authors thank Eandis for the close cooperation.

Author Contributions

The paper was a collaborative effort between the authors. Tine Vandoorn performed the research and wrote the paper. Lieven Vandevelde is the promoter of the research. Lieven Degroote provided technical assistance and supervised the research. Jan Van de Vyver and Louis Gevaert contributed to the technical value of the paper and analysed the data and simulations.

Conflicts of Interest

The authors declare no conflict of interest.

References

  1. Lasseter, R.H.; Akhil, A.; Marnay, C.; Stephens, J.; Dagle, J.; Guttromson, R.; Meliopoulous, A.; Yinger, R.; Eto, J. The CERTS Microgrid Concept, White Paper on Integration of Distributed Energy Resources; LBNL–50829; California Energy Commission, Office of Power Technologies—U.S. Department of Energy: Washington DC, USA.
  2. Lasseter, R.H.; Paigi, P. Microgrid: A conceptual solution, Proceedings of the IEEE Power Electronics Specialists Conference (PESC 2004), Aachen, Germany, 20–25 June 2004.
  3. Farhangi, H. The path of the smart grid. IEEE Power Energy Mag 2010, 8, 18–28. [Google Scholar]
  4. Kezunovic, M.; Vittal, V.; Meliopoulos, S.; Mount, T. The big picture: Smart research for large-scale integrated smart grid solutions. IEEE Power Energy Mag 2012, 10, 22–34. [Google Scholar]
  5. Lidula, N.; Rajapakse, A.D. Microgrids research: A review of experimental microgrids and test systems. Renew. Sustain. Energy Rev. 2011, 15, 186–202. [Google Scholar]
  6. Savaghebi, M.; Jalilian, A.; Vasquez, J.C.; Guerrero, J.M. Secondary control scheme for voltage unbalance compensation in an islanded droop-controlled microgrid. IEEE Trans. Smart Grid 2012, 3, 797–807. [Google Scholar]
  7. Katiraei, F.; Iravani, R.; Hatziargyriou, N.; Dimeas, A. Microgrids management: Controls and operation aspects of microgrids. IEEE Power Energy Mag 2008, 6, 54–65. [Google Scholar]
  8. Chandorkar, M.C.; Divan, D.M.; Adapa, R. Control of parallel connected inverters in standalone ac supply systems. IEEE Trans. Ind. Appl. 1993, 29, 136–143. [Google Scholar]
  9. Guerrero, J.M.; Matas, J.; de Vicuna, L.G.; Castilla, M.; Miret, J. Wireless-control strategy for parallel operation of distributed-generation inverters. IEEE Trans. Ind. Electron 2006, 53, 1461–1470. [Google Scholar]
  10. Conti, S.; Greco, A.M.; Messina, N.; Vagliasindi, U. Generators control systems in intentionally islanded MV microgrids, International Symposium on Power Electronics, Electrical Drives, automation and motion (SPEEDAM), Ischia, Italy, 11–13 June 2008.
  11. Vandoorn, T.L.; Meersman, B.; Degroote, L.; Renders, B.; Vandevelde, L. A control strategy for islanded microgrids with dc-link voltage control. IEEE Trans. Power Deliv 2011, 26, 703–713. [Google Scholar]
  12. Sao, C.; Lehn, P. Intentional islanded operation of converter fed microgrids, Proceedings of the IEEE Power Engineering Society General Meeting, Montréal, QC, Canada, 18–22 June 2006.
  13. Shafiee, Q.; Guerrero, J.; Vasquez, J.M. Distributed secondary control for islanded microgrids—A novel approach. IEEE Trans. Power Electron 2014, 29, 1018–1031. [Google Scholar]
  14. Savaghebi, M.; Jalilian, A.; Vasquez, J.C.; Guerrero, J.M. Secondary control for voltage quality enhancement in microgrids. IEEE Trans. Smart Grid 2013, 3, 1893–1902. [Google Scholar]
  15. Hawkes, A.D.; Leach, M.A. Modelling high level system design and unit commitment for a microgrid. Appl. Energy 2009, 86, 1253–1265. [Google Scholar]
  16. Chaouachi, A.; Kamel, R.M.; Andoulsi, R.; Nagasaka, K. Multiobjective intelligent energy management for a microgrid. IEEE Trans. Ind. Electron 2013, 60, 1688–1699. [Google Scholar]
  17. Tsikalakis, A.G.; Hatziargyriou, N.D. Centralized control for optimizing microgrids operation. IEEE Trans. Energy Convers 2008, 23, 241–248. [Google Scholar]
  18. Giraldoa, J.; Mojica-Navab, E.; Quijanoa, N. Synchronization of isolated microgrids with a communication infrastructure using energy storage systems. Int. J. Electr. Power Energy Syst 2014, 63, 71–82. [Google Scholar]
  19. Katsaros, K.; Chai, Wei; Wang, Ning; Pavlou, G.; Bontius, H.; Paolone, M. Information-centric networking for machine-to-machine data delivery: A case study in smart grid applications. IEEE Netw 2014, 3, 58–64. [Google Scholar]
  20. Czarnecki, L.; Staroszczyk, Z. On-line measurement of equivalent parameters for harmonic frequencies of a power distribution system and load. IEEE Trans. Instrum. Meas 1996, 45, 467–472. [Google Scholar]
  21. Sakis Meliopoulos, A.P.; Polymeneas, E.; Tan, Z.; Huang, R.; Zhao, D. Advanced Distribution Management System. IEEE Trans. Smart Grid 2013, 4, 2109–2117. [Google Scholar]
  22. Singh, N.; Kliokys, E.; Feldmann, H.; Kussel, R.; Chrustowski, R.; Jaborowicz, C. Power System Modelling and Analysis in a Mixed Energy Management and Distribution Management System. IEEE Trans. Power Syst 1998, 13, 1143–1149. [Google Scholar]
  23. William, R. Cassel. Distribution management systems: Functions and payback. IEEE Trans. Power Syst 1993, 8, 796–801. [Google Scholar]
  24. European FP7 Project INCREASE. Grant Agreement: 608998. Available online: http://www.project-increase.eu accessed on 17 June 2015.
  25. Vandoorn, T.L.; Meersman, B.; Degroote, L.; Renders, B.; Vandevelde, L. A Control Strategy for Islanded Microgrids with dc-link Voltage Control. IEEE Trans. Power Deliv 2011, 26, 703–713. [Google Scholar]
  26. Meersman, B.; Renders, B.; Degroote, L.; Vandoorn, T.; Vandevelde, L. Three-phase inverter-connected DG-units and voltage unbalance. Electr. Power Syst. Res 2011, 81, 899–906. [Google Scholar] [Green Version]
  27. Bozalakov, D.; Vandoorn, T.L.; Meersman, B.; Demoulias, C.; Vandevelde, L. Voltage Dip Mitigation Capabilities of Three-Phase Damping Control Strategy. Electr. Power Syst. Res 2015, 121, 192–199. [Google Scholar]
  28. Yoo, C.-H.; Chung, I.-Y.; Lee, H.-J.; Hong, S.-S. Intelligent Control of Battery Energy Storage for Multi-Agent Based Microgrid Energy Management. Energies 2013, 6, 4956–4979. [Google Scholar]
  29. Kim, H.-M.; Lim, Y.; Kinoshita, T. An Intelligent Multiagent System for Autonomous Microgrid Operation. Energies 2012, 5, 3347–3362. [Google Scholar]
  30. Thongkeaw, S.; Boonthienthong, M. Technique for Voltage Control in Distribution System. Int. J. Electr. Robot. Electron. Commun. Eng. 1996, 7, 826–829. [Google Scholar]
  31. Demirok, E.; Sera, D.; Teodorescu, R.; Rodriguez, P.; Borup, U. Clustered PV inverters in LV networks: An overview of impacts and comparison of voltage control strategies. Proceedings of the 2009 IEEE Electrical Power Energy Conference, Montréal, QC, Canada, 22–23 October 2009.
  32. Christakou, K.; Tomozei, D.-C.; Bahramipanah, M.; Le Boudec, J.-Y.; Paolone, M. Primary voltage control in active distribution networks via broadcast signals: The case of distributed storage. IEEE Trans. Smart Grid 2014, 5, 2314–2325. [Google Scholar]
  33. Vandoorn, T.L.; de Kooning, J.D.M.; Meersman, B.; Guerrero, J.; Vandevelde, L. Voltage-Based Control of a Smart Transformer in a Microgrid. IEEE Trans. Ind. Electron. 2013, 60, 1291–1305. [Google Scholar] [Green Version]
  34. Sabihuddin, S.; Kiprakis, A.E.; Mueller, M. A Numerical and Graphical Review of Energy Storage Technologies. Energies 2015, 8, 172–216. [Google Scholar]
  35. Liu, X.; Aichhorn, A.; Liu, L.; Li, H. Coordinated Control of Distributed Energy Storage System With Tap Changer Transformers for Voltage Rise Mitigation Under High Photovoltaic Penetration. IEEE Trans. Smart Grid 2012, 3, 897–906. [Google Scholar]
  36. Vandoorn, T.L.; de Kooning, J.D.M.; Meersman, B.; Vandevelde, L. Voltage-Based Droop Control of Renewables to avoid On-Off Oscillations caused by Overvoltages. IEEE Trans. Power Deliv 2012, 28, 845–854. [Google Scholar]
  37. Ardakanian, O.; Rosenberg, C.; Keshav, S. Realtime distributed congestion control for electrical vehicle charging. ACM SIGMETRICS Perform. Eval. Rev 2012, 40, 38–42. [Google Scholar]
  38. Kazmierkowski, M.P.; Malesani, L. Current control techniques for three-phase voltage-source PWM converters: A survey. IEEE Trans. Ind. Electron 1998, 45, 691–703. [Google Scholar]
  39. Bevrani, H.; Hiyama, T. Intelligent Automatic Generation Control; CRC Press: Boca Raton, FL, USA, 2011. [Google Scholar]
  40. Laguna Estopier, A.; Crosthwaite Eyre, E.; Georgiopoulos, S.; Marantes, C. Flexible plug and play low carbon networks: Commercial solutions for active network management, Proceedings of the 22nd International Conference on Electricity Distribution (CIRED2013), Stockholm, Sweden, 10–13 June 2013.
Figure 1. Microgrid.
Energies 08 06013f1
Figure 2. Control strategy: overview.
Energies 08 06013f2
Figure 3. Congestion management initiator function.
Energies 08 06013f3
Figure 4. Measured feeder.
Energies 08 06013f4
Figure 5. Measurements test feeder.
Energies 08 06013f5
Figure 6. Control strategy: implementation in the distribution management system (DMS).
Energies 08 06013f6
Table 1. Solutions for voltage congestion issues. DG, distributed generation; FACTS, flexible AC transmission system; MV, medium voltage.
AssetComments
New lines and new substationsexpensive
sometimes social opposition
long lead times for installing DG

Dedicated devices (FACTS)expensive
a new solution in LV /MV grids with limited practical experience

Automatic MV/LV transformers OLTCsLV/MV transformers are generally manual tap changers
+large potential in voltage control
can control only voltage at beginning of line

Automatic HV/MV transformers (OLTCs)these are often transmission system operator (TSO)-owned
often already used for voltage control in the transmission system

Storageexpensive

Inverter-control of DG units+relatively cheap
potential loss of renewable energy capturing
potential higher losses due to reactive power flows
+rather easy
+shorter lead times for installing DG
Table 2. Solutions for current congestion issues.
AssetComments
New lines/substationssee Table 1

Dynamic line rating+increased hosting capacity for DG
does not solve congestion, but avoids worst case-based planning rules

Storageexpensive

Load/electrical vehicle controlexpensive
small effect of single unit on congestion

Demand responsehard to manage because of large amounts of LV customers
hard to manage because of different characteristics of MV consumers

Inverter-controlsee Table 1
Table 3. Cable ampacity.
CablePermanent CurrentCyclic Current
XLPE 50150 A160 A
XLPE 150270 A300 A
XLPE 240360 A390 A
Table 4. Timing temperature rise of 10 °C.
Installed CapacityTime (XLPE 50)Time (XLPE 240)
110%25 h15 h
120%45 min2 h
130%30 min36 min
140%20 min26 min
150%15 min25 min
160%12 min16 min
170%10 min13 min
Table 5. Theoretical results for wind energy capturing (%).
Installed (%)93100110120130
Threshold value (TV) = 390 A89.687.684.682.079.4
Threshold value (TV) = 360 A93.291.488.786.183.6
Table 6. Simulation results: full relief of the control action and the effect of the hysteresis band.
Hysteresis Band (A)0102030
Set point control (%)9.8410.6511.0411.74
Current above TV (%)1.070.800.700.58
Current in hysteresis (%)2.933.303.714.70
Wind capturing (%)88.2587.4886.9685.76
Table 7. Simulation results: stepwise relief of the control action and the effect of the parameter step.
Step (A)11020500
Set point control (%)15.2213.7613.4711.04
Current above TV (%)0.270.410.500.70
Current in hysteresis (%)6.684.674.153.71
Wind capturing (%)83.2285.5486.2086.93
Table 8. Simulation results: controlled relief of the control action and the effect of the hysteresis band.
Hysteresis Band (A)0102030
Set point control (%)11.7111.9012.2112.83
Current above TV (%)0.770.660.580.45
Current in hysteresis (%)3.063.393.834.89
Wind capturing (%)87.6787.1986.6385.38
Table 9. Simulation results: controlled relief of control action, PD (Proportional Derivative) action.
Mitigation Parameter α00.30.61
Set point control (%)11.4212.1112.1212.20
Current above TV (%)1.271.060.820.58
Current in hysteresis (%)3.353.253.343.83
Wind capturing (%)88.1287.9287.4686.63
Table 10. Effect of installed control point (CTP) power with controlled action on CTPs. CGP, congestion point.
TVInstalled CTP93%100%115%130%
360 AiCGP,360 (%)0.580.580.590.57
iCGP,390 (%)0.160.160.150.14
capture (%)86.6284.5580.1876.07

390-360 AiCGP,360 (%)1.882.002.162.29
iCGP,390 (%)0.480.510.520.53
capture (%)90.0588.1483.9880.07

390 AiCGP,360 (%)1.942.062.202.32
iCGP,390 (%)0.480.520.530.53
capture (%)90.1688.2684.0680.07
Table 11. Effect of installed CTP power on theoretical wind capture.
TVInstalled CTP93%100%115%130%
360 Acapture (%)89.687.6483.4279.4
390 Acapture (%)93.291.487.483.56

