Article

Computational Fluid Dynamics and Visualisation of Coastal Flows in Tidal Channels Supporting Ocean Energy Development

Marine Energy Research Group, Swansea University, Singleton Park, Swansea SA2 8PP, UK
*
Author to whom correspondence should be addressed.
Energies 2015, 8(6), 5997-6012; https://doi.org/10.3390/en8065997
Submission received: 31 March 2015 / Revised: 20 May 2015 / Accepted: 9 June 2015 / Published: 18 June 2015
(This article belongs to the Special Issue Tools and Techniques for Economic Delivery of Ocean Energy)

Abstract

:
Flow characteristics in coastal regions are strongly influenced by the topography of the seabed and understanding the fluid dynamics is necessary before installation of tidal stream turbines (TST). In this paper, the bathymetry of a potential TST deployment site is used in the development of the a CFD (Computational Fluid Dynamics) model. The steady state k-ϵ and transient Large Eddy Simulation (LES) turbulence methods are employed and compared. The simulations are conducted with a fixed representation of the ocean surface, i.e., a rigid lid representation. In the vicinity of Horse Rock a study of the pressure difference shows that the small change in height of the water column is negligible, providing confidence in the simulation results. The stream surface method employed to visualise the results has important inherent characteristics that can enhance the visual perception of complex flow structures. The results of all cases are compared with the flow data transect gathered by an Acoustic Doppler Current Profiler (ADCP). It has been understood that the k-ϵ method can predict the flow pattern relatively well near the main features of the domain and the LES model has the ability to simulate some important flow patterns caused by the bathymetry.

1. Introduction

Modelling of the flow in an estuary or a channel depends on several parameters such as the bed friction factor and topography of the seabed. Other features like boulders and pinnacles can also affect the shape of the velocity profile and therefore affect the overall performance of a TST. Any model which is used to characterise the flow in a proposed TST deployment site has to have the ability to capture small scale turbulence. Turbulence effects on the structural integrity of turbine blades have been of interest for both wind and tidal energy [24]. In order to overcome this problem, ADCPs have been used to provide a better understanding of the flow properties [57].
Research has also been done to use ADCP data to generate turbulence synthetically to be used as an input to a Blade Element Momentum Theory model [8] to assess TST performance in very turbulent conditions [9]. In previous studies used to assess tidal energy resource, depth and velocity averaged data is extracted from admiralty navigational information such as [1013]. These assumptions have been criticised for incorrectly predicting the available resources. There are several issues such as “turbulence quantities”, “the rate at which a wake mixes with the free stream” and “velocity profile across the rotor” which must be considered [14]. A recent ADCP study which measured the properties of complicated flow in Ramsey Sound (West Wales) confirms that flow fields are spatially heterogeneous in three dimensions. Thus using depth-averaged velocity data to compute TST power extraction could provide inaccurate estimations [15], highlighting the necessity of detailed flow modelling for TST deployment sites.
Over the past few decades, large scale ocean modelling has been conducted and codes like TELEMAC [16,17] have been developed and are currently in practice to model free surface flow and waves in coastal regions. Research has been done in order to model the hydrology of ocean for the tidal sites [18,19]. All of this research is either based on using Shallow Water Equations (SWE) or applying Finite-Volume primitive equation Community Ocean Model (FVCOM). The SWE method is used when the ratio of depth to the length of the domain is very small and it is assumed that there is not any vertical shear on the flow. FVCOM uses the finite volume method so it is better at satisfying the mass conservation in comparison to methods which are using the finite element method (FEM). The FVCOM model consists of momentum, continuity, temperature, salinity, and density equations [20]. A 1D turbulence model which is called the General Ocean Turbulent Model (GOTM) has been added to the FVCOM model as well to solve the vertical mixing of the flow [21]. In all of the above-mentioned methods, an oceanographic grid was used to only model the general patterns of the flow and small scale turbulence (with a scale smaller than the grid cells) was neglected.
Selection of an appropriate modelling technique for a particular computational model is dependent on the requirements of the problem. Since the generation of eddies due to the seabed geometry is the area of interest for this research, turbulence has to be modelled. To model the small scale turbulence, oceanographic models are not suitable as they only model the general patterns of the flow and small scale turbulence (with a scale smaller than the grid cells) is neglected. It is necessary to employ turbulence models that can quantify the flow fluctuation in all directions as well as the important parameters which define the turbulence (turbulence kinetic energy, turbulence dissipation rate, turbulence length scale, etc.).
In general, it is possible to categorise turbulence models as either steady state or transient. Among the steady state frameworks, the two-equation turbulence methods (k-ϵ and k-ω) are the most commonly used [22]. For transient simulations, LES methods provide good results along with a lower computational cost in comparison to direct numerical simulation (DNS). Over the years a large amount of research has been done to model small scale sub-grid turbulence [2326]. Since resolving turbulence is computationally costly, the majority of turbulence models, particularly the transient ones, have been applied to small scale channel test cases and their results have been validated against the laboratory tests or benchmarked models. Almost all of these test cases did not consider the effect of real bathymetry in their efforts for small scale turbulence modelling. This research will concentrate on modelling flow over a rigid surface with a consideration of the seabed geometry and without considering any vegetation and sediment transport.
In addition to the novel flow analysis, this paper describes the application of a state-of-the-art visualisation system so that a greater understanding of the flow is achieved. Stream surfaces [1,27] have important inherent characteristics that can enhance the visual perception of complex flow structures. Lighting and shading reinforce the perception of shape and depth, images or textures can be mapped to the surface primitives providing additional visual information, colour and transparency can be used to convey additional data attributes. Stream surfaces are able to capture the features within the flow, and also have the inherent ability to convey further information about the local attributes of the flow. This, combined with the reduction in visual clutter when compared to using glyphs or streamlines, significantly enhances their utility for practitioners.

2. Theory and Method

In this research the turbulence in the flow is modelled using the k-ϵ method for steady state problems and the LES method for transient problems. The reason for choosing the k-ϵ method is that it is proven to provide accurate results in most cases and this makes it by far the most popular two-equation turbulence model [22]. Large eddy simulation is used as it can model the instantaneous turbulence properties of the flow with good approximation without having the extensive computational costs of direst numerical simulations (DNS) and the near solid boundary simplifications of detached eddy simulation (DES) [22]. These methods will be discussed in detail in the following sections.

2.1. Standard k-ϵ Turbulence Model

One of the most commonly used RANS (Reynolds-averaged Navier–Stokes) turbulence models is the standard k-ϵ turbulence model. The time averaged form of Navier–Stokes equations can be written as:
( ρ v ) = 0
( ρ v v i ) = p x i + ( [ μ l + μ t ] [ ρ v i ] ) + S i
where ρ is density, p is the pressure, v is the velocity vector, vi is the ith component of the velocity vector, µl and µt are the laminar and turbulent dynamic viscosities respectively, and Si includes any additional sources [28,29].
The main focus of the k-ϵ model is on the mechanism of turbulent kinetic energy and can be expressed by two transport equations. The main parameters are k which is the turbulence kinetic energy and ϵ which is the turbulent dissipation rate:
( ρ k ) t + ( ρ v k ) = ( [ μ l + μ t σ k ] k ) + μ t G ρ
( ρ ) t + ( ρ v ) = ( [ μ l + μ t σ ] ) + C 1 μ t G k C 2 ρ 2 k
The values, C1ϵ, C2ϵ, σk, and σϵ, are the closure constants, which are found empirically and are 1.44, 1.92, 1.0 and 1.3 respectively [29,30]. The turbulent generation rate G is defined by:
G = 2 ( [ u x ] 2 + [ v y ] 2 + [ w z ] 2 ) + ( u y + v x ) + ( u z + w x ) + ( w y + v z )
The dynamic turbulent viscosity is calculated using [31]:
μ t = ρ C μ k 2
The parameter Cµ is a constant with the value of 0.09. The coupling between turbulence and momentum equations is achieved through the dynamic viscosity which is a sum of the laminar and turbulent values. In all of the equations, since the flow is incompressible, the derivative of density over time is zero [32].
The turbulence length scale gives a better understanding of turbulent flow. This is representative of the large scale turbulence and is defined as “a physical quantity describing the size of the large energy-containing eddies in a turbulent flow” [33]. The following equation is used to calculate this parameter which is used in this work to obtain the inlet boundary conditions for a CFD simulation:
l = C μ 0.75 k 1.5

2.2. Large Eddy Simulation (LES)

To solve the large eddies explicitly a filtered approach to the Navier-Stokes equation is used in which the filter is defined by the grid size. The small eddies are modeled implicitly by using a subgrid-scale model (SGS model) [34].
The filtered continuity and momentum equations use filtered variables
ρ t + ρ u ¯ j x j = 0
and
ρ u ¯ i t + ρ u ¯ i u ¯ j x j = p ¯ x i + τ i j x j + σ i j x j
in which τij is the filtered stress tensor and σij is the subgrid-scale Reynolds stresses.
Physically, the dynamic coupling between large and small scales in turbulence is described by the SGS stress. Dimensionally, it scales quadratically with turbulent velocity differences at scales of order ∆ [35]. To solve the SGS model one of the most commonly used approaches is the Smagorinsky [36] model.
μ t = ( C s Δ ) 2 2 S i j S i j
where µt is the turbulent viscosity, ∆ is the length scale of the filter, Sij is the filtered strain-rate tensor, Cs is the Smagorinsky constant. The length scale of the filter, ∆, is usually considered to be the cube root of the volume of the cell [34].
Choosing the right inlet boundary condition is important for LES because it affects the quality of the results. In the steady-state models, a uniform inflow speed along with the turbulence parameters is defined whereas for the LES method a turbulent unsteady inlet condition is needed [37]. The Vortex Method has been developed for generating inlet velocity fluctuations [38]. This method, instead of applying random noise at the inlet, provides some spatial correlations for the fluctuations. In this method random vortices are created on the inlet flow plane (normal to the streamwise velocity) in a way that the wall-normal components gives a spatial correlation, and the Lagevin equation [39] is used to provide a temporal correlation not only for the generation of the streamwise component but also for the other two cross-stream components [34]. The vortex method is based on a Lagrangian formulation of Navier–Stokes. The centres of the vortices are transported and the velocity is given a certain distribution [34].
In the Vortex Method the vorticity is calculated by defining a circulation parameter, the intensity of which is quantified as a function of the turbulent kinetic energy that can be calculated from a RANS calculation [40]. For each vortex, a characteristic time (which is also known as the turbulent time scale = k/ϵ) is defined which represents the life time of a vortex. If the time exceeds this characteristic time, then it is destroyed and another random vortex is created on the 2D plane in the inlet. The diameter of the vortices can be set to a fixed number or can be calculated by using a turbulent length scale approach l = k 2 3 / . Then the vortices carry a random walk in the inlet plane to develop fluctuation in time [34].

2.3. Visualisation Technique

A stream surface [1] is the integration of a one dimensional curve through 3D steady flow. The resulting surface is everywhere tangential to the local flow. Since there is no normal component of the velocity along stream surfaces, they are useful for separating distinct regions of similar flow behaviour. These surfaces must represent an accurate approximation of the underlying simulation. Adequate sampling must be maintained while reducing the unnecessary computational overhead associated with over sampling. In practical applications a discretised approximation of the stream surface is constructed by integrating discretised seeding curves through the vector field.
To describe the stream surface [1], a streamline is first defined. A streamline is a curve which is tangential to the velocity field at every point along its length. Streamlines show the direction fluid flows within a steady state flow domain. If v ( p ) is a three dimensional vector field, the streamline through a point, p 0, is the solution I s ( p 0 , t ) to the differential equation:
d d t I s ( p 0 , t ) = v ( I s ( p 0 , t ) )
where, in the case of a steady state flow field, t is time, and the initial condition I ( p 0 , 0 ) = p 0. A stream surface [1] is the trace of a one dimensional seeding curve, C, through the flow. The resulting surface is everywhere tangential to the local flow. A stream surface, S, is defined by:
S ( s , t ) : = I s ( C ( s ) , t )
where S is the union or continuum of integral curves passing through the seeding curve C. S(s, −) coincides with an individual integral curve, and S(−, t) coincides with individual time lines.
With the use of surfaces problems such as occlusion can arises. This may stem from multiple surfaces that occlude one another, a large surface that results in self occlusion, or a combination of both. The use of transparency is a generalised solution to this problem. With stream surfaces additional options are available, for example, illustrative techniques can by utilised to improve the visual cues, and thus the visual perception of the underlying data [27]. Figure 1 highlights these characteristics, and demonstrates the use of a visualisation framework [41] for prototyping visualisation algorithms.

3. Domain

One suitable site in the UK for deployment of TSTs is Ramsey Sound in Pembrokeshire, Wales. The Sound is confined by the Irish Sea to the north and south and it is approximately 3 km long. The width of the channel varies between about 500 m to approximately 1600 m [42]. Kinetic energy of the water has been analysed with a regional coastal model and an estimate of the amount of power available in Ramsey Sound is 74.9 GWh/y [43]. It is going to be the site of DeltaStream, Wales’ first tidal stream turbine, which has consent to install a 1.2 MW pre-commercial prototype device for 12 months [44,45].
For flow modelling, an area in the vicinity of the installation site was chosen which is located between Ramsey Island and the mainland with an area of approximately 800 × 1800 m2. The bathymetry data was collected during the “Celtic Odyssey Operation”, using an echosounder [44] and then MATLAB® V4 grid data method which uses the Green functions of the biharmonic operator to find the minimum curvature interpolation of irregularly spaced data points was employed to generate the seabed geometry [46].
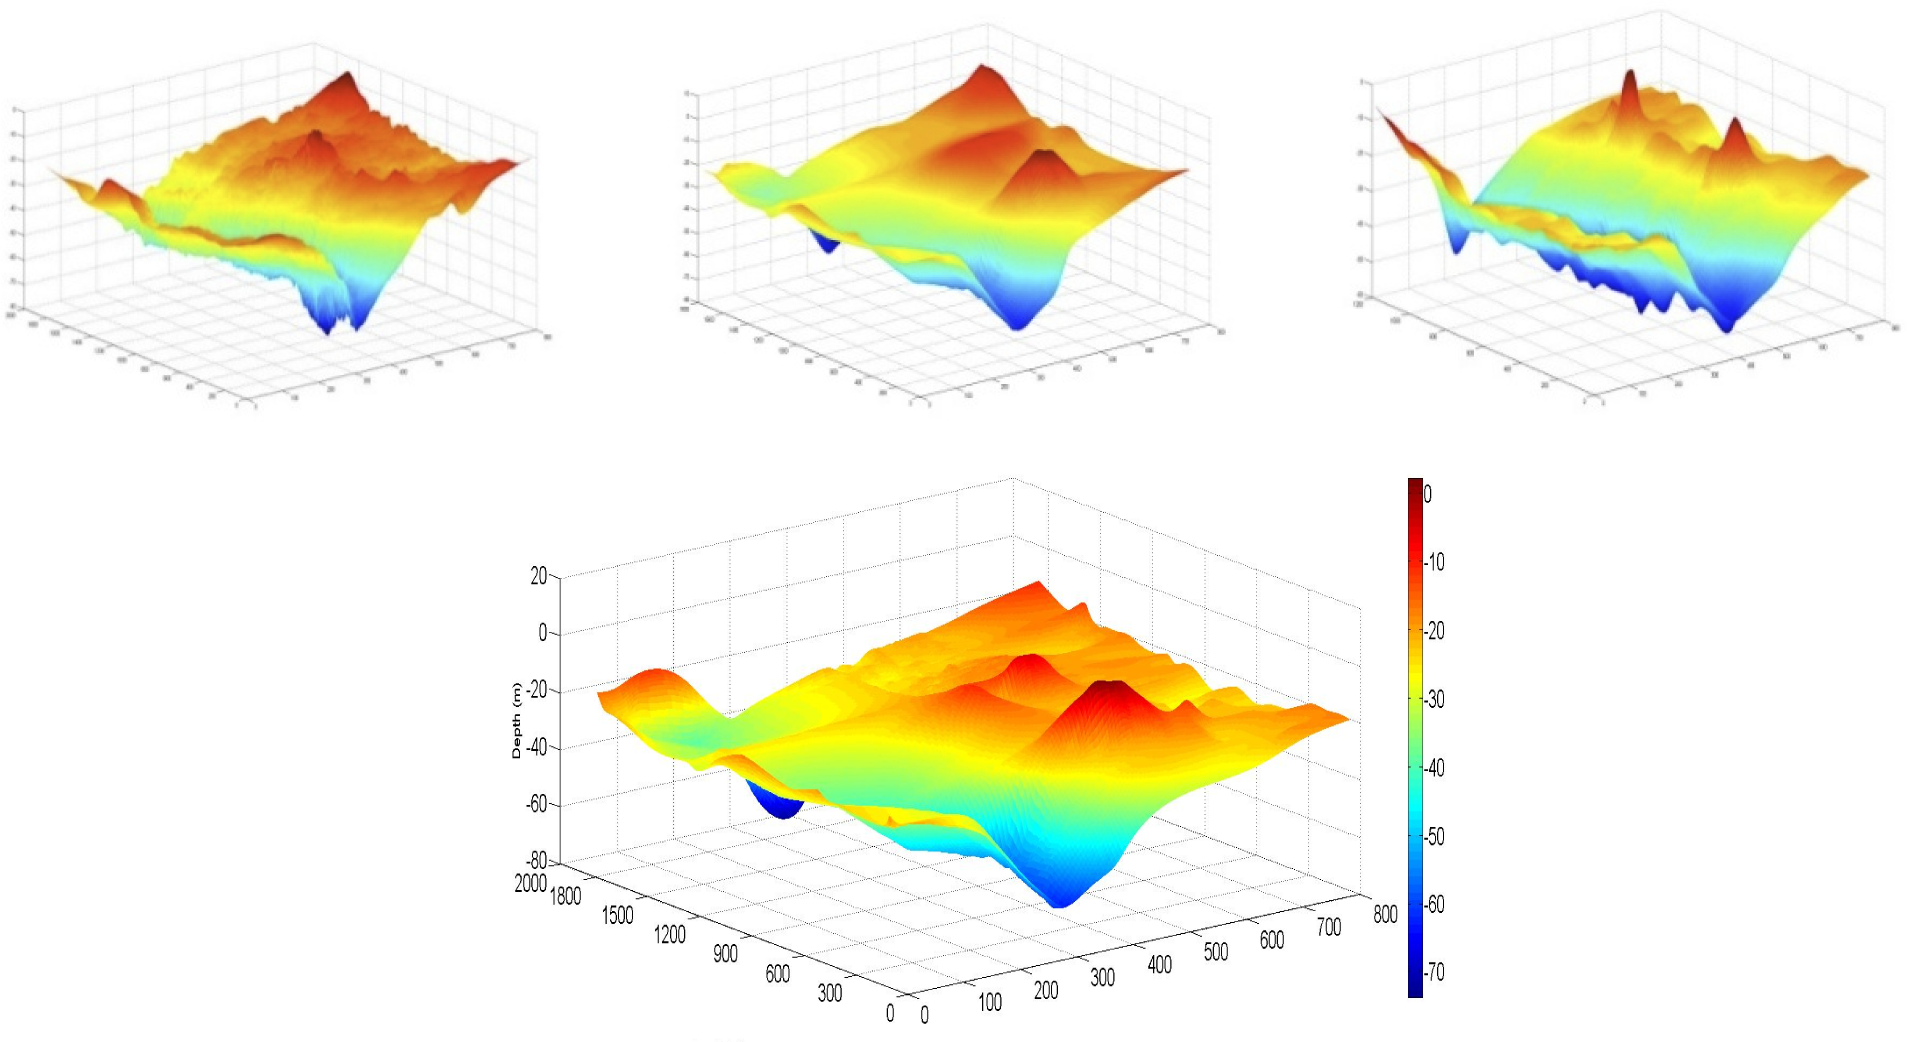
The quality of data was not assured in all locations as some of the features of the seabed are not visible in the boat data. This is due to the tide and sea conditions preventing the boat from approaching some areas of the sea. Thus it was decided to use two additional datasets to recreate the bathymetry. One of the datasets was provided by SeaZone®. This satellite data has a resolution of 30 m which means that the surface that is created by this dataset is very smooth and does not include the pinnacles and small rocks. The second dataset used was a historic dataset made available by the Royal Navy and was measured using a lead line in the early 20th century. In the regions where less information was available from the other two datasets, this was used to confirm the geometry of the seabed.
To create the final geometry the whole area was divided into 4 regions. For each region the quality of information in each dataset for that zone was investigated. For example, the quality of echosounder data was not acceptable for the deep valley and the Royal Navy dataset was not very accurate for the same region as well, so it was decided to use the SeaZone® dataset to construct that region. The same evaluation was done for the other regions and the final geometry of the seabed was constructed. Afterwards the proposed geometry of the seabed was discussed with the locals and boat skippers who were familiar with the area and the bathymetry was finalised. The result gives us a bathymetry which is not only relatively simple to mesh but also resembles the key features of the region accurately, see Figure 2.
The elevation for the selected area varies between +5 m and −74 m with the zero altitude datum set to be the highest peak on the seabed. The decision to have 5 m of water above the peak is based on the tidal range measured by the nearby Milford Haven tide gauge and gives the correct height of the high tide inside the sound. This distance was also discussed with local vessel operators who agreed with this assessment of the high tide clearance. In order to capture the eddies generated by the seabed and Horse Rock a fine discretised domain is considered that consists of more than 36.3 million elements (combination of tetrahedral, brick, pyramid and surface triangular). In this mesh, the vertical size of the first four layers of elements above the seabed is set to be 25 cm and then doubled for each level above up to 5 m height (i.e., fifth layer 50 cm, sixth layer 1 m, etc.). The smallest element in the flow direction is nearly 0.5 m and the largest element is slightly over 10.8 m. However, the mesh has been constructed so that over 80% of the elements are restricted to be below 2.1 m in length. This geometry is used for both the k-ϵ and LES turbulence models.
The simulation uses the commercial code ANSYS FLUENT®. The inlet velocity for the k-ϵ case is set to be 1.5 m/s with a turbulent intensity of 20% and turbulent viscosity ratio of 100. For the bed boundary condition a no slip wall with roughness height (ks) of 5.4 m and roughness constant of 0.9 is selected. In ANSYS FLUENT® the roughness constant is a value to define how uniformly the sand grains are distributed on the surface. A suitable value is usually between 0.5 and 1.0 and the smaller number means that the sand grains (here rocks) are placed on the surface more uniformly [47]. ANSYS FLUENT® uses the following equation to calculate the roughness height: Roughness Height = (9.793 × Roughness Length)/Roughness Constant. In which the roughness constant is a value to define how uniformly the sand grains are distributed on the surface, the roughness length is calculated based on the Nikuradse Sand Roughness. Based on this equation the size of the grains on the seabed is averaged to be roughly 0.5 m.
ANSYS FLUENT® uses the logarithmic law of wall to solve the wall-bounded turbulent flows [33]. The reason for selecting these values (5.4 for roughness height and 0.9 for roughness constant) is that the model has simplifications in terms of the exact shape of the bed and also in terms of the inlet boundary condition. In the real world, the inlet has a very turbulent boundary condition because of the big rocks located in the south of the sound (known as the bitches).
To model the free surface, a flat plane symmetry boundary condition (i.e., zero shear non slip wall) is applied to the upper surface of the domain. This rigid lid approach has been used in various research papers to model the turbulent flow in channels [4850]. It is also possible to model channels with a rigid but sloping lid [51,52], where the slope corresponds to a drop of 1/1000, for example, as observed in the field. This has not been applied here due to the complexity of the bed forms.
To model the subgrid-scale turbulence for the LES, the Smagorinsky–Lilly method is selected. Again the same inlet velocity as for the k-ϵ model has been chosen for the flow. By using the Vortex Method to create random fluctuations at the inlet, 1000 vortices are applied at the inlet. A turbulent intensity of 20% along with the turbulent length scale of 1m is chosen. Other boundary conditions are identical to the k-ϵ case.
A constant time step size of 6 seconds is selected. This value is calculated by multiplying the time that it takes for the flow to pass through the smallest element in the streamwise direction by a factor of 10. The maximum number of iterations for each time step is set to be 40. To run this simulation the HPC Wales platform is equipped with Intel Sandy Bridge E5-2690 at 2.9 GHz and 4 GB memory per core. The total problem is run for 5000 time steps and it takes about 466 h to run the LES job on 32 cores which is the maximum number of cores available to run the simulations.

4. Results

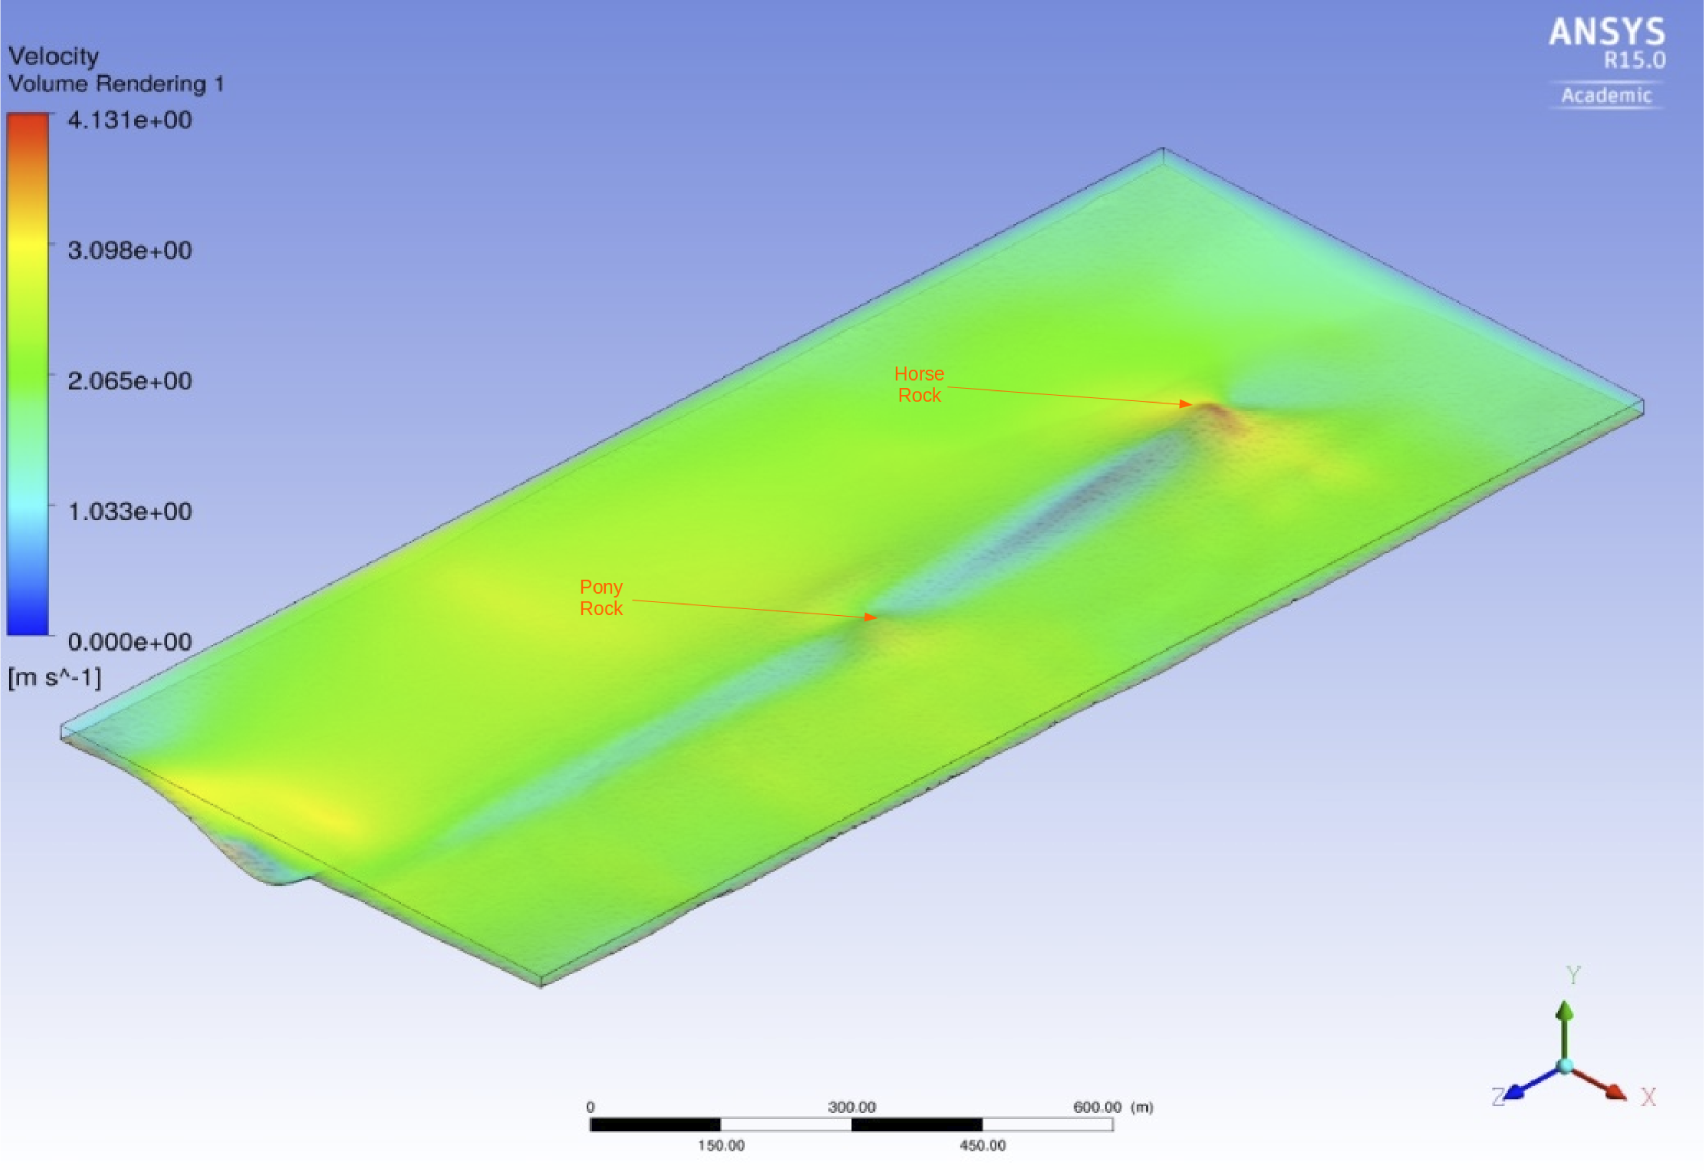
Figure 3 shows the results of velocity contours for the k-ϵ method. It clearly shows the influence of Horse Rock and Pony Rock forming a wake in the flow field. The largest velocity reduction occurs behind the main feature of the sound, Horse Rock (775 m from the inlet), and this can be see in the data collected by an ADCP transect as shown in Figure 4. The ADCP data shown here is from a single transect and was collected from a moving vessel at a low sample rate of 1 Hz.
The boat data only shows the velocity for only one transect across the channel. This data is noisy due to the condition of the sea on that particular date. Averaging several transects at a given location would provide data with improved noise characteristics. The averaged data can provide a better understanding about the state of the sea, and deliver a better comparison. Due to the transient nature of the model, vortices and eddies are constantly generated and dissipated, thus the results of consecutive iterations could show more fluctuations.
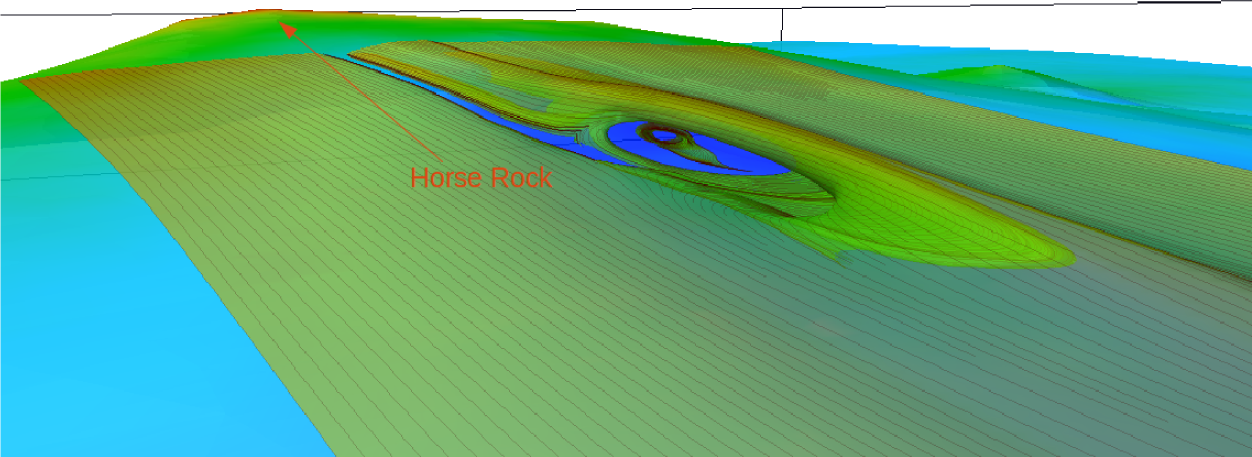
The LES result (Figure 5) shows that at least one eddy is forming behind Horse Rock. Figure 4 also shows two bodies of water coming from each side of the Rock and circling around the generated eddy before joining each other again further downstream. In Figure 6 it can be seen that the eddy is very flat. It starts its movement upward but then it seems that because of the fast water flowing overhead, it is crushed.
Another reason for this could be the restriction of the domain in the vertical direction. In a free surface model the eddy would propagate to the surface. (Figure 7) shows that near the gully close to the exit of the model the flow coming from both sides rushes down the channel. The general feature of the results in which the flow is very smooth near the surface is observed here as well. Eddies are formed as the flow comes off the edge of the deep valley and then it meets the flow coming from the other side of channel which cause both bodies of water to swirl. This pattern shows that different layers of the flow behave independently and have their own pattern due to the features on the seabed.
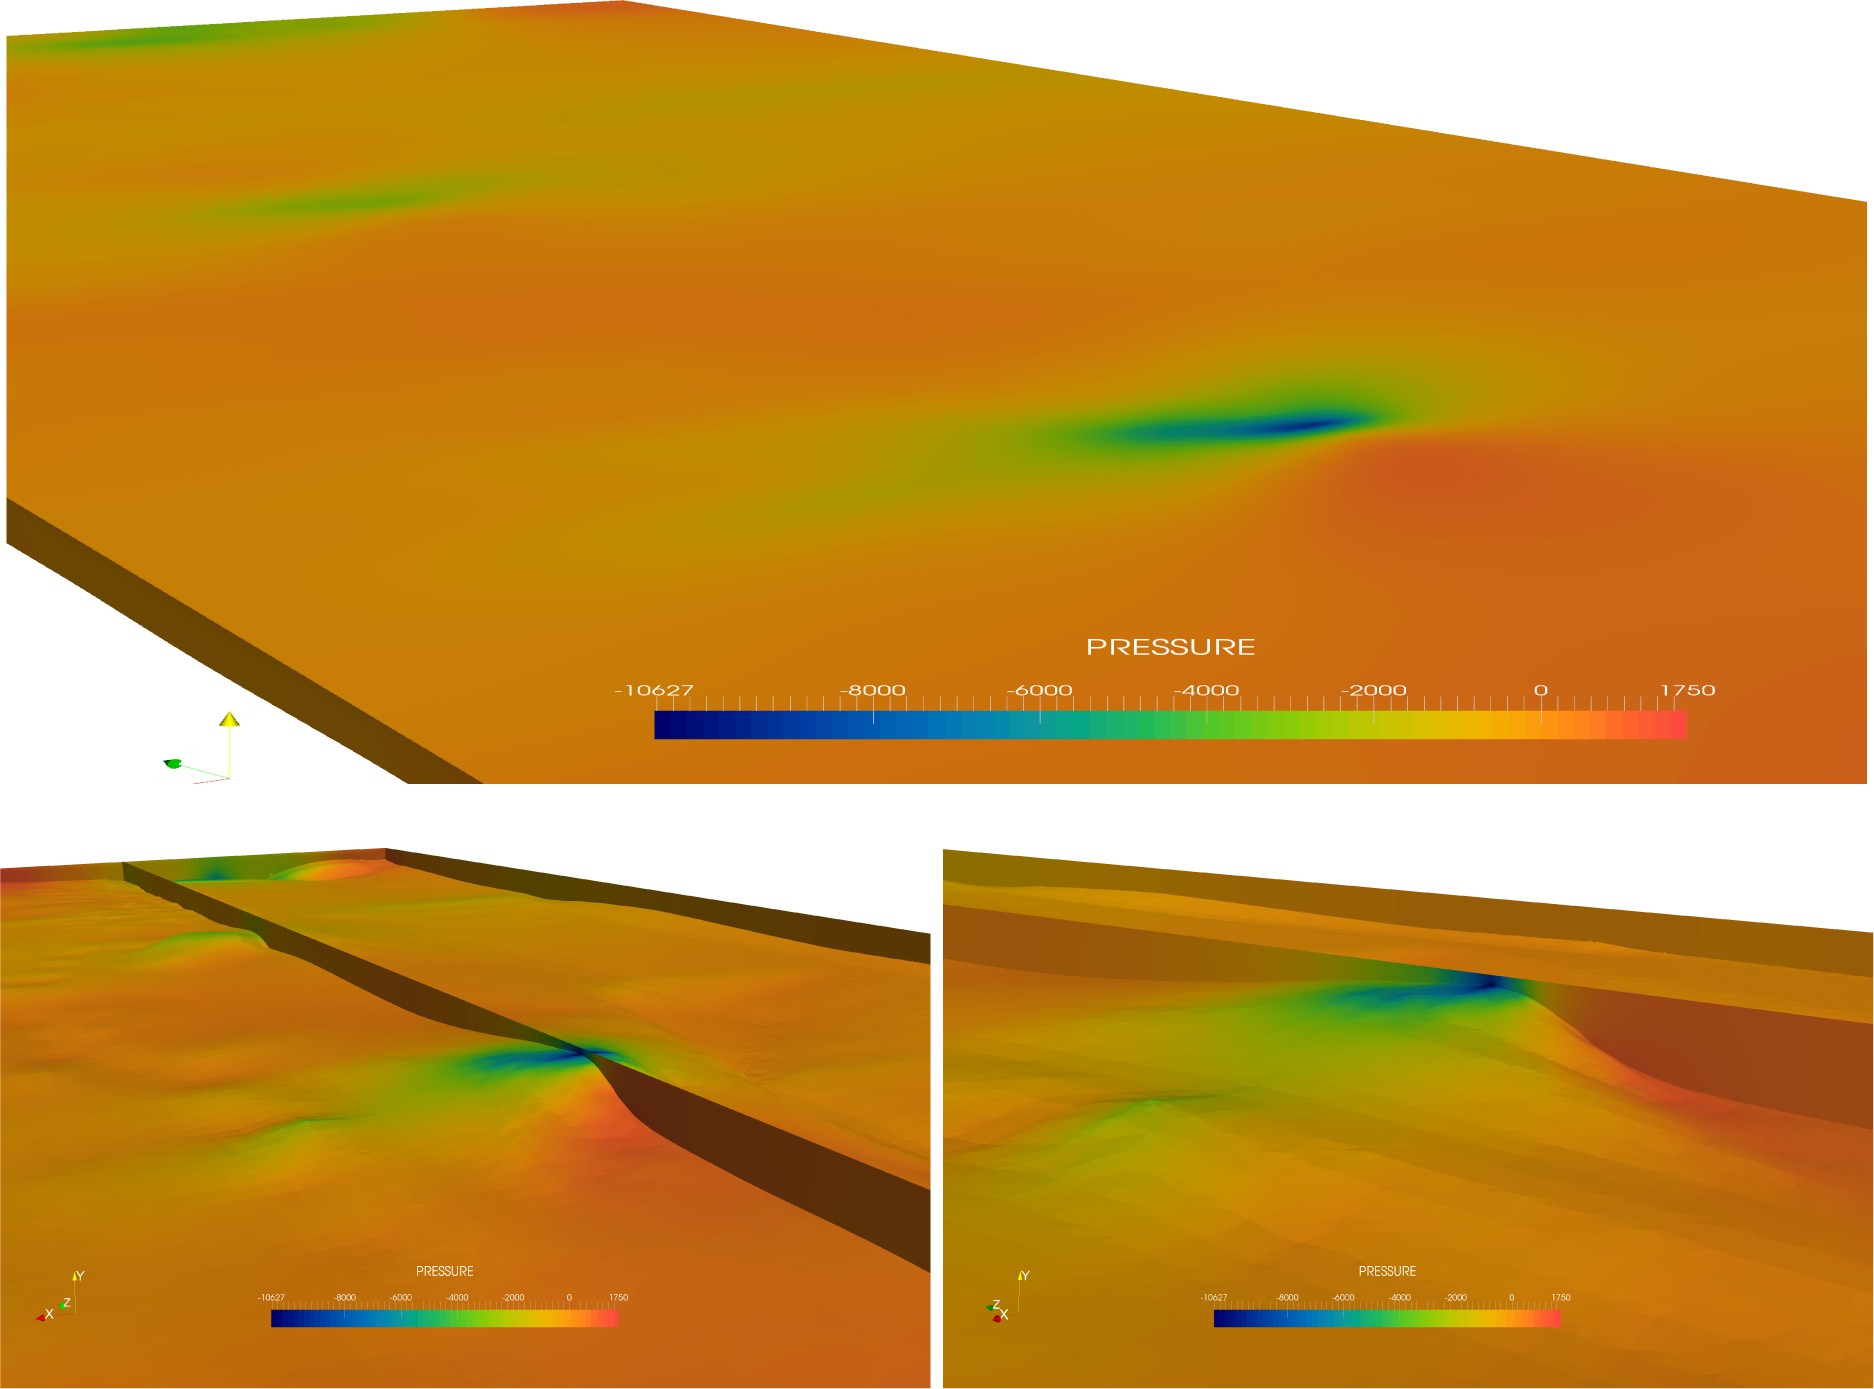
The simulations are conducted with a rigid lid representation of the ocean surface. Changes in sea surface level in the vicinity of some underwater obstruction, in this case Horse rock, effect flow characteristics in this region. The quantitative effect of this phenomena, and thus the accuracy of the prediction using a fixed lid, is assessed by studying the pressure change across Horse rock. The pressure field is sampled at the fixed lid at locations of maximum pressure upstream and minimum pressure downstream of the subsurface obstruction, as shown in Figure 8. Change in height resulting from the pressure difference can be predicted using the hydrostatic pressure relation between fluid height and pressure: p = ρgh, where ρ is the density of the fluid, g is gravity, and h is height. Rearranging for h using values of 9.81 m/s for gravity, 1000 kg/m3 for density and 9763 N/m2 for the pressure drop, h is calculated to be 0.995 m at a distance of 61 m downstream of Horse Rock. The samples are taken at x = 449, y = 5, z = 361, where p = −9014 and x = 449, y = 5, z = 300, where p = 749. Given the scale of the model and the small amount of blockage we can assume that the results are not significantly affected by the rigid lid. Therefore, the significant computational overhead of a free surface is not required in this case.

5. Conclusions

In this research the flow modelling and visualisation of a real bathymetry was investigated. The purpose of this model is to apply these methods to give a realistic view about the behaviour of flow in coastal regions before the deployment of tidal turbines. Two different turbulence models have been investigated for a possible site deployment of TST and the model results were compared with the real flow data acquired from the location. It has been understood that the k-ϵ method can predict the flow pattern with relatively good accuracy near the main features of the domain and although the LES model has the ability to demonstrate some expected flow patterns because of the bathymetry, it still needs more investigation before considering it for a possible robust method for solving these kinds of problems. Due to its nature, the LES model could provide more precise results in this current problem if there had been more knowledge about the inlet boundary conditions. In ocean modelling the target area is very extensive compared to a usual application of CFD and the vortices created by the vortex method at the inlet are not propagating all along the length of the domain, therefore it is suggested that a direction for future work would be the definition of a suitable bed boundary condition that can generate such turbulent structures in the flow.
Having the free surface feature helps the model to behave more realistically near the surface. It was shown in Figure 7 that the forming eddy is propagating towards the surface and because in the simulations presented here a rigid lid was placed on the top surface, the propagation of it is restricted. With a free surface model included the eddy may continue to develop toward the sea surface and emerge as a swirl of the surface. However the analysis of the pressure difference across the subsurface obstruction demonstrates a small change in height relative to the distance downstream which is not significantly affected by the rigid lid assumption. This demonstrates a reasonable level of confidence in the simulation results. The simulations showed that although using traditional k-ϵ and LES models can give reasonable results, in order to have a more precise model that can cover all the aspects of coastal flows it is necessary to customise the bed roughness parameters in a way that can compensate the effects of simplification of the bathymetry.

Acknowledgments

This work was undertaken as part of the Low Carbon Research Institute Marine Consortium and the Engineering and Physical Sciences Research Council (EPSRC) UK Centre for Marine Energy Research (EP/I027912/1). The Authors wish to acknowledge the financial support of the Welsh European Funding Office and the European Regional Development Fund Convergence Programme. The work was also supported by the EPSRC Supergen funded Terawatt project (EP/J010170/1) and the EPSRC Supergen funded ’The effects of realistic tidal flows on the performance and structural integrity of tidal stream turbines’ project (EP/J010200/1). Thanks also to HPC Wales for access to computational resources.

Author Contributions

Enayatollah Zangiabadi performed the simulations, collated and studied the results, and wrote aspects of the paper. Matt Edmunds wrote the visualisation software and studied the LES results using stream surface techniques, and wrote aspects of the paper. Ian Masters collated, studied and compared the ADCP data. Iain Fairley collected the data for, and generated the bathymetry and mesh. Michael Togneri provided the boundary conditions, turbulence characteristic estimations, and model setup in this study. Alison J. Williams wrote and proof read the paper. Nick Croft conceived and designed the experiments.

Conflicts of Interest

The authors declare no conflict of interest.

References

  1. Edmunds, M.; Laramee, R.S.; Chen, G.; Max, N.; Zhang, E.; Ware, C. Surface-based flow visualization. Comput. Graph 2012, 36, 974–990. [Google Scholar] [Green Version]
  2. Val, D.V.; Chernin, L.; Yurchenko, D.V. Reliability analysis of rotor blades of tidal stream turbines. Reliab. Eng. Syst. Saf. 2014, 121, 26–33. [Google Scholar]
  3. Sicot, C.; Devinant, P.; Loyer, S.; Hureau, J. Rotational and turbulence effects on a wind turbine blade. Investigation of the stall mechanisms. J. Wind Eng. Ind. Aerodyn. 2008, 96, 1320–1331. [Google Scholar]
  4. Mycek, P.; Gaurier, B.; Germain, G.; Pinon, G.; Rivoalen, E. Experimental study of the turbulence intensity effects on marine current turbines behaviour. Part II: Two interacting turbines. Renew. Energy 2014, 68, 876–892. [Google Scholar]
  5. Milne, I.; Sharma, R.; Flay, R.; Bickerton, S. Characteristics of the turbulence in the flow at a tidal stream power site. Philos. Trans. R. Soc. A Math. Phys. Eng. Sci. 2013, 371. [Google Scholar] [CrossRef]
  6. Lu, Y.; Lueck, R.G. Using a broadband ADCP in a tidal channel. Part II: Turbulence. J. Atmos. Ocean. Technol. 1999, 16, 1568–1579. [Google Scholar]
  7. Lorke, A.; Wüest, A. Application of coherent ADCP for turbulence measurements in the bottom boundary layer. J. Atmos. Ocean. Technol. 2005, 22, 1821–1828. [Google Scholar]
  8. Masters, I.; Chapman, J.; Orme, J.; Willis, M. A robust blade element momentum theory model for tidal stream turbines including tip and hub loss corrections. J. Mar. Eng. Technol. 2011, 10, 25–35. [Google Scholar]
  9. Togneri, M.; Masters, I.; Orme, J. Incorporating turbulent inflow conditions in a blade element momentum model of tidal stream turbines, In Proceedings of the 21st 2011 International Offshore and Polar Engineering Conference (ISOPE), 19–24 June 2011; Maui: HI, USA.
  10. Black and Veatch Limited. Tidal Stream Energy Resource and Technology Summary Report; Technical Report 107799/D/2200/04; Black and Veatch Limited: Middlesex, UK, 2005. [Google Scholar]
  11. Fraenkel, P.I.; Musgrove, P.J. Tidal and river current energy systems, Proceedings of the IEEE International Conference on Future Energy Concepts, 30 January –1 February 1979; London, UK; pp. 114–117.
  12. Binnie and partners, Sir Robert McAlpine & Sons Ltd and IT Power Ltd. Tidal Stream Energy Review; Technical report etsu-t-05/00155/rep, dti; Harwell Laboratory, Energy Technology Support Unit ETSU: Brighton, UK, 1993. [Google Scholar]
  13. European Commission. The Exploitation of Tidal and Marine Currents; Technical Report EUR 16683 EN; Wave Energy, Project Results; Directorate-General for Science, Research and Development: Brussels, Belgium, 1996. [Google Scholar]
  14. Blunden, L.; Bahaj, A. Tidal energy resource assessment for tidal stream generators. Proc. Inst. Mech. Eng. A J. Power Energy 2007, 221, 137–146. [Google Scholar]
  15. Evans, P.; Mason-Jones, A.; Wilson, C.; Wooldridge, C.; O’Doherty, T.; O’Doherty, D. Constraints on extractable power from energetic tidal straits. Renew. Energy 2015, 81, 707–722. [Google Scholar]
  16. Galland, J.C.; Goutal, N.; Hervouet, J.M. TELEMAC: A new numerical model for solving shallow water equations. Adv. Water Resour 1991, 14, 138–148. [Google Scholar]
  17. IMCS, Ocean Modelling Group. Regional Ocean Modelling System (ROMS). Available online: http://www.myroms.org/(accessed accessed on 4 Sptember 2014.
  18. Ahmadian, R.; Falconer, R.; Lin, B. Hydro-environmental modeling of proposed Severn barrage, UK. Proc. ICE-Energy 2010, 163, 107–117. [Google Scholar]
  19. Brammer, J.; Falconer, R.; Ellis, C.; Ahmadian, R. Physical and numerical modelling of the Severn Barrage. Sci. China Technol 2014, 57, 1471–1481. [Google Scholar]
  20. Chen, C.; Liu, H.; Beardsley, R.C. An unstructured grid, finite-volume, three-dimensional, primitive equations ocean model: Application to coastal ocean and estuaries. J. Atmos. Ocean. Technol. 2003, 20, 159–186. [Google Scholar]
  21. Burchard, H.; Bolding, K.; Villarreal, M.R. GOTM, A General Ocean Turbulence Model: Theory, Implementation and Test Cases; Space Applications Institute: Athens, Greece, 1999. [Google Scholar]
  22. Wilcox, D.C. Turbulence Modeling for CFD, 2nd ed; DCW Industries: La Cañada Flintridge, CA, USA, 1998. [Google Scholar]
  23. Schlichting, H.; Gersten, K.; Gersten, K. Boundary-Layer Theory; Springer Science & Business Media: Berlin/Heidelberg, Germany, 2000. [Google Scholar]
  24. Sarkar, A.; So, R. A critical evaluation of near-wall two-equation models against direct numerical simulation data. Int. J. Heat Fluid Flow 1997, 18, 197–208. [Google Scholar]
  25. Bomminayuni, S.; Stoesser, T. Turbulence statistics in an open-channel flow over a rough bed. J. Hydraul. Eng. 2011, 137, 1347–1358. [Google Scholar]
  26. Kuban, L.; Laval, J.P.; Elsner, W.; Tyliszczak, A.; Marquillie, M. LES modeling of converging-diverging turbulent channel flow. J. Turbul 2012, 13. [Google Scholar] [CrossRef]
  27. Edmunds, M.; Laramee, R.; Malki, R.; Masters, I.; Croft, T.; Chen, G.; Zhang, E. Automatic stream surface seeding: A feature centered approach. Comput. Graph. Forum. 2012, 31, 1095–1104. [Google Scholar]
  28. Launder, B.; Spalding, D. Mathematical Models of Turbulence; Academic Press: London, UK, 1972. [Google Scholar]
  29. Launder, B.E.; Spalding, D. The numerical computation of turbulent flows. Comput. Methods Appl. Mech. Eng. 1974, 3, 269–289. [Google Scholar]
  30. Versteeg, H.K.; Malalasekera, W. An Introduction to Computational Fluid Dynamics: The Finite Volume Method; Pearson Education: New York, NY, USA, 2007. [Google Scholar]
  31. Jones, W.; Launder, B. The prediction of laminarization with a two-equation model of turbulence. Int. J. Heat Mass Transf 1972, 15, 301–314. [Google Scholar]
  32. Zangiabadi, E.; Masters, I.; Williams, A. Characterisation of the coastal hydrology of oceans using 3D computational fluid dynamics, Proceedings of the 4th International Conference on Ocean Energy, Dublin, Ireland, 17 October 2012.
  33. ANSYS Inc. ANSYS FLUENT Theory Guide; ANSYS Inc: Canonsburg, PA, USA, 2010. [Google Scholar]
  34. Benhamadouche, S.; Jarrin, N.; Addad, Y.; Laurence, D. Synthetic turbulent inflow conditions based on a vortex method for large-eddy simulation. Prog. Comput. Fluid Dyn. Int. J. 2006, 6, 50–57. [Google Scholar]
  35. Moeng, C.H.; Sullivan, P. Large eddy simulation. Encycl. Atmos. Sci. 2002, 1140, 1150. [Google Scholar]
  36. Smagorinsky, J. General circulation experiments with the primitive equations: I. The basic experiment. Mon. Weather Rev 1963, 91, 99–164. [Google Scholar]
  37. Jarrin, N.; Benhamadouche, S.; Laurence, D.; Prosser, R. A synthetic-eddy-method for generating inflow conditions for large-eddy simulations. Int. J. Heat Fluid Flow 2006, 27, 585–593. [Google Scholar]
  38. Sergent, E. Vers une Methodologie de Couplage Entre la Simulation des Grandes Echelles et les Modeles Statistiques. Ph.D. Thesis, Ecole centrale de Lyon, Ecully, France, 2002. [Google Scholar]
  39. Langevin, P. On the theory of Brownian motion. C. R. Acad. Sci. (Paris) 1908, 146, 530–533. [Google Scholar]
  40. Zangiabadi, E. Using 3D-CFD Methods to Investigate Hydrology of Oceans and Fish Passage through Tidal Stream Turbines. Ph.D. Thesis, Swansea University, Swansea, UK, 2015. [Google Scholar]
  41. Edmunds, M.; Tong, C.; Laramee, R.S. Design of a flow visualisation framework. Computers 2015, 4, 24–38. [Google Scholar]
  42. Evans, P.; Armstrong, S.; Wilson, C.; Fairley, I.; Wooldridge, C.; Masters, I. Characterisation of a highly energetic tidal energy site with specific reference to hydrodynamics and bathymetry. Proceedings of the European Wave and Tidal Energy Conference EWTEC, Aalborg, Denmark, 2–5 September 2013.
  43. Fairley, I.; Neill, S.; Wrobelowski, T.; Willis, M.; Masters, I. Potential array sites for tidal stream electricity generation off the pembrokeshire coast. Proceedings of the 9th European Wave and Tidal Energy Conference, Southampton, UK, 5–9 September 2011.
  44. Fairley, I.; Evans, P.; Wooldridge, C.; Willis, M.; Masters, I. Evaluation of tidal stream resource in a potential array area via direct measurements. Renew. Energy 2013, 57, 70–78. [Google Scholar]
  45. Tidal Energy Limited. Wales’ First Full-Scale Tidal Energy Generator Unveiled Ahead of Its Installation in Welsh Waters. Available online: http://www.tidalenergyltd.com/?p=2191 accessed on 30 September 2014.
  46. Sandwell, D.T. Biharmonic spline interpolation of GEOS-3 and SEASAT altimeter data. Geophys. Res. Lett. 1987, 14, 139–142. [Google Scholar]
  47. Pattanapol, W.; Wakes, S.J.; Hilton, M.J.; Dickinson, K.J. Modeling of surface roughness for flow over a complex vegetated surface. Int. J. Math. Phys. Eng. Sci. 2008, 2, 18–26. [Google Scholar]
  48. Yue, W.; Lin, C.L.; Patel, V.C. Large-eddy simulation of turbulent flow over a fixed two-dimensional dune. J. Hydraul. Eng. 2006, 132, 643–651. [Google Scholar]
  49. Stoesser, T.; Braun, C.; Garcia-Villalba, M.; Rodi, W. Turbulence structures in flow over two-dimensional dunes. J. Hydraul. Eng. 2008, 134, 42–55. [Google Scholar]
  50. Xie, Z.; Lin, B.; Falconer, R.A. Turbulence characteristics in free-surface flow over two-dimensional dunes. J. Hydro-Environ. Res. 2014, 8, 200–209. [Google Scholar]
  51. Malki, R.; Masters, I.; Williams, A.J.; Croft, T.N. A numerical investigation into tidal stream turbine wake dynamics and device performance in non-uniform flows, Proceedings of the 22nd 2012 International Offshore and Polar Engineering Conference, 17–23 June 2012; ISOPE, Rhodes: Greece.
  52. Masters, I.; Malki, R.; Williams, A.J.; Croft, T.N. The influence of flow acceleration on tidal stream turbine wake dynamics: A numerical study using a coupled BEM–CFD model. Appl. Math. Model. 2013, 37, 7905–7918. [Google Scholar]
Figure 1. This illustration demonstrates a simple stream surfaces seeded in front of a cuboid, and capturing the flow characteristics, i.e., vortices, emanating downstream from the cuboid. This visualisation is constructed using the framework described in [41].
Energies 08 05997f1
Figure 2. The bathymetry (bottom) created with the combination of the Boat (Top left), SeaZone® (Top Centre) and Royal Navy (Top Right) data sets (The elevation was exaggerated to show the features clearly).
Energies 08 05997f2
Figure 3. Volume rendering of the velocity for the area (fine mesh, k-ϵ Method).
Energies 08 05997f3
Figure 4. Comparison of the velocity profile across the channel at 775 m from the inlet (k-ϵ, LES, Boat data).
Energies 08 05997f4
Figure 5. The Eddies forming behind the horse rock. The separation point is also visible (Large Eddy Simulation (LES) method).
Energies 08 05997f5
Figure 6. The eddy forming behind the Horse Rock from different angles visible (LES method).
Energies 08 05997f6
Figure 7. Three different views of the big eddies forming as water from both sides of the channel joins together in the deeper section (LES method fine mesh).
Energies 08 05997f7
Figure 8. Pressure plots (Pa) of the sea surface (top) and seabed (bottom), paying particular attention to the Horse rock region of the domain.
Energies 08 05997f8