Article

Online Internal Temperature Estimation for Lithium-Ion Batteries Based on Kalman Filter

School of Electrical Engineering and Automation, Harbin Institute of Technology, Harbin 150001, China
*
Author to whom correspondence should be addressed.
Energies 2015, 8(5), 4400-4415; https://doi.org/10.3390/en8054400
Submission received: 1 April 2015 / Revised: 5 May 2015 / Accepted: 12 May 2015 / Published: 15 May 2015

Abstract

:
The battery internal temperature estimation is important for the thermal safety in applications, because the internal temperature is hard to measure directly. In this work, an online internal temperature estimation method based on a simplified thermal model using a Kalman filter is proposed. As an improvement, the influences of entropy change and overpotential on heat generation are analyzed quantitatively. The model parameters are identified through a current pulse test. The charge/discharge experiments under different current rates are carried out on the same battery to verify the estimation results. The internal and surface temperatures are measured with thermocouples for result validation and model construction. The accuracy of the estimated result is validated with a maximum estimation error of around 1 K.

1. Introduction

Lithium-ion batteries have been widely used as energy storage devices in the fields of electric vehicles, wind power systems and micro-grids, because of their advantages, such as high energy density, high power density and long cycle life [1]. However, thermal issues affecting cells and packs always threaten the operational safety. Under typical conditions, the temperature differences between the battery surface and core can be 10 K or more [2]. When the surface temperature reaches the upper temperature limit, the core temperature is already beyond the limit. High battery temperatures can trigger problems such as fires, electrolyte leakage and venting [3]. Thus, surface temperature monitoring is not sufficient to ensure the safety [4,5]. Core temperature simultaneous estimation is necessary for battery management systems (BMS) to diagnose thermal runaway reactions and protect batteries from potential damage.
As a complex electrochemical process, heat generation inside batteries requires understanding the working principle, especially how the reaction rates change with time and temperature [6]. Formulating heat equilibrium equations is the most common way to describe heat generation and dissipation [7,8,9]. Heat generation sources are usually analyzed depending on the complexity of the model. To validate the model parameters, thermocouples are usually mounted on the surface of cells for temperature measurement. However, the measured temperature can only describe the trends of core temperature changes rather than the real-time changes, regardless of whether cylindrical or large size pouch cells are considered, which means that a thermal runaway cannot be detected in time only with surface temperature monitoring, because the heat conduction between the heat source and battery surface takes time [10].
Some researchers have installed thermocouples insides the battery to measure the cell internal temperature [11,12]. It should be noted that thermocouples inserted into cells add manufacturing costs and represent a potential safety threat. Hence, the core temperature measurement is not an appropriate method for industrial applications. Therefore, constructing a thermal model to predict the internal temperature with inputs measured during operation is a promising approach to estimate a battery’s thermal state. Lin [5] designed an adaptive observer based on a two-state thermal model to estimate the core temperature. However, Lin’s model ignored the effect of heat generation caused by entropy changes in cylindrical batteries. Although this contribution is relatively small compared with the overpotential heat generation, it influences the thermal model. Forgez’s [3] thermal model took entropy change into account, but it lacks a quantitative analysis of the influence of heat generation.
This work aims at developing a thermal model taking entropy change into consideration, and an online battery internal temperature estimation method. A simplified internal temperature estimation model is employed to analyze battery internal temperature changes by measurement of surface and ambient temperatures combined with knowledge about heat generation. This model provides insight into the core temperature estimation with a simplified thermal model. Model parameters such as heat capacity and thermal resistance are identified by using current pulses tests. A 40Ah/3.2V large size square laminated LiFePO4/graphite battery with thermocouples mounted on the surface and in the core is applied for model parameterization as well as the validation of internal temperature prediction. Furthermore, a Kalman filter (KF) is utilized to estimate the battery internal temperature in real-time during charge and discharge cycles with the process of state and time update. The estimation and measured results are compared to validate the model effectiveness. Experimental results show high quality estimation accuracy. Thus, the proposed estimation method could be applied to BMS for on-board thermal runaway prediction in advance using measureable surface temperatures and ambient temperatures.

2. Online Internal Temperature Estimation Based on a KF

2.1. Internal Temperature Estimation Model

For the battery internal temperature estimation, an accurate thermal state model has to be formulated. In our case, an internal temperature estimation model is applied to estimate the temperature changes in the battery core. The battery setup is shown in Figure 1. This model is also used in Lin’s [5] and Forgez’s [3] research works. What differs is that the entropy change is considered in the heat generation analysis for a square laminated LiFePO4/graphite battery in this work. Some assumptions are necessary to simplify the model development: (1) surface temperature of the battery is uniform; (2) the heat generation is evenly distributed within the battery; (3) heat conduction is the main way for heat exchange.
Figure 1. Experimental setup.
Energies 08 04400 g001
The governing equations of Tc and Ts are as follows:
C c d T c d t = Q t + T s T c R c
C s d T s d t = T f T s R u T s T c R c
where C c (J/K) and C s (J/K) are the heat capacity for the core and surface, respectively, T s (K) is the battery surface temperature, T c (K) is the core temperature, T f (K) is the temperature of air. R c (K/W) is a lumped parameter aggregating the conduction and contact thermal resistance, used to model the heat exchange between the core and the surface. Convective cooling through the battery surface is modeled by a convection resistance R u (K/W) between surface and ambient air. Q t is the by production of chemical reactions during battery operation.
An expression for heat sources in a lithium-ion battery was presented by Thomas and Newman [13]. In their study, heat sources include the Joule heating, reversible entropic heat from the reaction, the heat produced from mixing and the heat from irreversible chemical reactions. In this work, the side reactions caused by aging are so slow as to be neglected. In addition, the heat of mixing is due to a non-uniform reaction rate. When the current is interrupted, the concentration gradients developed inside the battery relax, causing heat to be released or absorbed [6]. A general trend is that for battery design and manufacturing processes, the concentration gradients are limited and the heat of mixing can usually be ignored. Following the statements above, the simplified heat generation can be expressed as Equation (3):
Q t = I ( V V O C V ) + I T c d V O C V d T c
Where I is the charge/discharge current (positive for charge, negative for discharge), V O C V is the open circuit voltage, V is the cell voltage, d V O C V d T c is the entropy coefficient. The first term on the right of Equation (3) is the heat generated by overpotential, which is irreversible, and is always positive, whereas, the second term is the reversible entropic heat, which is either positive or negative depending on the direction of current and also the sign of the entropy coefficient. The entropic heat generation is defined as I T c Δ S / n F , where Δ S is the entropy change, n is the number of electrons which are transferred in the electrochemical reaction during operation, F is the Faraday constant (96486 C·mol−1). Knowing that Δ S = n F d V O C V d T c , the entropic heat generation can be calculated and the result can be expressed as the second term on the right of Equation (3). The detailed derivation process is given in [14].
It is known that heat generation is the basis of internal temperature estimation, thus an accurate heat generation estimation is necessary. The heat generation equation as shown in Equation (3) has been applied in many previous studies [3,4,5]. The irreversible overpotential heat, which represents the dominant part in the total heat generation, can be calculated by the product of current and overpotential. The cell voltage could be measured directly, while the Open Circuit Voltage-State of Charge (OCV-SOC) curve was extracted experimentally [15]. Due to the hysteresis of the LiFePO4 chemistry, the average of the charge and discharge voltage curve is taken as the open circuit voltage curve in this study. For the reversible entropic heat, the entropy coefficient is based on the function of battery temperature at open circuit for different SOCs. In this work, the voltage relaxation method is used. The detailed process to obtain the OCV-SOC curve and entropy coefficient is described in Section 2.3. The heat generation caused by entropy change was neglected in Williford’s study [16], however, when the current rate is high, the Joule heating will be dominant as it is proportional to Current Square. Therefore, the effect of entropic heat will be negligible as it is only proportional to current. Entropic heat is most significant in the medium current range. Thus, overpotential and entropy change are the two origins of heat generation considered in this work.

2.2. State Space Model

The battery core and surface temperature are influenced by heat generation and release. For the sake of our internal temperature estimation design, it is assumed that the core of battery is taken as a lumped-parameter heat source to exchange heat to the surface, because the complex chemical reactions give out heat when the battery is charging or discharging. In addition, the battery surface temperature changes slowly during the sampling time (1 second or less), which is also proved in experiments. Therefore, it is assumed that the surface temperature does not change in a short sample time. Depending on the assumptions above, Equation (1) can be rewritten in discrete-time, as shown in Equations (4) and (5):
T c , t T c , t 1 = Δ t ( Q t 1 C c + T s , t 1 T c , t 1 C c R c )
T c , t = ( 1 Δ t C c R c ) T c , t 1 + Δ t Q t 1 C c + Δ t T s , t 1 C c R c
Inserting Equation (3) into (5), gives Equation (6):
T c , t = ( 1 Δ t C c R c ) T c , t 1 + Δ t C c [ I t 1 ( V t 1 V O C V , t 1 ) + I t 1 T c , t 1 d V O C V , t 1 d T c , t 1 ] + Δ t T s , t 1 C c R c
According to the assumptions, the surface temperature variation within a short sampling time is ignored, thus, the left part of Equation (2) is zero, a consequently Equation (2) can be simplified as Equation (7):
T s , t = R u ( R c + R u ) T c , t + R c ( R c + R u ) T f , t
Therefore, the discrete state-space equations can be expressed by Equations (6) and (7).

2.3. Parameters Identification

In this section, the thermal (Ru, Rc, Cc, Cs) and electrical (OCV, entropy coefficient) parameters in Equations (6) and (7) are identified by experiments:

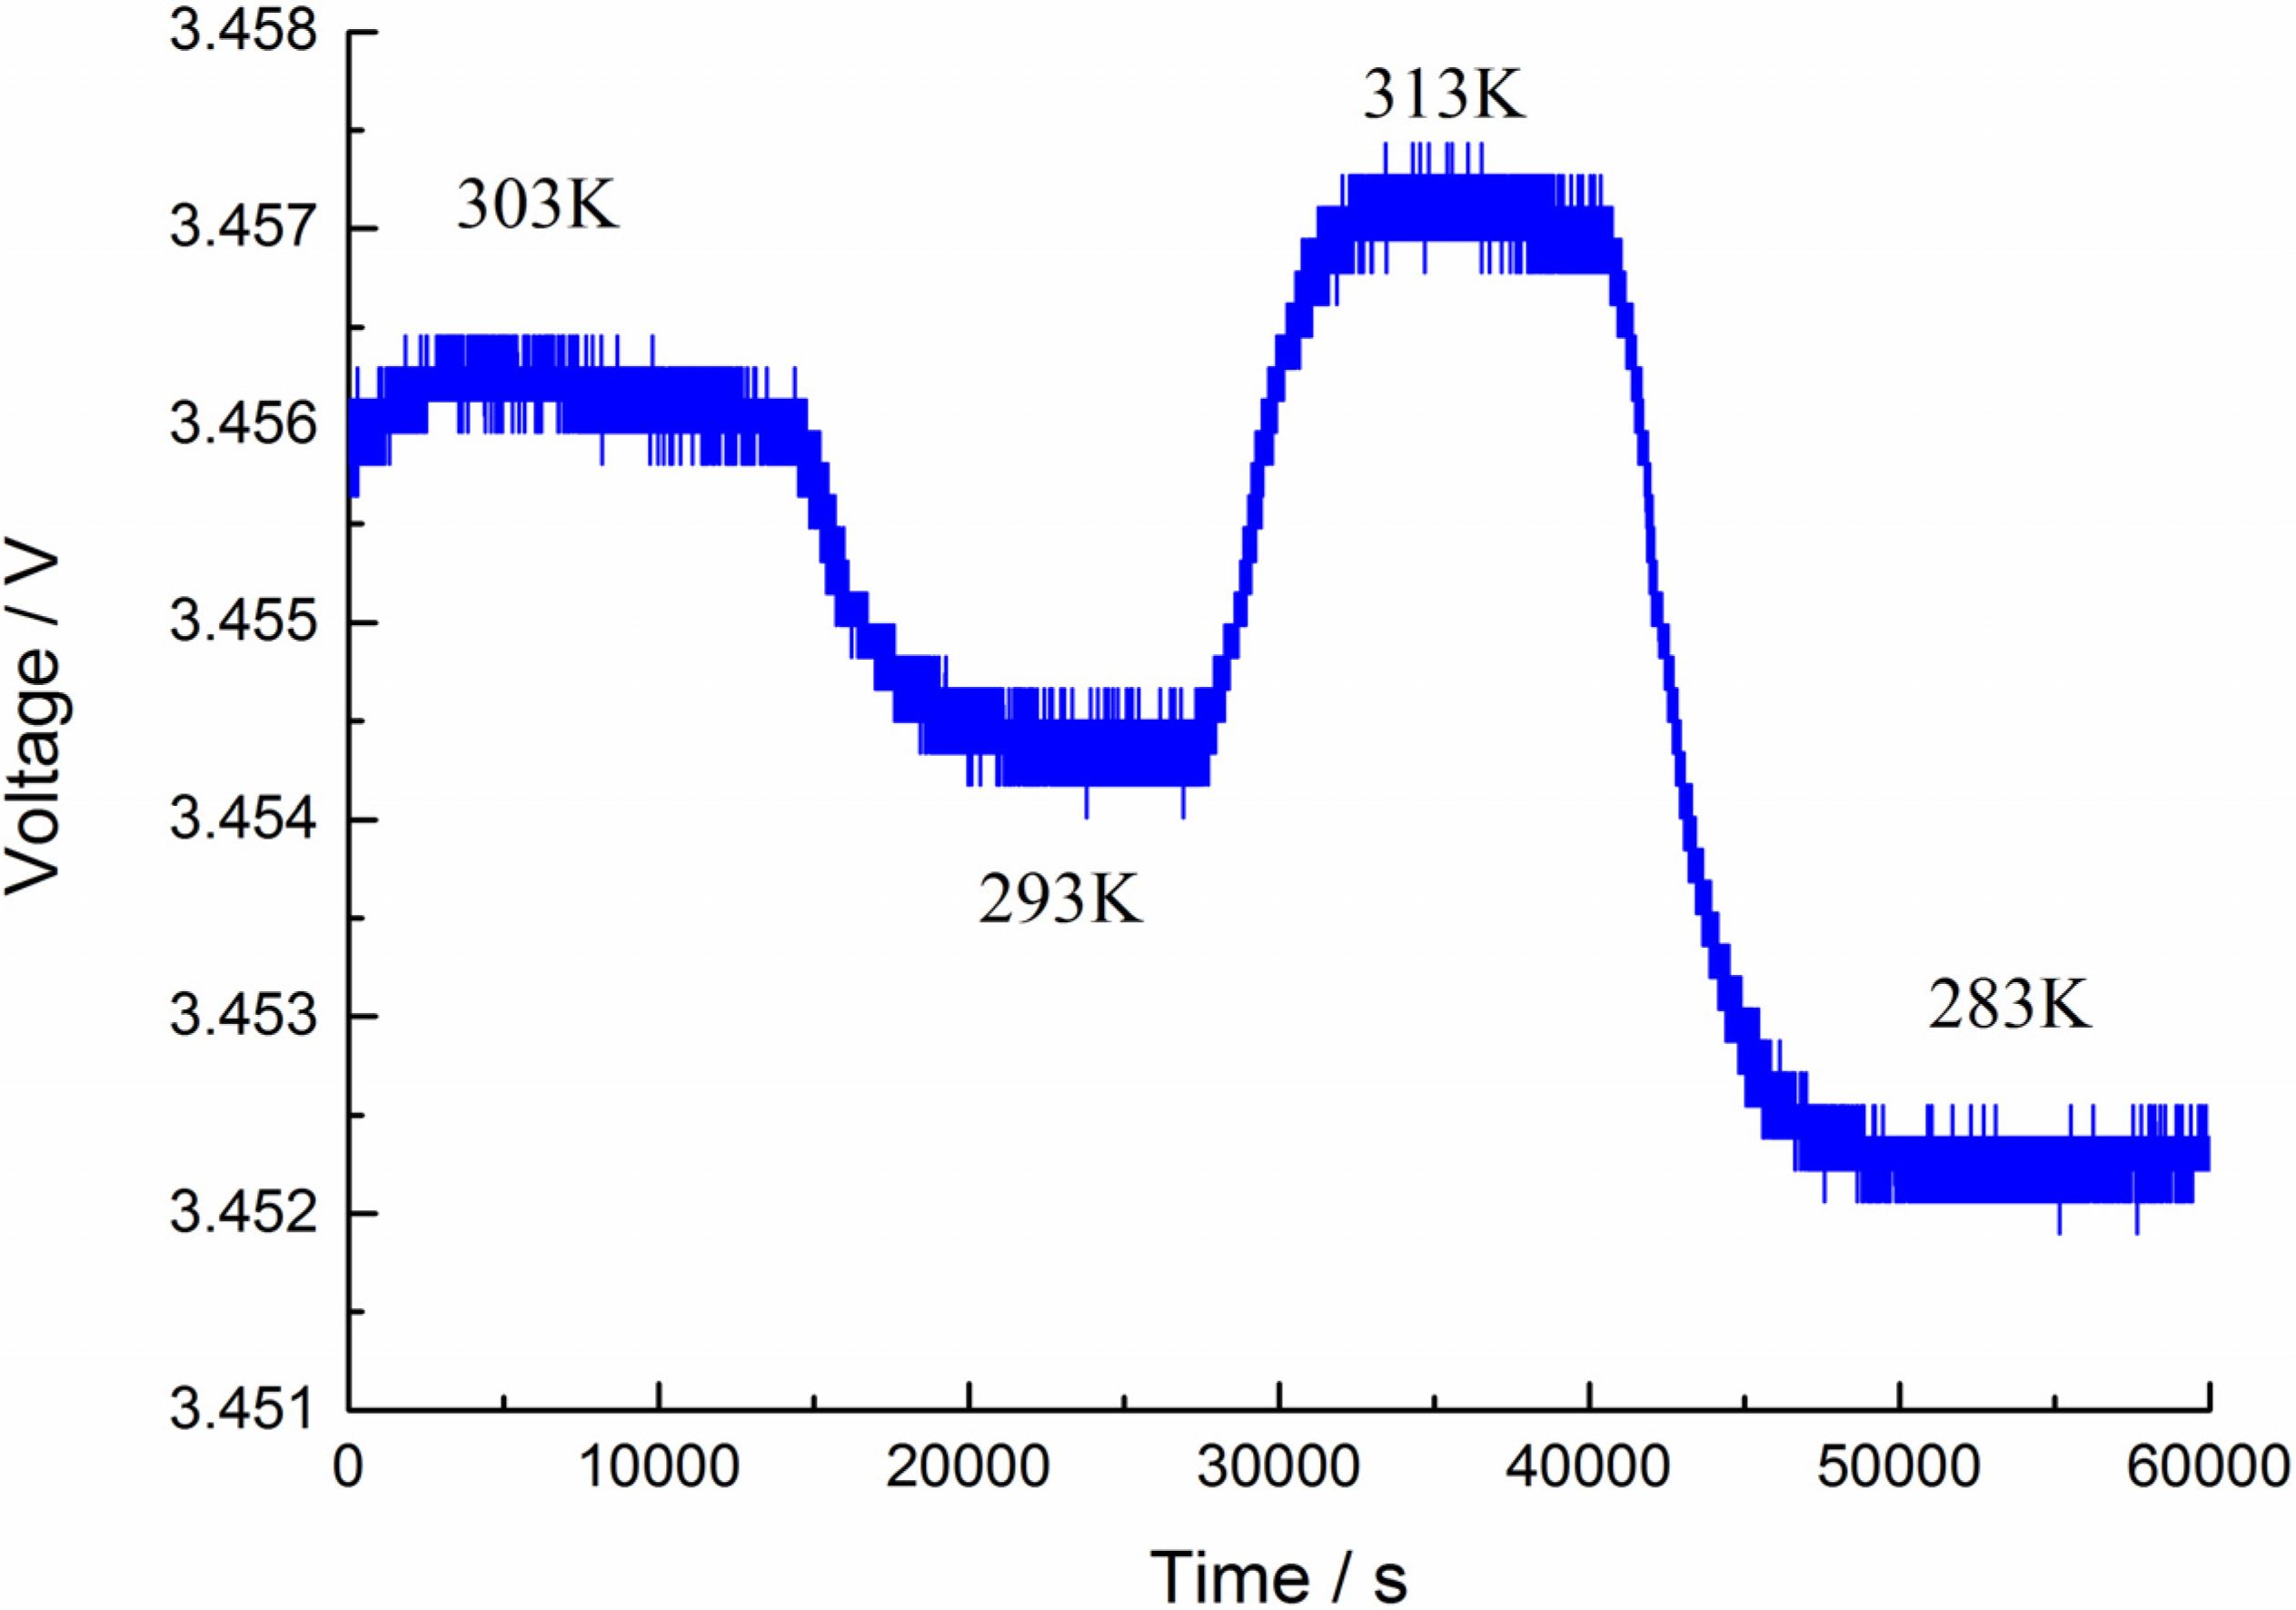
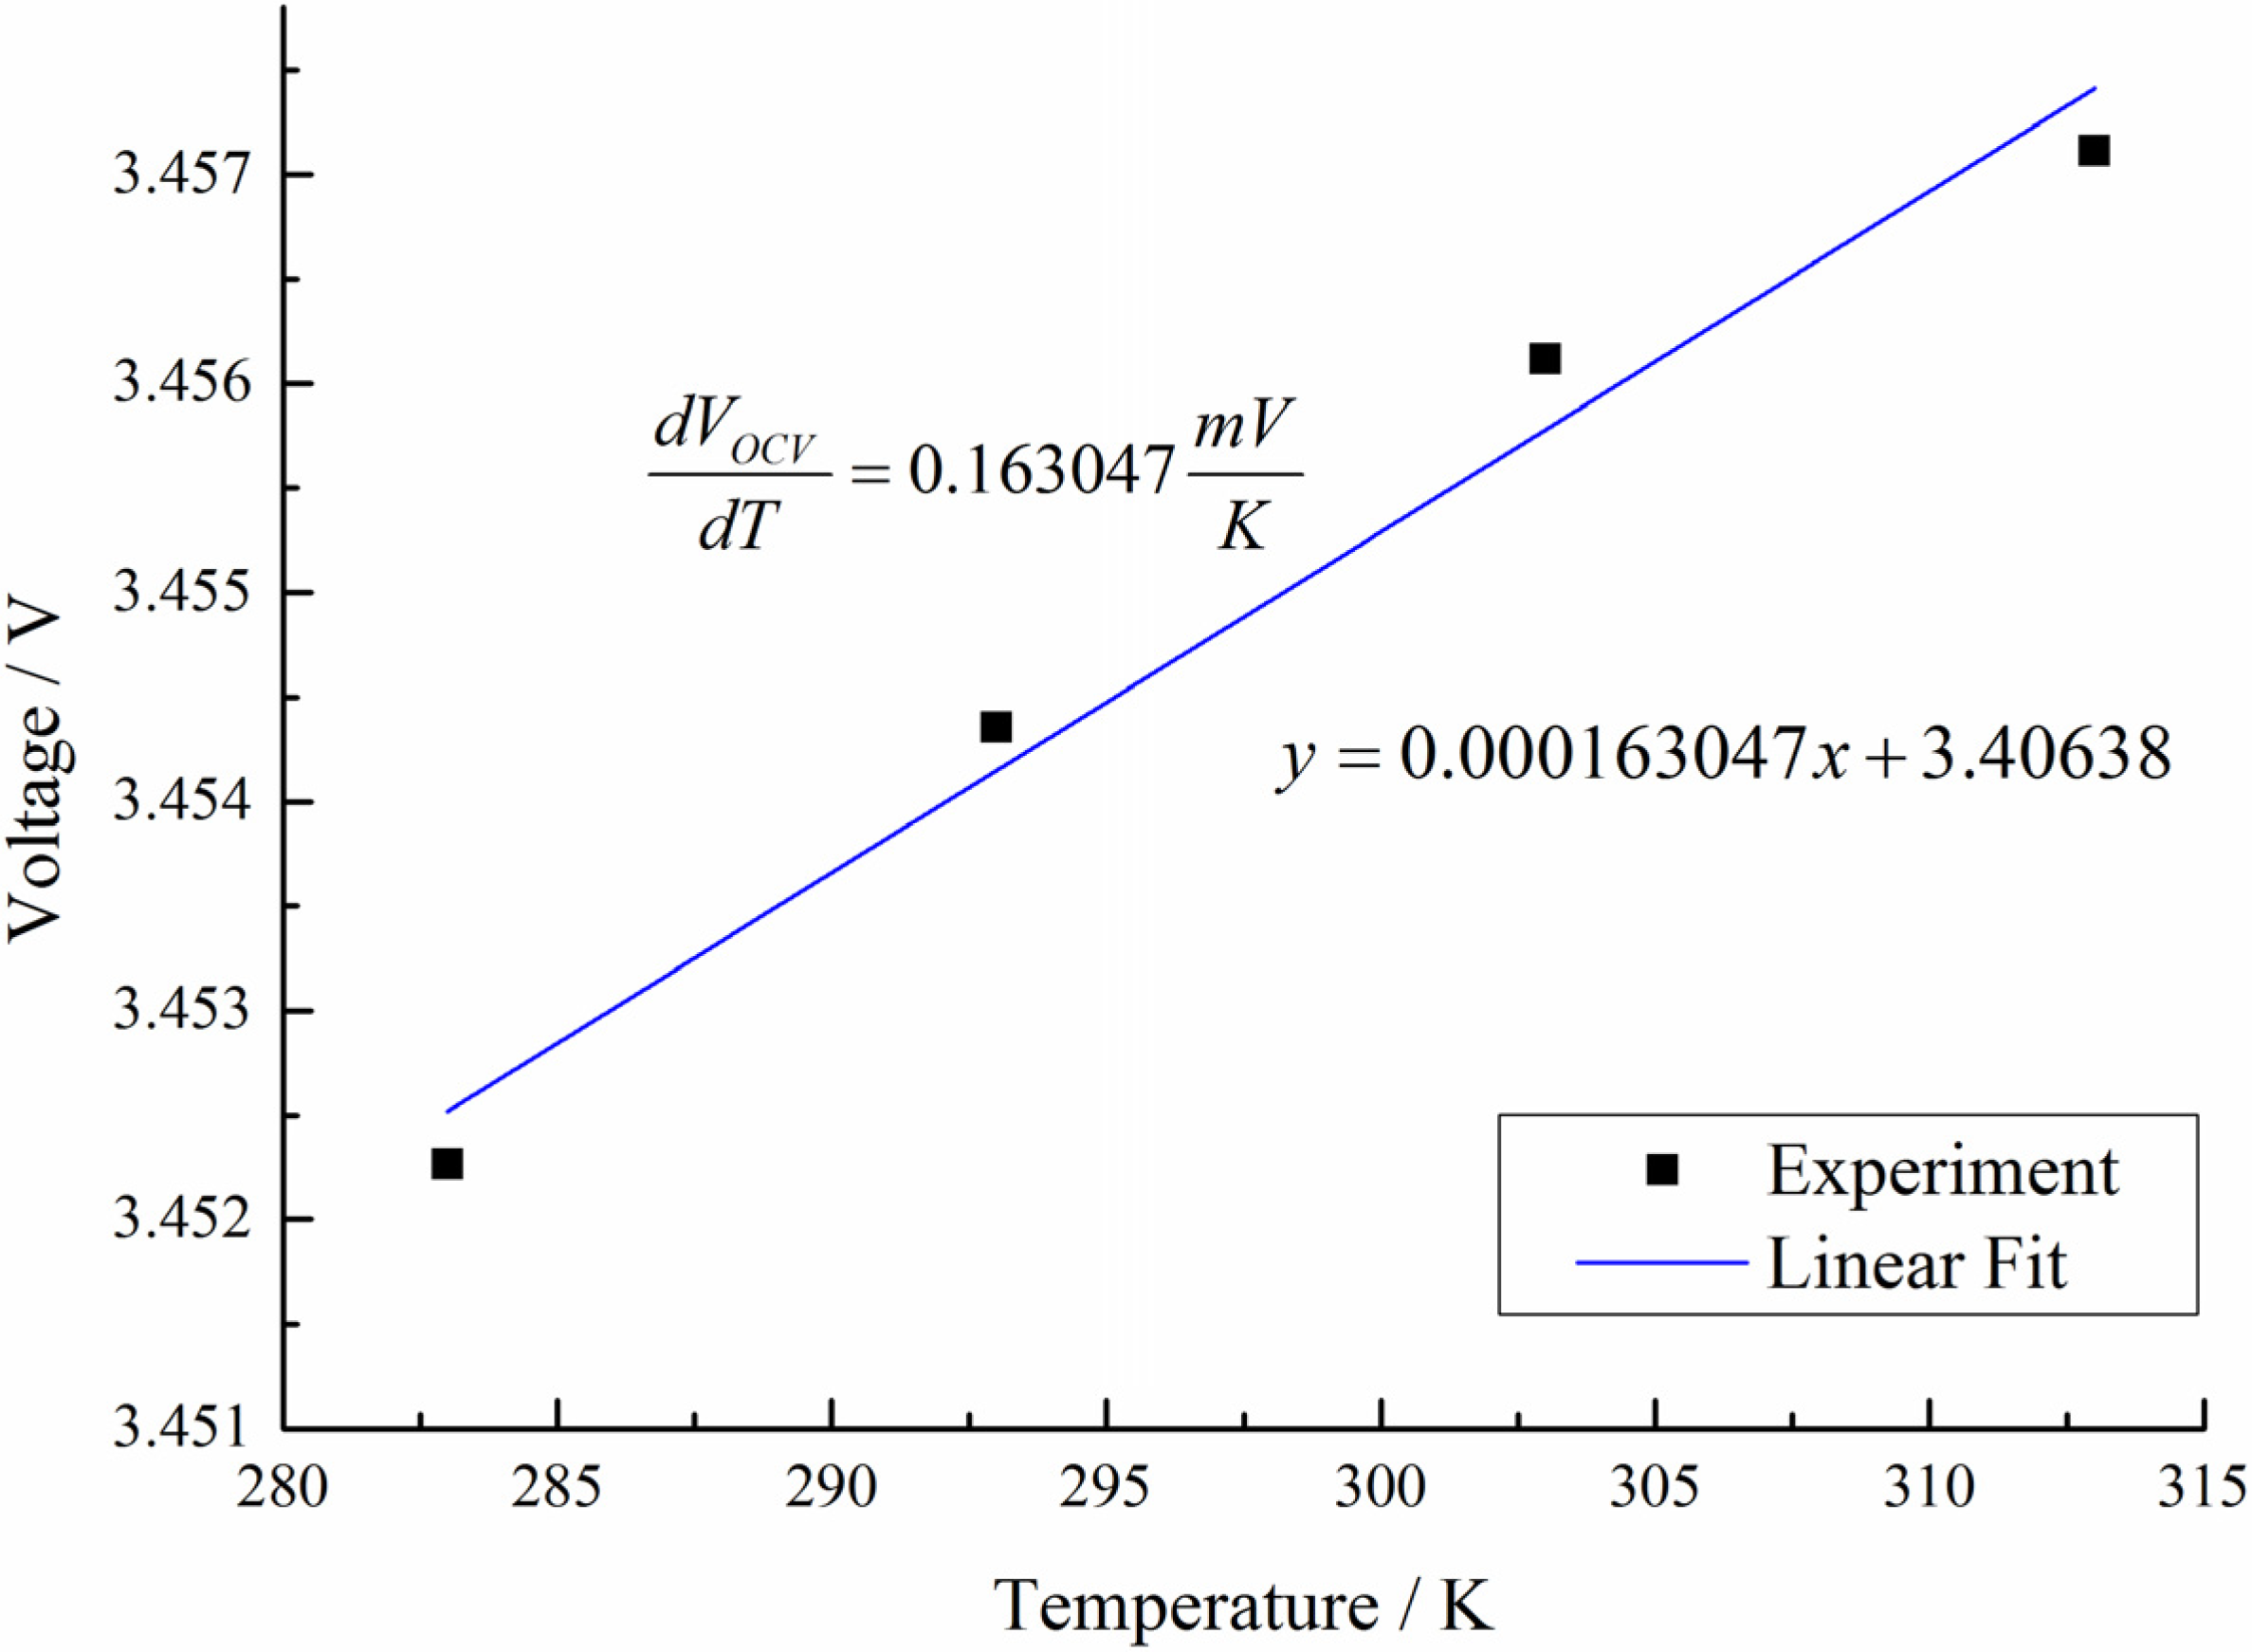
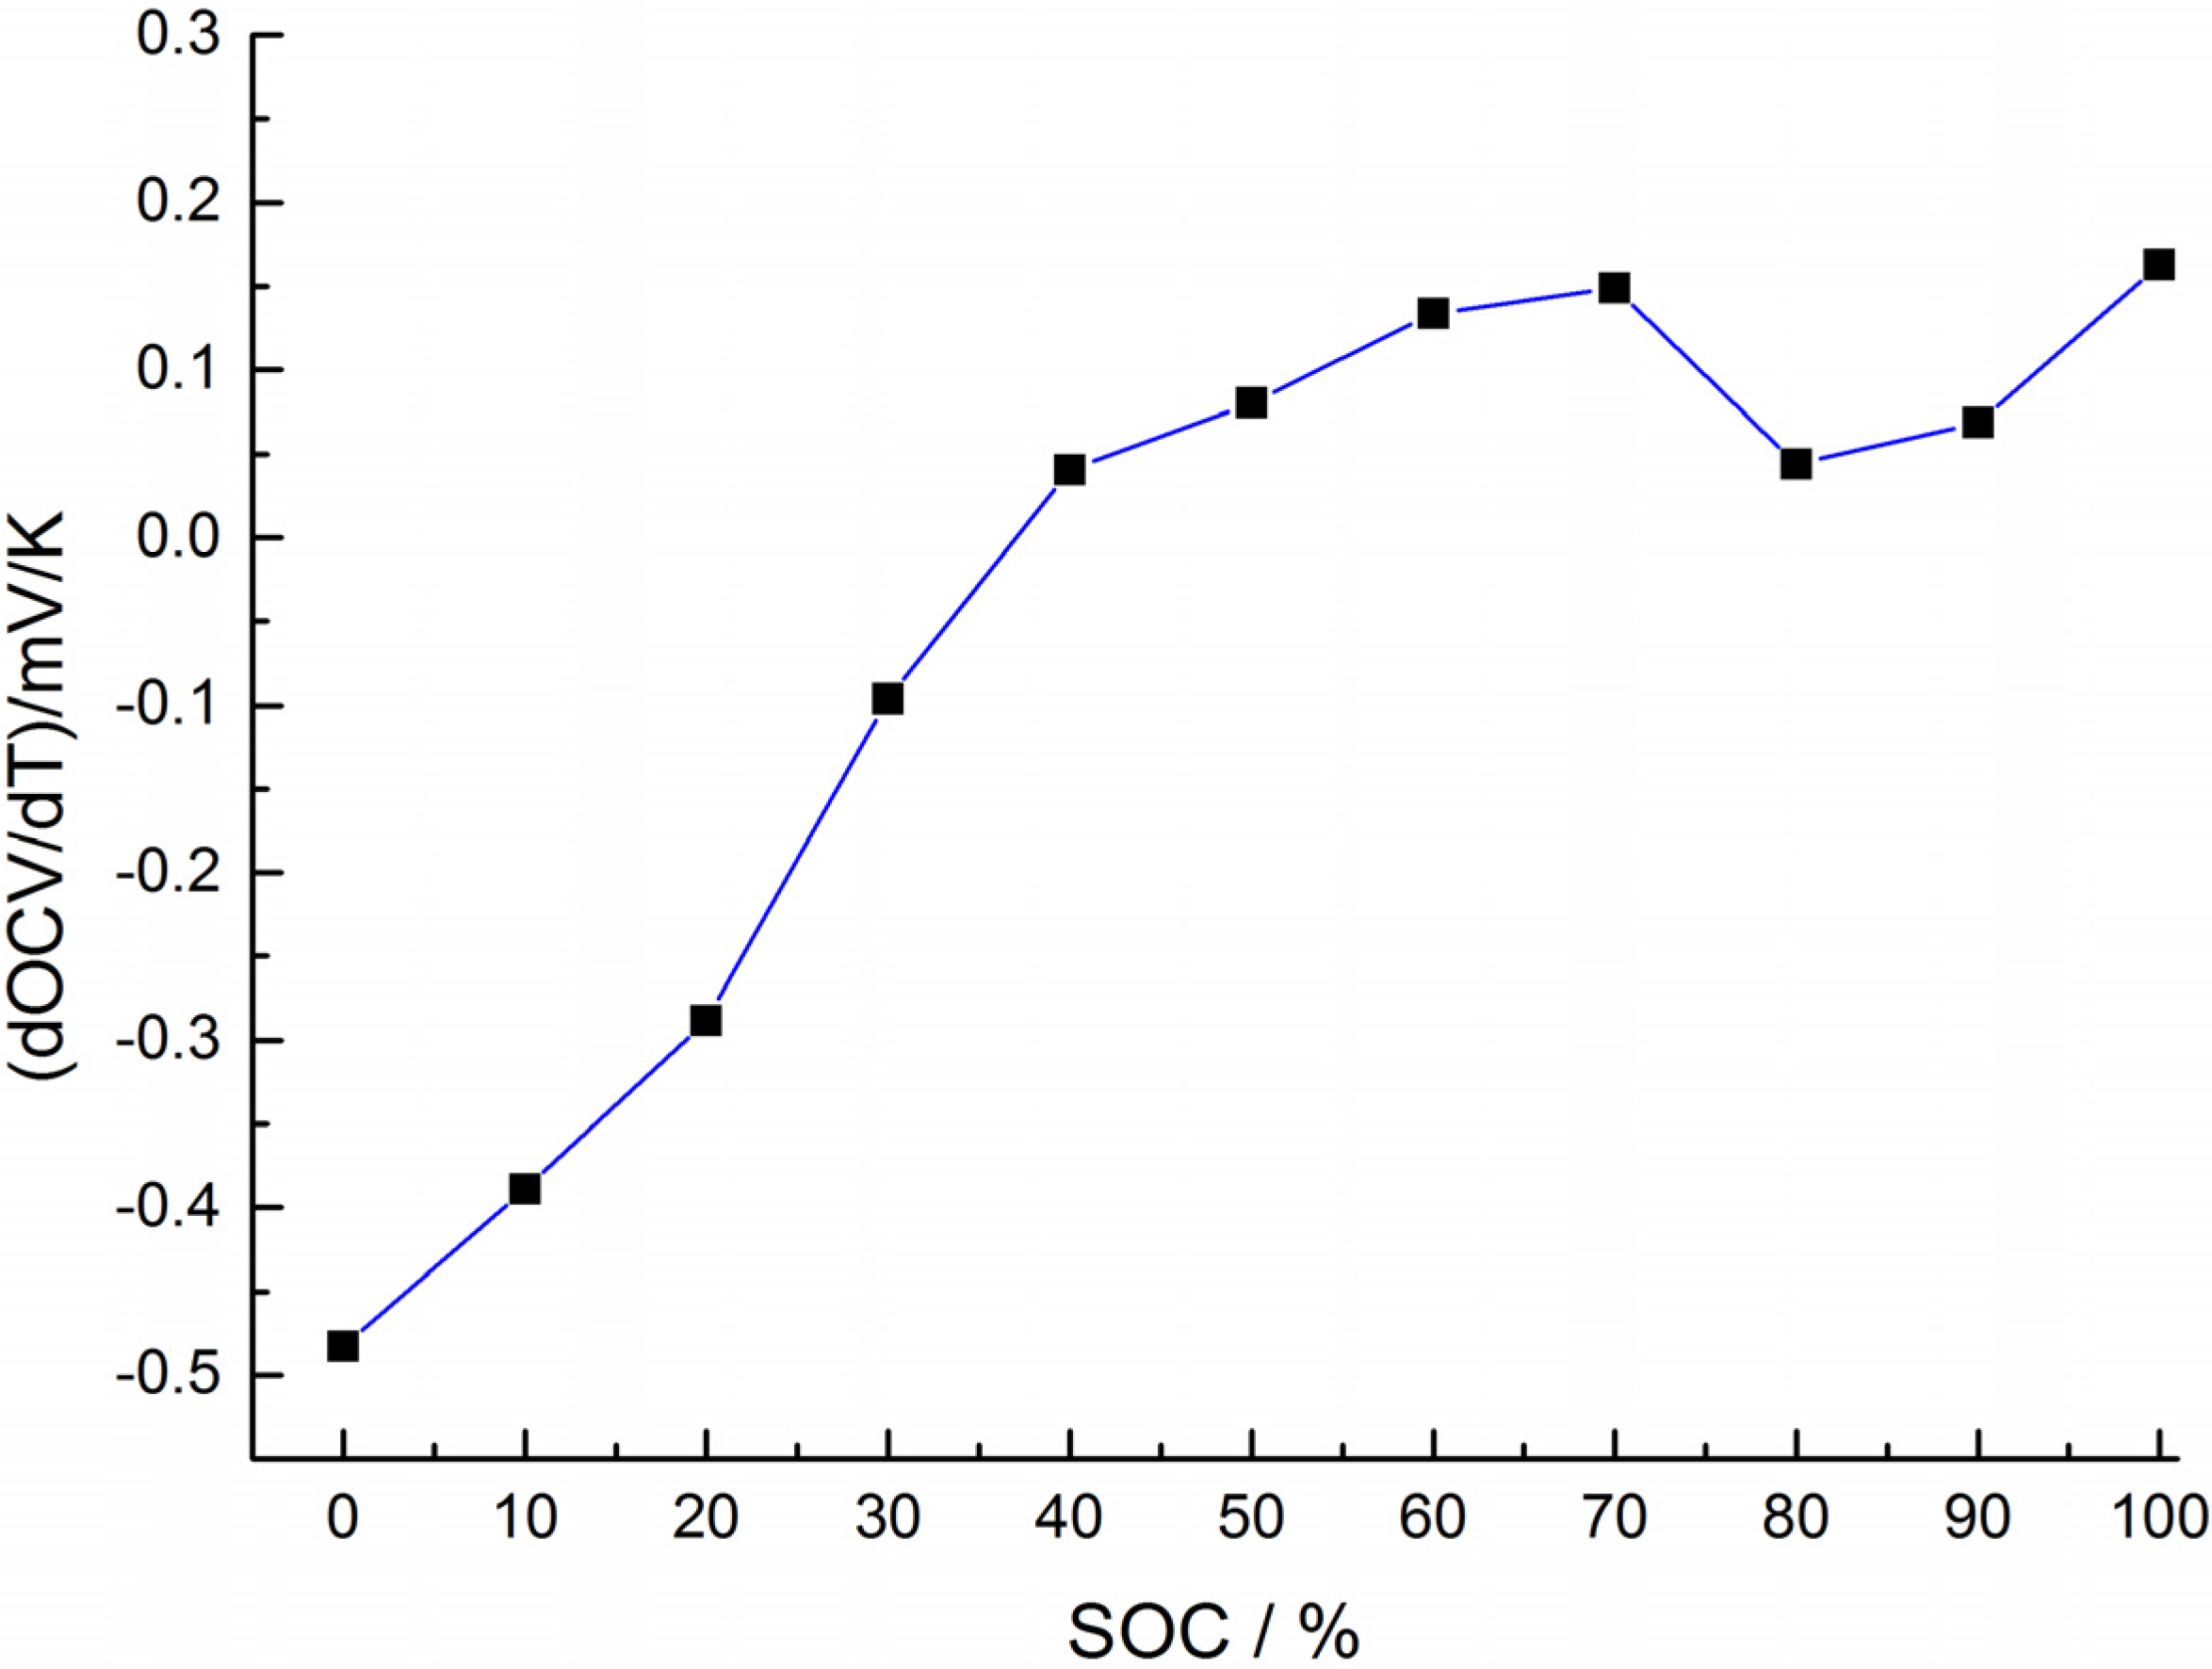
2.3.1. Thermal Parameter Identification

To identify the thermal parameters, the current pulses test [3] was applied to obtain the unmeasured heat capacity and heat resistance. In the experiment, symmetrical and periodic current pulses with 0.2 Hz frequency and two current rates, 40 A and 60 A, were used in the battery to raise the temperature. In a cycle of current pulses, the state of charge (SOC) variation is so small as to be neglected. As a result, the entropy change heat generation is zero, because in a short time period, the magnitude of entropic change heat in the positive pulse is the same as that in a negative pulse, but with opposite sign. Therefore, the overpotential heat generation can be seen as a constant heat source, because this part is always positive and the magnitude of current pulses is the same. The 50% SOC was chosen since the state of heat generation is steady. After the temperature is steady, parameters could be identified according to the thermal state equations. The curves of current pulses and the corresponding temperature changes are shown in Figure 2.
Figure 2. 60 A current pulses test and temperature changes.
Energies 08 04400 g002
In Figure 2 the black dotted line and blue solid line indicate current and voltage, respectively, while the black dotted line and red solid line indicate the surface and internal temperature, respectively.
Utilizing the results of current pulses test, the heat resistance for the core and surface as well as the heat capacity for the core can be calculated according to the following equations:
R c = T c , T s , Q
R u = T f T s , T s , T c , R c
In Equations (8) and (9), ∞ represents the thermal steady state (after an hour under current pulses in this study), the average power for overpotential heat generation is 4.759 W in a cycle. The core and surface heat capacity can be obtained from the transient part of the experiment. The identification results are shown in Table 1.
Table 1. The thermal parameters identification results.
ParametersRu (K/W)Rc (K/W)Cc (J/K)Cs (J/K)
±40 A current pulse (1.5 h)0.2600.8641067545.3
±60 A current pulse (1.5 h)0.2550.8731069548.1

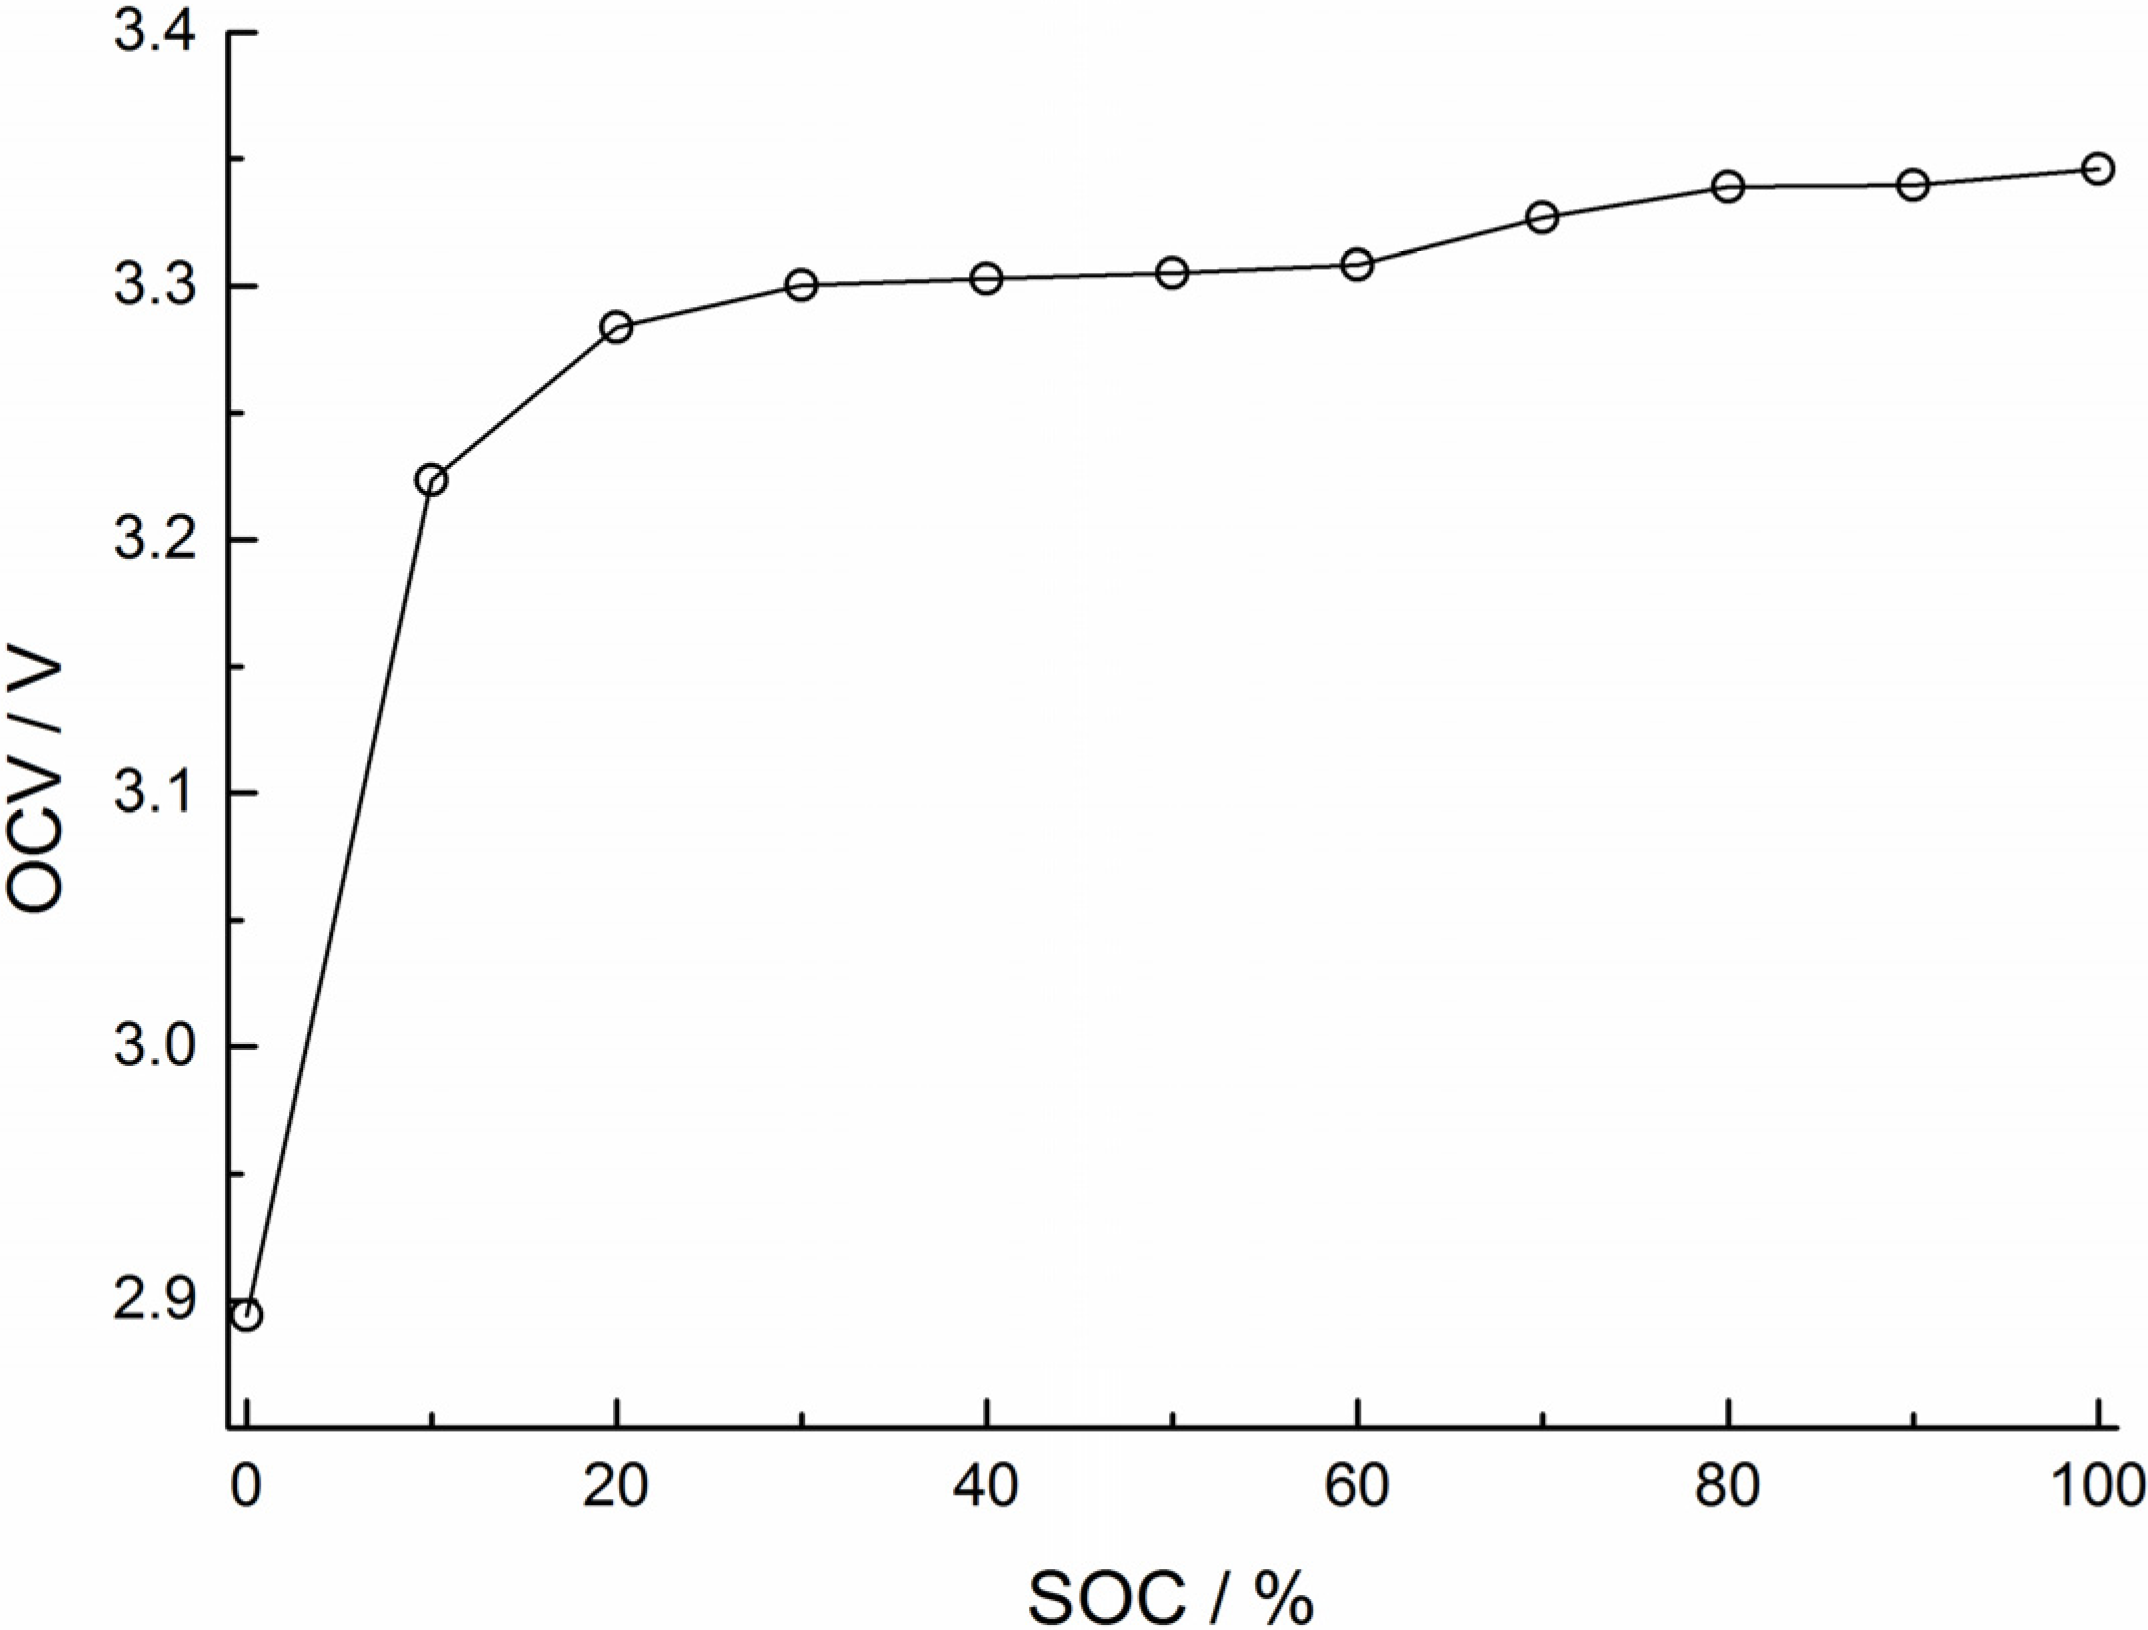
2.3.2. Electrical parameters identification

In order to calculate the heat generation, the relationship between OCV and SOC is required. The terminal voltage can achieve the true OCV value after idling for a long time. To acquire the data, a test was performed and the procedure is designed as follows: the battery is first discharged by 10% of the nominal capacity from fully charged state at 12 A. After 3 h resting, the OCV is considered to reach the equilibrium potential. The terminal voltage is measured to be taken as the OCV value at the target SOC. The battery is continuously discharged by a further 10% of the nominal capacity at the same current rate. The procedure above is performed repeatedly to obtain the OCV-SOC curve until the cutoff voltage is reached. The test is also performed during charging from fully discharged. The charge and discharge OCV-SOC curves do not coincide, because of the hysteresis effect. Hence, the average of charging and discharging curve is taken as the result. The OCV-SOC curve is shown in Figure 3.
Figure 3. OCV-SOC curve of the battery.
Energies 08 04400 g003
The voltage relaxation method is used to get the entropy coefficient. The battery is left with an open circuit for about 3 h to reach a relatively stable state at a specific SOC and temperature. Then, the cell voltage can be measured, which is approximately the open circuit voltage. The voltage variation curves under different ambient temperatures are shown in Figure 4.
Figure 4. Voltage variation with the change of ambient temperature.
Energies 08 04400 g004
Taking 100% SOC for example, the entropy coefficient is obtained from the slope of the curve as a function of SOC, as shown in Figure 5. Where, mV means 0.001 V. The same process is carried out at other SOCs with an interval of 10%, and the fit curve is shown in Figure 6.
Figure 5. Entropy coefficient for SOC = 100%.
Energies 08 04400 g005
Figure 6. Entropy coefficient curve with the change of SOC.
Energies 08 04400 g006
The identification for both thermal and electrical parameter has been finished. A mathematical method is required to achieve battery internal temperature online estimation. The following section introduces the KF-based internal temperature estimation method.

3. KF-Based Internal Temperature Estimation

As stated in the Introduction section, the battery internal temperature cannot be measured directly. For the proposed KF, the battery internal temperature can be estimated by acquired measureable parameters and the established model. It can be seen that the state space equations: Equations (6) and (7) are linear. KF is a common method used for linear state estimation problems [17,18]. It comprises a set of recursive equations that are repeatedly evaluated as the system operates. The unmeasured internal temperature can be estimated by Equation (6) and the Kalman gain is utilized to rectify the estimated internal temperature.
Assuming the discrete linear system is expressed as follows:
x t = A t 1 x t 1 + B t 1 u t 1 + w k
y t = C t x t + D t u t + v k
where x is the state vector, u is the input vector, t − 1 and t indicate the past state and the present state, w k and v k are the process noise and measurement noise respectively, obeying a zero-mean white Gaussian stochastic process with covariance matrices of P v and Q w . The determination of covariance matrix of noise P v and Q w has a great influence on estimation result. P v is highly related to the temperature measurement error. Q w is highly related to the system noise, current and voltage measurement error. Thus, we set value as: P v = 1 × 10⁻⁴, Q w = 1 × 10⁻¹.
The discrete Equations (6) and (7) can be written in the form of Equations (10) and (11), respectively. State vector x t = [ T c , t ] , input vector u t = [ T f , t Q t ] T , the matrices that describe the dynamics of the system are as follows:
A t 1 = [ 1 1 C c R c ]
B t 1 = [ 1 C c × ( R c + R u ) 1 C c ]
C t = [ R u ( R c + R u ) ]
D t = [ R c ( R c + R u ) 0 ] T
As the KF is a common method for linear state estimation, the detailed process is not described here. The reader is referred to Kalman’s original papers [17,19] for further derivation details.

4. Experiment Design

4.1. Battery Charge/Discharge Cycle Test

The battery cycle test was carried out in the temperature chamber at 298 K. In addition, the battery was charged and discharged at constant current rates (1 C, 1.5 C, 2 C) with the same initial state SOC = 0%. Before charging or discharging, a period of 6 hours’ relaxation was set to ensure the initial thermal state. The Arbin instrument (Arbin Instruments Co. Ltd., College Station, TX, USA) recorded the current and voltage and temperatures in real-time to calculate the ampere hour (Ah) consumed and monitor the surface and ambient temperatures. The operation information was transferred to a computer through a Recommended Standard 232 (RS 232) interface for record and storage.

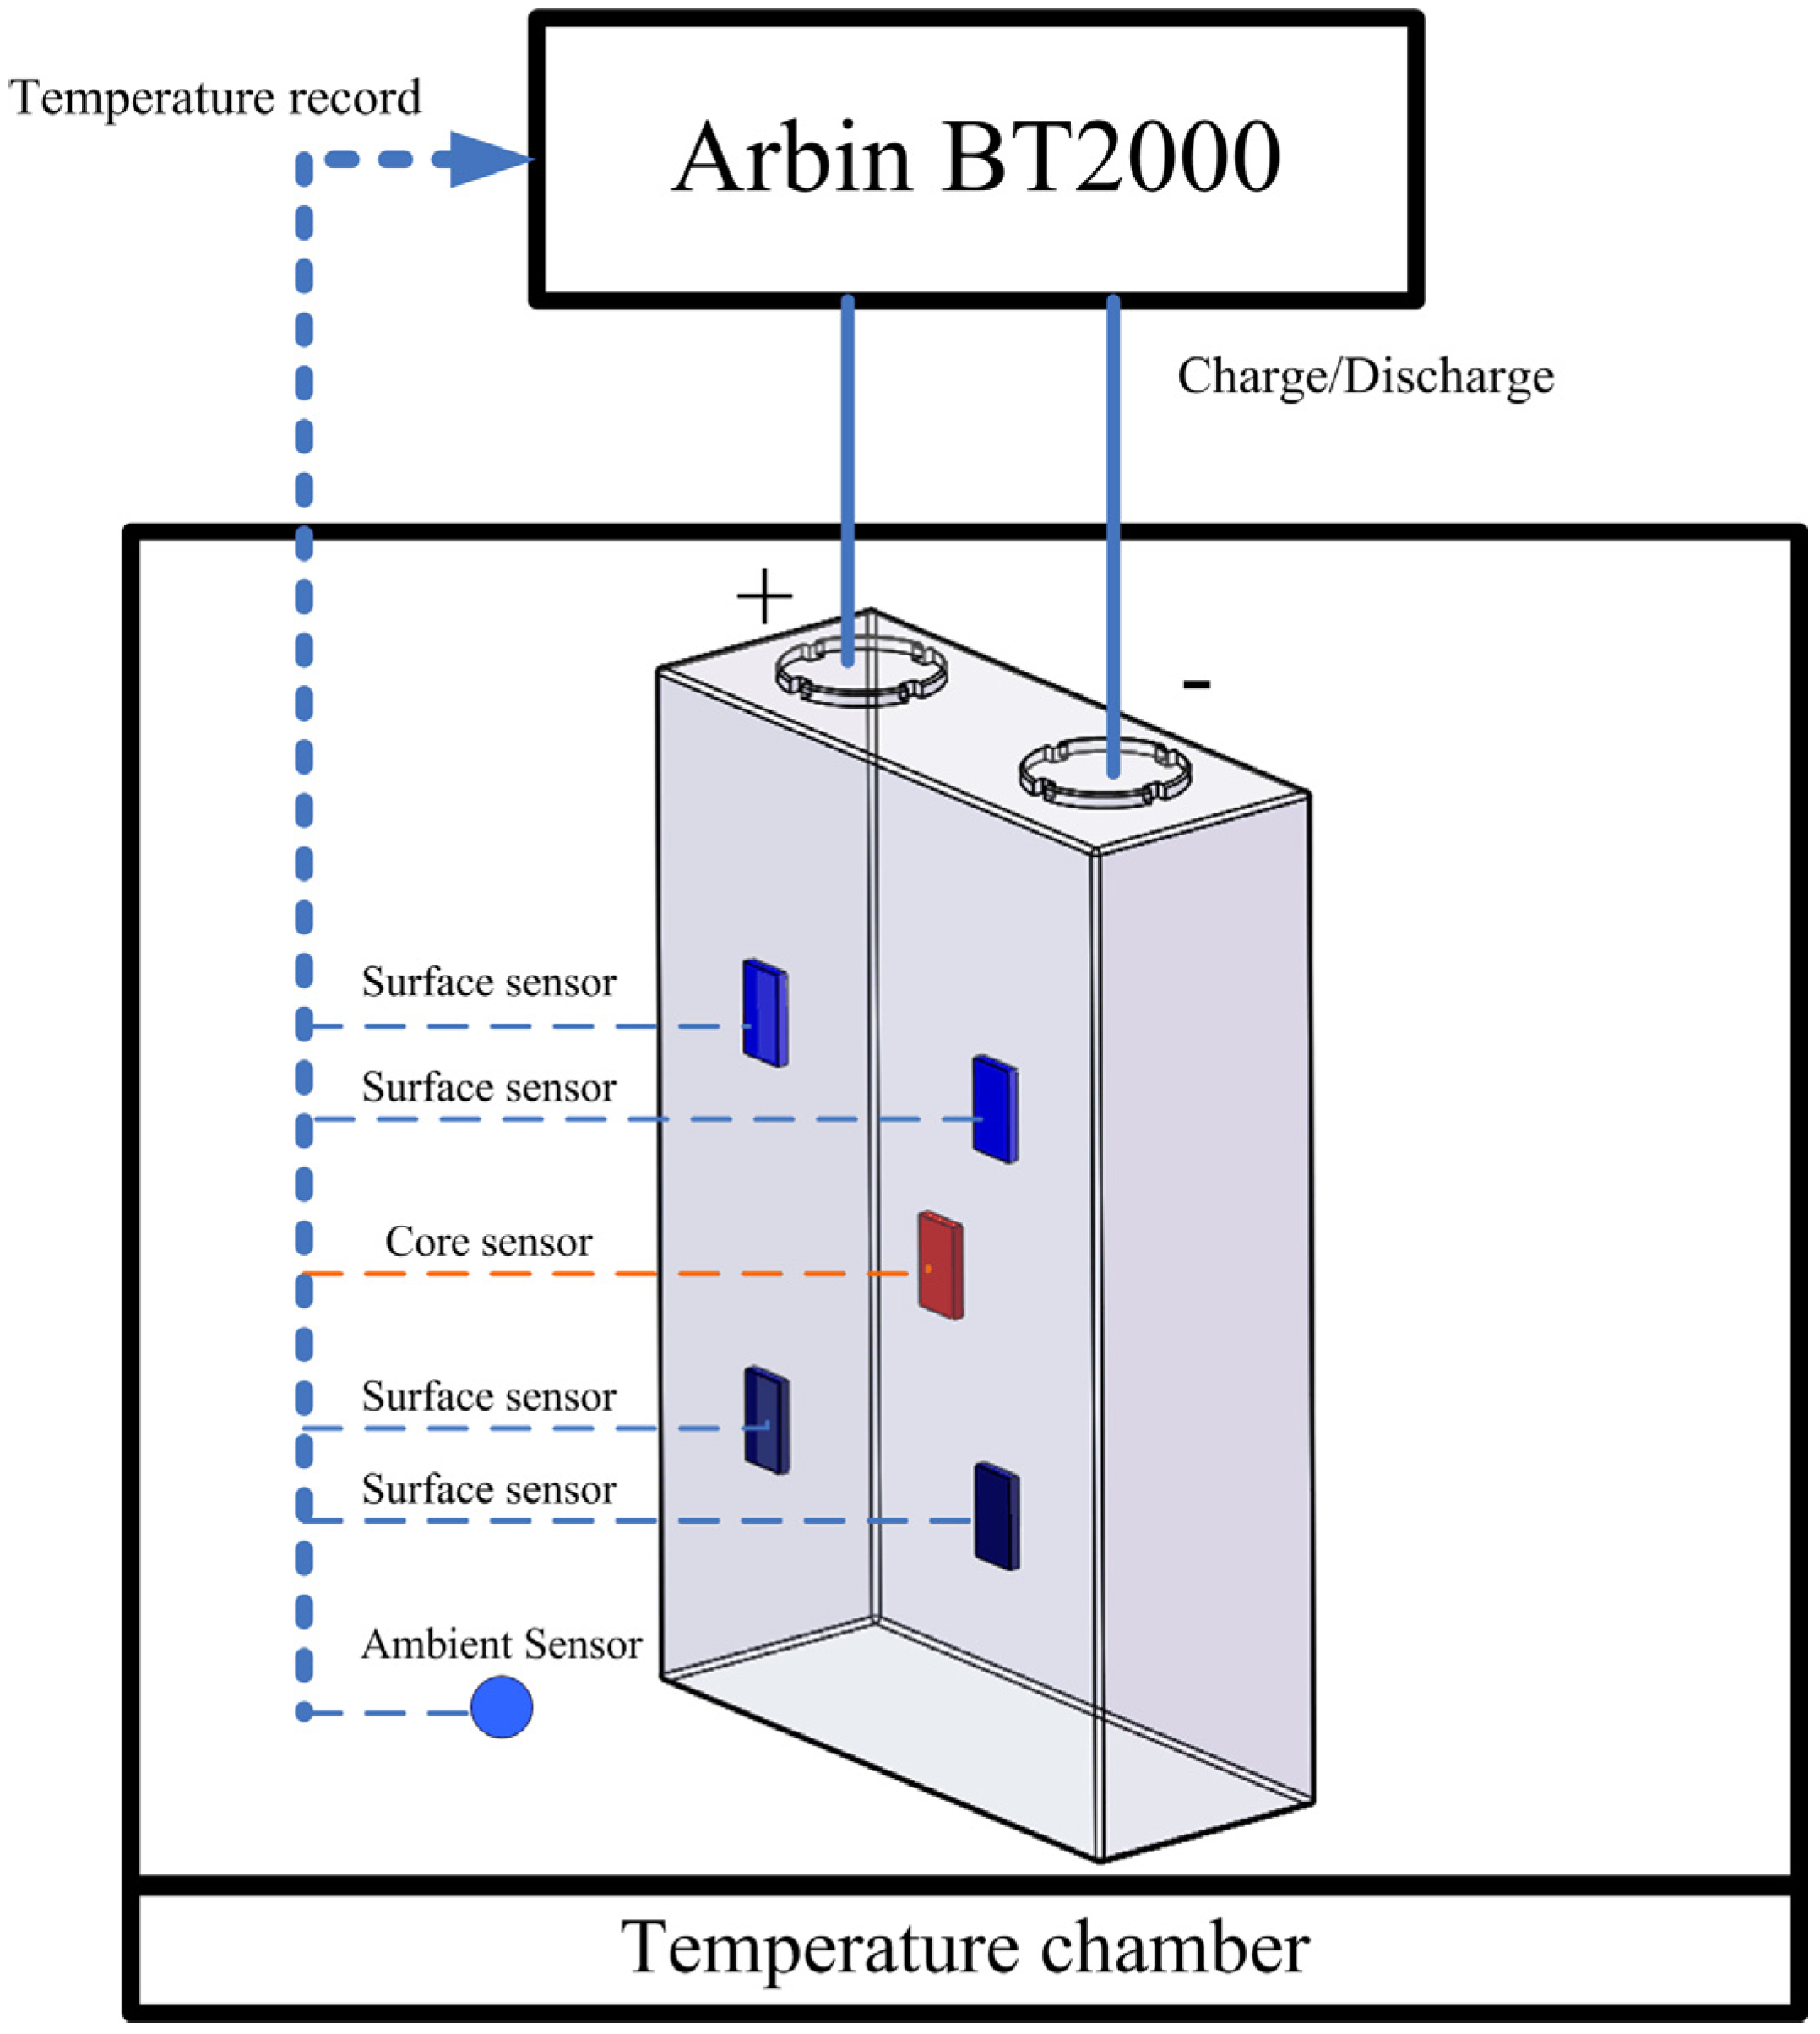
4.2. Measurement Equipment

All tests were performance with a channel of an Arbin Instruments BT2000 test bench (18 V, ±10 A for the medium current range and ±100 A for high current range), the voltage and current measurement accuracy are ±0.01% and ±0.02% for full-scale ranges respectively. Additionally, the temperature tests were performance in a Testsky GDW-80 (Taisite Experimental Equipment Co. Ltd., Nanjing, China) thermal chamber, where the temperature range is 233–423 K and the accuracy is ±2 K.

4.3. Experiment Object

The test batteries are LiFePO4/graphite type square laminated batteries, with a capacity of 40 Ah, and the upper and lower voltage limits are 3.65 V and 2.5 V, respectively. Moreover, thermocouples are installed: one is inserted into the cell and another four are on the surface, just as is shown in Figure 1. These thermocouples are used for parameter determination and model validation purposes.

5. Results and Discussion

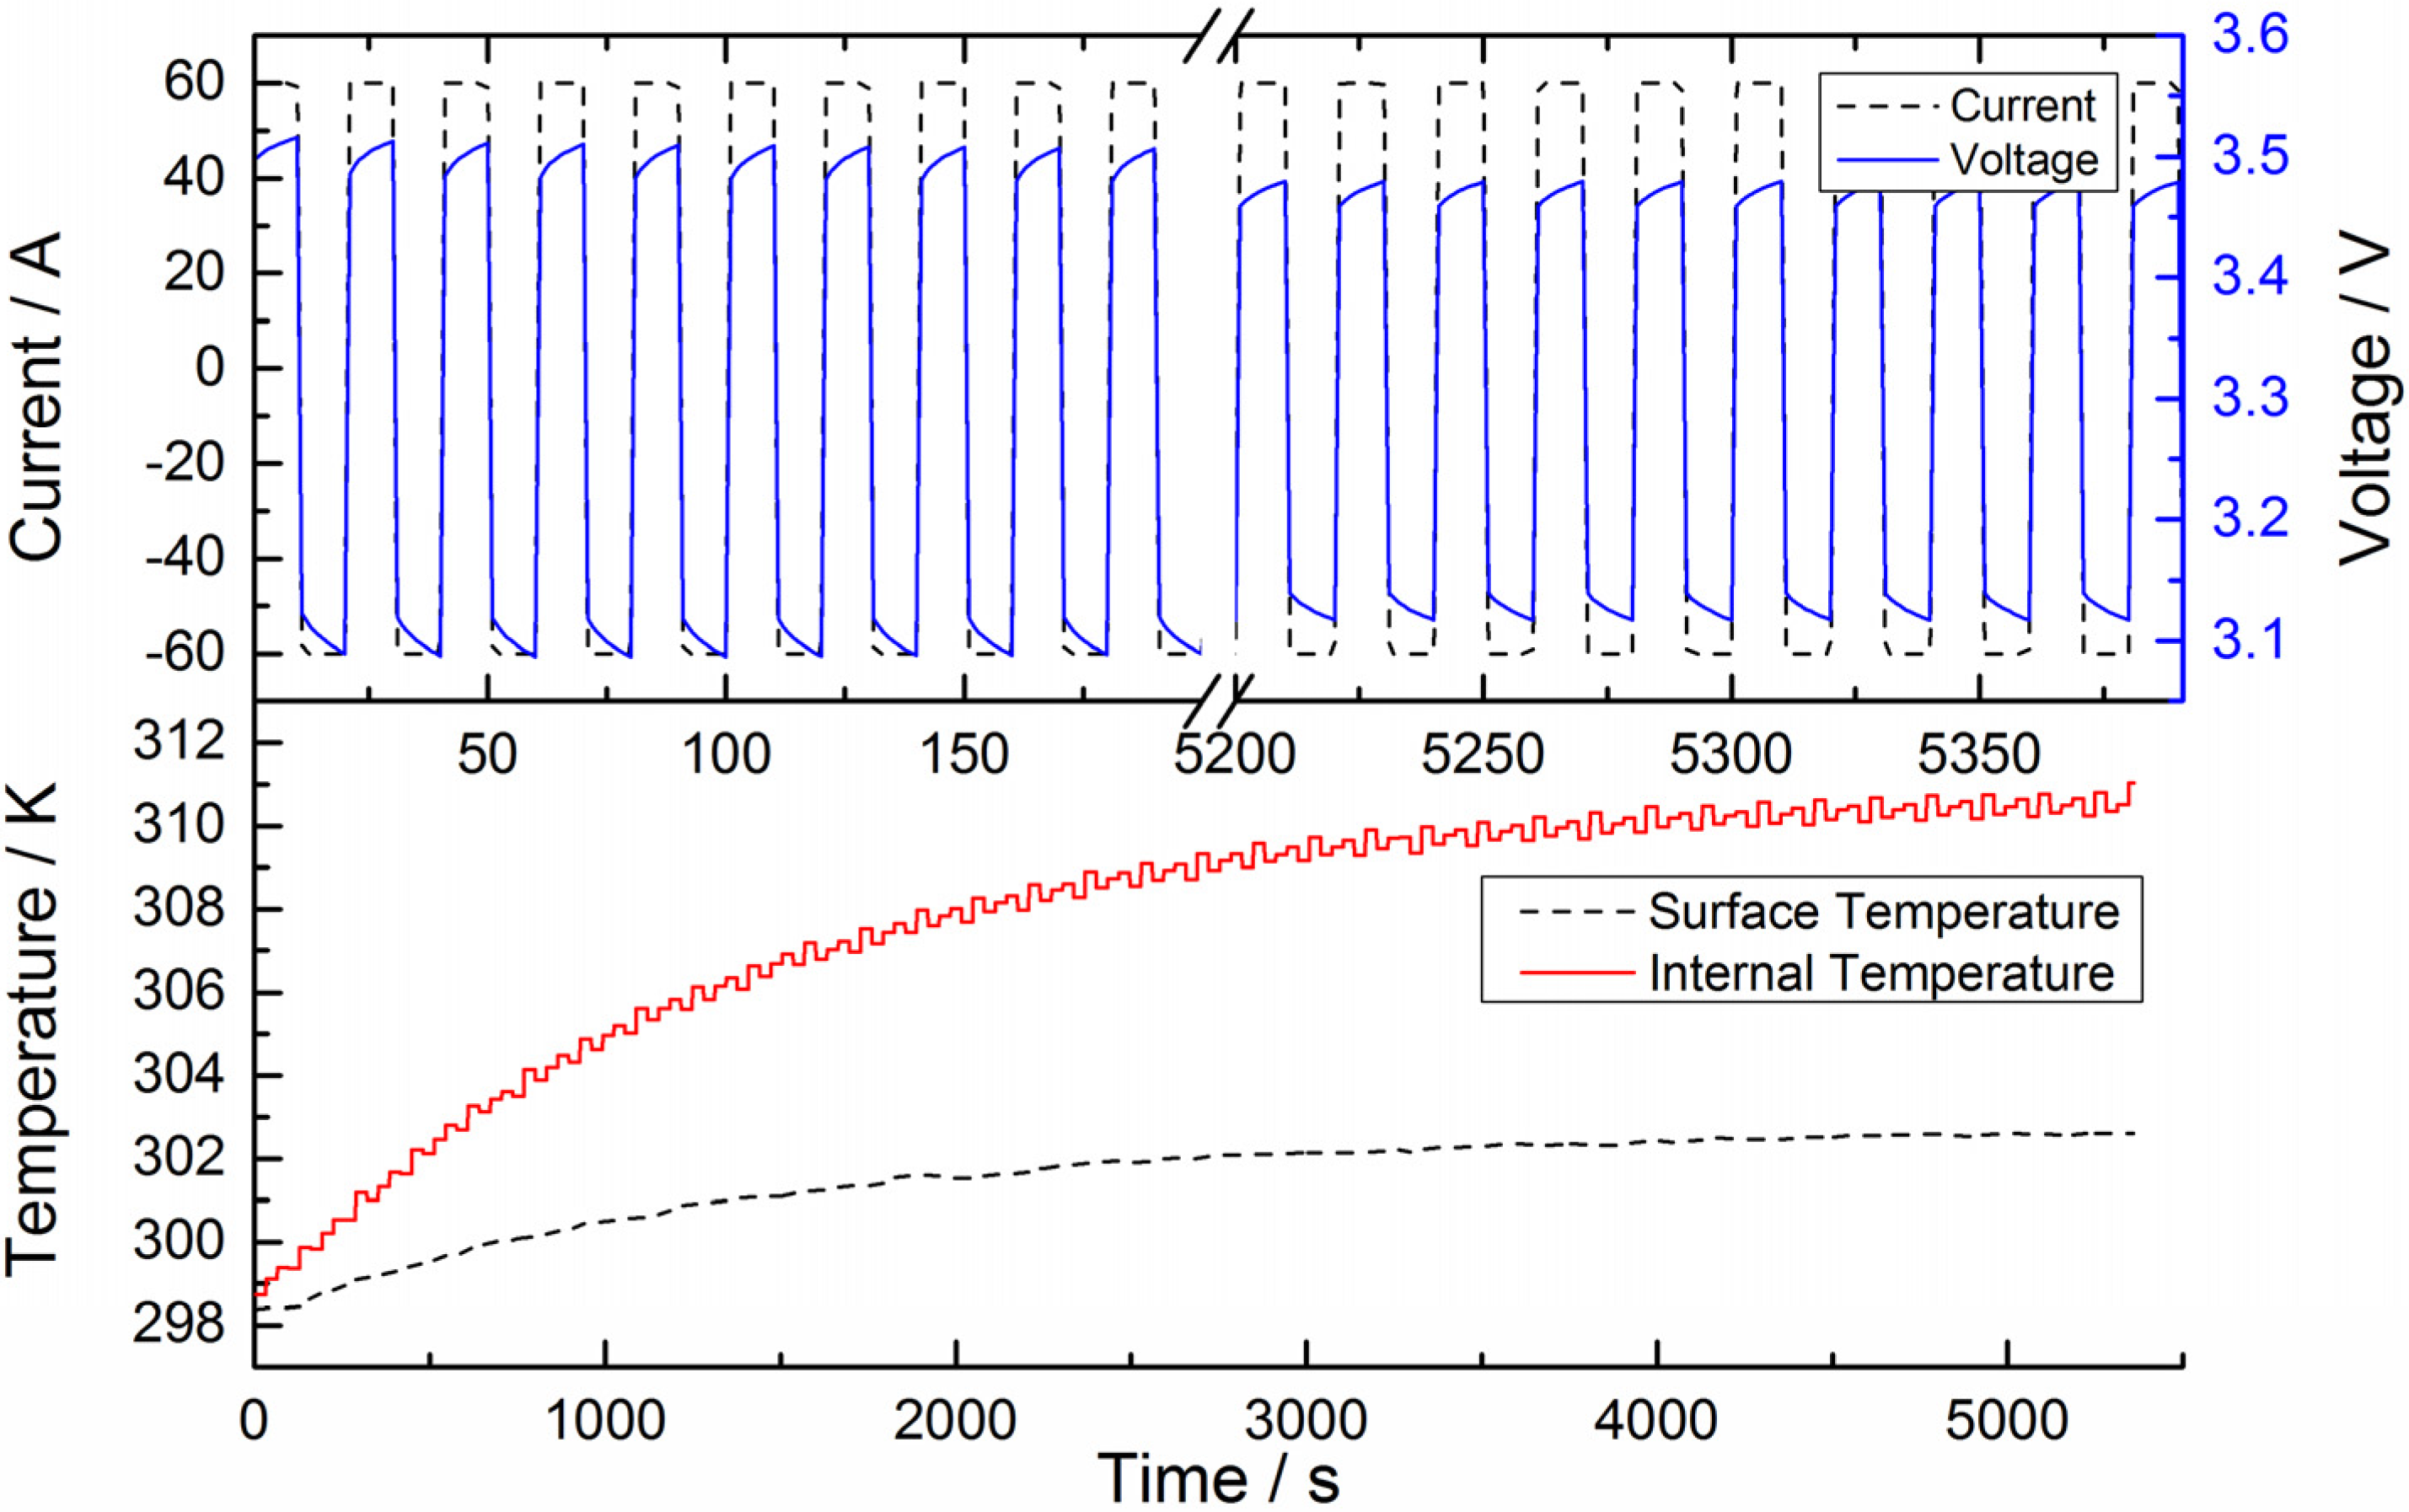
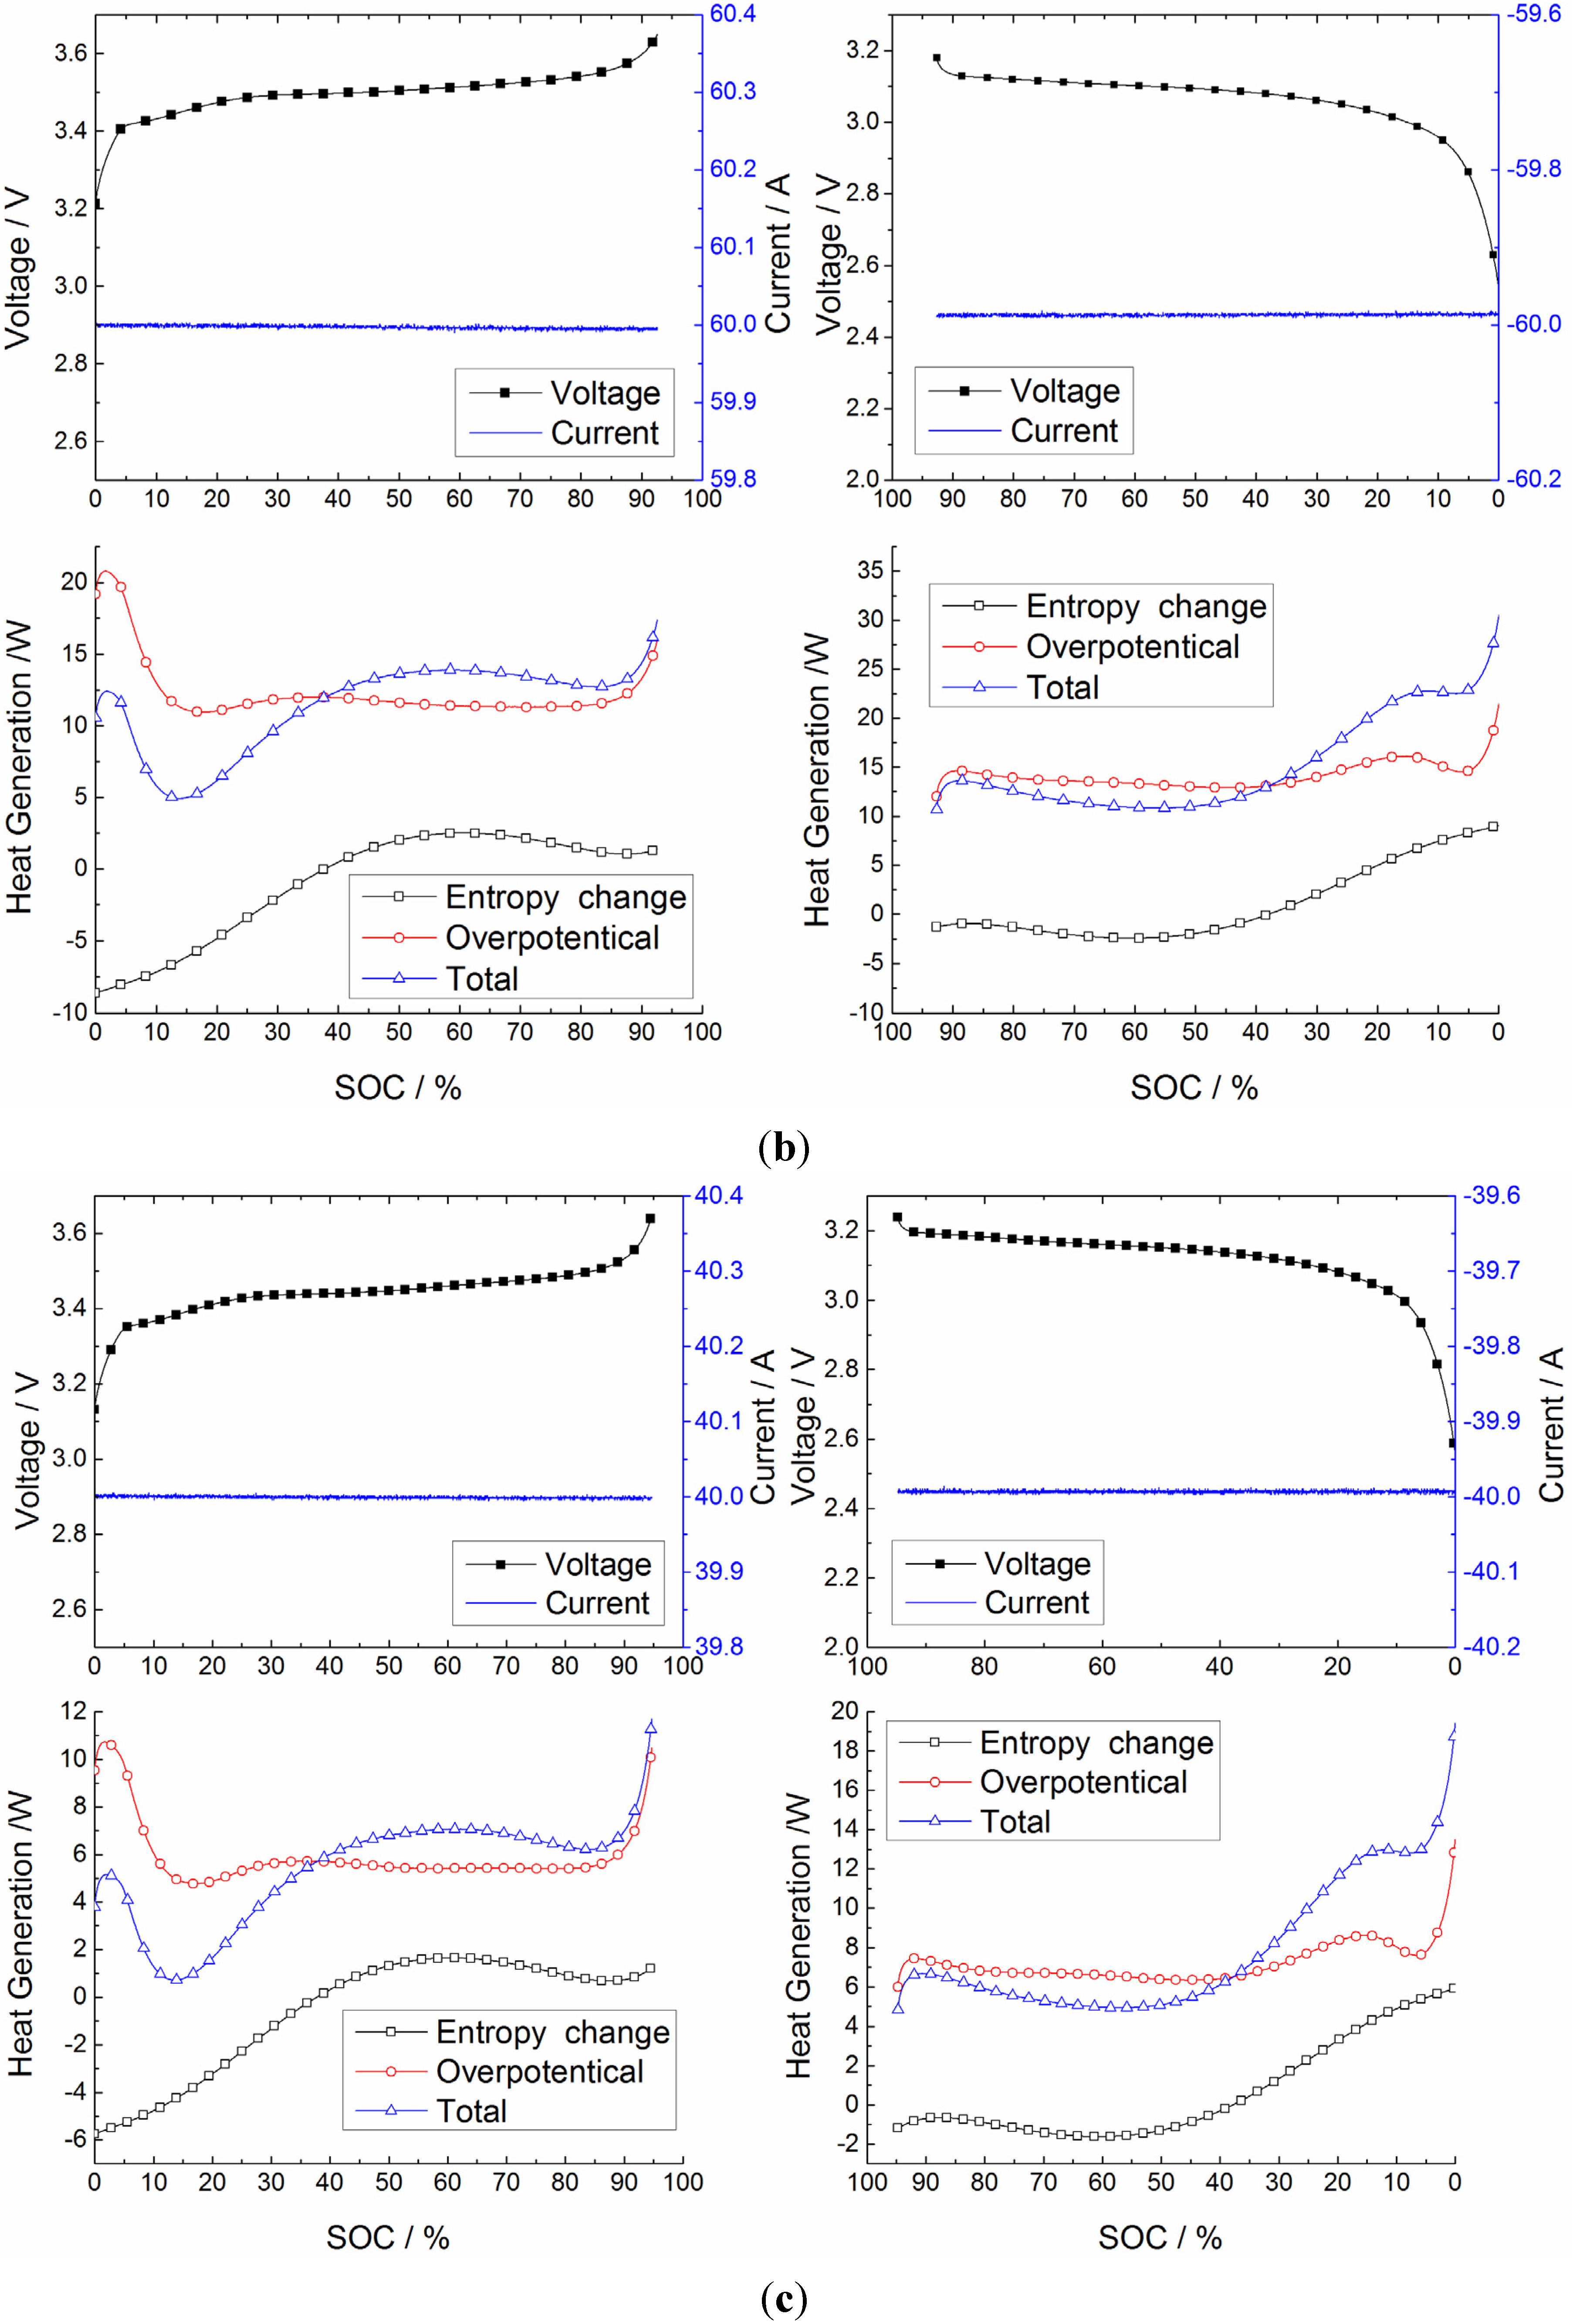
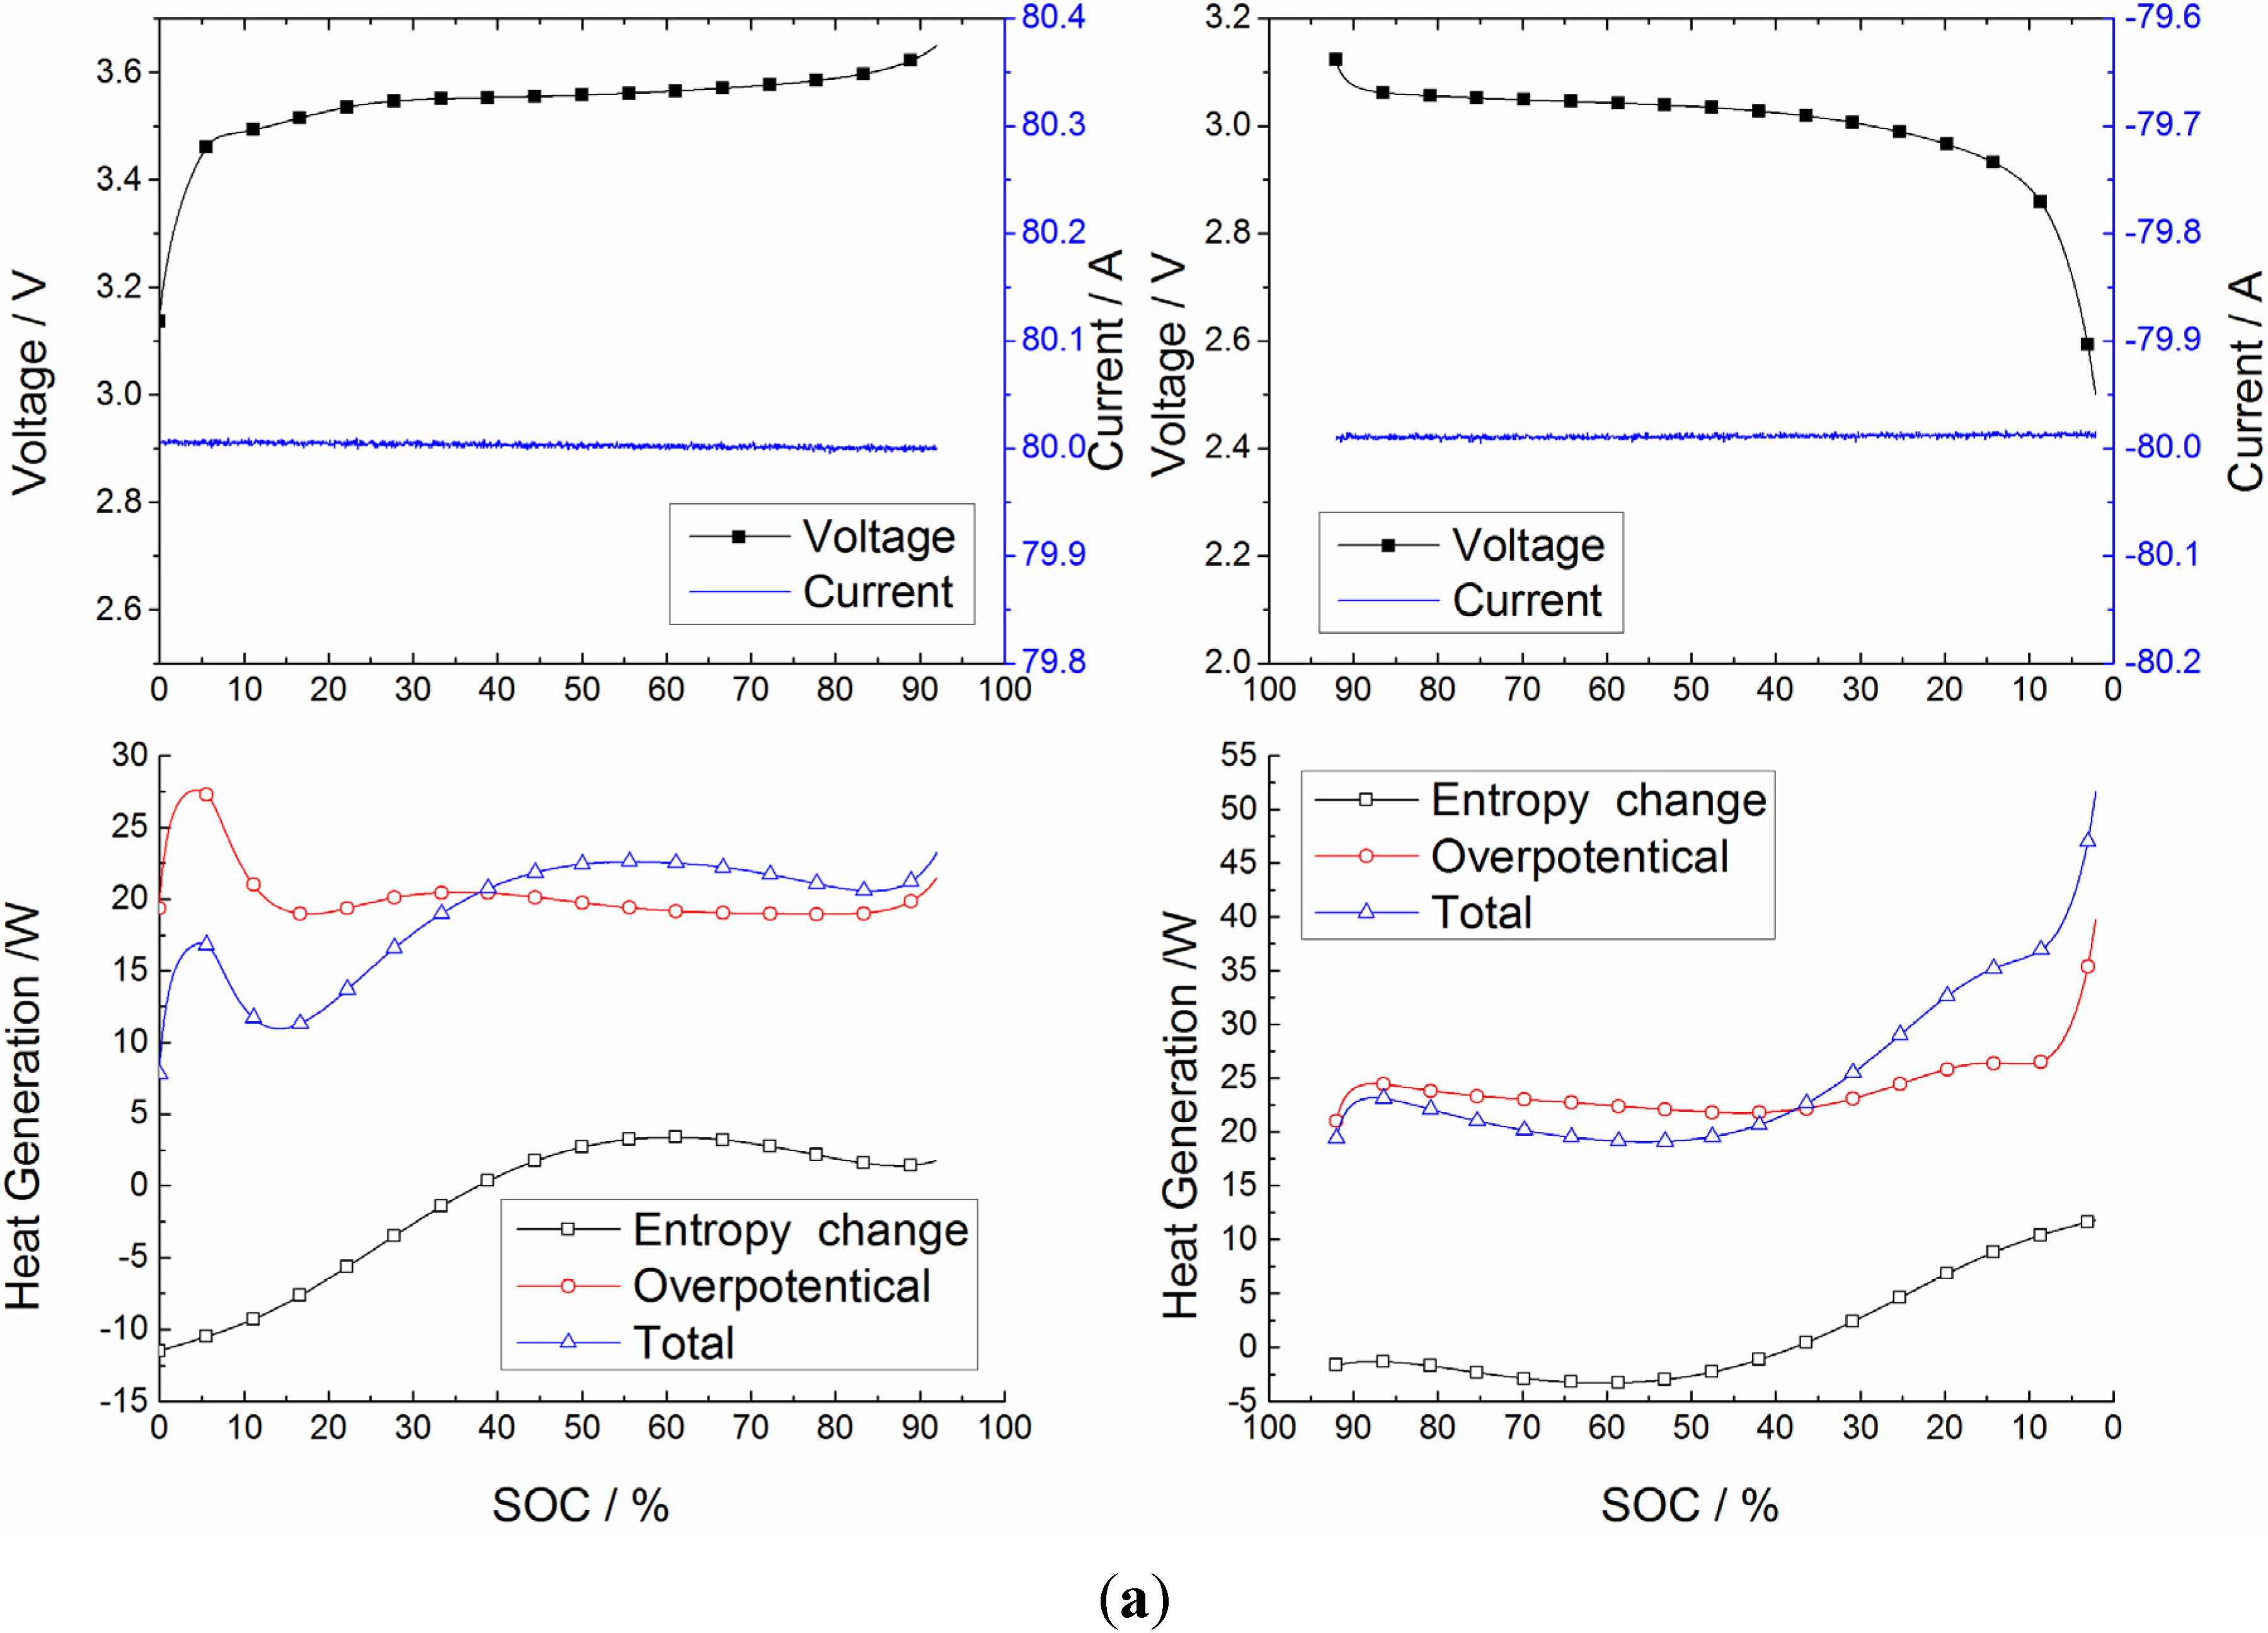
5.1. Heat Generation Analysis

In order to further evaluate the influence of overpotential and entropy change on heat generation at different current rate cycles, three charge and discharge cycles under different current rates were carried out. Figure 7 shows the heat generation caused by overpotential and entropy changes during the process of constant current charging and discharging.
Figure 7. Heat generation for 3 charge/discharge current rates (a) 2 C current rate heat generation; (b) 1.5 C current rate heat generation; (c) 1 C current rate heat generation.
Energies 08 04400 g007aEnergies 08 04400 g007b
In Figure 7, the left part of each figure is the result of charging, while the right part is that of discharging. And the heat generation caused by entropy change is indicated with black solid lines with box markings, the overpotentical heat generation is indicated with blue solid lines with round markings and the total of that two parts is indicated with triangle markings. In the charge/discharge curves of Figure 7, the black line with solid boxes is the voltage curve and the blue solid line is the current curve.
As discussed in Section 2.1, overpotential heat generation is always positive in Equation (3) that means that the effect of this part is exothermic. For entropy change heat generation, whether it is exothermic or endothermic depends on the sign of the current and the entropy coefficient. As is observed in Figure 7, the sign of the entropy change heat generation during the charging process at different current rates is negative, which indicates that the entropy change generation is endothermic within the SOC range between 0% and 37%. However, the amplitude of overpotential heat generation is large, due to the large resistance in the low SOC range. As a result, the total heat generation is exothermic. As the charging process progresses, the SOC increases when the SOC is within the range between 37% and 85%, and both parts of heat generation are exothermic. Additionally, the overpotential part accounts for the main part of total heat generation, because of the small amplitude of the entropy coefficient. Near the end of the charging process, the heat generation increases dramatically, due to the increase of entropy coefficient and resistance.
In the discharging process, the sign of the entropy change heat generation is negative over a large SOC range (from the start to 37% SOC discharging), whereas the total heat generation is always exothermic because of the large amplitude of the overpotential part. However, near the end of discharge (37% SOC–0% SOC), the sign of the entropy change heat generation becomes positive, thus the total heat generation increases sharply. It is notable that the total heat generation in this SOC range is 2–3 times that in the steady state, for example SOC = 50% in discharging mode.
The analysis above shows that at the end of the charging or discharging process, the total heat generation increases greatly. Moreover, the battery generates more heat with the increase of current rate in both the charging and discharging processes. In applications such as Electric Vehicle (EV)/Hybrid Electric Vehicle (HEV), if the heat could not be released efficiently, the accumulated heat may cause a thermal runaway, which threatens the operational safety. For the HEV application, the SOC operation range is between 30% and 70%, the heat generation is relatively steady in this range, and the entropy change part is so small as to be ignored, while overpotential heat generation is the main part, which would be a reference for the determination of a control strategy for a Thermal Management System (TMS). As for EV, whose SOC operation range is from 0% SOC to 100% SOC, high rate charging and discharging should be avoided, moreover, at the end of charging or discharging, TMS should control the actuator to dissipate more heat, considering the observed sudden increase of heat generation.

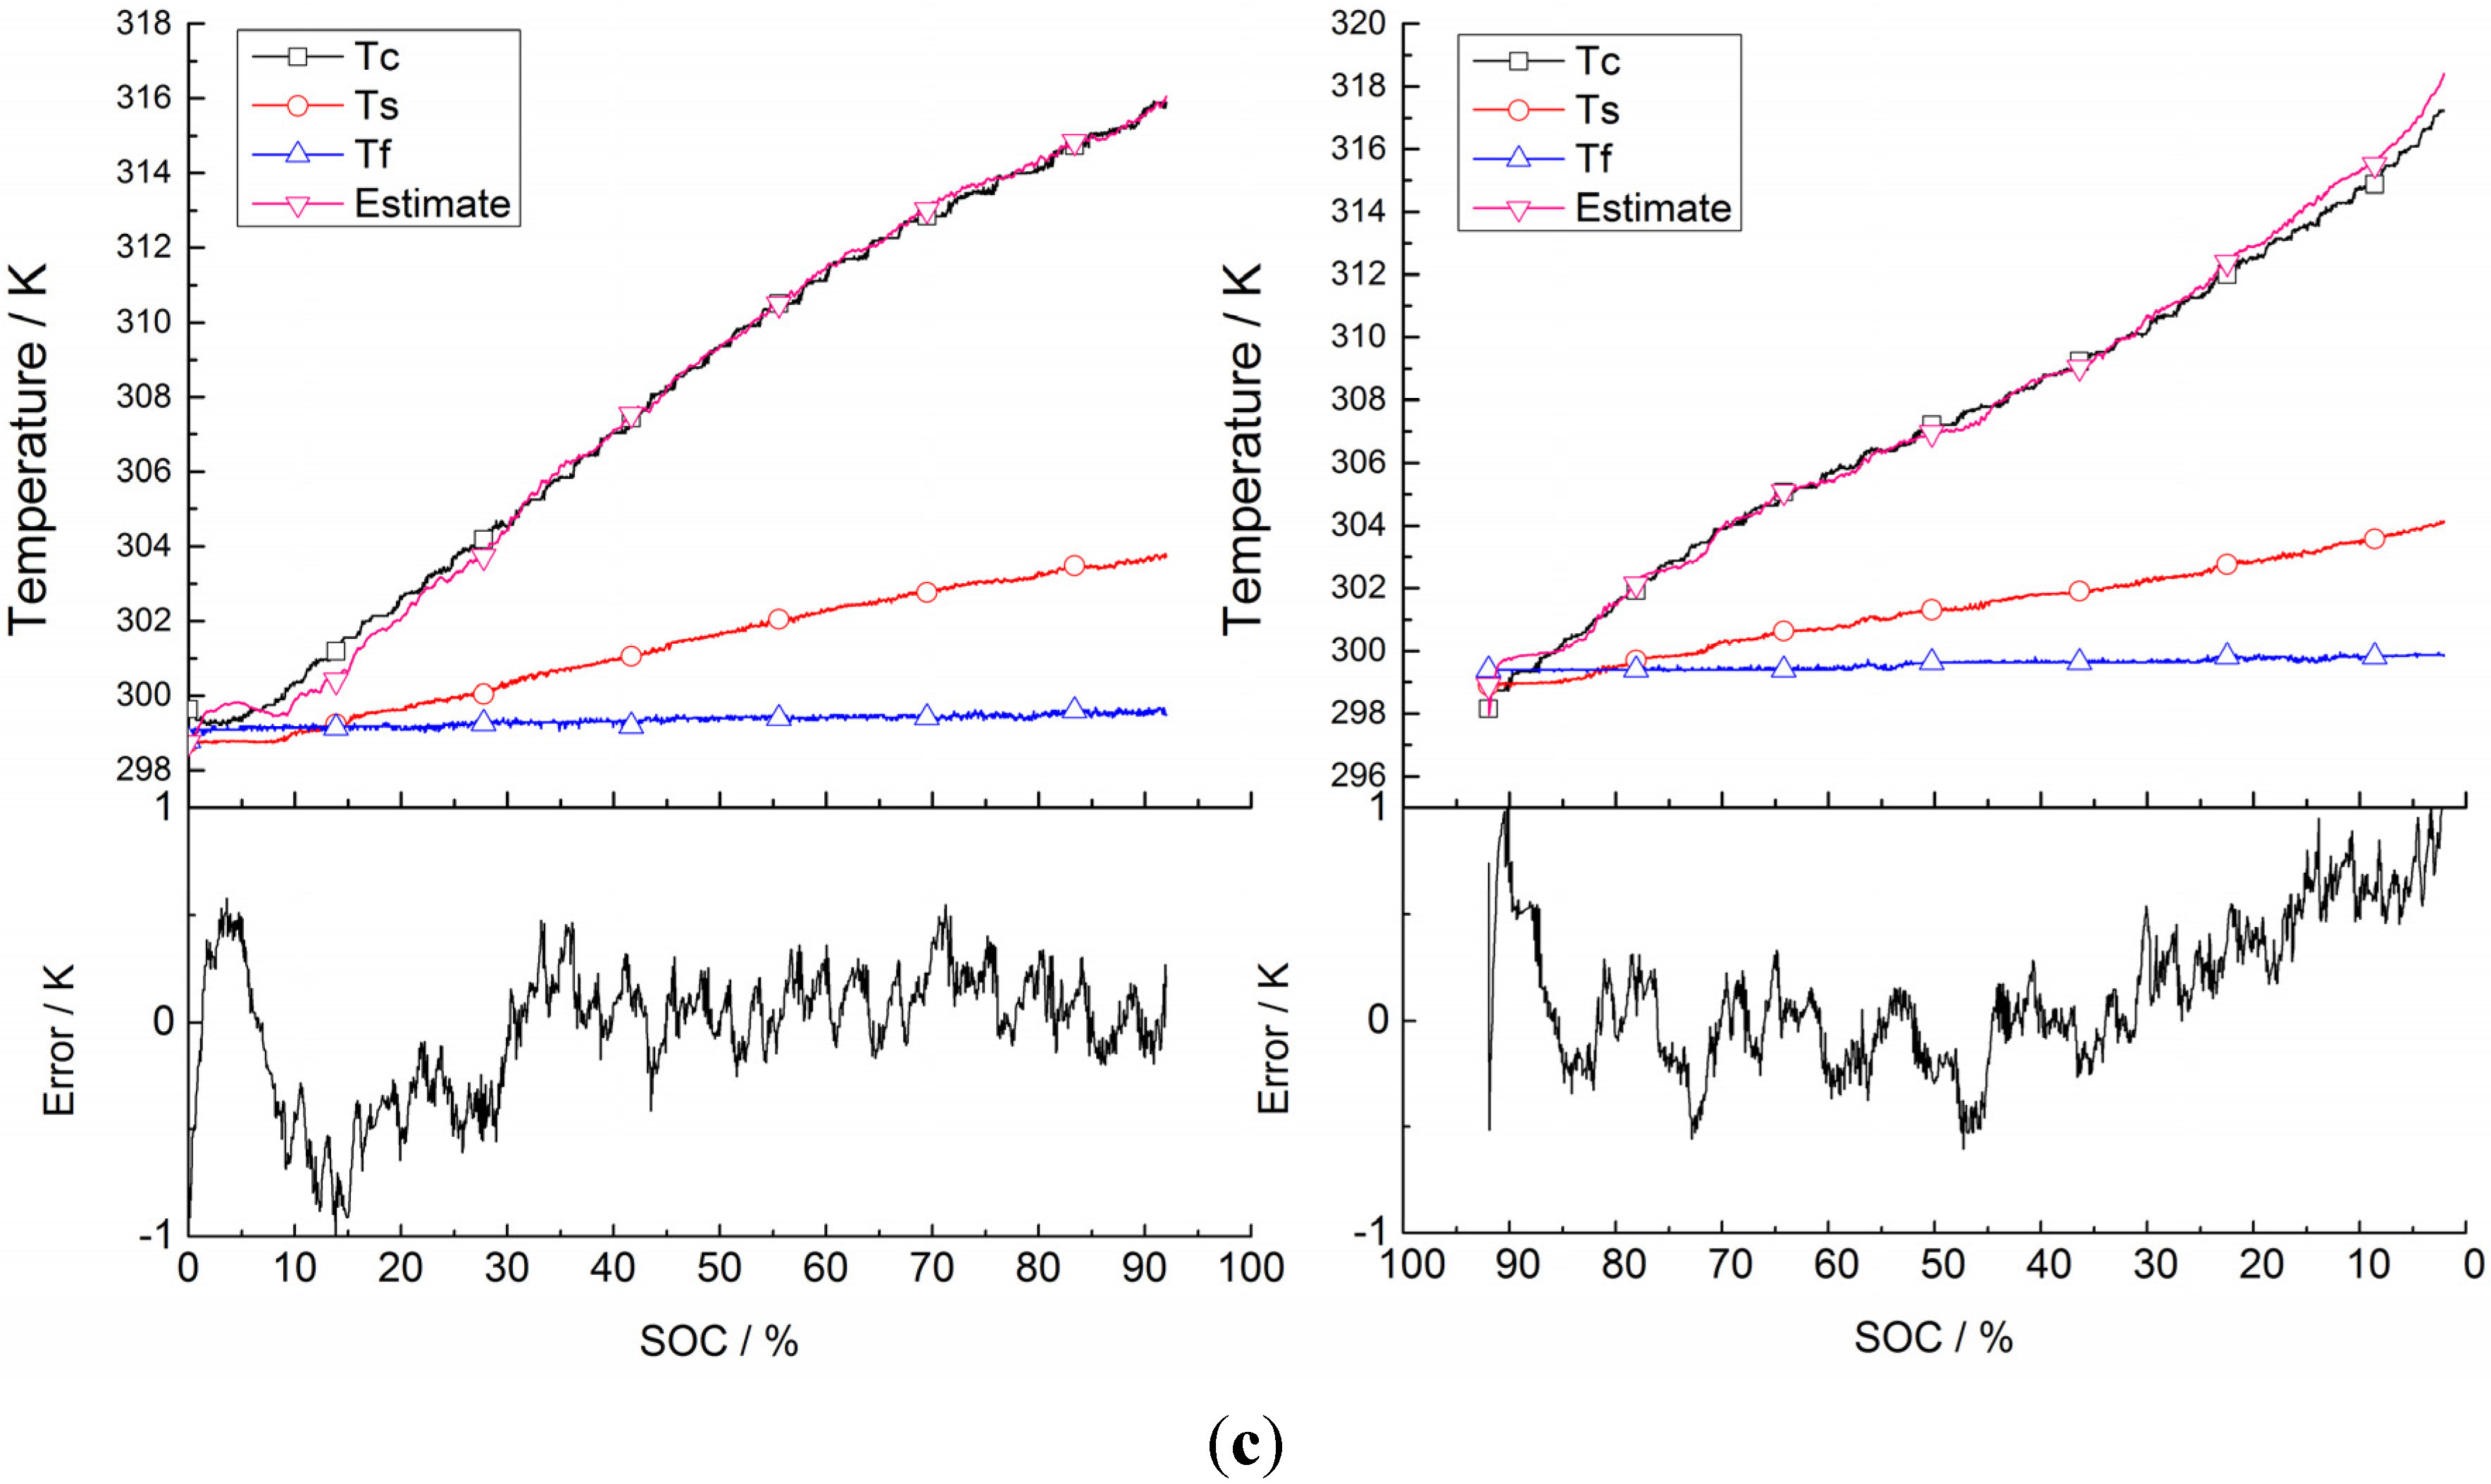
5.2. Validation of Battery Internal Temperature Estimation
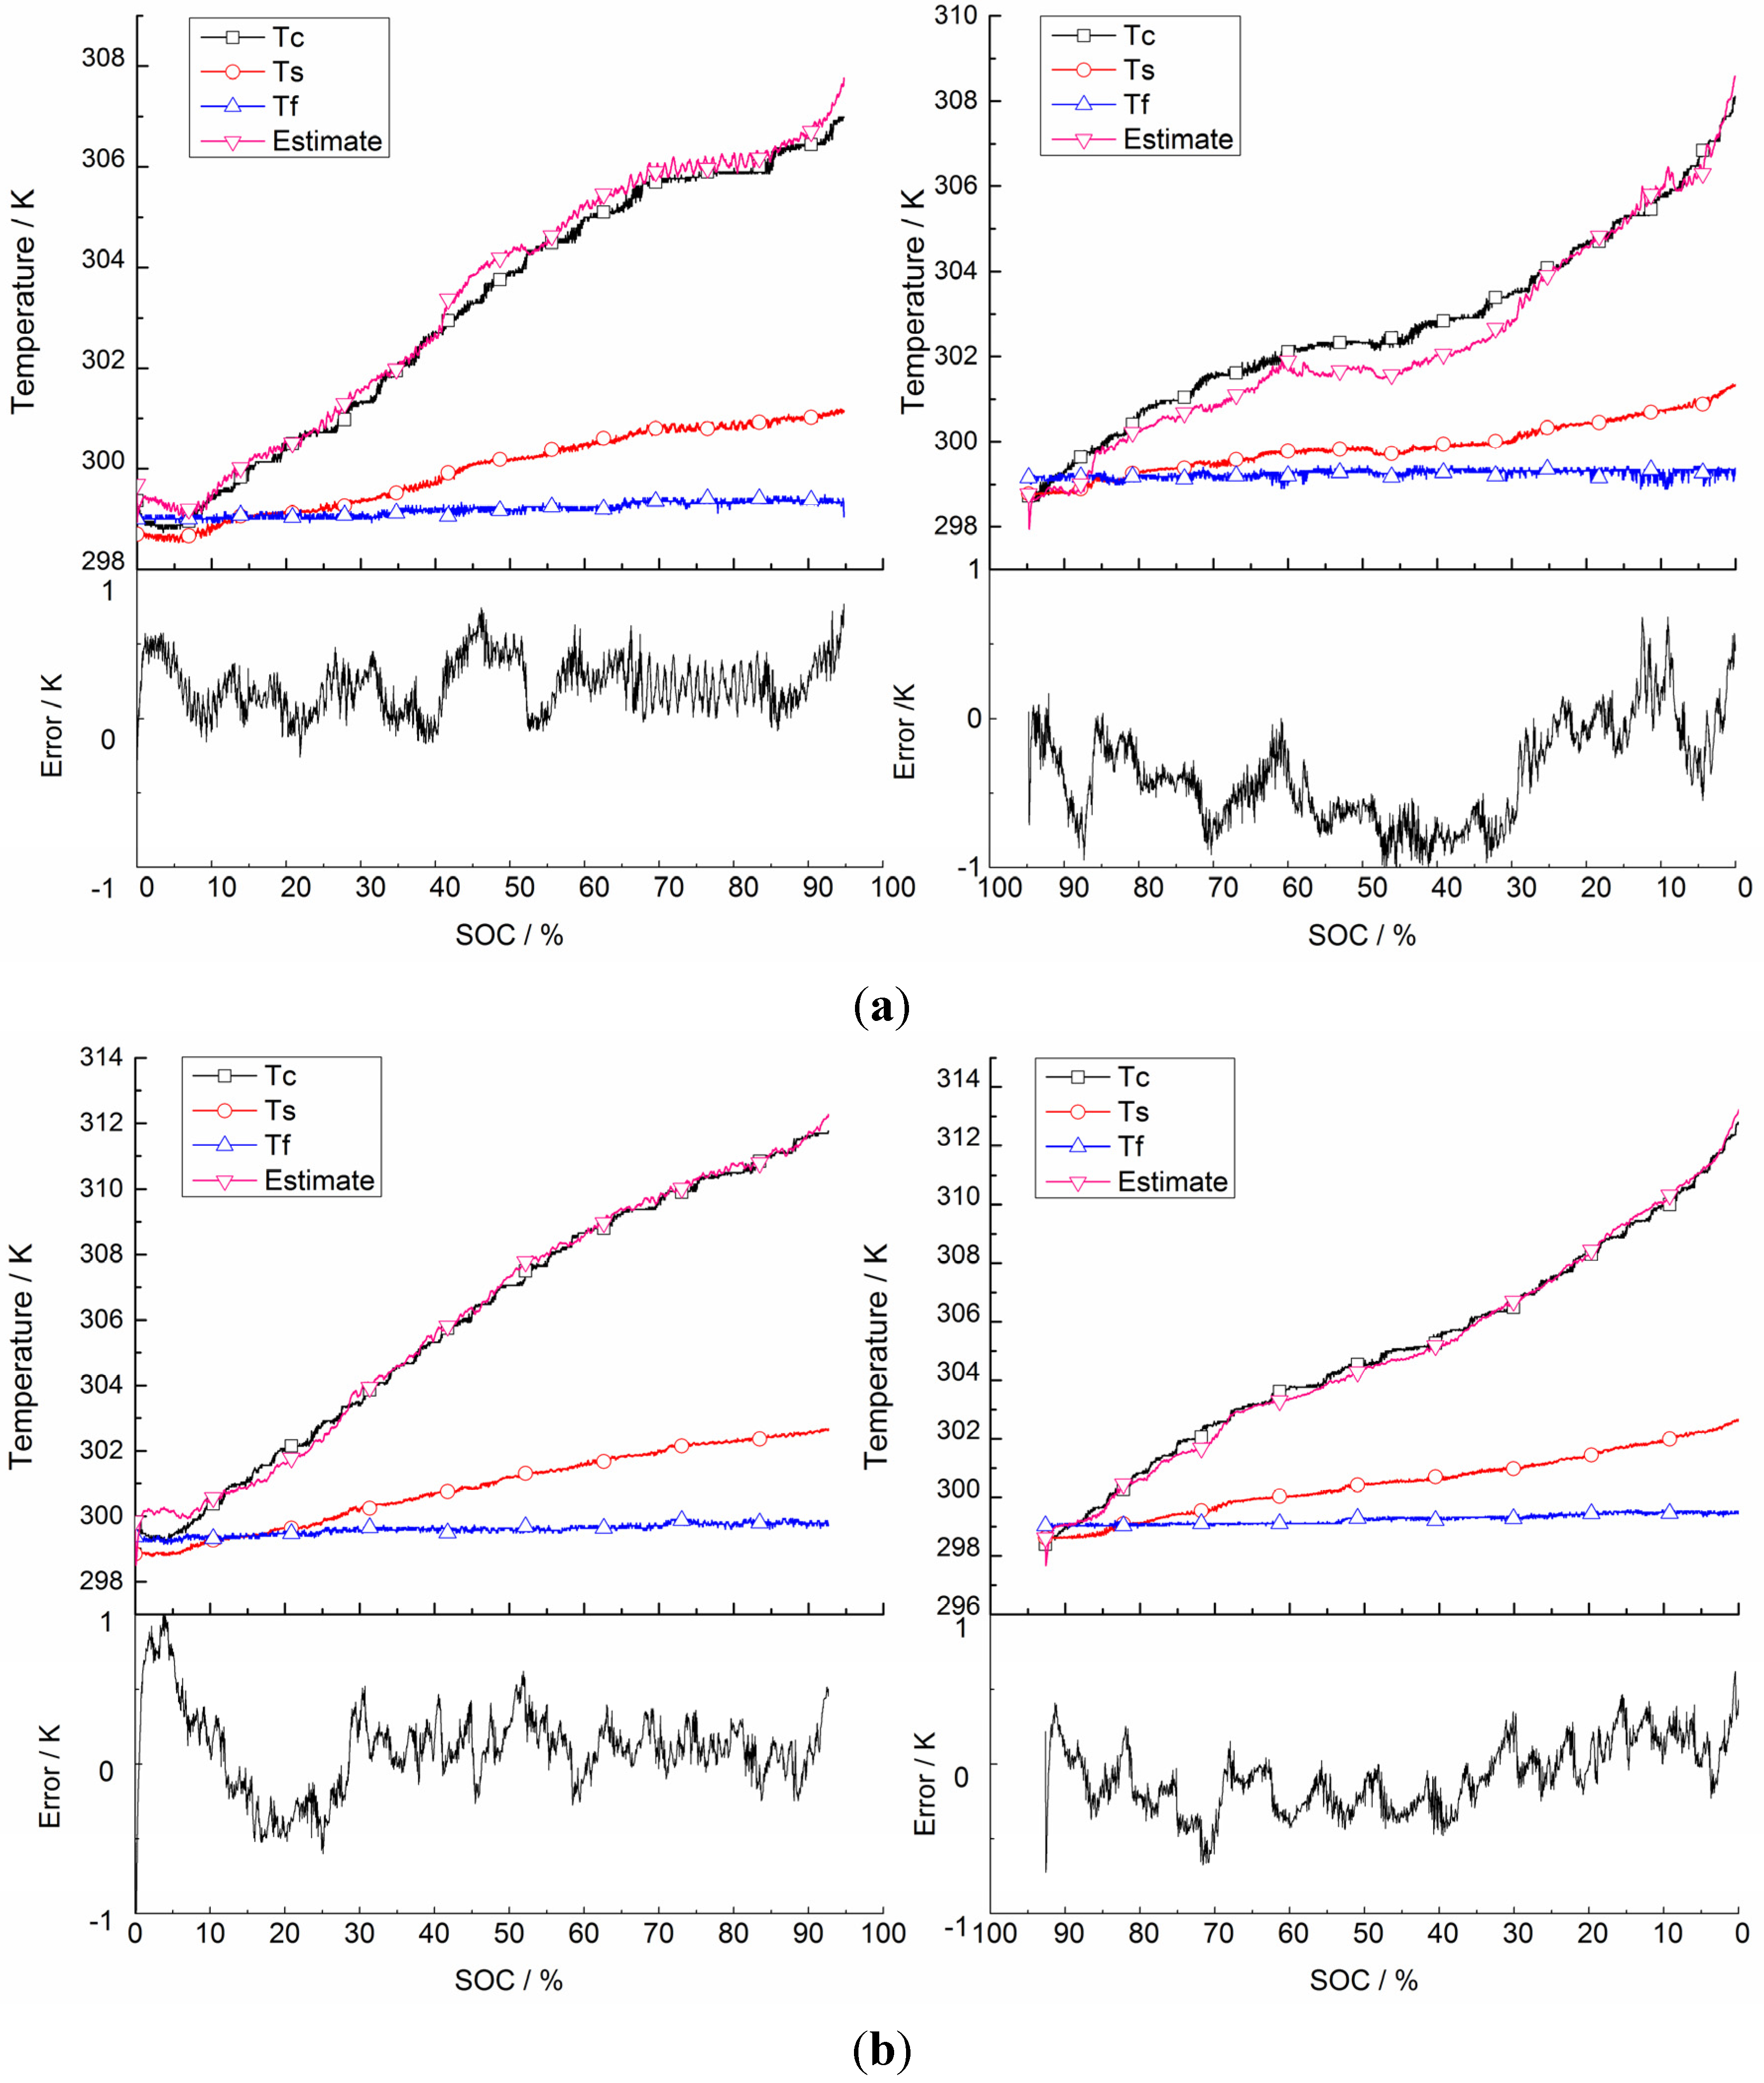
To verify the battery internal temperature estimation described in Section 3, the proposed method is applied in charge and discharge cycles to estimate the internal temperature with measured cell voltage, current, surface temperature and ambient temperature. The identification parameters are obtained through previous experiments. The model parameters refer to Table 1. The real values for internal temperature are measured by a thermocouple inserted inside the battery, and the estimated values are based on the model and measured inputs. Here, three current rates (2 C, 1.5 C, 1 C) for charge and discharge are chosen for validation, and the corresponding current and voltage curves are shown in Figure 7. The temperature variations are shown in Figure 8, the left part of each figure is the result of charging, while the right part is that of discharging. And the pink dotted line with upside-down triangle markings indicates the estimated internal temperature, the black solid line with box markings is the measured internal temperature. The red solid line with round markings is the average of four surface temperatures measured by surface thermocouples. The blue solid line with regular triangle markings is the ambient temperature.
Figure 8. Internal temperature estimation for three current rates. (a) Internal temperature estimations for 1 C current rate charge/discharge; (b) Internal temperature estimations for 1.5 C current rate charge/discharge; (c) Internal temperature estimations for 2 C current rate charge/discharge.
Energies 08 04400 g008aEnergies 08 04400 g008b
As observed in Figure 8, there are significant differences between the surface and core temperatures. This demonstrates the statement in the Introduction section that the surface temperature could hardly reflect the core temperature change accurately. In the charge and discharge process under the same current rate, the temperature rise rate at the end of discharging is higher than that of charging. Under different current rates with the same current direction, the internal temperature rises with the increase of current rate. Thus, the heat generation analysis mentioned in Section 5.1 is verified. The proposed method is implemented on the three current rates for charging and discharging, and the results are shown in Figure 8a–c, respectively, which show good curve-fitting effects and accurate prediction results with maximum errors within 1 K. Additionally, the RMSE for internal temperature estimation under different current rates and directions are detailed in Table 2.
Table 2. Root Mean Squared Error (RMSE) for estimation on the three current rates.
CurrentCurrent DirectionRMSE
40 ACharge/Discharge0.287145/0.502787
60 ACharge/Discharge0.294537/0.243265
80 ACharge/Discharge0.301420/0.362020

6. Conclusions

A simplified thermal model was presented to describe the thermal balance in a battery. The heat generation was analyzed quatitatively so as to determine the influence of overpotential entropy changes on battery heat generation. As a result, at both ends of charging and discharging, the total heat generation increases dramatically, especially for discharging. Thermocouples are installed inside the battery to provide real values for parameterization and validation of prediction. Additionally, the battery surface temperature and ambient temperature are measured as the inputs for the proposed method. A difference between the surface and core is observed during the experiments of constant current charging/discharging, which emphasizes the necessity for the estimation of internal temperature. The estimation error of the internal temperature with a KF is validated to be less than 1 K. In addition, the KF comprises a set of recursive equations that are repeatedly evaluated as the system operates, so during the operation only the present data and the last time point data need to be stored. The proposed method is efficient and simple to implement on a micro-controller based BMS or TMS for battery internal temperature estimation. This is a preliminary study, and our future work will focus on a strategy for low temperature thermal management.

Acknowledgments

This research was supported in part by the Research and Development of Application Technology Plan Project in Heilongjiang Province of China (GA13A202) and the Nature Science Foundation of China-Engineering and Physical Sciences Research Council (NSFC-EPSRC) Collaborative Research Initiative in Smart Grids and the Integration of Electric Vehicles (51361130153) and Science and Technology Project of State Grid Corporation of China.

Author Contributions

Jinlei Sun designed the method and some parts of the experiments, and wrote the main parts of the manuscript. Lei Pei checked the Kalman filter part. Chao Wu, Rengui Lu and Kai Song designed the other experimental parts. Chunbo Zhu and Guo Wei checked the results and the whole manuscript.

Conflicts of Interest

The authors declare no conflict of interest.

References

  1. Lu, L.; Han, X.; Li, J.; Hua, J.; Ouyang, M. A review on the key issues for lithium-ion battery management in electric vehicles. J. Power Sources 2013, 226, 272–288. [Google Scholar] [CrossRef]
  2. Richardson, R.R.; Ireland, P.T.; Howey, D.A. Battery internal temperature estimation by combined impedance and surface temperature measurement. J. Power Sources 2014, 265, 254–261. [Google Scholar] [CrossRef]
  3. Forgez, C.; Do, D.V.; Friedrich, G.; Morcrette, M.; Delacourt, C. Thermal modeling of a cylindrical lifepo4/graphite lithium-ion battery. J. Power Sources 2010, 195, 2961–2968. [Google Scholar] [CrossRef]
  4. Debert, M.; Colin, G.; Bloch, G.; Chamaillard, Y. An observer looks at the cell temperature in automotive battery packs. Control Eng. Pract. 2013, 21, 1035–1042. [Google Scholar] [CrossRef]
  5. Lin, X.; Perez, H.E.; Siegel, J.B.; Stefanopoulou, A.G.; Li, Y.; Anderson, R.D.; Ding, Y.; Castanier, M.P. Online parameterization of lumped thermal dynamics in cylindrical lithium ion batteries for core temperature estimation and health monitoring. IEEE Trans. Control Syst. Technol. 2013, 21, 1745–1755. [Google Scholar] [CrossRef]
  6. Bandhauer, T.M.; Garimella, S.; Fuller, T.F. A critical review of thermal issues in lithium-ion batteries. J. Electrochem. Soc. 2011, 158, R1–R25. [Google Scholar] [CrossRef]
  7. Dong, H.J.; Seung, M.B. Thermal modeling of cylindrical lithium ion battery during discharge cycle. Energy Convers. Manag. 2011, 52, 2973–2981. [Google Scholar] [CrossRef]
  8. Rad, M.S.; Danilov, D.L.; Baghalha, M.; Kazemeini, M.; Notten, P.H.L. Adaptive thermal modeling of Li-ion batteries. Electrochim. Acta 2013, 102, 183–195. [Google Scholar] [CrossRef]
  9. Samba, A.; Omar, N.; Gualous, H.; Firouz, Y.; van den Bossche, P.; van Mierlo, J.; Boubekeur, T.I. Development of an advanced two-dimensional thermal model for large size lithium-ion pouch cells. Electrochim. Acta 2014, 117, 246–254. [Google Scholar] [CrossRef]
  10. Santhanagopalan, S.; Ramadass, P.; Zhang, J.Z. Analysis of internal short-circuit in a lithium ion cell. J. Power Sources 2009, 194, 550–557. [Google Scholar] [CrossRef]
  11. Li, Z.; Zhang, J.B.; Wu, B.; Huang, J.; Nie, Z.H.; Sun, Y.; An, F.Q.; Wu, N.N. Examining temporal and spatial variations of internal temperature in large-format laminated battery with embedded thermocouples. J. Power Sources 2013, 241, 536–553. [Google Scholar] [CrossRef]
  12. Mutyala, M.; Zhao, J.Z.; Li, J.Y.; Pan, H.G.; Yuan, C.; Li, X.C. In-situ temperature measurement in lithium ion battery by transferable flexible thin film thermocouples. J. Power Sources 2014, 260, 43–49. [Google Scholar] [CrossRef]
  13. Thomas, K.E.; Newman, J. Thermal modeling of porous insertion electrodes. J. Electrochem. Soc. 2003, 150, A176–A192. [Google Scholar] [CrossRef]
  14. Lin, X.F.; Perez, H.E.; Mohan, S.; Siegel, J.B.; Stefanopoulou, A.G.; Ding, Y.; Castanier, M.P. A lumped-parameter electro-thermal model for cylindrical batteries. J. Power Sources 2014, 257, 1–11. [Google Scholar] [CrossRef]
  15. Pei, L.; Wang, T.; Lu, R.; Zhu, C. Development of a voltage relaxation model for rapid open-circuit voltage prediction in lithium-ion batteries. J. Power Sources 2014, 253, 412–418. [Google Scholar] [CrossRef]
  16. Williford, R.E.; Viswanathan, V.V.; Zhang, J.-G. Effects of entropy changes in anodes and cathodes on the thermal behavior of lithium ion batteries. J. Power Sources 2009, 189, 101–107. [Google Scholar] [CrossRef]
  17. Plett, G.L. Extended kalman filtering for battery management systems of LiPB-based HEV battery packs: Part 1. Background. J. Power Sources 2004, 134, 252–261. [Google Scholar] [CrossRef]
  18. Pei, L.; Zhu, C.; Wang, T.; Lu, R.; Chan, C.C. Online peak power prediction based on a parameter and state estimator for lithium-ion batteries in electric vehicles. Energy 2014, 66, 766–778. [Google Scholar] [CrossRef]
  19. Kalman, R.E. A new approach to linear filtering and prediction problems. Trans. ASME J. Basic Eng. 1960, 82, 35–45. [Google Scholar] [CrossRef]

