1. Introduction
The expansion of smart metering systems worldwide, and especially in Europe as a result of the Directive [
1], Annex I.2 (last report in [
2]), is now not a trend but a fact. Smart metering systems have evolved from the plain automatic meter reading (AMR) to the advanced metering infrastructure (AMI) [
3], and from there, they have acquired this new name of smart metering.
Smart metering systems have common characteristics, and eventually a formal architecture [
4] has been defined for them. Depending on the nature of the utility and country, parts of that system are implemented in a different way. Undoubtedly, one of the main differences among smart metering systems is the telecommunications technology used [
5,
6]. Although the different technology alternatives may be functional, they show different particularities that make the deployments different, either from the logistics, or from the investment levels, or from the operational costs. Moreover, not all of them offer the same functionality or control over the smart metering infrastructure needed for their performance.
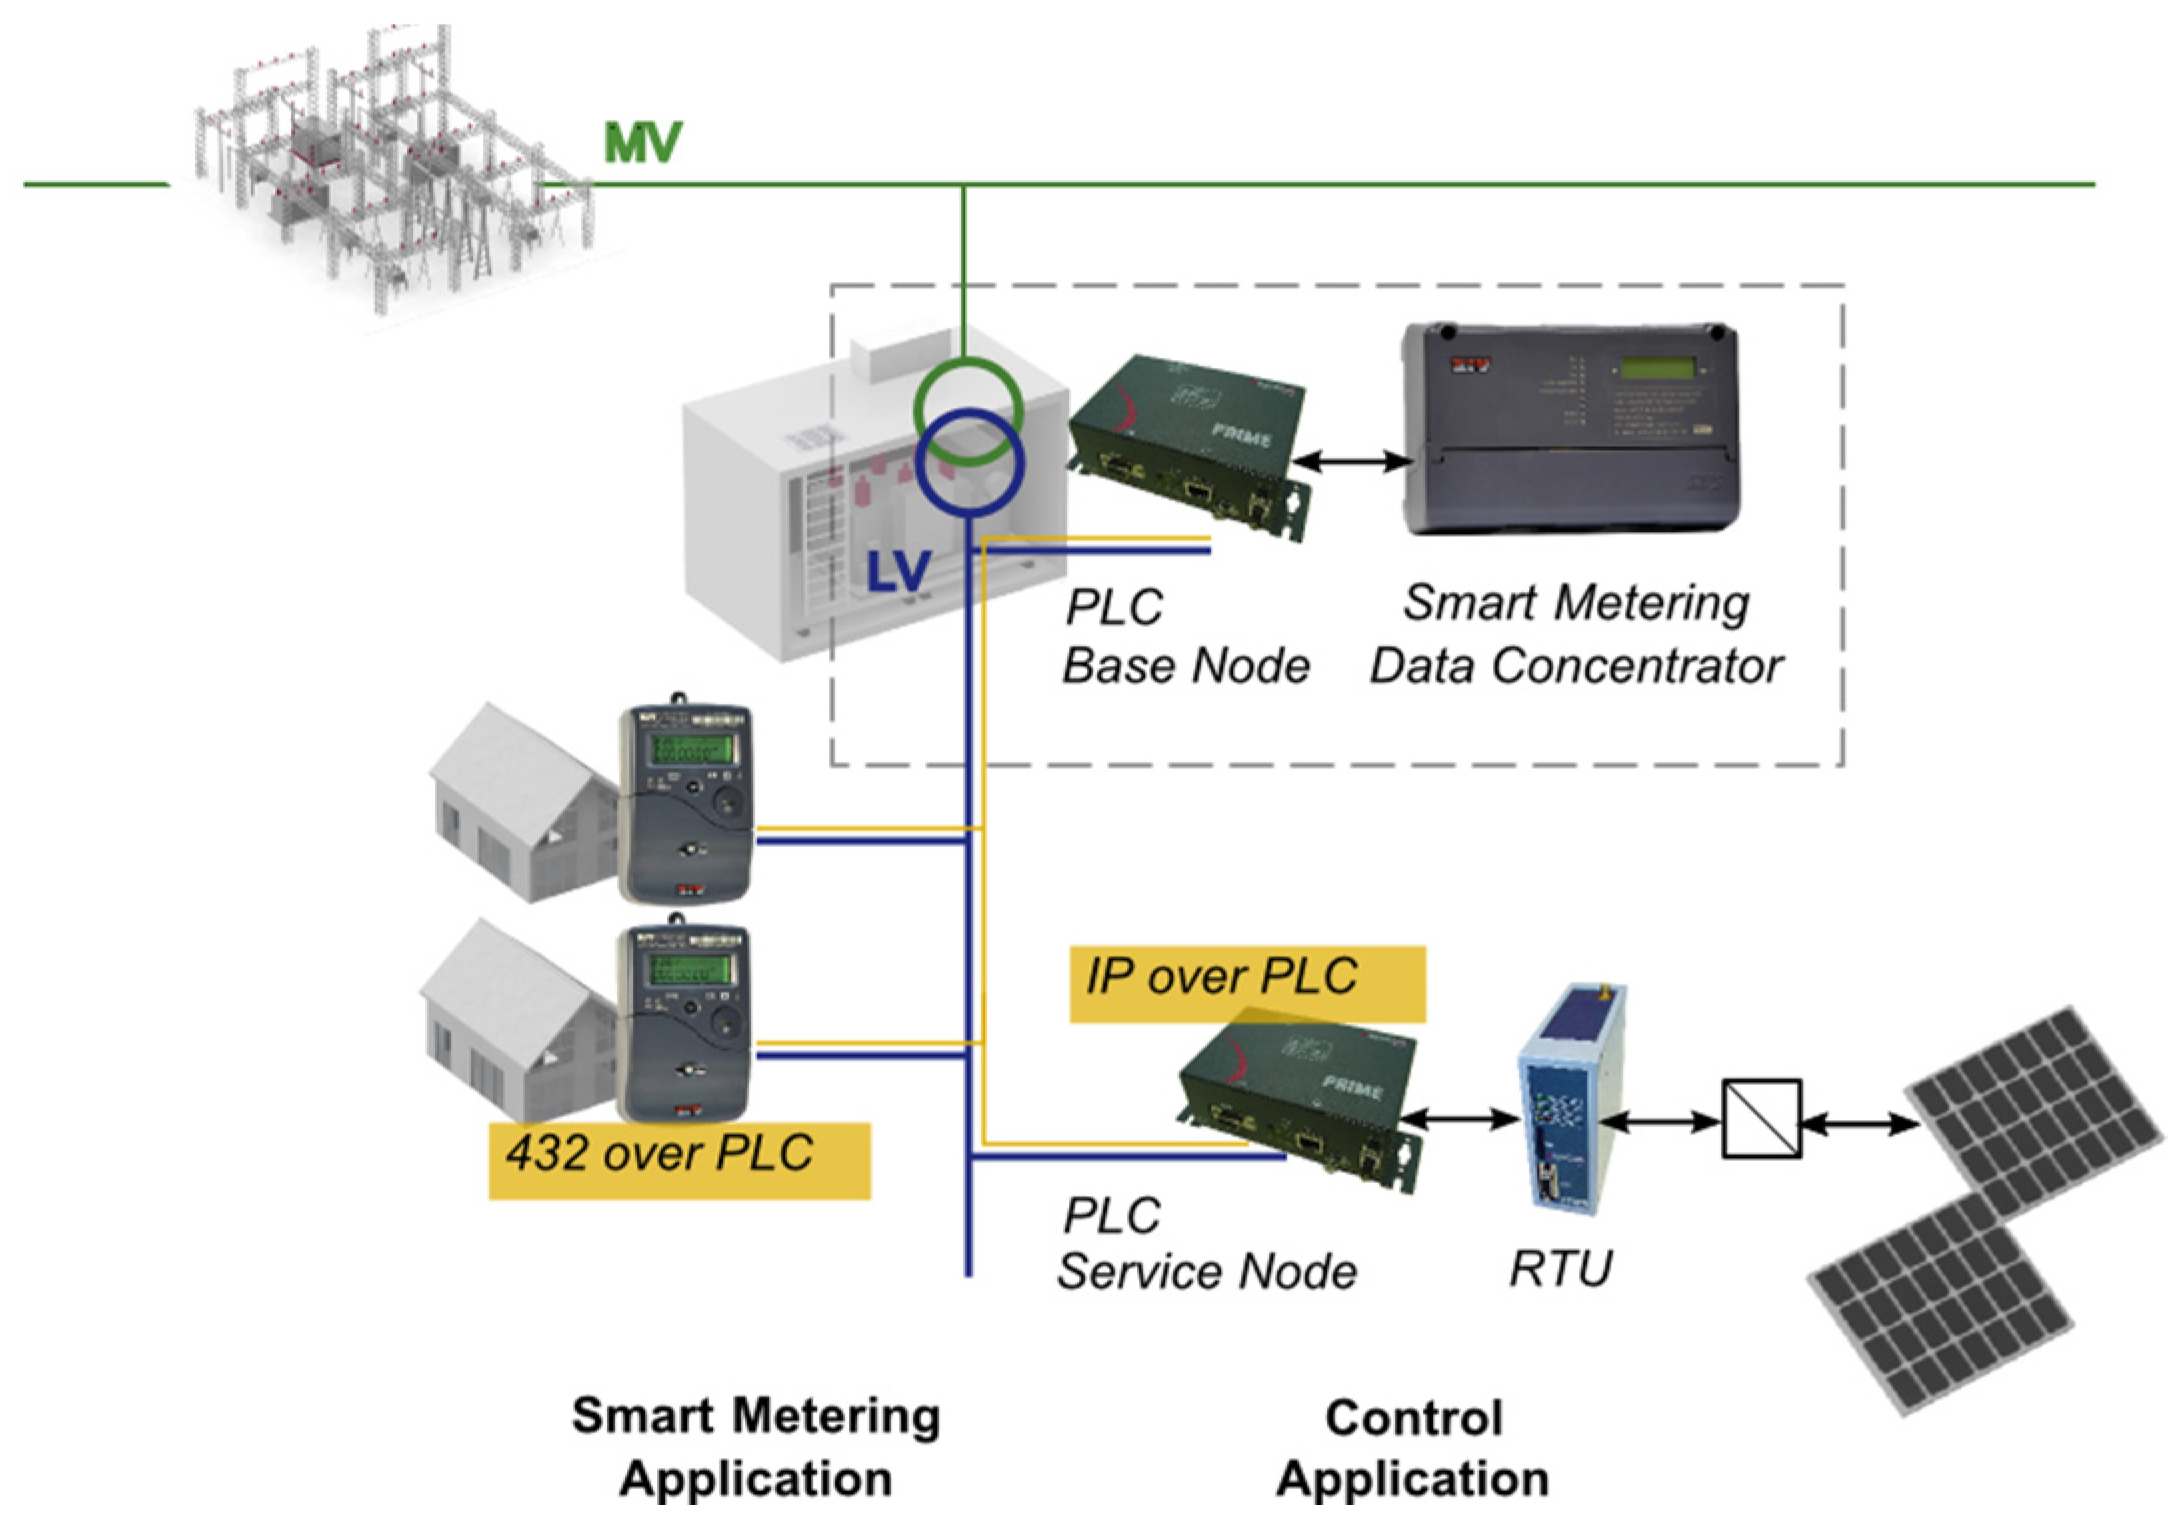
One of the most popular technologies for smart metering deployments is powerline communications (PLC). Among the different advantages that have been reported in literature, integration with the grid infrastructure (cables), low investment costs, no third-party intervention and good performance [
7], can be mentioned. The literature also mentions some drawbacks of the technology, such as bad noise conditions in the channel, cable attenuations and some others that, in fact, are not so uncommon in other non-PLC technologies [
8]. However, these drawbacks are many times just nominal, and not quantified or thoroughly tested, as in the last years, and with the advent of the so-called new generation narrowband high data rate (NB HDR)PLC technologies [
9] (NB HDR PLC; international telecommunication union ITU-T G.9902 [
10], ITU-T G.9903 [
11], ITU-T G.9904 [
12] and IEEE 1901.2 [
13]) many papers have shown real results of the tens of millions of PLC smart meters deployed on the field making many of the theoretical concerns vanish. The example of the utilities in Spain is relevant, as they have deployed millions of NB HDR PLC ITU-T G.9904 systems in the last four years, solving any deployment-related difficulties, among them coupling and channel characterization aspects; the research on these topics is now part of the available products and standards, especially in low voltage (LV) grid applications. However, constant research is needed to improve the knowledge on the distribution grid and how to adapt PLC technologies to its different challenges within the smart grid domain [
14,
15,
16,
17].
There are different strategies to deploy PLC-based smart metering systems, as [
18] describes. Broadband PLC (BPL) can be combined with NB HDR PLC systems in different ways. Although BPL can be deployed in LV and NB HDR PLC in medium voltage (MV), the most extended NB HDR PLC deployment scenario limits it to LV grid segments. Thus, data concentrators are deployed in secondary substations to reach the smart meters with NB HDR PLC; and these data concentrators connect to central utility systems via other technologies (non-PLC based-commercial 2G/3G/4G radio,
etc.; or with BPL as [
19] describes).
Smart metering systems are also mentioned profusely in the literature as the first stage towards the implementation of the smart grid [
20]. The smart grid concept is a general one [
21] and no single set of functionality can be found. However, it is clearly related to the integration of ICT within the electrical grid infrastructure for its better control and management. The smart grid in the distribution grid is one of the key challenges in this broad domain [
22], as telecommunications are widely used to operate all primary substations [
23], but are not so much spread over the secondary substations, and clearly not in LV grids, where the telecommunication technology for smart metering needs to be deployed and utilities in many occasions do not even have a precise knowledge of their LV assets and their location.
The varied functionality that is expected for a smart grid in LV is covered by the literature. First, smart metering is more or less advanced depending on the telecommunications technology used. The majority of the PLC existing systems before the new generation [
24] were just able to get meter readings once in periods of days, and they cannot be considered to offer any analysis of the grid in real time [
25]. Real time information is needed to optimize the operation of the grid [
26] providing instantaneous information of the meters connected to the secondary substations [
27]. The use of this information allows the detection of faults in the feeders (broken conductors), voltage control in the transformer, and tampering detection [
28]. Reference [
29] emphasizes connectivity identification (the transformer, with LV feeder and phase identification of smart meters) to allow a good customer asset management, the reduction of the technical losses, and transformer balancing. Synchrophasors are covered in [
30], and reference [
31] shows the possibility of remote control over LV assets, similar to that of MV levels (e.g., line protection switches). Some of these applications (feeder identification) are not feasible at a reduced cost with non-PLC technologies.
As already mentioned, LV remote control extension is assumed within the smart grid functions. MV remote control is well integrated in the electricity grid operation, although not present in all MV substations. Its purpose is to get information about the grid as well as to operate the grid elements (e.g., switches) remotely and safely. Remote controllable points in the LV grid will allow the same mode of operation in this LV segment of the grid.
In order to take advantage of the telecommunication infrastructure that is deployed for smart metering purposes, in the support of this smart grid functionalities including remote control, PLC is a perfect candidate. Reference [
32] provides information on the feasibility of IP transport for remote control applications and the extra-bandwidth of newly deployed PLC-based networks for smart metering, and discusses smart metering as the first application of these new generation NB HDR PLC technologies. On the negative side, literature shows a lack of references to IP telecommunicated remote terminal units (RTUs) [
22] over PLC-enabled LV grids, and it also declares the need to have PLC network management systems (NMSs), in order to control the performance of the telecommunication network created with PLC [
33]. On the NMS side, several papers mention the need of NMS for PLC systems that are to be used for smart grid purposes [
34]. However, literature references to NMS for PLC mostly focuses on BPL-related systems that were popular in the early 2000s, due to the positioning of the technology as an alternative to Internet access. Reference [
35] describes a simple network management protocol (SNMP)-based (RFC 1157 and 3410) system called NEOpS for BPL over MV and LV lines. Reference [
36] integrates SNMP-based BPL devices in a commercial NMS platform. Reference [
37] is centered on the SNMP management information base (MIB) description.
This paper presents two novel contributions. The first one shows the multiservice capabilities of NB HDR PLC systems deployed over LV grids. The support of distribution line messaging specification/companion specification for energy metering (DLMS/COSEM) and IP applications for metering and telecontrol over a PLC network deployed initially for smart metering purposes, is simulated and tested in laboratory for the first time with a representative quantity of ITU-T G.9904 PLC network elements working in European committee for electrotechnical standardization or Comité Européen de Normalisation Électrotechnique (CENELEC) A-band, and real metering traffic. The results of these tests show the feasibility of new IP applications over existing PLC smart metering networks.
The second novel contribution of this paper is the definition of a SNMP-based NMS for NB HDR PLC systems, including a MIB definition, an interface for PLC traffic capture and the first results of a prototype implementation over a massive NB HDR PLC deployment. This NMS is fundamental to allow the effective management of telecommunication services over NB HDR PLC technologies, and this contribution if a novelty for this kind of PLC systems.
The structure of the paper beyond this introduction includes a
Section 2 describing the most relevant deployments and standards of PLC-based smart metering networks.
Section 3 focuses in the main difficulties of these systems to evolve into full smart grid deployments, and focuses the content of this paper on the aspects under the control of the technology or the deployments.
Section 4 and
Section 5 focus on the feasibility of IP transport over NB HDR PLC-based smart metering networks, first with a simulation (
Section 4) and then (
Section 5) with real laboratory tests with ITU-T G.9904 technology.
Section 6 proposes a SNMP-based NMS system for these NB HDR PLC networks, and shows the first results of a prototype implementation.
2. Powerline Communications-Based Deployments
PLC has been considered as a useful technology virtually since the origin of the remote metering concept itself. Since the first patents were applied for back in the beginnings of the 20th century [
38], the power lines themselves have been seen as a natural medium to convey all kinds of information coming from electricity meters to remote, central locations.
Since the 1930s, a number of mainly European companies started developing ripple-control systems [
39] over MV and LV networks. Although for decades these were unidirectional systems with very low data rates, the acquired experience and the progress in electronics allowed for utilities to propose a totally different kind of system in the 1980s: two way communications in the order of kilobits per second, to be used for close-to-real-time critical operations. In the case of MV the application was distribution automation (DA), and for LV the use of PLC for AMR gave birth to a new industry.
Based on the now withdrawn British Standard BS 6839-1 from 1987 [
40], CENELEC in Europe published European standard EN 50065-1 “Signalling on low-voltage electrical installations in the frequency range 3 kHz to 148.5 kHz. General requirements, frequency bands and electromagnetic disturbances”, which in 1991 established the (narrow) frequency bands thought at the time to be enough for the development of PLC-based applications. In order to respect the existing European home system (EHS) specification which used the band from 125 kHz to 140 kHz with a carrier frequency of 132.5 kHz, C-band was reserved for home network systems. Since also the European installation bus (EIB) specification existed in the domain of home networking at the time (and it had the option of PLC around 110 kHz), B-band from 95 kHz to 125 kHz was defined for consumer use as well, along with D-band from 140 kHz to 148.5 kHz. A-band between 3 kHz and 95 kHz was left for utility applications, and it is still a very popular frequency range for PLC utility systems. EN 50065-1, in its most recent 2011 version [
41], is considered a harmonized standard under the current European Union legislation.
The availability of a standard specification further spurred development efforts to obtain commercial PLC devices for remote metering. Utilities certainly saw a benefit in employing these efficient technologies to optimize metering costs while facing the challenges of deregulation in the 1990s. At an international level, there were two main standardization efforts which succeeded and set the basis for the widespread usage of PLC networks in LV metering.
The first initiative, focused on application layers, was based on the work of several utilities and industry suppliers gathered around the utility communications architecture (UCA) group, which was promoted by the American electric power research institute (EPRI) [
42]. Although focused on substation automation and not in remote metering, the upper layer protocol which was adopted by UCA (the so-called manufacturing message service (MMS)) was used as the main reference for a reduced group of mainly European companies to define the simplified distribution line messaging specification (DLMS), an application layer protocol internationally standardized as part of the international electrotechnical commission (IEC) 61334 series [
43,
44]. Originally produced by IEC technical committee 57 “Power Systems management and associated information exchange” as a DA system using distribution line carrier, the industry soon looked for ways to apply it for automatic meter reading. IEC technical committee 13 “Electrical energy measurement and control” took the basis of DLMS, renamed it as device language message specification and developed an object model on top of it (an object oriented model as it was common in the 1990s) which, based on German Standard DIN 43863-3 [
45], was defined as companion specification for energy metering (COSEM). The DLMS/COSEM suite was designed for any kind of transport medium, not exclusively PLC. It has been standardized as part of the IEC 62056 series, which is actively evolving since then and still provides the application layer for many AMR PLC systems.
The second effort also crystalized as part of the IEC 61334 series, and it mainly dealt with the lower layers (physical layer (PHY) and media access control (MAC)) of the PLC stack. Since the 1980s, a number of bidirectional PLC systems had been designed and produced for both MV and LV grids, usually for frequencies below 500 kHz. Five of them ended up being standardized as Part 5 “lower layer profiles” of IEC 61334. Reference [
46] specified the spread frequency shift keying (S-FSK) modulation by Landis + Gyr, with two carriers set apart >10 kHz which are FSK modulated for data rates multiple of 0.3 kbps in LV. Reference [
47] defines a binary FSK modulation proposed by ENEL (Rome, Italy), with a carrier at 82.05 kHz and 0.6 kbps in the case of LV, and a carrier at 72 kHz and 1.2 kbps in the case of MV. Reference [
48] by Adaptive Networks describes a direct sequence spread spectrum adaptive wideband (SS-AW) modulation for LV, while [
49,
50] represent systems developed by ABB, an implementation of multi-carrier modulation (MCM) with differential PSK for MV and spread spectrum fast frequency hopping (SS-FFH) for LV, respectively.
Of the above, DLMS/COSEM over S-FSK systems were the most commonly adopted deployment option. The exception worthwhile mentioning is the massive FSK technology deployment by utility ENEL in Italy, which used a proprietary application layer.
Since approximately 2005 [
51], the advancement of semiconductor large-scale integration and the increasing bandwidth needs of real-time DA and smart metering facilitated the appearance of a new generation of PLC systems. Also the experience of several utilities with BPL networks in the 2–30 MHz frequency range led to the application of traditionally broadband techniques (e.g., orthogonal frequency division multiplexing (OFDM), adaptive modulation, coding and interleaving) to PLC systems below 500 kHz for distribution networks.
With regards to the IEC 61334 legacy PHY layers discussed above, the new generation of NB HDR PLC in the A-band and above provides several advantages: use of the full available bandwidth instead of a couple discrete frequencies (avoiding inter carrier interference (ICI) thanks to OFDM techniques), tolerance against frequency selective PLC channels, much higher data rates (up to 1 Mbps in the case of [
52]), easier channel equalization, robustness to narrowband interference and even a more cost-effective design thanks to the relative simplicity of OFDM implementation in currently available processors.
There are currently numerous examples of narrowband PLC deployment for smart metering throughout the world. ITU-T G.9904 (PRIME) is a technology currently deployed in some seven million smart meters in Australia, Korea, Latvia, Poland, Portugal, Spain,
etc. Other technologies are deployed or in the process of being deployed in Austria, Belgium, Brazil, China, Denmark, Finland, France, India, Italy, Japan, Luxemburg, Sweden,
etc. In Europe, approximately 90% of the currently installed smart meters employ PLC and the expectation is that by 2020 just one third of the smart meter deployments will use other technologies (mostly public cellular networks) [
53].
3. Smart Grid beyond Smart Metering in Powerline Communications-Based Systems
As it was already mentioned, smart metering is often the starting point of the smart grid [
22]. With this approach, smart metering is one of the applications running over the telecommunications infrastructure that would carry the different smart grid services (smart metering being one of them). Utilities involved in smart meter rollouts, realize that rather than deploying a smart metering infrastructure, they are deploying telecommunication networks. These PLC networks provide a PLC-based “coverage” area, linked to the LV grid that is able to support additional services and applications apart from the feature of managing smart meters. Other smart grid related applications, such as distributed energy resources (DER) integration and electric vehicle (EV)-related ones, may use the same telecommunication network as well.
PLC technologies are seen as the preferred option to provide the data services required by the new applications, as they provide coverage through the pervasive LV grid. NB HDR PLC technologies are multiservice by design. However, the systems in which they are included may or may not reflect this capability. These systems need to be prepared to support different data services with varying requirements in terms of quality of service (QoS; i.e., throughput, latency and jitter limits) depending on the smart grid functionality they need to support.
After a thorough review of existing PLC networks deployments in Europe where the most relevant PLC for smart metering deployments exist [
2], two main obstacles can be identified with PLC technologies. The first obstacle is related to network management. PLC networks, like any other telecommunication infrastructure, need to be managed. It is critical that the PLC network operator collects real-time information related to its performance. This is the only way to control and be able to improve the operation of a telecommunication network, and to guarantee the availability of its data services.
The second obstacle is related to the assurance of the PLC network available data capacity. Utility use of the spectrum in LV power lines in Europe is limited to A-band (between 3 kHz and 95 kHz). Several LV channel characterizations [
54] show that the lower part of the band is useless. This is the reason why most PLC systems use the upper part of the band (from 30 kHz or 40 kHz). Thus maximum capacity is restricted by the limited bandwidth of 40 kHz and by the noises of different nature that can be found in the band [
55]. As certain smart grid applications (e.g., remote control) can be jitter-sensitive [
22], PLC systems need to provide resource reservation mechanisms to deliver QoS service-levels, for example, to remote control data flows. This obstacle will be solved with the existing features of NB HDR PLC standards (e.g., the use of the contention free period (CFP) of the ITU-T G.9904 standard) that however and logically cannot prevent electricity grid noises. Regarding the frequency band enlargement, it is important to mention that in America and Asia, utilities can use frequencies beyond 95 kHz. In the USA, according to the Federal Communications Commission FCC Part 15 under Title 47 of the code of federal regulations, the band can be extended from 10 kHz to 490 kHz [
9]. In the case of Japan, utilities are allowed to use telecommunication equipment in frequencies between 10 kHz and 450 kHz (association of radio industries and businesses standard ARIB STD T-84) [
9]. South Korea is currently using International Organization for Standardization ISO/IEC 12139-1 [
56] with Korean Standard KN60 defined limits for frequencies below 500 kHz. This extended frequency band, with an appropriate regulation in the compatibility levels, is highly beneficial for the development of telecommunication networks for smart grid applications over PLC. As stated in [
57] for Europe, emission levels of PLC systems need to comply with EN 50065-1. Unfortunately, there are no standards that define the compatibility levels in CENELEC A-Band, which may impact negatively on the communications quality due to not intentional disturbances produced by devices connected to the electricity grid exclusively for power applications (power inverters as studied in [
58,
59] and other electronic devices).
4. A Capacity Assessment of Existing Narrowband Powerline Communications Resources in the CENELEC A-Band
A simulation of a simple but representative scenario of ITU-T G.9904 technology is developed in this section in order to make a capacity assessment of NB HDR PLC networks in the CENELEC A-band. ITU-T G.9904 NB HDR PLC system is the most extended and deployed PLC system of all the standards available.
This PLC network simulator covers different network elements and traffic conditions, in a smart metering data transport scenario. The objective of the simulation is the estimation of the maximum capacity of NB HDR PLC systems for IP data transmission in the presence of smart metering traffic.
The simulation consists of a C language coded software that implements the carrier sense multiple access collision avoidance (CSMA/CA) algorithm in ITU-T G.9904 for the smart metering profile (maximum raw speed of 20 kbps at PHY) for multiple nodes in a single collision domain. The software is coded to emulate different traffic patterns, all of them in the worst case of collision domain sharing. The results are extracted based on frame error rate (FER), a way to measure the packet loss probability. Application level rate is calculated based on FER, including retries (automatic retransmission request: ARQ).
The simulated network topology is composed of one base node (BN), a variable number of service nodes (SNs) associated to the smart metering (they do not exchange IP traffic), and one SN (device under test: DUT,) sending IP traffic over the PLC network. Other assumptions are:
The BN reaches all SNs without “switching” (signal repetition) in one single collision domain.
There is no external noise source.
Network traffic is based on a Poisson distribution with a mean time obtained from real field scenarios. The transmission attempt follows this distribution; note that repetitions (if needed) will follow CSMA/CA algorithm.
The time distribution parameters considered per traffic type in this simulation are:
Control traffic for the BN. It follows a Poisson distribution with a mean of 0.5 s for networks larger than 32 nodes and 16/N s where N is the number of nodes, for smaller networks (the difference is made to keep a stable control traffic in the subnetwork).
Control traffic for each SN. It follows a Poisson distribution with a mean of N/2 s for networks larger than 32 nodes, and 16 s for smaller networks.
IP traffic for the SN under test (the DUT) and the BN. It follows a Poisson distribution with a mean of 10 ms, for the first transmission attempt. Following ARQ retransmissions will have a mean of 1 s. The ARQ timeout is 1 s.
Smart metering application data for each SN. It follows a Poisson distribution with a mean of 1.6 s.
These traffic patterns show the following PHY protocol data unit (PPDU) length:
The different simulation scenarios consider the following aspects:
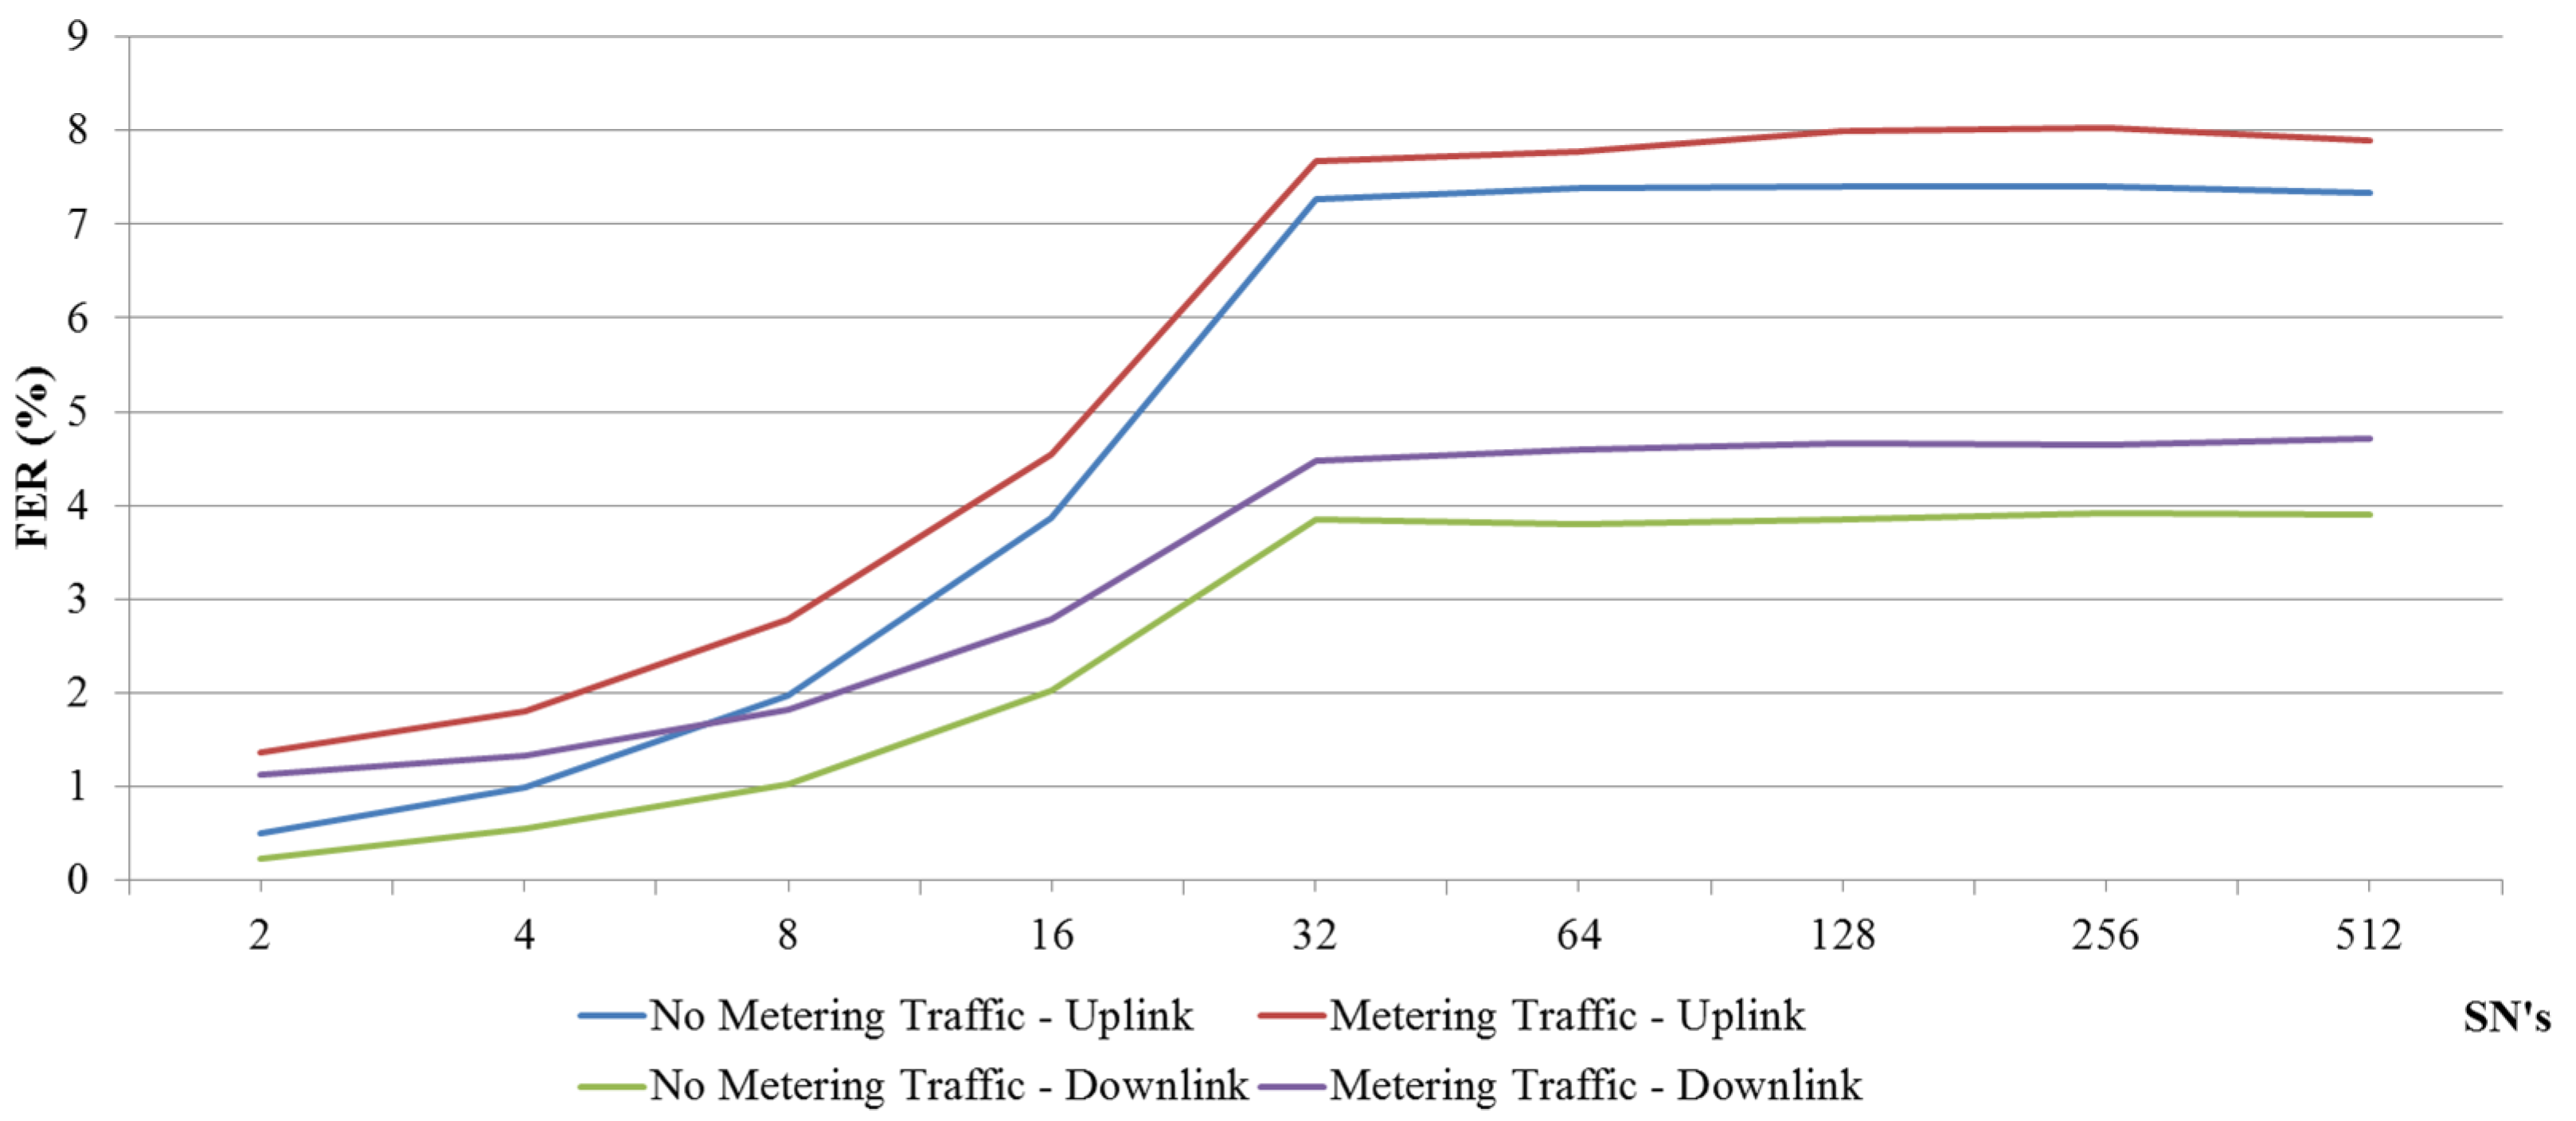
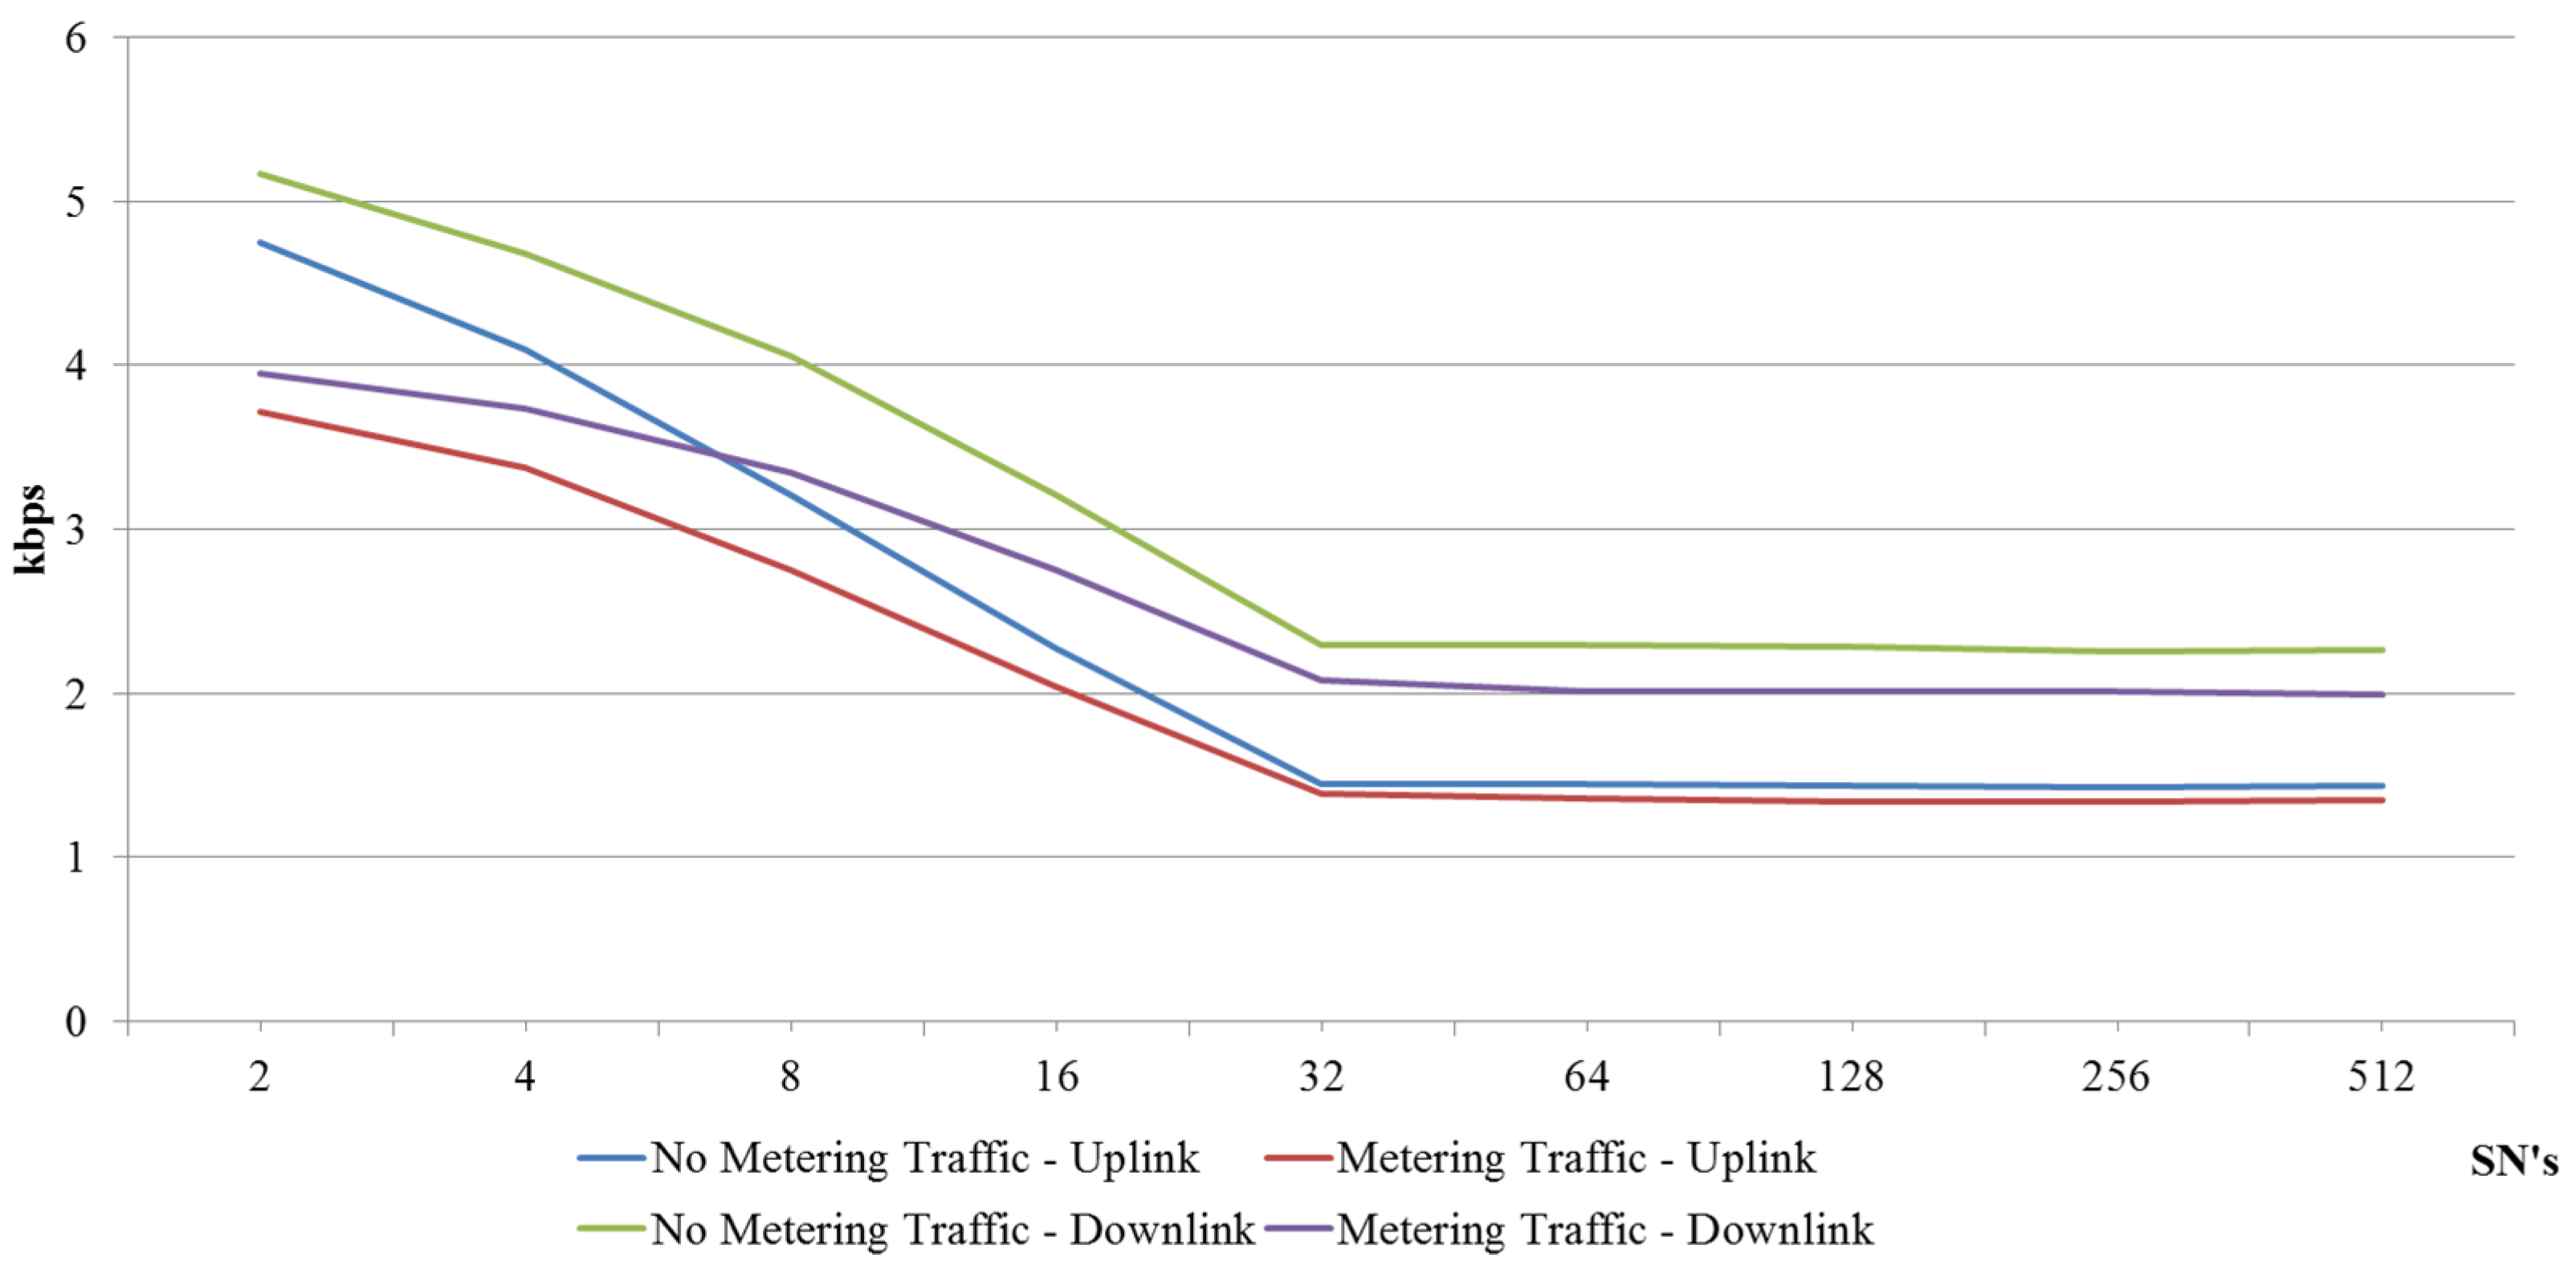
Figure 1 shows the FER evolution as the PLC network size increases (SNs in abscissa axis).
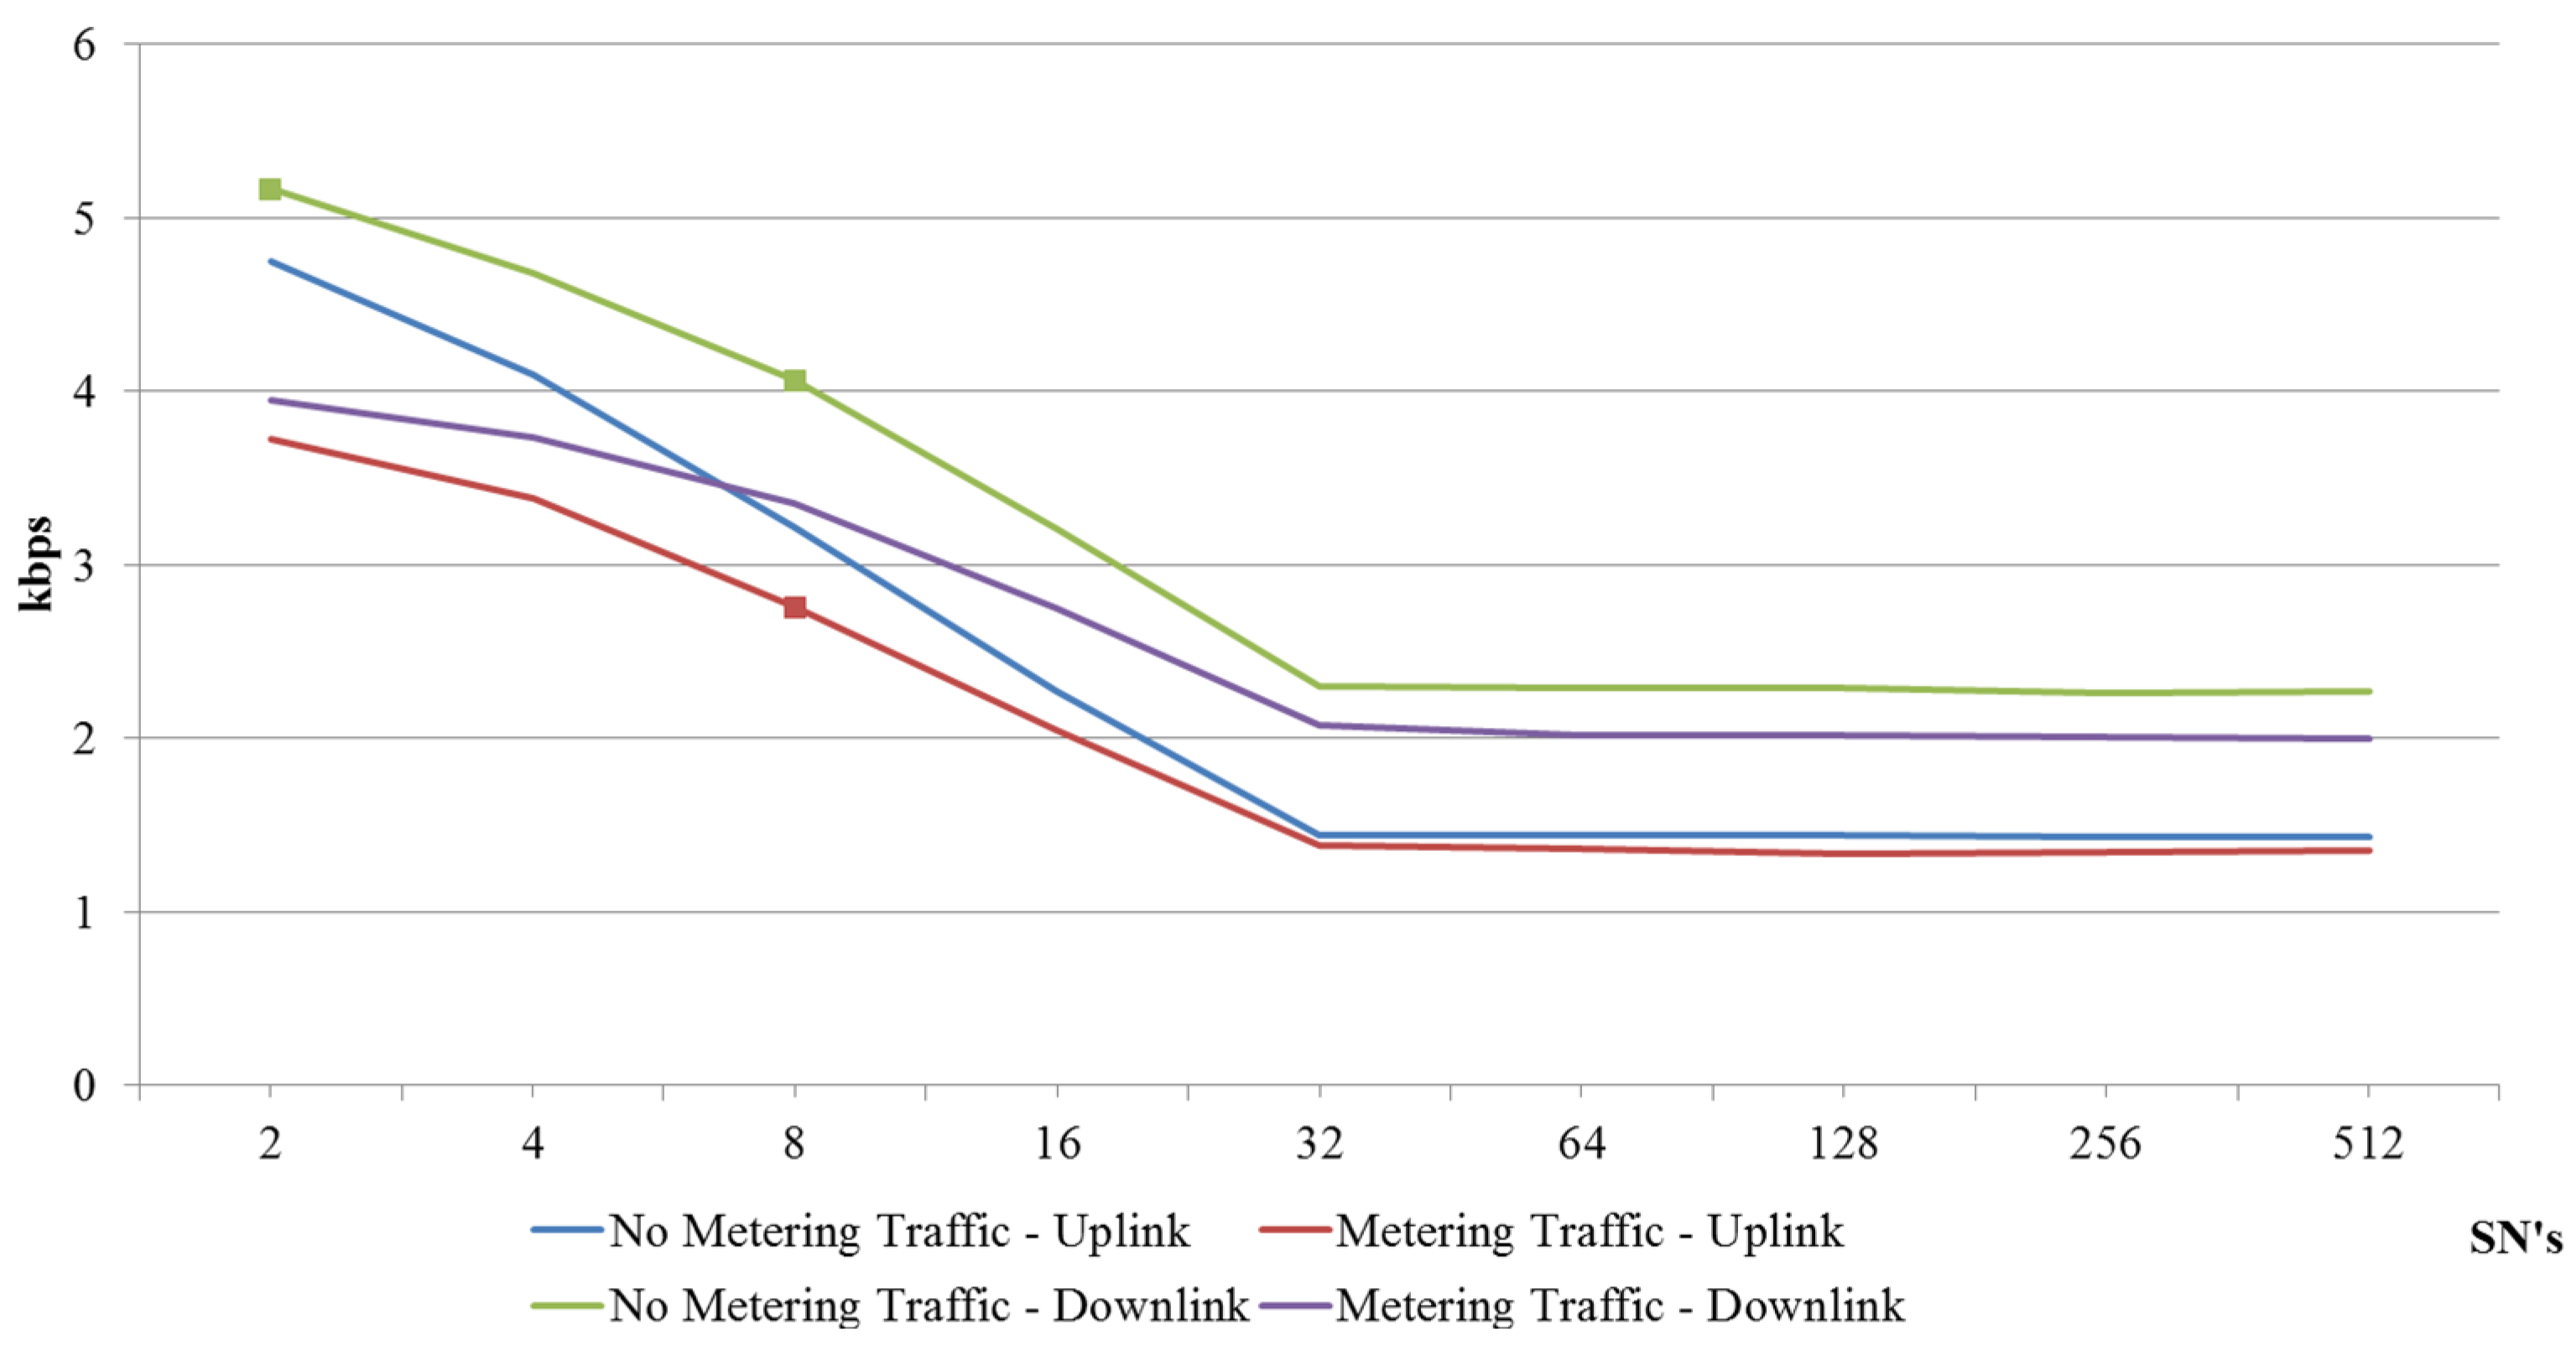
Figure 2 shows the IP data rate (kbps) of the DUT, both uplink and downlink, as the number of SNs grows.
Figure 1.
Frame error rate (FER) simulation based on ITU-T G.9904. International telecommunication union: ITU.
Figure 1.
Frame error rate (FER) simulation based on ITU-T G.9904. International telecommunication union: ITU.
Figure 2.
Data rate simulation based on ITU-T G.9904.
Figure 2.
Data rate simulation based on ITU-T G.9904.
5. Internet Protocol over Narrowband High Data Rate Powerline Communications in CENELEC A-Band
ITU-T G.9904 PLC builds a multiservice network designed to support multiple applications. Different convergence layers (CSs) are defined in order to optimize each data type transport over PLC.
432-CS (for IEC 61334-4-32) is oriented to DLMS/COSEM smart metering applications.
Internet protocol–convergence sublayer (IP-CS) enables the use of this multiservice network for other technologies over IP.
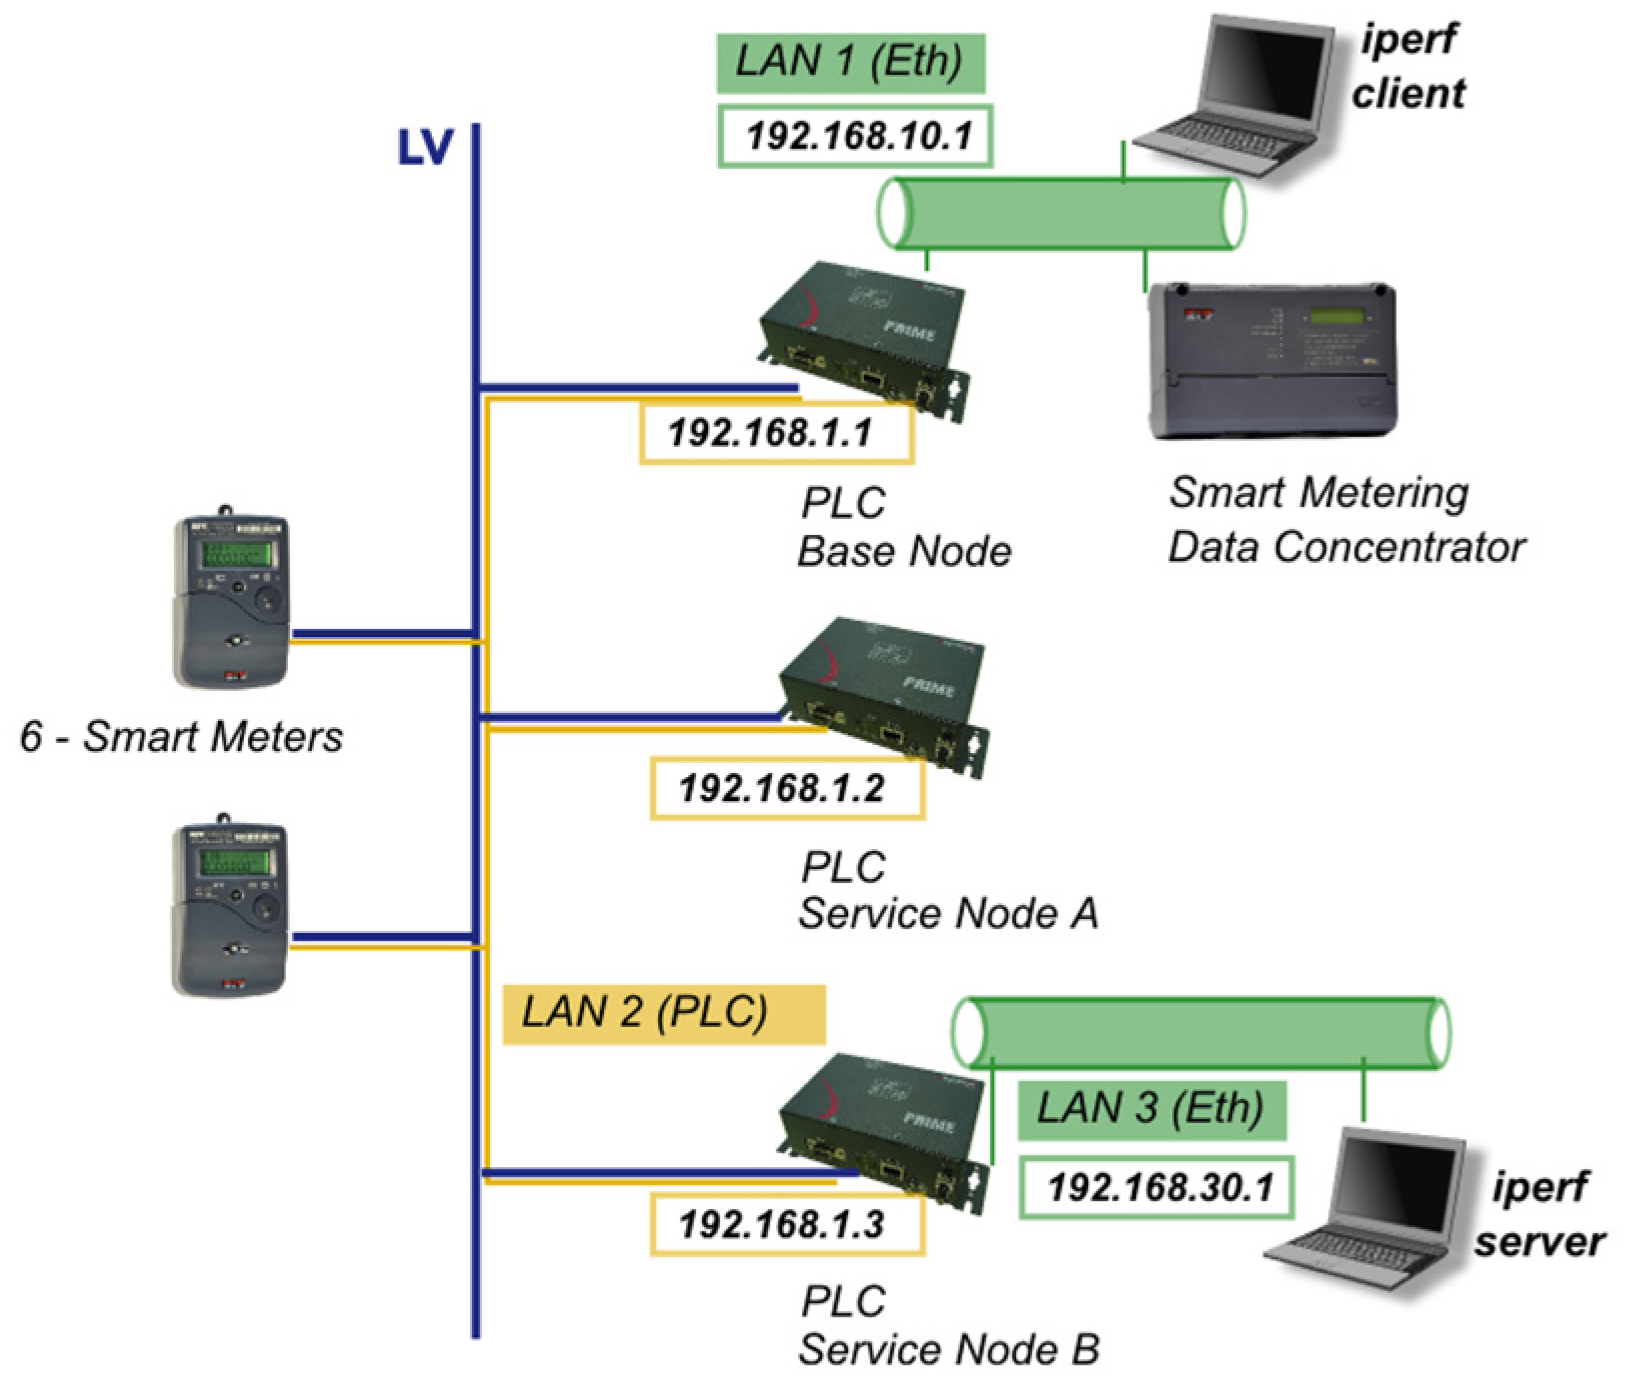
Figure 3 shows the versatility of ITU-T G.9904 NB HDR PLC network. Smart meters’ data is collected over PLC while simultaneously IP access to other applications is allowed.
Figure 3.
Multiservice network built over ITU-T G.9904.
Figure 3.
Multiservice network built over ITU-T G.9904.
5.1. Support for Multiservice Internet Protocol Profile (Internet Protocol–Convergence Sublayer: IP-CS)
This section analyzes the traffic to be exchanged over PLC to make the multiservice network possible. Note that ITU-T G.9904 NB HDR PLC BN is ready to manage different communication profiles, smart metering profile (over 432-CS) and any other application running over IP (over IP-CS) will be described.
The MAC registration process is independent from the profile used. It is initiated from the SN that automatically sends a registration request control frame (REG_REQ) when it is aware of the presence of a network (notified by the master of the network, BN). The unique BN of the network acknowledges this registration process and accepts the required capabilities for this SN (REG_RSP). Final confirmation is sent from the SN (REG_ACK).
Following is a real ITU-T G.9904 PLC MAC level capture using the ZIV PRIME Manager tool [
60] showing the registration process of a SN. This node has an EUI-48 address of 40:40:22:02:4f:b1 and after this registration process it has been assigned a local node identifier lnid:2987. The first lines are metadata information, and the real hexadecimal transmitted content is included in the 16 bytes rows bellow, behind the “|” sign.
[RX] 2015/07/21 11:50:28 164.584684(0.013248) dbpsk_f rxpow:6.33809(Vrms) evm:14.7(dB) channels:phy0
     GPDU: sna:40:40:22:02:4f:b0 UP level:0 frametime:0.095384 SCP
        REG_REQ: eui48: 40:40:22:02:4f:b1 sid:0 spc:0 caps:0x47
            00 | 00 00 97 06 01 00 ff fc 08[02 38 40 40 22 02 4f
            10 | b1]58 dd b8 c6
[TX] 2015/07/21 11:50:28 164.632236(0.013248) dbpsk_f channels:1
     GPDU: sna:40:40:22:02:4f:b0 DO level:0
        REG_RSP: eui48: 40:40:22:02:4f:b1 sid:0 lnid:2987 spc:0 caps:0x47 time:0
            00 | 00 40 50 06 01 00 2e ac 08[02 38 40 40 22 02 4f
            10 | b1]52 c6 d9 5d
            10 | b1]52 c6 d9 5d
[RX] 2015/07/21 11:50:28 164.738164(0.013248) dbpsk_f rxpow:6.42130(Vrms) evm:14.6(dB) channels:phy0
     GPDU: sna:40:40:22:02:4f:b0 UP level:0 frametime:0.248864 SCP
        REG_ACK: eui48: 40:40:22:02:4f:b1 sid:0 lnid:2987 spc:0 caps:0x47 time:0
            00 | 00 00 97 06 01 00 2e ac 08[02 38 40 40 22 02 4f
            10 | b1]10 99 ff 04
Once the registration is complete, a profile dependent connection is opened from the SN. This is an example of multiservice IP profile establishment; connection is requested from the SN with a control message (CON_REQ_S) and confirmed from the BN (CON_REQ_B).
The BN maintains a database of IP addresses and EUI-48 addresses. Address resolution then operates by querying this database. A SN must establish a connection to the address resolution service running on the BN, using the connection type TYPE_CL_IPv4_AR (type:1).
For packets to be transferred, a connection needs to be established between source and destination nodes. IP-CS will examine each IP packet to determine the destination EUI-48 address and therefore a MAC connection is established to the remote device. The TYPE value of this connection is TYPE_CL_IPv4_UNICAST (type:2).
- ○
Inside the data included in the request message, the local IP address is provided so that the remote device can add this new connection to its cache of connections for sending data in the opposite direction.
- ○
The use of Van Jacobson Header Compression (RFC 1144) is also negotiated as part of the connection establishment.
Once registration is achieved and the IP-CS connection is established, IP packets can be sent over PLC. Following is a capture of internet control message protocol (ICMP) packets being exchanged over IP with this same node that had been assigned a local node identifier lnid:2987. Note that once the connection is ready, IP packets sent over PLC will be shown as DATA packets in the MAC layer. This DATA is sent over the TYPE_CL_IPv4_UNICAST connection that was assigned a connection identifier of lcid:257.
As described above, ITU-T G.9904 NB HDR PLC builds a multiservice application so different data profiles can be exchanged simultaneously. The following traffic capture shows an example of this capability. This MAC capture includes the traffic of a network where a smart meter is being read while simultaneously ICMP packets over IP are being exchanged.
-
Smart meter with serial ZIV0041213078 with EUI-48 40:40:22:74:dc:96 and lnid:11162 details are being read using 432-CS. DLMS traffic is sent over TYPE_CL_432 connection (type:3) that was assigned a connection identifier lcid:258.
At the same time ICMP packets (ping) are being exchanged with SN of PLC IP 192.168.1.3 with MAC 40:40:22:02:4f:b1 and lnid:2987. IP traffic is sent over TYPE_CL_IPv4_UNICAST connection that was assigned a connection identifier lcid:257.
5.2. Internet Protocol Over Narrowband High Data Rate Powerline Communications Tests in Non-Switched Environments
5.2.1. Test Description
This test plan has been defined in order to determine the performance and best possibilities of IP transport in flat PLC networks, where no switching levels exist (i.e., no signal repetition is needed in the network).
The following incremental steps are defined in order to validate these two scenarios:
Figure 4 shows the test setup used for the validation. For each application, the following devices are involved:
DLMS smart metering application:
- ○
Smart metering data concentrator.
- ○
Six smart meters.
Multiservice application over IP:
- ○
2 SNs implementing IP-CS.
In order to manage the setup, a BN that supports both profiles is required. The BN is a ZIV PBN [
61].
Figure 4.
Multiservice network built over ITU-T G.9904 narrowband high data rate (NB HDR) powerline communications (PLC). Test setup.
Figure 4.
Multiservice network built over ITU-T G.9904 narrowband high data rate (NB HDR) powerline communications (PLC). Test setup.
Measurements are taken under different traffic conditions:
- (1)
Basic connectivity ICMP tests (ping, as per RFC 792 and RFC 1122).
- (2)
Performance measurements of TCP/IP traffic over PLC (using the iperf tool [
62] in a client-server setup).
TCP/IP traffic without smart metering data (PLC control traffic of the nodes)—Minimum network size of two nodes (see
Section 5.2.2a).
TCP/IP traffic without smart metering data (PLC control traffic of the nodes)—Medium network size of eight nodes (see
Section 5.2.2b).
TCP/IP traffic with intensive smart metering data—Medium network size eight nodes (see
Section 5.2.2c).
5.2.2. Tests Results
Results obtained with each test setup scenario and traffic conditions are described in this section.
- (1)
Basic connectivity ICMP tests (ping).
Connectivity is validated between the different local area networks (LANs) shown in
Figure 4.
First connectivity step is between LAN1 (Ethernet) and LAN2 (PLC). ICMP packets of 32 bytes are sent, with an average time of 214 ms. All ICMP packets sent are successfully received (0% packet loss at this level).
Second connectivity step involves LAN1 (Ethernet) and LAN3 (Ethernet), making the transport through LAN2 (PLC). This step is covered in the performance measurements described below.
- (2)
Performance measurements using iperf tool of TCP/IP traffic over PLC.
Different tests are performed modifying these TCP parameters:
TCP window size (socket buffer size)—both at client and server side.
- ○
The best results are obtained with default (adaptive) value, although a window of 300 bytes offers similar performance during this test.
- ○
The bigger the window fixed (above this value), the lower the performance.
TCP maximum segment size (maximum transmission unit (MTU)).
- ○
Best results are obtained with default value, i.e., 1500 bytes.
The results shown are those obtained with the default TCP window size and MTU selection.
TCP/IP traffic without smart metering data (PLC control traffic of the nodes only)—Minimum network size.
- -
PLC network size: two nodes.
- -
MAC mechanism: according to ITU-T G.9904 specification.
- -
Traffic conditions: TCP transmission of the DUT without smart metering data. This step is measured between different network elements (BN-SN, and SN-SN), so both scenarios results are shown below. SNA is SN A and SNB is SN B.
Test scenario 1: End nodes BN—SNB
In this scenario traffic measured is:
- -
Downlink traffic, BN as transmitter (iperf client) and SNB as receiver (iperf server).
Iperf started at the client side on LAN1 (Ethernet).
bin/iperf.exe -c 192.168.30.10 -P 1 -i 30 -p 5001 -f k -n 100000
------------------------------------------------------------
Client connecting to 192.168.30.10, TCP port 5001
TCP window size: 8.00 kByte (default)
------------------------------------------------------------
[168] local 192.168.10.10 port 53897 connected with 192.168.30.10 port 5001
[ ID] Interval          Transfer     Bandwidth
[168]  0.0-30.0 sec     24.0 kBytes  6.55 kbps
[168]  30.0-60.0 sec    24.0 kBytes  6.55 kbps
[168]  60.0-90.0 sec    16.0 kBytes  4.37 kbps
[168]  90.0-120.0 sec   24.0 kBytes  6.55 kbps
[168]  0.0-161.2 sec    104  kBytes  5.28 kbps
Done.
At the server side at LAN3 (Ethernet) the following results are shown. These values show different test executions performed under these same conditions.
   local 192.168.30.10 port 5001 connected with 192.168.10.10 port 53897
First iteration result:
   0.0-160.9 sec 104 kBytes 5.29 kbps
Second iteration result:
   0.0-170.2 sec 104 kBytes 5.00 kbps
Third iteration result:
   0.0-189.4 sec 104 kBytes 4.50 kbps
Test scenario 2: End nodes SNA—SNB
Iperf started at the client side at the LAN (Ethernet) behind SNA. Therefore client location is different from the test scenario described above.
- -
This kind of traffic was not described in the simulation process. SNA as transmitter (iperf client) and SNB as receiver (iperf server).
At the server side at LAN3 (Ethernet) the following results are shown. These values show different test executions performed under these same conditions.
First iteration result:
   0.0-559.4 sec 104 kBytes 1.52 kbps
Second iteration result:
   0.0-460.9 sec 104 kBytes 1.85 kbps
Third iteration result:
   0.0-494.6 sec 104 kBytes 1.72 kbps
TCP/IP traffic without smart metering data (PLC control traffic of the nodes only)—Medium network size.
- -
PLC network size: eight nodes.
- -
MAC mechanism: according to ITU-T G.9904 specification.
- -
Downlink traffic, BN as transmitter (iperf client) and SNB as receiver (iperf server).
- -
Traffic conditions: TCP transmission of the DUT without smart metering data.
At the server side at LAN3 (Ethernet) the following results are shown. These values show different test executions performed under these same conditions.
First iteration result:
   0.0-197.4 sec 104 kBytes 4.32 kbps
Second iteration result:
   0.0-209.8 sec 104 kBytes 4.06 kbps
TCP/IP traffic with intensive smart metering data—Medium network size.
- -
PLC network size: eight SNs.
- -
MAC mechanism: according to PLC PRIME 1.3.6 specification.
- -
Downlink traffic, BN as transmitter (iperf client) and SNB as receiver (iperf server).
- -
Traffic conditions: TCP transmission of the DUT with intensive smart metering data.
At the server side at LAN3 (Ethernet) the following results are shown.
These values show different test executions performed under these same conditions.
First iteration result:
   0.0-227.2 sec 104 kBytes 3.75 kbps
Second iteration result:
   0.0-257.3 sec 104 kBytes 3.31 kbps
Third iteration result:
   0.0-243.9 sec 104 kBytes 3.49 kbps
Table 1. Summarizes performance measurements obtained during the tests.
Table 1.
IP over narrowband high data rate (NB HDR) powerline communications (PLC) performance measurements. Service Nodes: SNs; TCP: transmission control protocol; IP: Internet protocol.
Table 1.
IP over narrowband high data rate (NB HDR) powerline communications (PLC) performance measurements. Service Nodes: SNs; TCP: transmission control protocol; IP: Internet protocol.
| Traffic type | Traffic conditions | Number of SNs | Data rate (kbps) |
|---|
| Downlink | TCP/IP with PLC control traffic only | 2 | 4.50–5.29 |
| Downlink | TCP/IP with PLC control traffic only | 8 | 4.06–4.32 |
| Downlink | TCP/IP with intensive smartmetering traffic | 8 | 3.31–3.75 |
| Between two SNs | TCP/IP with PLC control traffic only | 2 | 1.52–1.85 |
5.2.3. Test Results Analysis and Conclusions
The application level data rates summarized in
Table 1 confirm the simulation prepared for the capacity assessment of NB HDR PLC networks in CENELEC A-band.
Figure 2 shown as part of the simulations is repeated below in
Figure 5, highlighting the conditions validated in the test environment.
Figure 5.
Simulation results validated in the tests plan based on ITU-T G.9904.
Figure 5.
Simulation results validated in the tests plan based on ITU-T G.9904.
FER (%) and data rate (kbps) obtained in the simulation are therefore a valid assessment of the existing extra-capacity in NB HDR PLC technologies, when smart metering traffic is present (this profile, with binary phase shift keying (BPSK) modulation and forward error correction (FEC) provides a maximum of 20 kbps raw PHY speed).
5.3. Internet Protocol over Narrowband High Data Rate Powerline Communications Tests in Switched Environments
5.3.1. Test Description
As it has been stated in some references to ITU-T G.9904 technology [
12], PLC signal repetition is one of the more important features of NB HDR PLC systems to overcome the effects of noise.
Further tests have been carried out in realistic environments such as the one referenced in [
63] without any noise filtering, with larger quantities of SNs and several switching (repetition) levels, to understand the effect of switches in the IP data rates.
The test scenario consists of one BN and 50 SNs connected simulating four meter-room concentrations. The data concentrator connected to the BN is a ZIV device [
61], and it has been used to create the application level metering traffic. The smart meters used are devices from the vendors ZIV, Landis + Gyr, Sagemcom, Orbis and Sogecam, as referenced in [
64,
65]. The configuration of the PLC network follows the smart metering profile [
64] defined for the technology, with ARQ, lowest throughput modulation (
i.e., DBPSK with error correction) and 64 byte word Segmentation and Reassembly (SAR) to minimize the effect of noise.
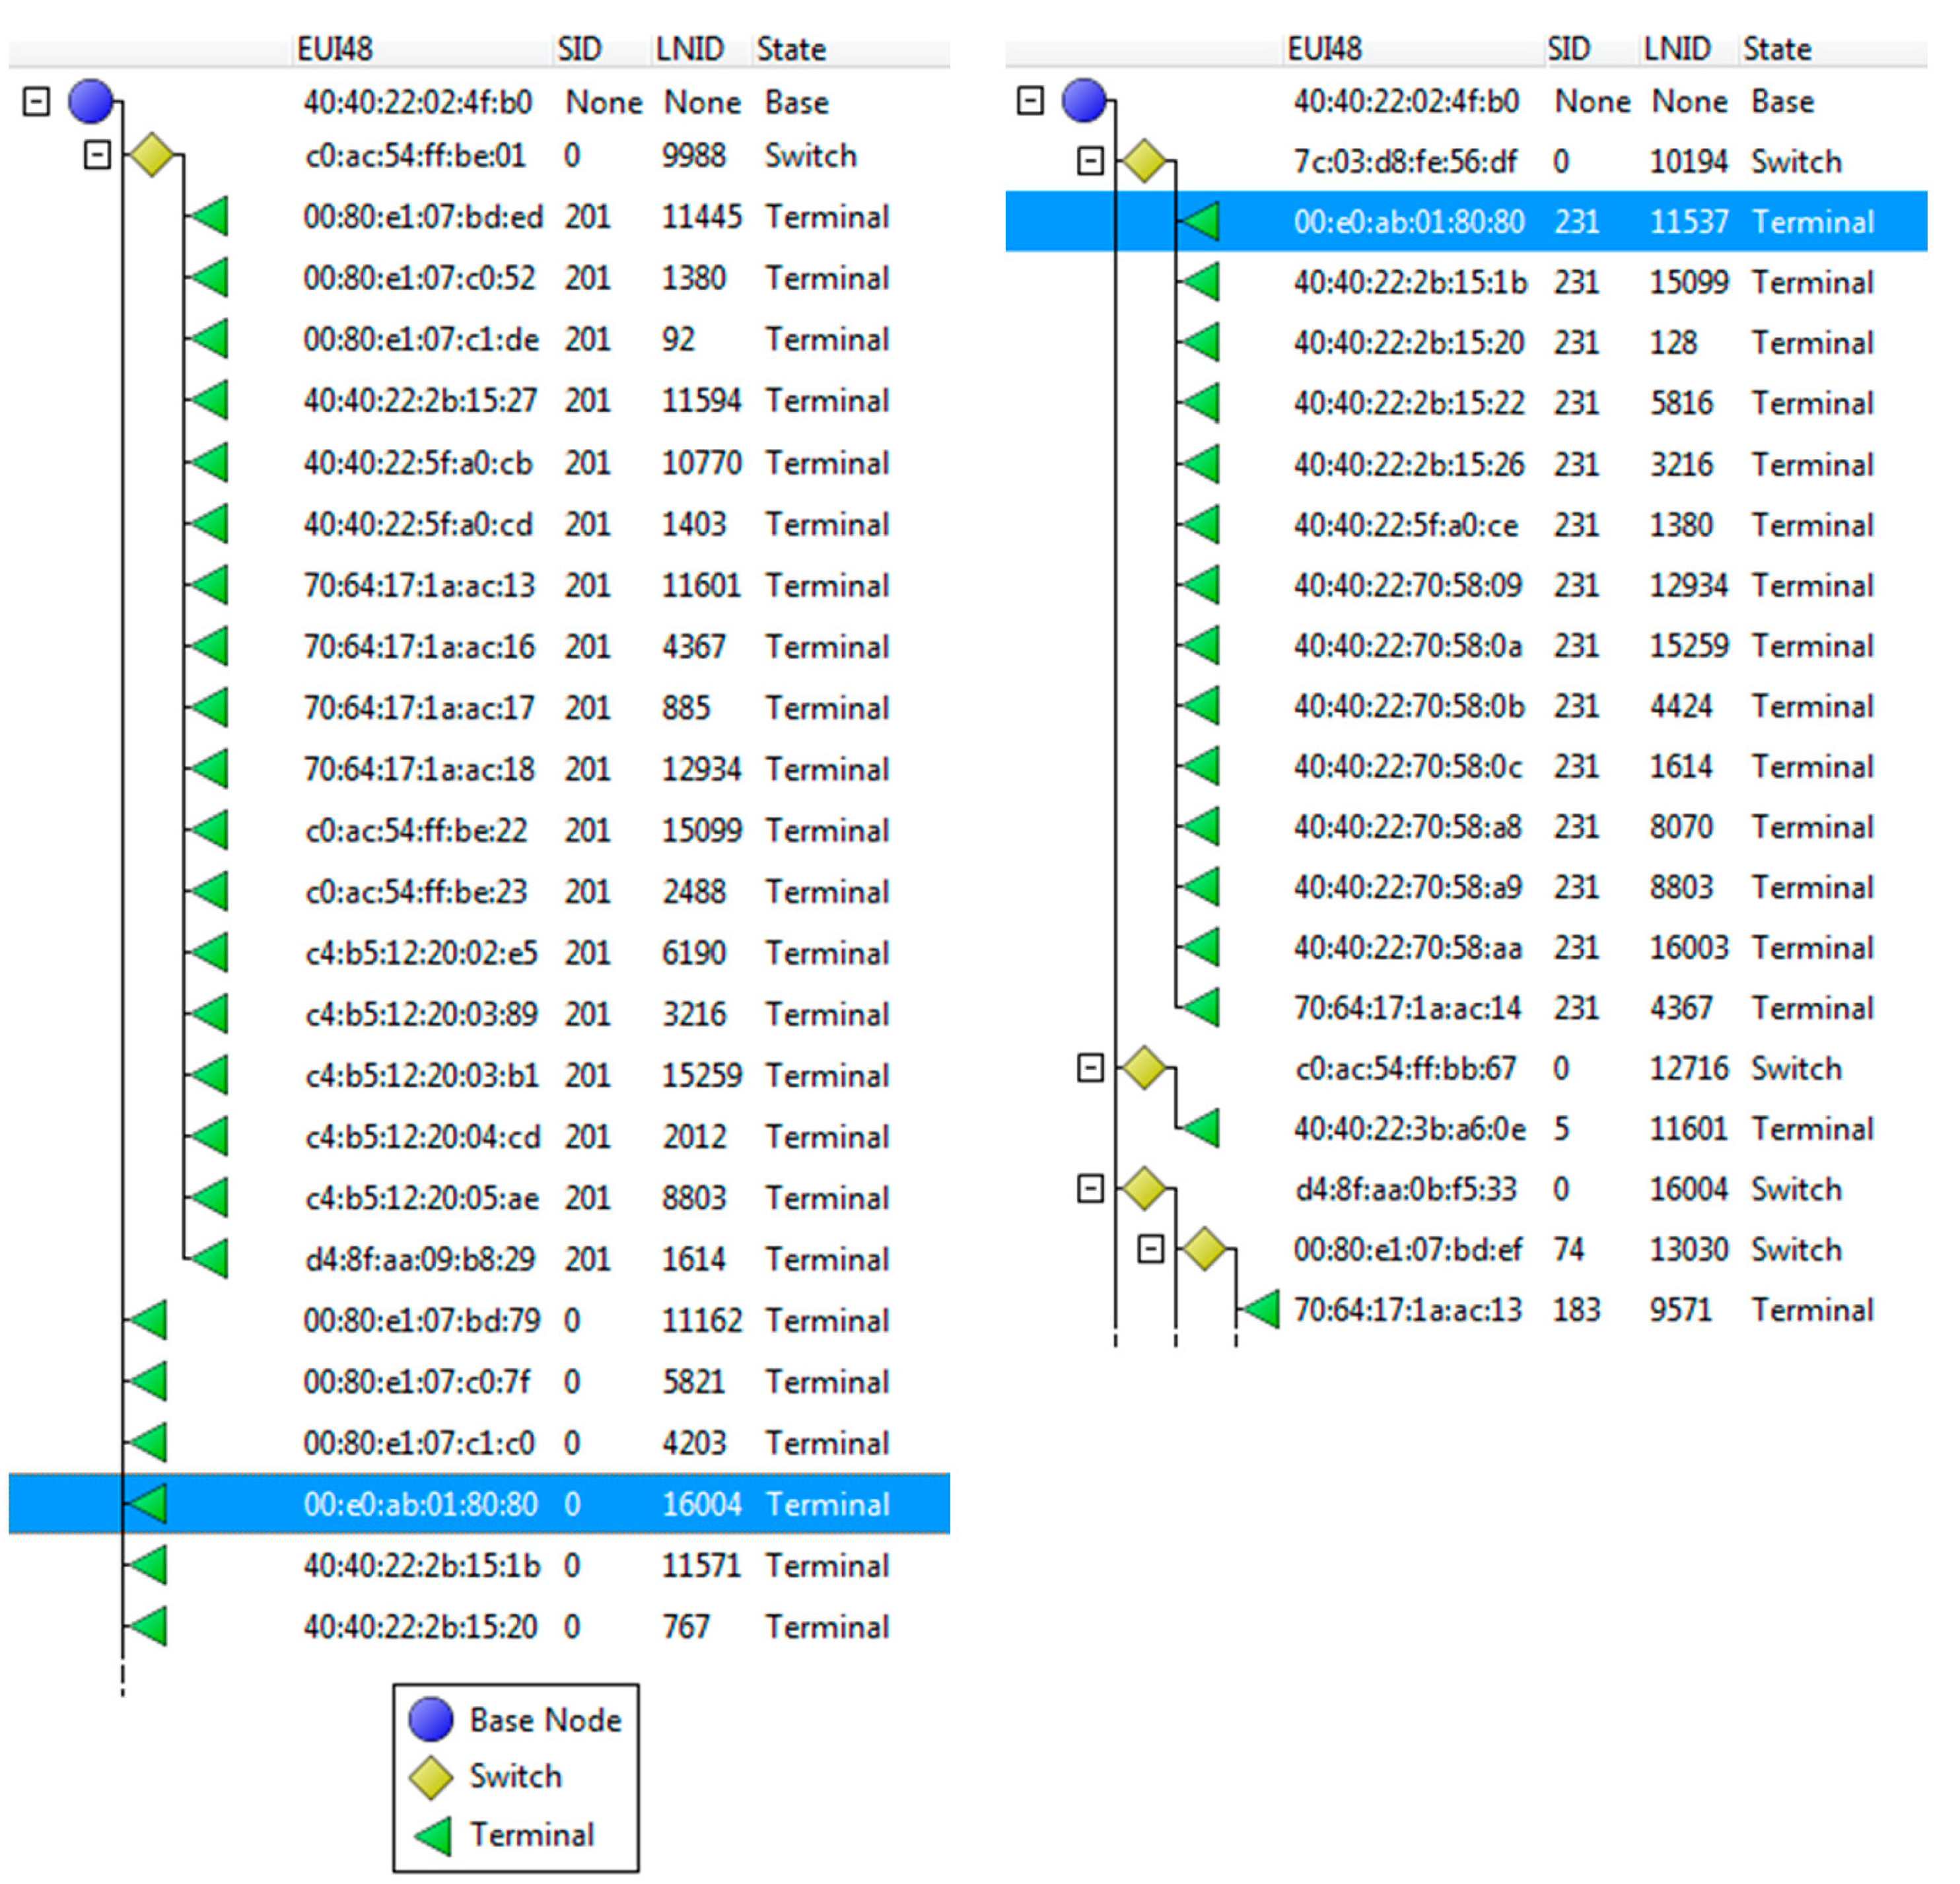
The PLC network topology that has been recorded is shown in
Figure 6. The SN used as DUT to communicate through IP with the BN, has been connected in different positions of the topology, as
Figure 6 highlights in blue color.
Figure 6.
Topologies (first level on the left and second level on the right) for switching environment tests.
Figure 6.
Topologies (first level on the left and second level on the right) for switching environment tests.
5.3.2. Tests Results
ICMP pings have been used to evaluate the performance of the IP connectivity. 32 bytes and 64 bytes of payload have been sent from the BN to the SN used as DUT (150 and 100 pings for each payload size, respectively), connecting the DUT at two different positions (first level—no PLC switching involved-, and second level—PLC switching-). PLC network has been configured to request acknowledge of any sent data packet.
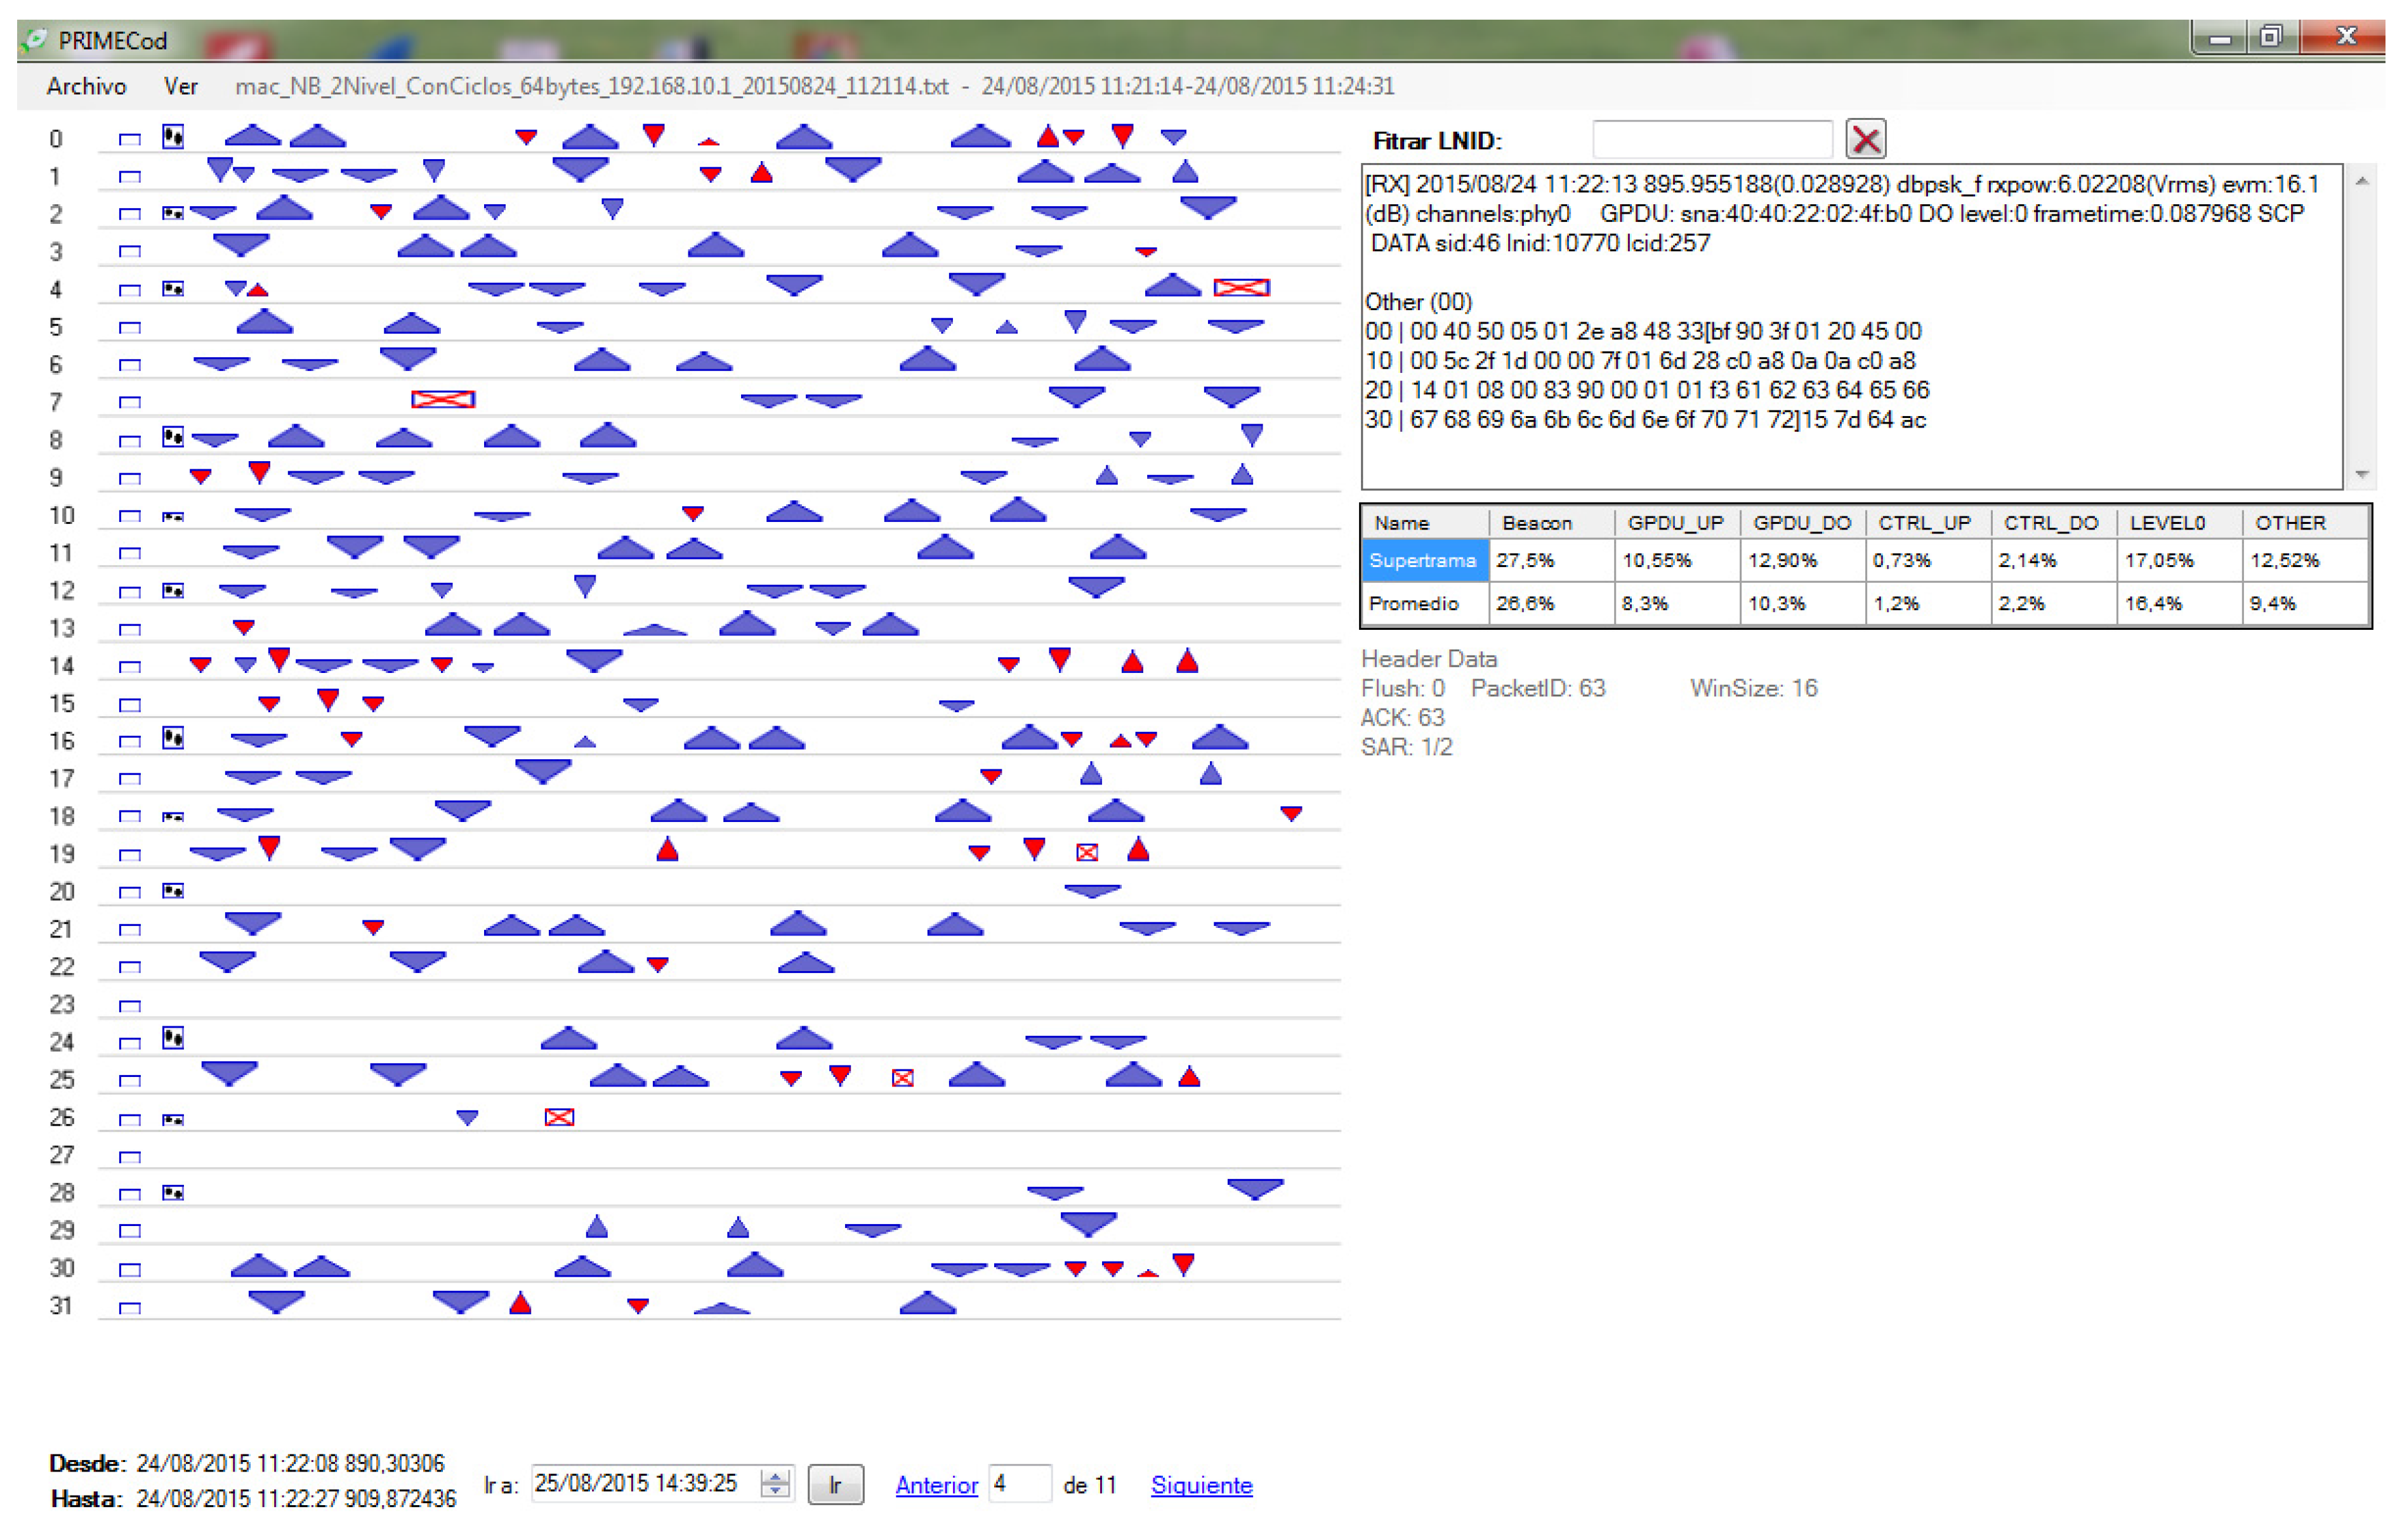
The network is configured with a smart metering profile with ARQ, and carries metering traffic (short cycles are used, as described in [
66]); a graphical representation of the PLC channel occupation is shown in
Figure 7. The plot represents a ITU-T G.9904 superframe (time in
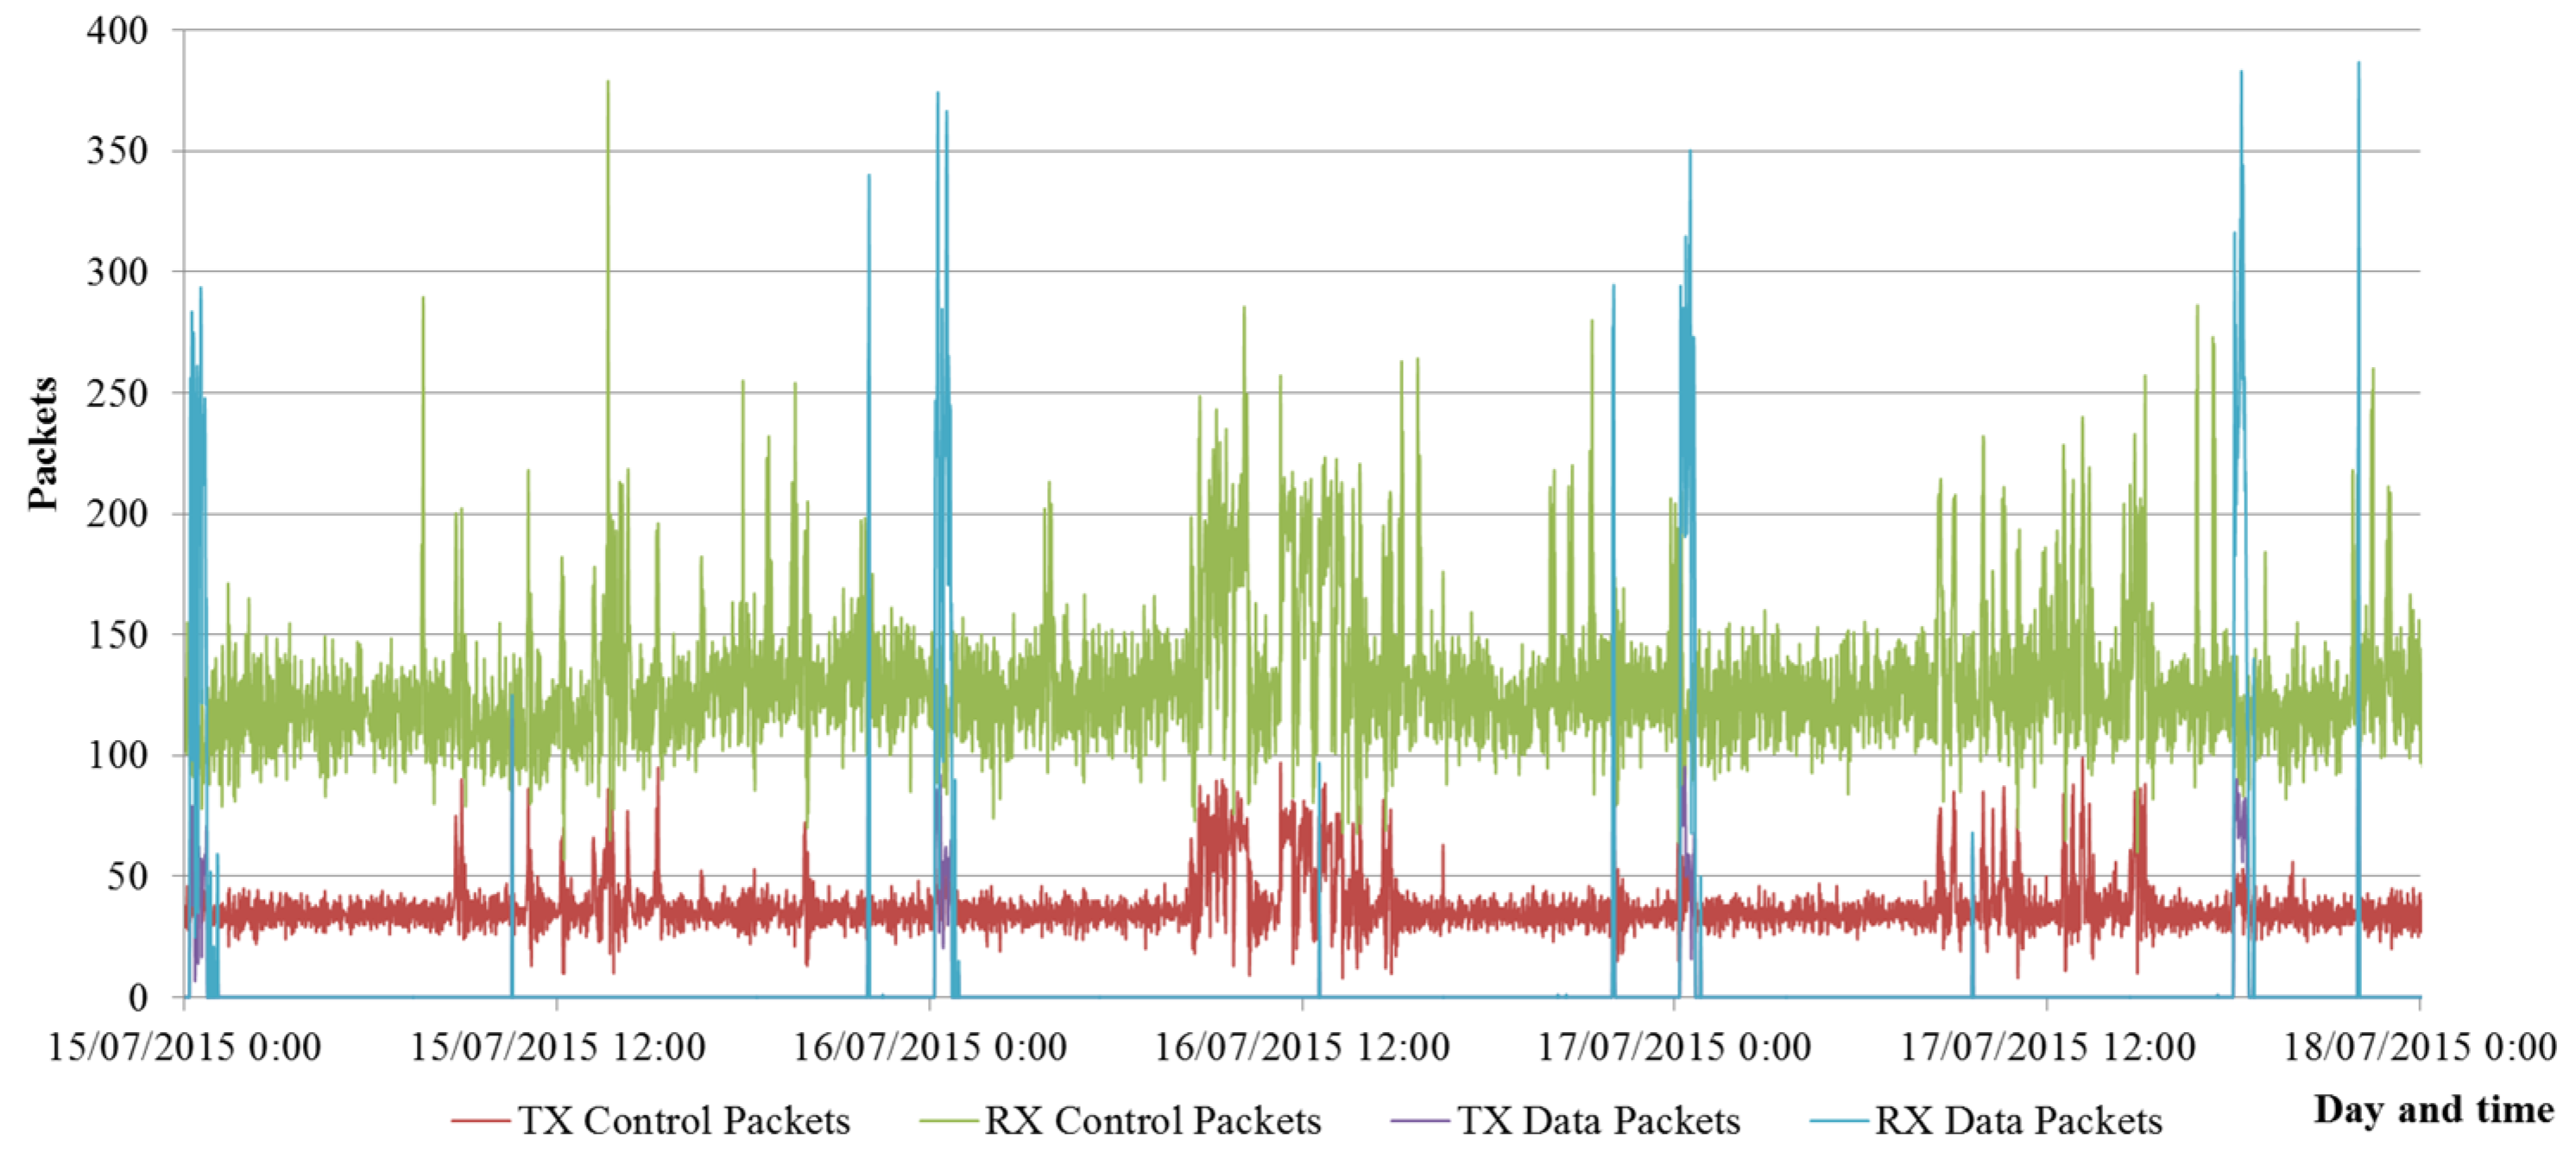
X axis), where blue triangles (pointing up equal to uplink, and pointing down equal to downlink) are data packets, and red ones control traffic (the crosses show packets in the network that do not belong to the switching level that the BN can listen to—they are behind the device acting as a switch- but are somehow decoded even with invalid cyclic redundancy check (CRC)).
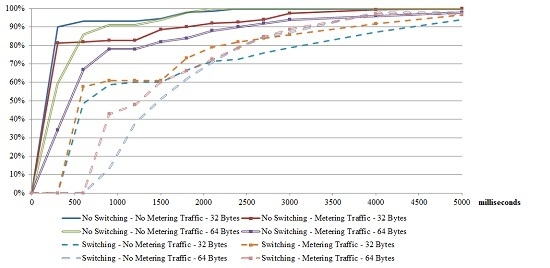
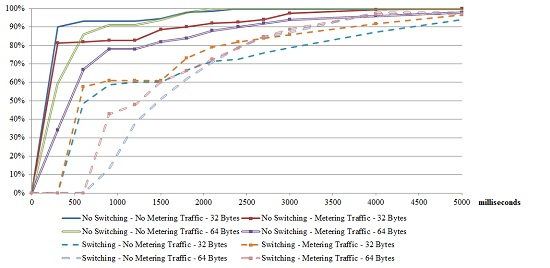
Figure 8 shows the results for the delay of the ICMP pings, expressed as a histogram of the total percentage of packets below a specific delay. A worst case throughput for 32 byte-packets has been measured as 0.36 kbps, and 0.65 kbps for 64 byte-packets.
Figure 7.
Traffic representation in PLC subnetwork under test.
Figure 7.
Traffic representation in PLC subnetwork under test.
Figure 8.
Internet control message protocol (ICMP) ping round-trip delay histogram.
Figure 8.
Internet control message protocol (ICMP) ping round-trip delay histogram.
5.3.3. Tests Results Analysis and Conclusions
The results presented for real field conditions demonstrate the feasibility of IP traffic transport over NB HDR PLC technologies in existing grid conditions, and in worst-case scenarios when smart metering traffic is present in the subnetwork. The results are coherent with the expected throughputs for “lossy” networks, and as such, should be handled for applications making use of them.
A further analysis of the test conditions shows that the results obtained can be significantly improved. The NB HDR PLC system implementation used for the tests is certified with the smart metering profile [
64]. This means that standard features such as CFP (defined to ensure QoS for specific devices) and direct connections (designed to allow data traffic between peer devices without engaging the BN) are not present. And some of the parameters present in the test (lowest throughput modulation, and 64 byte SAR mainly) could be improved. Thus, the tests have been performed under worst-case (or “best effort”) conditions. With the introduction of the smart grid features, the adaptation of the conservative selections of smart metering applications, and the evolution of this technology into its next version [
52], significantly improved results are expected.
6. Powerline Communications Network Management
A NMS, as it is defined in the IEC 60728-10, is a “software based system for controlling and supervising networks”. A NMS for a NB HDR PLC telecommunication network must be able to manage the information on the performance of each PLC subnetwork to evaluate if it is working properly and how its performance can be improved.
In an ITU-T G.9904 system, the BN is the element controlling each subnetwork, and it has access to most of the real-time performance parameters of it. Out of the experience in the deployment of more than 30,000 ITU-T G.9904 subnetworks in Iberdrola Spain, the information needed to monitor the performance of the subnetworks can be categorized in the following groups:
Subnetwork topology: number of SNs (terminals and switches), distribution of SNs within the subnetwork (at each subnetwork level), average availability of the SNs, detailed topology tree, etc.
PLC channel occupation: number of bytes and occupied time of both CFP and shared contention period (SCP), classifying control and data traffic as well as downlink and uplink flow direction.
Connection information (convergence layer): management connections, IEC 61334-4-32 connections, IP connections (Version 4 and 6), etc.
Apart from the monitoring capabilities, a NMS system needs to have the ability to follow the performance of the system in real-time. For this purpose, traffic capturing (“sniffing”) capabilities must be added to be able to retrieve PLC packets exchanged by the BN.
6.1. Simple Network Management Protocol
The information should be available through a SNMP agent implementing a MIB, including the object identifiers (OIDs) object identifiers listed in
Table 2.
Table 2.
Object identifiers (OIDs) of the simple network management protocol (SNMP) management information base (MIB). Media access control: MAC.
Table 2.
Object identifiers (OIDs) of the simple network management protocol (SNMP) management information base (MIB). Media access control: MAC.
| OID Group | OID Number | OID Name |
|---|
| Subnetwork topology | 1.3.6.1.4.1.x.1.1 | Subnetwork uptime (ms) |
| 1.3.6.1.4.1.x.1.2 | Number of terminals in the subnetwork |
| 1.3.6.1.4.1.x.1.3 | Number of switches in the subnetwork |
| 1.3.6.1.4.1.x.1.4 | Number of beacons allocated |
| 1.3.6.1.4.1.x.1.5 | Number of switching levels |
| 1.3.6.1.4.1.x.1.6 | Number of switches per level |
| 1.3.6.1.4.1.x.1.7 | Number of terminals per level |
| 1.3.6.1.4.1.x.1.8 | Number of promotions |
| 1.3.6.1.4.1.x.1.9 | Number of demotions |
| 1.3.6.1.4.1.x.1.10 | Number of registrations |
| 1.3.6.1.4.1.x.1.11 | Number of unregistrations |
| 1.3.6.1.4.1.x.1.12 | Successful alive base node (ALV)_B |
| 1.3.6.1.4.1.x.1.13 | Total ALV_B |
| 1.3.6.1.4.1.x.1.14 | Average availability—(1/10000) |
| 1.3.6.1.4.1.x.1.15 | Number of nodes used in the availability calculation (n) |
| Topology tree (list of registered nodes with the following information of each of them) | 1.3.6.1.4.1.x.2.MAC.1 | 1. MAC |
| 1.3.6.1.4.1.x.2.MAC.2 | 2. STATUS—Integer (0:Disconnected;1:Terminal;2:Switch;3:Base) |
| 1.3.6.1.4.1.x.2.MAC.3 | 3. LNID |
| 1.3.6.1.4.1.x.2.MAC.4 | 4. Switch identifier (SID) (if not directly connected to the BN) |
| 1.3.6.1.4.1.x.2.MAC.5 | 5. Local switch identifier (LSID) (if it is a Switch)—Unsigned32 |
| 1.3.6.1.4.1.x.2.MAC.6 | 6. AVAILABILITY—(1/10,000) |
| 1.3.6.1.4.1.x.2.MAC.7 | 7. DISCONNECTIONS |
| 1.3.6.1.4.1.x.2.MAC.8 | 8. Successful ALV_B |
| 1.3.6.1.4.1.x.2.MAC.9 | 9. Total ALV_B |
| 1.3.6.1.4.1.x.2.MAC.10 | 10. ALV_TIME |
| Connection information (convergence layer) | 1.3.6.1.4.1.x.3.1 | Total number of unicast active connections |
| 1.3.6.1.4.1.x.3.2 | Number of 4–32 connections |
| 1.3.6.1.4.1.x.3.3 | Number of management connections |
| 1.3.6.1.4.1.x.3.4 | Total number of multicast connections |
| 1.3.6.1.4.1.x.3.5 | Total number of devices registered in a multicast connection |
| PLC channel occupation | 1.3.6.1.4.1.x.4.1 | Number of packets in CFP |
| 1.3.6.1.4.1.x.4.2 | Time occupation (ms) of CFP |
| 1.3.6.1.4.1.x.4.3 | Number of packets in SCP |
| 1.3.6.1.4.1.x.4.4 | Time occupation (ms) of SCP |
| 1.3.6.1.4.1.x.4.5 | Number of error packets |
| 1.3.6.1.4.1.x.4.6 | Time occupation of error packets |
| 1.3.6.1.4.1.x.4.7 | Number of beacons received |
| 1.3.6.1.4.1.x.4.8 | Number of transmitted TX control packets |
| 1.3.6.1.4.1.x.4.9 | Number of received RX control packets |
| 1.3.6.1.4.1.x.4.10 | Time occupation of TX control packets (ms) |
| 1.3.6.1.4.1.x.4.11 | Time occupation of RX control packets (ms) |
| 1.3.6.1.4.1.x.4.12 | Number of TX data packets |
| 1.3.6.1.4.1.x.4.13 | Number of RX data packets |
| 1.3.6.1.4.1.x.4.14 | Time occupation of TX data packets (ms) |
| 1.3.6.1.4.1.x.4.15 | Time occupation of RX data packets (ms) |
6.2. Traffic Captures
In order to analyze the traffic in the PLC subnetwork, an interface is to be defined in BNs to capture and send to the NMS every PLC packet data unit (PDU). This interface defines the TCP encapsulation for each PDU, including several fields in the header with information of the PDU (PDU type, origin and destination address, topology level,
etc.) in order to facilitate the presentation of the information by the NMS to the operator. The interface defined is a custom simple binary protocol encoded in big endian that encapsulates messages as in
Table 3.
Table 3.
Traffic capture interface protocol.
Table 3.
Traffic capture interface protocol.
| Length | Type | Payload |
|---|
| 4 bytes | 1 byte | “Length” bytes |
where:
Length is the length of the payload. The messages are encoded sequentially and multiplexed using this length.
Type is the type of the message. Currently there are just two types of messages: MAC PDU reception and transmission.
The payload will have the format in
Table 4.
Table 4.
Traffic capture interface protocol. Payload format. Physical layer (PHY); packet data unit: PDU.
Table 4.
Traffic capture interface protocol. Payload format. Physical layer (PHY); packet data unit: PDU.
| Time counter | Date and time | PHY Info | Len | PDU | Optional fields |
|---|
| 4 bytes | 5 bytes | 2 bytes | 2 bytes | Len | - |
Table 5.
Traffic capture interface protocol. Payload physical layer (PHY) Info format.
Table 5.
Traffic capture interface protocol. Payload physical layer (PHY) Info format.
| Bits | Type | Description |
|---|
| 15 | Optional fields | 1 if optional fields are present, 0 otherwise. |
| 14 | Interface | 1 if PLC, 0 other. If 0, SNR, power and encoding are not valid |
| 10–13 | Reserved | - |
| 7–9 | Encoding | The encoding of the PDU: |
| 0—D8PSK |
| 1—DQPSK |
| 2—D8PSK |
| 4—DBPSK_CC |
| 5—DQPSK_CC |
| 6—D8PSK_CC |
| 4–6 | SNR | Signal to noise ratio in which this message was received (only reception) as defined in ITU-T G.9904 standard: |
| 0: ≤0 dB |
| 1: ≤3 dB |
| 2: ≤6 dB |
| … |
| 7: >18 dB |
| 0–3 | Power | For RX: reception power in which this messages was received (only reception) as defined in ITU-T G.9904: |
| 0: ≥70 dBuV |
| 1: ≥72 dBuV |
| 2: ≥74 dBuV |
| … |
| 15: >98 dBuV |
| For TX: |
| 0: maximal output level (MOL) |
| 1: MOL −3 dB |
| 2: MOL −6 dB |
| … |
| 7: MOL −21 dB |
Table 6.
Traffic capture interface protocol. Payload Optional fields format.
Table 6.
Traffic capture interface protocol. Payload Optional fields format.
| Field identifier | Field length | Data |
|---|
| 1 byte | 1 byte | Field length |
6.3. Network Management Systems Use Case: Powerline Communications Subnetwork Monitoring
The most basic subnetwork monitoring use-case for smart metering applications is based on the PLC topology, the packet count and the channel occupation control.
For this purpose, with the indications gathered from [
18,
67], the following information needs to be collected by the NMS from each subnetwork:
Once per minute:
- ○
Number of Terminals in the subnetwork—Unsigned 32.
- ○
Number of Switches in the subnetwork—Unsigned 32.
- ○
Average Availability—Unsigned 32 (as explained below).
Once per hour:
- ○
Number of TX Control Packets—Unsigned32.
- ○
Number of RX Control Packets—Unsigned32.
- ○
Time occupation of TX Control Packets (ms)—Unsigned32.
- ○
Time occupation of RX Control Packets (ms)—Unsigned32.
- ○
Number of TX Data Packets—Unsigned32.
- ○
Number of RX Data Packets—Unsigned32.
- ○
Time occupation of TX Data Packets (ms)—Unsigned32.
- ○
Time occupation of RX Data Packets (ms)—Unsigned32.
Once per day:
- ○
List of registered nodes (Topology Tree).
- ○
UpTime—Unsigned 32.
With this configuration of the use-case, the traffic expected per PLC subnetwork (i.e., domain of the BN) to retrieve the information needed and considering an average subnetwork size of 130 SNs is 0.813 MB per day (optimizing SNMP requests through the use of “bulk” requests when possible). The volume of data to be stored in the database per each BN to comply with this configuration of the system, considering an average subnetwork size of 130 smart meters, is 24 kBytes per day.
Topology information is interesting to evaluate the behavior of the subnetwork in terms of stability. The average availability is calculated with the following formula:
where:
Treg: is the time that a particular node is registered in the subnetwork since the last reset.
n: is the number of different nodes registered in the subnetwork at least once since the last reset.
Tuptime: is the time since the last reset.
Channel occupation measures the use of the PLC subnetwork resources, obtaining patterns of use to detect any unexpected behavior which may damage the performance of the subnetwork.
The automatic analysis of the information received in the system, compared to the historical available information, will be used to represent trends and create alarms. Applying an intelligent algorithm to compare expected results with the actual situation of the subnetwork, and calibrating correctly the last results in order to avoid unnecessary alarms, the NMS will notify the operator alarms when a subnetwork is not performing according to its expected behavior, giving the operator the opportunity to manually retrieve additional OIDs and real-time detailed information (i.e., traffic capture interface), to analyze the situation and decide if it requires any remote or local, action or configuration.
6.4. Powerline Communications Subnetwork Monitoring Tests
Following the use-case of the previous section, several tests have been developed in different ITU-T G.9904 subnetworks, gathering the most important OIDs during a period of time. Some graphs and reports to check the performance have been generated.
Figure 9 shows the topology evolution of a subnetwork. It represents the number of terminals and switches registered in the subnetwork through time, giving a view of the stability of the subnetwork and showing possible events with a daily or hourly pattern.
Figure 9.
Topology SNs connected to the BN; terminals and switches) evolution of a PLC subnetwork.
Figure 9.
Topology SNs connected to the BN; terminals and switches) evolution of a PLC subnetwork.
Figure 10 shows the evolution of the number of control and data packets in the subnetwork. It gives information about the use of the communication resources provided by the subnetwork and the distribution of traffic along time.
Figure 10.
Control and data packets (transmitted –TX- and received –RX-) in a ITU-T G.9904 subnetwork.
Figure 10.
Control and data packets (transmitted –TX- and received –RX-) in a ITU-T G.9904 subnetwork.
Figure 11 shows the SCP occupation in the subnetwork. It represents the percentage of time in which the channel is occupied by any PDU in comparison with the duration of the SCP. Together with
Figure 10, it gives information of the traffic in the subnetwork.
Figure 11.
PLC channel occupation in a subnetwork.
Figure 11.
PLC channel occupation in a subnetwork.
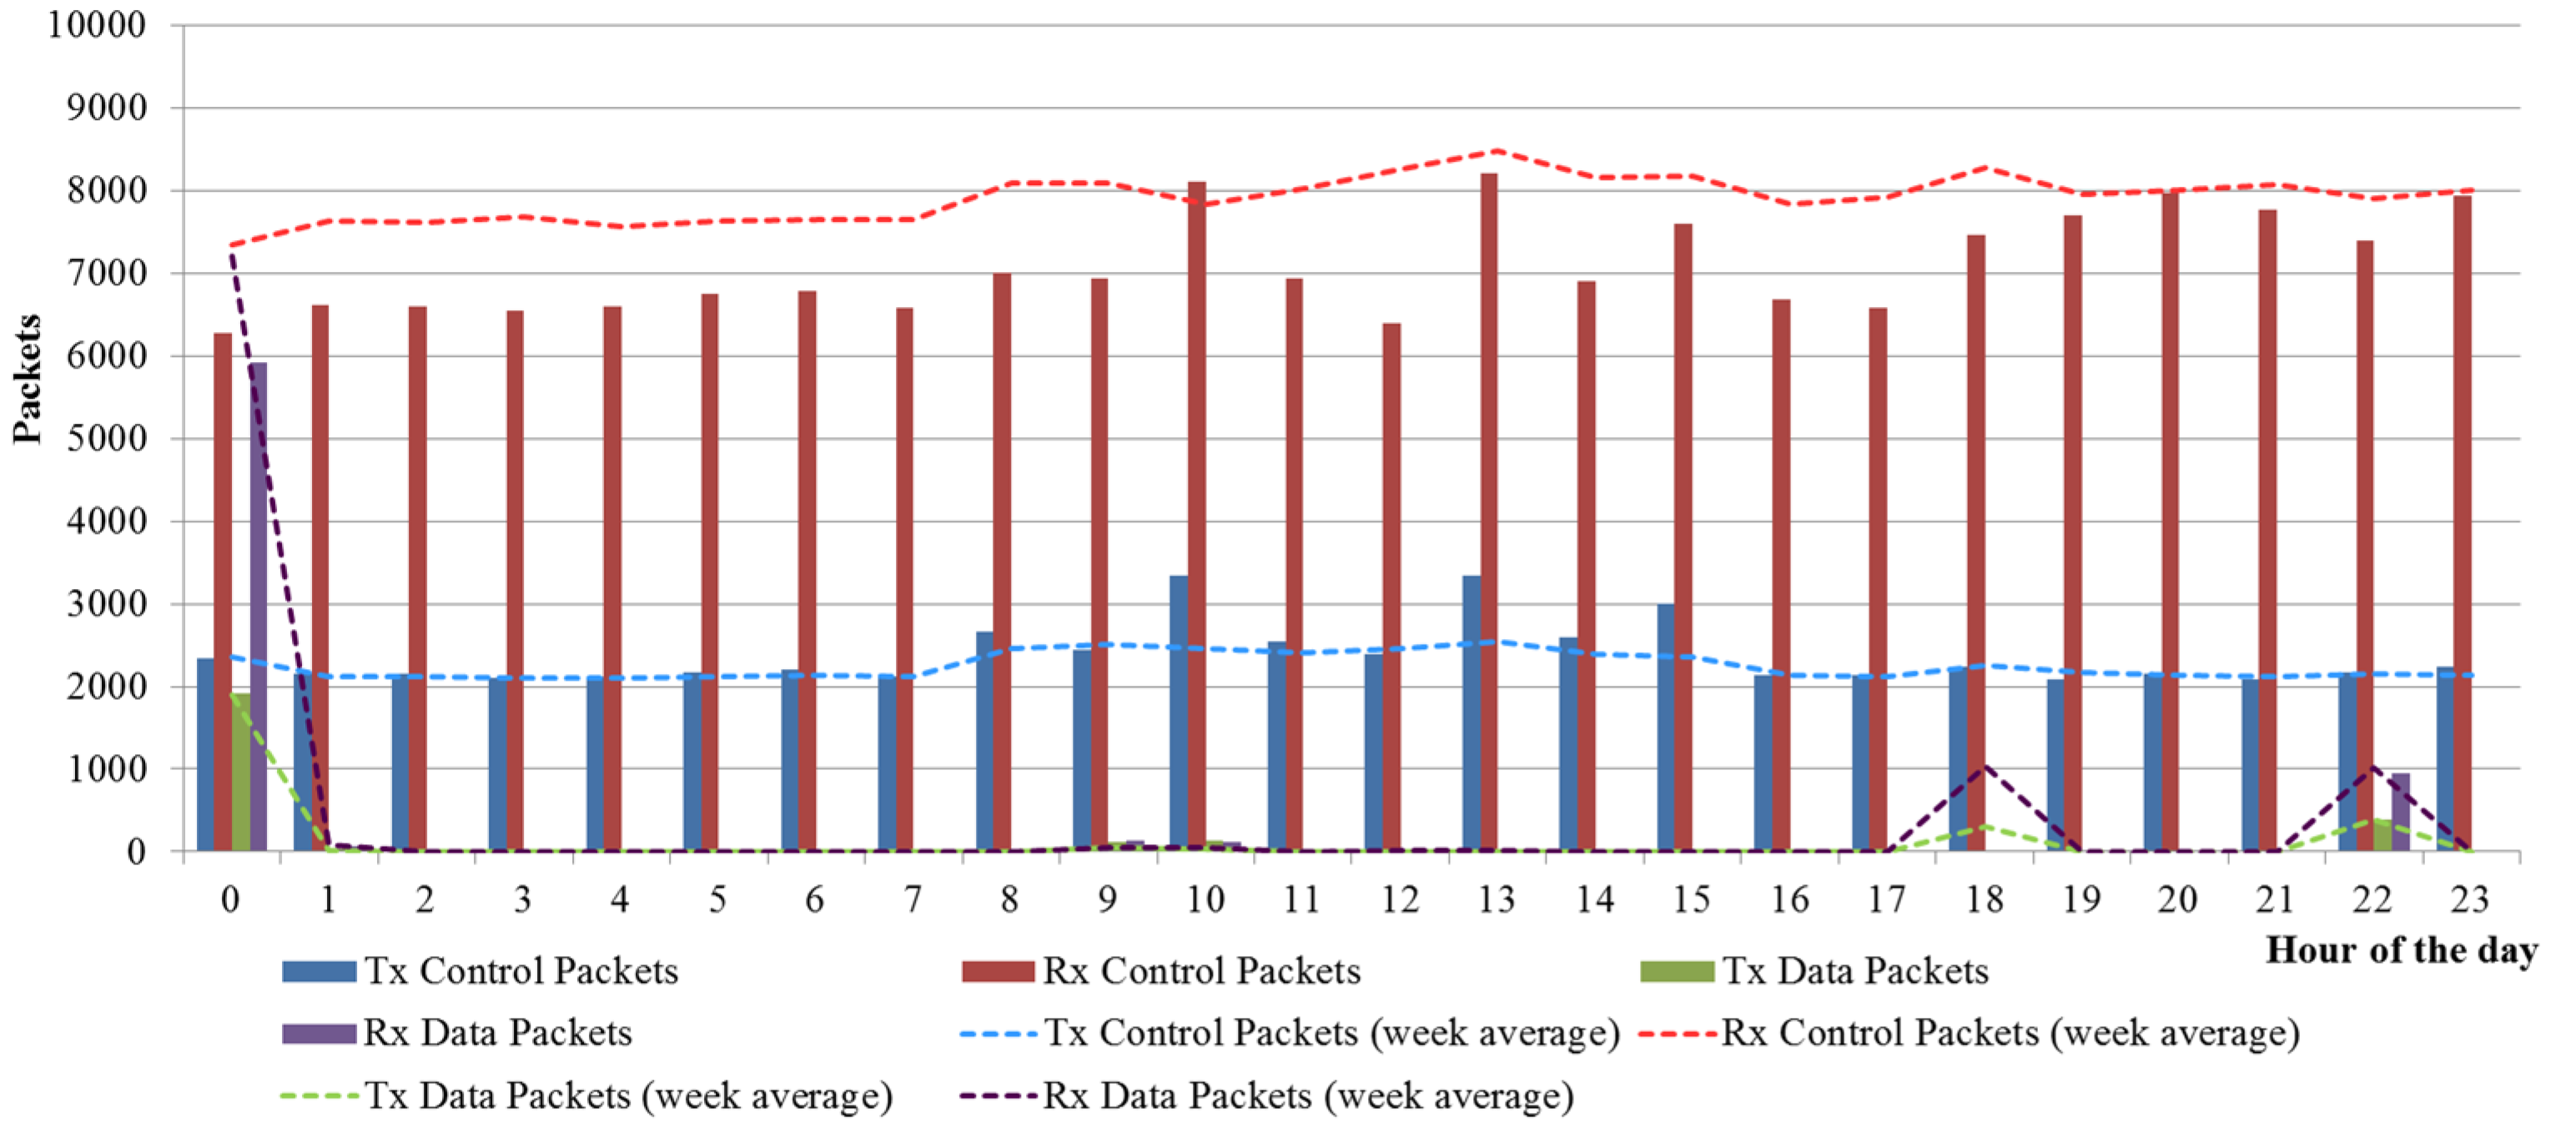
Figure 12 contains an example of how the data can be analyzed to understand trends and study deviations. It shows the hourly channel occupation (number of transmitted data packets, received data packets, transmitted control packets and received control packets) of a PLC subnetwork with 100 SNs during one day. It is compared with the average traffic of this subnetwork in order to detect unexpected patterns.
Figure 12.
Graphical report of the number of data and control packets in the PLC subnetwork.
Figure 12.
Graphical report of the number of data and control packets in the PLC subnetwork.


 ,
, 


