
Analysis of the Channel Influence to Power Line Communications Based on ITU-T G.9904 (PRIME)

 , , ,
, , ,
Abstract
:1. Introduction
2. Scope of the Paper
- Channel configurable parameters.
- −
- Channel response function, usually defined by its response in module and phase (described in Section 4.2).
- −
- Noise model (described in Section 4.3).
- −
- Signal-to-Noise Ratio (SNR).
- Transmission configurable parameters.
- −
- Modulation scheme: Differential Binary Phase-Shift Keying (DBPSK), Differential Quadrature Phase-Shift Keying (DQPSK) and Differential 8 Phase-Shift Keying (D8PSK) with and without convolutional encoding.
- −
- Packet Service Data Unit (PSDU) length.
The purpose of each simulation is to identify the PRIME behavior under individual channel effects.The understanding of the technology based on the conclusions of this article will be used to: - Better understand individual issues, giving the information needed to identify and compare these individual channel effects on field deployments in order to evaluate how they might affect the network performance.
- Guide deployment strategies.
- Evaluate current PLC technologies to enhance their features in future developments.
- Obtain values of parameters to compare PLC technologies and choose the one best suited to a particular environment or application.
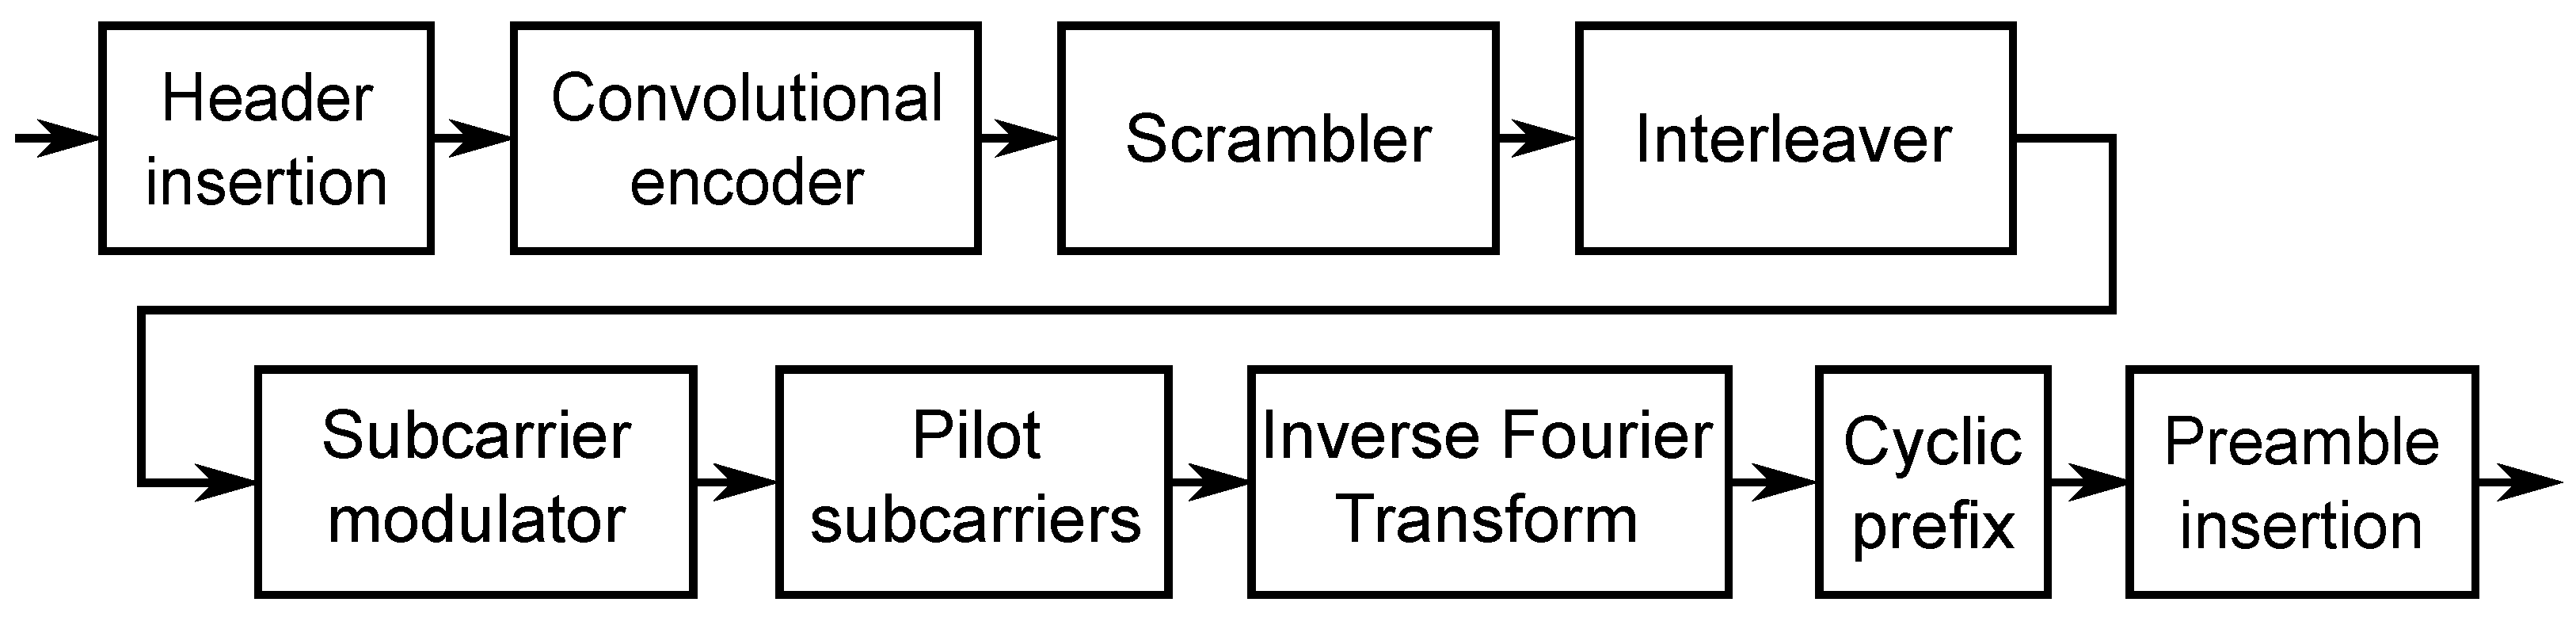
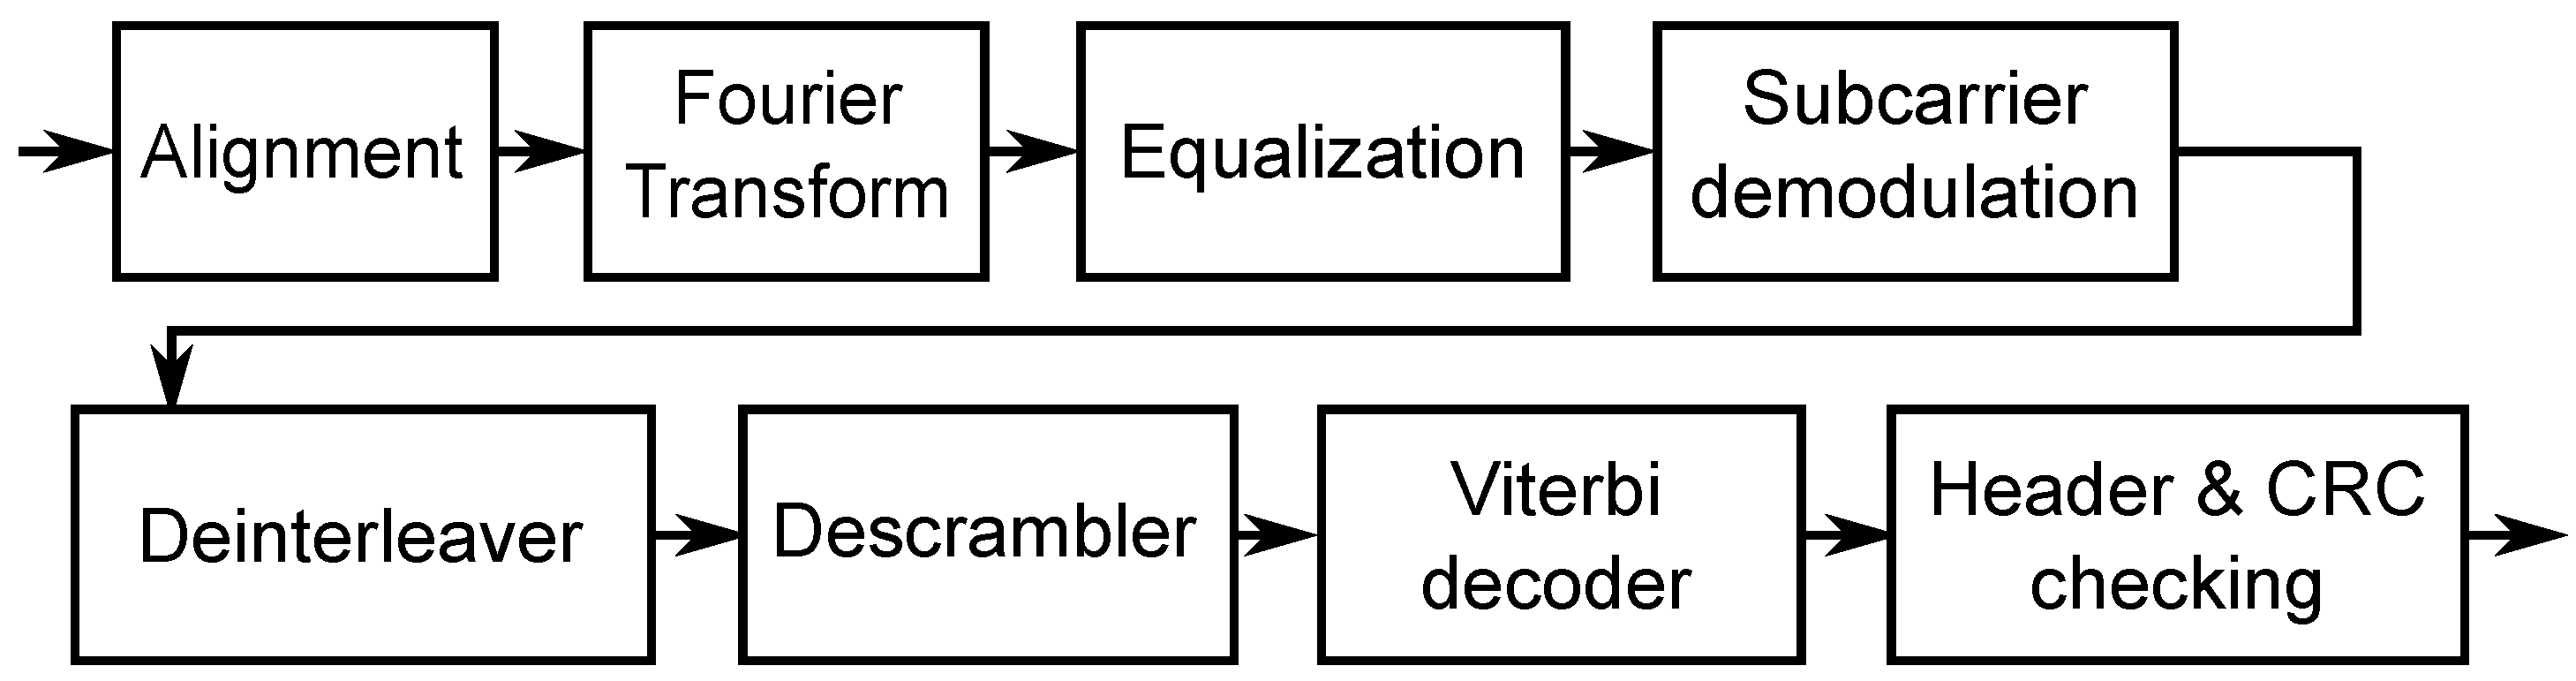
3. Brief Description of ITU-T G.9904 (PRIME) Physical Layer


| Parameter | Value |
|---|---|
| Frequency band | 41.9–88.9 kHz |
| Number of subcarriers | 97 |
| Intercarrier spacing | 488.28 Hz |
| OFDM symbol length | 2.24 ms |
| Cyclic prefix length | 192 μs |
| Interleaver type | Block interleaver |
| Interleaver size | 1 OFDM symbol |
| Encoder rate | 1/2 |
| Subcarrier modulation | DBPSK: Differential Binary Phase-Shift Keying |
| DQPSK: Differential Quadrature Phase-Shift Keying | |
| D8PSK: Differential 8 Phase-Shift Keying | |
| Preamble waveform | Single chirp from 41.9–88.9 kHz in 2.048 ms |
4. Workbench Description and Test Conditions
4.1. Implementation of the ITU-T G.9904 (PRIME) Layer Used for the Simulation
4.2. Channel Response Models under Test
4.2.1. Flat Channel
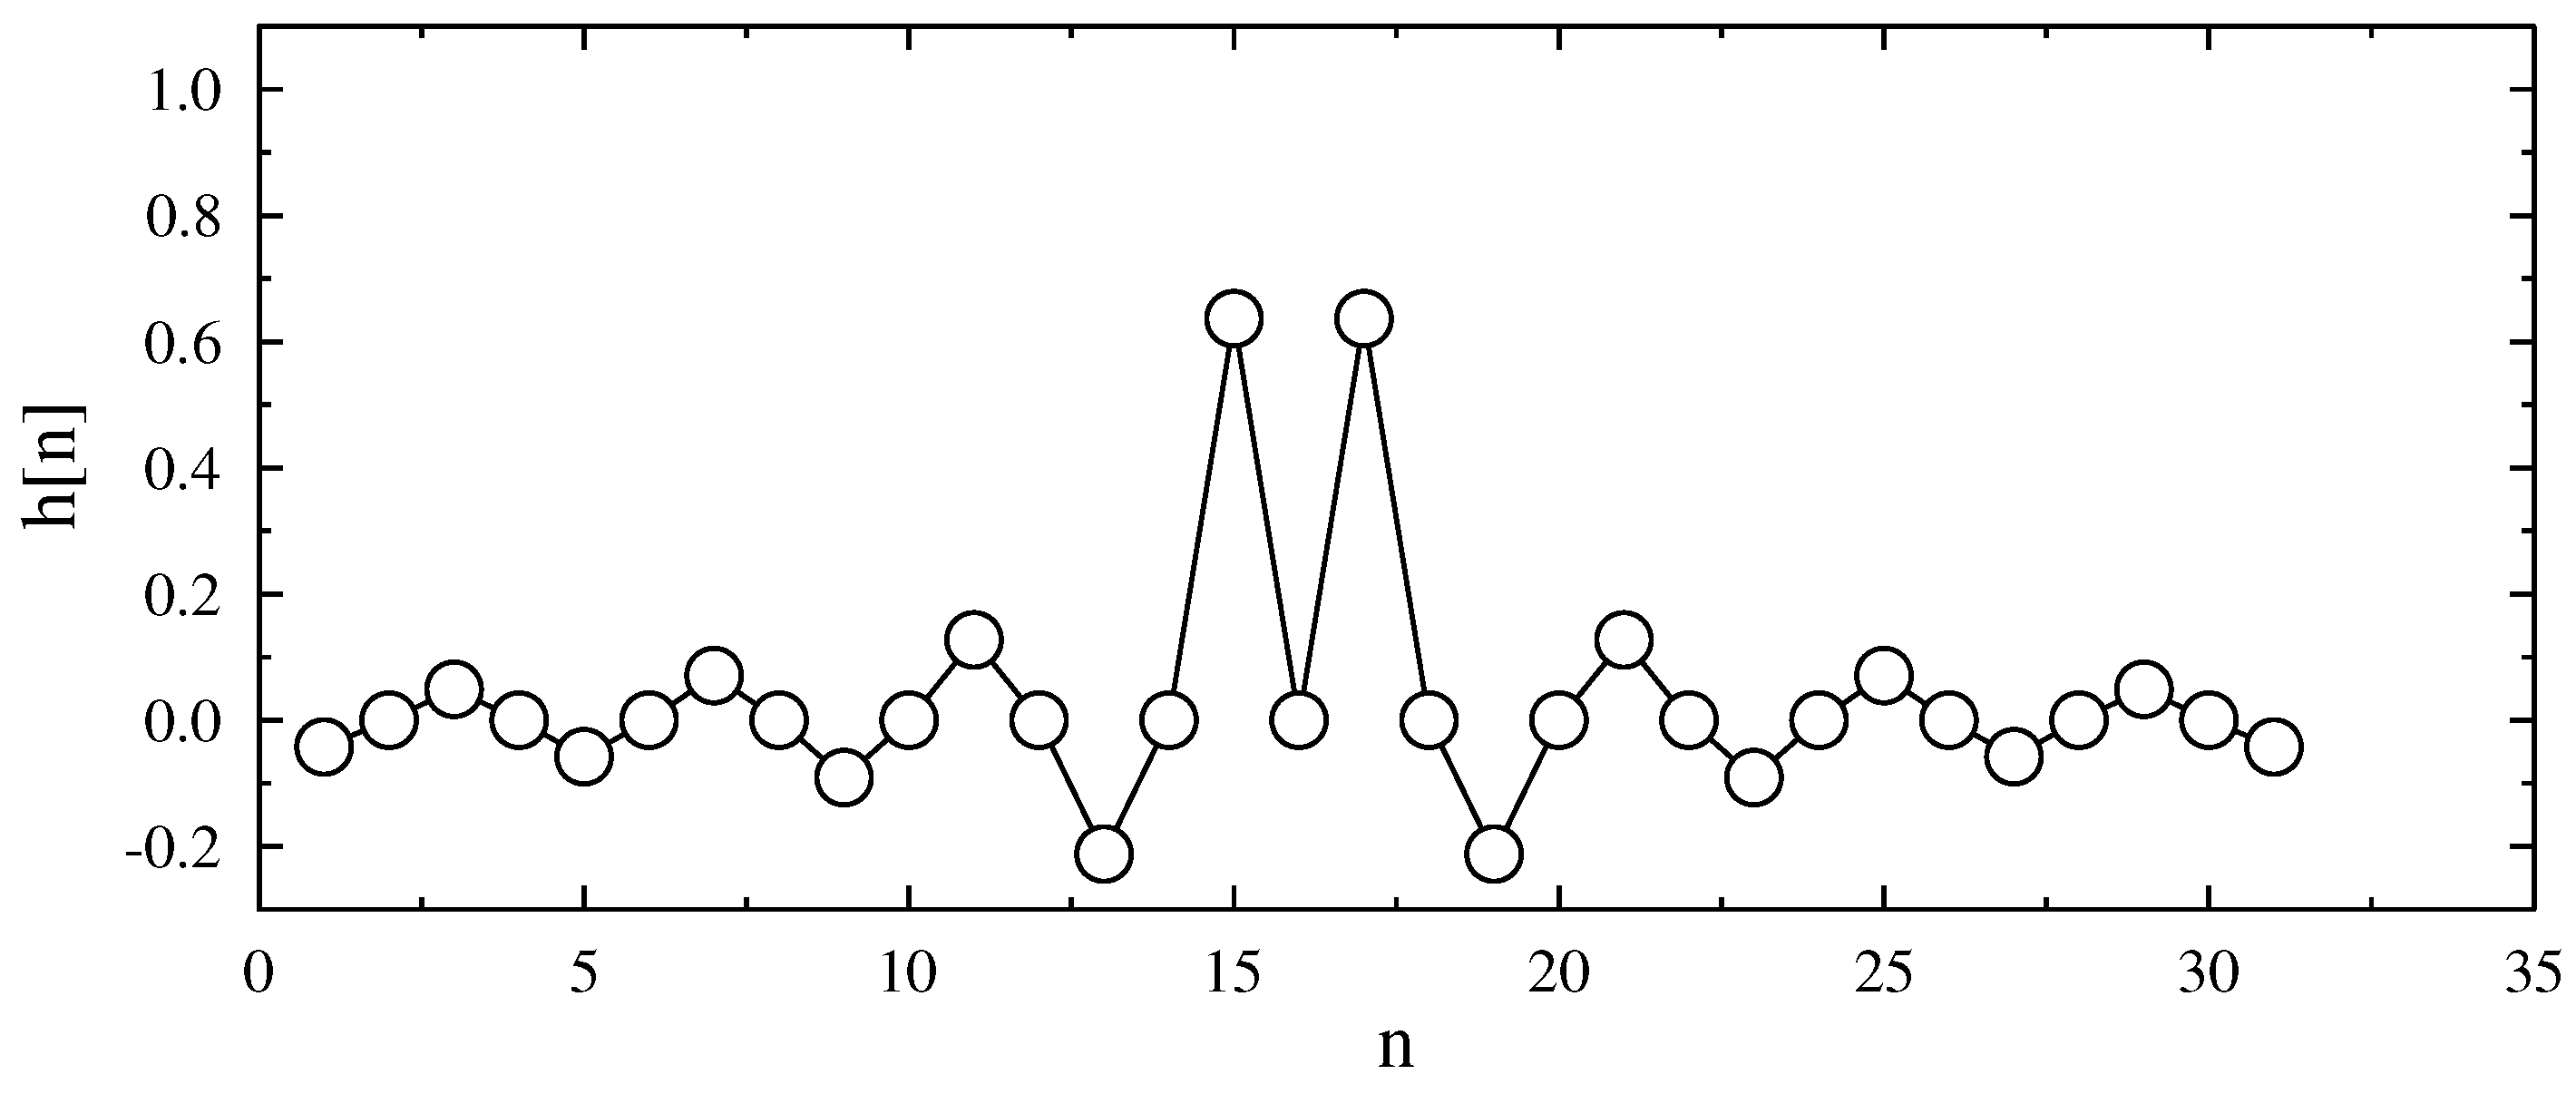
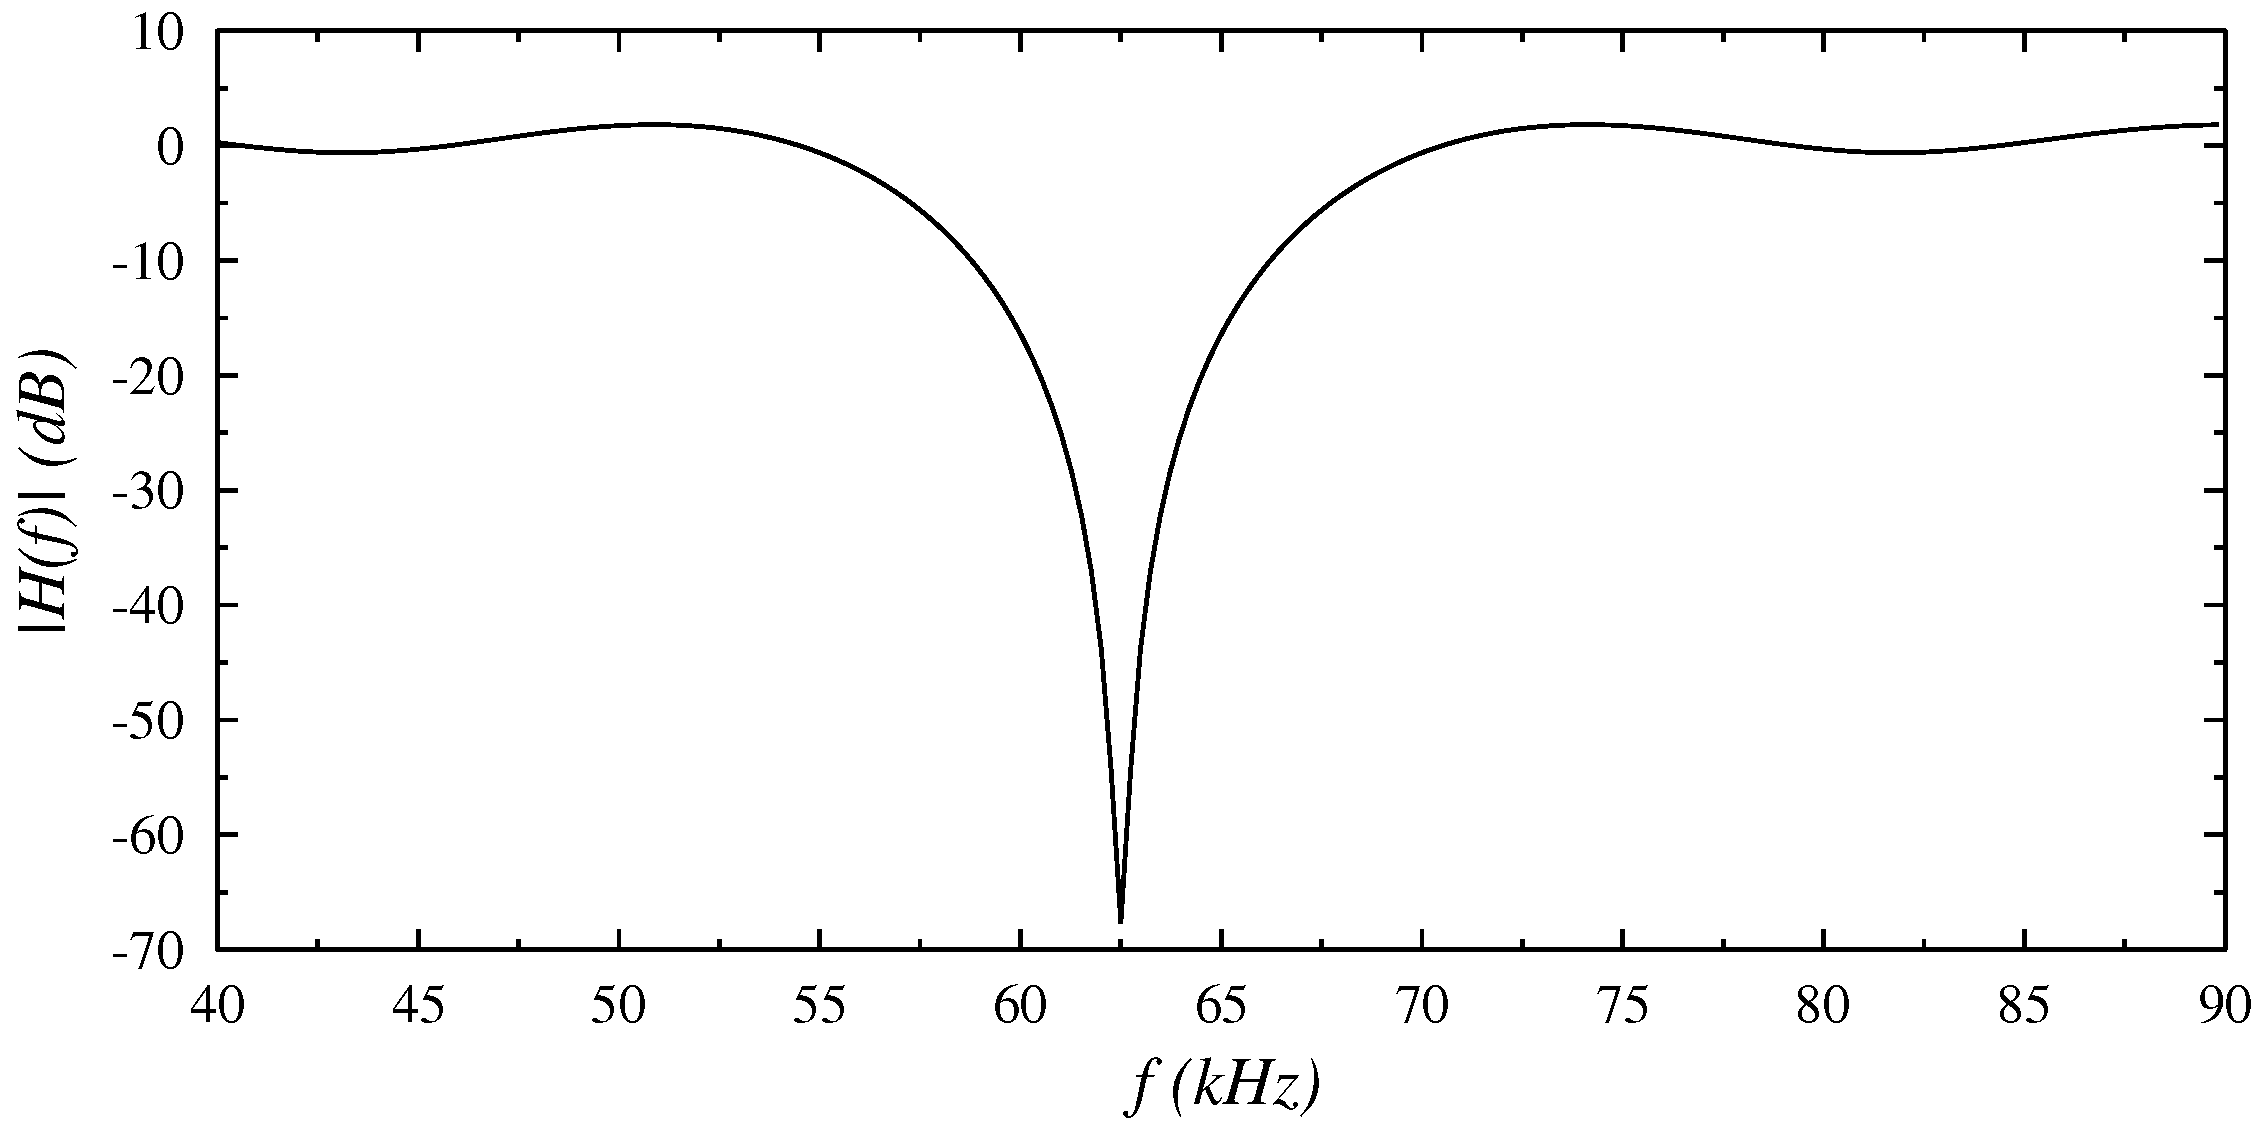
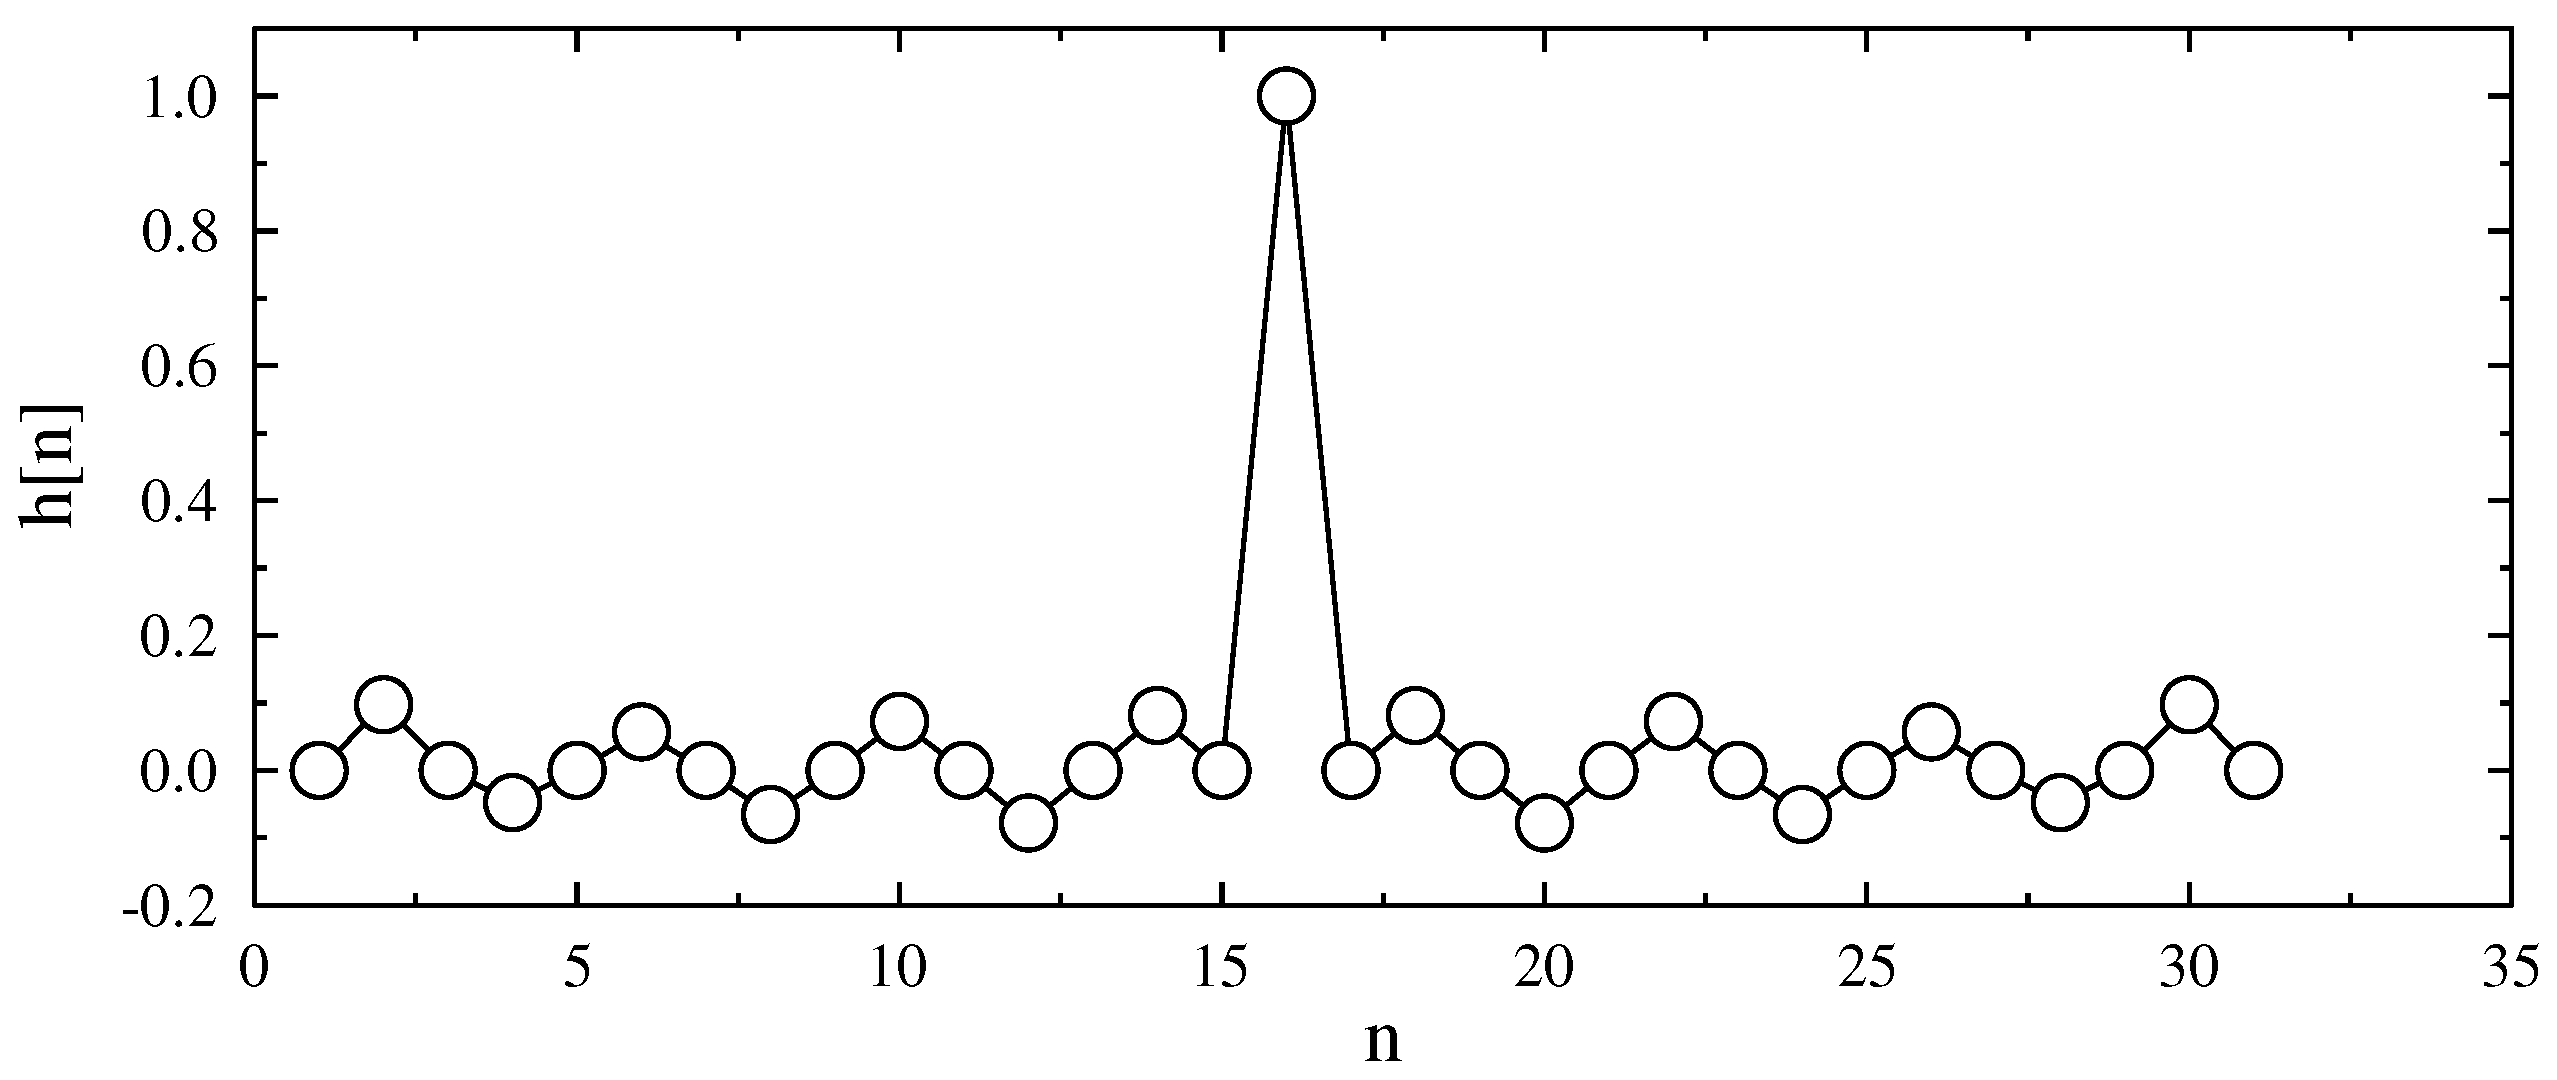
4.2.2. Frequency Selective Channel
| n | h[n] | n | h[n] | n | h[n] | n | h[n] |
|---|---|---|---|---|---|---|---|
| 0 | 4 | 8 | 12 | ||||
| 1 | 5 | 9 | 13 | ||||
| 2 | 6 | 10 | 14 | ||||
| 3 | 7 | 11 | 15 | 1 | |||
| Remaining values of defined through symmetry: | |||||||
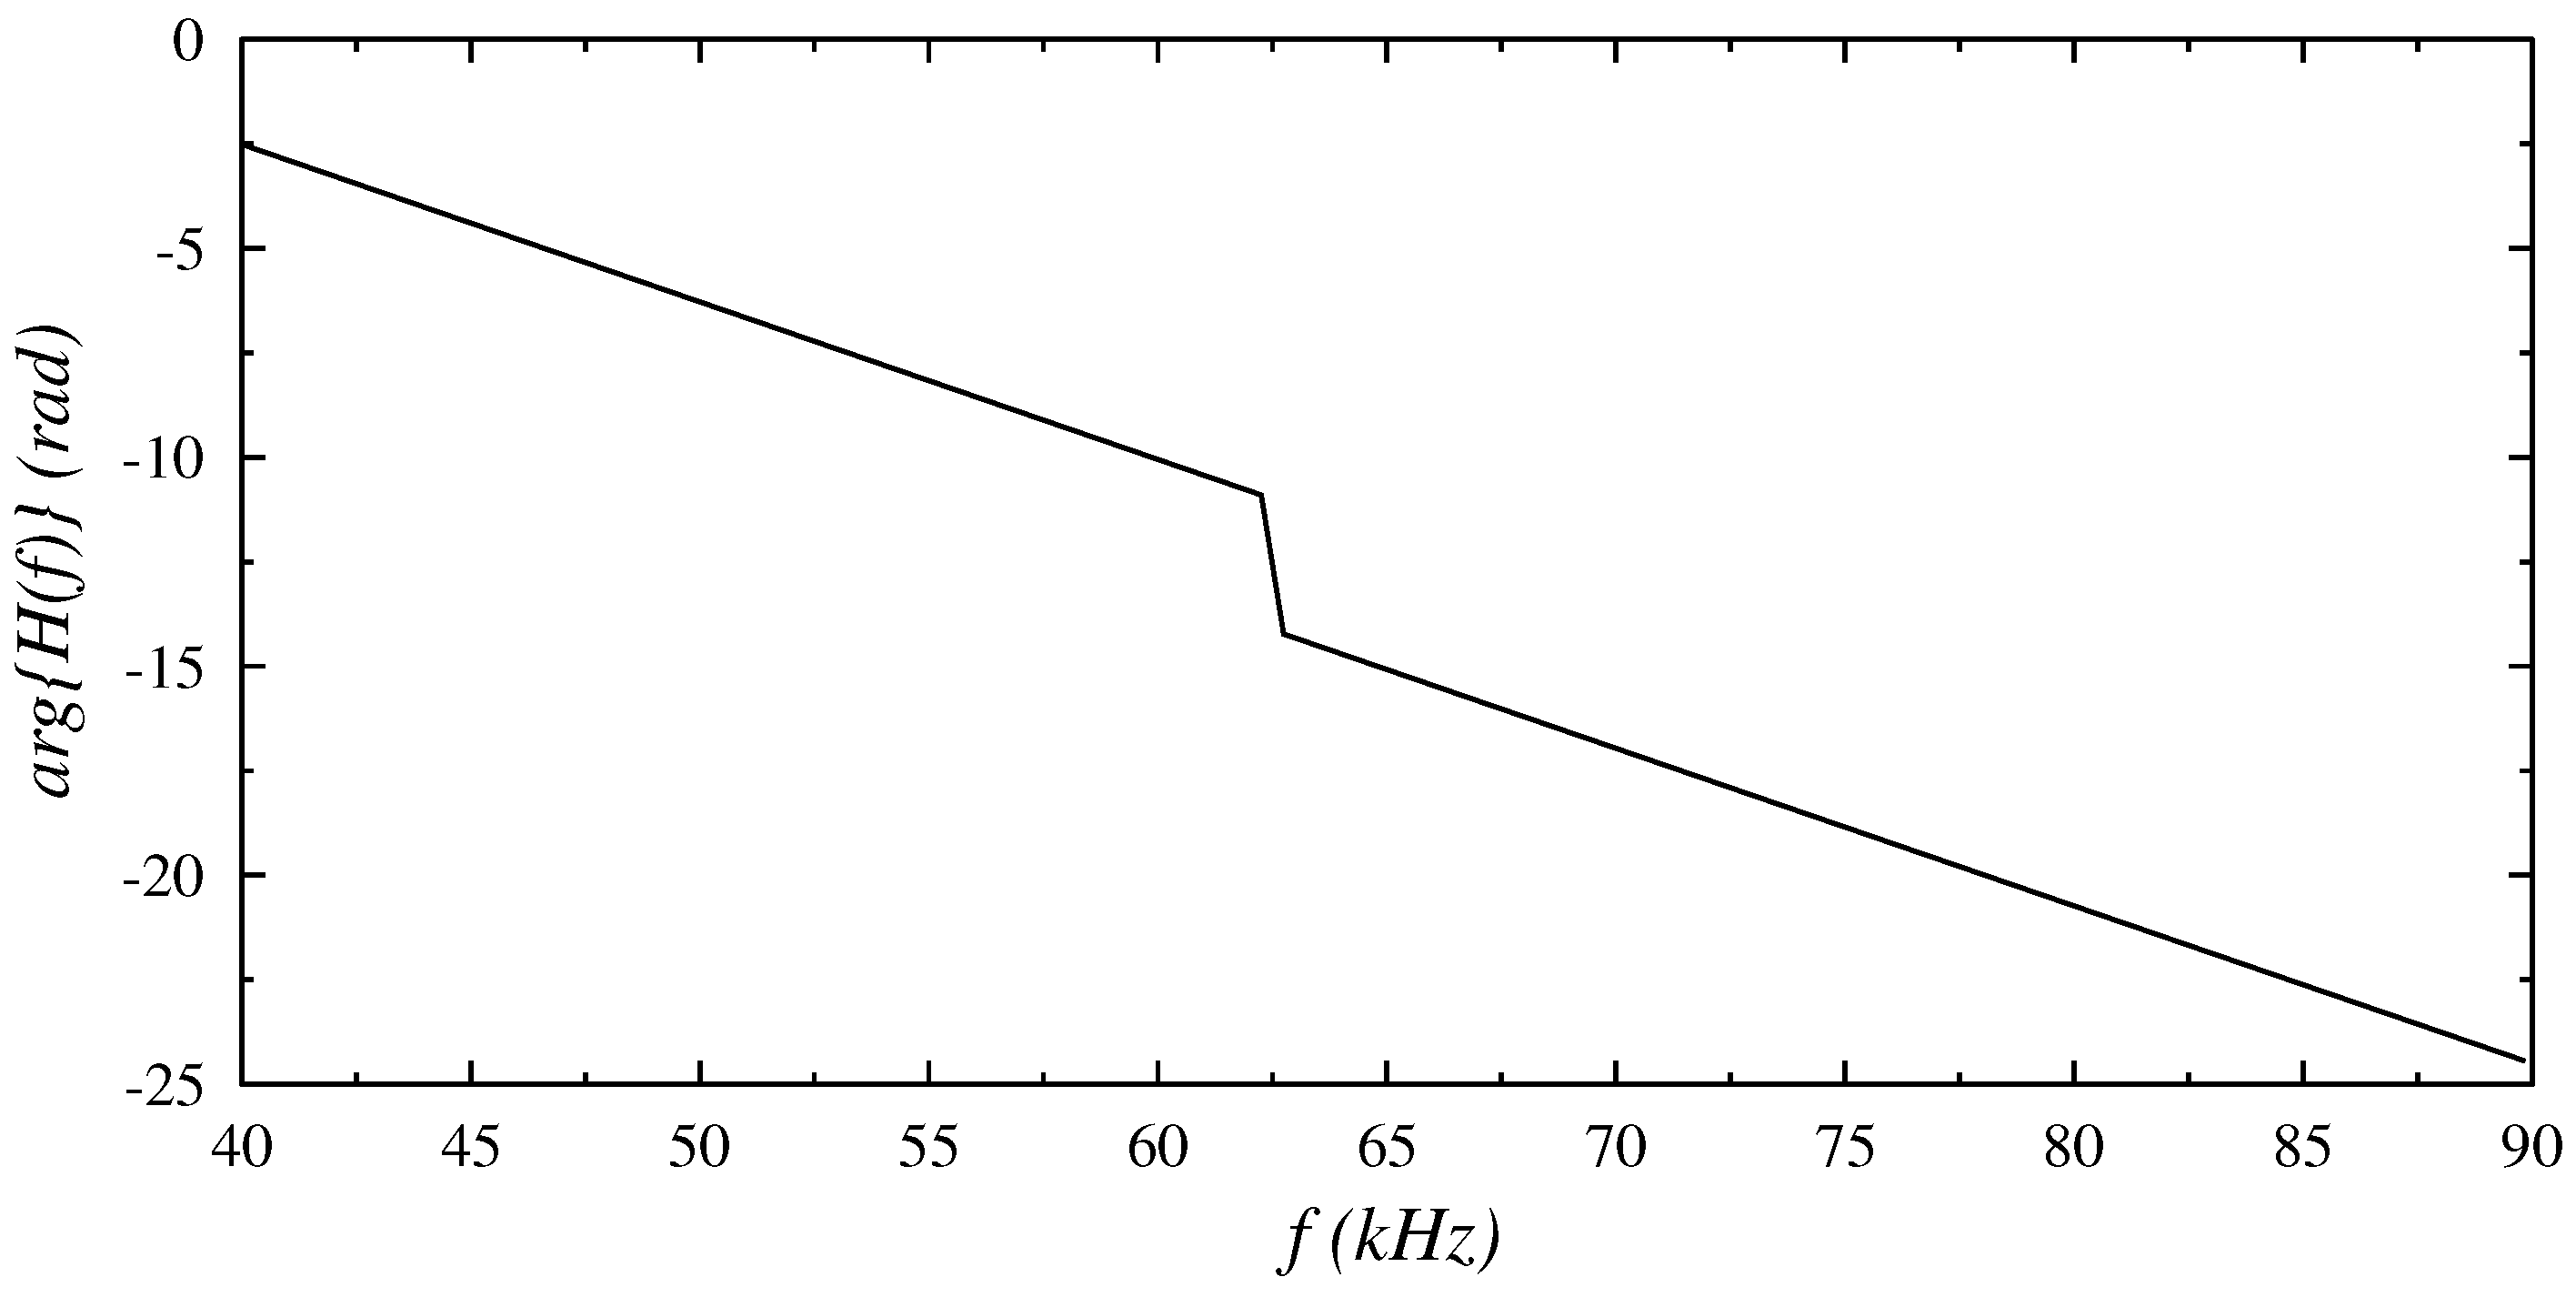
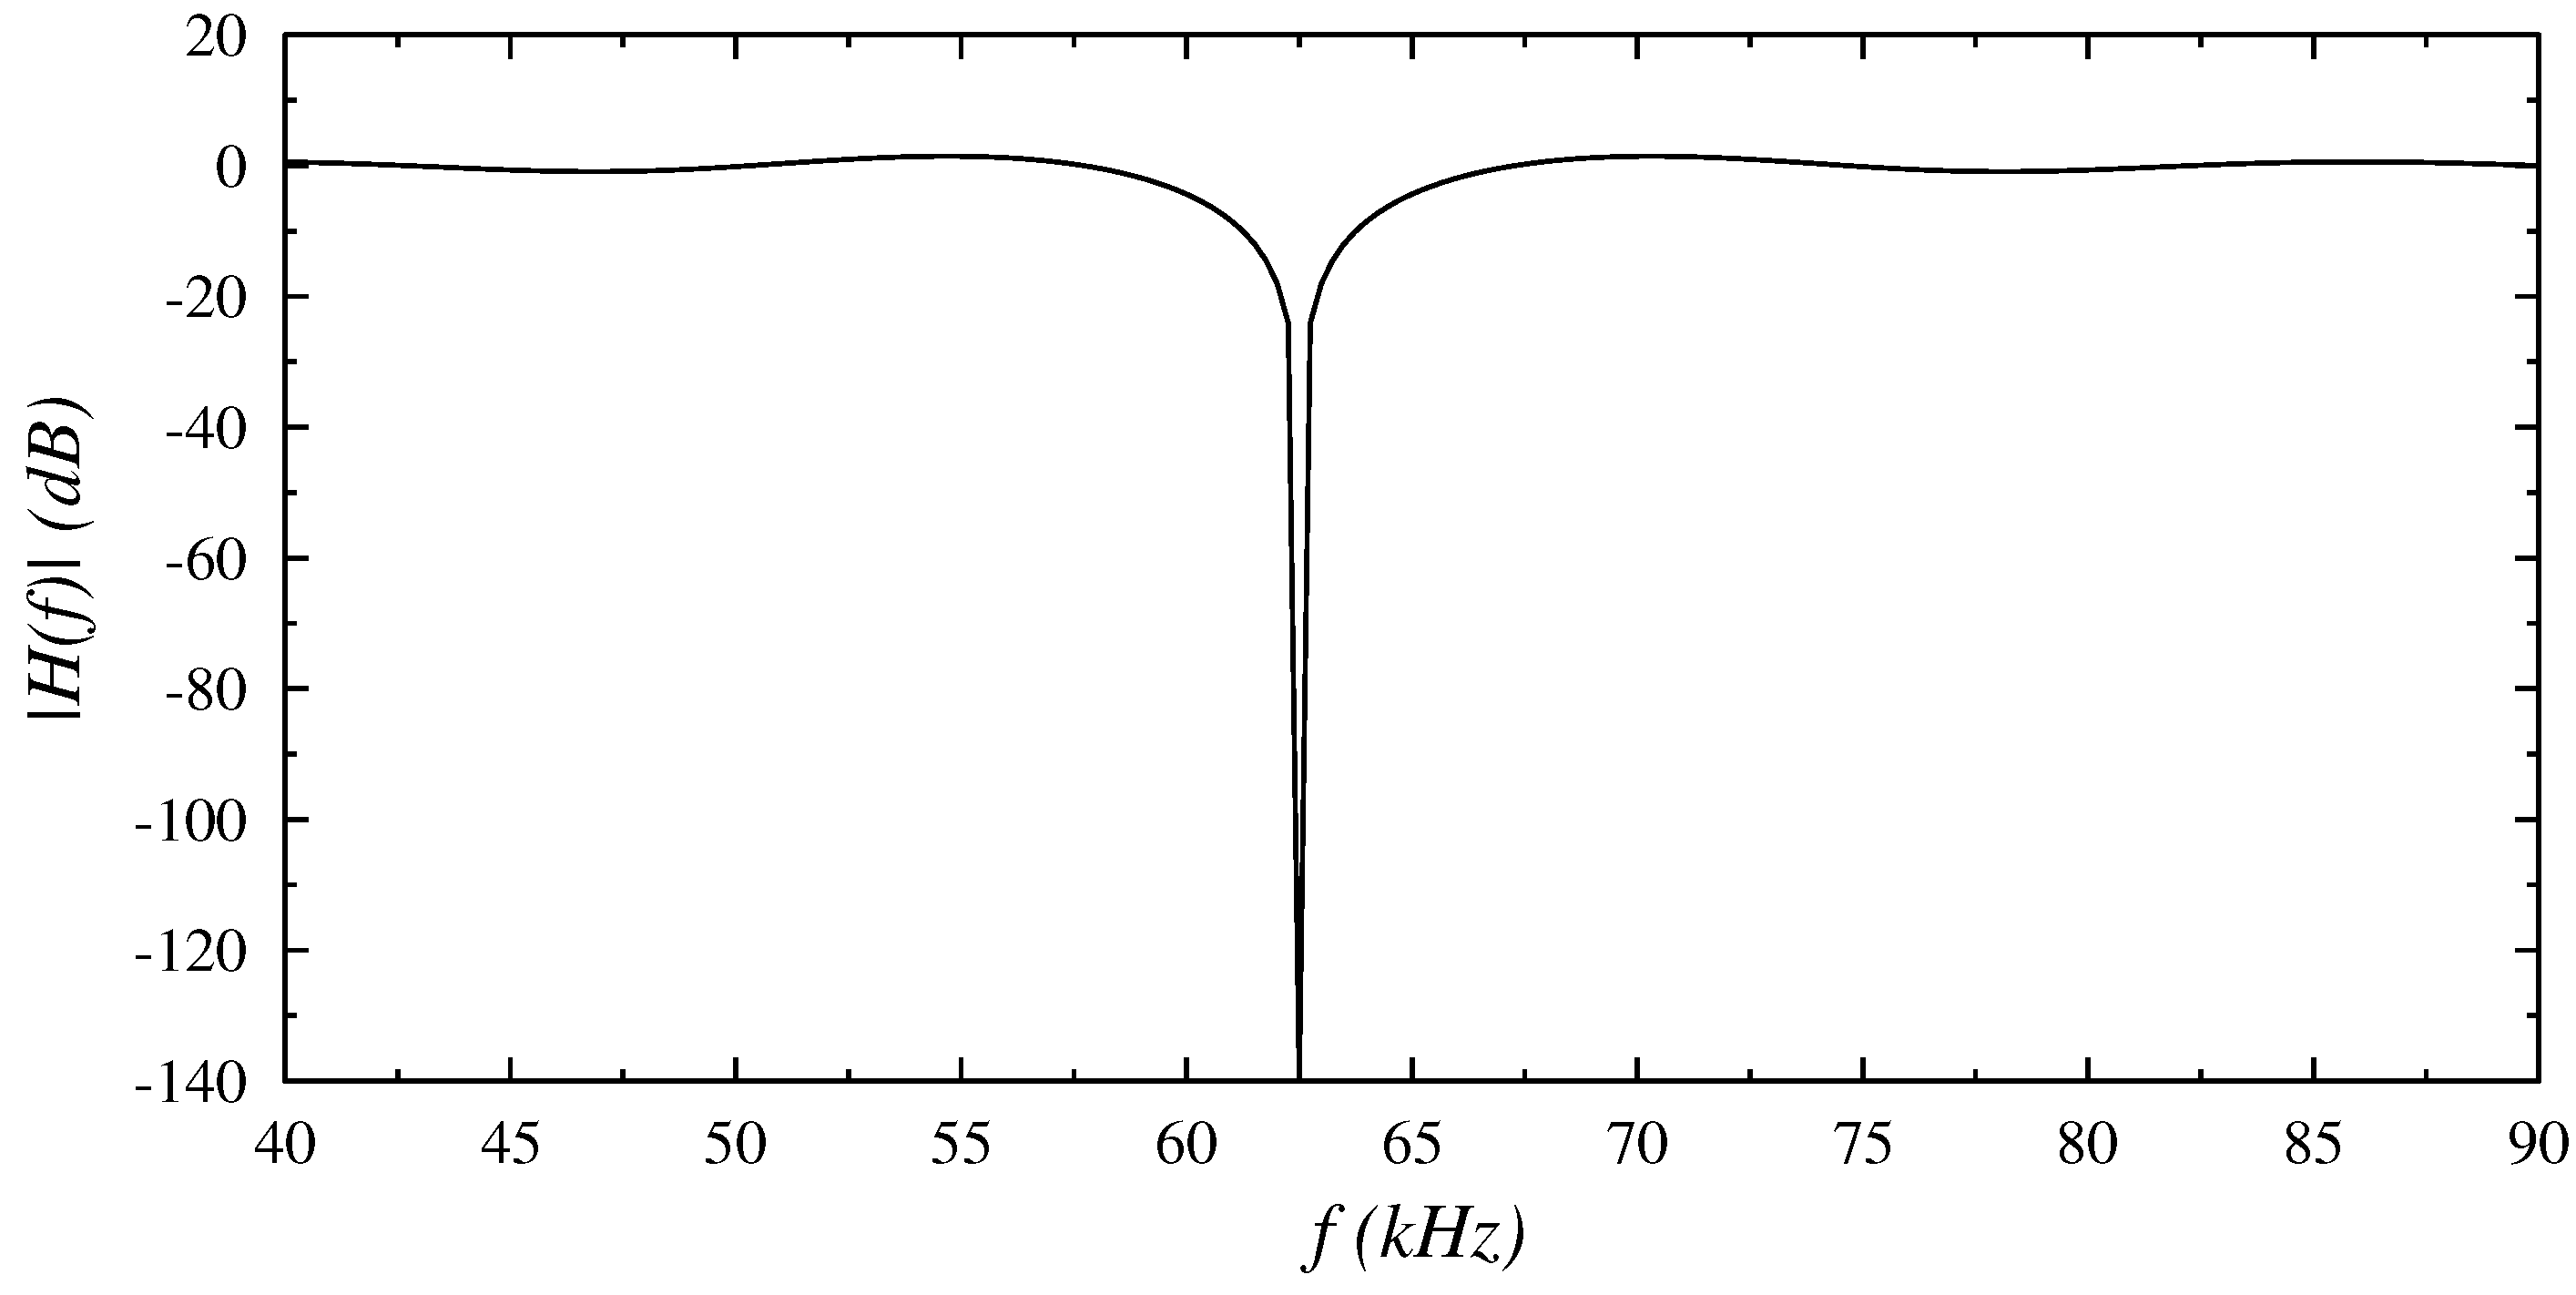
4.2.3. Abrupt Phase Shift Channel


| n | h[n] | n | h[n] | n | h[n] | n | h[n] |
|---|---|---|---|---|---|---|---|
| 0 | 4 | 8 | 12 | ||||
| 1 | 5 | 9 | 13 | ||||
| 2 | 6 | 10 | 14 | ||||
| 3 | 7 | 11 | 15 | ||||
| Remaining values of defined through symmetry: | |||||||

4.3. Channel Noise Models under Test
4.3.1. Additive White Gaussian Noise (AWGN) Generation
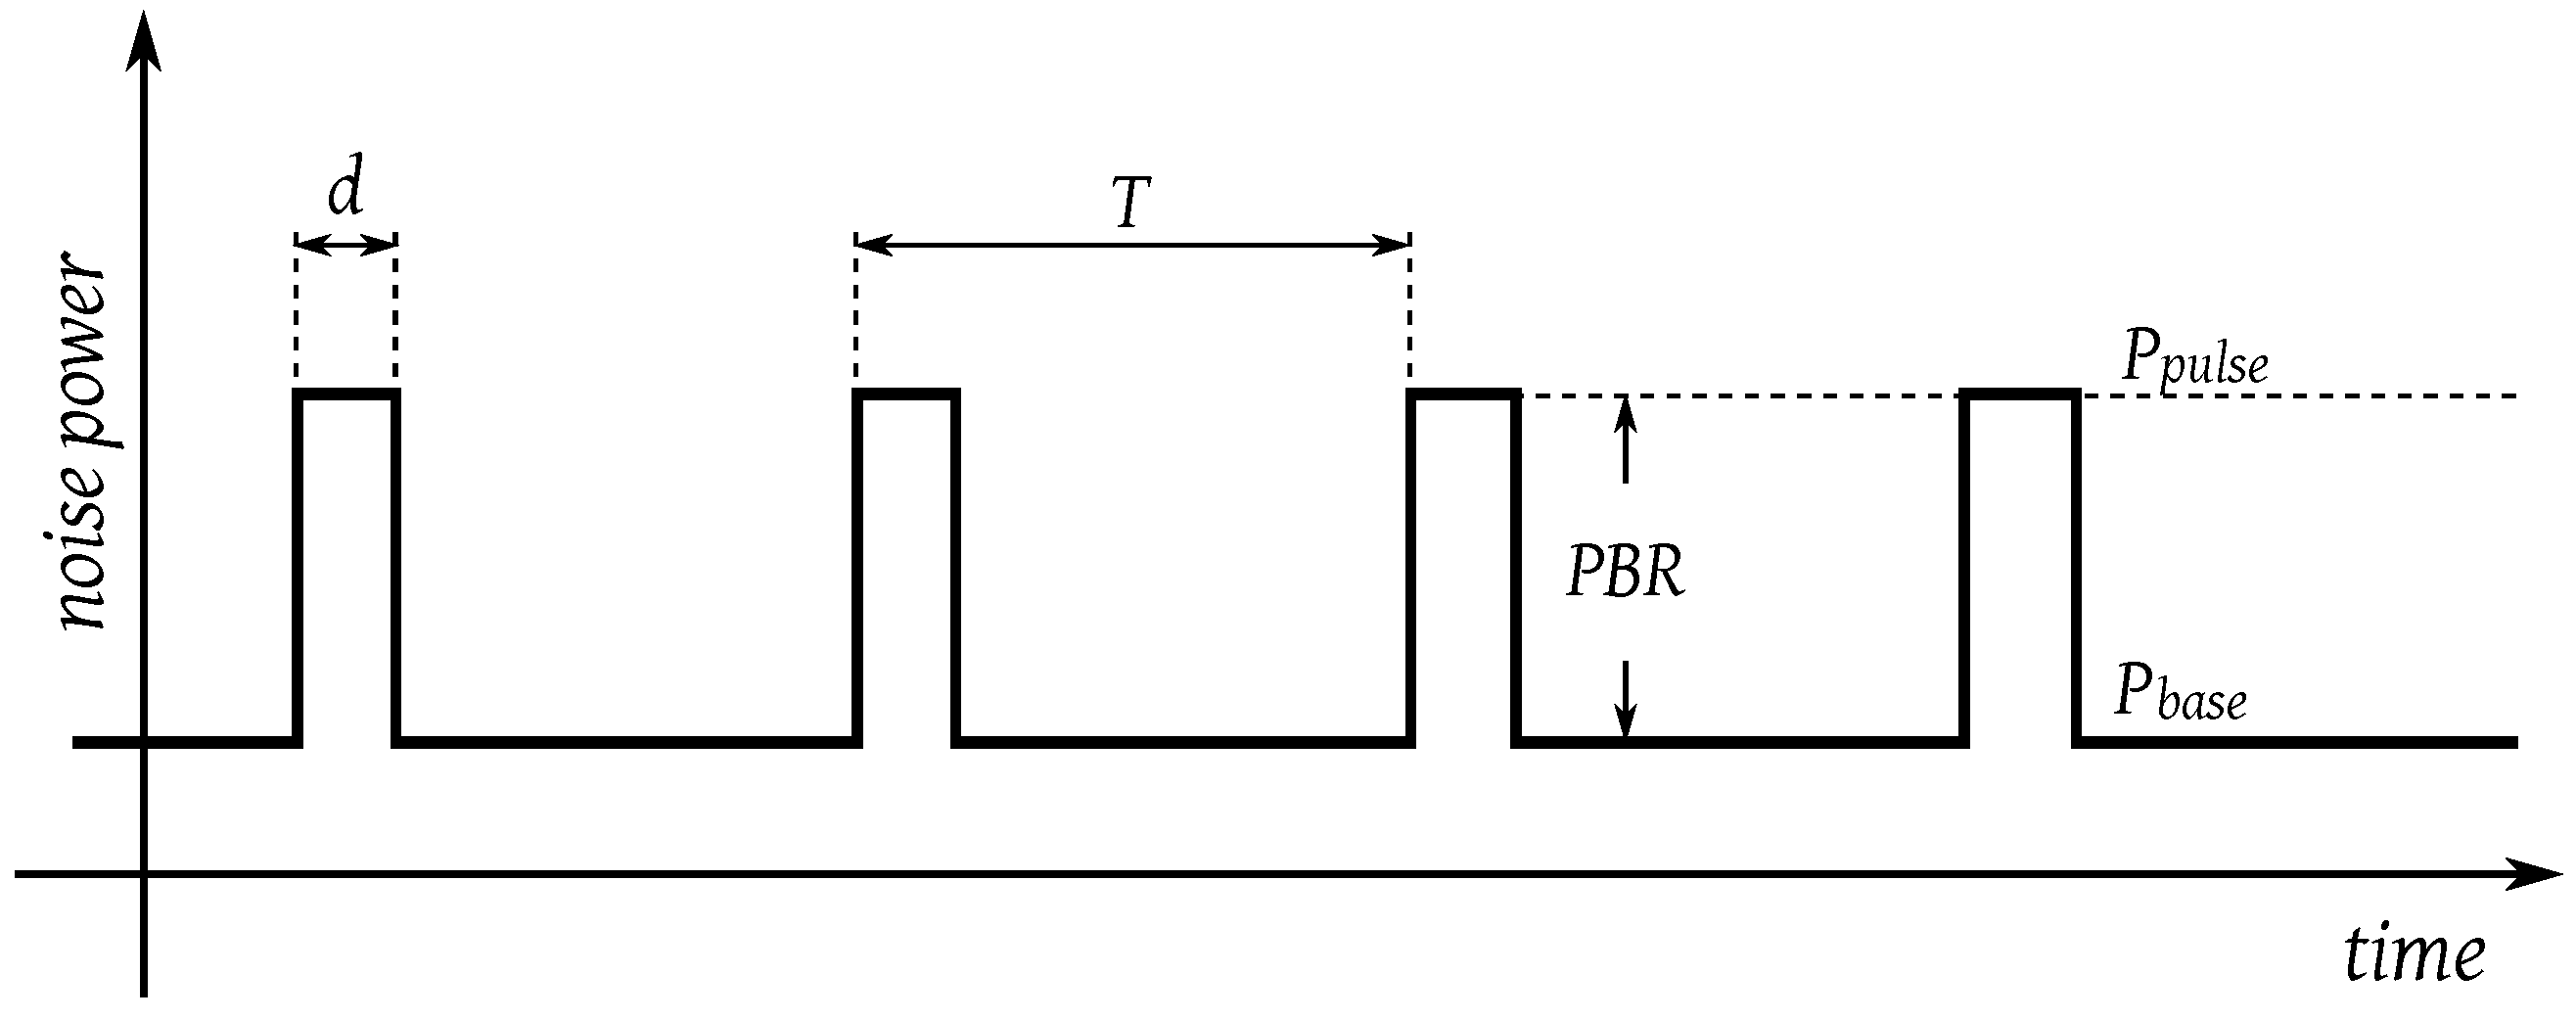
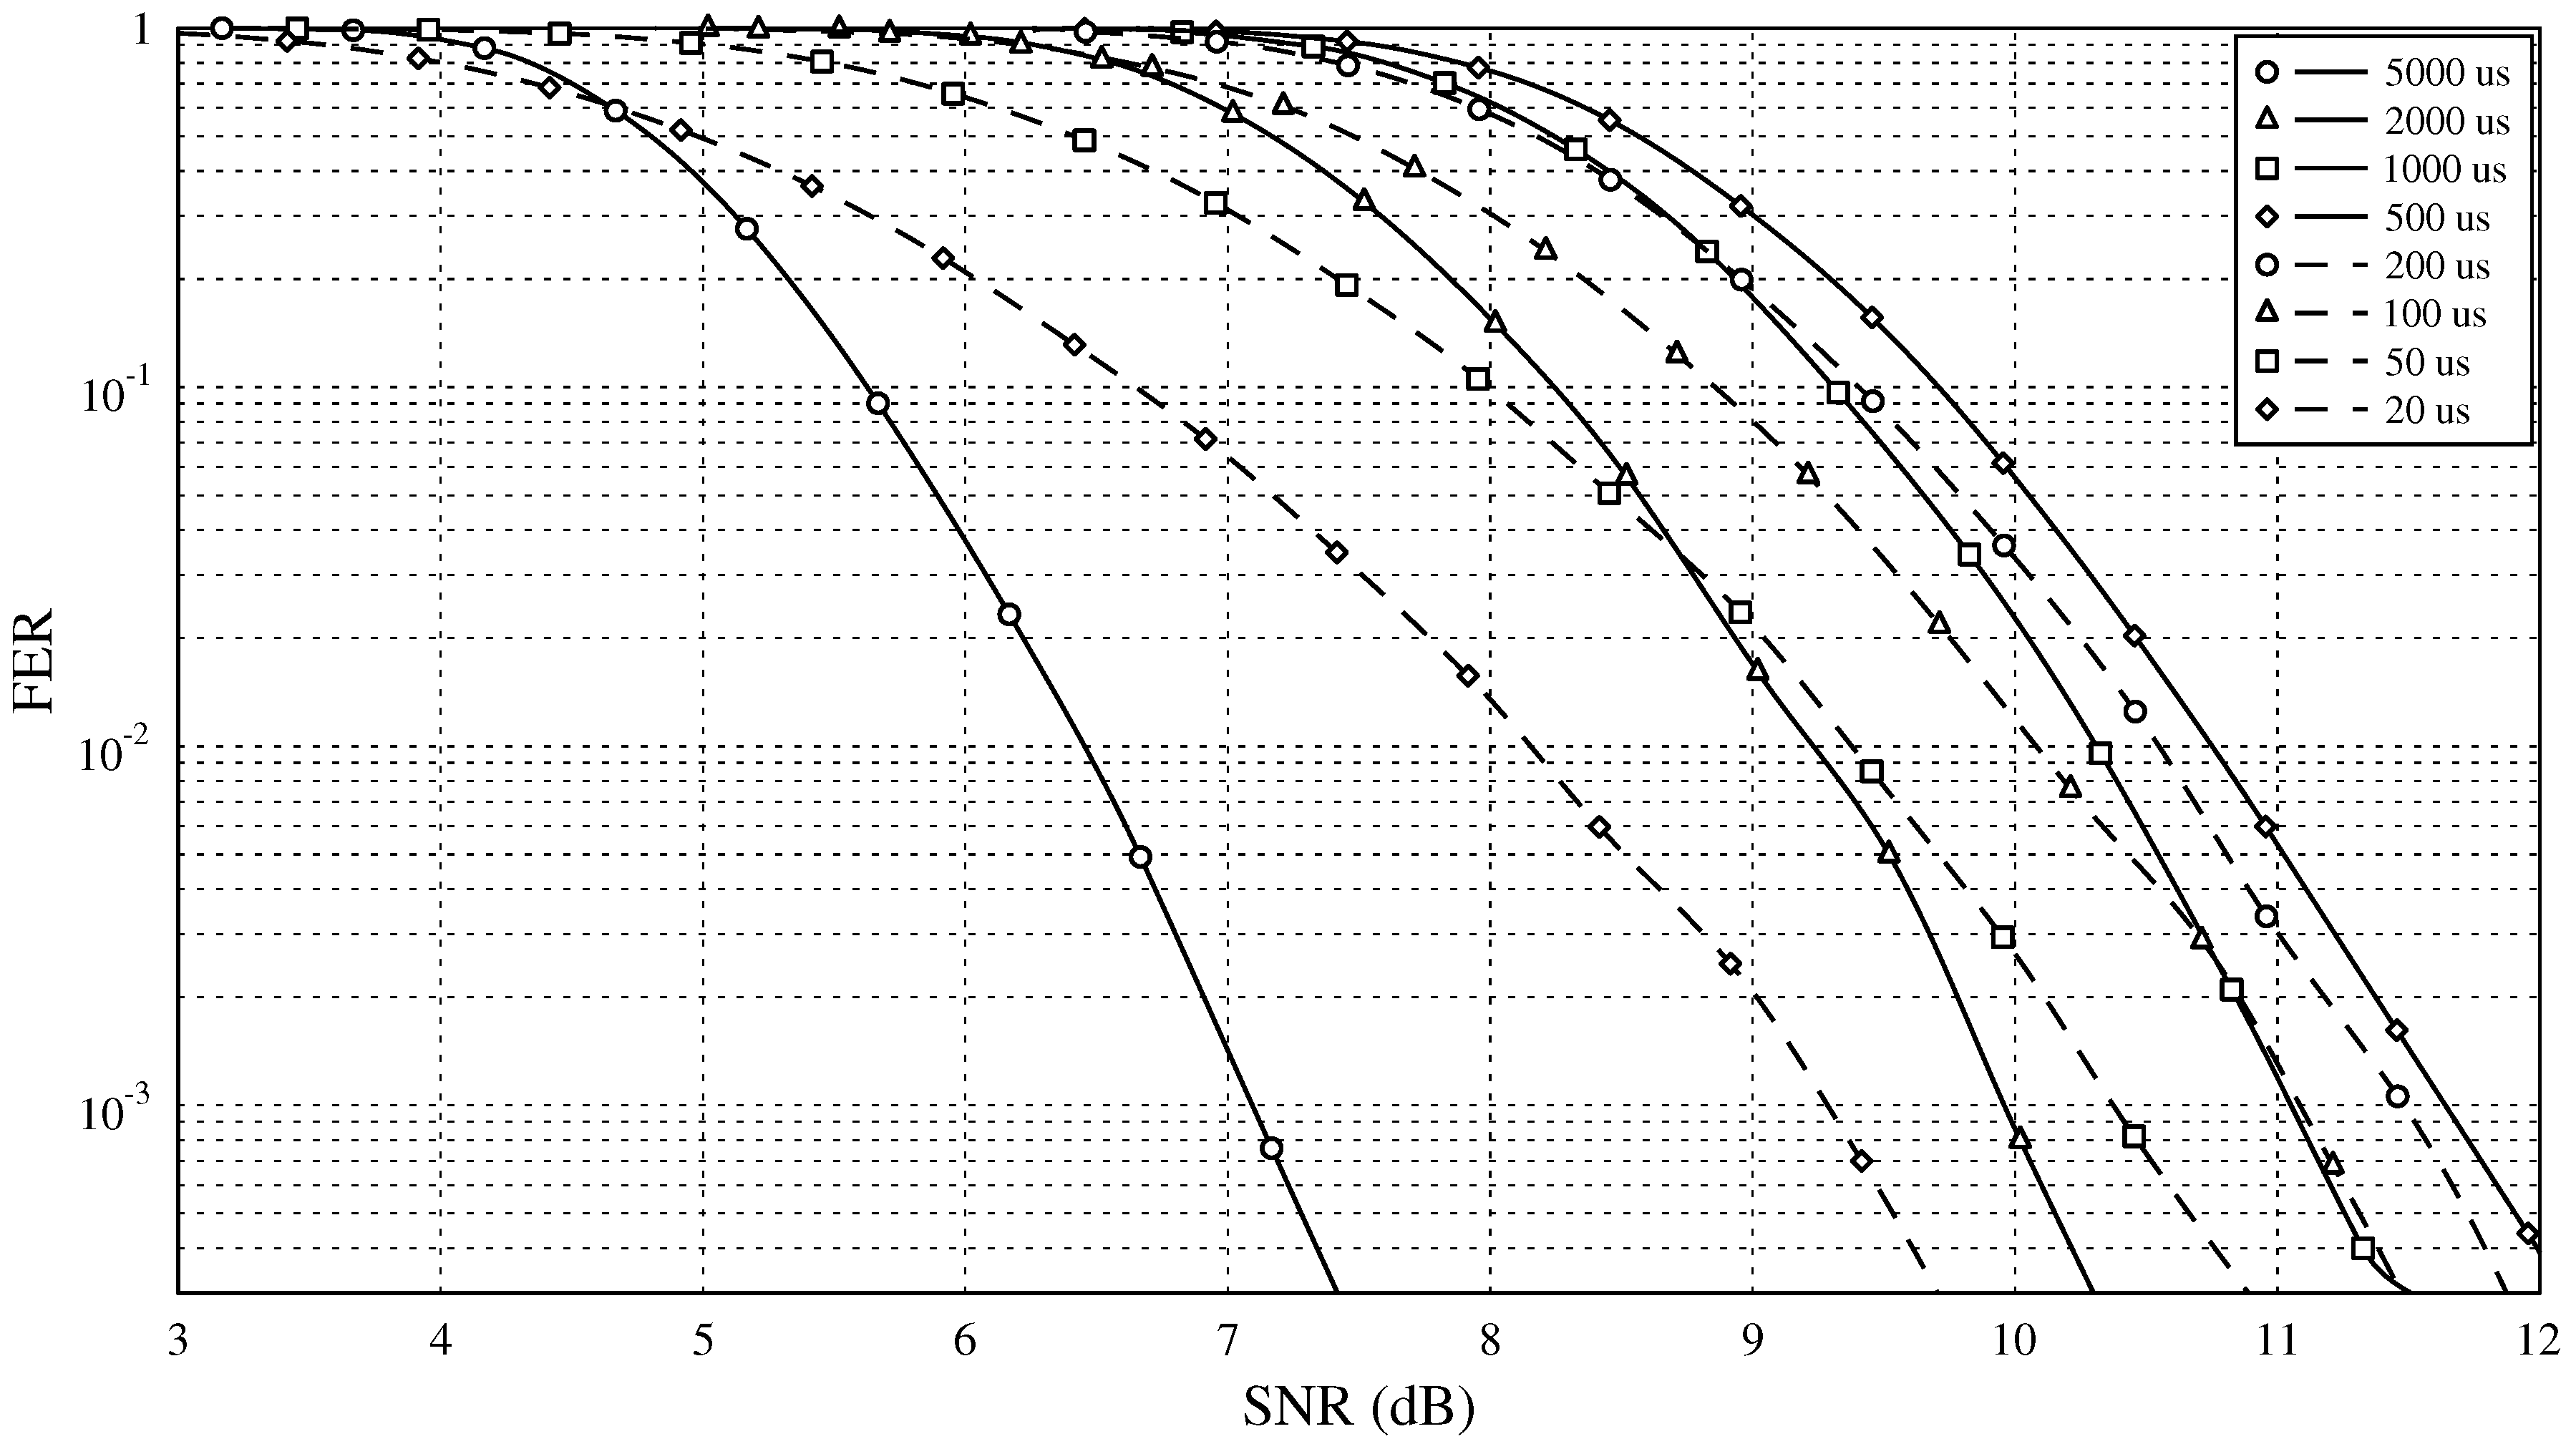
4.3.2. Synchronous Impulsive Noise
- Pulse to Base Ratio (). The ratio between the pulse power () and the base power () of the impulsive noise, configured in dB.
- Period (T). The period between pulses can be configured in μs.
- Duration (d). The duration of each pulse can be configured in μs.

4.4. Precision of the Simulations
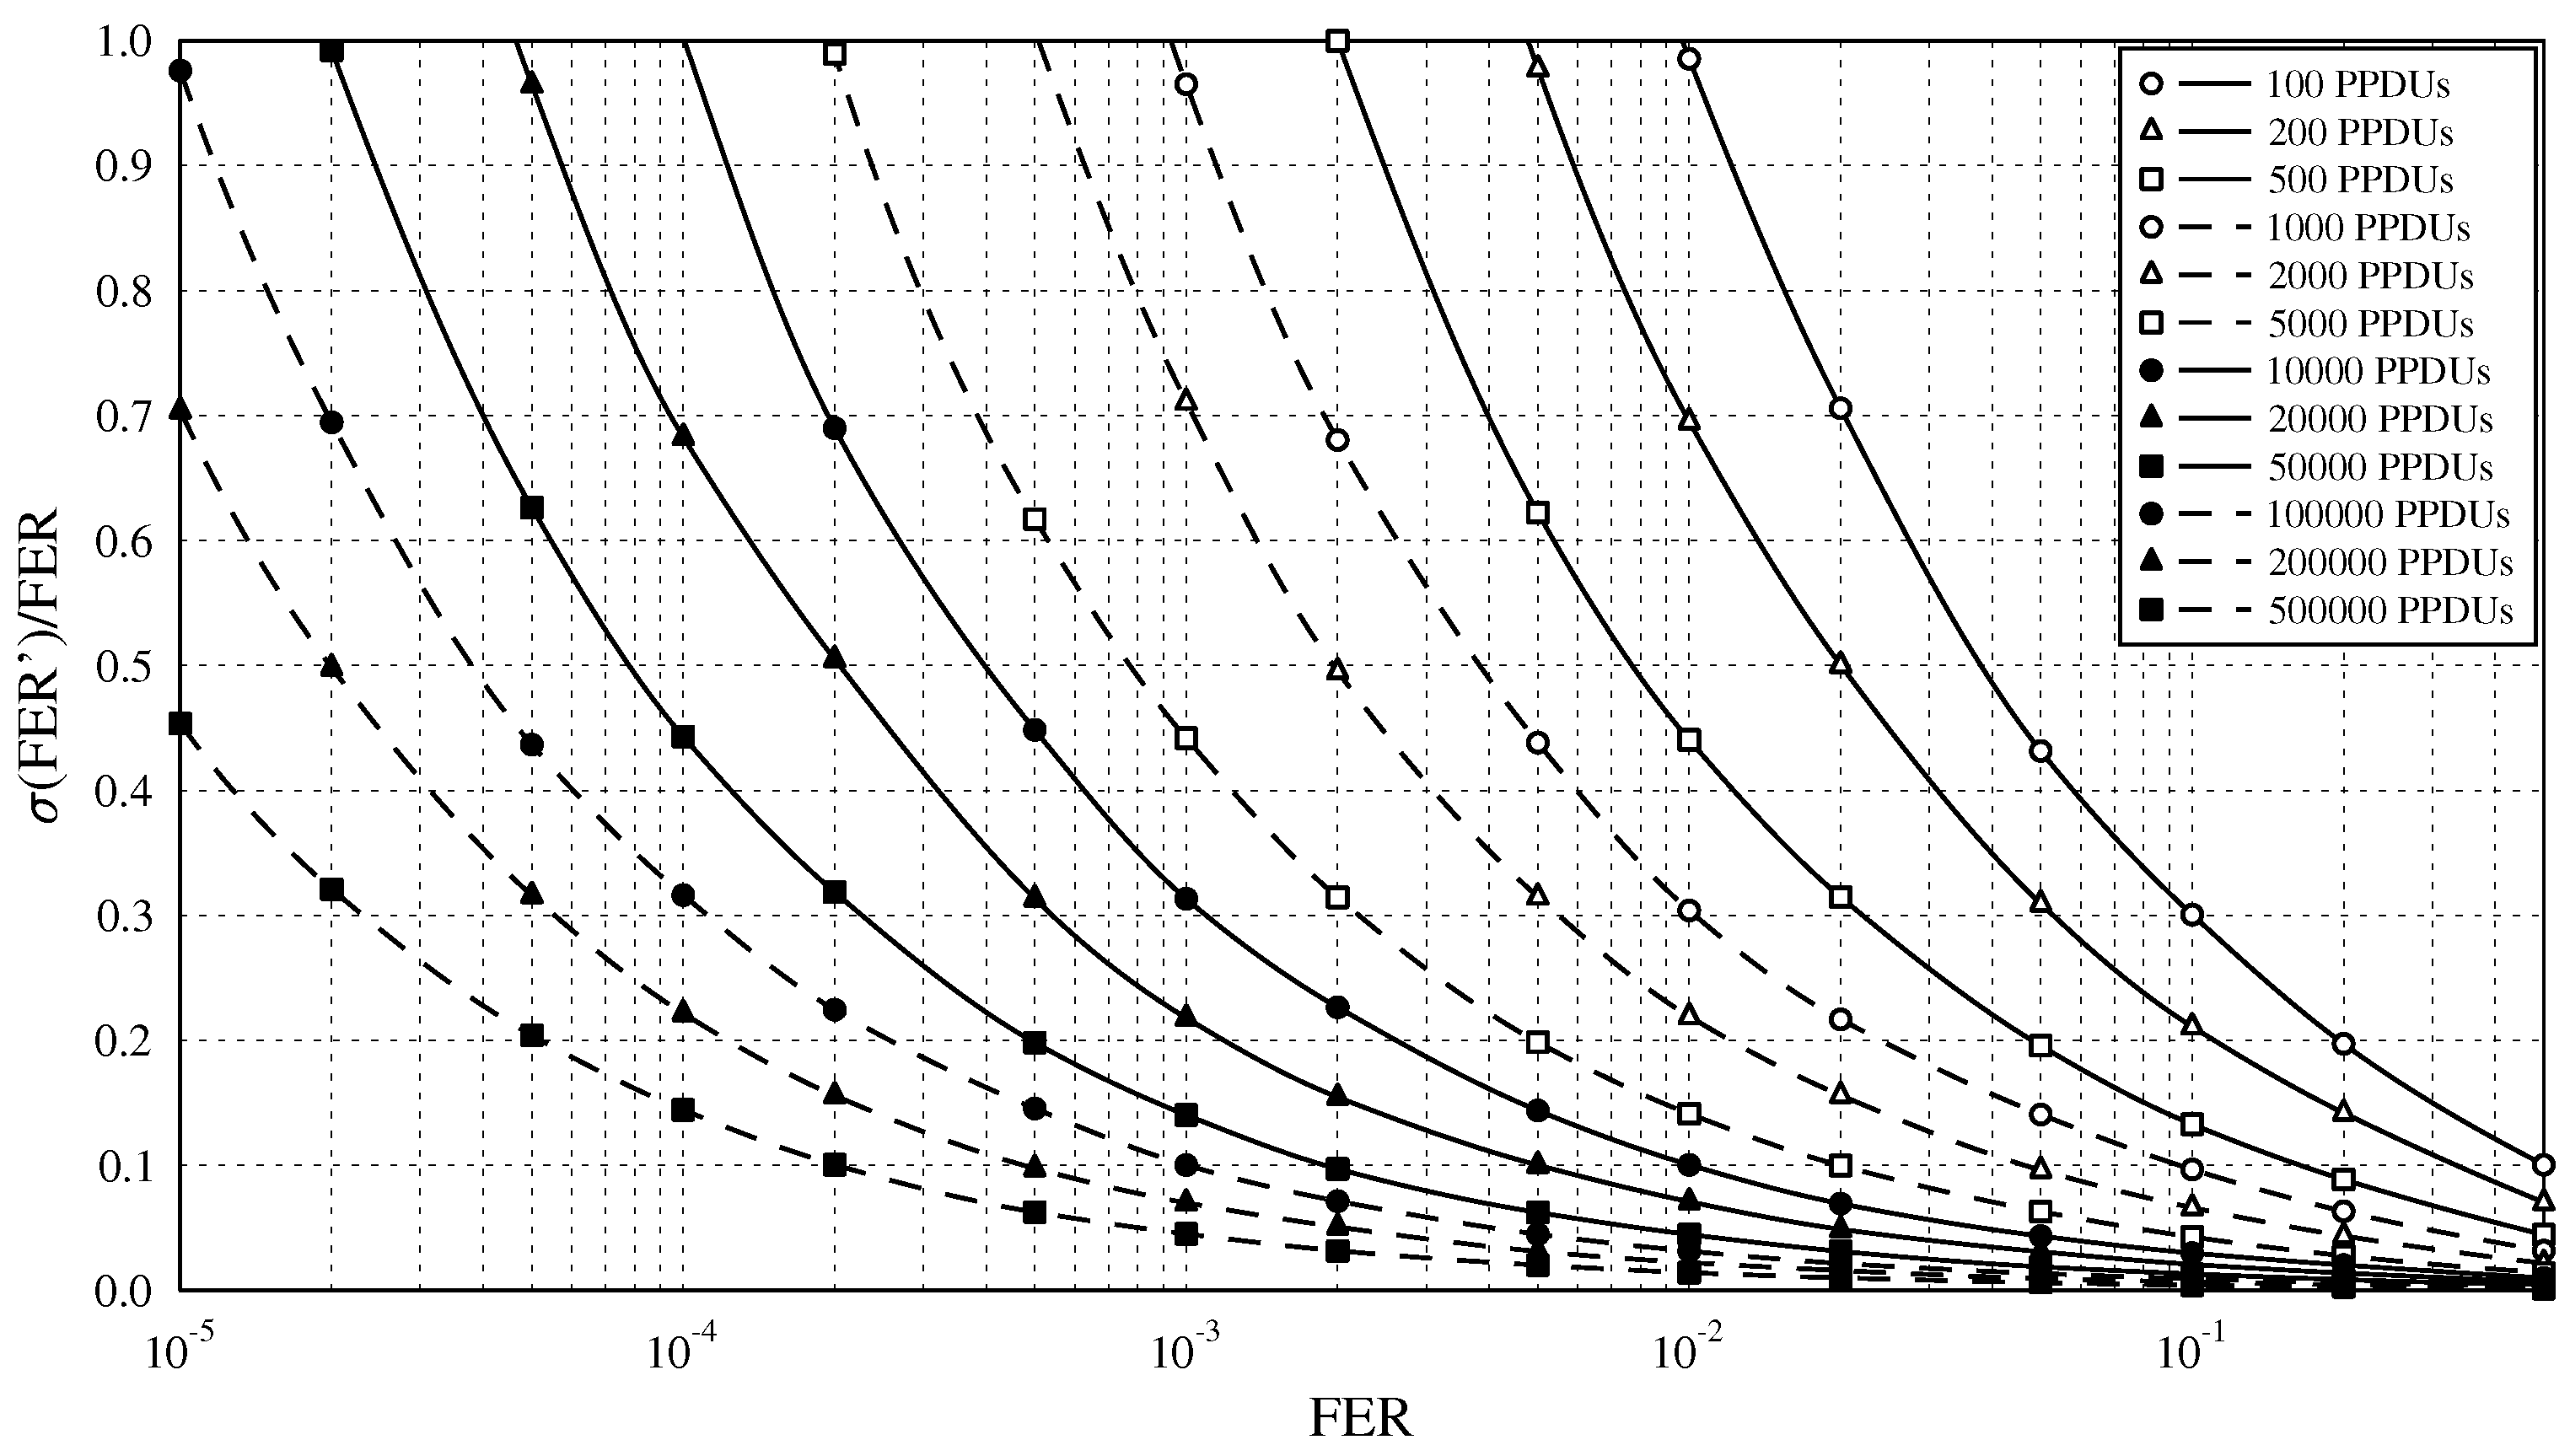
4.4.1. FER Precision and Number of PPDUs
- . This FER value is considered the minimum acceptable value so communication can be started. Although many losses are expected, communication is feasible in this environment. Since it is a minimum value, it is unlikely that at Medium Access Control (MAC) level one device with this PPDUs loss rate could become a repeater for others and keep a stable topology. Some narrowband PLC technologies make their sensitivity limit for , such as [20].
- . This FER value is used for some narrowband technologies as the quality threshold for good communication. Reference [21] considers this threshold for PLC communication without errors (considering that this percentage of errors will be solved by higher layers).
- . This more restrictive FER value is considered a satisfactory FER for the performance of this technology. One device operating with this amount of FER can behave thoroughly as a repeater. The PRIME Alliance uses this value as its threshold in reference [22].

4.4.2. SNR Precision and SNR Range for Each Test
4.4.3. Tests Execution
5. Methodology
5.1. Channel Simulation Environment with Full Transmitter-Receiver
5.2. Configurations under Test
- AWGN channel test. It is a test of the whole transmission and reception chain with a flat channel and AWGN noise. It is the base reference test, used as a reference for the rest of the performed tests, to relate how changes in the different parameters affect the system behavior. Results are described in Section 6.1.
- Synchronous impulsive Noise channel test. The test inserts in the propagation channel synchronous impulsive noise of variable duration. This test aims at evaluating the robustness of the system to synchronous impulsive noises of different temporal distribution of the noise power. Results are described in Section 6.2.
- Selective channel test. The purpose of this test is to check the robustness of the communications in the presence of an important attenuation on some of the subcarriers. Results are described in Section 6.3.
- Abrupt Phase channel test. For this particular channel, the distortion to be tested is an abrupt phase shift of in the center of the band. Results are described in Section 6.4.
| Test Configuration | Channel Response | Noise Model | Subcarrier Modulation | PSDU Length |
|---|---|---|---|---|
| Channel simulation TX-RX | ||||
| - AWGN | Flat | AWGN | All | 256 bytes |
| - Impulsive Noise | Flat | Impulsive | 256 bytes | |
| - Selective Channel | Selective | AWGN | – | 256 bytes |
| - Abrupt Phase Channel | Abrupt Phase | AWGN | – | 256 bytes |
6. Results
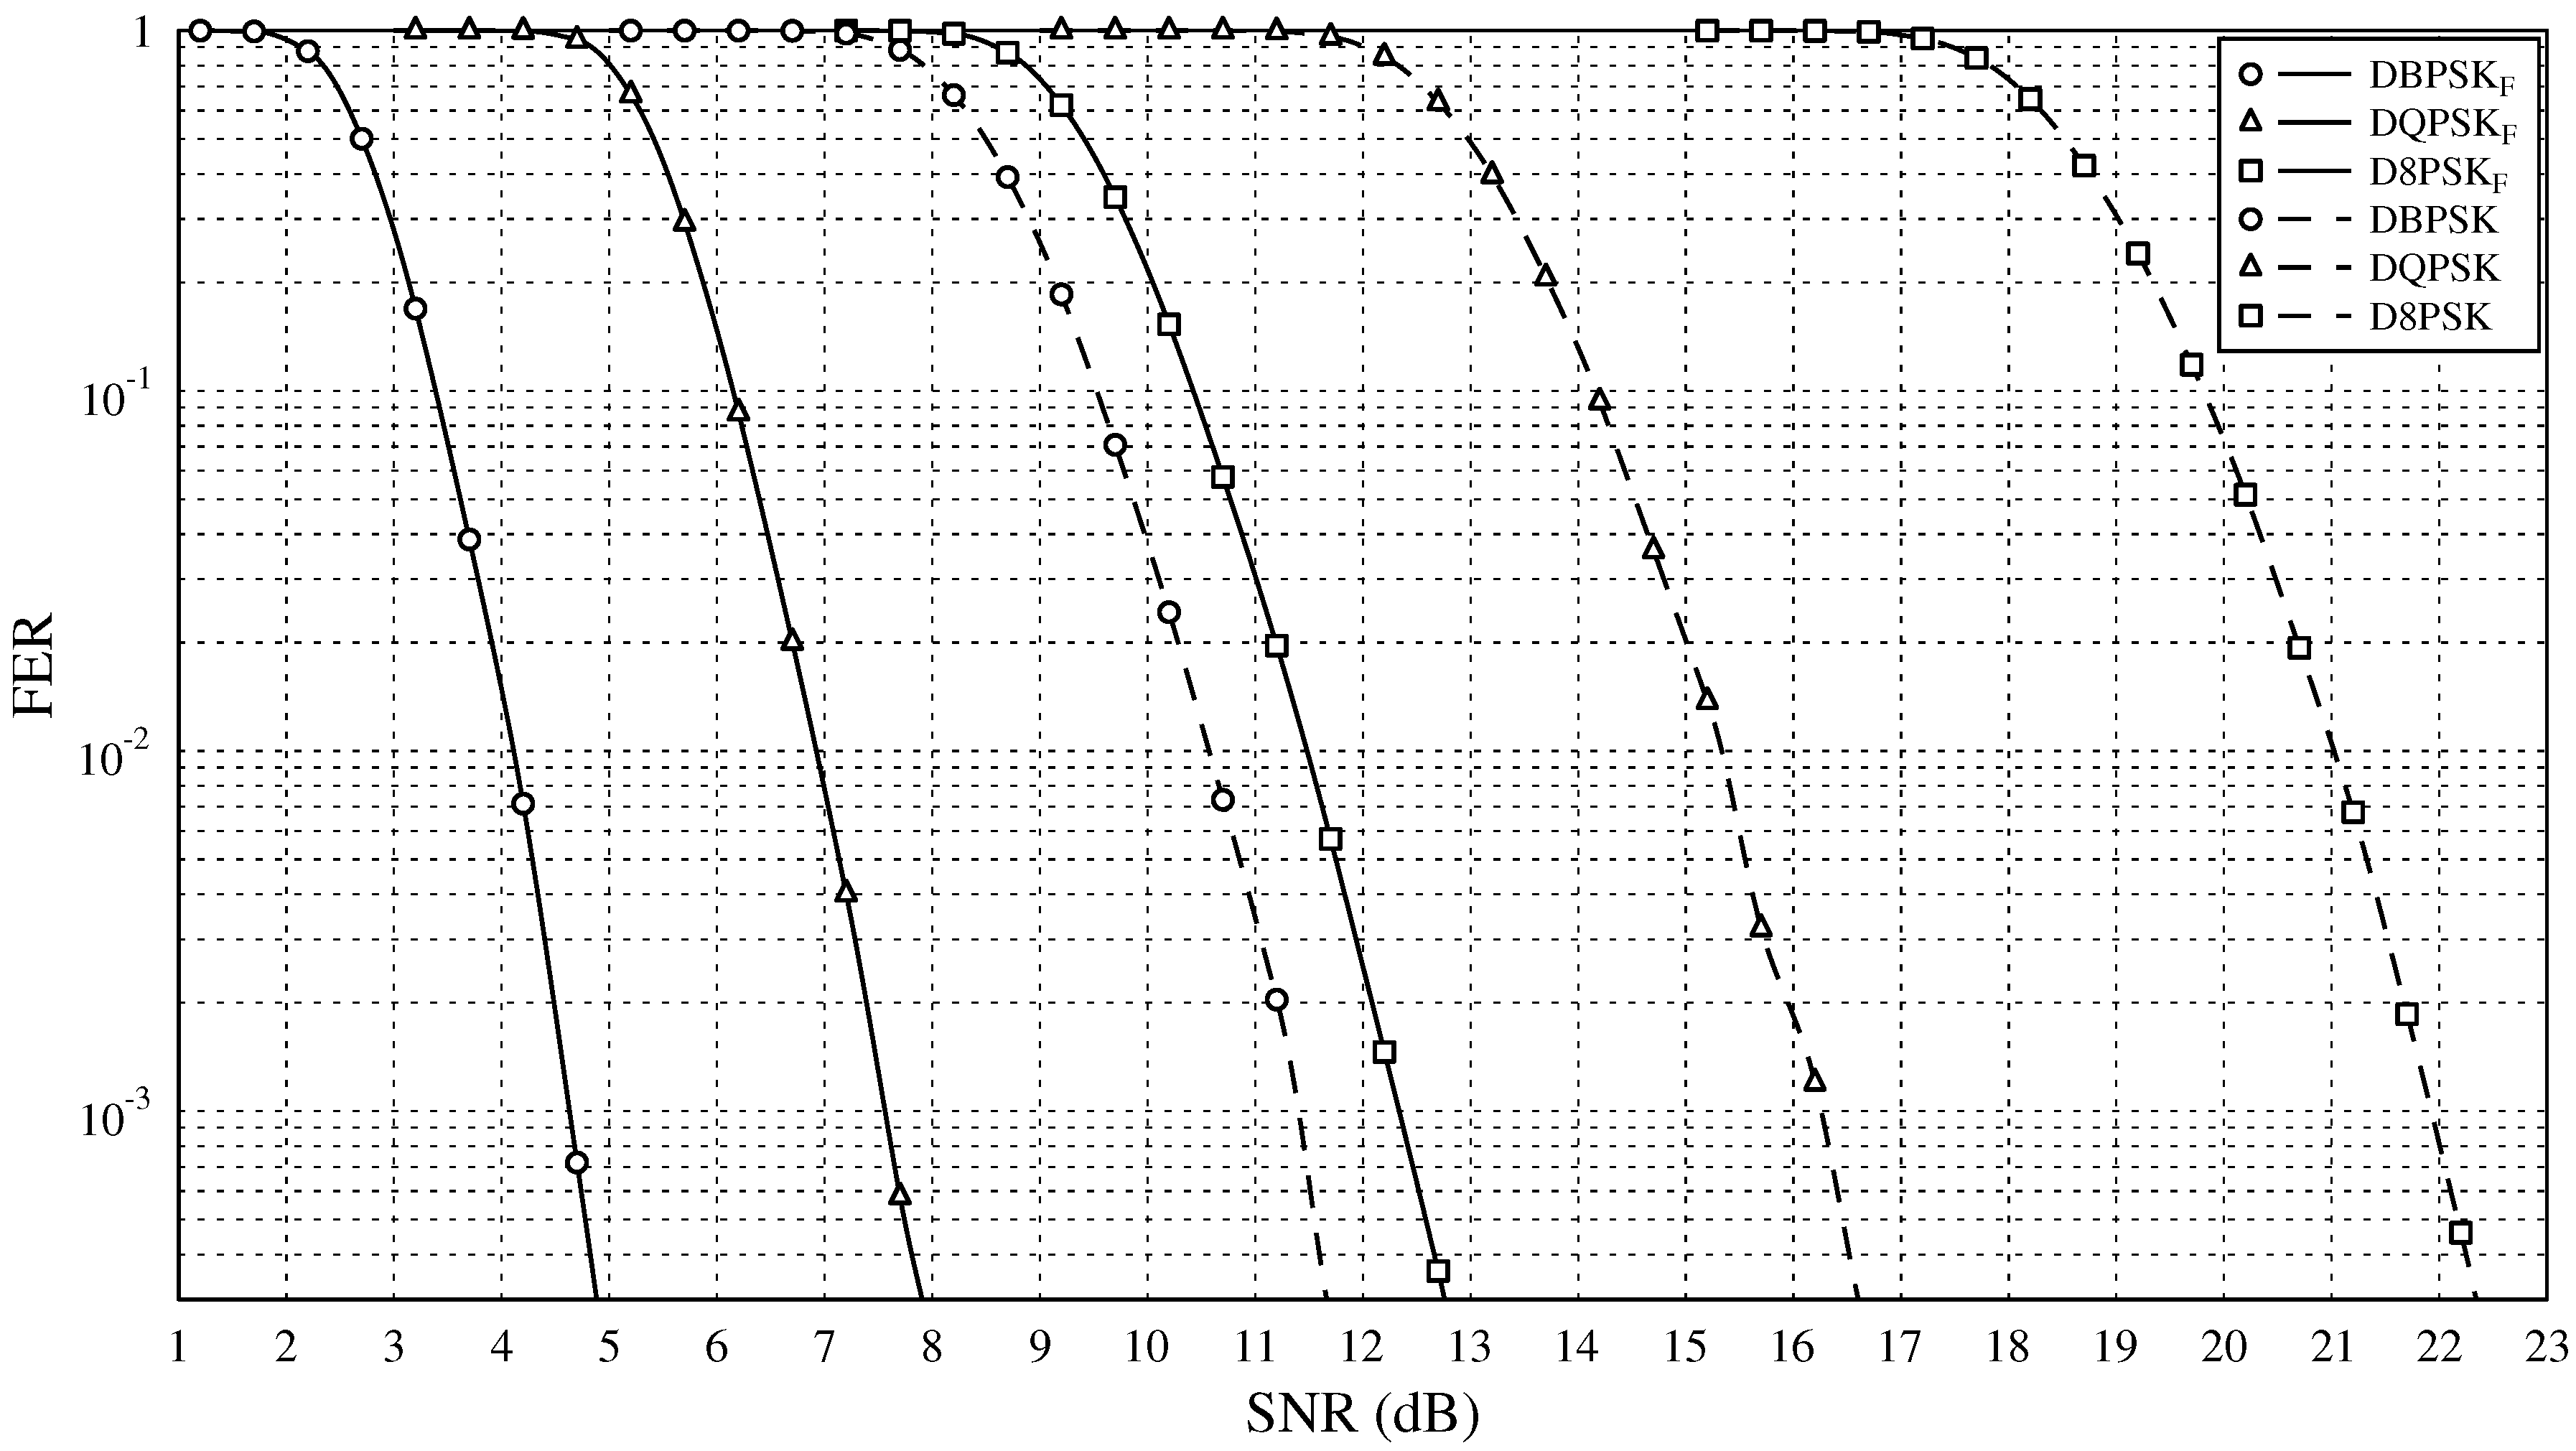
6.1. AWGN

6.2. Synchronous Impulsive Noise
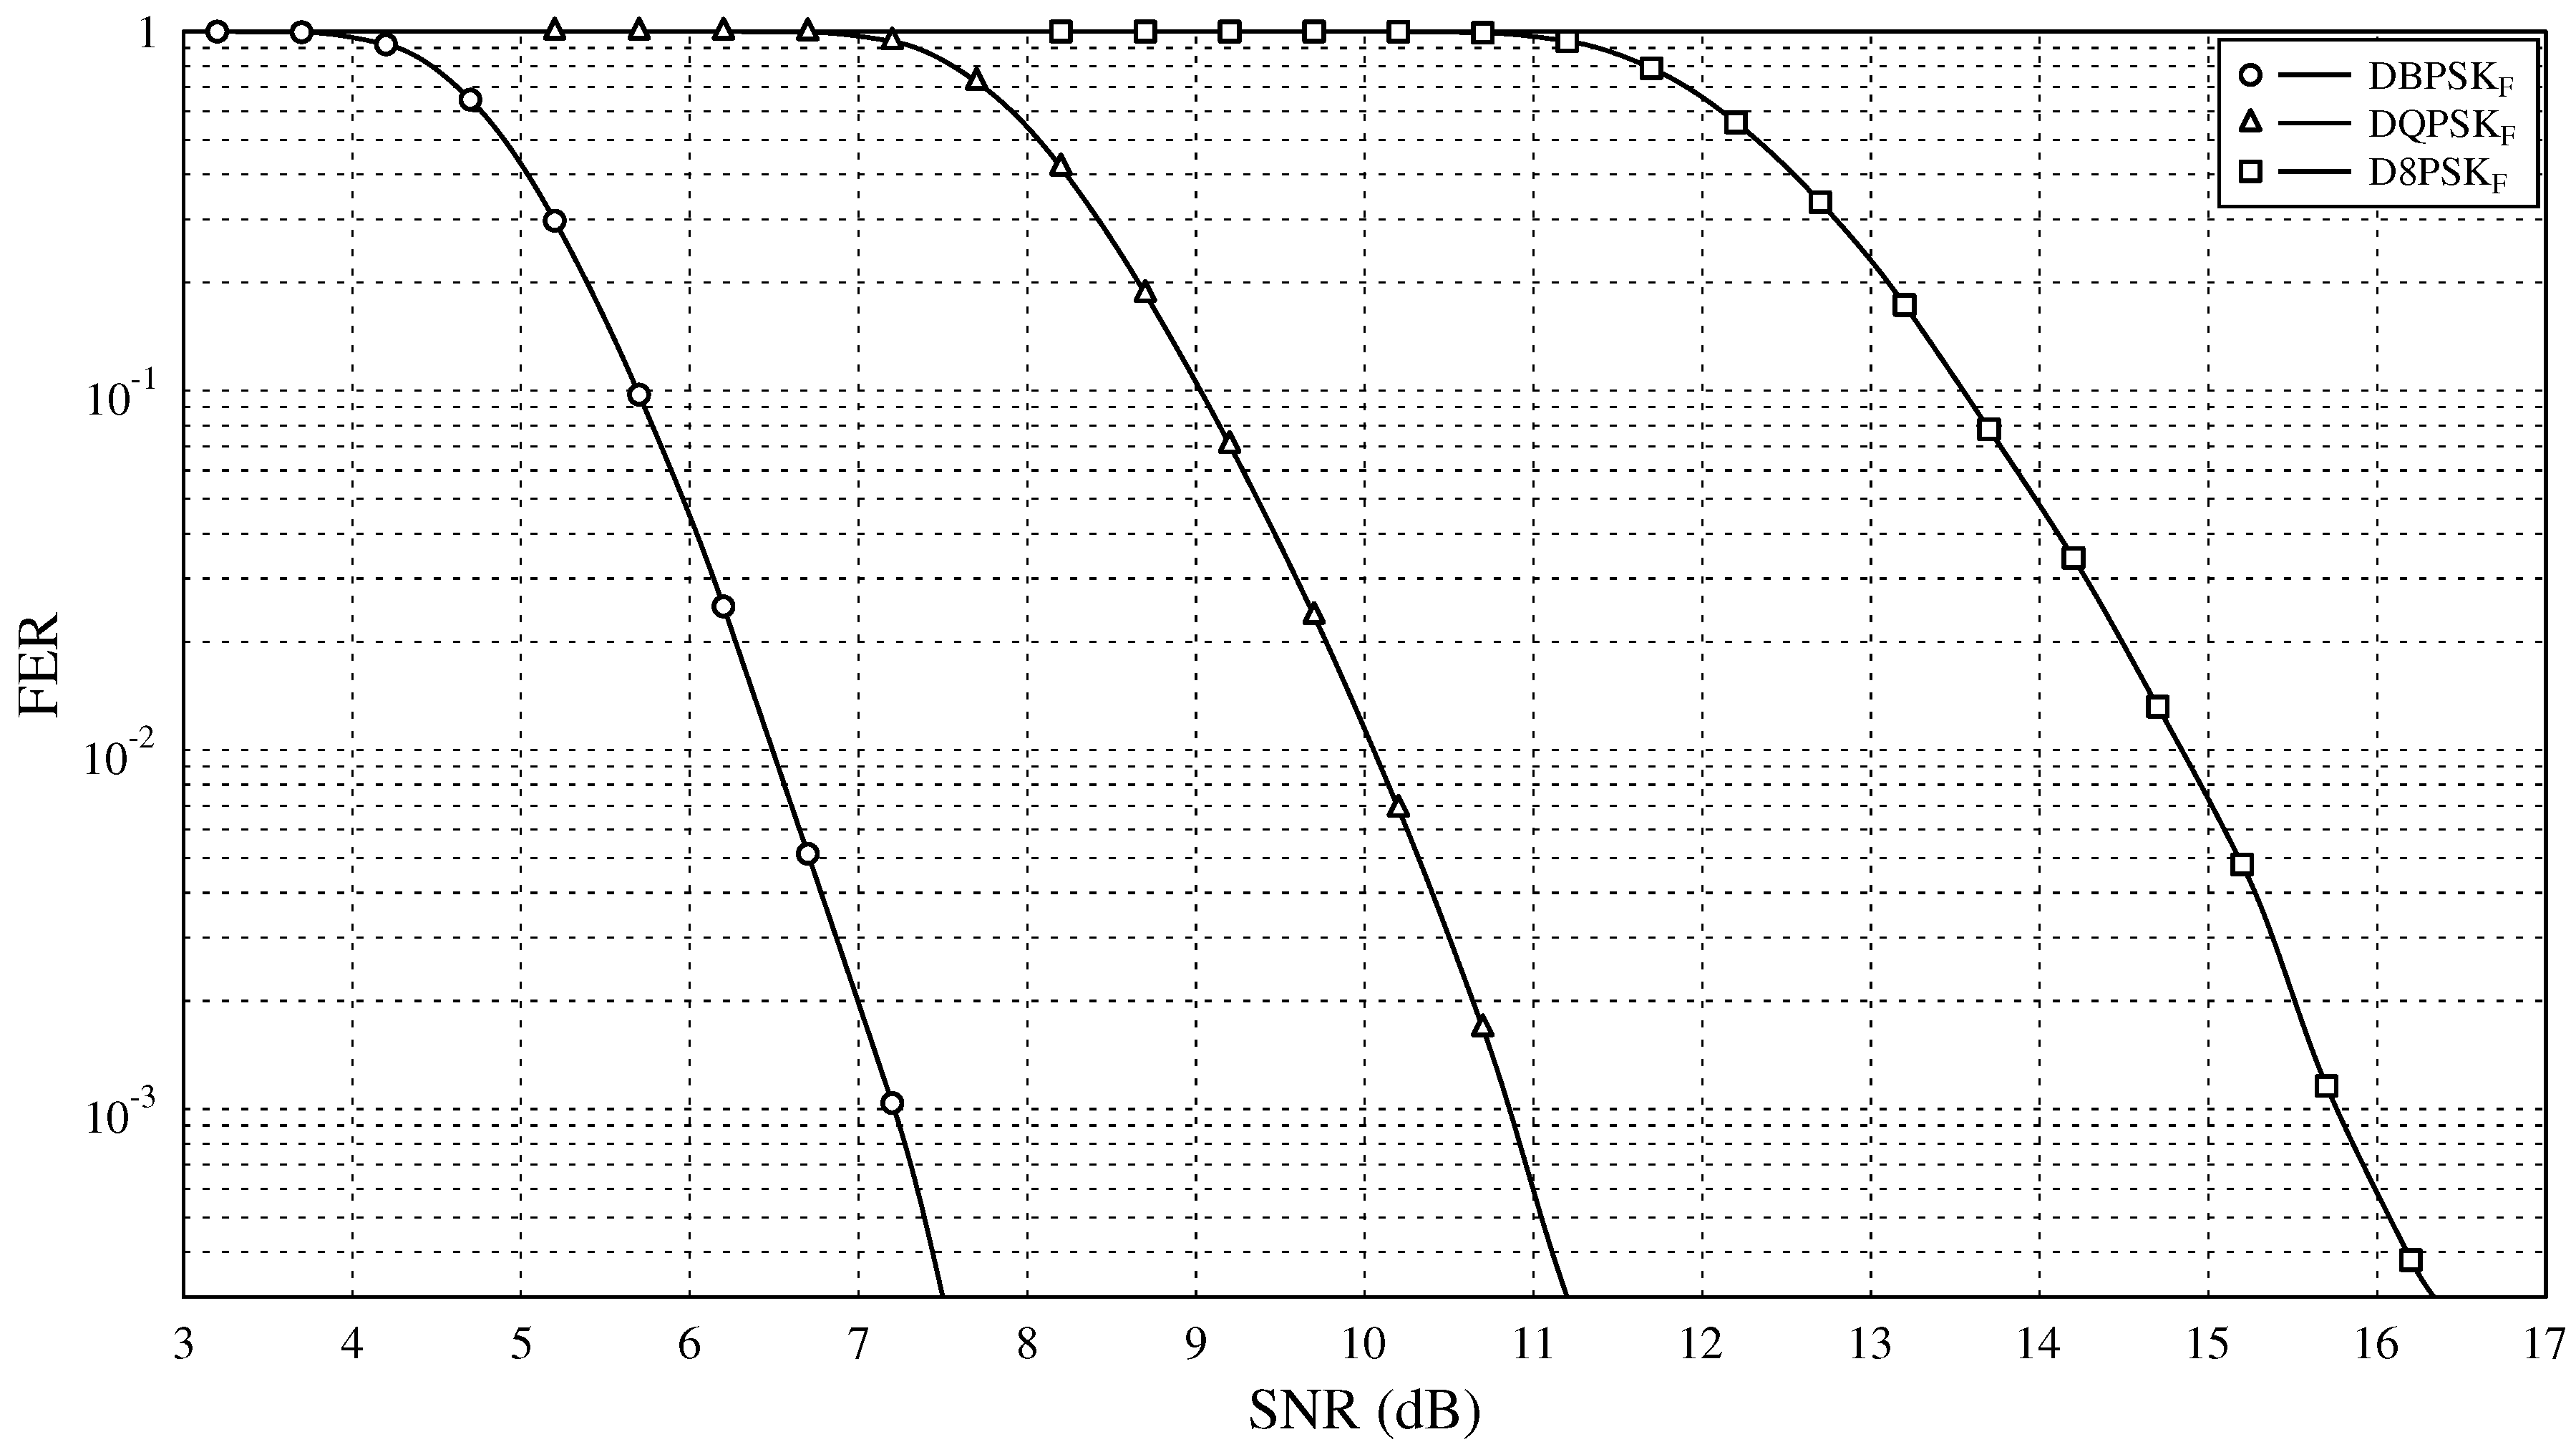
6.3. Frequency Selective Channel

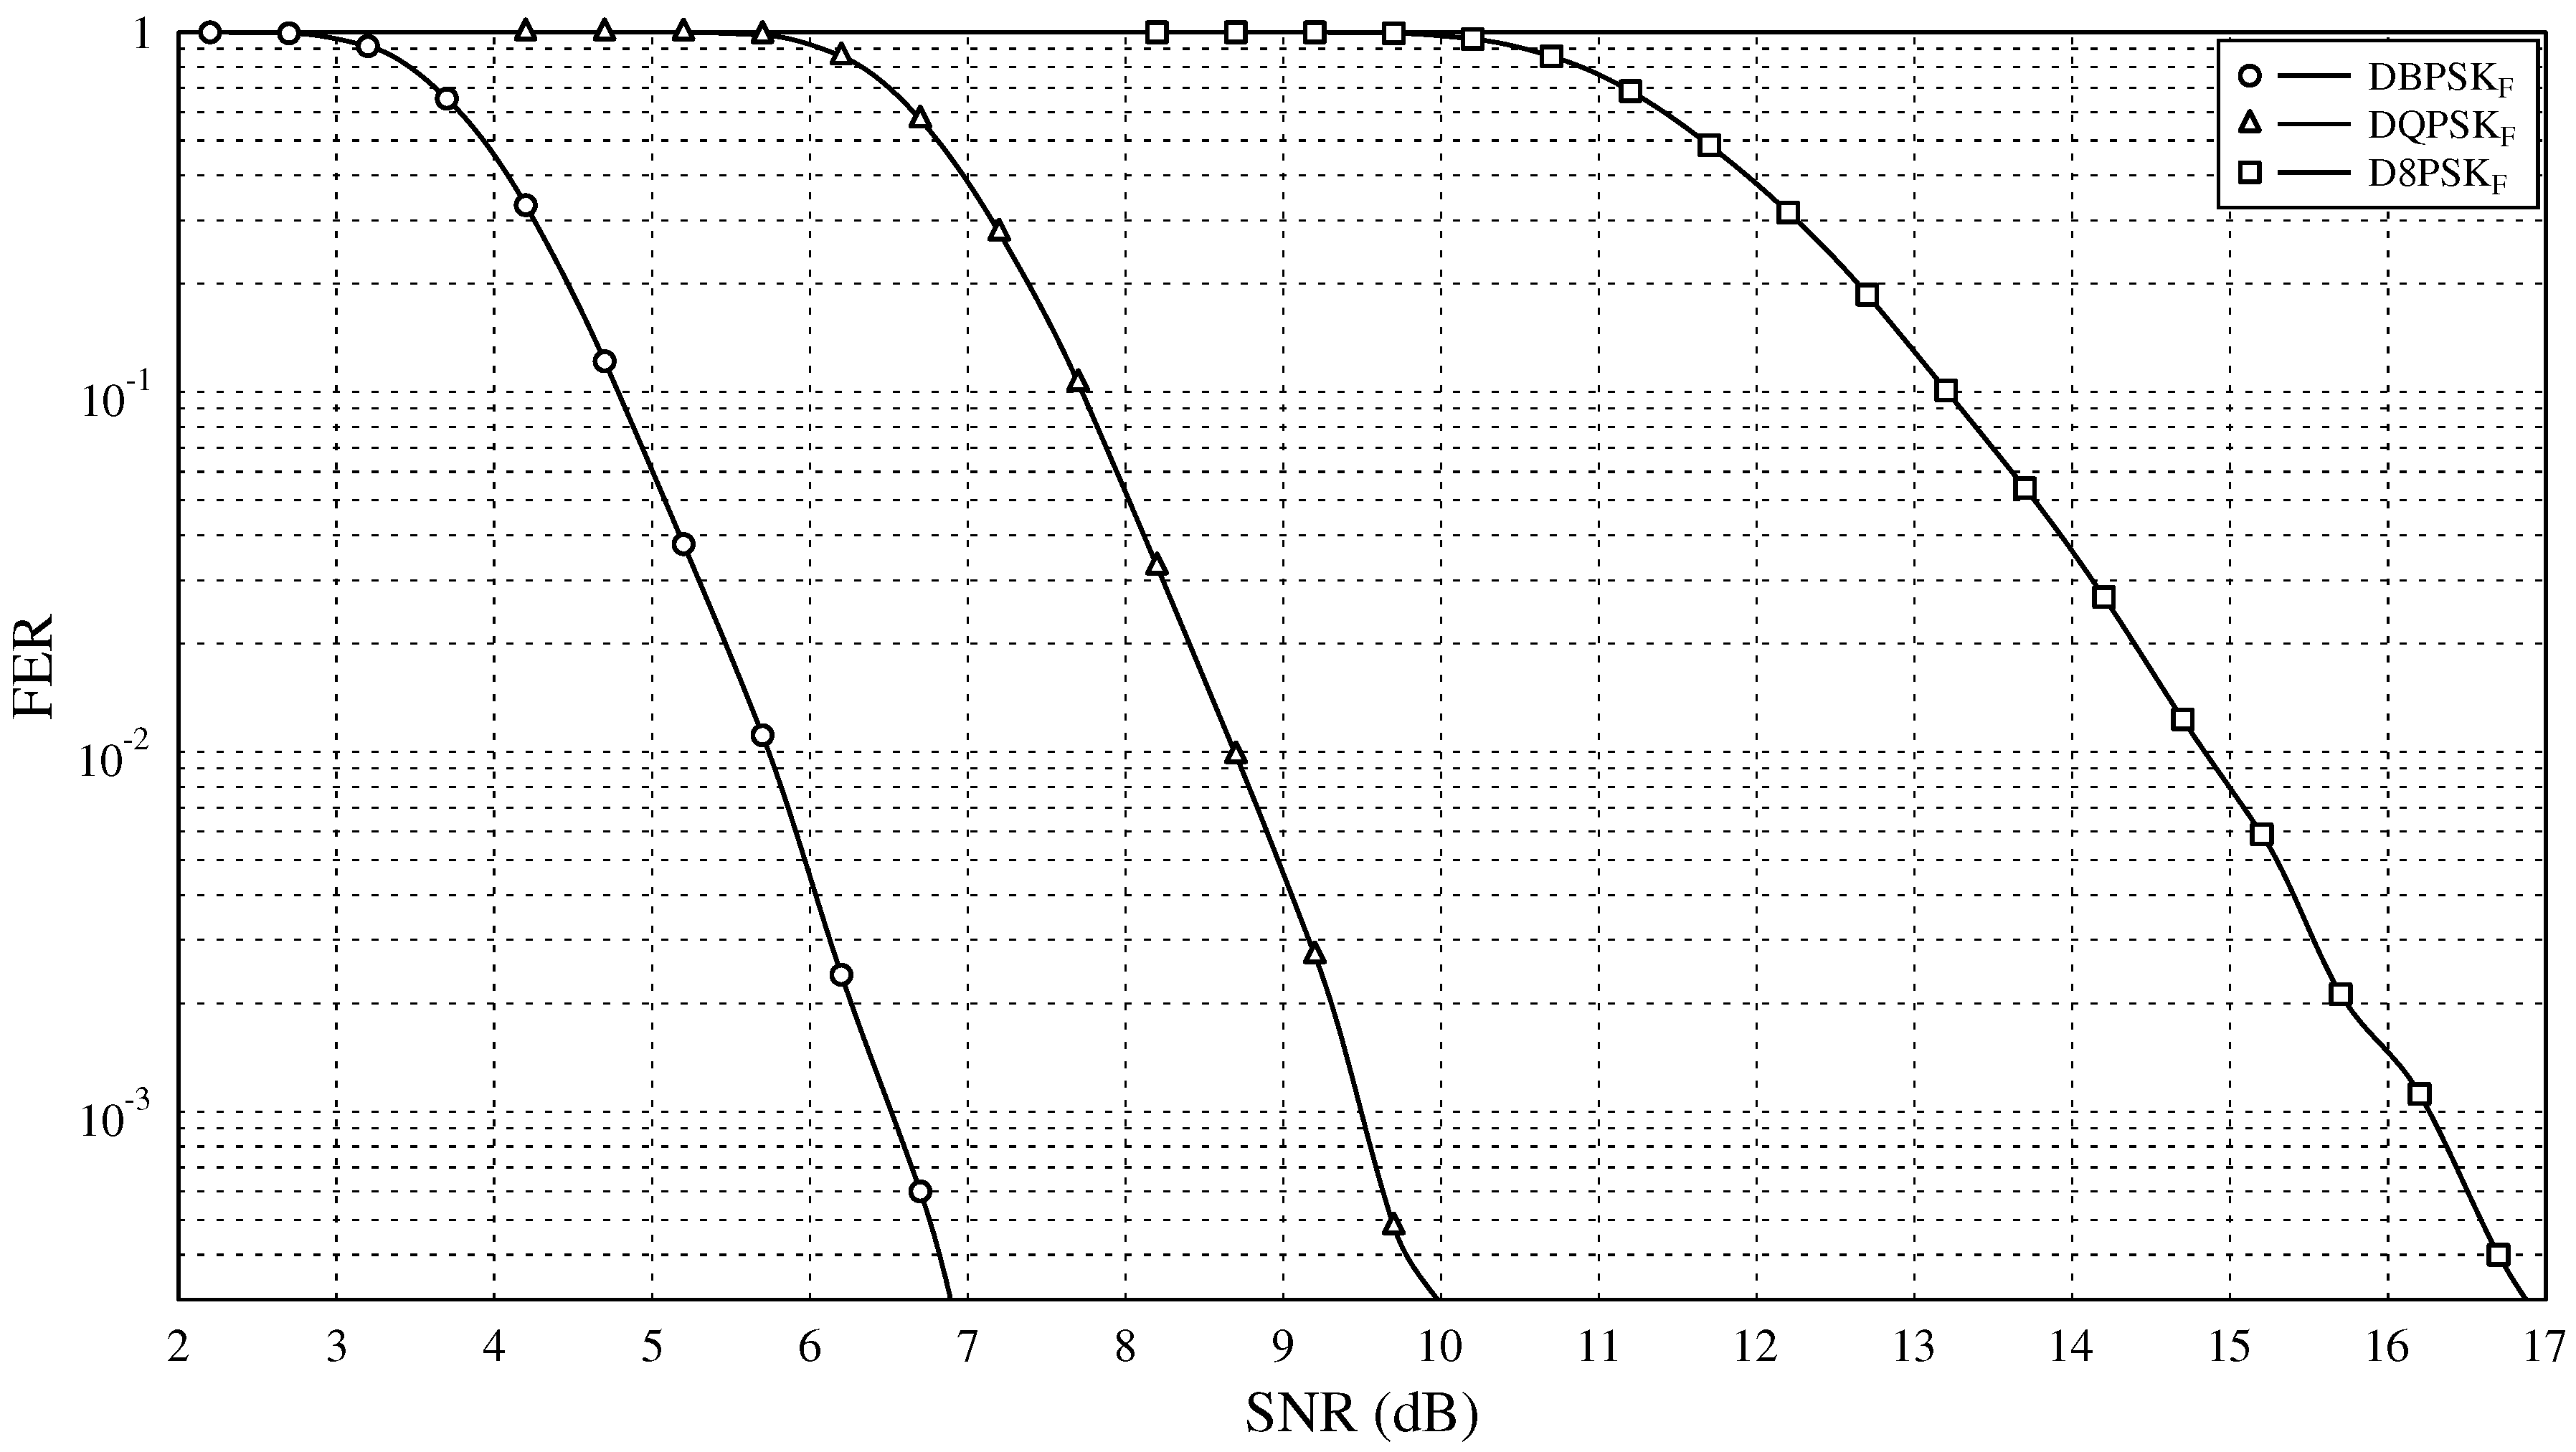
6.4. Channel with Abrupt Phase Shift

7. Conclusions
- Regarding the usability of the PHY modes without convolutional coding, the results show that the transmission modes without convolutional encoding are not valid for practical use. The consequences of not using convolutional encoding are particularly severe in situations of impulsive or frequency selective channels, as the channel erases or distorts one of the carriers, and it is not possible to decode any PPDU without any kind of error correction.
- PRIME standard shows high robustness against tough channel conditions (frequency selective channel or channel with abrupt phase change), being the decoding sensitivity usually impacted by less than 3 dB.
- The presence of synchronous impulsive noise and its duration or waveform are very important for analyzing the PRIME communications sensitivity.
Acknowledgments
Author Contributions
Conflicts of Interest
References
- O’Neal, J.B., Jr. The residential power circuit as a communication medium. IEEE Trans. Consum. Electron. 1986, 32, 567–677. [Google Scholar] [CrossRef]
- Hooijen, O.G. A channel model for the low-voltage power-line channel; Measurement and simulation results. In Proceedings of the IEEE International Symposium on Powerline Communications, Essen, Germany, 2–4 April 1997; pp. 51–56.
- Hooijen, O.G. A channel model for the residential power circuit used as a digital communications medium. IEEE Trans. Electromagn. Compat. 1998, 40, 331–336. [Google Scholar] [CrossRef]
- Tlich, M.; Chaouche, H.; Zeddam, A.; Pagani, P. Novel approach for PLC impulsive noise modelling. In Proceedings of the IEEE International Symposium on Powerline Communications, Dresden, Germany, 29 March–1 April 2009; pp. 20–25.
- Gassara, H.; Rouissi, F.; Ghazel, A. Narrowband stationary noise characterization and modelling for power line communication. In Proceedings of the IEEE International Symposium on Powerline Communications, Surat Thani, Thailand, 4–6 September 2013; pp. 148–153.
- Wenqing, L.; Sigle, M.; Dostert, K. Channel phase distortion and its influence on PLC systems. In Proceedings of the IEEE International Symposium on Powerline Communications, Beijing, China, 27–30 March 2012; pp. 268–273.
- Mitra, J.; Lampe, L. Coded narrowband transmission over noisy powerline channels. In Proceedings of the IEEE International Symposium on Powerline Communications, Dresden, Germany, 29 March–1 April 2009; pp. 143–148.
- Ndo, G.; Siohan, P.; Hamon, M.H. OFDM/OQAM performance analysis under asynchronous impulsive noise. In Proceedings of the IEEE International Symposium on Powerline Communications, Dresden, Germany, 29 March–1 April 2009; pp. 160–165.
- Matanza, J.; Alexandres, S.; Rodriguez-Morcillo, C. PRIME performance under impulsive noise environments. In Proceedings of the IEEE International Symposium on Powerline Communications, Beijing, China, 27–30 March 2012; pp. 380–385.
- Kim, I.H.; Varadarajan, B.; Dabak, A. Performance analysis and enhancements of narrowband OFDM powerline communication systems. In Proceedings of the IEEE International Conference on Smart Grid Communications, Gaithersburg, MD, USA, 4–6 October 2010; pp. 362–367.
- Hoch, M. Comparison of PLC G3 and PRIME. In Proceedings of the IEEE International Symposium on Power Line Communications and Its Applications, Udine, Italy, 3–6 April 2011; pp. 165–169.
- Meyer, J.; Bollen, M.; Amaris, H.; Blanco, A.M.; Gil de Castro, A.; Desmet, J.; Klatt, M.; Kocewiak, Ł.; Rönnberg, S.; Yang, K. Future work on harmonics—Some expert opinions Part II—Supraharmonics, standards and measurements. In Proceedings of the IEEE International Conference on Harmonics and Quality of Power, Bucharest, Romania, 25–28 May 2014; pp. 909–913.
- Bollen, M.; Olofsson, M.; Larsson, A.; Ronnberg, S.; Lundmark, M. Standards for supraharmonics (2 to 150 kHz). IEEE Electromagn. Compat. Mag. 2014, 3, 114–119. [Google Scholar]
- CENELEC SC 205A. Mains Communicating Systems TF EMI Study Report on Electromagnetic Interference Between Electrical Equipment/systems in the Frequency Range below 150 kHz, 2nd ed.; European Committee for Electrotechnical Standardization (CENELEC): Brussels, Belgium, 2013. [Google Scholar]
- G.9904 Narrowband Orthogonal Frequency Division Multiplexing Power Line Communication Transceivers for PRIME Networks; Telecommunication Standardization Sector (ITU-T) of the International Telecommunication Union (ITU): Geneva, Switzerland, 2012.
- G.9901 Narrowband Orthogonal Frequency Division Multiplexing Power Line Communication Transceivers—Power Spectral Density Specification; ITU-T: Geneva, Switzerland, 2012.
- PRIME Technical Working Group. Specification for PoweRline Intelligent Metering Evolution 1.3.6; Prime Alliance: Brussels, Belgium, 2012. [Google Scholar]
- ZIV Metering Solutions Home Page. Available online: http://www.meteringsolutions.ziv.es (accessed on 5 October 2015).
- PRIME Certification Working Group. PRIME Certification Test Cases, Version 1.2; Prime Alliance: Brussels, Belgium, 2010. [Google Scholar]
- IEEE Standard 1901.2-2013—IEEE Standard for Low-Frequency (less than 500 kHz) Narrowband Power Line Communications for Smart Grid Applications; IEEE: Piscataway, NJ, USA, 2013.
- Performance Assessment of G3-PLC for Smart Grid Applications. Ref:3002002917; Electric Power Research Institute (EPRI): Palo Alto, CA, USA, 2014.
- PRIME Alliance Technical Working Group. PRIME v1.4 White Paper; PRIME Alliance: Brussels, Belgium, 2014. [Google Scholar]
- Sendín, A.; Llano, A.; Angueria, P. Análisis de la utilización efectiva de los esquemas de modulación de la especificación PRIME para la lectura remota de contadores. In Proceedings of the XIX Telecom I+D, Madrid, Spain, 24 November 2009. (In Spanish)
© 2016 by the authors; licensee MDPI, Basel, Switzerland. This article is an open access article distributed under the terms and conditions of the Creative Commons by Attribution (CC-BY) license (http://creativecommons.org/licenses/by/4.0/).
Share and Cite
Llano, A.; Angulo, I.; Angueira, P.; Arzuaga, T.; De la Vega, D. Analysis of the Channel Influence to Power Line Communications Based on ITU-T G.9904 (PRIME). Energies 2016, 9, 39. https://doi.org/10.3390/en9010039
Llano A, Angulo I, Angueira P, Arzuaga T, De la Vega D. Analysis of the Channel Influence to Power Line Communications Based on ITU-T G.9904 (PRIME). Energies. 2016; 9(1):39. https://doi.org/10.3390/en9010039
Chicago/Turabian StyleLlano, Asier, Itziar Angulo, Pablo Angueira, Txetxu Arzuaga, and David De la Vega. 2016. "Analysis of the Channel Influence to Power Line Communications Based on ITU-T G.9904 (PRIME)" Energies 9, no. 1: 39. https://doi.org/10.3390/en9010039