Article

Experimental Study in a Cascade Row for Improving the Performance of a Partially Admitted Turbo-Expander

1
Department of Aerospace & System Engineering (ReCAPT), Gyeong-Sang National University, 501 Jinju-daero, Jinju 660-701, Korea
2
Department of System Reliability, Korea Institute of Machinery and Materials, Yu-Sung, 171 Jangdong, Daejeon 305-343, Korea
*
Author to whom correspondence should be addressed.
These authors contributed equally to this work.
Energies 2015, 8(12), 13576-13589; https://doi.org/10.3390/en81212385
Submission received: 15 October 2015 / Revised: 8 November 2015 / Accepted: 23 November 2015 / Published: 1 December 2015

Abstract

:
Turbo-expanders are widely used as power generators in the field of energy conversion such as organic Rankine cycle (ORC) systems. When the available thermal energy is not sufficient to operate the turbo-expander in full admission, it is much better to operate in partial admission instead of stand-down. However, the performance of the turbo-expander greatly depends on the operating conditions. Among many operating conditions, the flow angle at the nozzle and solidity can be major factors affecting the performance of the expander. In order to investigate the optimal operation conditions, experiments were conducted in a linear cascade apparatus simulating the operation of turbo-expander in partial admission. Three different nozzle flow angles of 58°, 65°, and 72° were adopted, and the experiments were conducted with respective solidities of 1.25, 1.38, and 1.67 at each nozzle flow angle. The cross section of the nozzle was rectangular and the chord of the tested blade was 200 mm. The blades moved in a rotational direction, and the forces on the blades were measured with the surface pressure at steady state. The experimental results showed that the rotational force increased for a larger solidity or for a smaller nozzle flow angle.

1. Introduction

Turbo-expanders have been widely used to generate electricity not only in power plants but also in the field of energy conversion to utilize renewable energy. Recently, they have been adopted as expanders in organic Rankine cycle (ORC) systems because they can produce various output powers depending on the available thermal energy input [1,2,3]. The source of this thermal energy can be the waste heat energy in an industry complex, solar energy, geothermal energy, and so on. However, such sources are typically unable to supply energy continuously because they are dependent on a particular process or environment. Hence, to accommodate the conditions typically found with renewable energy, the expander should be designed with the ability to operate at partial load [4]. In partial load operation, the turbo-expander can perform better than other expander types by controlling the admission rate. The admission rate is typically defined as the ratio of the spouting area at the stator or nozzle to the full admission area at the rotor. The admission rate on the expander can be easily controlled by the stator or nozzle. Hence, the expander can be operated without any structural modification even though the mass flow rate changes due to variation in the available thermal energy [5]. This is one of many merits of the turbo-expander when adopted in the ORC.
Studies about the effects of partial admission were initially conducted on the gas turbine or steam turbine, and this method was used to adjust the output power of the turbine according to the requisite load. The output power of these machines was typically controlled only within a small range of the rated output power. Therefore, these machines operated in a high partial admission rate. Researches on these machines were typically focused on improving performance by changing the geometric parameters of the turbine components, such as the shape of the passage channel [6], the magnitude of the upper and lower overlap [7], the axial gap between the nozzle and rotor [8], blade shape [9], double stages [10] and so on. In addition, studies were conducted in a high admission rate, focusing on performance predictions. An improved prediction method [11] was suggested through a comparison of the Suter-Traupel’s method and Stenning’s method. A theory [12] was developed for flow conditions in partial admission turbines assuming incompressible flow, and the efficiency of the turbine was determined as a function of distance measured along the admission region. Additional losses incurred by partial admission were observed [13], and these were variously classified as filling/emptying loss, scavenge loss, and blade pumping loss. These additional losses, which occurred due to partial admission in axial flow turbines, were enumerated [14]. A relationship of partial admission losses was developed by establishing the influence of geometric parameters of interest to the turbine designer [15]. A performance prediction model was developed for a turbine operating at supersonic flow with the working fluid R113 by selecting better models among known prediction models [16]. A prediction model was developed for a single stage axial-type turbine working in partial admission through a circular-type nozzle channel [17]. In reviewing these prediction models for partial admission, it is clear that they estimated the turbine performance accurately at the design point. However, they also found some discrepancies between the experimental results and the predicted results when the turbines worked at a low partial admission rate or a far off-design point.
When a turbo-expander is operated with the fluctuating thermal energy levels, the mass flow rate is widely changed and the expander must be operated in a very low partial admission rate. The output power of the expander also varies depending on the partial admission rate. Hence, it is important to predict the performance of the expander accurately, because the expander design must be resolved by considering trade-offs between many design variables based on the predicted result. For better prediction, studies were conducted to investigate the effects of design variables on a partially admitted turbo-expander using a cascade apparatus [18,19,20]. However, those experimental results were limited to predicting the performance of a turbo-expander employing a circular-type nozzle. In order to improve the performance prediction of an expander using a rectangular nozzle in a low partial admission rate, more detailed experiments are required by considering those design variables which mainly affect the performance loss. Therefore, three different solidities and nozzle flow angles were chosen, and a linear cascade apparatus was manufactured with a large-size rectangular-type nozzle of 200 mm × 200 mm in order to reduce experimental uncertainty. The experiments were conducted with respective solidities of 1.25, 1.38, and 1.67 for each nozzle flow angle of 58°, 65°, and 72° using air. Typically, a working fluid of the ORCs is adopted among organic fluids used as refrigerant. Properties of the organic fluid at vapor state could be different from those of air. However, the performance of a partial admitted turbine greatly depended on the flow structure within the turbine. Since the difference of the flow structure was insignificant at vapor state between refrigerant and air, optimal operating conditions could be determined through the relative comparison of the experimental results. In order to compare each performance for three different solidities and nozzle flow angles, the operating forces and surface pressures on a linear cascade blade were measured along the admission region.

2. Experimental Apparatus
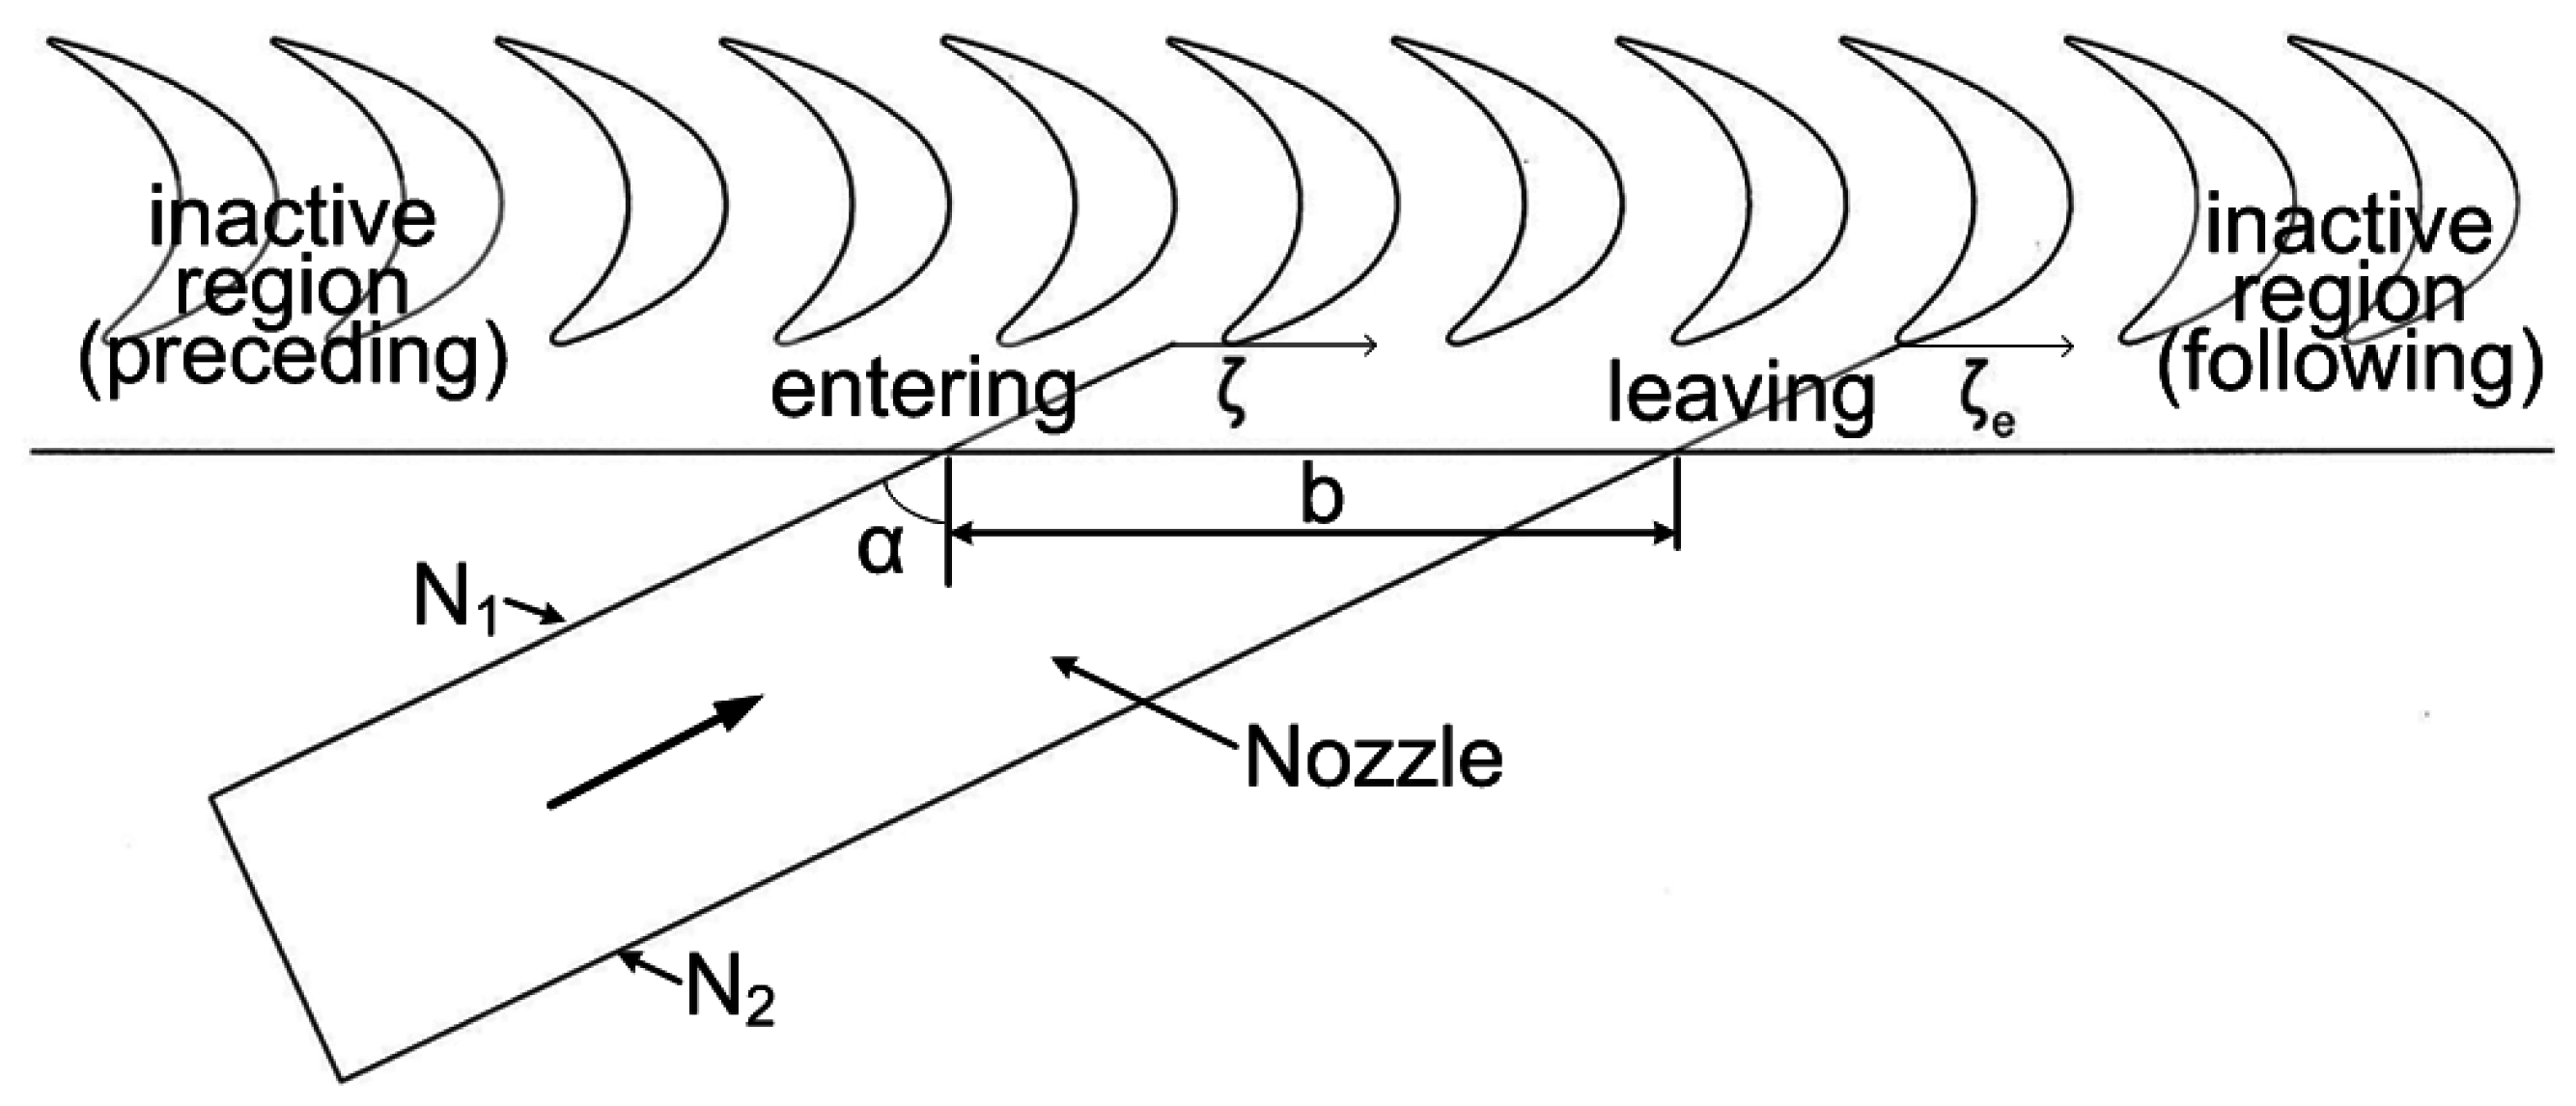
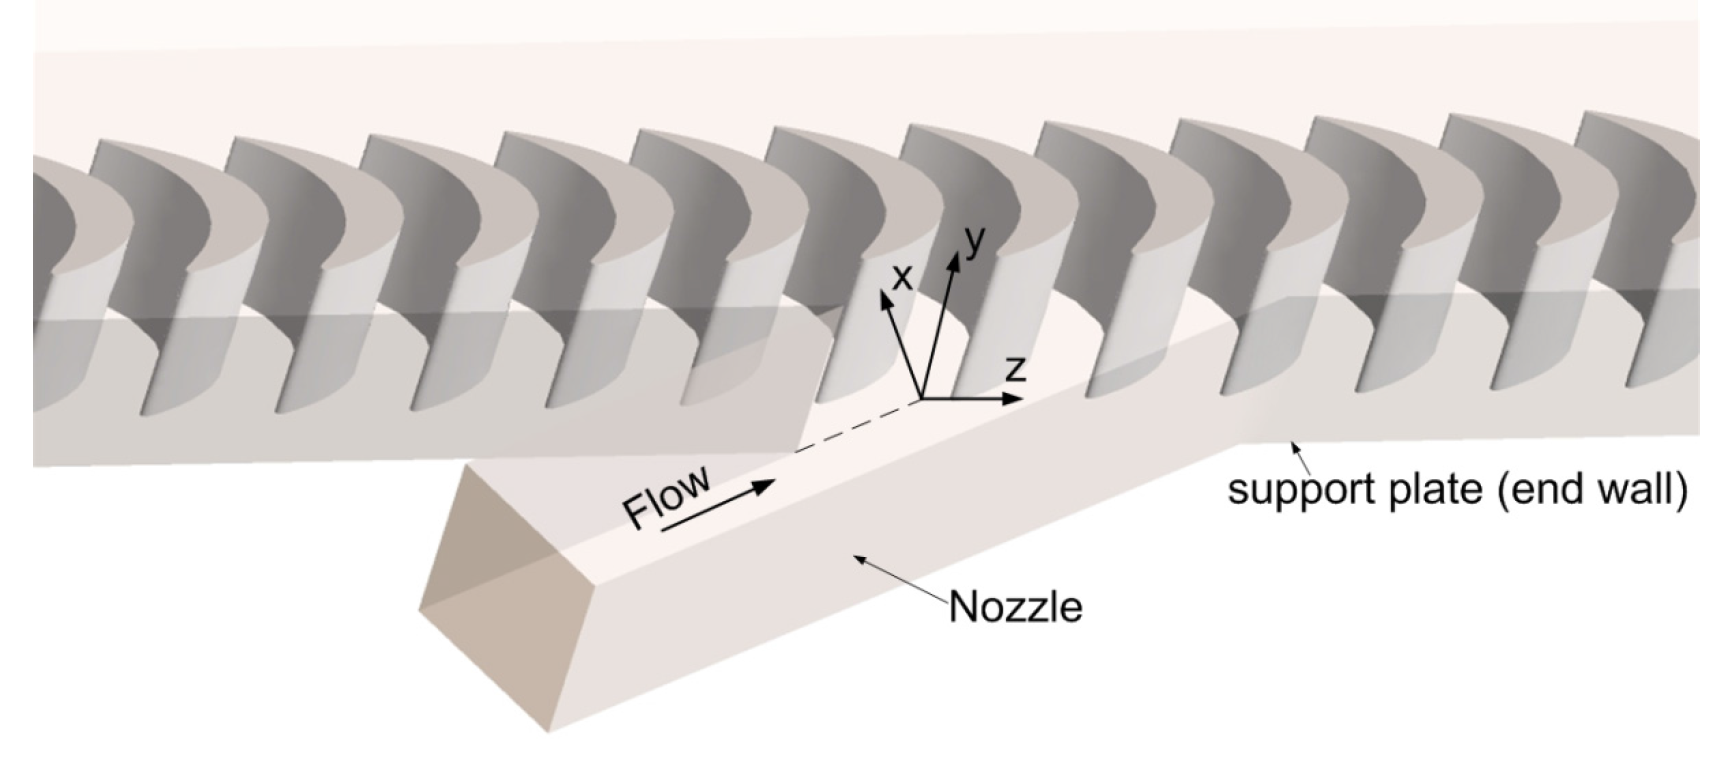
2.1. Linear Cascade

The linear cascade apparatus used for the partial admission experiments consisted of impulse-type blades and a nozzle, as shown in Figure 1. The cross section of the nozzle is rectangular, and its size is 200 mm × 200 mm. The chord of the cascade blade is 200 mm, and the stagger angle is 10.52°. An experiment was conducted at a Reynolds number of 3 × 10⁵ based on the chord. The operating air was supplied from an open-type wind tunnel of 30 kW. Not only the exit but also both sides of the linear cascade apparatus were open to the atmosphere for the simulation of blades rotated across the admission region in the circumferential direction. In Figure 1, “b” means the width of the admission region, “α” is the nozzle flow angle, “N1” and “N2” are sidewalls of the nozzle, and “ζ” means the non-dimensional length divided by the width of the admission region. In the experiment, nine blades were installed in each inactive region at the side of the admission region in order to obtain the same operating conditions as those of the partial admission operation. The cascade can be moved to simulate the position of a rotor blade across and beyond the admission region to simulate the flow field of the rotating frame under quasi-steady state flow conditions.
Figure 1. Linear cascades in front of the partial admission region.
Energies 08 12385 g001
Cascades of different solidity were constructed by changing the pitch (s) of the blade row. This pitch was controlled precisely by three different support plates, which had a penetrated blade pattern with different pitches. The solidity (σ) is defined as the ratio of chord (c) to pitch. A solidity of 1.38 was adopted on the basis of the design point, and two different solidities of 1.25 and 1.67 were chosen to see the effect of different solidities away from the design point. Three different nozzles were adopted to set different nozzle flow angles of 58°, 65° and 72°. The nozzle flow angle of 65° was derived from the design point operation. Flow structures at the nozzle inlet were measured using a hot-wire anemometer. The flow non-uniformity was less than ± 1% at the cross section, and the turbulence intensity was 0.5%–0.7%. The axial gap between the leading edge of the blade and the nozzle exit was set to 35% of the chord. The tip clearance at the blade tip was 2.5% of the blade span.

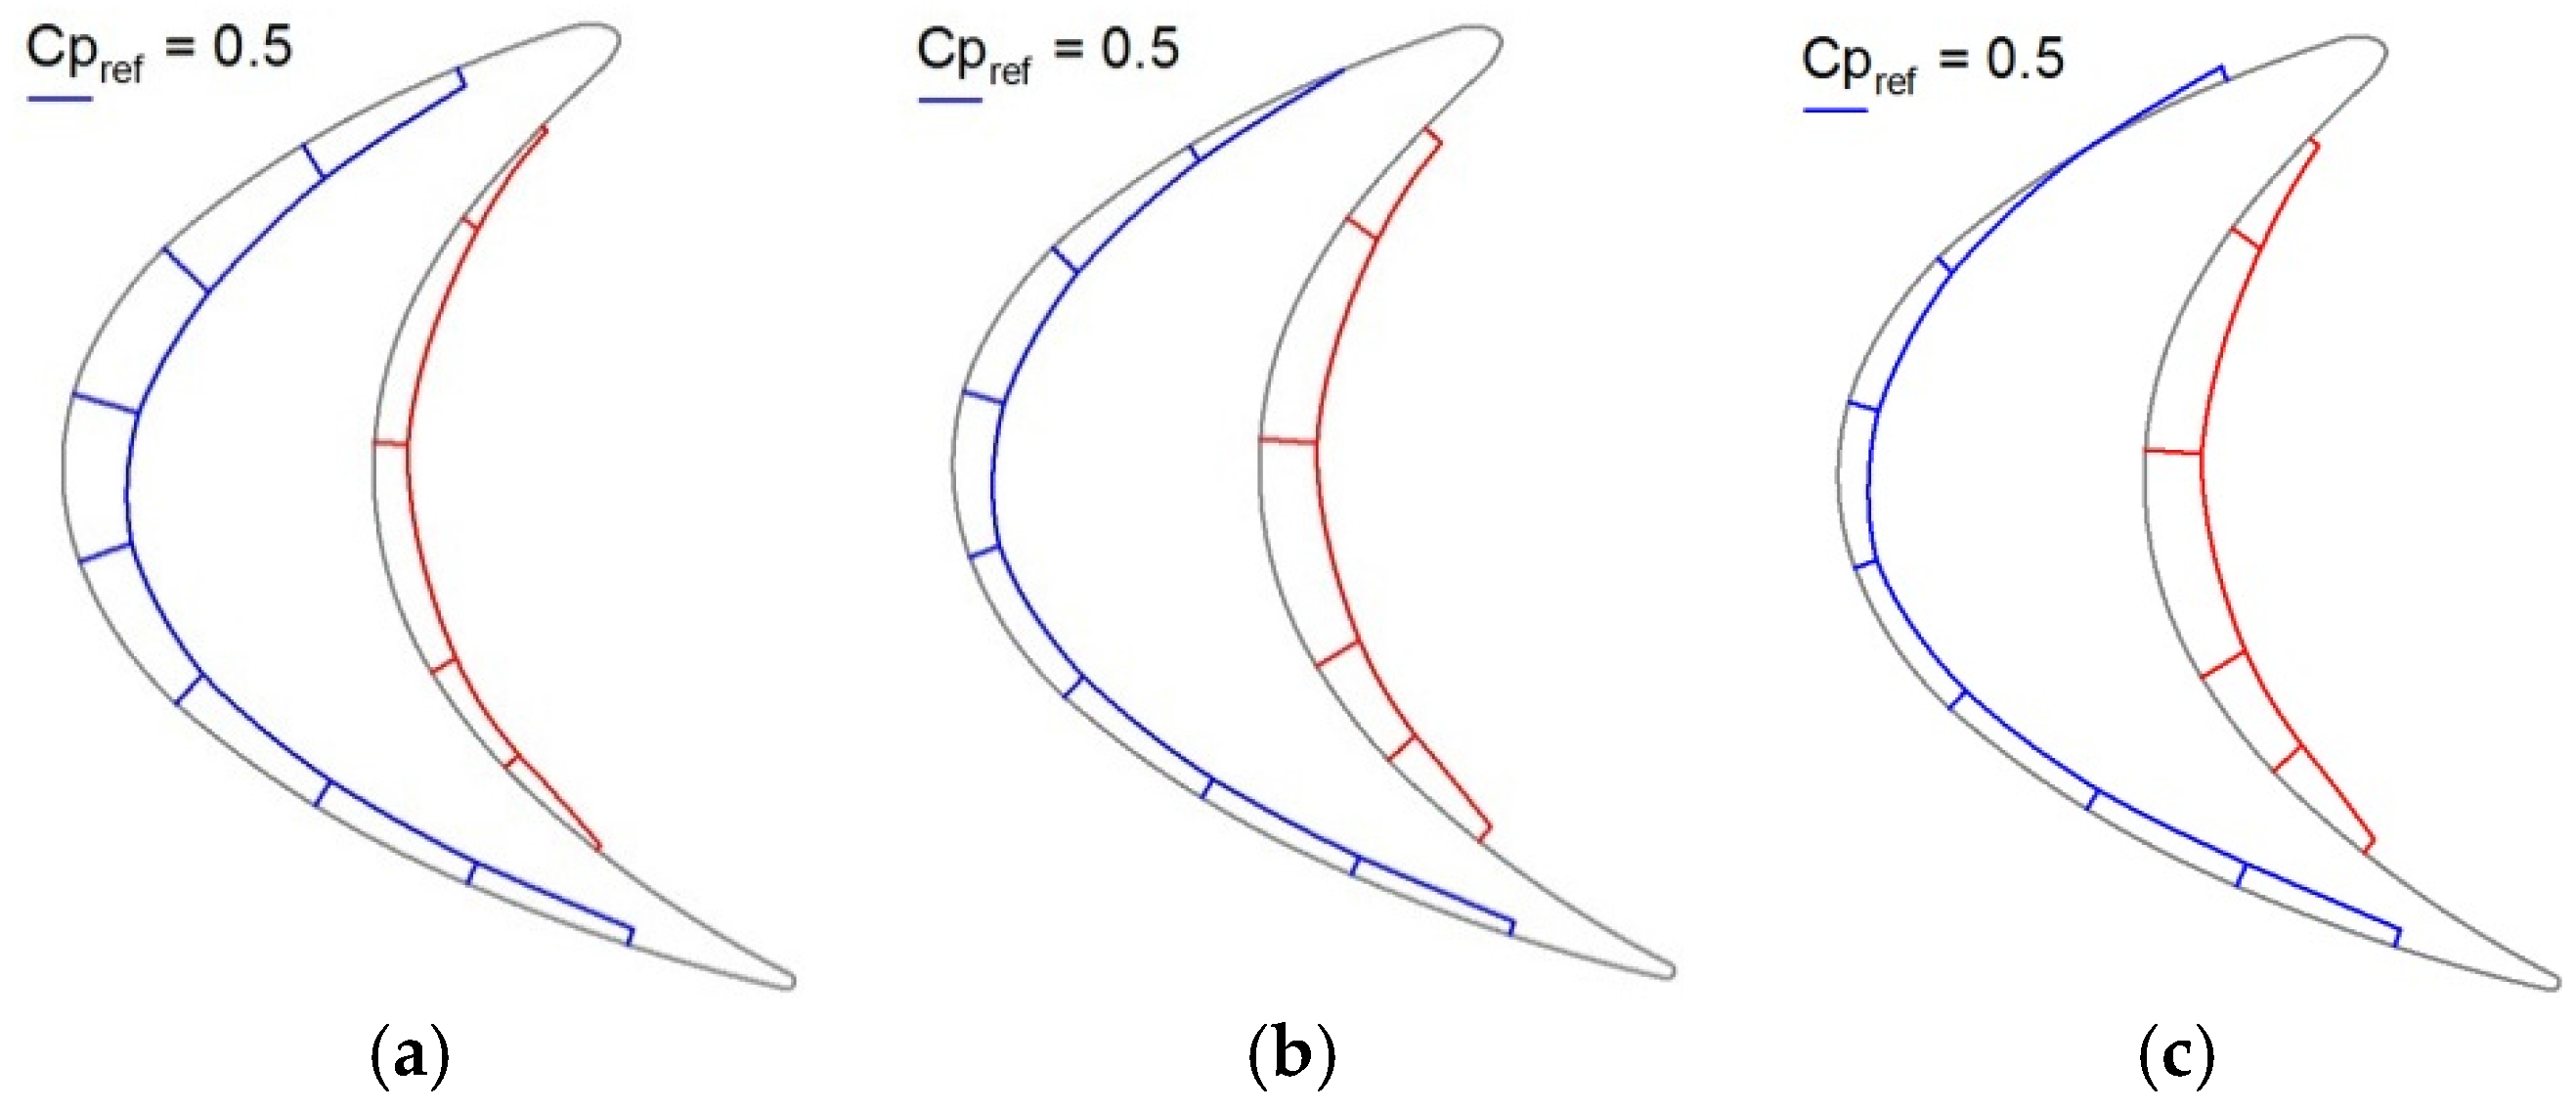
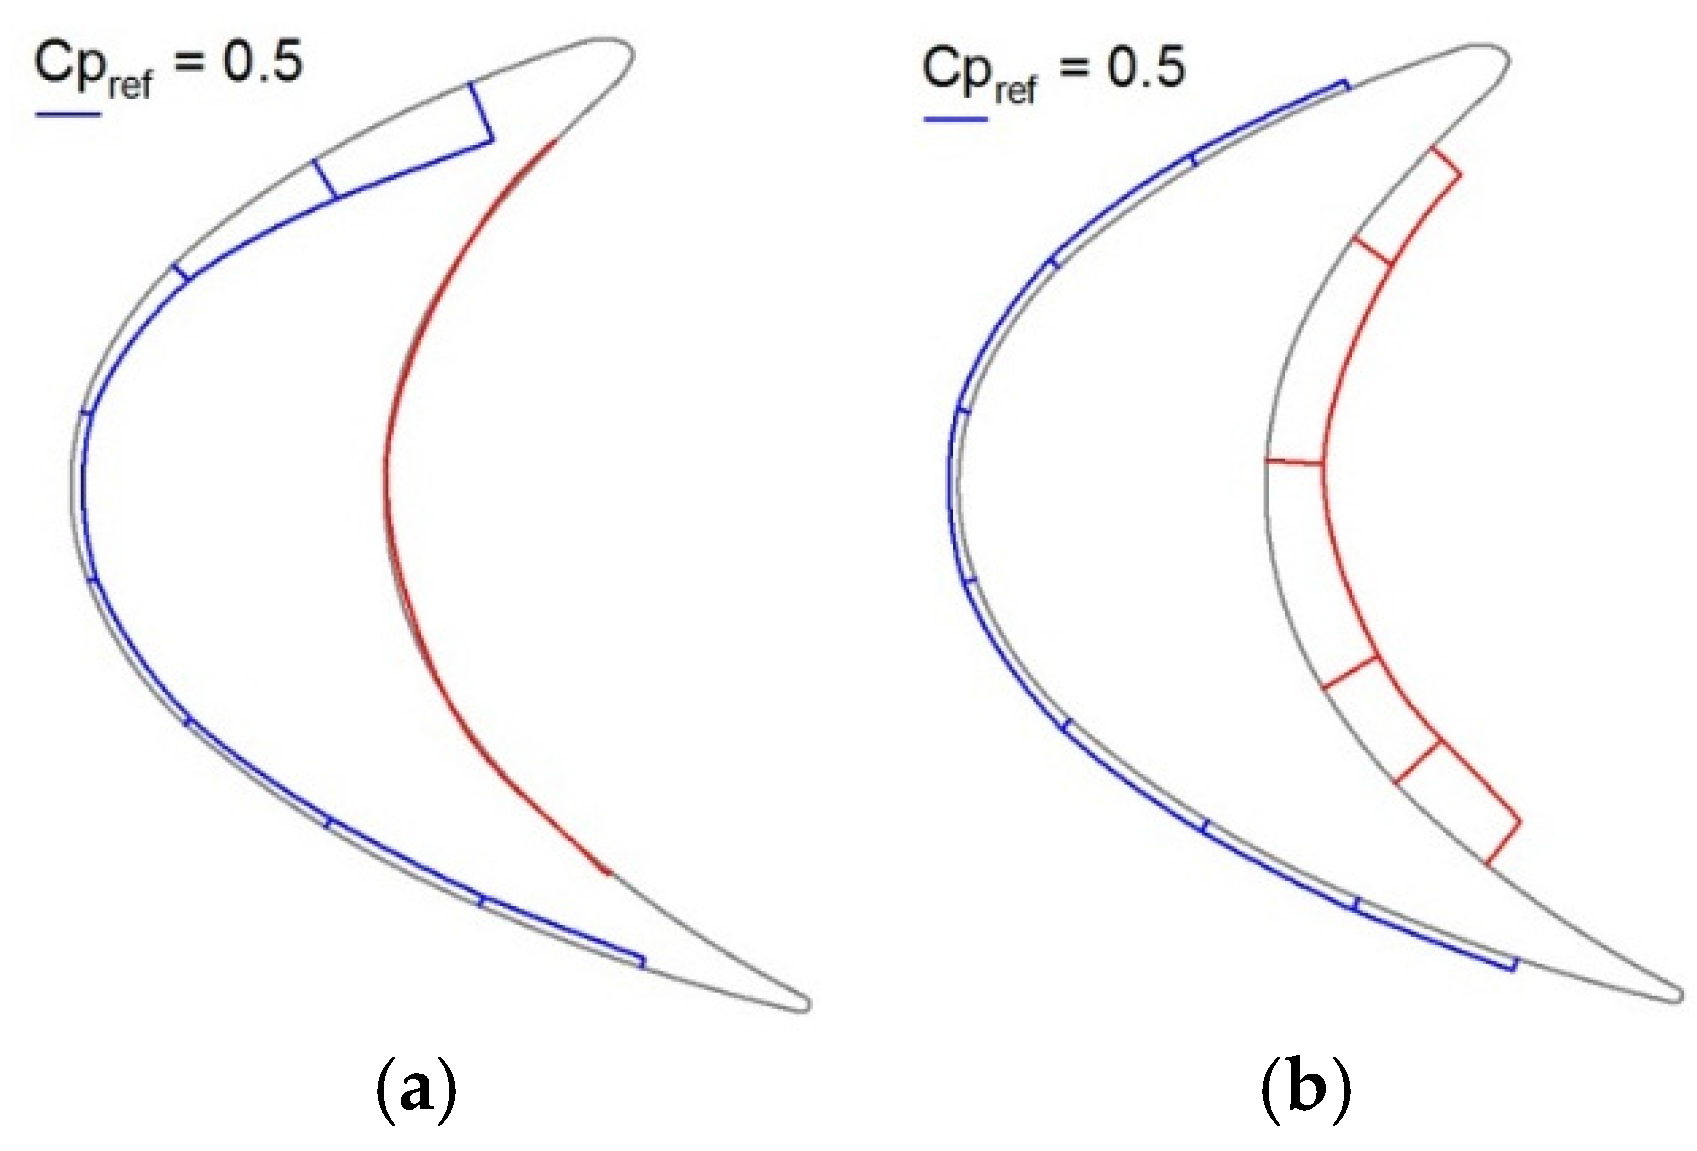
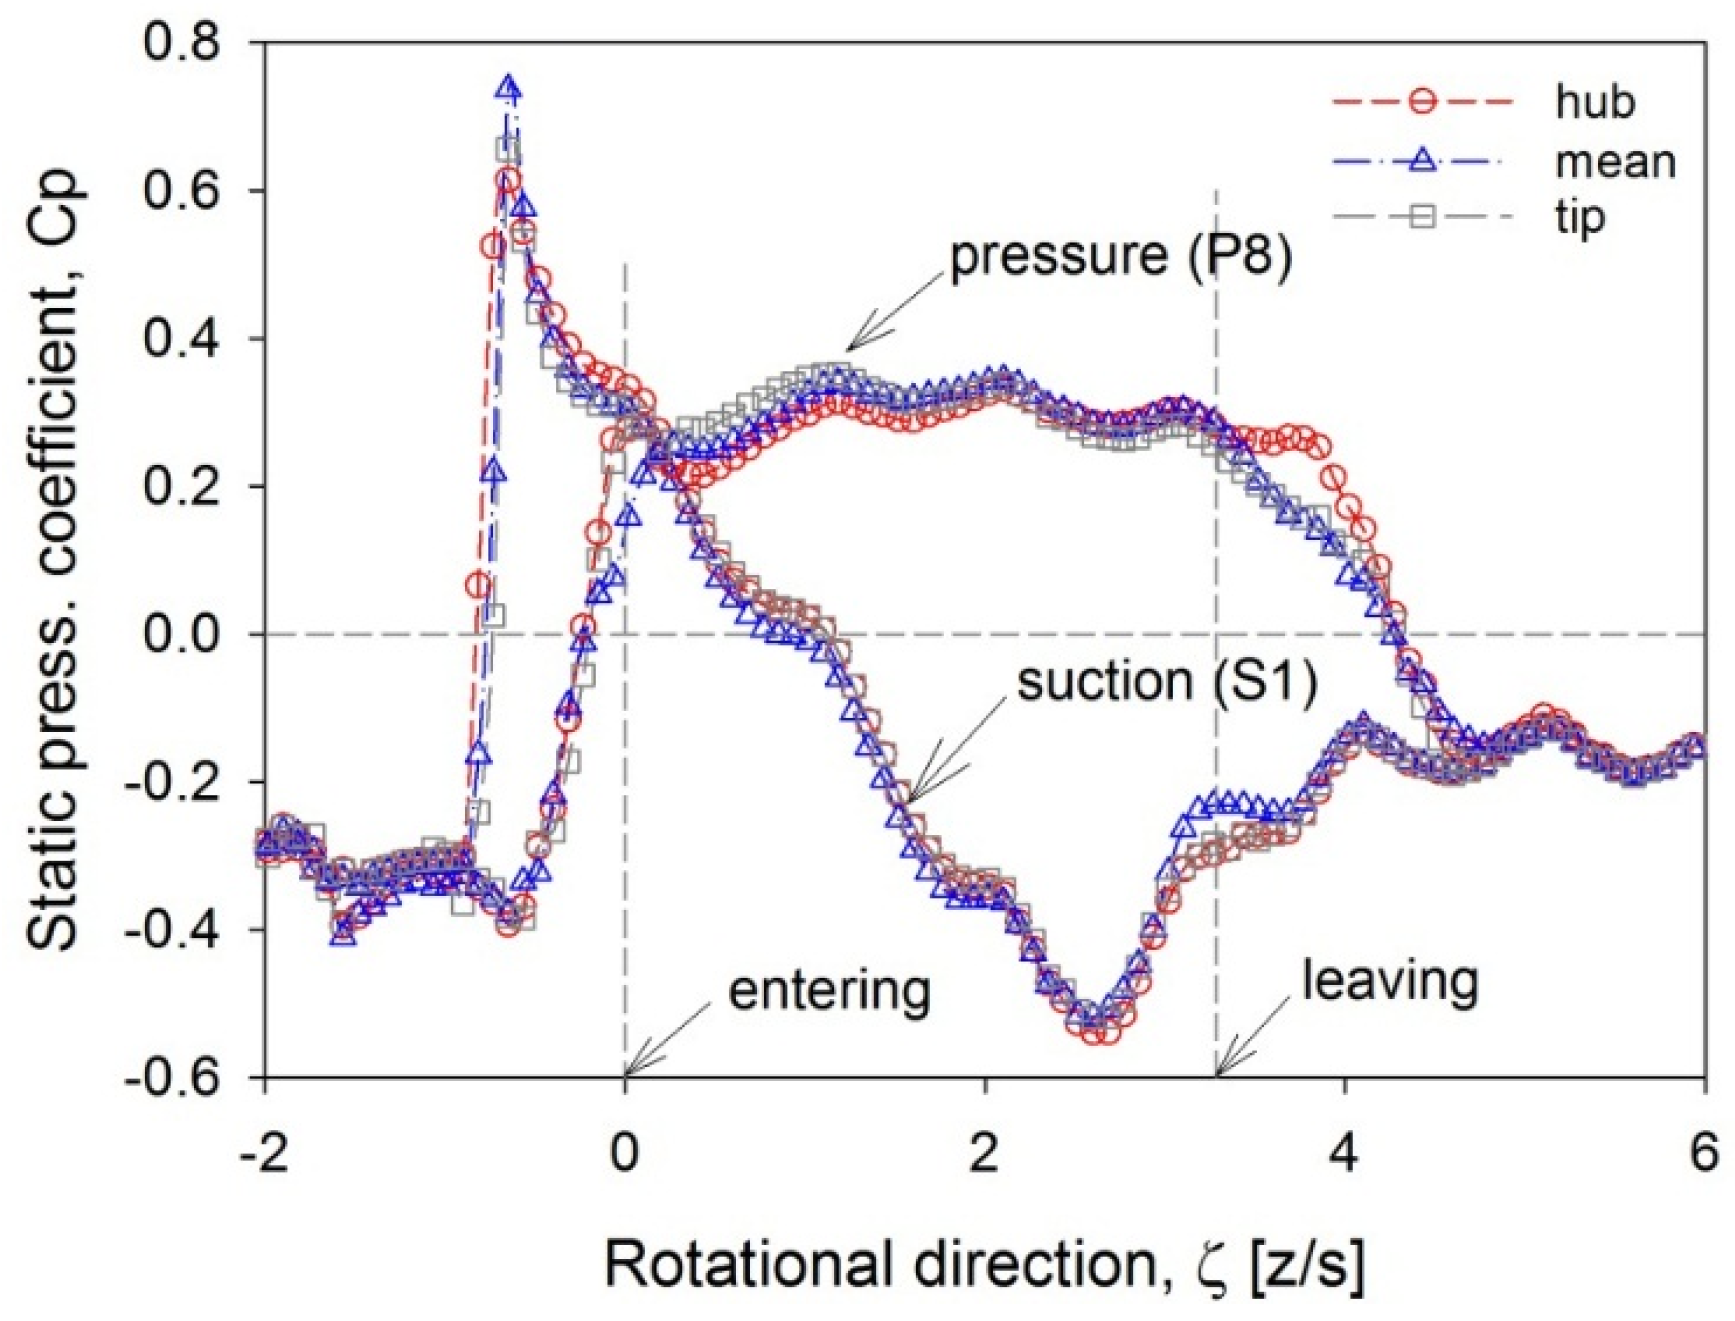
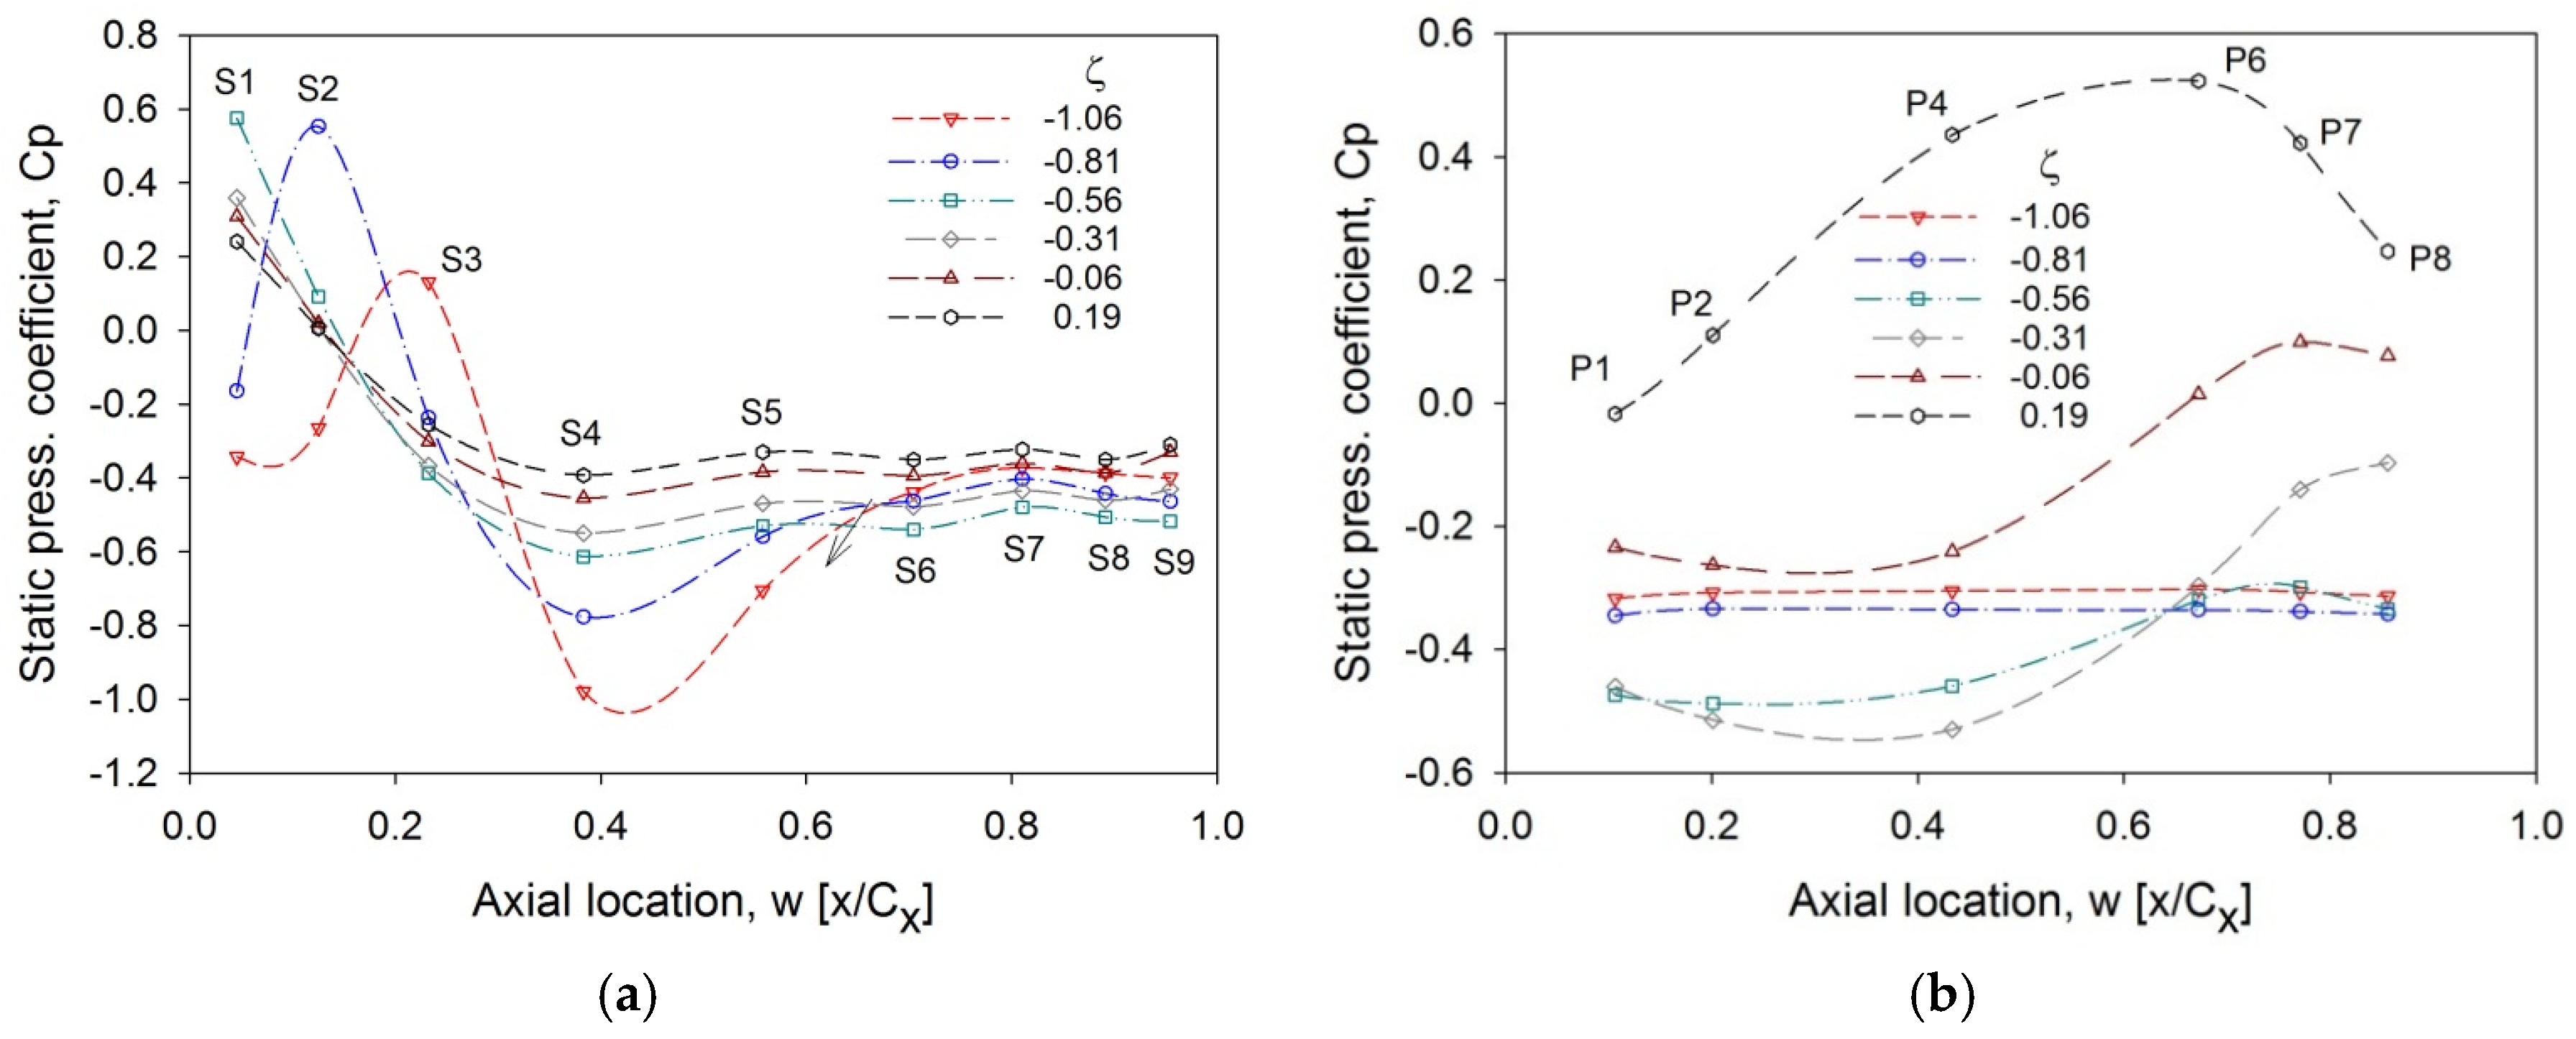
2.2. Pressure Holes on the Blade Surface
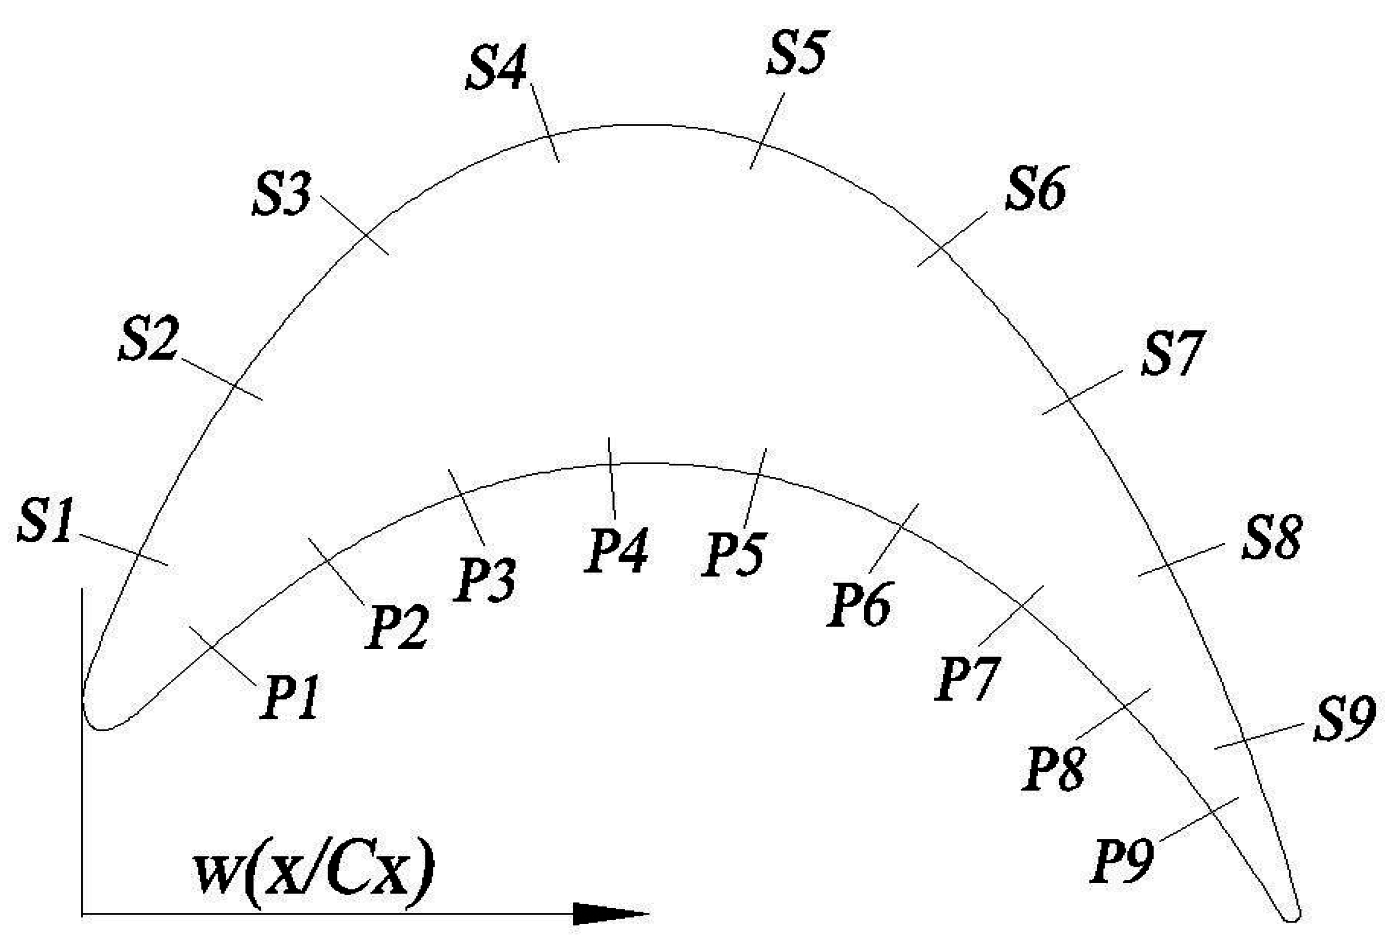
Figure 2 shows the locations of pressure holes on the pressure and suction surface of the blade. Each hole is located at points corresponding to 10% of the length from the leading edge to the trailing edge on the suction surface or the pressure surface. Table 1 shows the axial locations of the pressure holes from the leading edge, which are non-dimensionalized by the blade axial chord (Cx). The diameter of the holes is 0.8 mm, and a total of fifty-four holes (3 × 18) were manufactured normal to the blade surface. Three sections of the hub (y/H = 8%), mean (y/H = 49%) and tip (y/H = 90%) were selected to measure the surface pressure on a blade in the spanwise direction, and eighteen pressure holes were manufacture each section. “H” and “y” are the blade height and the spanwise direction, respectively.
Surface pressures were measured using three 9016 pressure scanners of PSI (Pressure Systems, Inc., Hampton, VA, USA), whose measuring error were less than 0.05%. All pressure values were obtained simultaneously. However, the pressure tap of the P9 hole was not connected to the pressure scanner because the blade thickness near the trailing edge was too thin, and also the pressures at P3 and P5 holes were not measured because pressures at these holes changed smoothly. The experiment was conducted three times to check repeatability. The 95% uncertainty of the pressure measurement was less than 1.2%.
Figure 2. Pressure taps on a tested blade.
Energies 08 12385 g002
Table 1. Axial location of pressure taps non-dimensionalized by the blade axial chord.
Pressure TapsSuction (x/Cx)Pressure (x/Cx)
S1, P10.0460.106
S2, P20.1250.201
S3, P30.2320.320
S4, P40.3830.433
S5, P50.5580.555
S6, P60.7050.672
S7, P70.8100.771
S8, P80.8910.856
S9, P90.9540.927

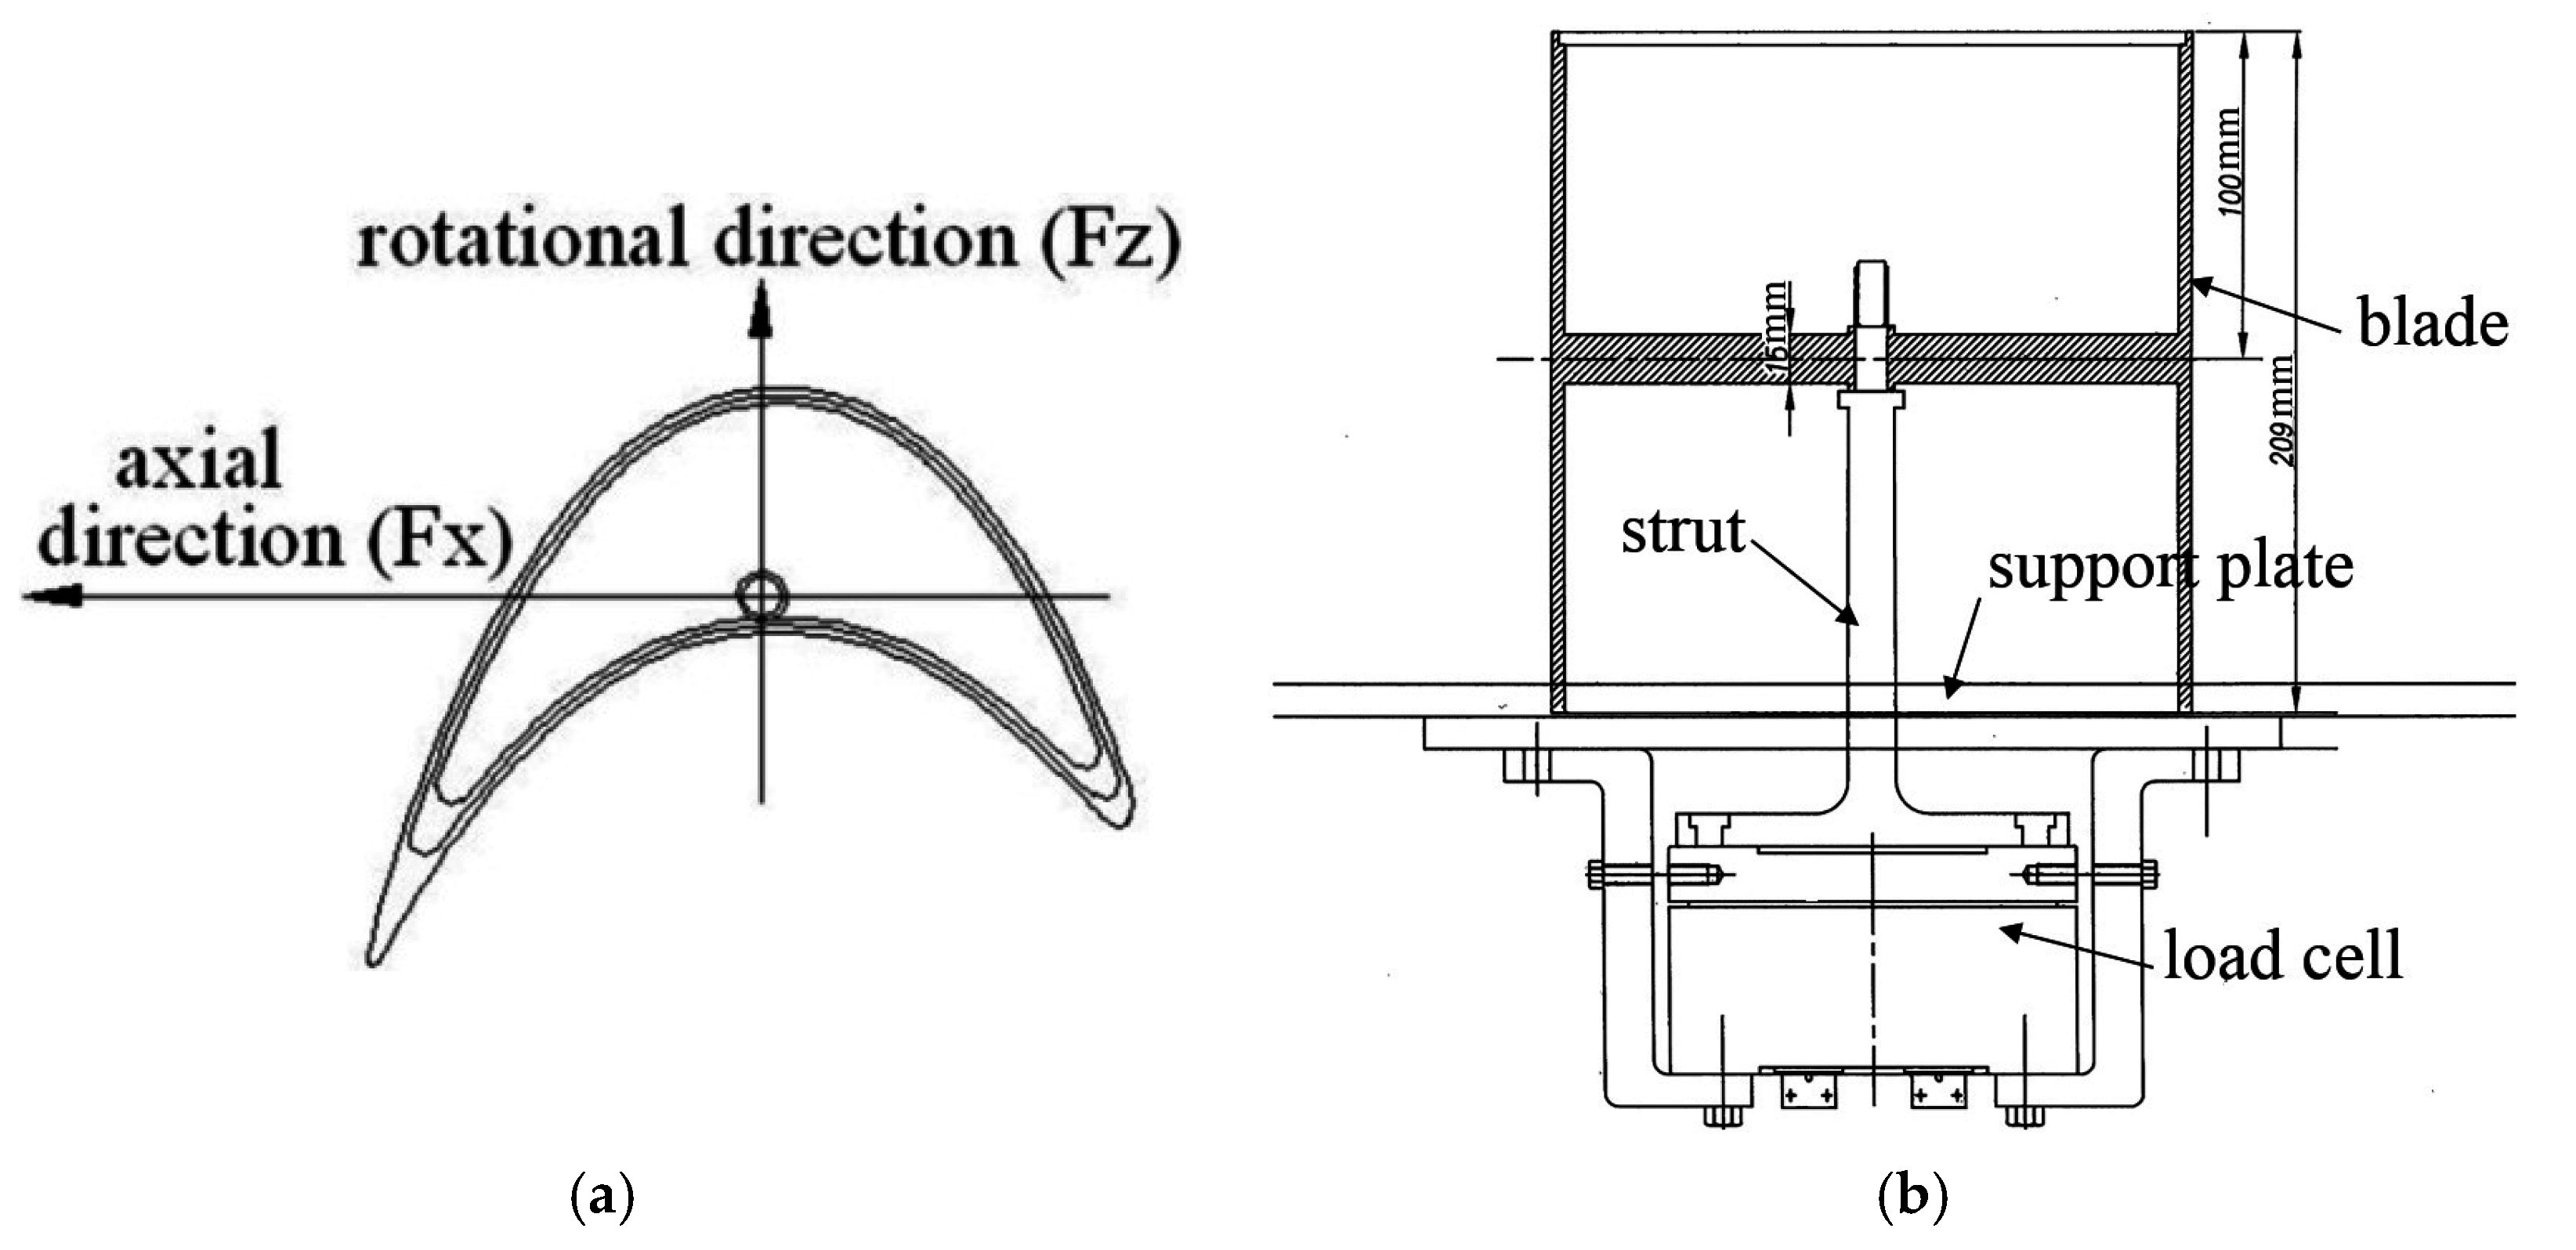
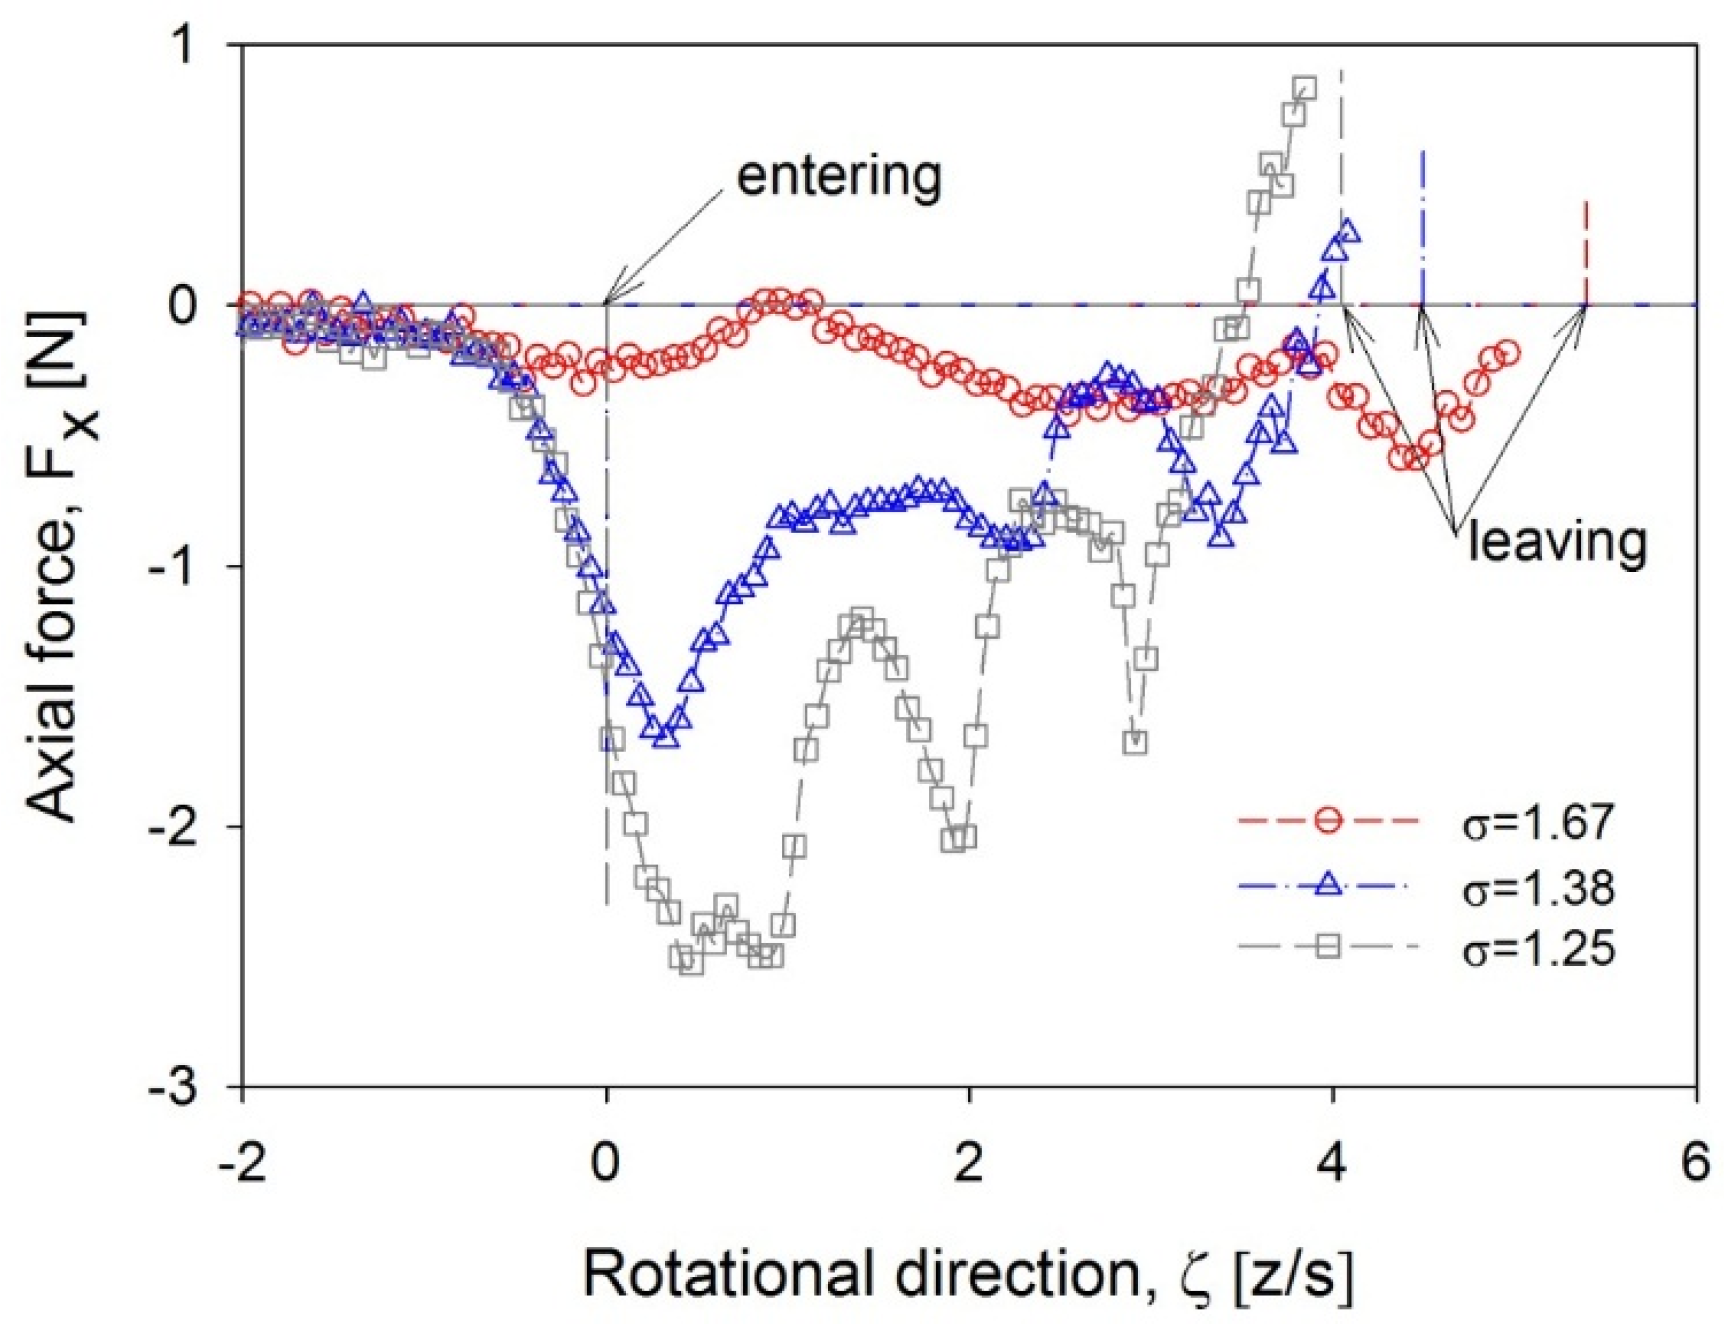
2.3. Devices for Force Measurement

Forces on a blade were measured using a two-axis load cell for both the rotational direction and the axial direction. The rotational direction is similar to the circumferential direction because the experiment was conducted on a linear cascade. The load cell was precisely manufactured not to interfere with either directional force. Its specifications are shown in Table 2. In the experiments, this load cell was connected to a blade using a strut as shown in Figure 3.
Table 2. Degree of accuracy and model of a load cell.
ContentsAccuracyRemarks
Rated capacities50 NFor each component
Nonlinearity± 0.5% at full scaleFor each component force and moment
Hysteresis± 0.5% at full scaleFor each component force and moment
Temperature effect0.06% F.S./°C at full scaleFor each component force
Maker/model-CasKorea/MAS110-5L
Figure 3. Blade for measuring forces with a two-axis load cell: (a) top view and (b) cross-sectional view.
Energies 08 12385 g003
In order to reduce the weight of the blade itself, the inner part of the blade was removed except for a slat component of 15 mm thickness at the mid span. This slat was used to connect the load cell with the strut, which was located at the centroid of the blade. The top of the blade was covered by a thin plate, and this blade was installed in the penetrated pattern of the support plate. This pattern was manufactured to be 0.5 mm wider than the blade profile to prevent any contact between the blade and the support plate during the experiment. The bottom of the support plate was shielded and the load cell was attached below it. Therefore, this load cell could move together with the blade. The output of the load cell was stored in a PC through the data acquisition 34970A (Agilent, Santa Clara, CA, USA). The maximum deviation of measured forces was less than ± 0.6% in repeated experiments.

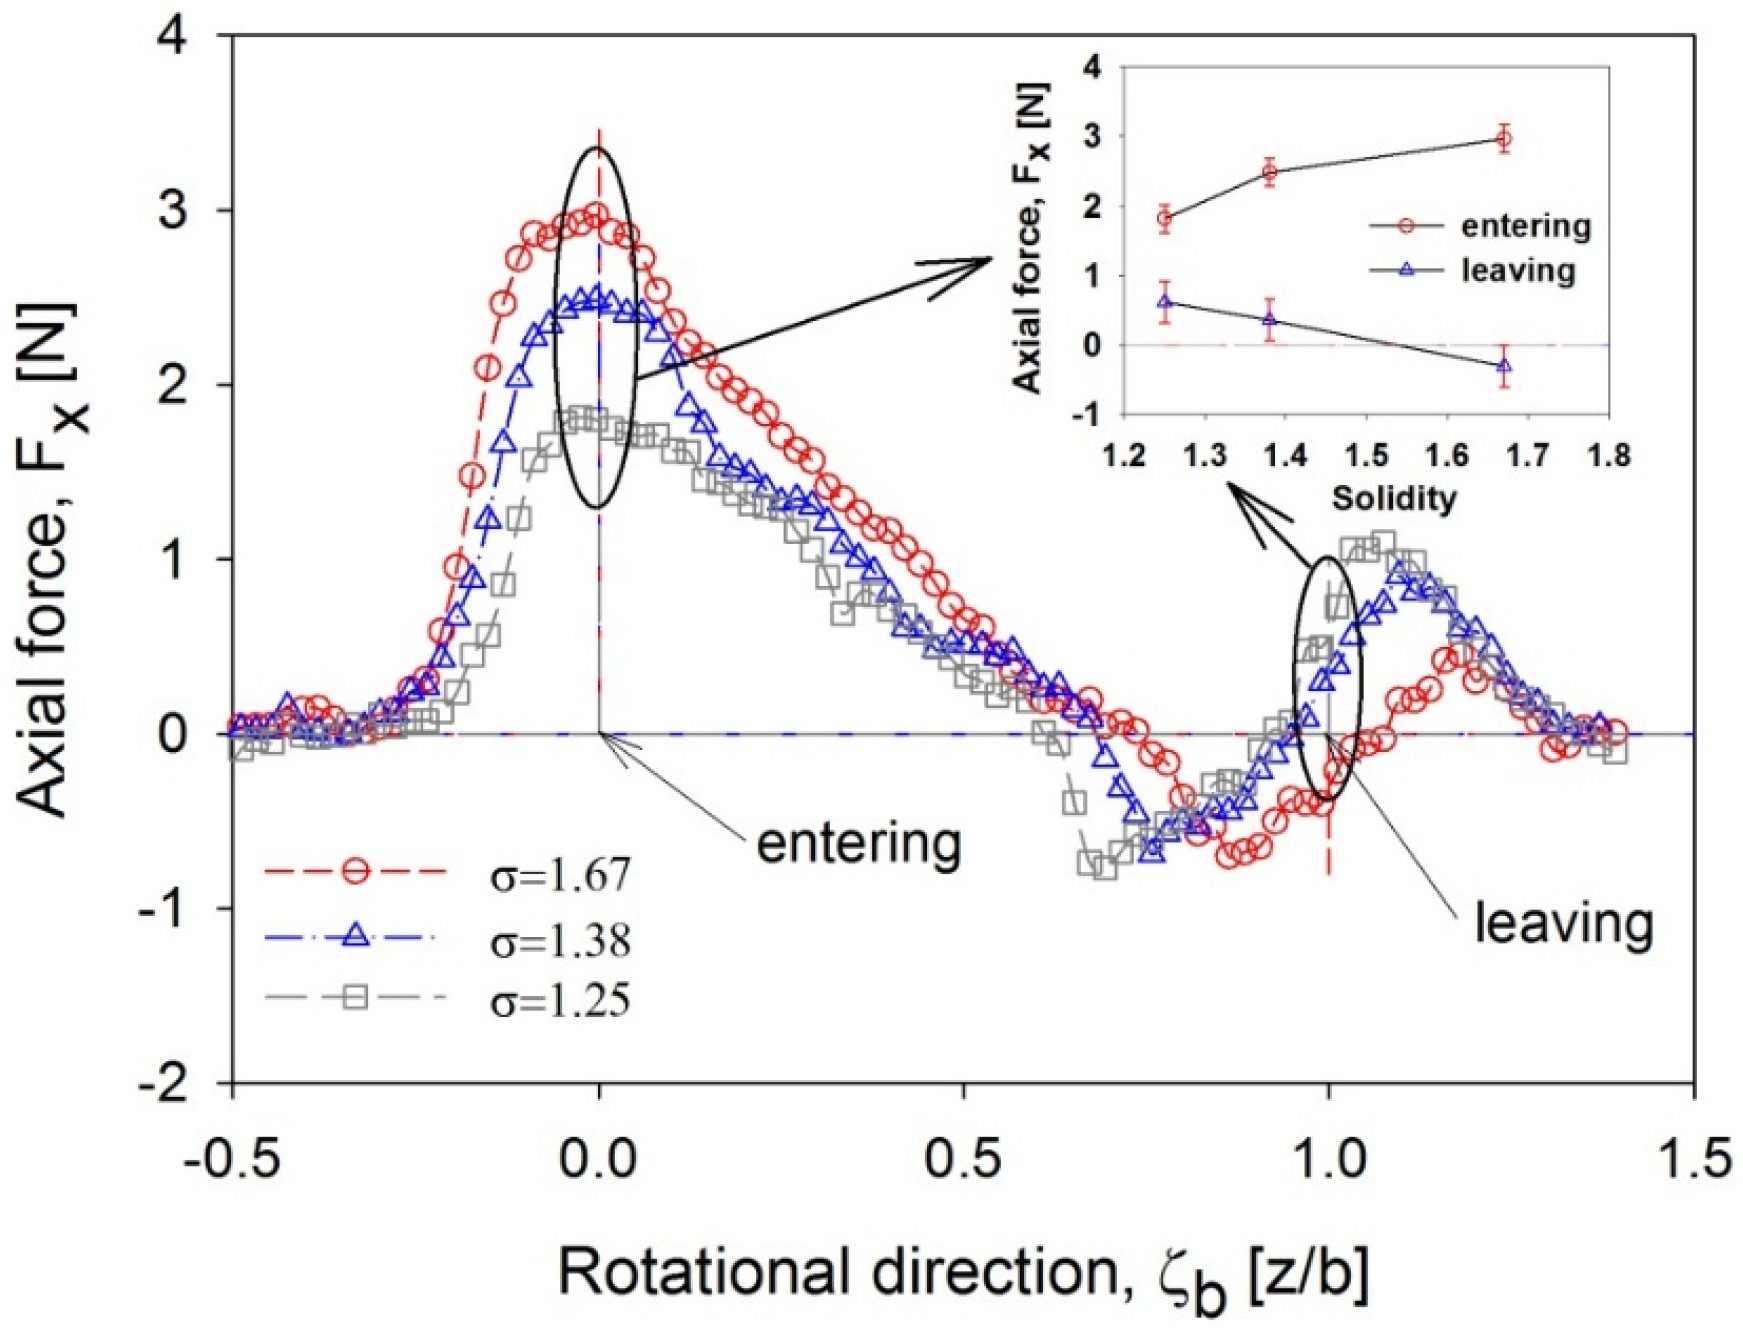
3. Experimental Result and Discussion

The coordinates of the linear cascade apparatus are shown in Figure 4 with the blades in order to make clear the notation in the experimental results. The “z” represents the rotational direction of the blade, which is the same as the direction of the blade movement. The “x” and “y” represent the axial direction and the spanwise direction, respectively. The origin of the coordinates is the intersection between the extension of the nozzle sidewall (N1) shown in Figure 1 and an imaginary line drawn by moving the leading edge of the blade. This intersection is the location at which the blade enters the admission region. Another intersection can be obtained by extending the nozzle sidewall (N2) shown in Figure 1 to meet with the identical imaginary line drawn by the leading edge. This intersection is located where the blade leaves the admission region.
Figure 4. Coordinates and nozzle on the linear cascade experimental apparatus.
Energies 08 12385 g004

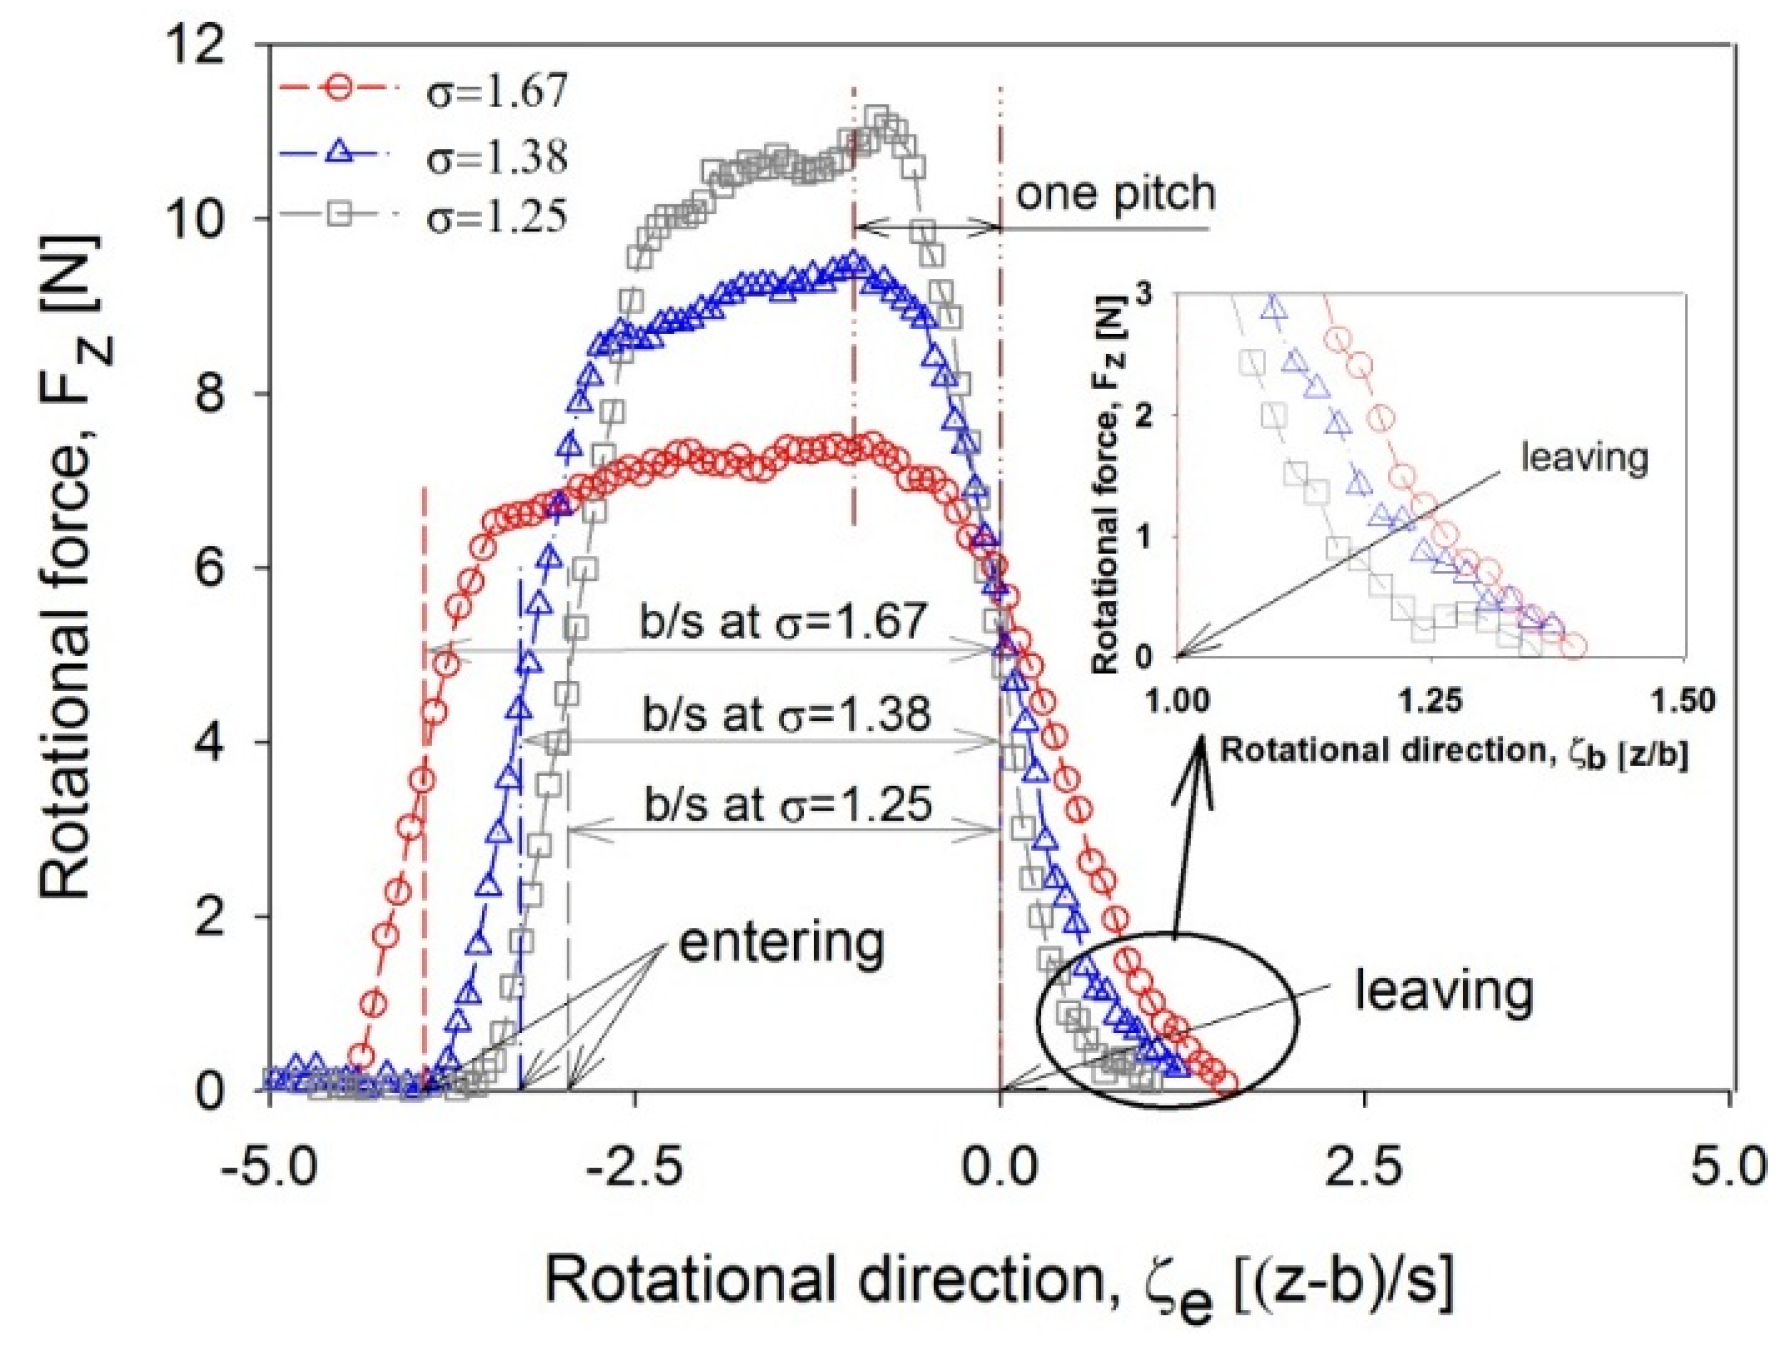
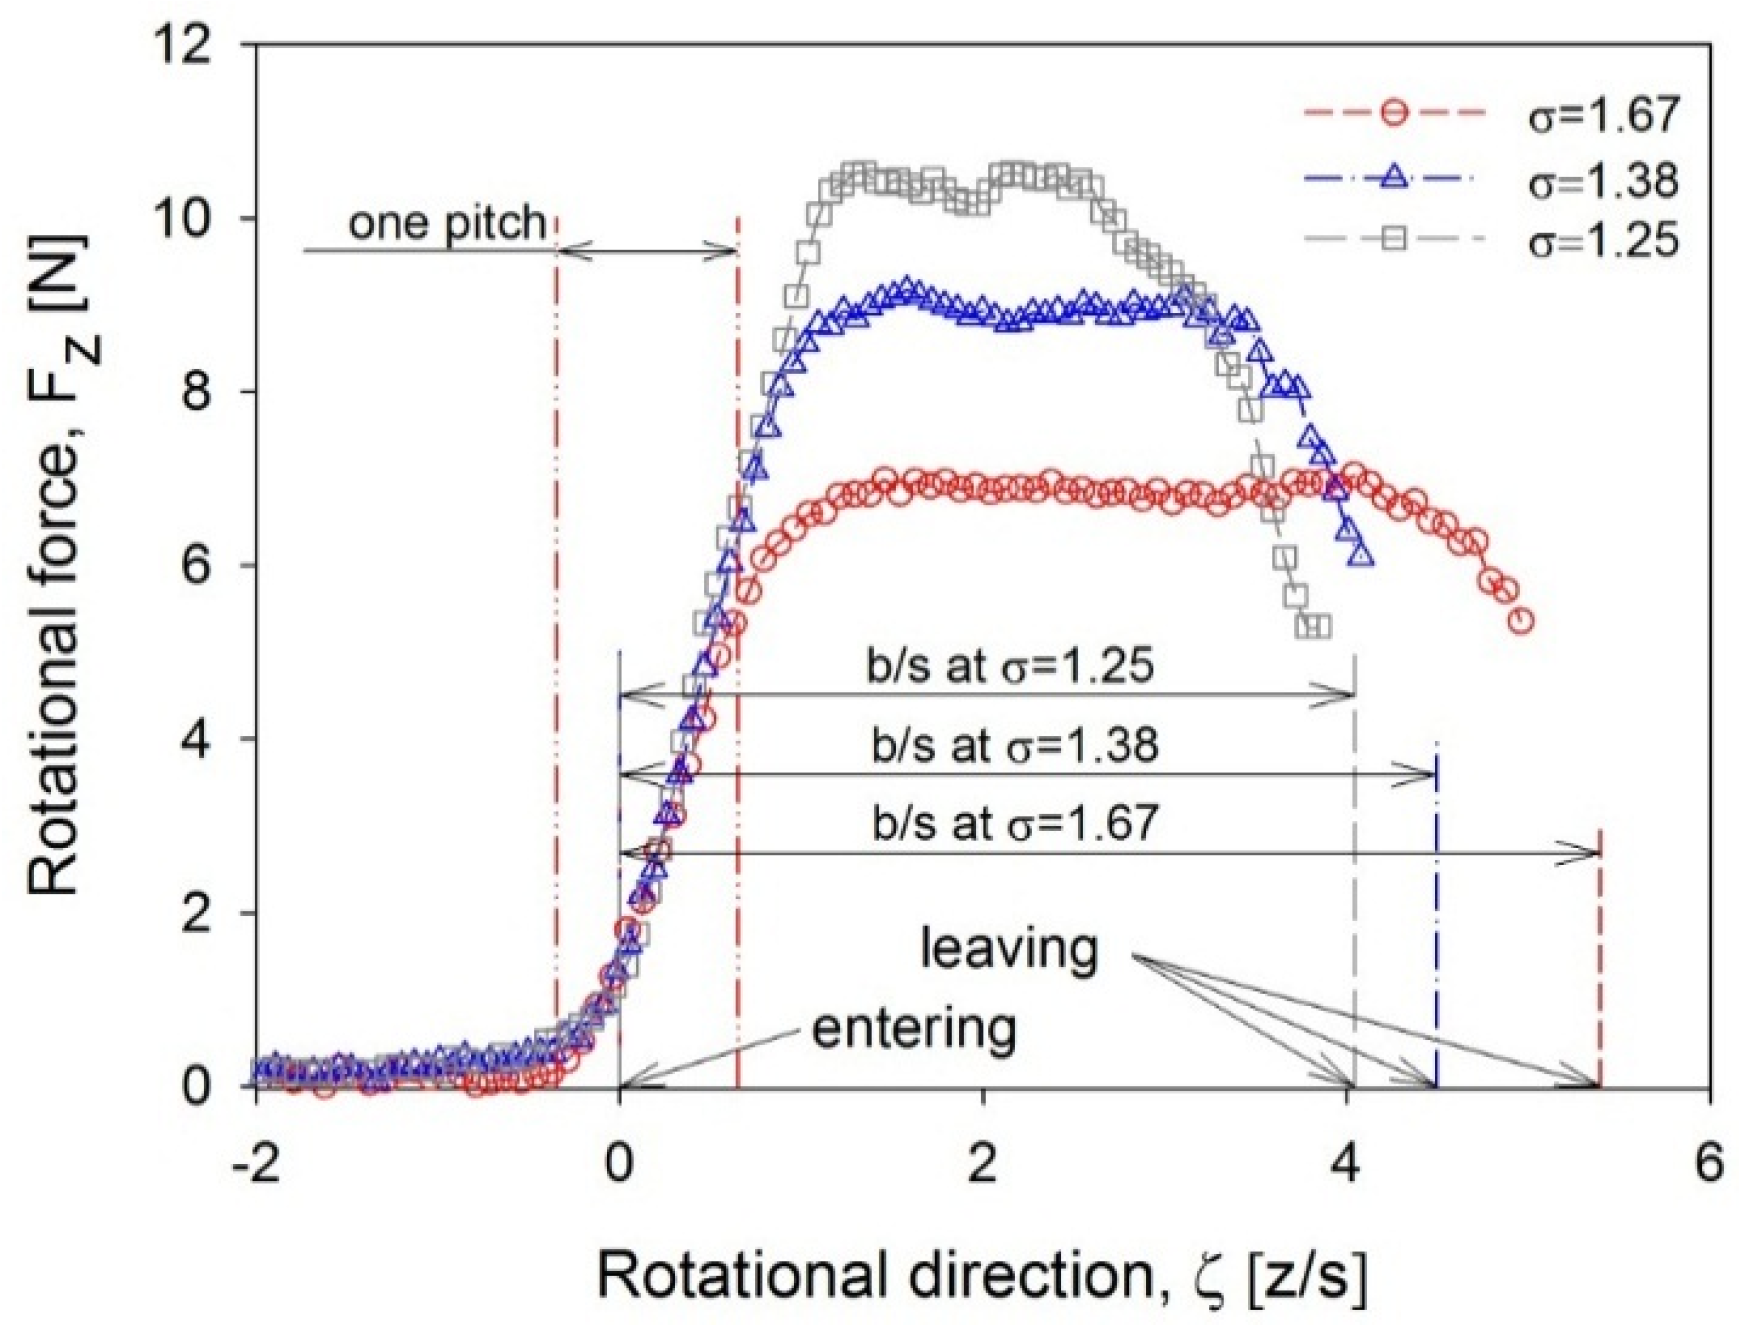
3.1. Nozzle Flow Angle of α = 65°

Figure 5 shows the rotational forces measured on a blade along the rotational direction with three different solidities while the nozzle flow angle was set to 65°. The blade was moved by 10 mm along the rotational direction, and then the rotational forces and axial forces were measured simultaneously with surface pressures on the blade at the steady state. The rotational force always increased at the same location even though three different solidities were applied. The starting location was approximately a half-pitch ahead of the entering location, and then the rotational force increased linearly until the blade moved forwards a distance of one pitch. Larger operating forces were obtained with a smaller solidity because the blades having smaller solidity received more momentum. However, the mean rotational forces for these three cases, which were evaluated using Equation (1) while assuming that infinite blades were applied, were almost the same since they were evaluated at 31.2–31.8 N. These values could be compared with the result obtained using a circular-type nozzle. In the experiment with a circular-type nozzle [20], the cross-sectional area of the nozzle was smaller than that of the rectangular-type nozzle. Thus, the results were evaluated based on the equivalent experimental condition. The mean rotational forces were 22.9–24.05 N, which were lower than those obtained using a rectangular-type nozzle. This resulted from the cross-sectional shape that was changed from circular to ellipse in the admission region. In partial admission, expansion loss was generated because the nozzle flow expanded into the inactive region. This expansion loss increased in a circular-type nozzle because the contacting area with the inactive region was increased when its shape changed to ellipse. This resulted in the low mean rotational forces.
Figure 5. Variation of rotational forces with different solidities at α = 65°.
Energies 08 12385 g005
F mean = N F z , i N = + F z d z + d z
Figure 6 shows the variation in the rotational forces when the blade approaches the end of the admission region, i.e., the leaving location. Despite the different solidities, the rotational forces always began to decrease at about the same location within one pitch prior to the leaving location. However, in the following inactive region, these rotational forces completely decayed at different ζ-locations, even though they began to weaken at the same location. This result means that the decaying distance of the rotational force is not related to the pitch (s), but to the expansion width of the nozzle flow. When the abscissa is re-drawn based on the admission region (b) instead of the pitch (s), the rotational forces all completely disappear at virtually the same location, as shown in the small figure in the right-hand corner.
Figure 6. Comparison of rotational forces based on the end of admission region at α = 65°.
Energies 08 12385 g006
The axial force variation is shown in Figure 7 according to the three different solidities. These forces were varied with a similar trend for all three cases. For a larger solidity cascade, the maximum axial force increased at the entering location. This maximum axial force proportionally increased with the increment of the solidity, as shown in the small figure in the upper right-hand corner. The reason for this was that the flow expansion into the preceding inactive region was limited because of the small pitch, thus yielding high pressure on the suction surface of the fore blade. This pressure was directly related to the increase in the axial force. Even though the applied solidities were different, the maximum axial forces appeared at the identical location of ζb = 0. This result was quite different compared with the experimental results used a circular-type nozzle [20]. In a circular-type nozzle, the expansion were strongly occurred at the leaving location, and the maximum axial forces appeared at the location of ζb = 1.
Figure 7. Variation of axial forces with different solidities at α = 65°.
Energies 08 12385 g007
Pressures on the blade surface were measured at the entering location, where the maximum axial force was obtained. These pressures were converted to the static pressure coefficient, as defined in Equation (2):
C p = ( P s local P s in ) ( P t in P s in )
where Pt and Ps in Equation (2) represent the total pressure and the static pressure, respectively. The subscripts “in” and “local” indicate the location at the nozzle inlet and on the blade surface, respectively. Figure 8 shows the static pressure distribution on the blade for the three different solidities at the mean, and also it shows the reference length for the magnitude of the static pressure coefficient at Cp = 0.5. The experimental results show that the axial force is produced mainly by the pressure on the suction surface. Meanwhile, the pressure on the pressure surface has only a slight influence on the axial force because pressure towards the axial direction cancels itself out. The blade row with the largest solidity showed substantial pressure on the suction surface of the fore blade. Hence, the largest axial force was obtained on the cascade having σ = 1.67 at the entering location.
Figure 8. Shape of static pressure coefficient on the blade surface at the entering location: (a) σ = 1.25; (b) σ = 1.38; and (c) σ = 1.67.
Energies 08 12385 g008

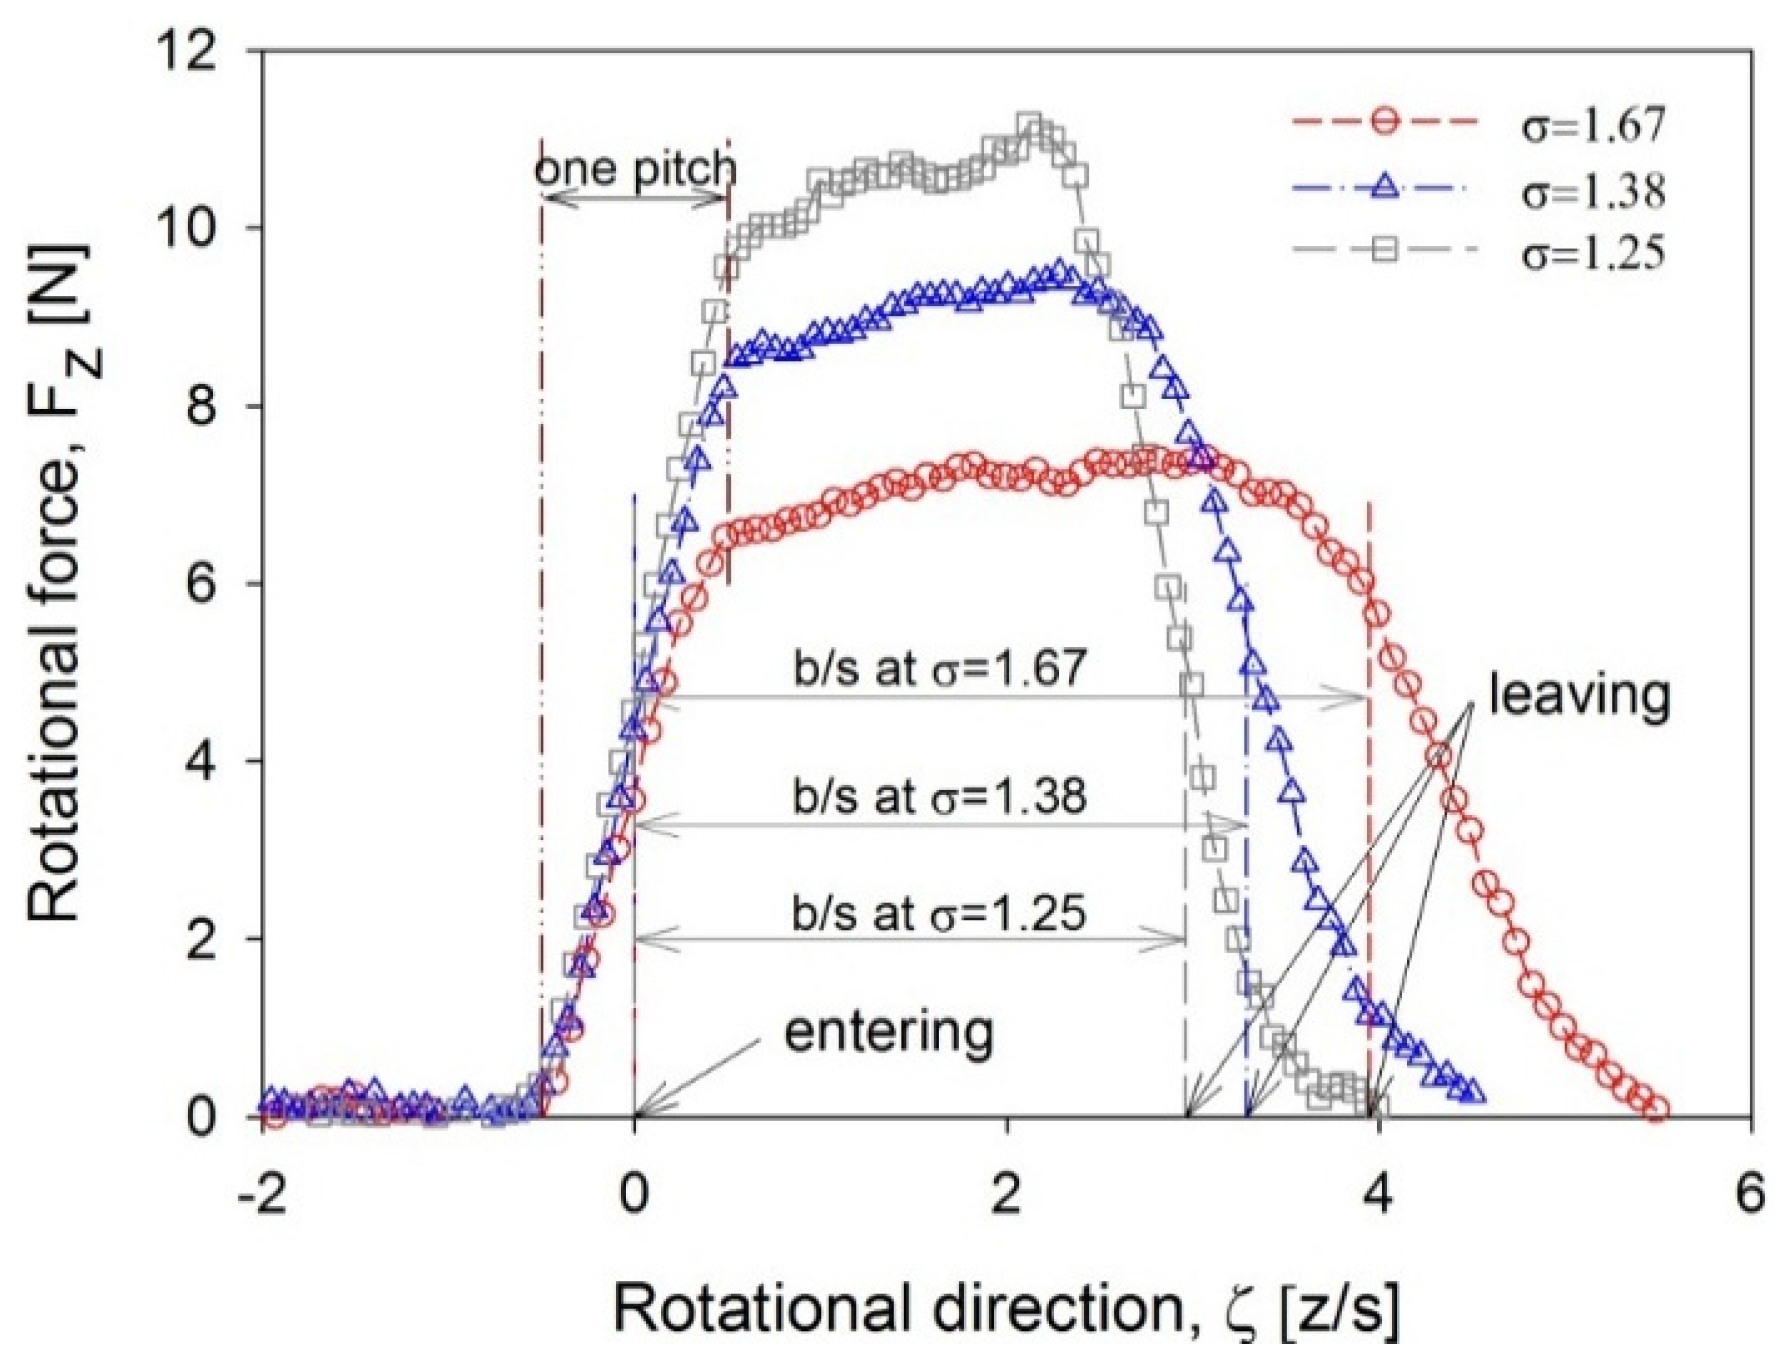
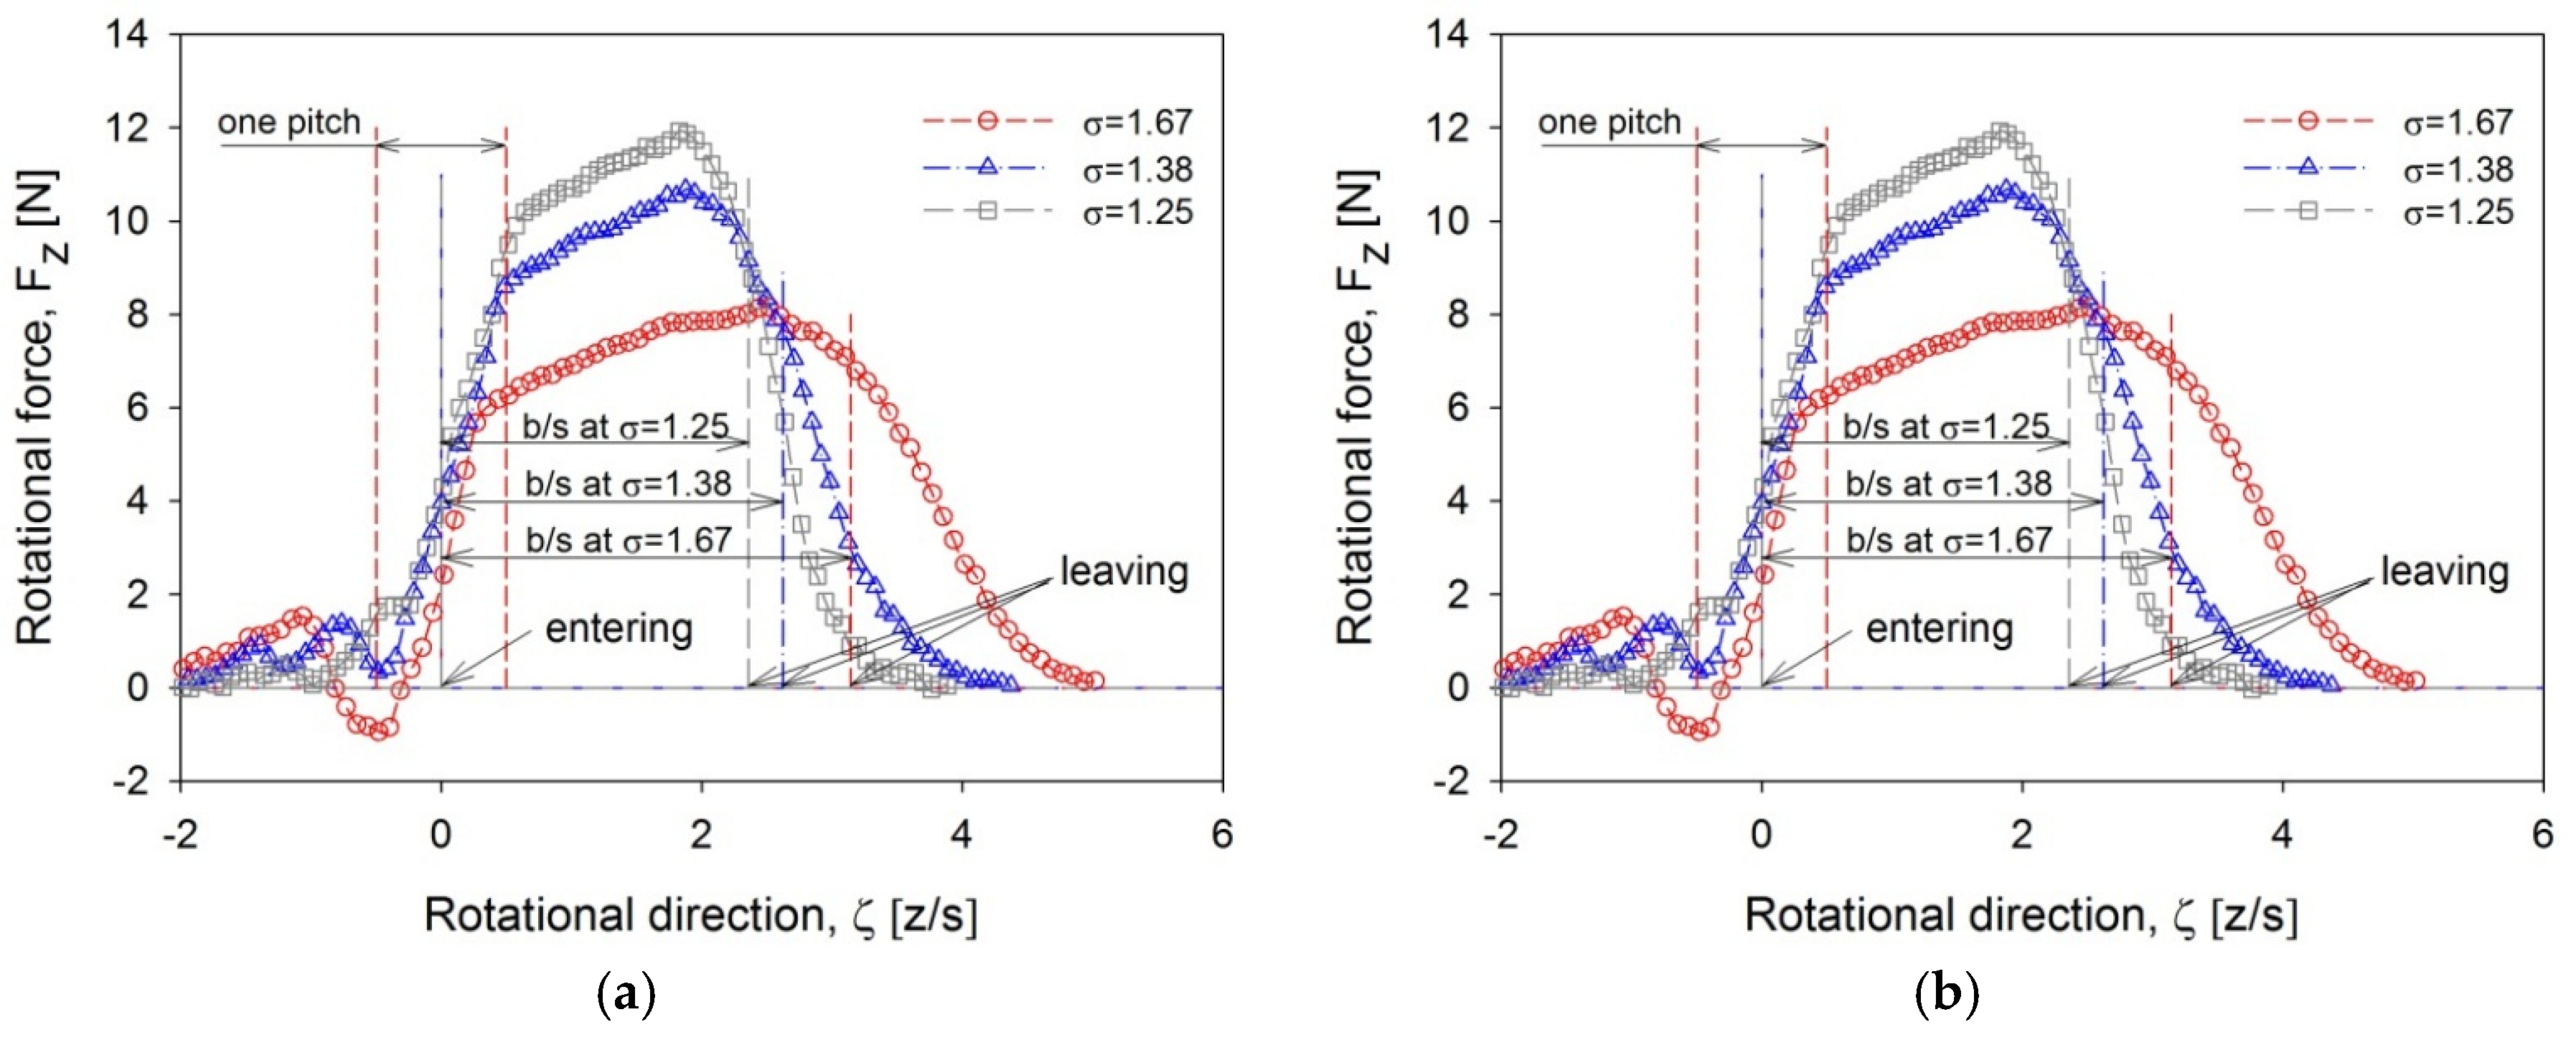
3.2. Nozzle Flow Angle of α = 72°

The rotational speed of turbo-expanders can be changed depending on the input flow condition or output power. Sometimes, turbo-expanders need to operate at off-design points. Increasing the nozzle flow angle serves to simulate the operating condition of a turbo-expander rotating faster than its design point. In an experiment to investigate such operation, the nozzle was set to the flow angle of α = 72° with the blade rows having three different solidities. The origin of the coordinates on this cascade apparatus was determined by the same method explained in Section 3.1. Figure 9 shows the variation of the rotational forces with the three different solidities. Compared to the results obtained at α = 65°, the maximum rotational forces were slightly decreased because the experiment was conducted at the same mass flow rate with an increased admission region. In regards to the solidity change, the maximum rotational force increased as the solidity of the cascade decreased.
Figure 9. Variation of rotational forces with different solidities at α = 72°.
Energies 08 12385 g009
As the blade approached the admission region from the preceding inactive region, the rotational force began to increase within a half pitch before the admission region and continued to increase as the blade moved forward by a distance of one and half pitches. These phenomena differed from the results measured at α = 65°, i.e., when the nozzle flow angle increased to 72° from 65°, the location where the rotational force was generated moved closer to the entering location, and the distance needed for the rotational force to reach its maximum was longer. When the nozzle flow angle is increased at the same mass flow rate, both the axial velocity in the admission region and the expansion to the preceding inactive region are reduced. In addition, the region influenced by the nozzle wall grows wider when this region is projected onto the rotational direction. As a result of these changes, the distance needed for the rotational force to reach its peak increases and the location for generating the rotational force shifts towards the entering location.
Figure 10 shows the variation of the axial forces measured with different solidities along the rotational direction. At the entering location, the axial forces show negative force, which means that the force is directed upstream. These results are quite different from the results at α = 65°. In addition, a larger negative axial force was measured for a smaller solidity cascade. In order to analyze these different phenomena, the static pressure distribution on the blade surface was drawn at the mean for the blade having α = 1.25 when the blade passed the entering and leaving location, as shown in Figure 11. Low pressure on the suction surface of the fore blade caused the negative axial force at the entering location. However, at the leaving location, high pressure on the pressure surface of the aft blade resulted in a positive axial force.
Figure 10. Axial forces on the blade along the circumferential direction at α = 72°.
Energies 08 12385 g010
Figure 11. Shape of static pressure coefficient on the blade of σ = 1.25 at the entering and leaving location: (a) at ζ = 0.03 and (b) at ζ = 4.03.
Energies 08 12385 g011
The variation in the static pressure on the blade surface with three different solidities along the rotational direction is shown in Figure 12. The pressure on the suction surface of the blade is shown in the lower part of the figure, while the upper part shows the pressure on the pressure surface for comparison. For a blade with smaller solidity, the pressure on the suction surface at the entering location decreased, and this pressure remained low throughout the admission region, as compared with the blades having solidities of 1.38 or 1.65. In addition, high pressure on the pressure surface was obtained. Therefore, this wide pressure difference between the suction and pressure surface produced large rotational force on the blade. In the experiment with different solidities, the wide pressure difference between the suction and pressure surfaces was obtained for a smaller solidity cascade because one blade received more momentum due to the wide passage.
Figure 12. Variation of static pressure coefficient with three different solidities at α = 72°. (a) σ = 1.25; (b) σ = 1.38; (c) σ = 1.67.
Energies 08 12385 g012

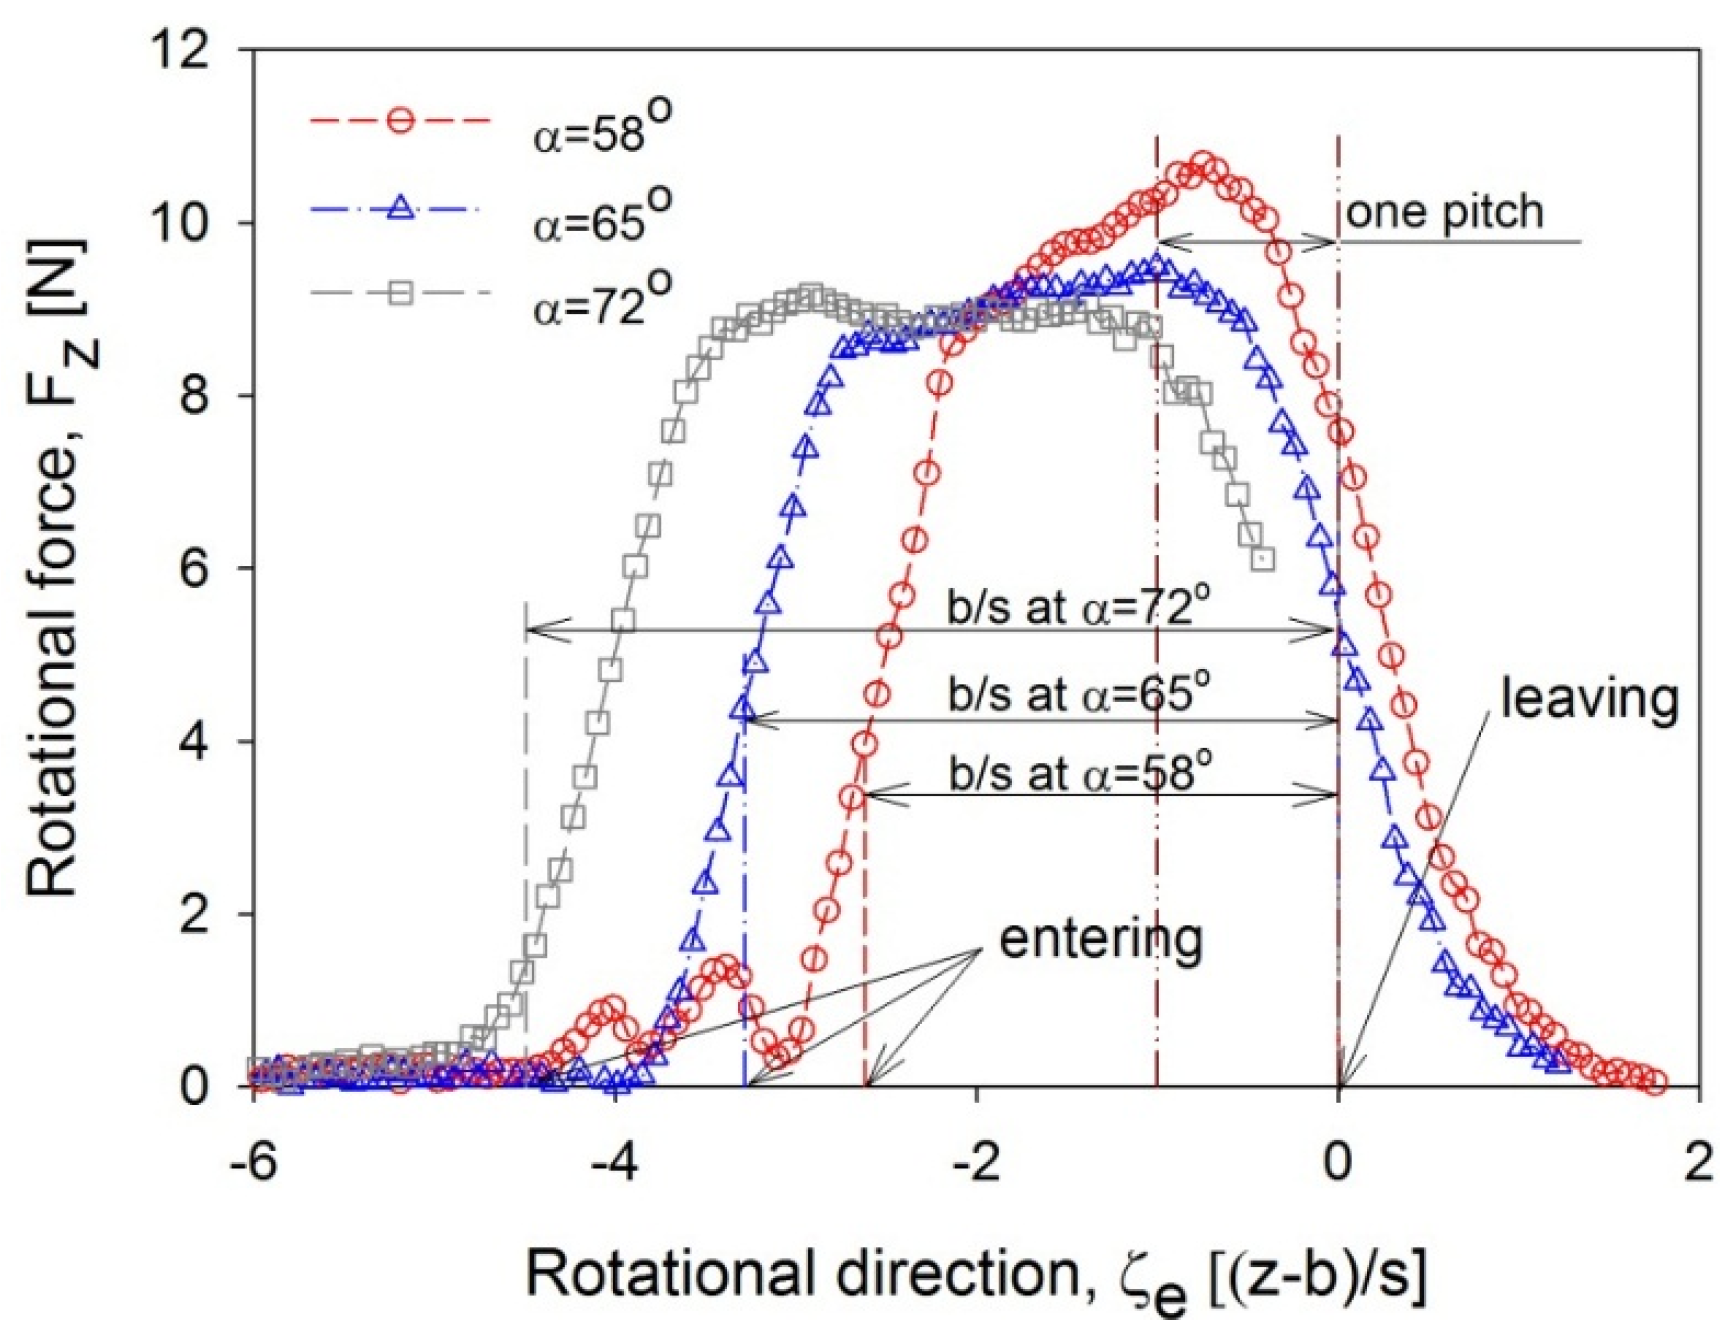
3.3. Nozzle Flow Angle of α = 58°

To simulate another operation at an off-design point, the nozzle was set to the flow angle of 58°. Figure 13 shows the rotational forces and axial forces with the three different solidities. The variation of these forces along the rotational direction was quite similar to those obtained at α = 65°. In addition, the rotational forces were fully developed within a distance of one pitch before the blade entered the admission region, but the magnitude of the operating forces measured at α = 58° was larger. If a nozzle is installed with a nozzle flow angle smaller than the design point, then the admission region is reduced. Hence, the axial velocity of the spouting nozzle flow increases in the admission region. This increased axial velocity in turn causes the maximum rotational and axial forces to increase. However, the increased forces cannot guarantee the increment of the output power due to the narrow admission region. When the mean rotational forces were evaluated using Equation (1), they showed almost the same force of 29.1–29.9 N even though the applied solidity was different. However, these mean forces were slightly smaller than those obtained at α = 65°.
When the blade approached the entering location from the preceding inactive region, the rotational or axial force smoothly developed for the cases of α = 65° or α = 72°. However, in the experiment at α = 58°, these forces oscillated with a larger solidity cascade. Figure 14 shows the pressure measured at each pressure tap on the blade having σ = 1.67 in the oscillating region. This figure clearly shows that the location of high pressure on the suction surface of the fore blade moves from S3 to S1 according to the blade movement. This phenomenon occurred because the nozzle flow expanded into the preceding inactive region. As the blade approached the admission region, the pressure taps located at the middle of the blade were affected early by the expanded nozzle flow. This affected region then migrated towards the leading edge since the nozzle flow angle was reduced as compared to the design point.
Figure 13. Operating forces on the blade along the rotational direction at α = 58°: (a) rotational force and (b) axial force.
Energies 08 12385 g013
Figure 14. Variation of static pressure coefficient along the blade of σ = 1.67 in the preceding inactive region: (a) on the suction surface and (b) on the pressure surface.
Energies 08 12385 g014
During the expansion of the nozzle flow into the inactive region, a powerful nozzle flow absorbs the surrounding air and spouts together. In particular, the quantity of absorbed air increases when the flow direction of the absorbing air is close to the nozzle flow direction, such as at the entering location. This absorbed air reduced the expansion of the nozzle flow into the inactive region. However, if the nozzle flow angle is reduced, the expansion of the nozzle flow widens because the effect of the absorbed air is reduced. In such cases, the expanded stream flows towards the blade suction surface instead of along the blade surface. Therefore, high pressure on the suction surface of the fore blade was measured, but this expansion had only a slight influence on the pressure on the pressure surface, as shown in Figure 14.
Figure 15 shows the pressure distribution measured at the pressure tap of S1 and P8 on the blade of σ = 1.67. These two pressure taps were chosen because the pressures on S1 and P8 were highly effective in determining the axial force due to their force direction. The experimental result on S1 shows the peak pressures for three different spanwise locations in the preceding inactive region. These peak pressures were measured at the same location regardless of the spanwise location, and the pressures were abruptly changed at this location. As mentioned in regards to the expansion of the nozzle flow, the effect of the expanded stream on the inactive region depended on the nozzle flow angle. In the preceding inactive region, the flow angle of the expanded stream became less than the nozzle flow angle. Therefore, when the blade moved into the expanded region, a stagnant region occurred on the suction surface of the blade, and the peak pressure appeared in this stagnant region. As the blade moved forward, this pressure gradually decreased until the lowest pressure was obtained at a distance of one pitch ahead of the leaving location.
Figure 15. Variation of static pressure coefficient on the suction (S1) and pressure surfaces (P8).
Energies 08 12385 g015
In the expansion of the nozzle flow in the following inactive region, the nozzle flow was slightly influenced by the flow absorbed from the surrounding region because the flow direction of the absorbing stream was nearly opposite to that of the nozzle flow. Thus, the expanded region decreased when the nozzle flow angle was reduced. This reduced expansion region reduced the effect of the expansion when the blade approached the leaving location. Figure 16 shows the rotational force measured at α = 58° compared with those measured with two different nozzle flow angles. The experiment was conducted at the same solidity of σ = 1.34 and the rotational forces were redrawn based on the leaving location. For a smaller nozzle flow angle, the maximum rotational force was maintained for a longer distance even though the blade entered within a distance of one pitch ahead of the leaving location.
Figure 16. Comparison of rotational forces on the blade of σ = 1.38 with different nozzle angles.
Energies 08 12385 g016

4. Conclusions

In a linear cascade simulating the operation of a turbo-expander working in a low partial admission rate, the force and surface pressure on a blade were measured with three different nozzle flow angles and solidities. Comparing with the performance on design point, the maximum rotational force increased when the nozzle flow angle was decreased to 58°. However, this rotational force slightly oscillated at the region where the blade moved from the inactive region into the admission. For a larger nozzle flow angle, the maximum rotational force decreased and the negative axial force was measured due to the strong expansion into the inactive region. At the same nozzle flow angle, the maximum rotational force was more substantial for a smaller solidity. The mean rotational force for any nozzle flow angle remained virtually the same regardless of the solidity in assuming that infinite blades were applied. As for the surface pressure, pressure on the suction surface of the fore blade was highly affected by variations in the nozzle flow angle, and the axial force of the blade was mainly determined by this pressure. Hence, these results can guide an appropriate direction for designing a turbo-expander operating in a low partial admission, and they can also be usefully applied to make a better loss model for performance prediction.

Acknowledgments

The authors would like to acknowledge the financial support offered by a grant (No. KRF-2008-005-J01001) from the Korea Research Foundation Grant funded by the Korean government.

Author Contributions

All authors contributed equally to this work. All authors were involved in the design of the experimental apparatus and discussion of the results. The manuscript was written by Soo-Yong Cho and commented on by Sang-Kyu Choi and Chae Hwan Rim. The experiment was conducted by Chong-Hyun Cho under the supervision of Soo-Yong Cho and Sang-Kyu Choi. The analysis of the experimental results was done by Chae Hwan Rim.

Conflicts of Interest

The authors declare no conflict of interest.

References

  1. Pei, G.; Li, J.; Li, Y.; Wang, D.; Ji, J. Construction and dynamic test of a small-scale Organic Rankine cycle. Energy 2011, 36, 3215–3223. [Google Scholar] [CrossRef]
  2. Kang, S.H. Design and experimental study of ORC and radial turbine using R245fa working fluid. Energy 2012, 41, 514–524. [Google Scholar] [CrossRef]
  3. Capata, R.; Hernandez, G. Preliminary design and simulation of a turbo expander for small rated power organic Rankine cycle (ORC). Energies 2014, 7, 7067–7093. [Google Scholar] [CrossRef]
  4. Pierobon, L.; Nguyen, T.; Mazzucco, A.; Lasenn, U.; Haglind, F. Part-load performance of a wet indirectly fired gas turbine integrated with the organic Rankine cycle turbogenerator. Energies 2014, 7, 8294–8316. [Google Scholar] [CrossRef] [Green Version]
  5. Cho, S.Y.; Cho, C.H.; Ahn, K.Y.; Lee, Y.D. A study of the optimal operating conditions in the organic Rankine cycle using a turbo-expander for fluctuations of the available thermal energy. Energy 2014, 64, 900–911. [Google Scholar] [CrossRef]
  6. Bohn, D.; Gier, J.; Ziemann, M. Influence of the cross-over channel geometry on the flow equalization in partial-admission turbines. VGB PowerTech. Engl. Ed. 1988, 78, 49–54. [Google Scholar]
  7. Musatkin, N.F.; Tikhonov, N.T. Influence of upper and lower overlap on efficiency of partial-admission axial air microturbine. Sov. Aeronaut. 1979, 22, 95–97. [Google Scholar]
  8. Skopec, J.; Vomela, L.; Tajc, L.; Polansky, J. Partial steam admission in an axial turbine stage. In Proceedings of the IMechE International Conference on Third European Conference on Turbomachinery’99, Conference Transactions, London, UK, 2–5 March 1999; pp. 681–691.
  9. Cho, S.Y.; Cho, T.H.; Choi, S.K. An experimental study of the performance characteristics with four different rotor blade shapes on a small mixed-type turbine. J. Mech. Sci. Technol. 2005, 19, 1478–1487. [Google Scholar] [CrossRef]
  10. Sutton, R.F.; Boynton, J.L.; Scheer, D. Small, two-stage, partial admission turbine. In Proceedings of the 1985 JANNAF Propulsion Meeting: the Town & Country Hotel, San Diego, CA, USA, 9–12 April 1985.
  11. Doyle, M.D.C. Theories for predicting partial-admission losses in turbines. J. Aerosp. Sci. 1962, 29, 489–490. [Google Scholar] [CrossRef]
  12. Ohlssson, G.O. Partial-admission turbines. J. Aerosp. Sci. 1962, 29, 1017–1028. [Google Scholar] [CrossRef]
  13. Balje, O.E.; Binsley, R.L. Axial turbine performance evaluation Part A—Loss geometry relationships. J. Eng. Power 1968, 19, 341–348. [Google Scholar]
  14. Yahya, S.M. Partial admission turbines and their problems. Bull. Mech. Eng. Ed. 1970, 9, 263–273. [Google Scholar]
  15. Korematsu, K.; Hirayama, N. Performance Estimation of Partial Admission Turbines. In Proceedings of the ASME 1979 International Gas Turbine Conference and Exhibit and Solar Energy Conference, San Diego, CA, USA, 12–15 March 1979.
  16. Verneau, A. Supersonic Turbines for Organic Fluid Rankine Cycles from 3 kW to 1300 kW. Von Karman Inst. Fluid Dyn. 1987, 7, 1–22. [Google Scholar]
  17. Cho, S.Y.; Cho, C.H.; Kim, C. Performance prediction on a partially admitted small axial-type turbine. JSME Int. J. Ser. B Fluid. Therm. Eng. 2006, 49, 1290–1297. [Google Scholar] [CrossRef]
  18. Yahya, S.M. Some tests on partial admission turbine cascades. Int. J. Mech. Sci. 1969, 11, 853–866. [Google Scholar] [CrossRef]
  19. Cho, S.Y.; Cho, C.H.; Ahn, K.Y.; Kim, Y.C. Forces and surface pressure on a blade moving in front of the admission region. J. Fluid. Eng. 2010, 132. [Google Scholar] [CrossRef]
  20. Cho, S.Y.; Ahn, K.Y.; Lee, Y.D.; Kim, Y.C. Pressure and force on a blade row operated in partial admission with different solidity. J. Mech. Sci. Technol. 2013, 27, 387–396. [Google Scholar] [CrossRef]

