Article

Contribution of Vertical Methane Flux to Shallow Sediment Carbon Pools across Porangahau Ridge, New Zealand

1
Naval Research Laboratory, Washington, DC 20375, USA
2
Department of Environmental Science and Policy, George Mason University, Fairfax, VA 22030, USA
3
United States Naval Academy, Annapolis, MD 21402, USA
4
Naval Research Laboratory, National Research Council, Washington, DC 20375, USA
5
Department of Geology, University of Maryland College Park, College Park, MD 20742, USA
6
Hawaii Natural Energy Institute, University of Hawaii, Honolulu, HI 96822, USA
7
School of Environment, University of Auckland, Auckland 1142, New Zealand
*
Author to whom correspondence should be addressed.
Current Address: Department of Physical and Environmental Sciences, Texas A&M University—Corpus Christi, Corpus Christi, TX 78412, USA.
Energies 2014, 7(8), 5332-5356; https://doi.org/10.3390/en7085332
Submission received: 12 June 2014 / Revised: 4 August 2014 / Accepted: 11 August 2014 / Published: 18 August 2014
(This article belongs to the Special Issue Coastal Ocean Natural Gas Hydrate 2014)

Abstract

:
Moderate elevated vertical methane (CH4) flux is associated with sediment accretion and raised fluid expulsion at the Hikurangi subduction margin, located along the northeast coast of New Zealand. This focused CH4 flux contributes to the cycling of inorganic and organic carbon in solid phase sediment and pore water. Along a 7 km offshore transect across the Porangahau Ridge, vertical CH4 flux rates range from 11.4 mmol·m−2·a−1 off the ridge to 82.6 mmol·m−2·a−1 at the ridge base. Stable carbon isotope ratios (δ13C) in pore water and sediment were variable across the ridge suggesting close proximity of heterogeneous carbon sources. Methane stable carbon isotope ratios ranging from −107.9‰ to −60.5‰ and a C1:C2 of 3000 indicate a microbial, or biogenic, source. Near ridge, average δ13C for pore water and sediment inorganic carbon were 13C-depleted (−28.7‰ and −7.9‰, respectively) relative to all core subsamples (−19.9‰ and −2.4‰, respectively) suggesting localized anaerobic CH4 oxidation and precipitation of authigenic carbonates. Through the transect there was low contribution from anaerobic oxidation of CH4 to organic carbon pools; for all cores δ13C values of pore water dissolved organic carbon and sediment organic carbon averaged −24.4‰ and −22.1‰, respectively. Anaerobic oxidation of CH4 contributed to pore water and sediment organic carbon near the ridge as evidenced by carbon isotope values as low as to −42.8‰ and −24.7‰, respectively. Carbon concentration and isotope analyses distinguished contributions from CH4 and phytodetrital carbon sources across the ridge and show a low methane contribution to organic carbon.

1. Introduction

The majority of coastal sediment carbon cycling studies have focused on contributions from autochthonous photosynthetic marine and allocthonous terrigenous inputs [1,2,3]. However, hydrocarbons produced within deep sediment through thermochemical and microbiological conversions can significantly contribute to cycling of carbon, especially in shallower sediments and water column [4,5,6,7,8,9]. Stable carbon isotope ratios (δ13C) indicative of petroleum and methane (CH4) origins are found in bacterioplankton biomarkers [4]. In a related study in the Northeastern Pacific Ocean, it has been estimated that sediment methane contributes about 28% of the carbon to the water column dissolved organic carbon (DOC) pool [10,11] and is a significant energy resource for biological activity in many coastal regions worldwide [10,12,13,14]. Methane also contributes to carbon pools within shallow sediments [13,15,16].
Vertical CH4 flux in shallow sediments is predominantly controlled by anaerobic oxidation of methane (AOM) which occurs at the sulfate-methane transition (SMT) zone [17,18,19,20]. Equation (1) shows the net biochemical reaction for AOM in marine sediments:
CH4 + SO42− → HCO3 + HS + H2O
Comparison of SMT depths in CH4-rich sediments through different marine environments suggests a wide range in vertical CH4 flux rates that are dependent on CH4 concentrations and physical settings [16,21,22,23].
Natural abundance carbon isotopes have been useful for studying microbial cycling of hydrocarbons in marine environments [4,5,24,25,26,27]. Stable carbon isotope analysis (δ13C) of CH4 has been successfully used to distinguish between thermogenic and biogenic CH4 sources [28,29]. Furthermore, δ13C values of pore water dissolved inorganic carbon (DIC) and calcium carbonate (CaCO3) can provide an assessment of AOM and/or CH4 reduction through methanogenesis [14,30,31,32]. Vertical CH4 fluxes combined with carbon isotope analysis of organic and inorganic carbon pools in coastal ocean regions will help to quantify the contribution of CH4 to the shallow sediment carbon pools.
Along the Hikurangi Margin, the Pacific Plate subducts beneath the Australian Plate at a rate of 40–45 mm·year−1 [33]. On the southern margin, sediment accretion occurs at a rate of approximately 12 mm·year−1 [34] and subduction creates a focused vertical fluid flux from deep within the accretionary wedge and underthrust sediments [35]. In this study, the relative contribution of CH4 from subducting sediments and pelagic phytodetritus to shallow sediment is examined using δ13C values of solid phase sediment and pore water carbon pools (Figure 1). Focused fluid advection, observed immediately adjacent to the landward flank of the ridge, may contribute to carbon shallow sediment carbon cycling, along with ex situ pelagic derived organic matter (terrestrial and pelagic sources) [35,36,37]. This study provides further assessment of previous seismic data interpretation. We test the hypothesis that the different sources of carbon, CH4 and pelagic detritus, partition between dissolved and particulate carbon pools with CH4 as the primary contributor to pore water dissolved carbon and pelagic detritus the dominant contributor to sediment carbon (Figure 2).
Figure 1. Sediment core locations across the Porangahau Ridge on the Hikurangi Margin, east of northern New Zealand.
Energies 07 05332 g001

2. Methods

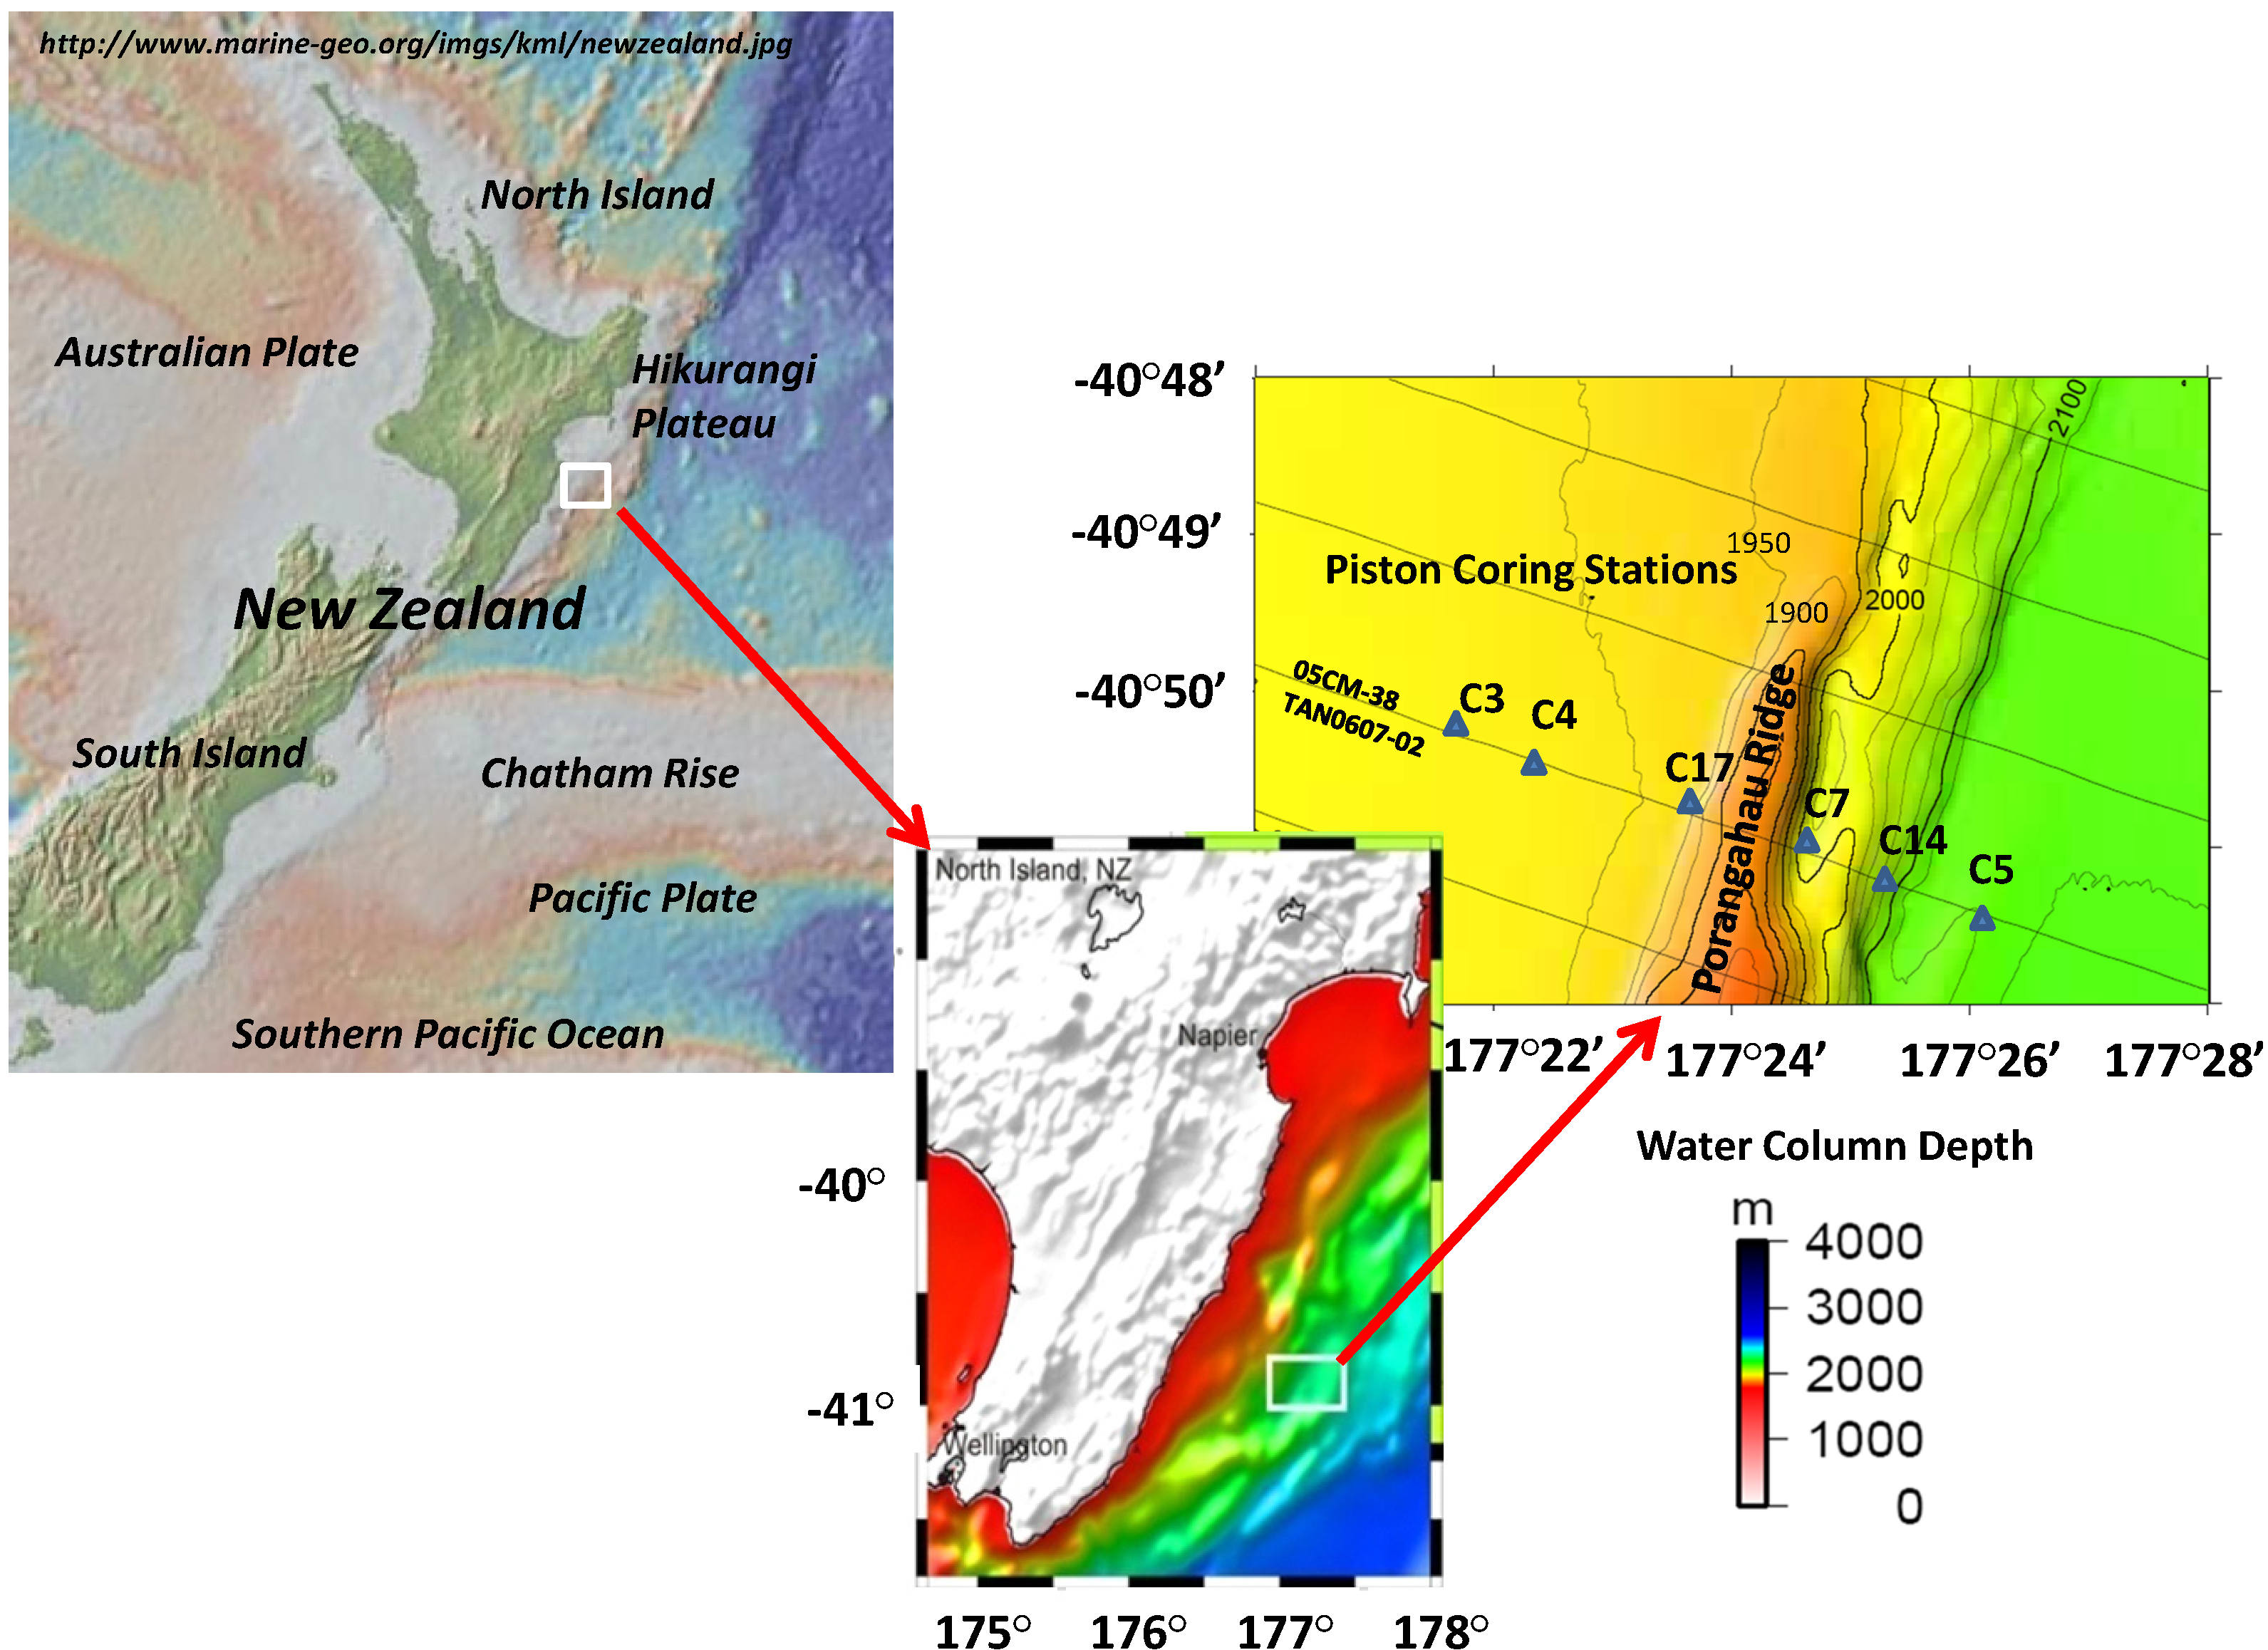
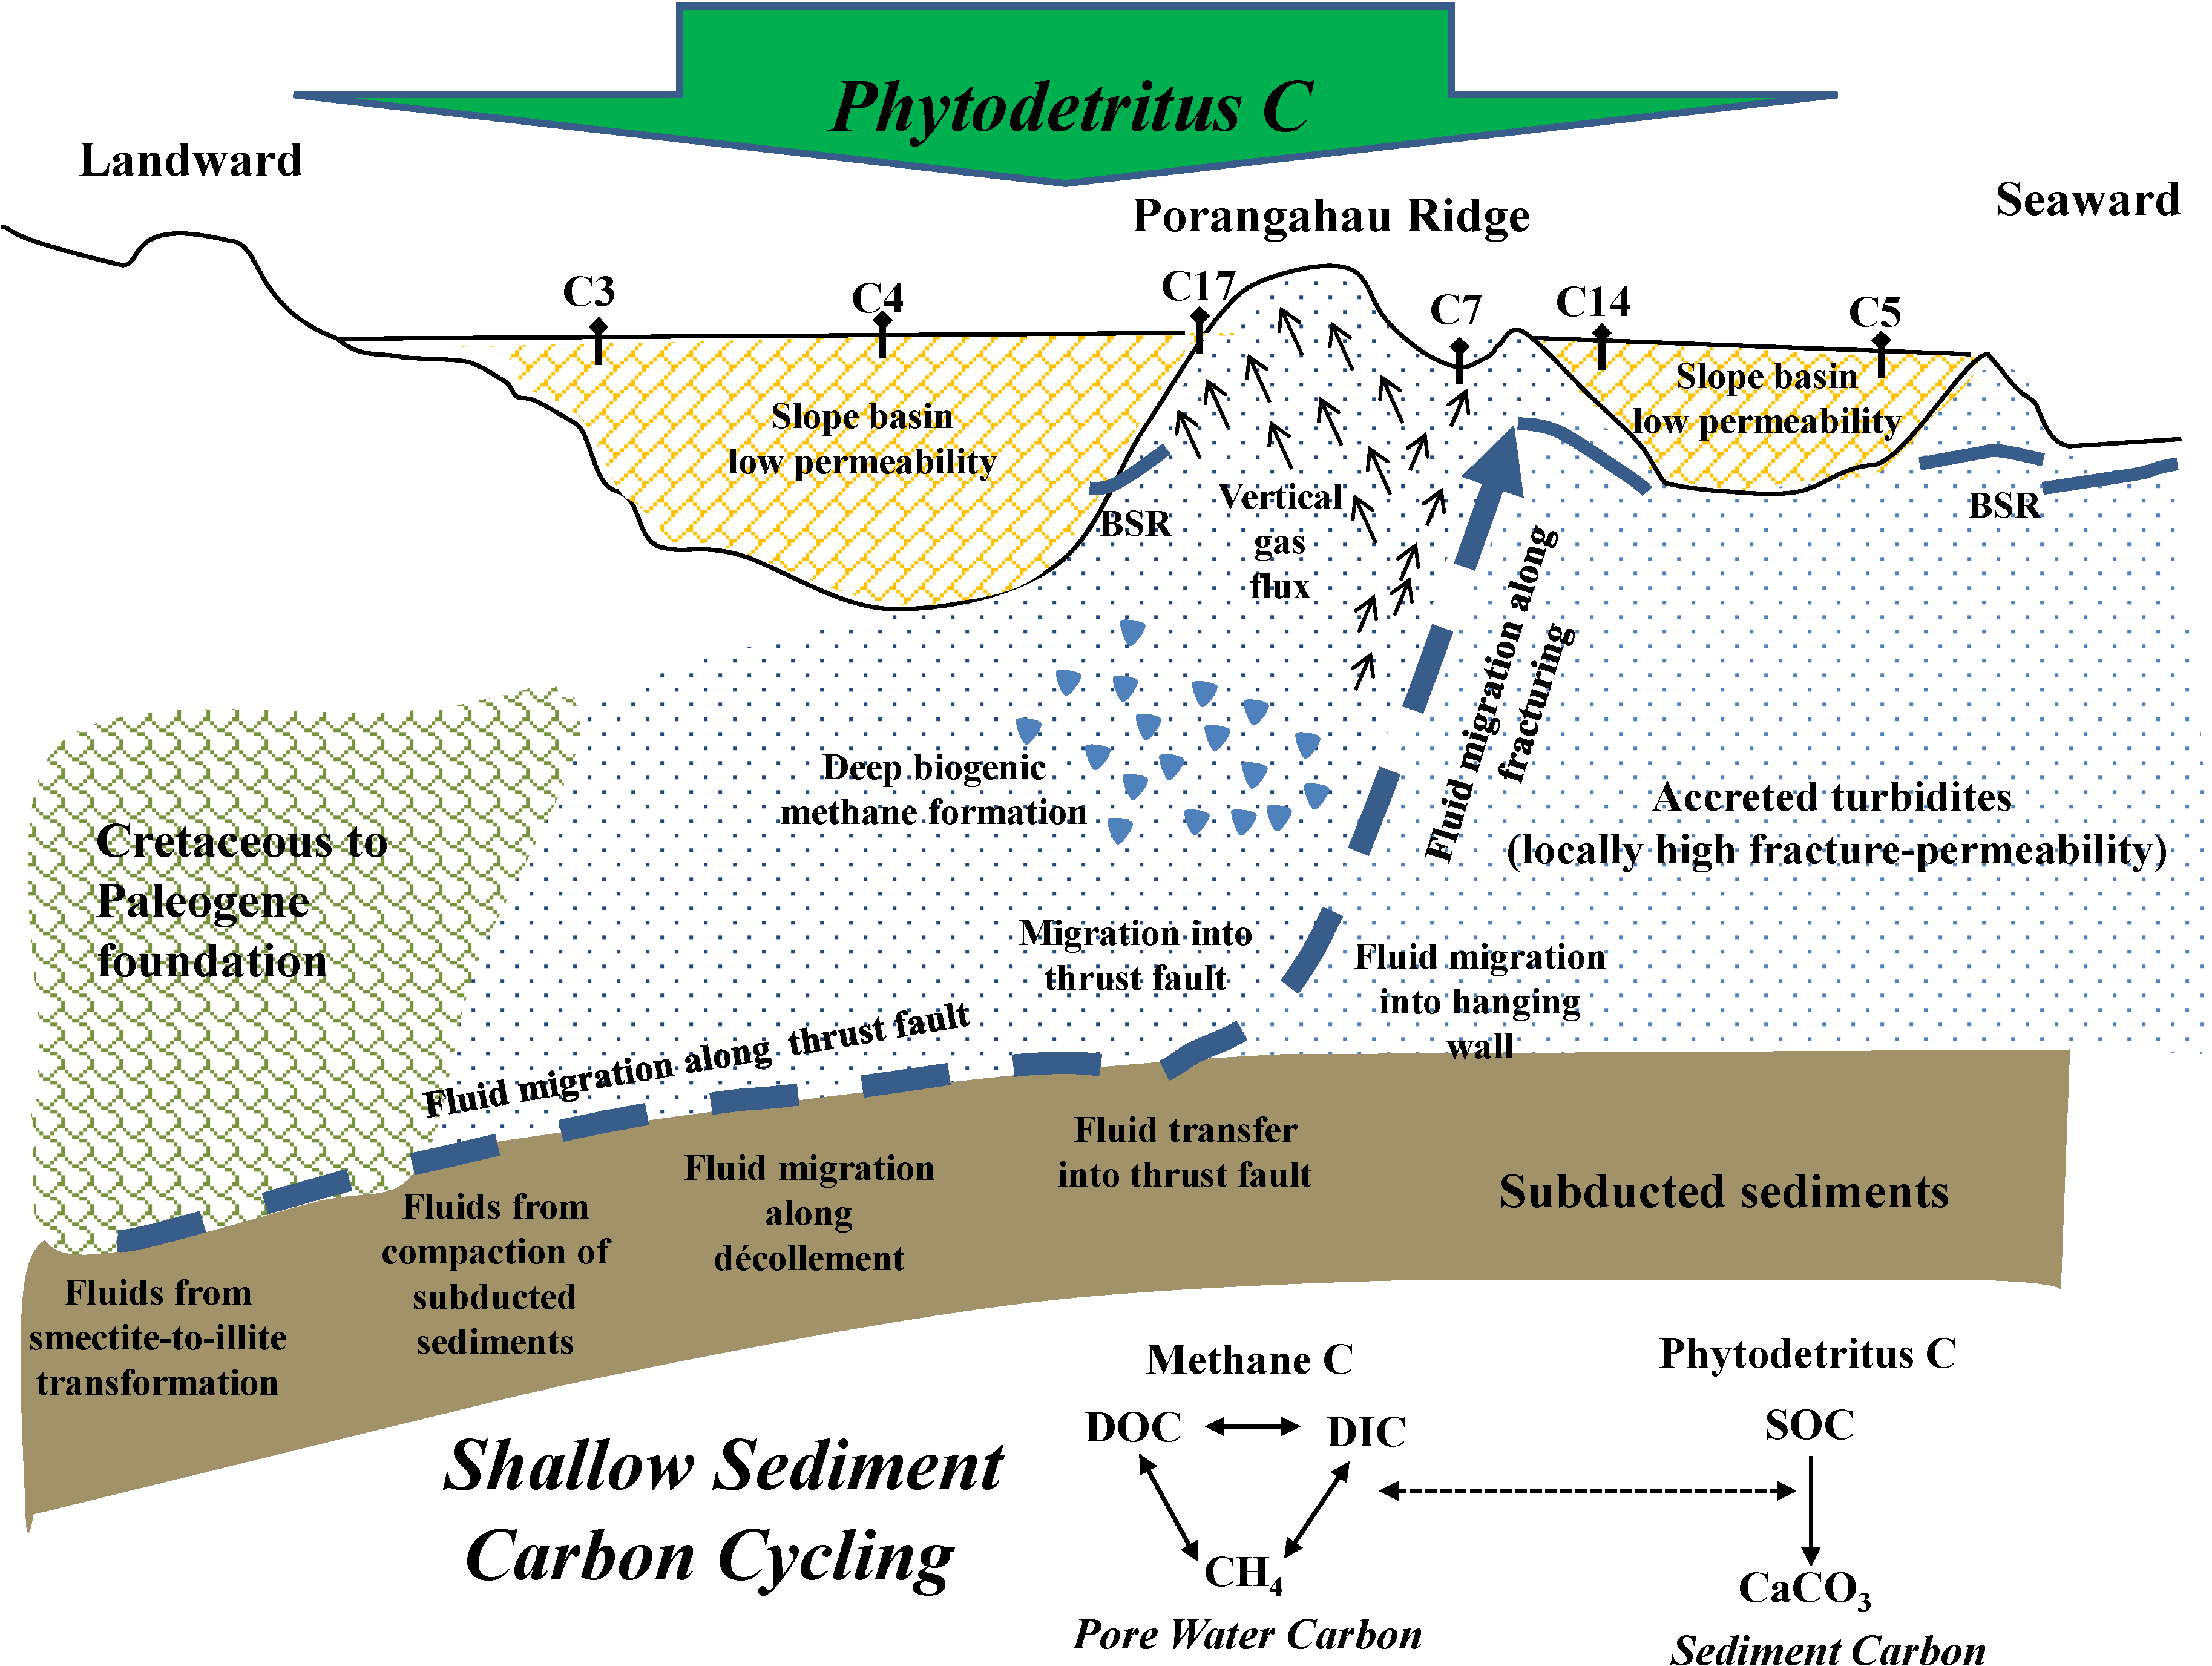
2.1. Regional Description

The Hikurangi Plateau is an igneous province within the Pacific Plate, undergoing oblique subduction below the Australian Plate [33], leading to formation of an accretionary wedge 20–25 Ma ago [34]. The central Hikurangi subduction margin contains a 150 km wide imbricated frontal wedge that is poorly drained and over pressured with low taper thrust systems concurrent with a smooth subducting plate, a thick trench sedimentary sequence, and weak basal décollement with a convergent rate of approximately 40 mm·a−1 [38]. The Porangahau Ridge is located south on this subduction margin on the outer accretionary wedge (Figure 1). Sediment geology at this location is driven by the accretionary wedge growing at a rapid rate, filling with turbidites and mudstones [34].
Bottom simulating reflections (BSR) in seismic profiles through large areas of this study region indicate the presence of gas hydrates [39,40]. A local heatflow anomaly based on upwarping of BSRs was interpreted as an indication of fluid expulsion from the subduction interface on the Porangahau Ridge [35]. Previous work suggests that gas from beneath the Porangahau Basin in the accretionary wedge is transported along with fluids that undergo a compaction during sediment subduction and possibly transform from a smectite to illite (Figure 2). Fluid is interpreted to migrate horizontally along a décollement that transition to a vertical pattern through a thrust fault upon downward décollement stepping or vertical hydrofracturing [40]. A high-resistivity anomaly on the western landward side of the ridge if due to gas hydrates would provide further evidence for elevated fluid flow [36].
Figure 2. Sediment and pore water carbon pools studied across the Porangahau Ridge to determine the relative contribution of phytodetritus and vertical CH4 flux to shallow sediment. Sediment organic and inorganic carbon concentrations (SOC and CaCO3) and δ13C (SOC and TIC) and pore water dissolved organic and inorganic carbon (DOC and DIC) are summarized to compare spatial variation in these carbon sources. Data interpretation suggests phytodetritus dominates contribution to solid phase sediment carbon while AOM has a more significant contribution to the dissolved carbon cycling which, subsequently, contributes to the solid phase pool.
Energies 07 05332 g002
Seismic data retrieved during hydrocarbon exploration across the Porangahau Ridge displayed strong reflections above the predicted regional BSR; profiles were interpreted as free gas beneath a locally upwarped base of gas hydrate stability zone. These data were used to focus piston coring locations for this study. The coring area is seaward of a Cretaceous to Palaogene base believed to create a deforming tectonic buttress for a frontal accretionary wedge comprised of underlying Plio- to Pleistocene accreted turbidites that are near slope basins formed the Miocene to recent times [38,41]. Six cores were collected in June 2006 across the ridge in an offshore transect (Figure 1) [36,37]. Data were interpreted to compare variation in the contribution of CH4 and pelagic detritus to shallow system carbon pools across the ridge with previous indications of fluid expulsion at specific locations along this transect [35] (Figure 2).

2.2. Sample Collection and Analysis

Sediment was collected using a 6.5 m piston core with an average of 15 subsamples taken from each core; cores ranged in length from 206 to 480 centimeters below sea floor (cmbsf). Pore water was obtained using Reeburgh style presses pressurized to ~400 kPa (~60 psi) [36,37].
For determination of sediment CH4 and higher molecular weight gas concentrations, a sediment plug was collected from the core using a 3 mL syringe with the end removed and sealed a in 20 mL serum vial. Gas was extracted [42] and measured on-board using a Shimadzu GC-FID GC-14A gas chromatograph equipped with a 6 foot Hayesep-Q 80/100 mesh column (Alltech, Deerfield, IL, USA) and quantified with certified gas standards (Scott Gas, Plumbsteadville, PA, USA). Limit of detection (LOD) for CH4 concentrations was 0.009 mM; values below LOD are presented as 0.0 mM.
A Dionex DX-120 ion chromatograph (Thermo Scientific, Waltham, MA, USA) was used on-board to measure pore water SO42− concentrations. Samples were diluted 1:50 (vol:vol−1) prior to analysis and measured against IAPSO (International Association for the Physical Sciences of the Ocean) standard seawater (28.9 mM SO42−). The SO42− LOD was 0.6 mM; values below LOD are reported as 0.0 mM.
Total dissolved sulfide (TDS) concentrations were measured on-board using a Turner spectrophotometer [43]. LOD was 0.05 mM; values below LOD are reported as 0.0 mM.
Concentrations of DIC were measured on-board using a coulometer (UIC, Inc., Joliet, IL, USA) that was standardized with a certified reference material (CRM #68, Scripps, La Jolla, CA, USA). LOD for DIC was 0.23 mM. DIC concentrations in all samples were above LOD.
Sediment samples were stored frozen in pre-weighed snap-tight Petri dishes. Porosity was determined from wet and dry mass of sediment. Concentrations and stable carbon isotopic compositions of sediment organic carbon (SOC) and total carbon (TC) were determined with a Thermo Delta Plus XP IRMS (Thermo Scientific, Waltham, MA, USA) in-line with a Costech EA using a Conflo III interface and helium carrier gas. Fifteen to 20 mg of dry, homogenized sediment was analyzed in triplicate. For SOC, sediments were weighed into silver capsules, acidified with excess 10% HCl to remove inorganic carbon, and dried at 60 °C. For TC, sediments were weighed into tin capsules and analyzed with no further treatment. Percent calcium carbonate (%CaCO3) was determined by subtracting %SOC from the %TC. Sediment δ13CTIC, was calculated using a mass and isotopic balance.
Stable carbon isotope ratios (δ13C) were measured on TC, SOC, CH4, dissolved organic carbon (DOC) and DIC. δ13CCH4 was measured from the same samples used for CH4 concentrations; samples with concentrations less than 2 μM are similar to the atmospheric background and are not reported. A sufficient volume of headspace was first cryogenically concentrated [44], and subsequently introduced into a Thermo Trace gas chromatograph (GC) equipped with a Varian Porapak-Q column, interfaced via a GC-C III combustion interface to a Thermo Delta Plus XP IRMS.
The same GC-C-IRMS system, with a split/splitless inlet instead of the cryofocusing unit, was used to measure δ13CDIC [13]. One mL of pore water was sealed in a 2 mL serum vial, then acidified with 20 μL of 85% phosphoric acid to convert the DIC to CO2, which was then extracted into the headspace and injected into the GC.
δ13CDOC was analyzed using an OI Analytical 1010 wet chemical oxidation system (OI Analytical, College Station, TX, USA) in line with the IRMS [45]. All δ13C data are presented in per mil units (‰), and referenced to the PeeDee Belmenite standard.

2.3. Carbon Pool Data Interpretation
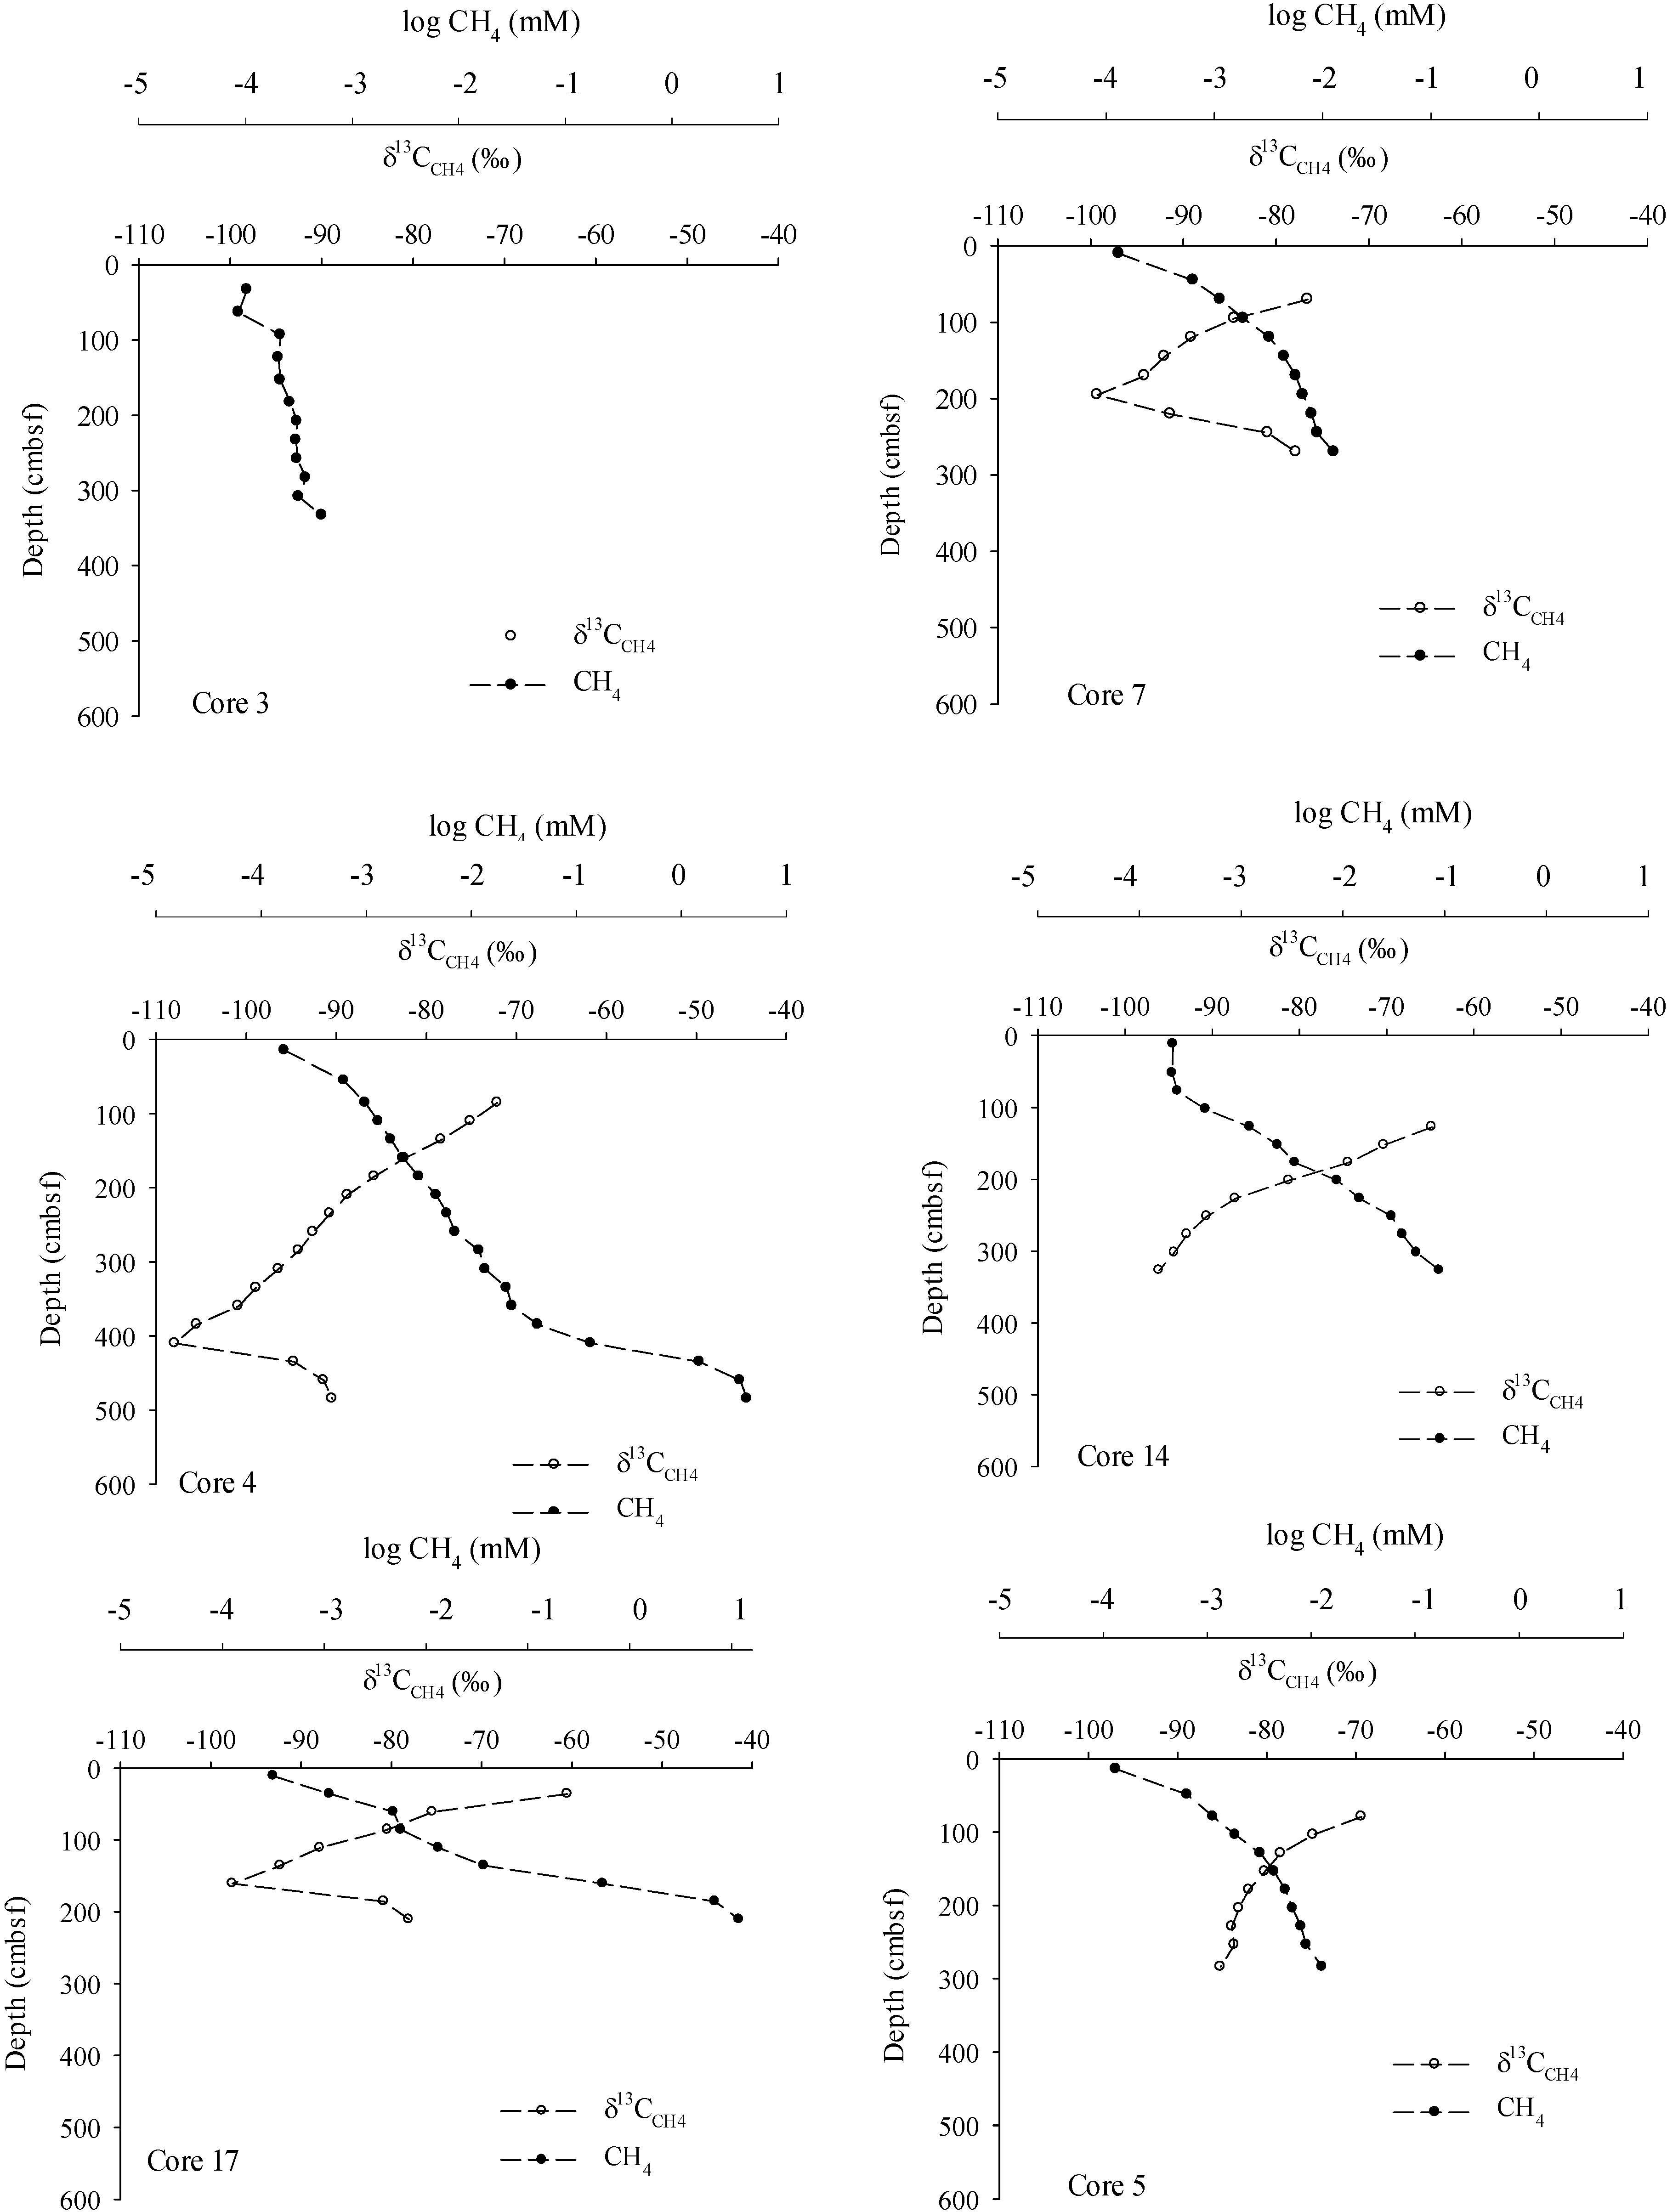
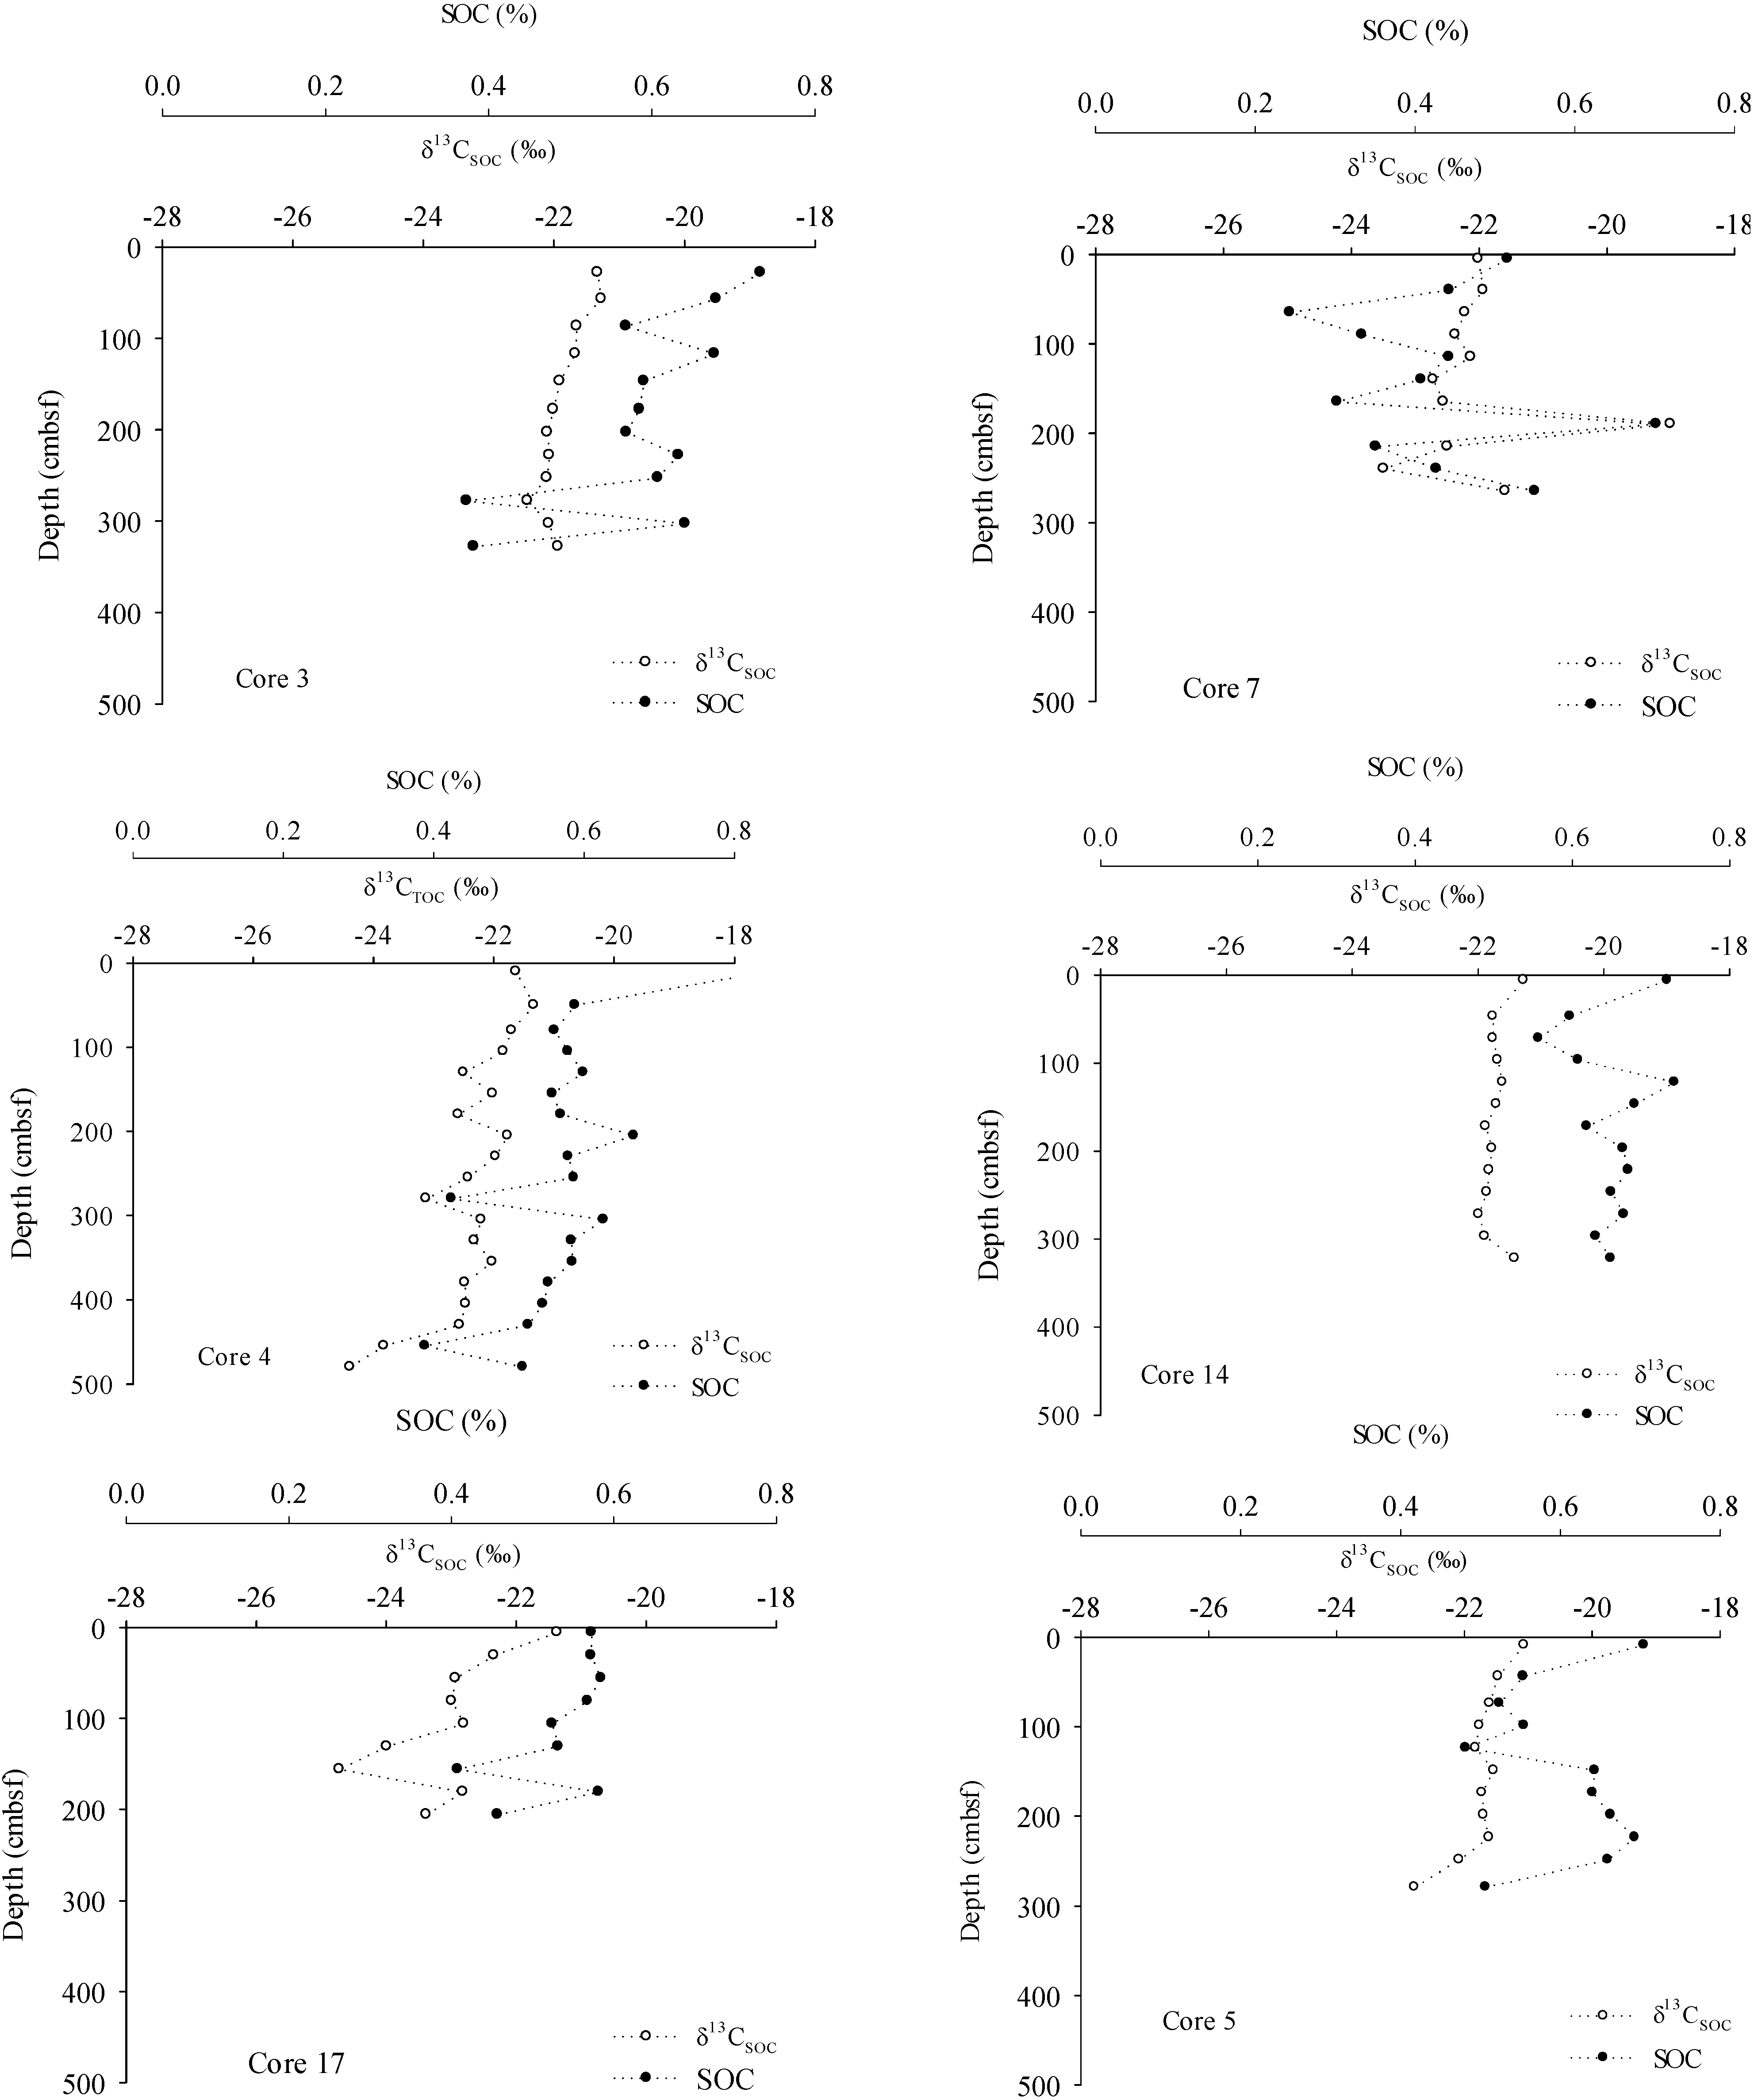
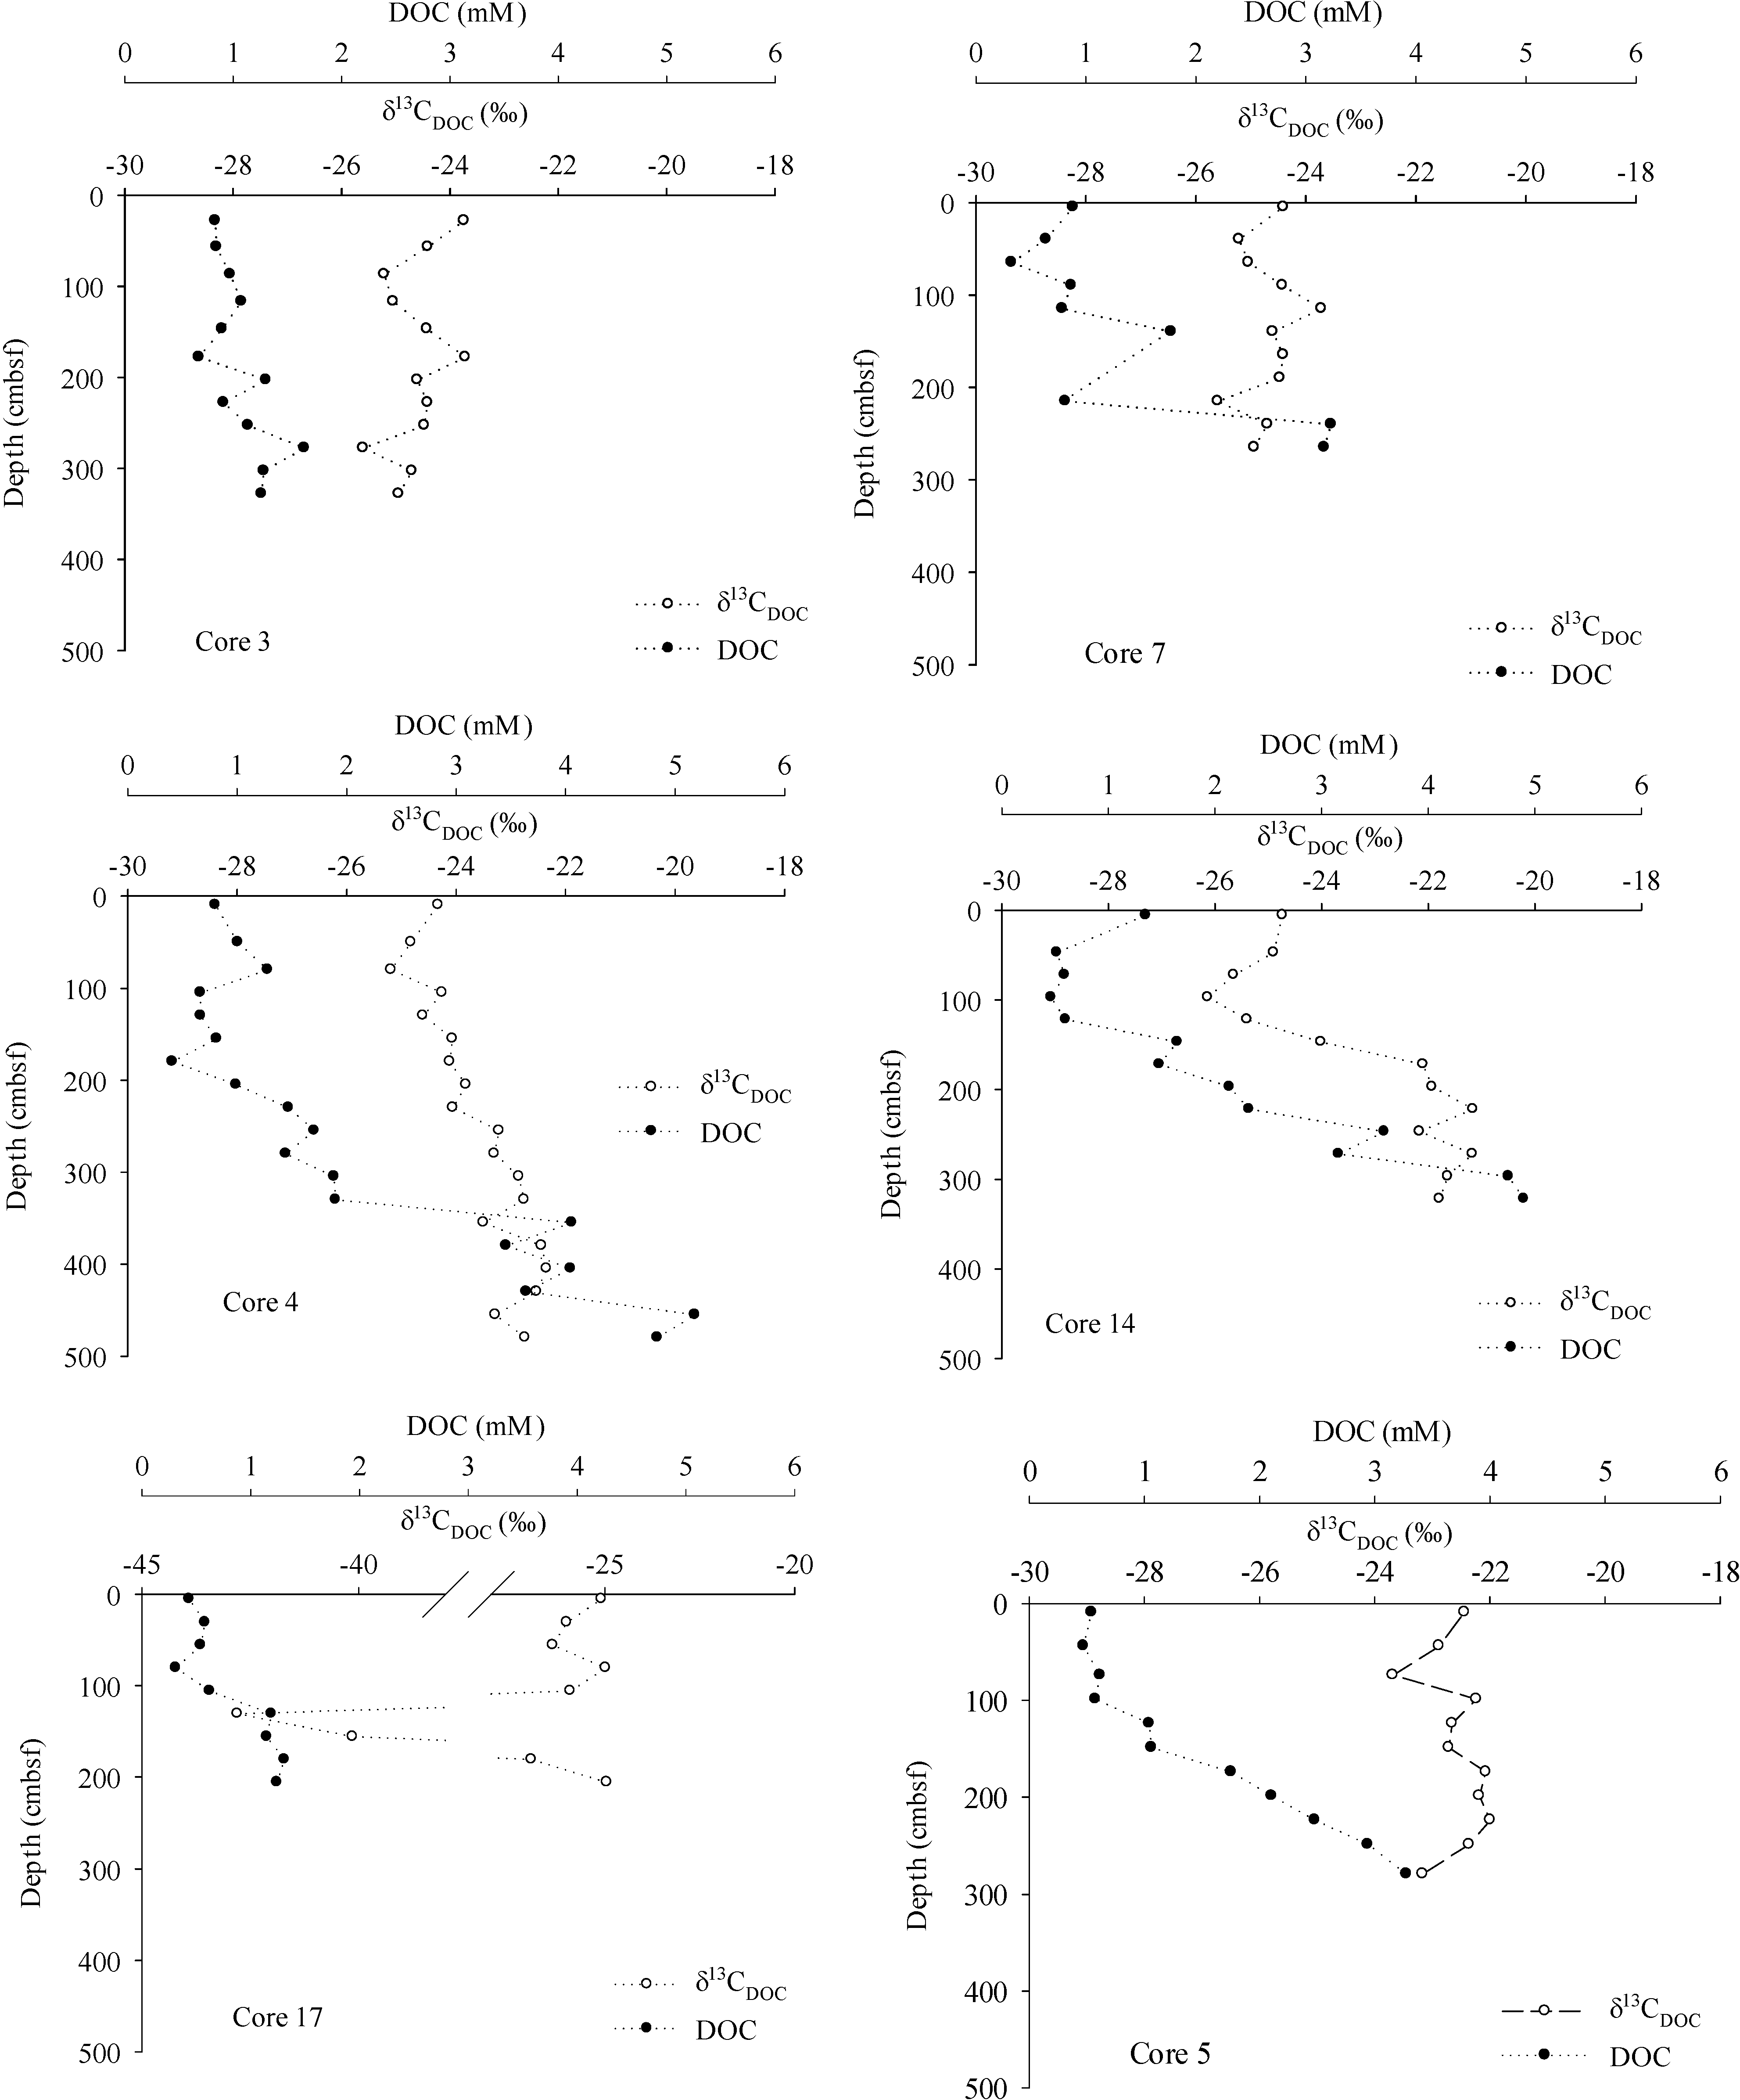
Data was evaluated assuming that carbon cycling associated with AOM is oxidation of CH4 to CO2 and fixation of CO2 into microbial biomass [46]. AOM contribution to sediment carbon pools was studied assuming mixing between two end-members: phytodetritus (CPD) and CH4 (CCH4). The spatial variation in the CH4 contribution to sediment carbon pools through the study region is evaluated with mass and isotopic balances summarized by Equations (2) and (3):
Cx = CPD + CCH4
δ13CxCx = δ13CPDCPD + δ13CCH4CCH4
where Cx = concentration of the carbon pool (CaCO3, SOC, DOC and DIC) and δ13Cx = the stable isotopic composition of the respective component. During diagenesis of organic matter with the initial components CPD(i) and CCH4(i), mass and isotopic changes of carbon pools are represented by Equation (4):
δ13CxCx = δ13CPDCPD(i) + δ13CCH4CCH4(i) + δ13C∆C
where ∆C = net change in carbon pool concentration and δ13C = net change in isotopic composition during diagenesis. When δ13CPDCPD (or δ13CCH4CCH4) = constant or zero and ∆Cx ≠ zero, Equation (5) becomes:
Energies 07 05332 i001
where linear slopes of δ13CxCx versus Cx estimate the net isotopic signal of carbon lost or gained through vertical sediment profiles during diagenesis [47,48,49,50].
The relative contribution of AOM to carbon pools at key depths, through each sediment core, was calculated using a two end-member isotope mass balance [51]:
RX = RPDCPD + RCH4CCH4
where RX represents the isotopic composition (δ13C) of the C pools: DIC, TIC, DOC and SOC, RPD and RCH4 represent the isotopic composition of marine phytodetritus (PD) and CH4 respectively, and CPD and CCH4 represent their corresponding fractional contributions such that:
CPD +CCH4 = 1
Percent contribution of CH4 to each C pool (%X) is derived from Equations (6)–(8):
Energies 07 05332 i002
where Rs represents the isotopic composition of CH4 or DIC.

3. Results

Measured CH4 concentrations ranged from LOD to 11.4 mM (Figure 3). The lowest concentrations were furthest off the ridge in both the landward and seaward direction, whereas the highest were at the landward ridge base (C17). All CH4 profiles had lowest concentrations in shallowest core sections. Concentrations in ridge cores (C17 and C7) showed rapid increases at mid core depths (Figure 3). δ13CCH4 values ranged from −107.9‰ to −60.5‰ (Figure 3). Generally, δ13CCH4 profiles were more positive (13C-enriched) in shallow sediment and more negative (13C-depleted) down core. Strong 13C-depletion occurred mid depth in C4, C17, and C7 (Figure 3). Average C1:C2 was 3000 (n = 23) and combined with the range of δ13CCH4 values, indicates a biogenic CH4 source in this region.
Pore water SO42− concentrations ranged from the LOD in mid to deep core sections to 29.3 mM in near surface sediments (Figure 4). Minimum SO42− concentration in each core was observed at different depths, with C17 and C7 having SO42− depletion at the most shallow depths. TDS ranged from LOD to 11.9 mM (Figure 4). TDS was not detected in surface sediments and increased down core in the presence of rapid shifts in CH4 and SO42− profiles. Highest H2S concentrations were observed in C17 and C7.
Pore water DIC values ranged from 2.5 mM to 21.5 mM (Figure 5). Except in C3, profiles showed low concentrations in surface samples and rapid non-conservative concave up increases at mid core depths (Figure 5). In C3, collected closest to shore, average DIC concentrations were lowest overall. In all cores δ13CDIC values ranged from 3.0‰ to −47.6‰ with consistent 13C-enrichments in surface sediments (Figure 5). Seaward off the ridge (C5 and C14) δ13CDIC profiles were linear with down core shifts to minimum values: –27.6‰ and –31.6‰, respectively. In contrast, δ13CDIC profiles for C4, C17 and C7 were sharply 13C-depleted to a minimum of −45.1‰ (C7, Figure 5). In C3 there was a smaller range in δ13C values between the shallow and deep pore water samples (−5.3‰ to −20.1‰).
Sediment CaCO3 concentrations ranged from 5.9% to 32.3% (Figure 6). With the exception of C17 and C7, all cores had relatively uniform CaCO3 profiles with a range of 5.9% to 17.0% coupled with slight variation in δ13CTIC profiles (−3.5‰ to 1.3‰). In contrast, in C17%CaCO3 ranged from 5.9% to 32.3%, with the highest percentage 156 cmbsf (Figure 6). Concomitant with the CaCO3 increase in C17, there was 13C depletion (Figure 6).
Sediment porosity ranged from 0.477 to 0.766 and averaged 0.604 ± 0.059 (n = 53). Across the ridge core, %SOC ranged from 0.24% to 0.85% (Figure 7) and was lowest in cores closest to the ridge (C17 and C7). The δ13CSOC values ranged from −19.0‰ to −24.7‰ and were generally enriched in surface sediment and depleted at depth toward the SO42− minimum; a trend that was most apparent in C17 (Figure 7).
Pore water DOC concentrations ranged from 0.3 mM to 5.2 mM, with core average concentrations lowest in C17 and highest in C4 and C14 (Figure 8). Pore water δ13CDOC values ranged from −42.8‰ to −21.1‰, suggesting variation in DOC sources. In C3, C7 and C5, δ13CDOC varied approximately ±2‰ through the profiles (Figure 8).
Figure 3. Profiles of sediment CH4 concentrations and δ13C values relative to centimeters below seafloor (cmbsf) from piston cores collected across the Porangahau Ridge. Graphs are listed by location relative to the ridge with the first column westward moving to the ridge and the second column eastward moving off the ridge.
Energies 07 05332 g003
Figure 4. Profiles of pore water SO42− (●) and TDS (○) concentrations in piston cores relative to centimeters below seafloor (cmbsf) collected across the Porangahau Ridge. Lines are drawn through the linear portion of the SO42− profile that were used to estimate the sulfate-methane transition (SMT) depth (cmbsf) and the diffusive SO42− (and CH4) flux (mmol SO42−·m−2·a−1). Graphs are listed by location relative to the ridge with the first column westward moving to the ridge and the second column eastward moving off the ridge.
Energies 07 05332 g004
Figure 5. Profiles of pore water dissolved inorganic carbon (DIC) concentrations and δ13C values relative to centimeters below seafloor (cmbsf) in piston cores collected across the Porangahau Ridge. Graphs are listed by location relative to the ridge with the first column westward moving to the ridge and the second column eastward moving off the ridge.
Energies 07 05332 g005
Figure 6. Profiles of sediment percent CaCO3 and δ13C values of the total inorganic carbon (CaCO3) relative to centimeters below seafloor (cmbsf) in piston cores collected across the Porangahau Ridge. Graphs are listed by location relative to the ridge with the first column westward moving to the ridge and the second column eastward moving off the ridge.
Energies 07 05332 g006
Figure 7. Profiles of percent (%C) and δ13C values of sediment organic carbon (SOC) relative to centimeters below seafloor (cmbsf) in piston cores collected across the Porangahau Ridge. Graphs are listed by location relative to the ridge with the first column westward moving to the ridge and the second column eastward moving off the ridge.
Energies 07 05332 g007
Figure 8. Profiles of pore water dissolved organic carbon (DOC) concentrations and δ13C values relative to centimeters below seafloor (cmbsf) in piston cores collected across the Porangahau Ridge. Graphs are listed by location relative to the ridge with the first column westward moving to the ridge and the second column eastward moving off the ridge.
Energies 07 05332 g008

4. Discussion

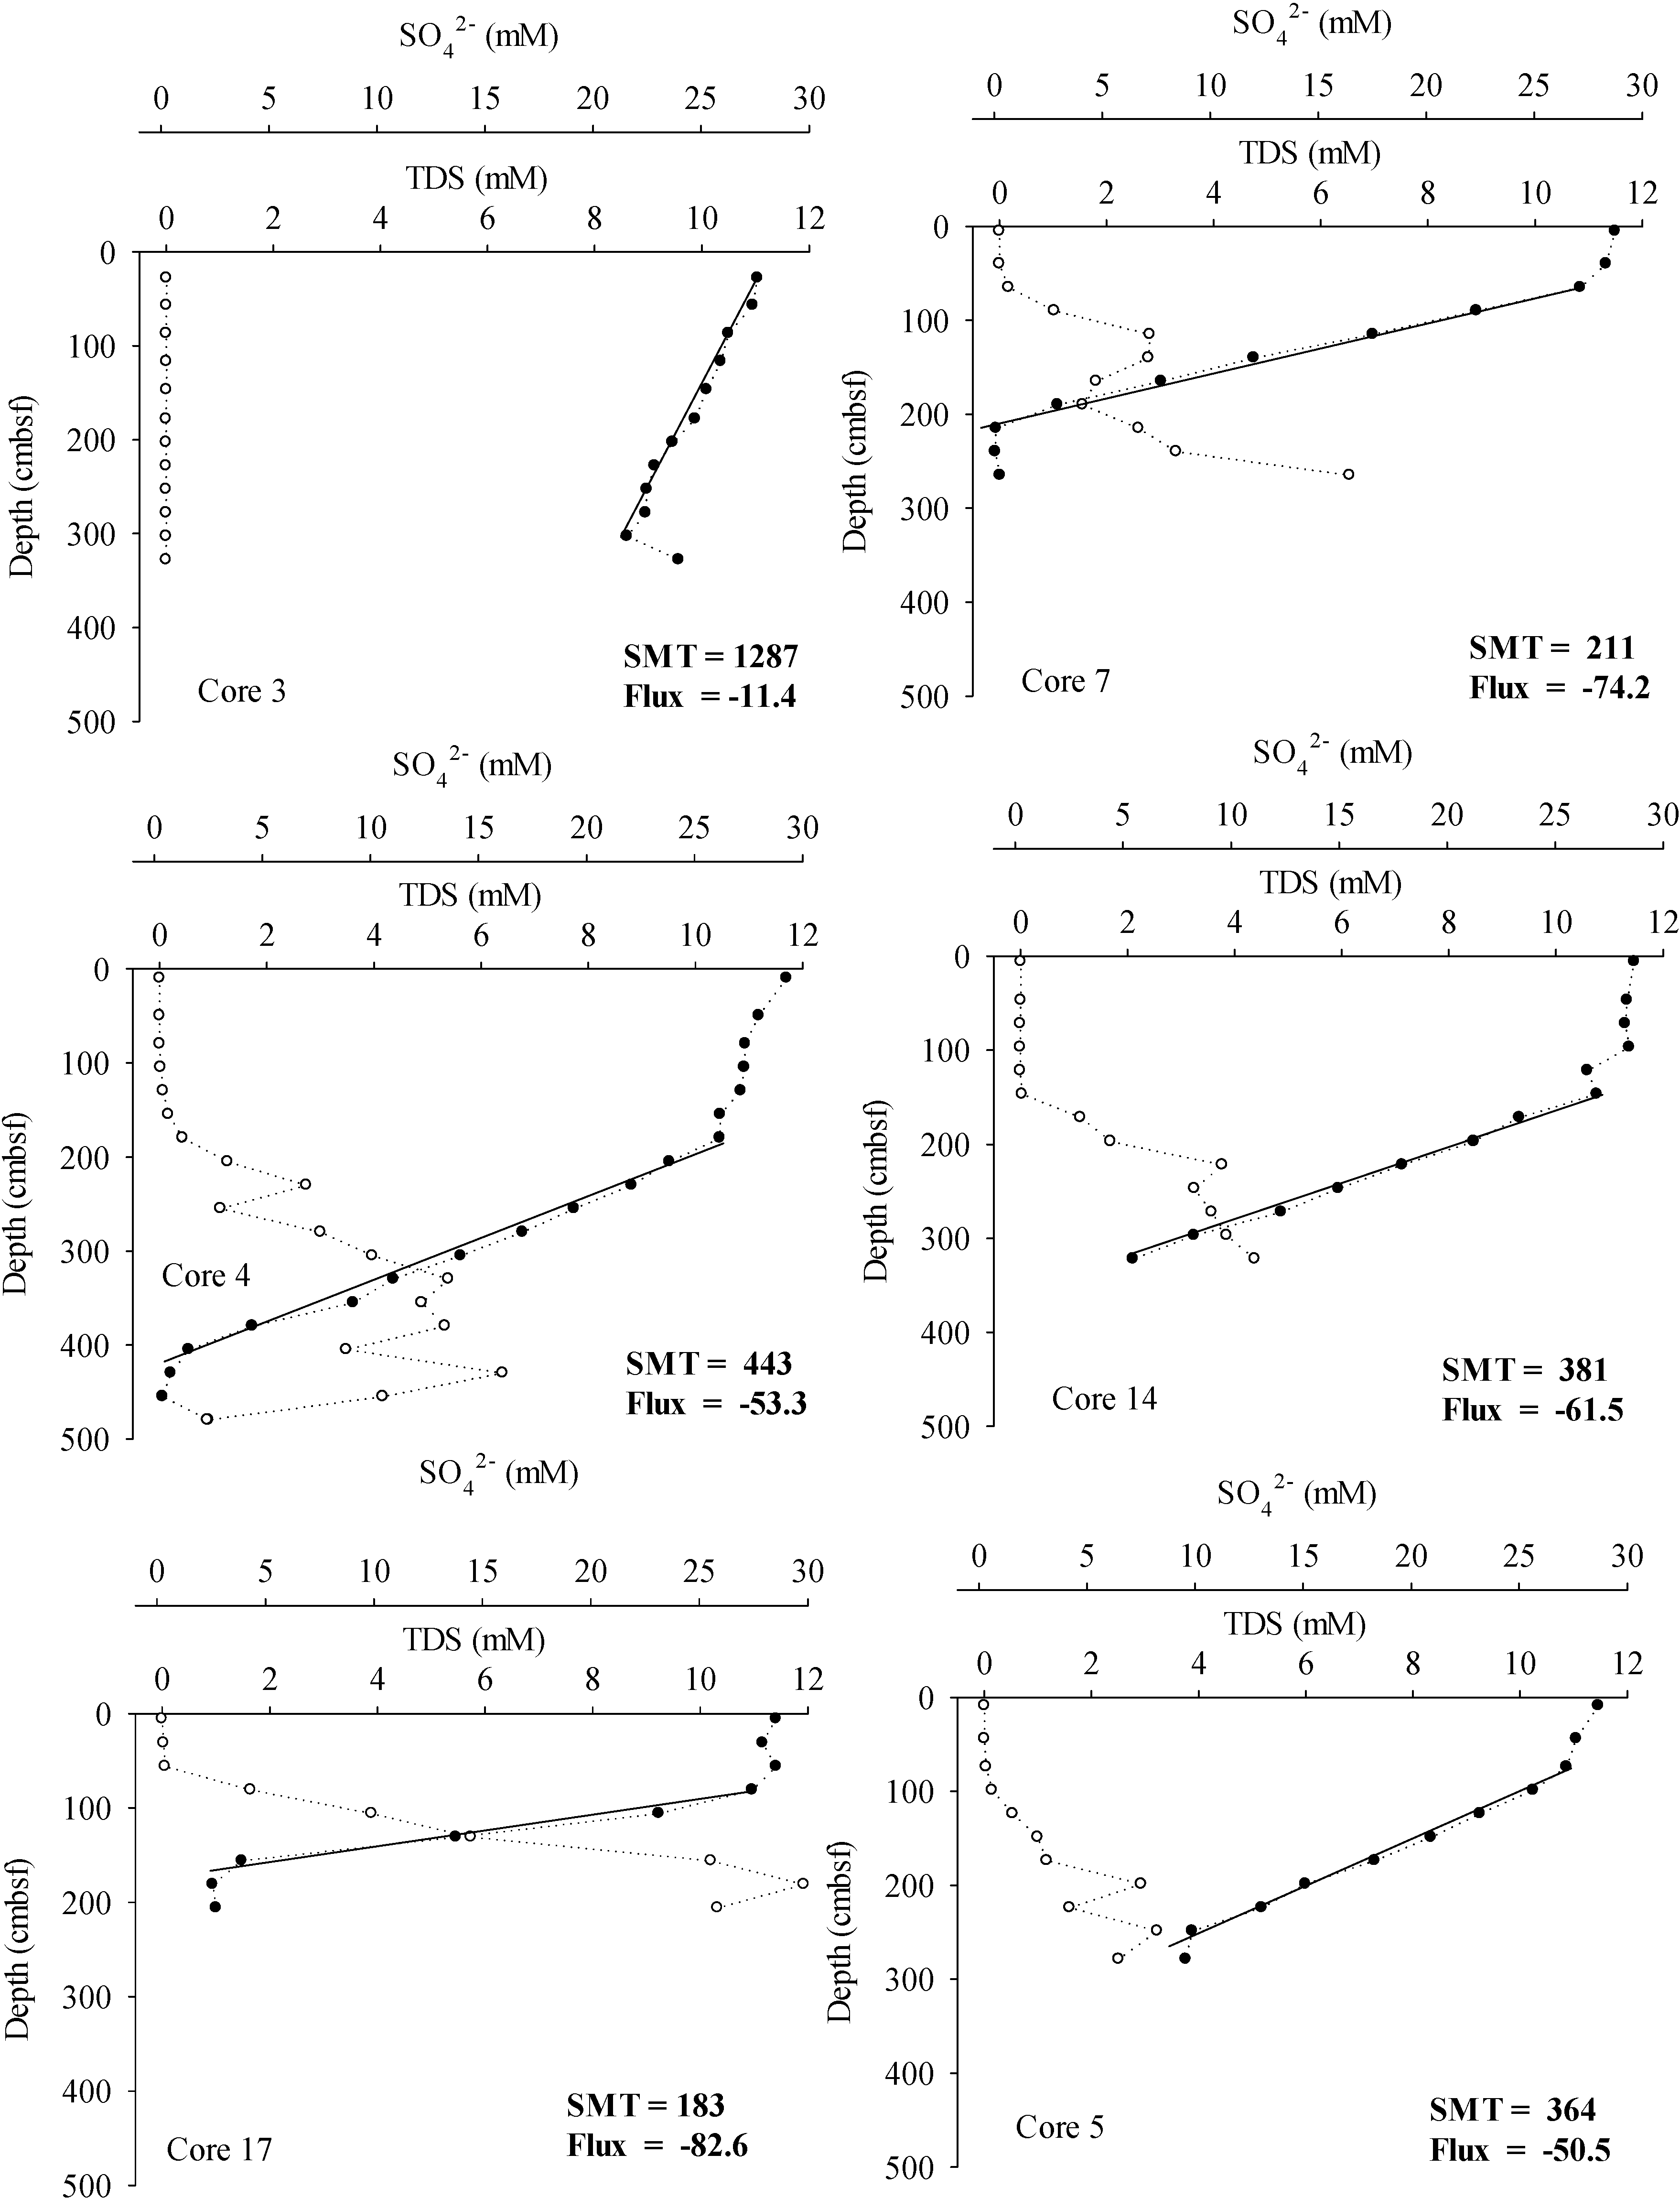
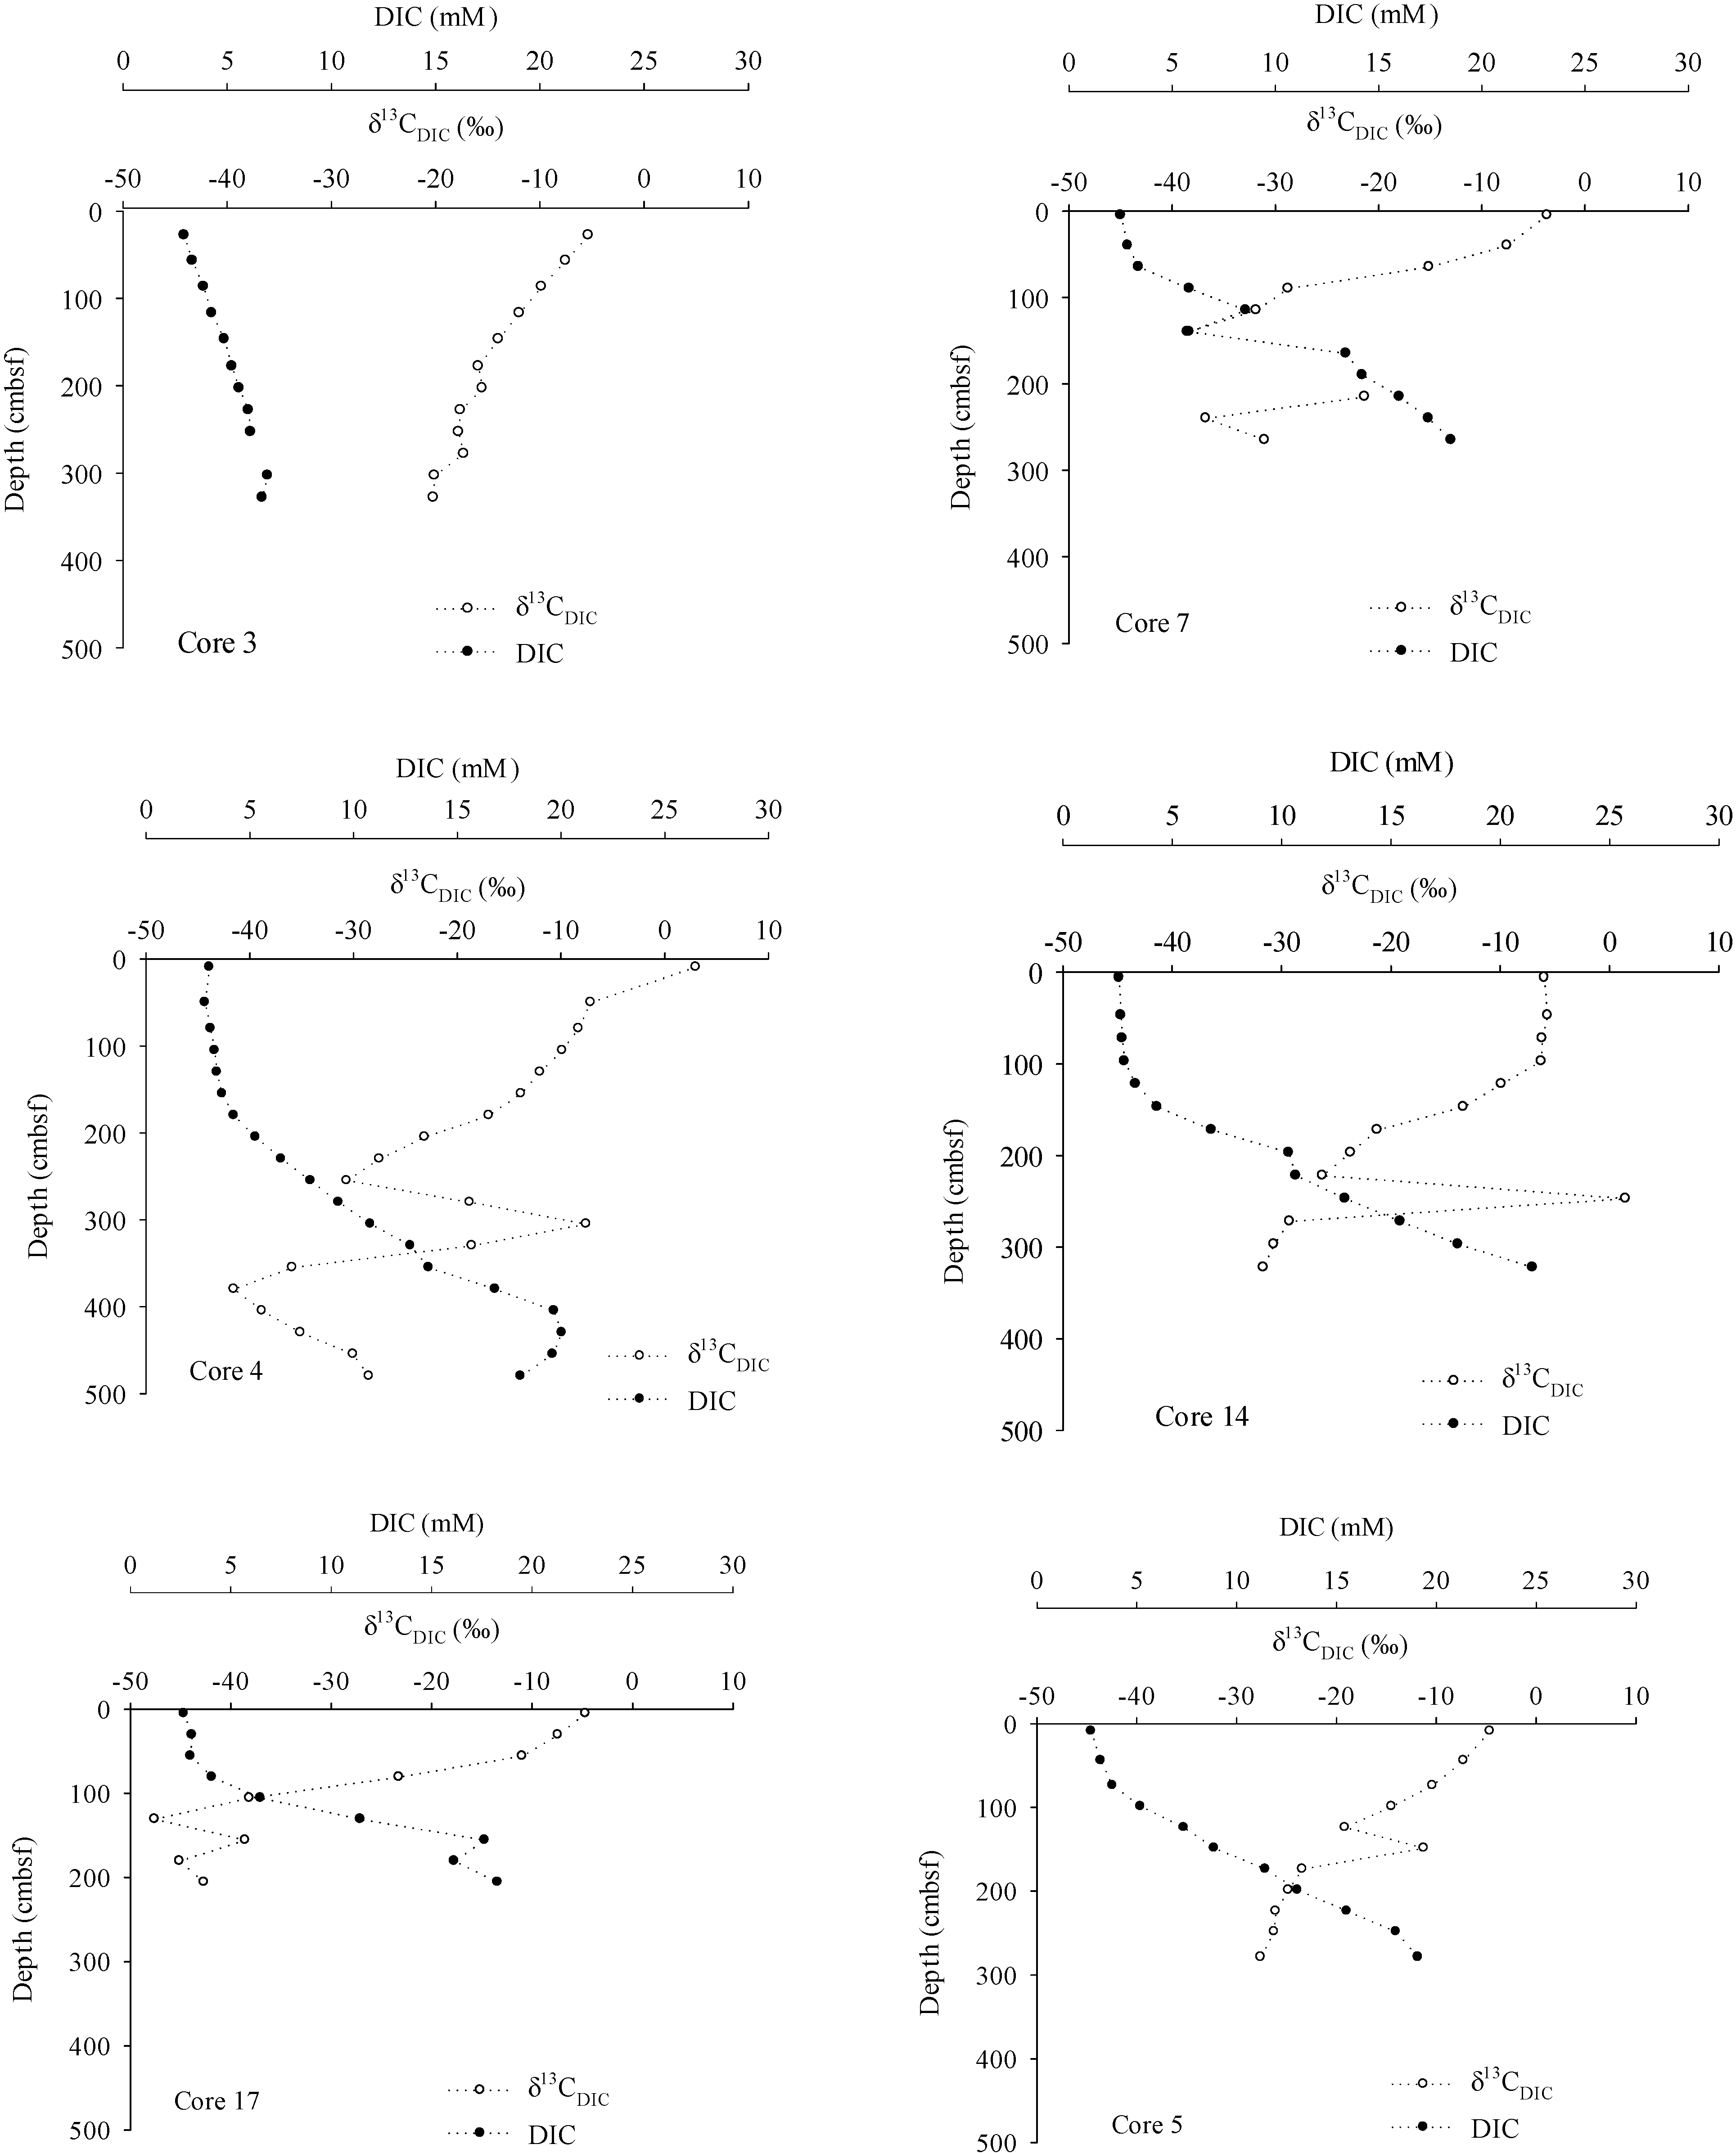
4.1. Methane Source, Vertical Flux and Cycling

Measured stable carbon isotope ratios and gas compositions are typical of biogenic CH413CCH4 = −107.9‰ to −60.5‰; average C1:C2 = 3000, [29]). In general, CH4 concentrations decrease with distance away from the ridge (Figure 3). Concentration profiles reflect active CH4 consumption via AOM at mid core depths and CH4 production below this zone (Figure 3 and Figure 4). Elevated TDS and DIC concentrations coincide with increasing CH4 and decreasing SO42− concentrations which suggest AOM is the principle process controlling sediment CH4 profiles (Equation (1), Figure 4 and Figure 5). Isotopic fractionation during AOM and methanogenesis is evident in the δ13CCH4 and δ13CDIC profiles. During AOM 13C-depleted CO2 is produced and subsequent reduction of this CO2 results in a δ13CCH4 minimum at the SMT as observed in C4, C17 and C7 ([21,52,53,54]; Figure 3; Figure 5). AOM signature is most prominent in C4, C17 and C7 where δ13CDIC values are more 13C-depleted. Furthermore, the bacterial phylotypes commonly observed to participate in sulfate dependent AOM were observed in these sediments [37].
SMT depth is primarily a function of vertical CH4 flux [18]. Although sediment did appear to contain low SOC concentrations (Figure 7) there is potential for organoclastic SO42− reduction in the shallow sediment where small changes in concentrations were observed (Figure 4; [55]). Linear portions of SO42− profiles indicated consumption of CH4 by AOM (Figure 4). An absence of TDS in shallow sediments may occur because of oxidation by bio-irrigation, but there is a clear pattern of TDS production correlated with linear declines in pore water SO42− concentrations through the SMT resulting from AOM (Figure 4). Linear SO42− profiles were extrapolated to estimate SMT depth and indicated that C17 and C7 had shallowest SMT zones at 183 and 211 cmbsf, respectively (Figure 4). Deepest SMT (1287 cmbsf) was in nearshore C3, well off the ridge. In the other cores, SMT zones were at intermediate depths (364–443 cmbsf).
Assuming steady state consumption and the reaction stoichiometry of AOM (Equation (1)), CH4 fluxes were estimated using SO42− profiles and Fick’s First Law [17,56]. Highest CH4 fluxes were on the ridge in C17 and C7 (86.2 and 74.2 mmol m−2·a−1, respectively). Off ridge CH4 flux rates were lower, ranging from 11.4 to 61.5 mmol m−2·a−1, with higher values offshore (Figure 4). Methane fluxes across Porangahau Ridge are moderate relative to values reported for other coastal regions. Similar ranges have been reported for passive sediment regions in the Bering, Kara, Chukchi and White Seas with maximum values at 25.3 and 47.4 mmol CH4 m−2·a−1 [21,22]. However, regions in the Beaufort Sea with past accumulation of scoured sediment show elevated CH4 fluxes at 154.8 mmol CH4 m−2·a−1 [16]. Higher diffusion rates at 249 mmol CH4 m−2·a−1, reported across a mound in Atwater Valley on the Texas-Louisiana Shelf, may be the result of deep sediment hydrate instability caused by salt diapirs [13]. On the mid Chilean Margin, with extreme plate subduction, geochemical profiles at a seismic blanking region showed an elevated flux at 362 mmol CH4 m−2·a−1 [15]. While seismic data and presence of a high-resistivity anomaly on the western side of the Porangahau Ridge indicates fluid migration resulting from décollement or vertical hydrofracturing [35,36], geochemical estimates of deep CH4 migration to shallow sediments suggest lower CH4 hydrate loading relative to other coastal locations.

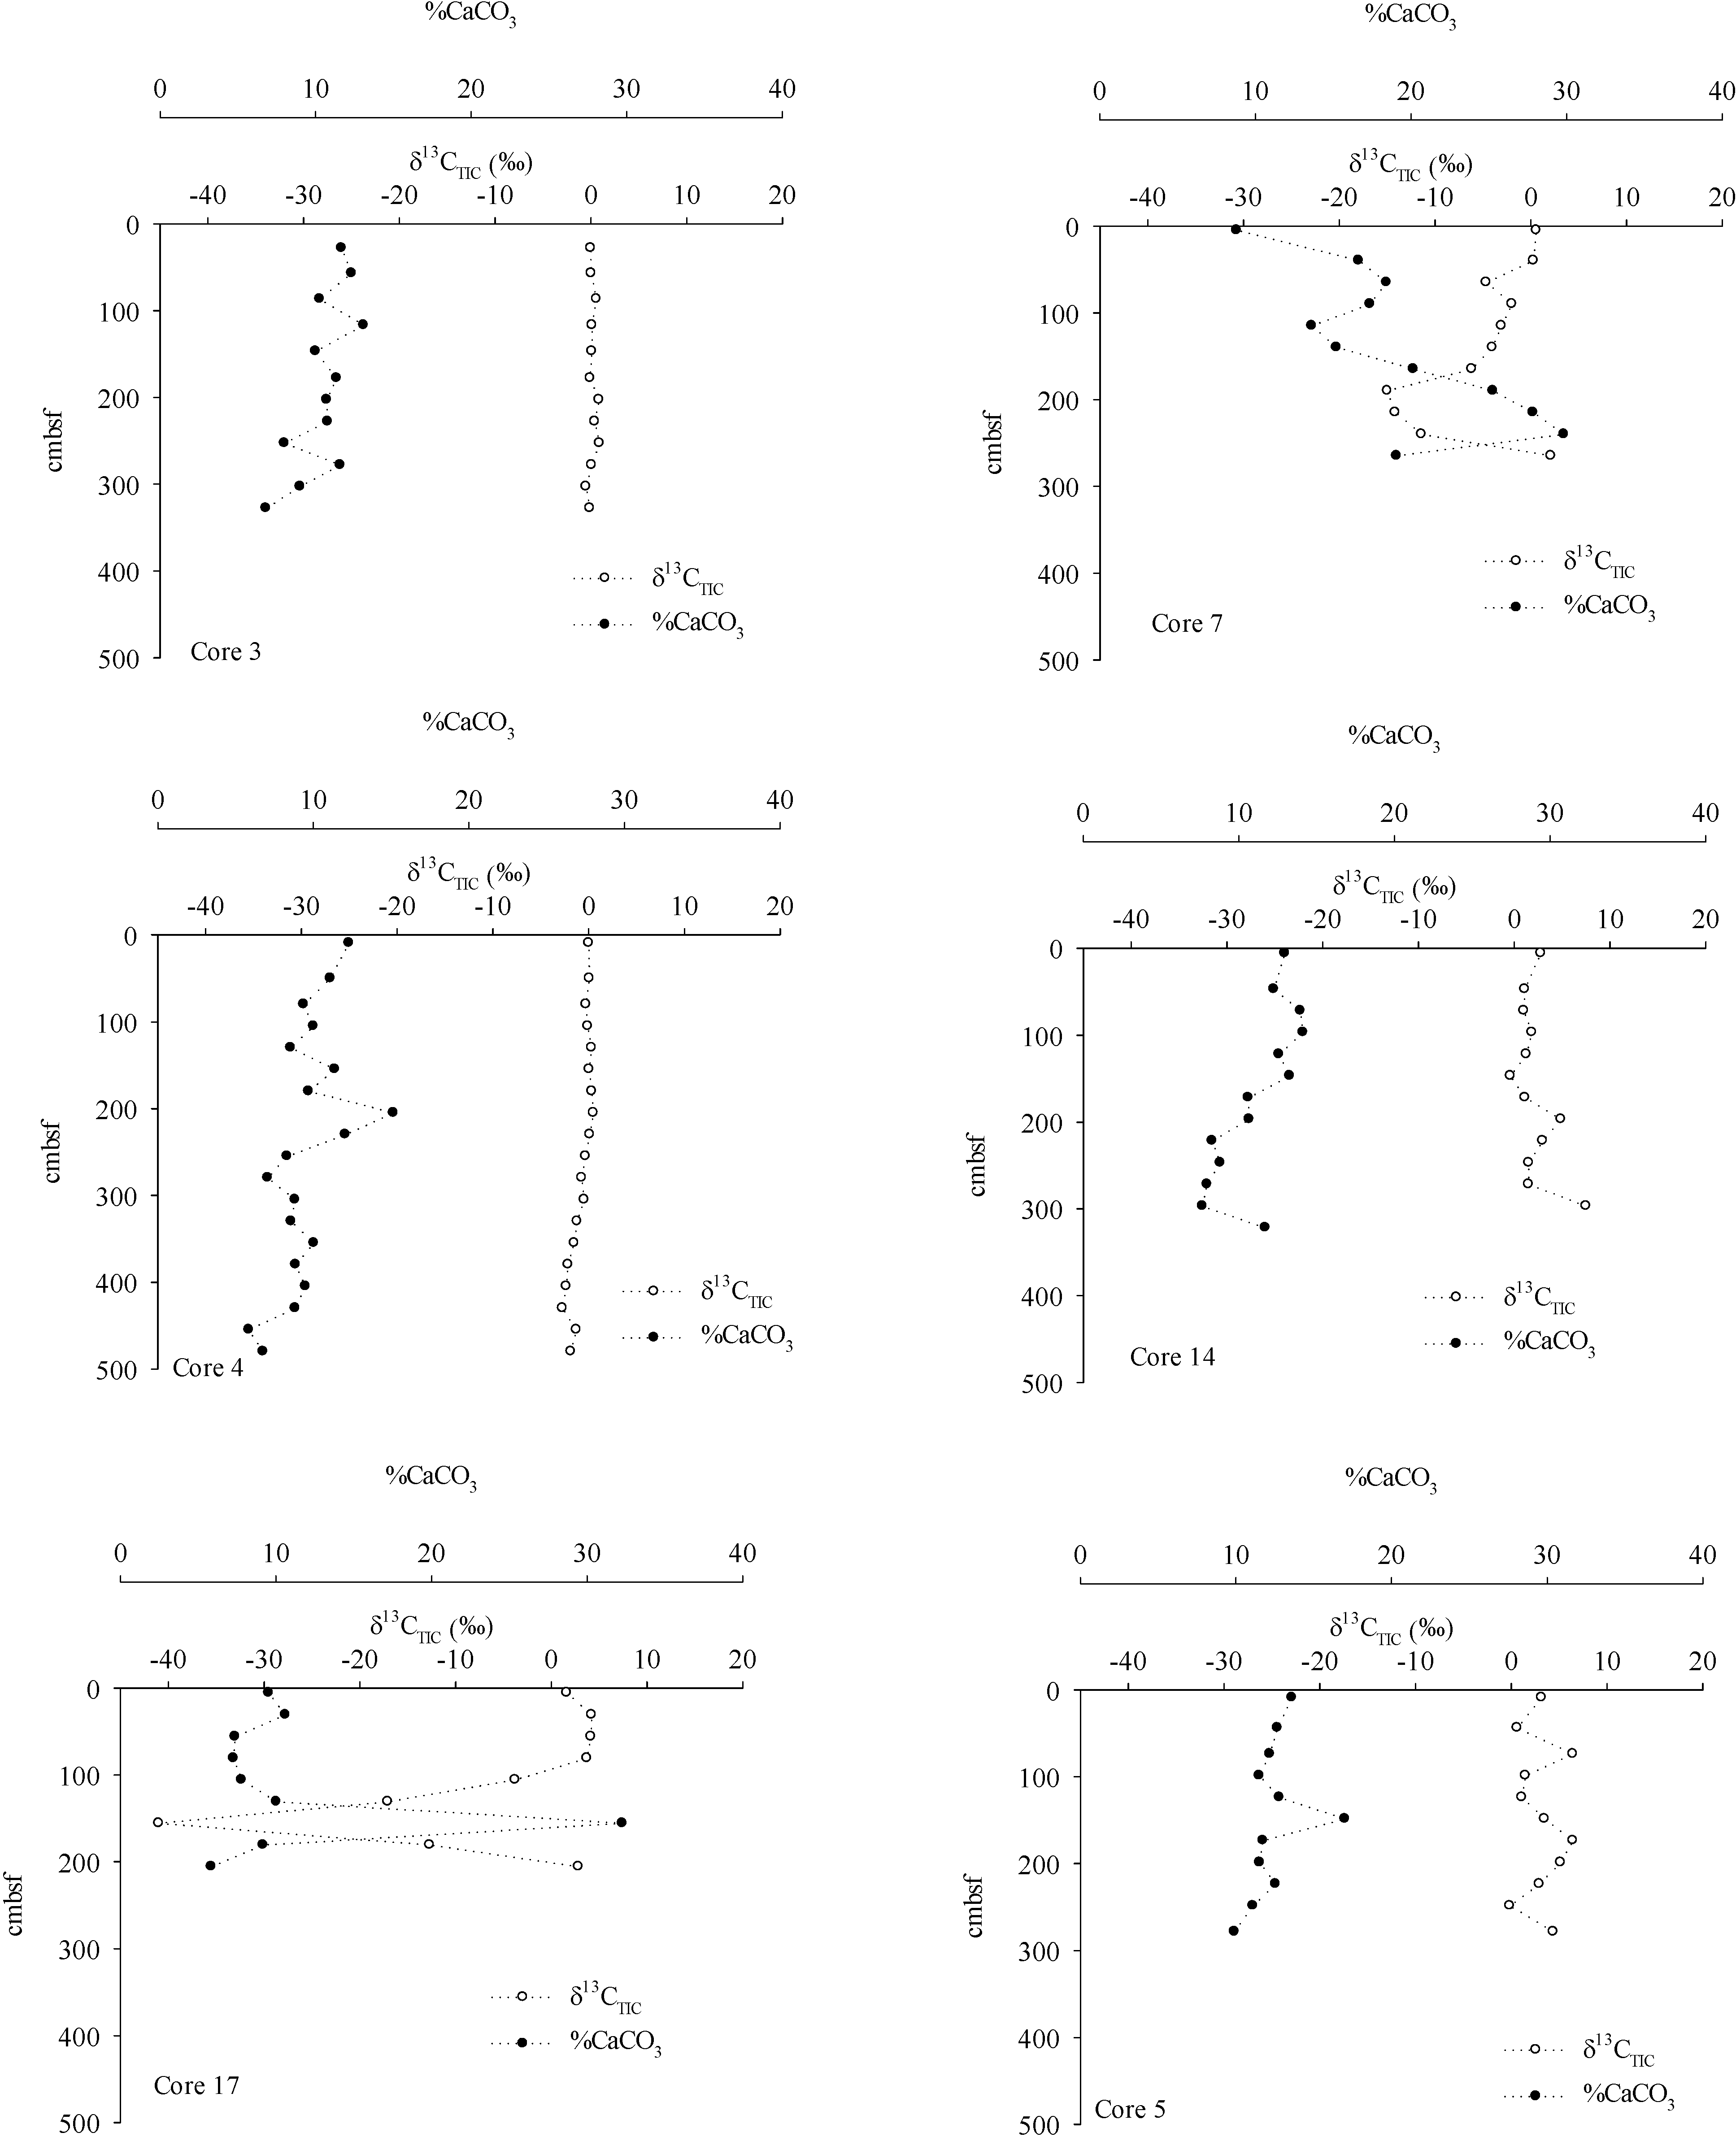
4.2. Inorganic Carbon Pools in Porangahau Ridge Sediments

Solid phase sediment and pore water inorganic carbon concentrations and δ13C values are influenced by microbial processes (AOM, OSR, and methanogenesis) and physical properties (downward diffusion and carbon pool solubility). In deeper core sections, increases in DIC concentration associated with decreases in SO42− concentration are attributed to elevated AOM rates (Figure 4). DIC profiles were generally concave up at mid core depths, being most pronounced in C17 (Figure 5). Concave up concentration profiles suggest that DIC production from AOM is greater than DIC losses from diffusion and carbonate precipitation [57]. These data support the conservative interpretation of observed vertical CH4 fluxes and AOM.
DIC concentrations and δ13CDIC profiles reflect variation in vertical CH4 flux across the ridge (Figure 5). Steepest gradients in DIC concentrations and the most 13C-depleted δ13CDIC values were near the ridge in C17 and C7 and also in C4, landward further from the ridge. Vertical CH4 flux is most rapid at C17 relative to other locations. Minimum δ13CDIC values at the SMT (−43.3‰ to −47.5‰) that are more 13C-depleted than resident organic matter (−24.5‰ ± 0.5‰, Figure 7) are unequivocal evidence of AOM [58,59,60]. In addition, there is a mid-profile, rapid enrichment in 13C that we assume results from shallow sediment CH4 production (Figure 5). Slight decreases in DIC concentrations are associated with shifts in the δ13CDIC at C7 and C17.
Authigenic CaCO3 concentrations and 13C-depleted pore water DIC suggest elevated AOM rates at the SMT [46,58]. 13C-enriched DIC in C4, C17 and C7, below the SMT results from isotopic fractionation during CO2 reduction [54,61]. In C3 δ13CDIC values range from −5.3‰ (a near seawater value) to −20.2‰ at the greatest core depth. δ13C values of sediment organic matter are conserved during microbial respiration to DIC [27,31,61,62]. Average δ13CSOC value through C3 is −21.7‰ ± 0.3‰ (n = 12, Figure 7). Such a shift in δ13CDIC may result from mixing between seawater and microbially-respired phytodetritus. This location is used later in this discussion as a phytodetritus end-member for calculating the CH4 contribution to DIC pools across the ridge.
Active CH4 cycling is also reflected in CaCO3 and δ13CTIC profiles in near ridge cores C17 and C7 (Figure 6). Increased carbonate alkalinity as a result of AOM precipitates CaCO3 and incorporates 13C-depleted DIC into this pool [30]. Calcium carbonate ranged 5.9% to 32% of solid phase sediment. Off ridge cores (C3, C4, C14, and C5) had relatively uniform CaCO3 and δ13CTIC profiles with depth in the sediment. A strong contrast to this was observed in C17 with a maximum CaCO3 concentration (32.3% at 156 cmbsf) and a minimum δ13CTIC value at the same depth (−43.8‰). Similar CaCO3 and δ13CTIC profiles were observed at C7. These CaCO3 and δ13CTIC profiles highlight locations where CH4 contribution to bulk carbon pools is greatest.

4.3. Organic Carbon Pools in Porangahau Ridge Sediments

Methane cycling is not reflected to the same extent in SOC profiles (Figure 7). Sediment organic carbon concentrations were lowest in ridge cores (C17 and C7) and increased off the ridge. Range of δ13CSOC values across the ridge suggests two carbon sources: phytodetritus and CH4 (−19.0‰ to −24.7‰). In the most landward core (C3), δ13CSOC profiles were relatively uniform and had values characteristic of phytodetritus (−22.5‰ to −18.7‰, [27,63,64]). In other cores, δ13CSOC values were generally 13C-enriched in surface sediments and 13C-depleted at depth. A recent study nearby on southern Wairarapa Ridge reported δ13CSOC values in near surface sediment (<10 cmbsf) ranging from −22.8‰ to −22.3‰ in seep locations and non-seep (control) sites [63]. This illustrates that despite high CH4 fluxes in this region, CH4 was not appreciably incorporated into the SOC pool.
In this study, phytodetritus is the predominant source of SOC in most cores. However, an alternate source of SOC was observed in deep sections of C4 and C17 with a minimum δ13CSOC value at C17 (−24.7‰). Although these values approach terrestrially-derived carbon signatures [62], considering the distance offshore, overlying 13C-enriched SOC, pore water DIC concentration and δ13CDIC profiles, this is likely from CH4 cycling. Note that 13C-depletion of SOC is concomitant with lower SOC concentrations in C17 suggesting decreased organic carbon production associated with CH4 cycling. Similar shifts in δ13CSOC values with depth were not observed in a location close to our study site [63]; however, this may be a function of their sampling depth (≤10 cm) relative to the SMT depth.
Pore water DOC concentrations showed similar patterns to SOC with the lowest concentrations in C17 and higher in C4 (Figure 8). In C17, lower CH4 concentration corresponded to pronounced 13C-depletion in δ13CDOC (−42.8‰). Of note is the disparate range of δ13CDOC values encountered in surface sediment across the ridge and 13C-depletion in DOC at mid depths in C17. In the case of C4 and C14, an increase in concentration was accompanied by a 13C-enrichment in DOC. In C17, DOC was significantly 13C-depleted near and at the SMT (156 cmbsf, respectively) where DOC concentrations were lower.
Other studies indicate CH4 contributes to pore water DOC. At a Gulf of Mexico site with advective CH4 flux (−3250 mM m−1·a−1), there was substantial depletion of δ13CDOC (−27.6‰) which reflected influence of AOM in this carbon pool [13,65]. In contrast, on the Cascadia Margin, average δ13CDOC values were −21.6‰ ± 1.3‰ in a region with active advective methane fluxes [32]. Enriched δ13CDOC suggests advection of CH4 prohibits AOM and subsequent production of DOC. However, a sediment CH4 source to the Cascadia Margin water column contributed 28% of water column DOC in a region with an advective flux [10].

4.4. Methane Contribution to Shallow Sediment Carbon Pools

Carbon mass and isotope balances in each vertical core profile indicate CH4 contribution to carbon cycling varies across the ridge (Equations (2)–(5); Figure 2). Linear slopes of δ13CxCx versus Cx reflect the net isotopic signature of carbon lost or gained at each site in the various pools. Sites at the ridge base have 13C-depleted values, consistent with AOM and methanogenesis (Table 1). Net isotopic value (δ13C) of pore water DIC ranged from −31.4‰ to −35.0‰ off the ridge. Near the ridge, δ13C values of DIC were lower below the SMT in C4 and C7 (−49.2‰ to −41.3‰), and through the entire C17 profile (−48.8‰). For TIC, δ13C values ranged from 0.0‰ to 1.1‰ off the ridge at C3, C4, C14 and C5. Near the ridge at C17 and C7, δ13C values ranged from −58.0‰ to −22.6‰, with the most 13C-depleted values in C17 suggesting a substantial AOM contribution to the carbon pool. Although AOM contribution to inorganic carbon pool is clearly evident, SOC δ13C values ranged from −21.2‰ to −17.1‰, indicating phytodetritus was the dominant source of sediment organic carbon. Pore water DOC δ13C values ranged from −40.9‰ to −21.1‰. In C17, a 13C-depleted value of −40.9‰ suggests CH4 contributed to the DOC pool below the SMT; above the SMT there was a moderate contribution from phytodetritus with a slight 13C-enrichment (−36.5‰). δ13C value for DOC was also depleted in C3 on the near shore, landward side of the ridge. However, δ13CDIC values and CH4 flux estimates do not indicate a significant CH4 contribution at this site. Here the 13C-depleted value may indicate a recalcitrant source of terrestrial organic matter.
Table 1. Net isotopic values (δ13C) calculated for dissolved inorganic carbon (DIC), organic carbon (DOC) and total inorganic carbon (CaCO3) and sediment organic carbon (SOC) derived from the slopes of the plots δ13Cx × Cx versus Cx (Equation (5)). Data from C4, C17 and C7 were plotted above (A) and below (B) the SMT. Values for C3, C4 and C5 were generated from full core profiles.
StationDICDOCCaCO3SOC
δ13C
C3−31.4−26.50.0−20.8
C4 A−31.6−22.61.0−19.5
B−41.3−22.31.1−20.2
C17 A−48.8−36.5−56.6−17.8
B−49.2−40.9−58.0−17.1
C7 A−33.4−22.8−22.6−21.2
B−46.6−22.6−23.0−21.6
C14−35.0−21.10.8−20.6
C5−31.4−22.60.0−20.3
Further examination of CH4 contribution to sediment carbon cycling was conducted with a two-end-member isotope mass balance [51]. It was assumed that CH4 is not directly assimilated, but is first oxidized via AOM and the CO2 (DIC) produced in this reaction is fixed into biomass [46]. This assumption is supported by research showing the AOM community only assimilates 1% of the CH4 with the other 99% being oxidized to CO2. Subsequently, a significant proportion of CH4 sourced CO2 is assimilated by the AOM community [66,67,68]. Assimilation of CH4 carbon through AOM contrasts with aerobic CH4 oxidation where 60% of CH4 carbon is assimilated into biomass [69].
AOM contribution to SOC, CaCO3, DOC and DIC was estimated in C4, C17 and C7, where an SMT was observed, using a carbon isotope mass balance (Equations (6)–(8)). CH4 contribution to each carbon pool was estimated at the SMT (i.e., the maximum contribution in each core). Regarding SOC, a 13C isotopic fractionation of −3.75‰ during CO2 fixation was assumed, a midpoint for the 2.0‰ to 5.5‰ range expected for the reversed tricarboxylic acid cycle (rTCA) [70,71,72]. This assumption is based on extensive data gathered for rTCA in laboratory and field research where bacterial biomass results in δ13C values to be −2.0‰ to −12.0‰ depleted relative to the substrate through a temperature range of 30–100 °C and varying growth conditions [70,71,72,73,74]. Characterization of the microbial community diversity in sediments supports the assumption that the primary CO2 fixation cycle is rTCA [75,76]. Selection of an intermediate value (−3.75‰) is based on core samples taken from sediment profiles at points where AOM was active and low isotope fractionation during CO2 assimilation is expected. To evaluate AOM contribution to SOC (%SOCCH4), the average δ13CSOC value of C3 as the CPD end-member was used (−21.7‰, Table 2). This value is within the expected range of water column phytoplankton: −22.5‰ to −18.7‰ [27,63,64,77,78]. Low CH4 concentrations and a near conservative DIC concentration and δ13CDIC profiles suggest minimal CH4 contribution to carbon cycling in this core and support the use of this end-member. For C17, with assumptions stated above, the δ13Cend-members for DIC (−47.6‰) and phytodetritus (−21.7‰) and minimum δ13CSOC value in the SMT (−24.7‰) AOM contribution to SOC is 8%. Using the same approach for C4 and C7 and end members listed in Table 2, the contributions of AOM to SOC are 12% and 8%, respectively (Table 3).
Table 2. δ13C values (‰) used in carbon isotope mass balance calculations to estimate CH4 contribution to sediment organic carbon (SOC), dissolved inorganic carbon (DIC), total inorganic carbon (TIC) and dissolved organic carbon (DOC). Sample data are the minimum values observed in the sulfate-methane transition zone. End-members used are phytodetritus (PD), methane (CH4) and dissolved inorganic carbon (DIC). Note: * indicates values to which the −3.75‰ fractionation was applied for isotopic mass balance calculations.
CoreSOCCaCO3DOCDIC
End membersSamplesEnd membersSamplesEnd membersSamplesEnd membersSamples
PDDIC *SOCPDCH4TICPDDIC *DOCPDCH4DIC
C4−21.7−41.5−24.4−0.3−83.3−2.7−21.7−41.5−23.3−21.7−83.3−41.5
C17−21.7−47.6−24.7−0.3−83.3−43.9−21.7−47.6−42.8−21.7−83.3−47.6
C7−21.7−38.5−23.4−0.3−83.3−15.0−21.7−38.5−26.6−21.7−83.3−38.5
To estimate AOM contribution to CaCO3, it was assumed that there was no isotopic fractionation during DIC precipitation to form CaCO3 [79]. δ13CTIC profile in C3 did not vary with depth, showed no evidence of CH4, and had a relatively conservative DIC profile. Thus, we used the average δ13CTIC value from C3 (−0.3‰) as the phytodetritus end-member for estimating contribution of CH4 to the CaCO3 pool. The CH4 end-member is the average δ13CCH4 value below the SMT from all cores (−83.3‰). For C17, the minimum δ13CTIC value (−43.9‰, Table 2) observed through the SMT represents a 55% contribution from AOM (Table 3). In C7, the AOM contribution to CaCO3 was estimated to be 19% based on a δ13CTIC of −15.0‰. Moving landward to C4, the minimum δ13CTIC value of −2.5‰ resulted in a CH4 contribution to CaCO3 of 3%.
Table 3. Percent CH4 contribution to dissolved inorganic carbon (DIC), dissolved organic carbon (DOC), calcium carbonate (CaCO3), and sediment organic carbon (SOC) at core locations observed to have a SMT (C4, C17, C7).
CoreDICDOCCaCO3SOC
C432%7%3%12%
C1747%71%55%8%
C733%24%19%8%
For CH4 contribution to sediment pore water carbon pools, it was assumed that phtyodetritus-derived δ13CDOC was −21.7‰ and that DOC is produced during DIC fixation; therefore the same DIC end-members as in SOC calculations were used (Table 2). With these end-members and a δ13CDOC value of −42.8‰, maximum AOM contribution to DOC is 71% in C17 (Table 3). Moving seaward to C7, contribution of AOM to pore water DOC was estimated to be 24%. Landward in C4, the AOM contribution to DOC was 7%.
To calculate CH4 contribution to pore water DIC, the CH4 end-member presented above for CaCO3 (−83.3‰) was used with no isotopic fractionation. The phytodetritus end-member was estimated using C3 pore water δ13CDIC profile (Figure 4). δ13CDIC values in C3 represent mixing of seawater DIC (~0‰) and DIC derived from SOC degradation (−21.7‰) were used, with no contribution from CH4. For C17 and C7, the phytodetritus end-member is the δ13CDIC value in C3 at respective depths of the SMT (C17 = −15.9‰ at 183 cmbsf; C7 = −16.5‰ at 211 cmbsf). Using the same approach for C4 and extrapolating the C3 profile to 443 cmbsf (the depth of the SMT in C4) resulted in a δ13CDIC value that cannot be representative of mixing between DIC derived from seawater and that derived from SOC degradation (−32.2‰). Therefore, −21.7‰ was used for the phytodetritus end-member, a reasonable value for DIC produced during SOC decomposition. In C17 the minimum δ13CDIC value in the SMT was −47.6‰; CH4 was estimated to contribute 47% to the DIC pool (Table 3). In C7, δ13CDIC at the SMT is −38.5‰ resulting in a 33% contribution from CH4 to DIC. In C4, maximum contribution from AOM is 32% to pore water DIC.

5. Conclusions

Relative contribution of phytodetritus and deep biogenic CH4 to shallow sediment carbon pools varies across the Porangahau Ridge. Estimated CH4 fluxes across the ridge ranged from 11.4 to 86.2 mmol CH4 m−2·a−1 with the highest value on the westward side of the ridge where heat flow, seismic and controlled source electromagnetics data indicate elevated vertical fluid migration [35,36]. While seismic and geophysical parameters do show high fluid migration, CH4 flux at this study site is moderate relative to previous studies [13,15]. These data do show need for a combination of seismic and geochemical data for a thorough assessment of vertical methane flux levels. A carbon mass and isotope evaluation through core profiles [47,48] showed strong variation in contribution of CH4 to SOC, CaCO3, DOC and DIC (Table 1). A key observation for this assessment is the westward ridge elevated CH4 contribution to CaCO3 and DIC but not to SOC. A large contribution to CaCO3 but not SOC results from low microbial biomass production relative to CH4 oxidation. There was CH4 contribution to pore water DOC, but DOC concentrations are 3-fold lower than SOC resulting in a low contribution to the total carbon. At locations with an observed SMT (C4, C17 and C7) a more thorough evaluation of the CH4 contribution to shallow sediment carbon cycling is completed with a two end-member isotope mass balance [51]. At the landward ridge location (C17), CH4 contribution to CaCO3 and DIC was 55% and 47%, respectively showing a high respiration of CH4 to inorganic carbon pools during AOM (Table 3). There was a large contribution of AOM to pore water DOC at this location (71%); however, as stated above, this is small fraction of total sediment carbon. The CH4 contribution to SOC in this location was only 8%. In contrast, at C4 CH4 contribution to CaCO3 and DIC was 3% and 32%, indicating lower values of CH4-sourced carbon precipitating to inorganic phases. CH4-sourced pore water DOC at this location was an order of magnitude less (7%). Off ridge sediment is dominated by phytodetritus. This study examines shallow sediment carbon cycling and highlights the need to assess deep sediment CH4 contribution to coastal models. In addition, the combination of sediment geochemical profiles, seismic data [35], CSEM, and estimates of vertical fluid migration [36] provides strong predictive tools of for deep sediment CH4 hydrate loadings.

Acknowledgments

Acknowledgment is made to the New Zealand Foundation of Research, Science and Technology, Office of Naval Research and Department of Energy, National Energy Technology Laboratory for financial support of this research. We express sincere appreciation for support from the RV Tangaroa crew for support during this expedition.

Author Contributions

All authors have contributed to writing and revisions of this manuscript.

Conflicts of Interest

The authors declare no conflict of interest.

References

  1. Milliman, J. Flux and fate of fluvial sediment and water in coastal seas. In Ocean Margin Processes in Global Change; Mantoura, R.F.C., Martin, J., Wollast, R., Eds.; Wiley: New York, NY, USA, 1991; pp. 69–90. [Google Scholar]
  2. Goñi, M.A.; Ruttenberg, K.C.; Eglinton, T.I. Sources and contribution of terrigenous organic carbon to surface sediments in the Gulf of Mexico. Nature 1997, 389, 275–278. [Google Scholar]
  3. Mayer, L.M.; Schick, L.L.; Allison, M.A.; Rutthenberg, K.C.; Bentley, S.J. Marine vs. terrigenous organic matter in Louisiana coastal sediments: The uses of bromine:organic carbon ratios. Mar. Chem. 2007, 107, 244–254. [Google Scholar]
  4. Kelley, C.A.; Coffin, R.B.; Cifuentes, L.A. Stable isotope evidence for alternate carbon sources in the Gulf of Mexico. Limnol. Oceanogr. 1998, 43, 1962–1969. [Google Scholar]
  5. Wang, X.-C.; Chen, R.F.; Whelan, J.; Eglinton, T. Contribution of “old” carbon from natural marine hydrocarbon seeps to sedimentary and dissolved organic carbon pools in the Gulf of Mexico. Geophys. Res. Lett. 2001, 28, 3313–3316. [Google Scholar] [CrossRef]
  6. Joye, S.B.; Boetius, A.; Orcutt, B.N.; Montoya, J.P.; Schulz, H.N.; Erickson, M.J.; Lugo, S.K. The anaerobic oxidation of methane and sulfate reduction in sediments from Gulf of Mexico cold seeps. Chem. Geol. 2004, 205, 219–238. [Google Scholar] [CrossRef]
  7. Paull, C.K.; Ussler, W., III; Lorenson, T.; Winters, W.; Dougherty, J. Geochemical constraints on the distribution of gas hydrates in the Gulf of Mexico. Geol. Mar. Lett. 2005, 25, 273–280. [Google Scholar]
  8. Ruppel, C.; Dickens, G.R.; Castellini, D.G.; Gilhooly, W.; Lizarralde, D. Heat and salt inhibition of gas hydrate formation in the northern Gulf of Mexico. Geophys. Res. Lett. 2005, 32. [Google Scholar] [CrossRef]
  9. Lapham, L.L.; Chanton, J.P.; Martens, C.S.; Sleeper, K.; Woolsey, J.R. Microbial activity in surficial sediments overlying acoustic wipeout zones at a Gulf of Mexico cold seep. Geochem. Geophy. Geosyst. 2008, 9. [Google Scholar] [CrossRef]
  10. Pohlman, J.W.; Bauer, J.E.; Waite, W.F.; Osburn, C.L.; Chapman, N.R. Methane hydrate-bearing seeps as a source of aged dissolved organic carbon to the oceans. Nat. Geosci. 2011, 4, 37–41. [Google Scholar] [CrossRef]
  11. McCarthy, M.D.; Beaupré, S.R.; Walker, B.D.; Voparil, I.; Guilderson, T.P.; Druffel, E.R.M. Chemosynthetic origin of 14C-depleted dissolved organic matter in a ridge-flank hydrothermal system. Nat. Geosci. 2011, 4. [Google Scholar] [CrossRef]
  12. Pohlman, J.W.; Kaneko, M.; Heuer, V.B.; Coffin, R.B.; Whiticar, M. Methane soucrces and production in the north Cascadia Margin gas hydrate system. Earth Planet. Sci. Lett. 2009, 287, 504–512. [Google Scholar] [CrossRef]
  13. Coffin, R.B.; Hamdan, L.; Plummer, R.; Smith, J.; Gardner, J.; Wood, W.T. Analysis of methane and sulfate flux in methane charged sediments from the Mississippi Canyon, Gulf of Mexico. Mar. Petrol. Geol. 2008, 25, 977–987. [Google Scholar] [CrossRef]
  14. Reitner, J.; Peckmann, J.; Reimer, A.; Schumann, G.; Thiel, V. Methane-derived carbonate build-ups and associated microbial communities at cold seeps on the lower Crimean shelf. (Black Sea). Facies 2005, 51, 66–79. [Google Scholar]
  15. Coffin, R.B.; Pohlman, J.W.; Gardner, J.; Downer, R.; Wood, W.; Hamdan, L.; Walker, S.; Plummer, R.; Gettrust, J.; Diaz, J. Methane hydrate exploration on the mid Chilean coast: A geochemical and geophysical survey. Am. Chem. Soc. Div. Pet. Chem. 2007, 56, 32–41. [Google Scholar]
  16. Coffin, R.B.; Hamdan, L.; Smith, J.P.; Plummer, R.; Millholland, L.; Larson, R. Spatial variation in shallow sediment methane source and cycling on the Alaskan Beaufort Sea. Mar. Pet. Geol. 2013, 45. [Google Scholar] [CrossRef]
  17. Borowski, W.S.; Paull, C.K.; Ussler, W., III. Marine porewater sulfate profiles indicate in situ methane flux from underlying gas hydrate. Geology 1996, 24, 655–658. [Google Scholar] [CrossRef]
  18. Borowski, W.S.; Paull, C.K.; Ussler, W., III. Global and local variations of interstitial sulfate gradients in the deep-water, continental margin sediments: Sensitivity to underlying methane and gas hydrates. Mar. Geol. 1999, 159, 131–154. [Google Scholar] [CrossRef]
  19. Orphan, V.J.; House, C.H.; Hinrichs, K.-U.; McKeegan, K.D.; DeLong, E.F. Methane-consuming archaea revealed by directly coupled isotopic and phylogenetic analysis. Science 2001, 293, 484–487. [Google Scholar] [CrossRef] [PubMed]
  20. Valentine, D.L. Biogeochemistry and microbial ecology of methane oxidation in anoxic environments: A review. Antonie Leeuwenhoek 2002, 81, 271–282. [Google Scholar] [CrossRef] [PubMed]
  21. Wehrmann, L.M.; Risgaard-Petersen, N.; Schrum, H.N.; Walsh, E.A.; Huh, Y.; Ikehara, M.; Pierre, C.; D’Hondt, S.; Ferdelman, R.G.; Ravelo, A.C.; et al. Couple organic and inorganic carbon cycling in the deep subseafloor sediment of the northeastern Bering Sea Slope (IODP Exp. 323). Chem. Geol. 2011, 284, 251–261. [Google Scholar]
  22. Lein, A.Y.; Savvichev, A.S.; Ivanov, M.V. Reservoir of dissolved methand in the water column of the sea of the Russian Arctic region. Doklady Earth Sci. 2011, 441, 1576–1578. [Google Scholar] [CrossRef]
  23. Treude, T.; Niggemann, J.; Kallmeyer, J.; Wintersteller, P.; Schubert, C.J.; Boetius, A.; Jørgensen, B.B. Anaerobic oxidation of methane and sulfate reduction along the Chilean continental margin. Geochim. Cosmochim. Acta 2005, 69, 2767–2779. [Google Scholar] [CrossRef]
  24. Kessler, J.D.; Reeburgh, W.S.; Valentine, D.L.; Kinnaman, F.S.; Peltzer, E.T.; Brewer, P.G.; Southon, J.; Tyler, S.C. A survey of methane isotope abundance (14C, 13C, 2H) from five nearshore marine basins that reveals unusual radiocarbon levels in subsurface waters. J. Geophys. Res. 2008, 113. [Google Scholar] [CrossRef]
  25. Savvichev, A.S.; Rusanov, I.I.; Pimenov, N.V.; Pimenov, E.E.; Zakharova, E.E.; Veslopolova, E.F.; Lein, A.Y.; Crane, K.; Ivanov, M.V. Microbial processes of the carbon and sulphur cycles in the Chukchi Sea. Microbiology 2007, 76, 603–613. [Google Scholar] [CrossRef]
  26. Broecker, W.; Barker, S.; Clark, E.; Hajdas, I.; Bonani, G.; Stott, L. Ventilation of the glacial deep pacific ocean. Science 2004, 306, 1169–1172. [Google Scholar] [CrossRef] [PubMed]
  27. Wang, X.; Chen, R.F.; Gardner, G.B. Sources and transport of dissolved and particulate organic carbon in the Mississippi River estuary and adjacent coastal waters of the northern Gulf of Mexico. Mar. Chem. 2004, 89, 241–256. [Google Scholar] [CrossRef]
  28. Sassen, R.; MacDonald, I.R. Hydrocarbons of experimental and natural gas hydrates, Gulf of Mexico continental slope. Org. Geochem. 1997, 26, 289–293. [Google Scholar] [CrossRef]
  29. Milkov, A.V. Molecular and stable isotope compositions of natural gas hydrates: A revised global data set and basic interpretations in the context of geological settings. Org. Geochem. 2005, 36, 681–702. [Google Scholar] [CrossRef]
  30. Rodrigues, N.M.; Paull, C.K.; Borowski, W.S. Zonation of authigenic carbonates within gas hydrate-bearing sedimentary sections on the blake ridge: Offshore Southeastern North America. In Proceedings of the Ocean Drilling Program—Scientific Results; Paull, C.K., Matsumoto, R., Wallace, P.J., Dillon, W.P., Eds.; Ocean Drilling Program: College Station, TX, USA, 2000; Volume 164. [Google Scholar]
  31. Chen, F.; Zhang, L.; Yang, Y.; Zhang, D. Chemical and isotopic alteration of organic matter during early diagenesis: Evidence from the coastal area off-shore the Pearl River estuary, south China. J. Mar. Syst. 2008, 74, 372–384. [Google Scholar] [CrossRef]
  32. Heuer, V.B.; Pohlman, J.W.; Torres, M.E.; Elvert, M.; Hinrichs, K.-U. The stable isotope biogeochemistry of acetate and other dissolved carbon species in deep subseafloor sediments at the northern Cascadia Margin. Geochem. Cosmochim. Acta 2009, 73, 3323–3336. [Google Scholar] [CrossRef]
  33. DeMets, C.; Gordon, R.G.; Argus, D.F.; Stein, S. Effect of recent revisions to the geomagnetic reversal time scale on estimates of current plate motions. Geophys. Res. Lett. 1994, 21, 2191–2194. [Google Scholar] [CrossRef]
  34. Barnes, P.M.; Mercier de Lépinay, B. Rates and mechanics of rapid frontal acrretion along the very obliquely converget southern Hikurangi Margin, New Zealand. J. Geophys. Res. 1997, 102, 24931–24952. [Google Scholar] [CrossRef]
  35. Pecher, I.A.; Henrys, S.A.; Wood, W.T.; Kukowski, N.; Crutchley, G.J.; Fohrmann, M.; Kilner, J.; Senger, K.; Gorman, A.R.; Coffin, R.B.; et al. Focussed fluid flow on the Hikurangi Margin, New Zealand—Evidence from possible local upwarping of the base fo gas hydrate stability. Mar. Geol. 2010, 272, 99–113. [Google Scholar] [CrossRef]
  36. Schwalenberg, K.; Wood, W.; Pecher, I.; Hamdan, L.; Stuart, S.; Jegen, M.; Coffin, R. Preliminary interpretation of electromagnetic, heat flow, seismic and geochemistry data for gas hydrate distribution across the Porangahau Ridge, New Zealand. Mar. Geol. 2010, 272, 89–108. [Google Scholar] [CrossRef]
  37. Hamdan, L.J.; Gillevet, P.M.; Pohlman, J.P.; Sikaroodi, M.; Greinert, J.; Coffin, R.B. Diversity and biogeochemical structuring of bacterial communities across the Porangahau ridge accretionary prism, New Zealand. FEMS Microbiol. Ecol. 2011, 77, 518–532. [Google Scholar] [CrossRef] [PubMed]
  38. Barnes, P.M.; Lamarche, G.; Bialas, J.; Henrys, S.A.; Pecher, I.A.; Netzeband, G.; Greinert, J.; Mountjoy, J.J.; Pedley, K.; Crutchley, G. Tectonic and geological framework for gas hydrates and cold seeps on the hikurangi subduction margin, New Zealand. Mar. Geol. 2010, 272, 26–48. [Google Scholar] [CrossRef]
  39. Katz, H.R. Probable gas hydrate in continental slope east of the North Island, New Zealand. J. Pet. Geol. 1981, 3, 315–324. [Google Scholar] [CrossRef]
  40. Pecher, I.A.; Henrys, S.A. Potential Gas Reserves in Gas Hydrate Sweet Spots on the Hikurangi Margin, New Zealand; Institute of Geological & Nuclear Sciences: Wellington, New Zealand, 2003. [Google Scholar]
  41. Lewis, K.B.; Pettinga, J.R. The emerging imbricate frontal wedge of the Hikurangi margin. In South Pacific Sedimentary Basins; Balance, P.F., Ed.; Elsevier: Amsterdam, The Netherlands, 1993; pp. 225–250. [Google Scholar]
  42. Hoehler, T.M.; Borowski, W.S.; Alperin, M.J.; Rodriguez, N.M.; Paull, C.K. Model, stable isotope, and radiocarbon characterization of anaerobic methane oxidation in gas hydrate-bearing sediments of the Blake Ridge. In Proceedings of the Ocean Drilling Program, Scientific Results, College Station, TX, USA; 2000; Volume 164, pp. 79–85. [Google Scholar]
  43. Cline, J.D. Spectrophotometric determination of hydrogen sulfide in natural waters. Limnol. Oceanogr. 1969, 14, 454–459. [Google Scholar] [CrossRef]
  44. Plummer, R.E.; Pohlman, J.W.; Coffin, R.B. Compound-specific stable carbon isotope analysis of low-concentration complex hydrocarbon mixtures from natural gas hydrate systems. In Proceedings of AGU Fall Meeting Abstracts, San Francisco, CA, USA, 5–9 December 2005.
  45. Osburn, C.L.; St-Jean, G. The use of wet chemical oxidation with high-amplification isotope ratio mass spectrometry (WCO-IRMS) to measure stable isotope values of dissolved organic carbon in seawater. Limnol. Oceanogr. Meth. 2007, 5, 296–308. [Google Scholar] [CrossRef]
  46. Borowski, W.S.; Paull, C.K.; Ussler, W., III. Carbon cycling within the upper methanogenic zone of continental rise sediments: An example from the methane-rich overlying the Blake Ridge gas hydrate deposits. Mar. Chem. 1997, 57, 299–311. [Google Scholar] [CrossRef]
  47. Aller, R.C.; Blair, N.E. Carbon remineralization in the Amazon-Guianas tropical mobile mudbelt: A sedimentary incinerator. Cont. Shelf Res. 2006, 26, 2241–2259. [Google Scholar] [CrossRef]
  48. Aller, R.C.; Blair, N.E.; Brunskill, G.J. Early diagenetic cycling, incineration, and burial of sedimentary organic carbon in the central Gulf of Papus (Papua New Guinea). J. Geophys. Res. 2008, 113. [Google Scholar] [CrossRef]
  49. Martin, W.R.; McNichol, A.P.; McCorkle, D.C. The radiocarbon age of calcite dissolving at the sea floor: Estimates from pore water data. Geochem. Cosmochim. Acta 2000, 64, 1391–1404. [Google Scholar] [CrossRef]
  50. Sayles, F.L.; Curry, W.B. δ13C, TCO2, and the metabolism of organic-carbon in deep-sea sediments. Geochem. Cosmochim. Acta 1988, 52, 2963–2978. [Google Scholar] [CrossRef]
  51. Macko, S.A.; Ostrom, N.E. Pollution studies using stable isotopes. In Stable Isotopes in Ecology and Environmental Science; Lajtha, K., Michener, R., Eds.; Blackwell Scientific Publications: Oxford, UK, 1994; pp. 45–62. [Google Scholar]
  52. Martens, C.S.; Berner, R.A. Methane production in interstitial waters of sulfate-depleted marine sediments. Science 1974, 185, 1167–1169. [Google Scholar] [CrossRef] [PubMed]
  53. Whiticar, M. Carbon and hydrogen isotope systematics of bacterial formation and oxidation of methane. Chem. Geol. 1999, 161, 291–314. [Google Scholar] [CrossRef]
  54. Boetius, A.; Ravenschlag, K.; Schubert, C.J.; Rickert, D.; Widdel, F.; Gleske, A.; Amann, R.; Jørgensen, B.B.; Witte, U.; Pfannkuche, O. A marine microbial consortium apparently mediating anaerobic oxidation of methane. Nature 2000, 407, 623–626. [Google Scholar] [CrossRef] [PubMed]
  55. Meister, P.; Liu, B.; Ferdelman, T.G.; Jørgensen, B.B.; Khalili, A. Control of sulphate and methane distributions in marine sediments by organic matter reactivity. Geochim. Cosmochim. Acta 2013, 104, 183–193. [Google Scholar] [CrossRef]
  56. Berner, R.A. Sulfate reduction and the rate of deposition of marine sediments. Earth Planet. Sci. Lett. 1978, 37, 492–498. [Google Scholar] [CrossRef]
  57. Ussler, W., III; Paull, C.K. Rates of anaerobic oxidation of methane and authigenic carbonate mineralization in methane-rich deep-sea sediments inferred from models and geochemical profiles. Earth Planet. Sci. Lett. 2008, 266, 271–287. [Google Scholar] [CrossRef]
  58. Claypool, G.E.; Milkov, A.V.; Lee, Y.-J.; Torres, M.E.; Borowski, W.S.; Tomaru, H. Microbial Methane Generation and Gas Transport in Shallow Sediments of Accretionary Complex, Southern Hydrate Ridge (ODP Leg 204), Offshore Oregon, USA. Available online: http://ir.library.oregonstate.edu/xmlui/handle/1957/13714 (accessed on 12 August 2014).
  59. Claypool, G.E.; Kaplan, I.R. The origin and distribution of methane in marine sediments. In Natural Gases in Marine Sediments; Kaplan, I.R., Ed.; Plenum Press: New York, NY, USA, 1974; pp. 99–139. [Google Scholar]
  60. Malinverno, A.; Pohlman, J.W. Modeling sulfate reduction in methane hydrate-bearing continental margin sediments: Does a suflate-methane transition require anaerobic oxidation of methane? Geochem. Geophys. Geosyst. 2011, 12. [Google Scholar] [CrossRef]
  61. Boehme, S.E.; Blair, N.E.; Chanton, J.P.; Martins, C.S. A mass balance of 13C and 12C in an organic-rich methane-producing marine sediment. Geochim. Cosmochim. Acta 1996, 60, 3835–3848. [Google Scholar] [CrossRef]
  62. Peterson, B.J.; Howarth, R.W.; Garritt, R.H. Multiple stable isotopes used to trace the flow of organic matter in estuarine food webs. Science 1985, 277, 1361–1363. [Google Scholar] [CrossRef]
  63. Law, C.S.; Nodder, S.D.; Mountjoy, J.J.; Marriner, A.; Orpin, A.; Pilditch, C.A.; Franz, P.; Thompson, K. Geological, hydrodynamic and biogeochemical variability of a New Zealand deep-water methane cold seep during an integrated three-year time-series study. Mar. Geol. 2010, 272, 189–208. [Google Scholar] [CrossRef]
  64. Morse, J.W.; Beazley, M.J. Organic matter in deepwater sediments of the Northern Gulf of Mexico and its relationship to the distribution of benthic organisms. Deep-Sea Res. II 2008, 55, 2563–2571. [Google Scholar]
  65. Coffin, R.B.; Osburn, C.L.; Plummer, R.; Grabowski, K.S. Deep sediment methane incorporation into shallow sediment carbon pools in Atwater Valley, Texas-Louisiana Shelf, Gulf of Mexico. Energies 2014. submitted. [Google Scholar]
  66. Wegener, G.; Niewmann, H.; Elvert, M.; Hinrichs, K.-U.; Boetius, A. Assimilation of methane and inorganic carbon by microbial communities mediating the anaerobic oxidation of methane. Environ. Microbiol. 2008, 10, 2287–2298. [Google Scholar] [CrossRef] [PubMed]
  67. Nauhaus, K.; Albrecht, M.; Elvert, M.; Boetius, A.; Widdel, F. In vitro cell growth of marine archaeal-bacterial consortia during anaerobic oxidation of methane with sulfate. Environ. Microbiol. 2007, 9, 187–196. [Google Scholar] [CrossRef] [PubMed]
  68. Knittel, K.; Boetius, A. Anaerobic oxidation of methane: Progress with an unknown process. Annu. Rev. Microbiol. 2009, 63, 311–334. [Google Scholar] [CrossRef] [PubMed]
  69. Leak, D.J.; Dalton, H. Growth yields of methanotrophs. Appl. Microbiol. Biotechnol. 1986, 23, 470–476. [Google Scholar] [CrossRef]
  70. House, C.H.; Schopf, J.W.; Stetter, K.O. Carbon isotopic fractionation by Archaens and other thermophilic prokaryotes. Org. Geochem. 2003, 34, 345–356. [Google Scholar] [CrossRef]
  71. Zhang, C.L.; Fouke, B.W.; Bonheyo, G.T.; Peackock, A.D.; White, D.C.; Huang, Y.; Romanek, C.S. Lipid biomarkers and carbon-isotopes of modern travertine deposits (Yellowstone Natioinal Park, USA): Implications for biogeochemical dynamics in hot-spring systems. Geochem. Cosmochim. Acta 2004, 68, 3157–3169. [Google Scholar] [CrossRef]
  72. Quandt, L.; Gottschalk, G.; Ziegler, H.; Stichler, W. Isotope discrimination by photosynthetic bacteria. REMS Microbiol. Lett. 1977, 1, 125–128. [Google Scholar] [CrossRef]
  73. Preuß, A.; Schauder, R.; Fuchs, G.; Stichler, W. Carbon isotope fractionation by autotrophic bacteria with three different CO2 fixation pathways. Z. Naturforsch. J. Biosci. 1989, 44, 397–402. [Google Scholar]
  74. Manske, A.K.; Glaeser, J.; Kuypers, M.M.M.; Overmann, J. Physiology and phylogeny of green sulfur bacteria forming a monospecific phototrophic assemblage at a depth of 100 meters in the Black Sea. Appl. Environ. Microbiol. 2005, 71, 8049–8060. [Google Scholar] [CrossRef] [PubMed]
  75. Inagaki, F.; Nunoura, T.; Nakagawa, S.; Teske, A.; Lever, M.; Lauer, A.; Suzuki, M.; Takai, K.; Delwiche, M.; Colwell, F.S. Biogeographical distribution and diversity of microbes in the methane hydrate-bearing deep marine sediments on the Pacific Ocean Margin. Proc. Natl. Acad. Sci. 2006, 103, 2815–2820. [Google Scholar] [CrossRef] [PubMed]
  76. Aoshima, M.; Igarashi, Y. A novel oxalosuccinate-forming enzyme involved in the reductive carboxylation of 2-oxoglutarate in Hydrogenbacter thermophiles TK-6. Mol. Microbiol. 2006, 62, 748–759. [Google Scholar] [CrossRef] [PubMed]
  77. Goñi, M.A.; Ruttenberg, K.C.; Eglinton, T.I. A re-assessment of the sources and importance of land-derived organic matter in surface sediment from the Gulf of Mexico. Geochem. Cosmochim. Acta 1998, 62, 3055–3075. [Google Scholar]
  78. Gordon, E.S.; Goñi, M.A. Controls on the distribution and accumulation of terrigenous organic matter in sediments from the Mississippi and Atchafalaya river margin. Mar. Chem. 2004, 92, 331–352. [Google Scholar] [CrossRef]
  79. Szynkiewicz, A.M.; Jedrysek, O.; Kurasiewicz, M. Carbon isotope effects during precipitation of barium carbonate: Implications for environmental studies. Environ. Chem. Lett. 2006, 4, 29–35. [Google Scholar] [CrossRef]

