Large-Scale Land Use for Construction and Energy Consumption after the New Millennium with Their Impact on Total-Factor Efficiency Change in China’s Regional Economy

Abstract
: The rapid economic growth after the new millennium could be characterized by the reappearance of heavy industrialization and land urbanization. In the literatures, extensive studies have examined the impact of energy and emissions on the growth quality during the heavy industrialization process, but few have paid attention to the land dimension. This paper aims at studying the role of land use in changing the total-factor efficiency (TFE) in China's regional economy, together with the energy factors. The basic conclusions obtained are as follows: (1) the land and energy factors do have a statistically significant influence on the total-factor integrated efficiency (TFIE), leading to a much lower and not improved efficiency performance in the sample period. The integrated efficiency is dominated by the land factor rather than energy ones; and (2) the total-factor land efficiency (TFLE) is lower than the energy efficiency and has more room to improve. The land factor has a statistically significant influence on the total-factor energy efficiency (TFEE) but not vice versa. As compared to single-factor efficiency, the total-factor energy/land efficiency provides us a more precise measure of factor efficiency in China.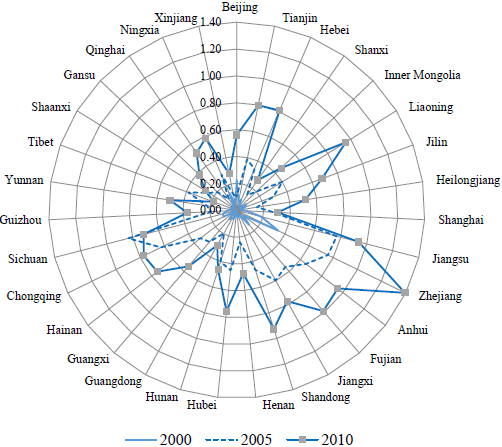
1. Introduction
China's economic model has delivered phenomenal rates of growth over the last three decades, resulting in the country's rise to front and center of the global economic stage. However, that model is still extensive in nature and could be characterized as high investment, large-scale energy consumption and heavy pollution emissions. After the new millennium, in particular, the phenomenon of heavy industrialization re-appeared in China, leading to more rapid consumption of energy and related pollution emissions. As shown in Figure 1, between 2003 and 2005, the growth rate of energy-induced CO2 emissions in China has exceeded 14% for continuous three years and only decreased after the economic crisis in 2008. Currently, China has become the largest energy consumer and carbon dioxide (CO2) emitter in the world. It culminated in an economy described by former Premier Wen Jiabao as “unstable, unbalanced, uncoordinated and ultimately unsustainable”.
Extensive studies have investigated the influence of energy or environment factors on the quality of economic growth in China and concluded that China's actual total-factor productivity (TFP) or total-factor efficiency (TFE) will be misestimated if the energy and/or environment issues are not, or not correctly taken into account, as stated by Hu and Wang [1], Zheng et al. [2], Chang and Hu [3], Wang et al. [4], Wu [5], Wu et al. [6], Wang et al. [7], Chen [8], Chen and Santos-Paulino [9], Lin and Du [10], and Zhang and Choi [11], among others. However, in the literatures, very few researchers have paid close attention to the impact of another important resource, land, on the productivity or efficiency performance of the Chinese economy. In fact, along with the reappearance of heavy industrialization, rapid land urbanization has become another obvious feature of economic growth in China since the beginning of this century. During the process of land urbanization, large-scale land is used for construction, also partly causing high energy use and environmental problems, the record of unaffordable high housing prices is repeatedly broken, and large amount of land revenue has accumulated, which suggests the urgent need for a detailed efficiency analysis of the land.
The core of urbanization is the urbanization of population in which the rural people continuously migrate and integrate into urban areas. Why land urbanization first rather than labor urbanization in China? Since the implementation of the “Tax Sharing System” (TSS) in 1994 and the income tax reform in 2002, the proportion of central fiscal revenue has been increased but the local responsibility of fiscal expenditure has not been decreased, leading to larger and larger budget deficits of local governments. To relieve the fiscal gap, land sale becomes one of choices to generate local fiscal revenue because the factor market is underdeveloped in China and local governments still control plenty of production factors, including land. Due to the unclear land property rights, local governments can easily obtain land resources at a very low compensation cost. As a monopoly supplier to the land market, on the one hand, local governments can transfer the land for production to industrial enterprises at a low negotiated price in order to attract investments; on the other hand, they can accumulate large amounts of land-related fiscal revenue by transferring the land to real estate firms for commercial construction at a very high price by bid, auction and listing. Furthermore, the big local fiscal gap forces the central government to allow the local governments to transfer the land and collect the land finance [12].
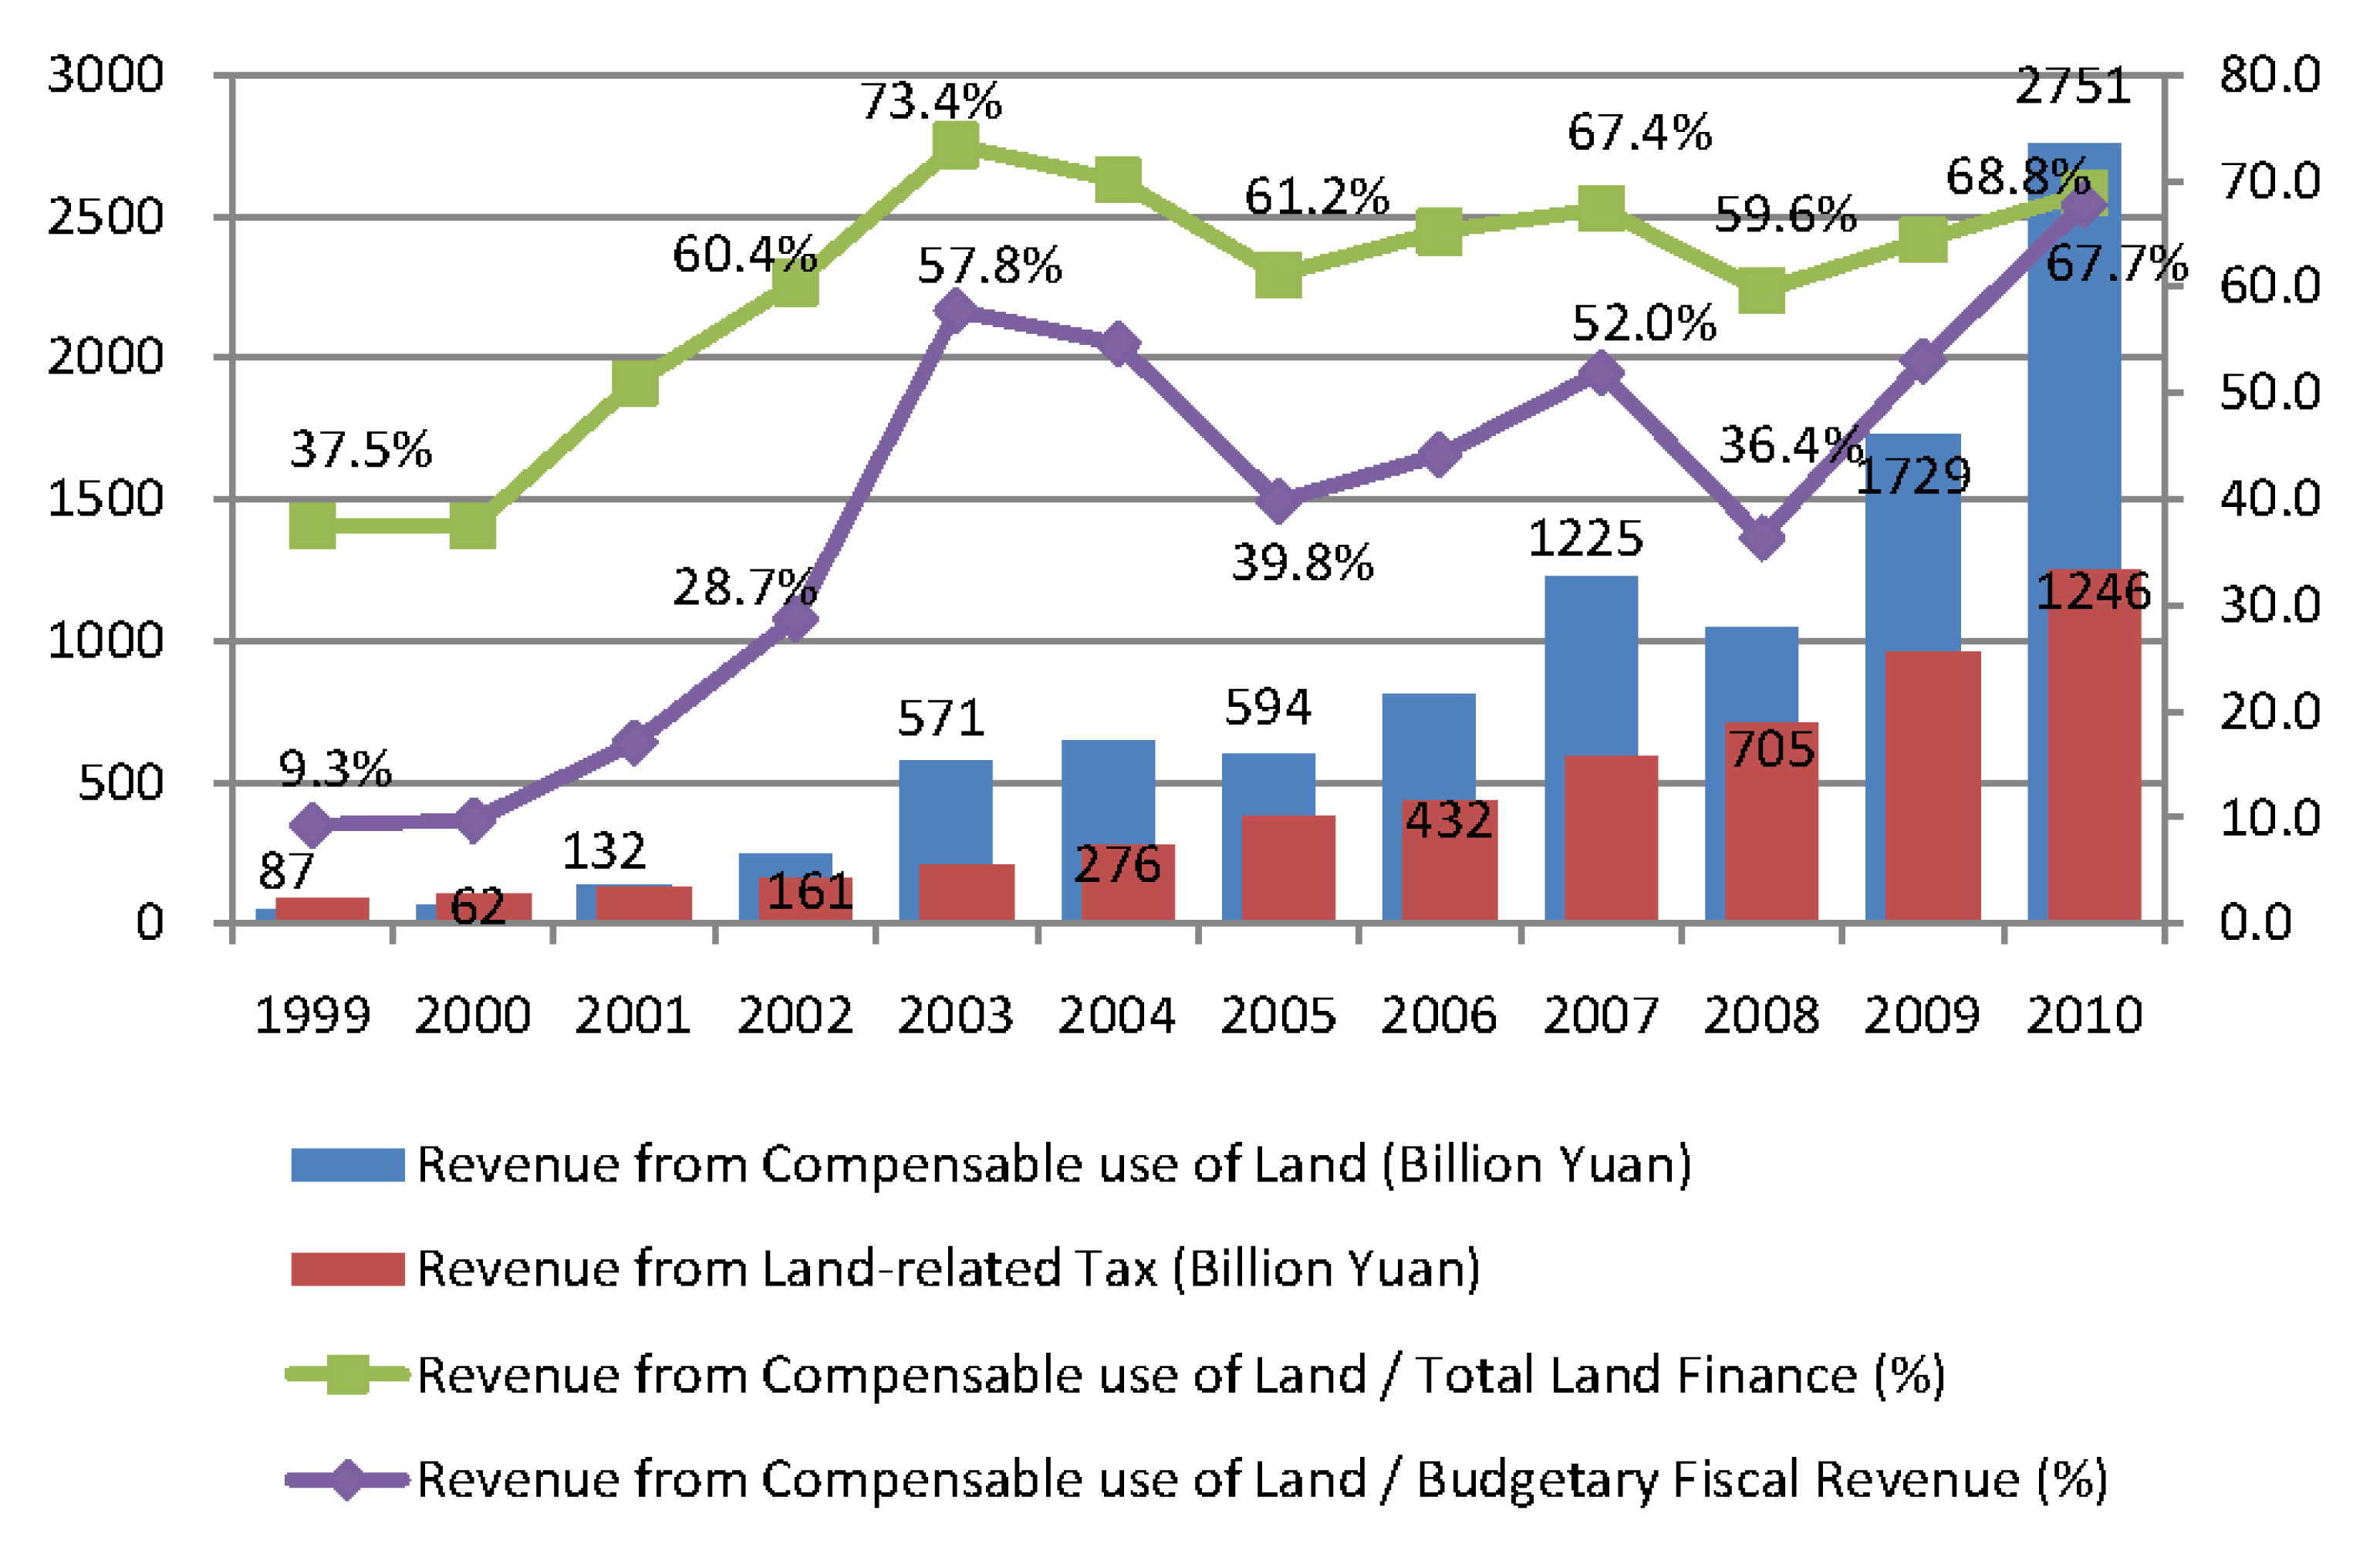
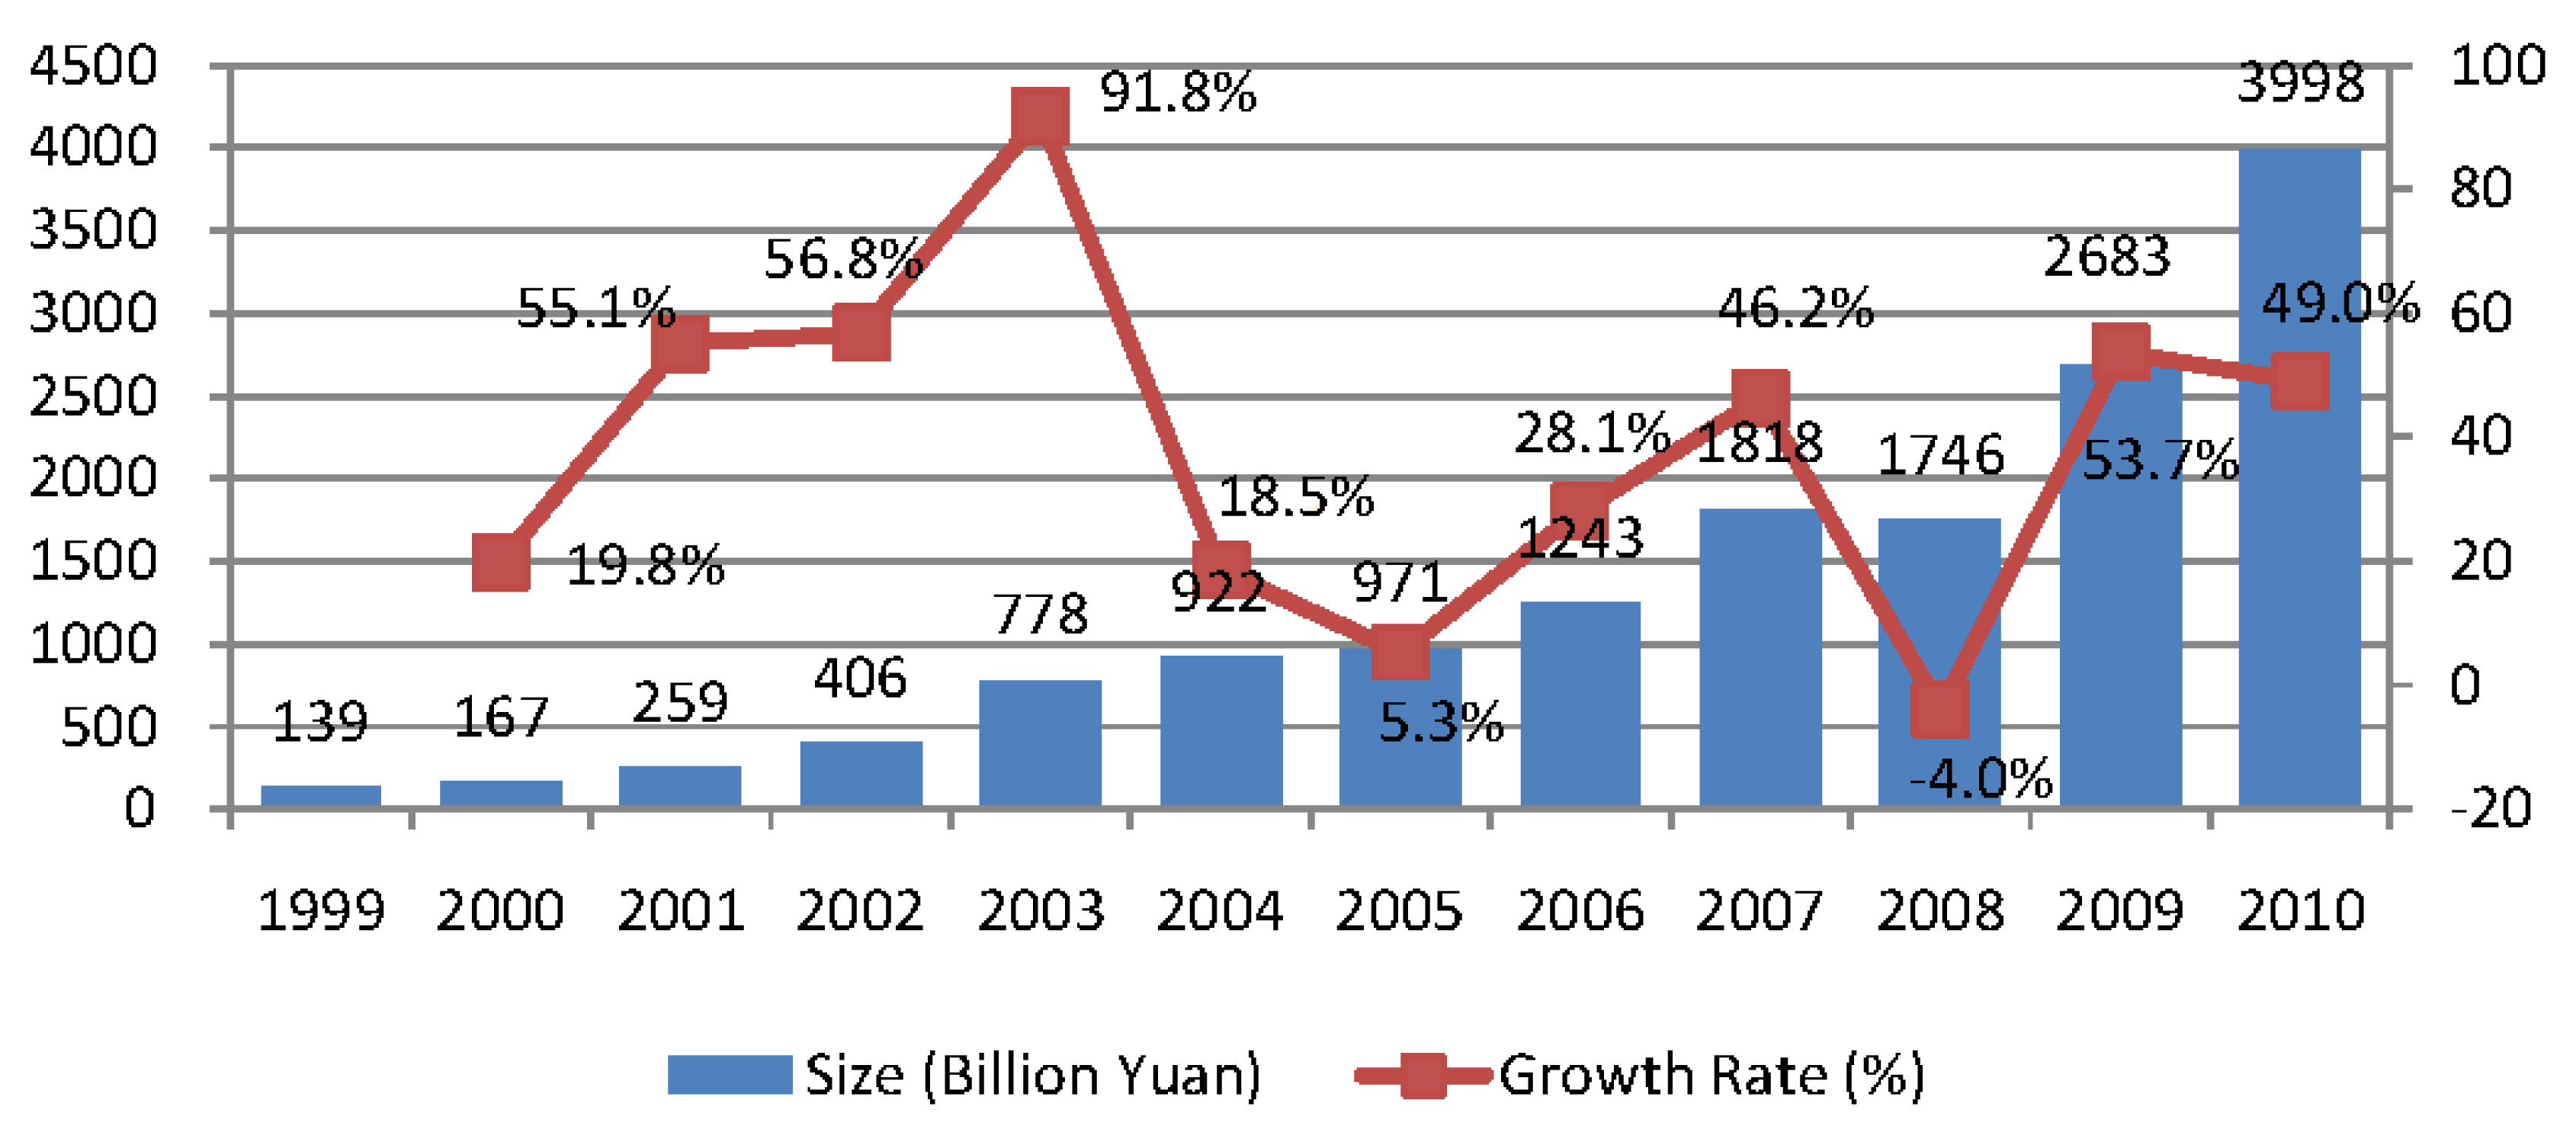
Under this institutional background, it's not surprising to see that the area of land use for construction and the revenue from land transactions increased sharply in China since the new century. According to the Bulletin of China Land and Resources 2010 [13], China supplied 428.2 thousand hectares of new land for construction in 2010, almost 10 times of the 45.4 thousand hectares of land supplied in 1999. In 2010, China's land transfer funds reached 2.7 trillion RMB, 53 times higher than the 51.4 billion RMB of land transfer funds obtained in 1999. Figure 2 describes the change of land finance revenue and its growth rate between 1999 and 2010. Here, land financial revenue includes two parts: the revenue from the compensable use of land, and the land-related tax income. As illustrated in the figure, the growth rate of land finance is far higher than that of CO2 emissions shown in Figure 1, which reached a highest rate of 91.8% in 2003, fell to a lowest −4% in 2008, influenced by the economic crisis, and returned to about 50% in 2009 and 2010. In 2010, China's total land finance amounted to 4 trillion RMB, almost equal to the size of China's budgetary fiscal revenue for the same year.
The huge land finance resources are controlled mainly by the local governments and have become their “second fiscal source”. The Land Administration Law revised in 2004 stipulated that though 30% of revenue of compensable use of newly supplied land should be handed over as central fiscal revenue, 70% of that is still left to local governments. In addition, the revenue from compensable use of land stock still belongs to local governments. Though land financial revenue made up the fiscal gap, it is often treated as the off-budgetary fiscal revenue, without any supervision by the local legislature and with very low fiscal transparency. In 2006, the State Council stipulated that the revenue from compensable use of land should be included in local budgetary revenue. However, due to the lack of necessary supervision, it has not been strictly implemented. According to the International Monetary Fund (IMF) [14], fiscal transparency is widely regarded as an important precondition for macroeconomic sustainability, fiscal stability and good governance. Lack of fiscal transparency will directly or indirectly result in many governance problems [15,16]. Many researchers have analyzed the phenomenon of social unfairness resulting from the process of land transfer by the local governments in China. Liang and Gao [17] concluded that the three factors of land prices, previous housing prices and interest rates have the largest influence on current housing prices, meaning that the rising land prices push the housing prices upward and brings risk to the banking sector. By using a case study in Jiangsu Province, Jiang [18] found that the farmers only can get 5%–10% of land value-added due to the change of land use area. The big land revenue provides an impulse for land sales to local governments, resulting in more frequent demolitions. Liang [19] found that official promotion incentives, fiscal revenue and governmental department interests played a positive role in breaking the land-related laws. Li [20] argued that the land finance not only overdrew the future land revenue in coming decades but also distorted the allocation efficiency of capital and land that increases the fiscal risk. Thus, it can clearly be seen that the land finance does more bad than good and can be regarded as the undesirable by-product of land use and development since the beginning of the new century.
As denoted above, few researchers have studied the impact of large scale use of land for construction on the efficiency performance of local governments in China. To compensate for this literatures' gap, this paper therefore aims to analyze the impact of land use, together with energy consumption, on the local TFE since the land urbanization and heavy industrialization are the main characteristics of China's regional economy after the new millennium. The remaining technological difficulty is how to appropriately include the land resource factor into the efficiency analysis. This will be discussed in Section 2. The rest of the paper is organized as follows: Section 3 describes the variables and data used for the efficiency measurement; Section 4 reports the measured total-factor integrated efficiency (TFIE) of local governments in China when the energy and land factors are taken into consideration; the influence of land resource and its negative outcome on the local total-factor energy efficiency (TFEE) is also investigated, and vice versa; finally, a comparative analysis between total-factor and single-factor energy/land efficiency is undertaken; Section 5 concludes this paper.
2. TFE with Undesirable Outputs
The directional distance function (DDF) methodology, the modification of data envelopment analysis (DEA), is often used to measure the environmental TFE, in which the energy is treated as the intermediate input and the energy-induced pollution emissions can be introduced as undesirable outputs to appropriately reveal their negative externalities in nature. Following this principle, this paper will also include the important resource of land as one of the inputs and regard its negative by-product of land financial revenue as the undesirable output, paralleling the energy input and emission output, because the DDF is a multiple-inputs and multiple-outputs framework. However, the DDF approach assumes that the increase of desirable output and the decrease of undesirable output follow a similar proportion, which is too strict in the reality. Contrarily, this paper will relax the assumption to consider the slacks of inputs and outputs. That is, to overcome the drawbacks of DDF, this paper will choose the non-radial, non-angle slacks-based measure (SBM) approach, and a variant of DDF, to estimate the actual TFE in China. This approach is also studied by Tone [21], Zhou et al. [22], Färe and Grosskopf [23] and so on.
Specifically, this paper will consider four different specifications: Model 1 in which the land and energy use are inputs, along with capital and labor, the land financial revenue and energy-induced CO2 emissions are bad outputs, and regional gross output value is a good output (the target model in the paper); Model 2 in which all the energy and land element and their bad outputs are ignored altogether (the basic DEA model with only capital, labor and good output of gross domestic product (GDP); by comparing to Model 1, this will check the effect of land and energy on efficiency); Model 3 that is specified by removing the land use and land finance from Model 1 in order to identify the effect of the land element on the total-factor integrated and energy efficiency by comparing the two; and Model 4 which is formed by deleting the energy and emissions from Model 1 to capture the effect of the energy element on integrated and land efficiency by comparing with Model 1. Below we will introduce the specification of the target Model 1 and the important concepts to be used in the paper.
Assume there are n decision-making units (DMUs) at t time point. For each DMU, there are k inputs, l desirable outputs and m undesirable outputs. x, y, b, X, Y and B represent the column vector and matrix of inputs, desirable outputs and undesirable outputs, respectively. Here, the DMUs are 31 provinces in China. In Model 1, k = 4 for capital, labor, energy and land use, l = 1 for GDP and m = 2 for energy-induced CO2 emission and land financial revenue. The production set p could be defined as:
The global SBM TFIE for i-th DMU could be obtained by resolving the following fraction programming:
By using the Charnes-Cooper transformation, the above nonlinear programming in Equation (2) could be transferred into the equivalent linear programming as shown below:
If the optimal solutions of linear programming in Equation (3) are symbolized by ( , Sx,−,*, Sy,+,* Sb,−,* τ*, Λ*), the optimal solutions of nonlinear programming in Equation (2) could be expressed accordingly as follows:
The global SBM TFEE and total-factor land efficiency (TFLE) for i-th DMU could be calculated as below:
The value of TFEE and TFLE also lies between 0 and 1, and the larger the value, the higher the efficiency of the unit is. TFEE has also been studied by Hu and Wang [1], Zhang and Choi [24].
3. Variables and Data
To estimate the provincial TFE in China since the new century, the input and output panel data for 31 provinces between 1999 and 2010 is necessary. Specifically, the panel database includes the variables of one desirable output (regional gross output value or regional GDP), two undesirable outputs (energy-induced CO2 emissions, revenue from compensable use of land for construction), and four inputs (capital stock, labor force, energy consumption, and land use for construction). All raw data to construct the provincial panel data comes from the China Statistical Yearbook (1999–2011) [25], China Energy Statistical Yearbook (1999–2011) [26], China Land & Resources Almanac (1999–2011) [27], China Taxation Yearbook (1999–2011) [28], China Compendium of Statistics 1949–2009 (2010) [29] and so on. The database includes all the 31 provinces, the rest of Hong Kong, Macao and Taiwan in China.
Because the intermediate inputs like energy consumption are included in the analysis of distance production function, the introduced output variables in Model 1, Model 3 and Model 4 should be the regional gross output values rather the value-added of GDP that is used in Model 2. The unit of desirable output is 100 million RMB and is depreciated at 2005 price level. Two traditional inputs are labor forces and capital stock. The labor input is the number of employed workers at the year-end rather than merely the number of staff, that reflects the actual utilization of all the labor resources at any time point (unit: ten thousand persons). The capital stock cannot be obtained directly and is estimated by using a perpetual inventory approach, also depreciated at constant 2005 prices of investment in fixed assets (unit: 100 million RMB). Energy consumption, measured in tons of coal equivalent (tce), is sourced from coal, petroleum and natural gas, each of which has a different CO2 emission factor. Energy-induced CO2 emissions (measured in tons) are calculated by multiplying the quantity of each energy source by its emission factor and summing across all sources. In this paper, we particularly investigate the influence of land resources and land related revenue on the local efficiency performance. The land input is the provincial land stock for construction in units of hectares. The land finance cannot be achieved directly, too, and needs estimation by ourselves. Below we focus on the estimation and discussion of provincial land finance, one of the undesirable outputs used in this paper.
In China, the land is freely used by making use of administrative allocation after the overthrow of infant capitalism and three years of land reforms over half a century ago. After the reform in 1978, the compensated use of the land was gradually implemented and became most serious during the first decade of this century. Local governments are not only the monopolists of the land market but also the decision-makers of land-related policies in China. As both the player and the referee, local governments are able to expropriate the land at low cost by using the non-market way, and also supply the expropriated land in a market manner to grab high monopoly profits. The land-related financial revenue is normally collected by the local governments in three ways: first, the revenue is directly obtained by supplying the land, including transferring or renting the land use rights, the so called the revenue from compensable use of land; second, the land-related taxes are also levied by the local governments; third, through the local governmental financing platforms like the Urban Development and Investment Company (UDIC), local governments can obtain large amounts of loans from the bank for further city construction by mortgaging their land. The third part of land finance is an invisible and the important component of local debts, which is very difficult to estimate due to the unavailability of its data. Thus, in this paper, the total land finance is measured according to the following formula:
Figure 2 in the Introduction Section has described the total size of the land finance, measured in this study, and its growing trend after the new millennium. Figure 3 further reports the structure of total land finance (land revenue of compensable use, and land tax income) and the relative size of land revenue of compensable use to the budgetary fiscal revenue on average. The land revenue of compensable use is not high in 1999, only 52 billion RMB, and represented 37.5% of total land finance; it grew fast since 2001, and reached 571 billion RMB in 2003, increasing by more than 10 times compared to 1999 and accounting for the highest 73.4% of total land finance; after 2003, both the revenue of compensable use of land and land tax income have maintained the increasing trend with only minor reductions of land revenue of compensable use in 2005 and 2008; in 2010, the land revenue of compensable use attained 2.75 trillion RMB and accounted for 68.8% of total land finance. Within land revenue of compensable use, land transfer funds had the overwhelming share of above 95%, while the land rent fees were very little. Obviously, the land revenue of compensable use not only grew rapidly, and had a big size, but it was also beyond the supervision of local legislatures, as mentioned in the Introduction Section, leading to very low fiscal transparency and the corresponding social problems and potential social dangers. Due to its typical negative externalities, in this paper, the land revenue of compensable use, rather the total land finance, will be used as the undesirable output to measure the local TFE.
The growing speed and big size of land revenue of compensable use could be better reflected in terms of its ratio to budgetary fiscal revenue, as shown in Figure 3. On average, the ratio of land revenue of compensable use to budgetary fiscal revenue was less than 10% in 1999, rapidly turned to 57.8% in 2003, and reached 67.7% in 2010, which means that the land finance became the second finance in reality as well as in name.
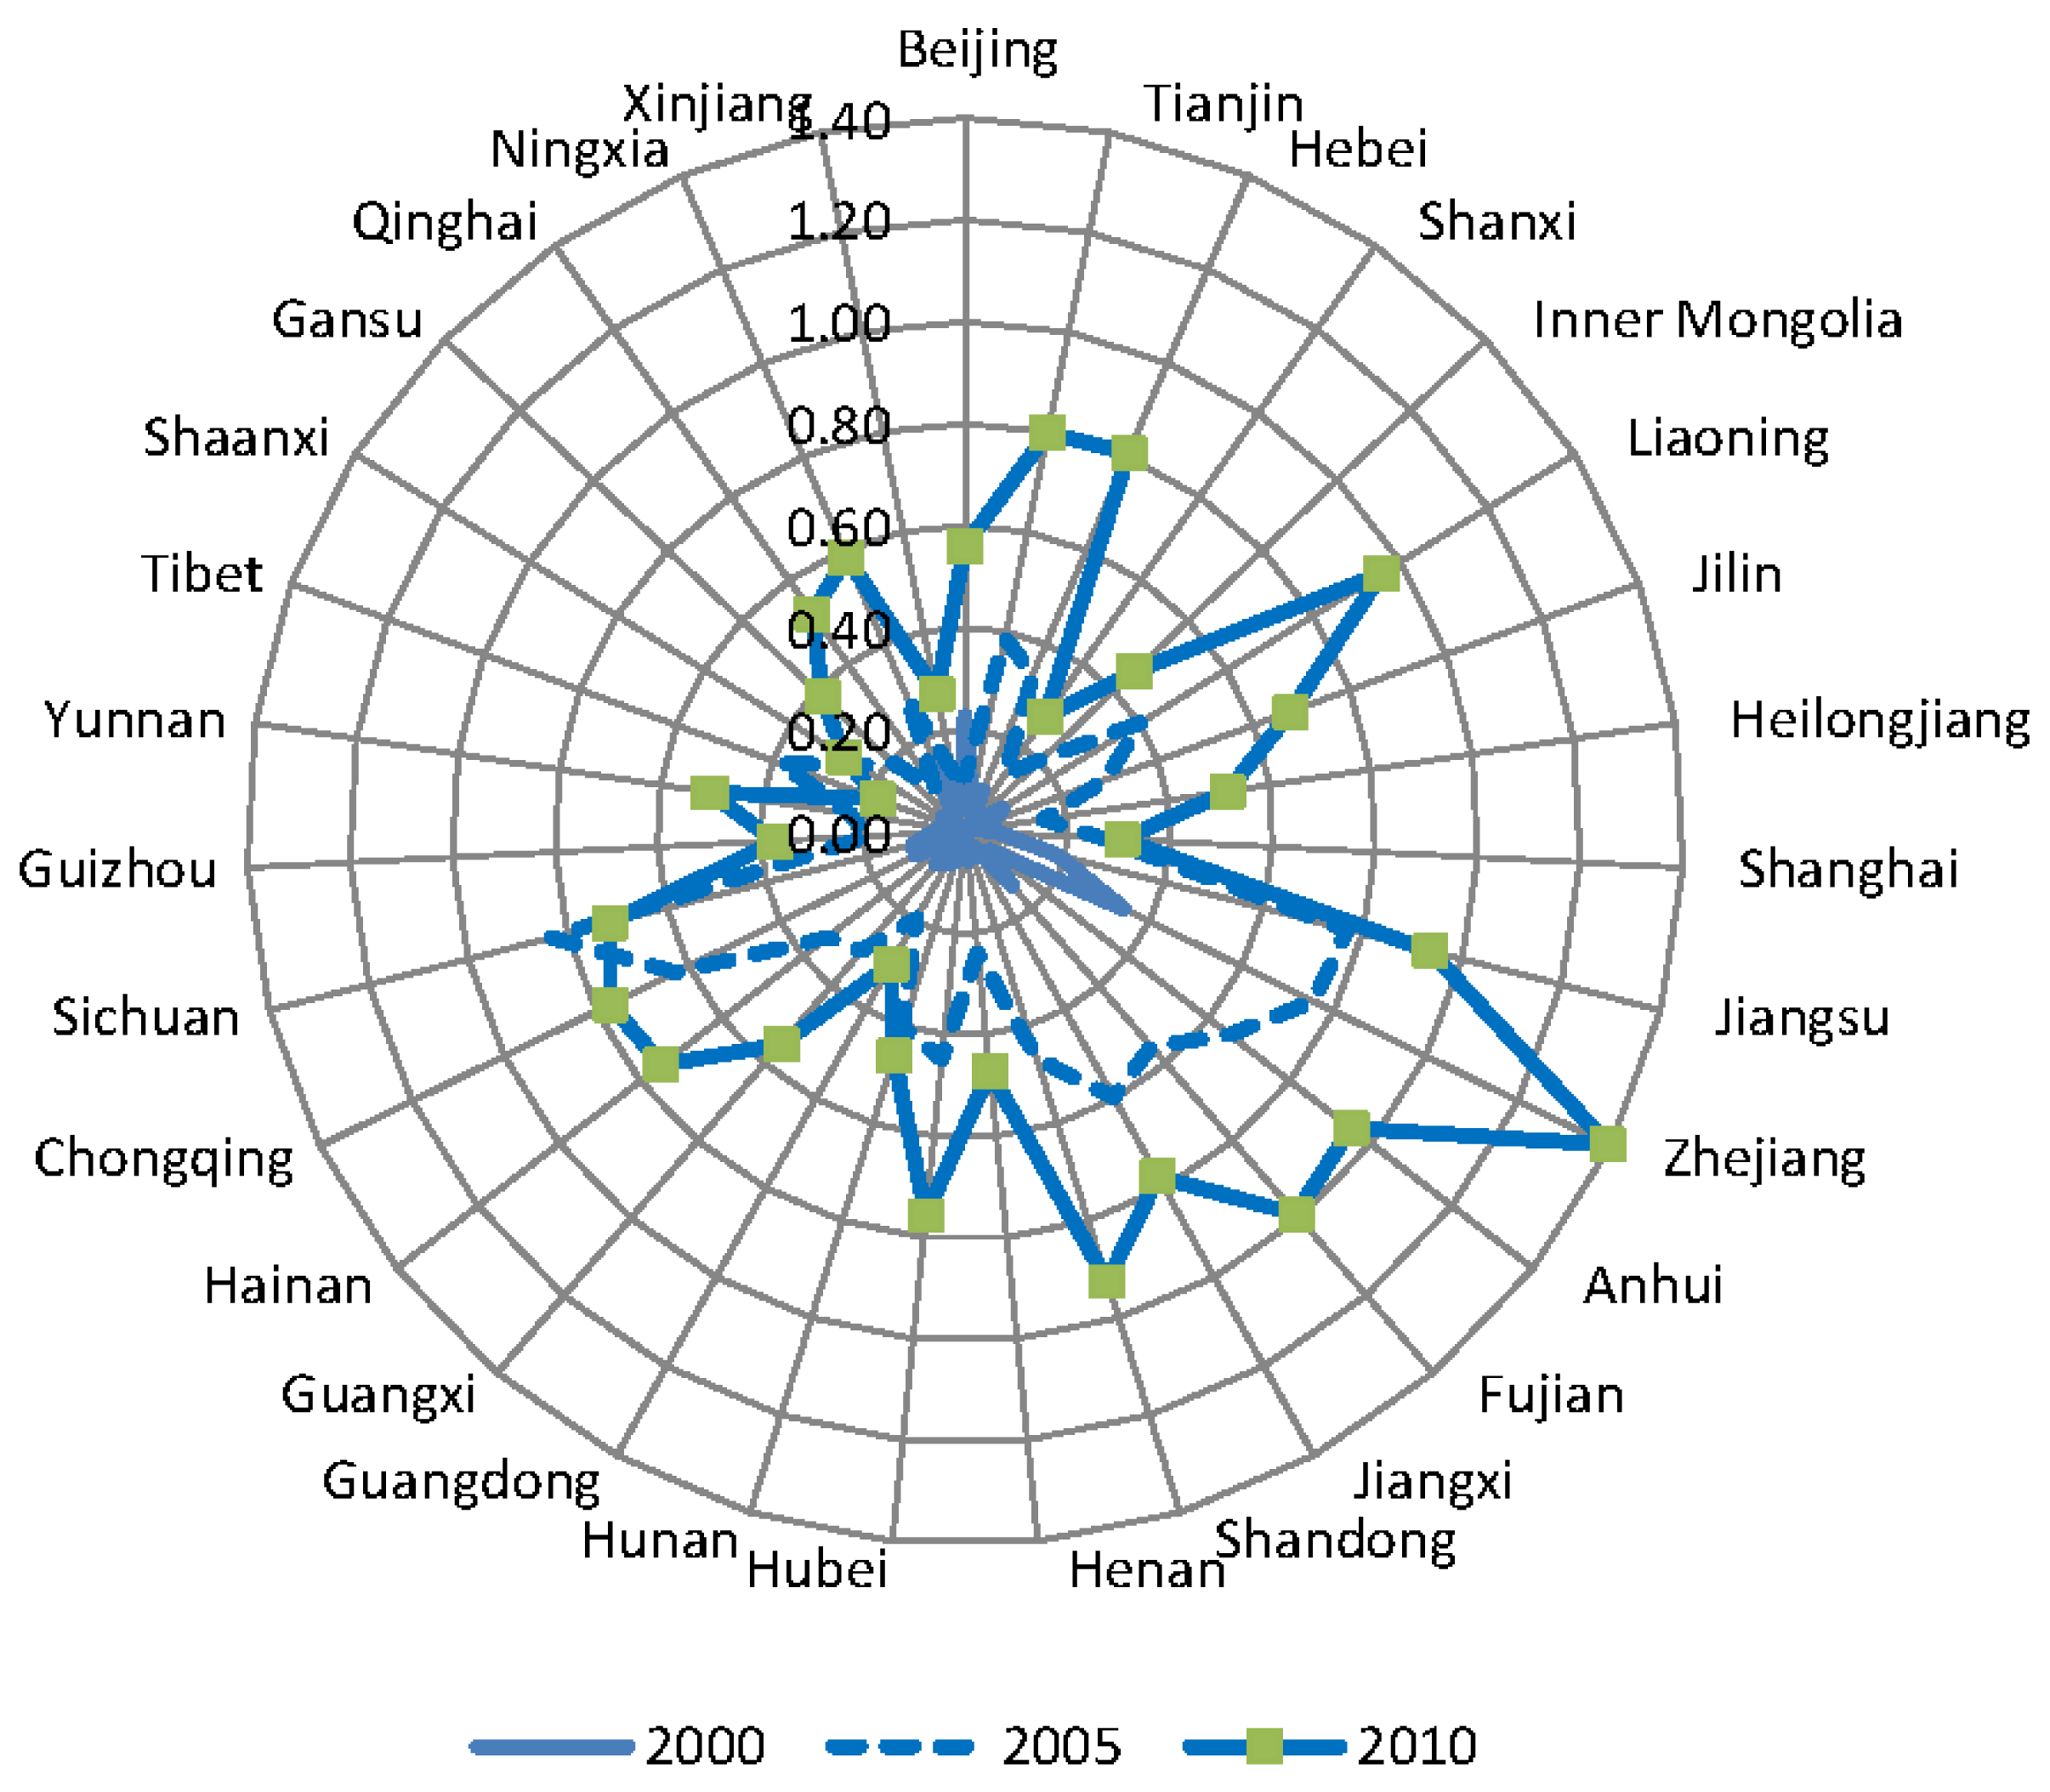
Figure 4 illustrates the provincial ratio of land revenue of compensable use to budgetary fiscal revenue in three years of 2000, 2005 and 2010. As seen from this radar chart, the growth rate of land revenue of compensable use was far faster than that of budgetary fiscal revenue and its size is so large relative to its budgetary fiscal revenue. In 2000, the ratio of most of the provinces is below 0.2 (only Beijing and Zhejiang exceeded 0.2, i.e., 0.23 and 0.34, respectively) and its mean is only 0.08; in 2005, its area almost covers that in 2000 and the mean of the ratio reached 0.36; in 2010, its area became much broader and the mean of the ratio reached 0.62. In particular, in 2010, the land revenue of compensable use in some provinces almost approaches to, or even exceeds the budgetary fiscal revenue. For example, in 2010, the ratio of Zhejiang Province is 1.40, while the ratios of Fujian, Liaoning, Anhui, Jiangsu and Shandong Provinces reached 0.99, 0.96, 0.95, 0.94, and 0.93, respectively. It can be clearly seen, even not including the invisible land finance and land tax income, the scale of land revenue of compensable use has already been quite amazing and it's very meaningful to use it as the undesirable output of land factor when measuring the actual TFE in China's regional economy.
4. The Influence of Land and Energy on Local TFE in China
By using the SBM approach, this paper estimates the actual TFE for 31 provinces between 1999 and 2010. Because the overuse of land and energy resources and the negative externalities of related land finance and CO2 emissions are considered in the target Model 1, we believe that the measure in this paper should be more precise than the studies that ignore the land and/or energy dimensions. The influence of land on TFEE will also be investigated in the following section, and vice versa. Finally, we will undertake a comparative analysis between the more precise total-factor land/energy efficiency and the traditional single-factor land/energy efficiency.
4.1. The Influence of Land and Energy on TFIE in China
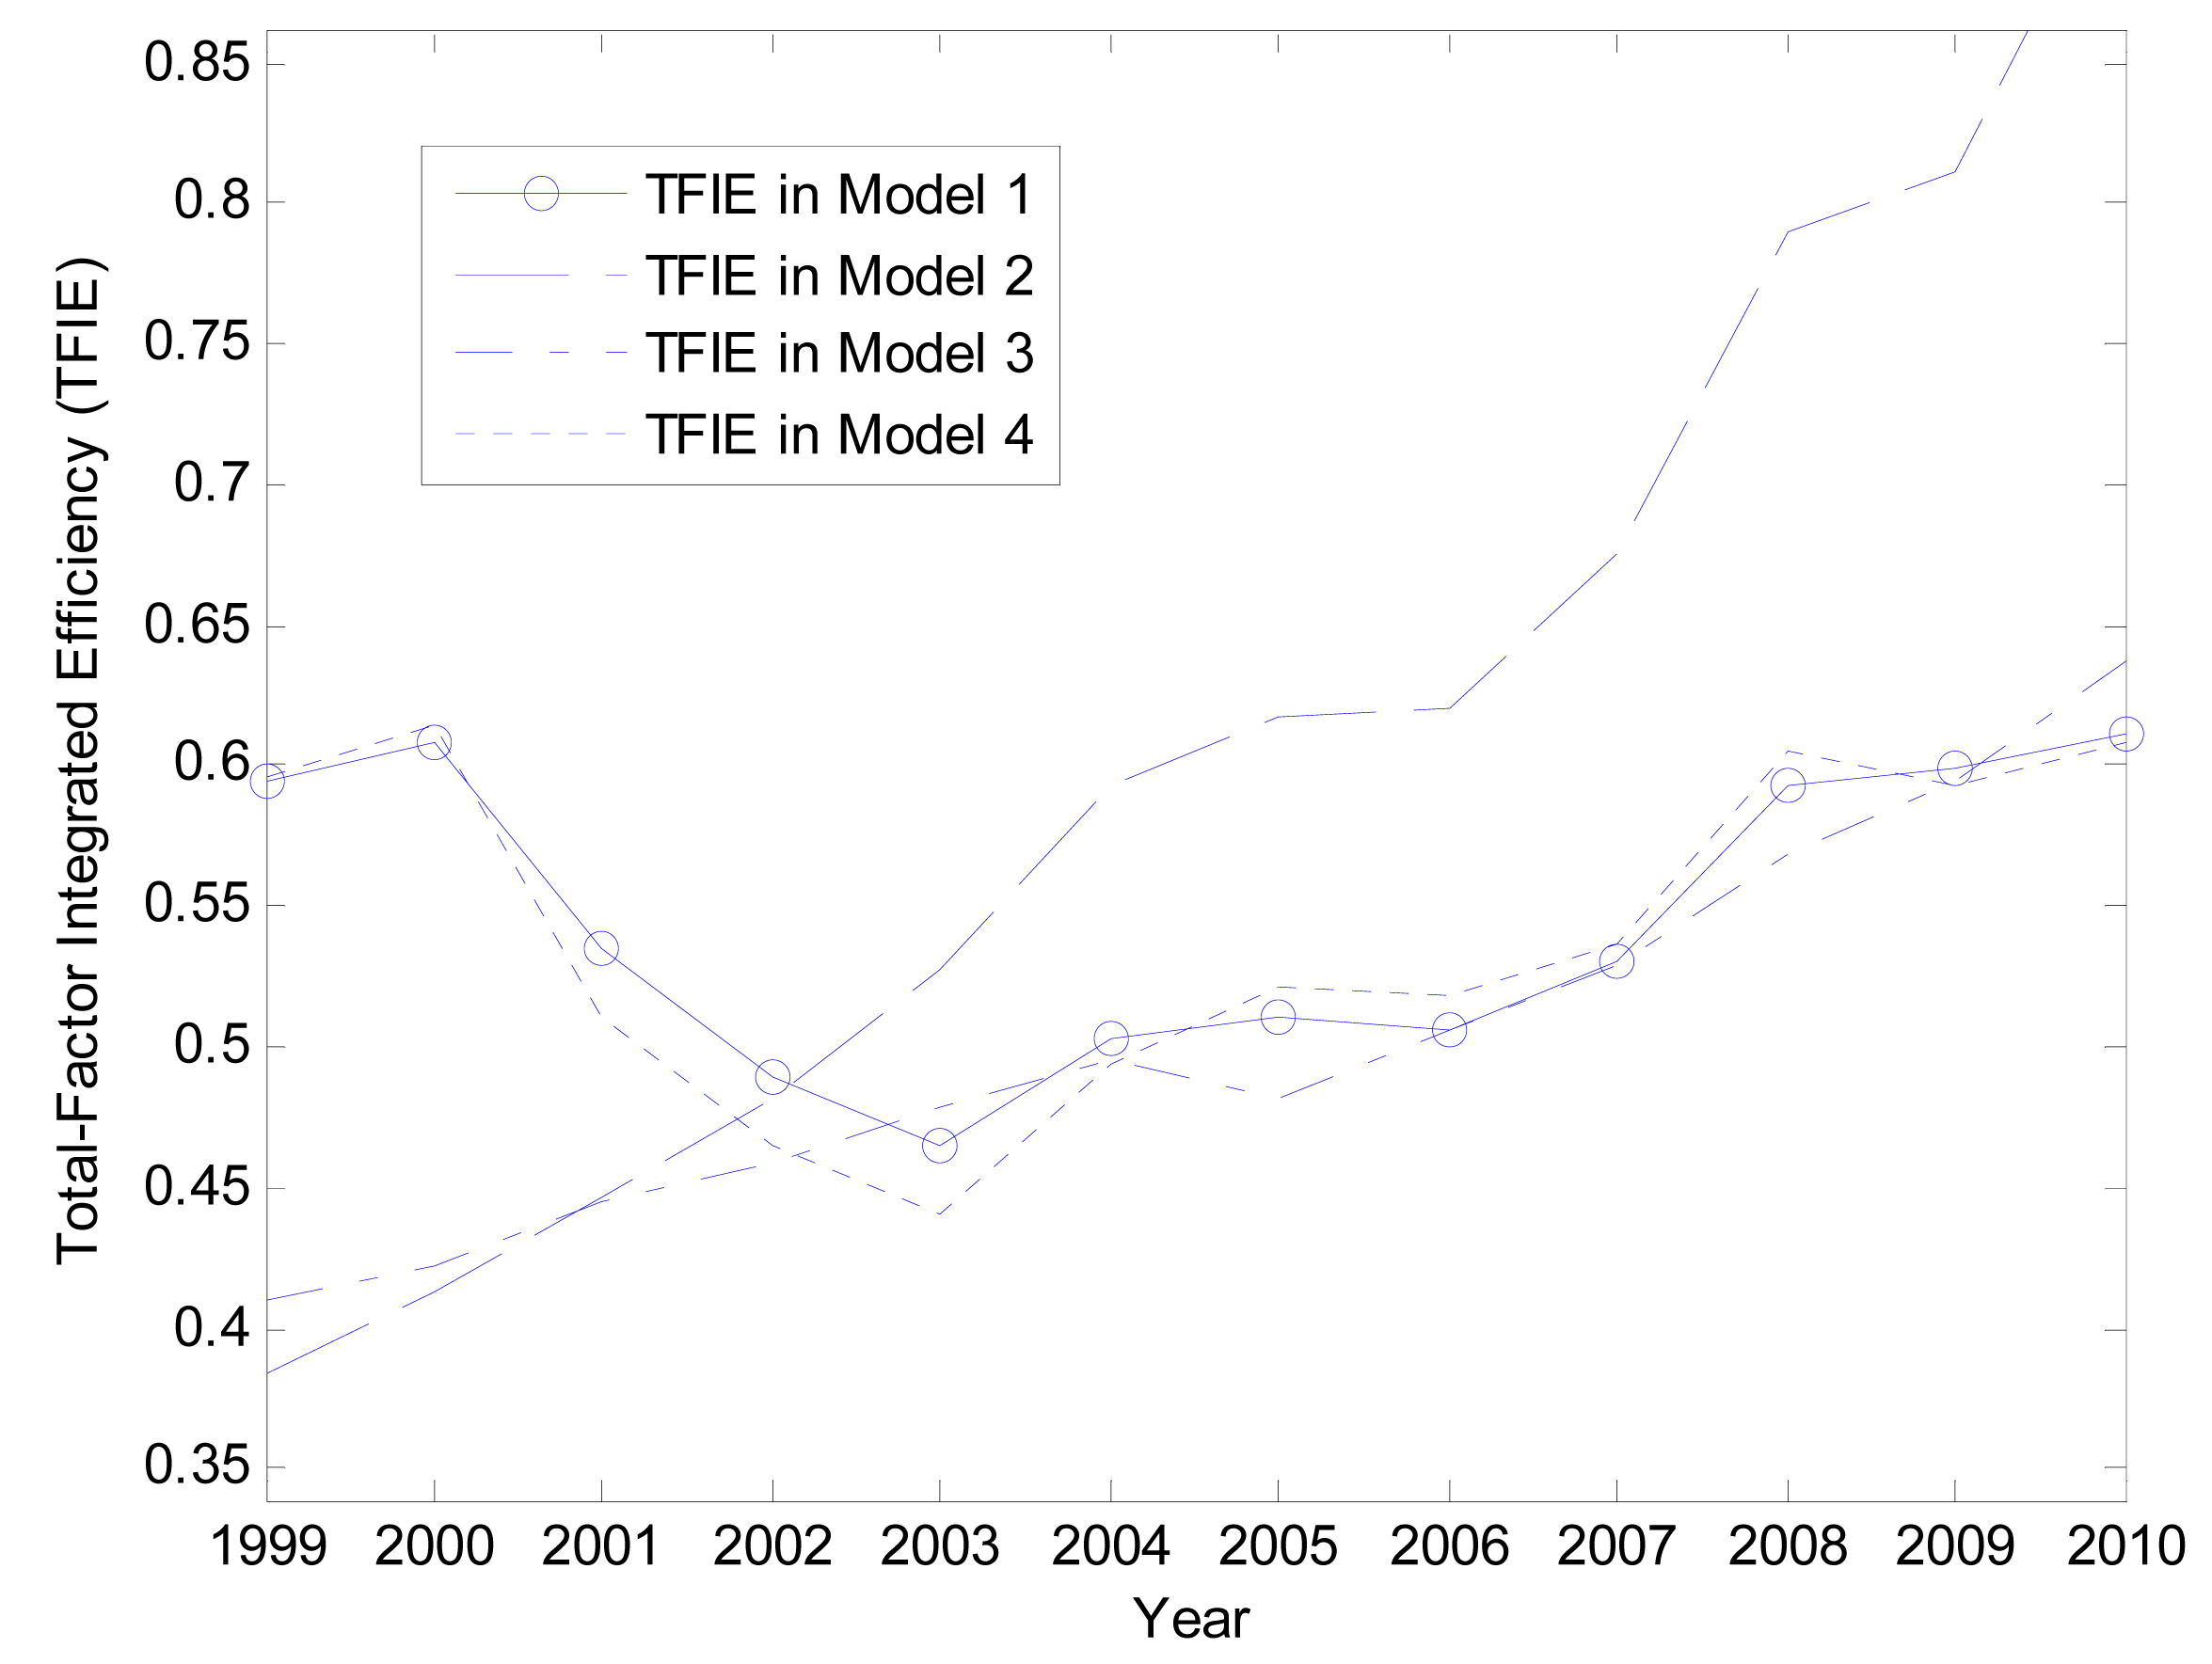
Figure 5 plots the weighted averaging TFIE for China during the sample period, estimated by four models. The weights are provincial GDP share. Considering the TFIE estimated by the target Model 1 firstly, after the land and energy factors are taken into account, the estimated TFIE displays the different pattern from that the land and energy are not considered in Model 2. Specifically, the averaged TFIE in China is 0.59 and 0.61 in 1999 and 2000, the first peak in the sample period; then the TFIE is decreasing in the following three years, reaching the lowest value of 0.46 in 2003; accompanied by the starting of both the land urbanization and heavy industrialization, the TFIE grows a little (0.50) in 2004 firstly, and then remains stagnant and even declines in the following three years (0.51, 0.50, 0.53 in 2005, 2006 and 2007, respectively); the TFIE achieves the highest growth in 2008 (0.59) and then still grows very slowly in the following two years of 2009 and 2010 due to the economic crisis that happened in 2008.
Overall, if both the land and energy factors are taken into consideration, the estimated TFIE level is just moderate and in fact not improved during the sample period. If the influence of land and energy factors on local TFIE cannot be seen clearly from Model 1, we can compare the estimated TFIE between Model 1 and Model 2. If we neglect the land and energy factors, like a lot of studies do, Model 2 tells us that the TFIE is experiencing a continuously and rapid increasing process from 1999 to 2010, completely unaffected by the disordered land urbanization and the reappearance of heavy industrialization, and reached a very high level after 2008, and also that it seems have nothing to do with the serious financial crisis. The overly optimistic phenomenon is untrue because Model 2 just provides us the traditional measurement that cannot reflect the negative externalities of land finance and energy-induced emissions. The real situation is revealed by the measure in Model 1, which handles the land finance and CO2 emissions as undesirable outputs in order to capture their negative externalities. Precisely speaking, the measure by Model 1 can reflect the high level of TFIE before 2002 and capture the low growth of efficiency level resulted from the serious land urbanization and reappearance of heavy industrialization after 2003; while Model 2 using a traditional DEA approach is not able to do so.
To check the measurement difference especially after the year of 2003, we ran two non-parametric tests (the Kolmogorov-Smirnov Z test and Wilcoxon rank sum test) plus a paired-sample t statistics to test whether the TFIE series estimated in Model 1 and Model 2 are statistically no different (Table 1). Based on the results shown in the second row of Table 1, we can reject the null hypothesis that the TFIE indices in both models are the same at least at the 0.01 significance level under all three tests. Figure 5 also depicts the TFIE series estimated by the benchmark Model 3 and Model 4. In addition to capital and labor inputs and desirable output of regional gross output, Model 3 includes energy input and the undesirable output of energy-induced emission more into the analysis, and Model 4 includes land input and bad output of land revenue of compensable use more into the SBM approach. In other words, three models of Model 1, Model 3 and Model 4 make using of the same SBM approach, but Model 1 considers the influence of both land and energy factors on TFIE performance, Model 3 considers only the energy factor without land elements, while Model 4 considers just land factors without energy elements. Figure 5 obviously tells us that TFIE series estimated by Model 1 and Model 4 have the similar U-shape and a close changing pattern, but the two efficiency series determined by Model 1 and Model 3 differ from each other. It concludes that, between land and energy factors, the land factor plays a greater role than energy in changing the TFIE performance of local governments in China in the first decade of this century. That confirms the importance of large-scale land use and land-related fiscal revenue in studying the local efficiency performance in China after the new millennium.
Table 2 reports the averaged TFIE, TFEE and TFLE at different stages, estimated by the target Model 1 in the study. Considering TFIE firstly, during the sample period, the provinces that perform better in TFIE scores include Zhejiang, Tibet, Fujian, Shanghai, Guangdong, which have efficiency values higher than 0.90; the provinces that have the TFIE values below 0.25 are Guizhou (0.18), Xinjiang (0.22), Inner Mongolia (0.23), Ningxia (0.23), Shanxi (0.24), Sichuan (0.24) and Yunnan (0.25). Beijing and Tianjin do not behave well in the efficiency performance, with scores of only 0.67 and 0.60, respectively. From the time horizontal, several provinces are experiencing an increasing level of efficiency in the sample period, like Beijing, Tianjin, Liaoning and Jiangxi; Tibet decreased its efficiency over time; some provinces such as Shanghai, Fujian and Ningxia decrease their TFIE for two periods of 2002–2004 and 2005–2007 and then rose again in 2008–2010; and most of provinces reduced their efficiency in 2002–2004 and increased it in the 2005–2007 sub-period, some even obtaining a higher efficiency in 2008–2010 than the first sub-period of 1999–2001 like Hebei, Jilin, Jiangsu, Anhui, Hunan, Guangxi, Chongqing, Sichuan, Guizhou and Shaanxi. From the perspective of China as a whole (see the last row of Table 2), China's TFIE is 0.57 in 1999–2001, falls to 0.48 in 2002–2004, rises again to 0.51 in 2005–2007, and reaches 0.60 in 2008–2010, leading to an averaged efficiency of 0.54 over the entire sample period. Considering the last two columns of Table 2, the averaged TFEE of China is 0.71 over the sample period, higher than the TFIE value; the averaged TFLE is less than integrated efficiency, being 0.51 over the entire period. This means that the TFLE has a more room to improve its level than energy efficiency, which deserves our emphasis. Though with different levels, such provinces have a similar ranking in the averaged series of TFIE, TFEE and TFLE, respectively. For example, in the top 10 provinces of the three series, 9 provinces are the same. They are Zhejiang, Tibet, Fujian, Shanghai, Guangdong, Jiangsu, Beijing, Tianjin and Shandong. In the last 10 provinces, 6 provinces are the same. They are Guizhou, Xinjiang, Inner Mongolia, Ningxia, Gansu and Jilin. 11 provinces even have a very low of TFLE below 0.20, in which Ningxia has the lowest value of 0.10.
4.2. Analyzing the TFLE/TFEE in China
By using the SBM approach, we could estimate not only the TFIE but also the TFE of each input. Below we will focus on the discussion of TFEE and TFLE. As reported in Table 2, on average, the level of TFEE is much higher than that of integrated efficiency but the TFLE value is a little lower than the integrated efficiency, indicating that the allocation efficiency of land resources is particularly low in China currently. Figures 6 and 7 plot the weighted averaging TFEE and TFLE estimated by the target Model 1 and benchmark Model 3 and Model 4, in which the weights are still the provincial GDP share.
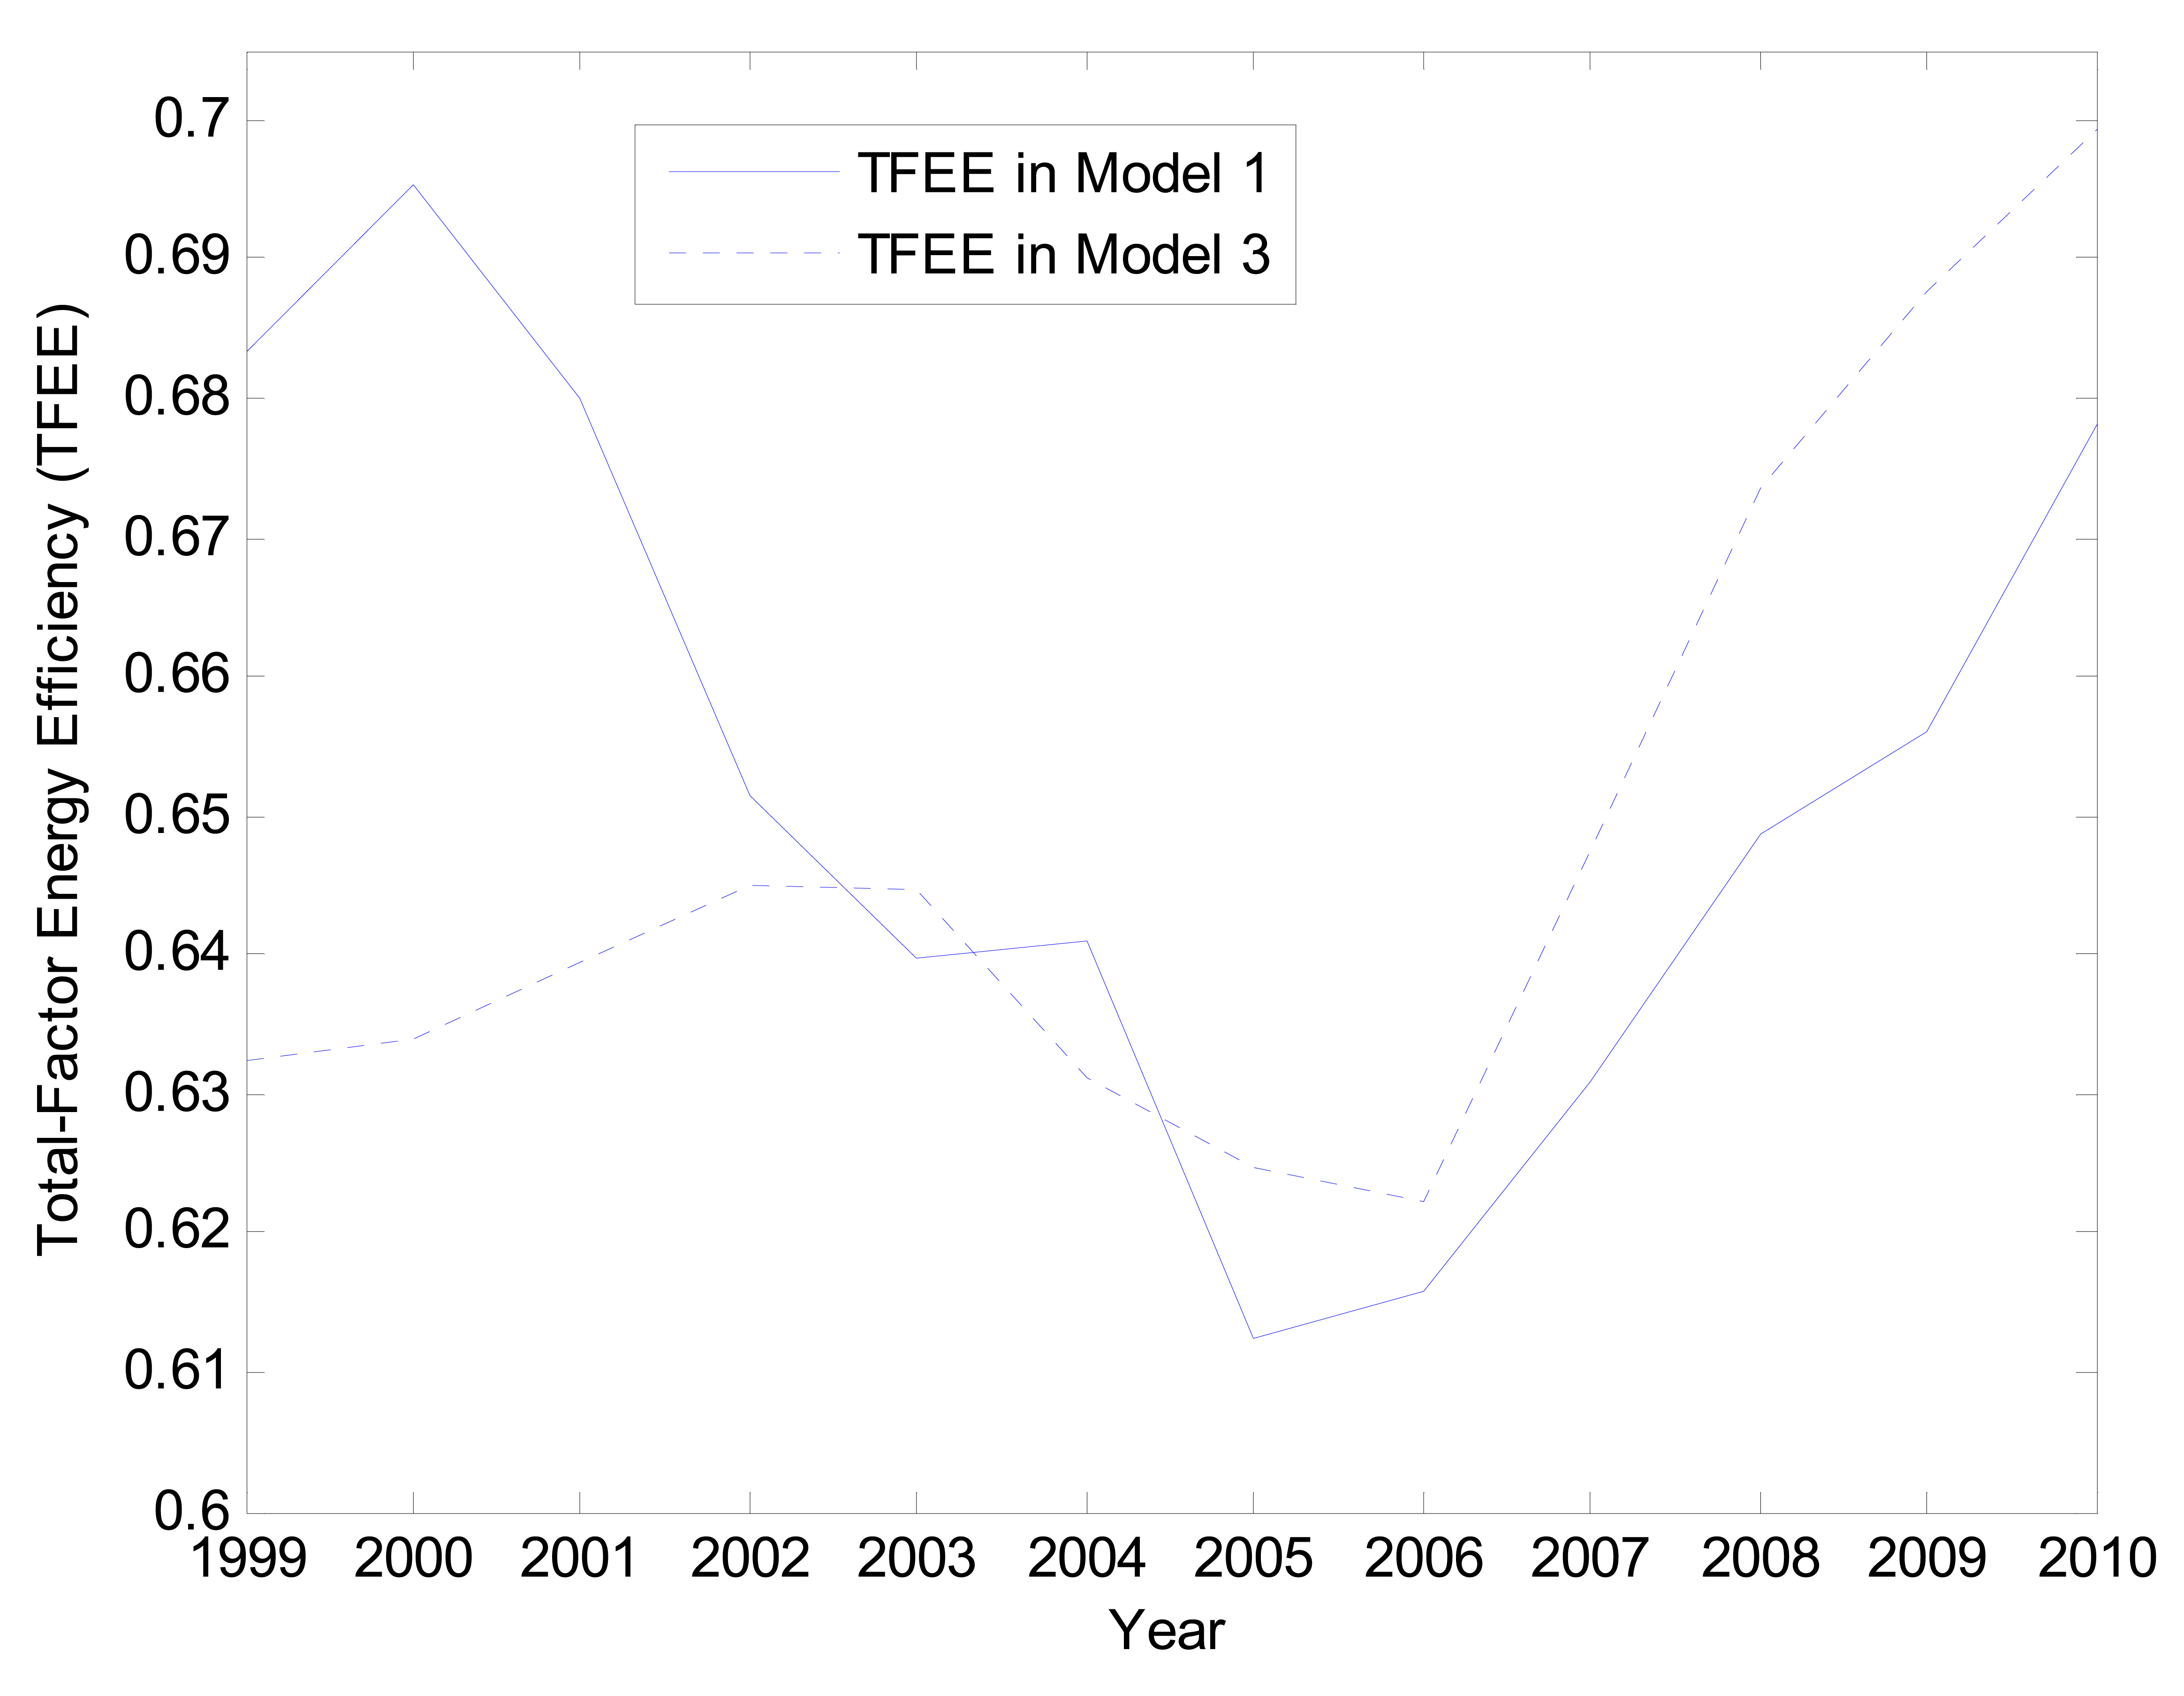
It can be seen from Figure 6 that China's average TFEE estimated by Model 1 displays an almost U shape during the entire sample period. It is 0.68 and 0.69 in the former two years, and declines continuously in the following five years, reaching the lowest value of 0.61 in 2005, and then rises again from 2006 to 2010, achieving a high value of 0.678 in 2010. The decline of TFEE level could be attributable to the reappearance of heavy industrialization during the 10th Five-Year Plan (2001–2005) and the improvement of TFEE level is due to the adjustment of energy policy in the 11th National Five-Year Plan (2006–2010). Because of low energy efficiency and overuse of energy, in 2006, the Central Government puts forth the quantitative goal to save energy and abate emissions, that is, decrease 20% energy consumption per GDP and total 10% pollution emission from 2006 to 2010. The concrete measures include both financial support and trade policy. The energy industry has no capability to accumulate financial resources to develop by itself because it is a high capital intensive sector but with low value of output due to low energy prices. According to the theory of public finance, this is the government's responsibility because the enterprises aiming at profit maximization are not willing to invest in it. Thus, the treasury bonds and financial investment of the Central Government on energy and environmental projects reached 23.5 billion RMB in 2007 and 50 billion RMB in 2008. The foreign trade policy was also adjusted from 2006, by canceling tax rebates, increasing tariffs, cutting down quotas and listing some export products with high energy consumption and pollution emissions and serious resource waste as forbidden items.
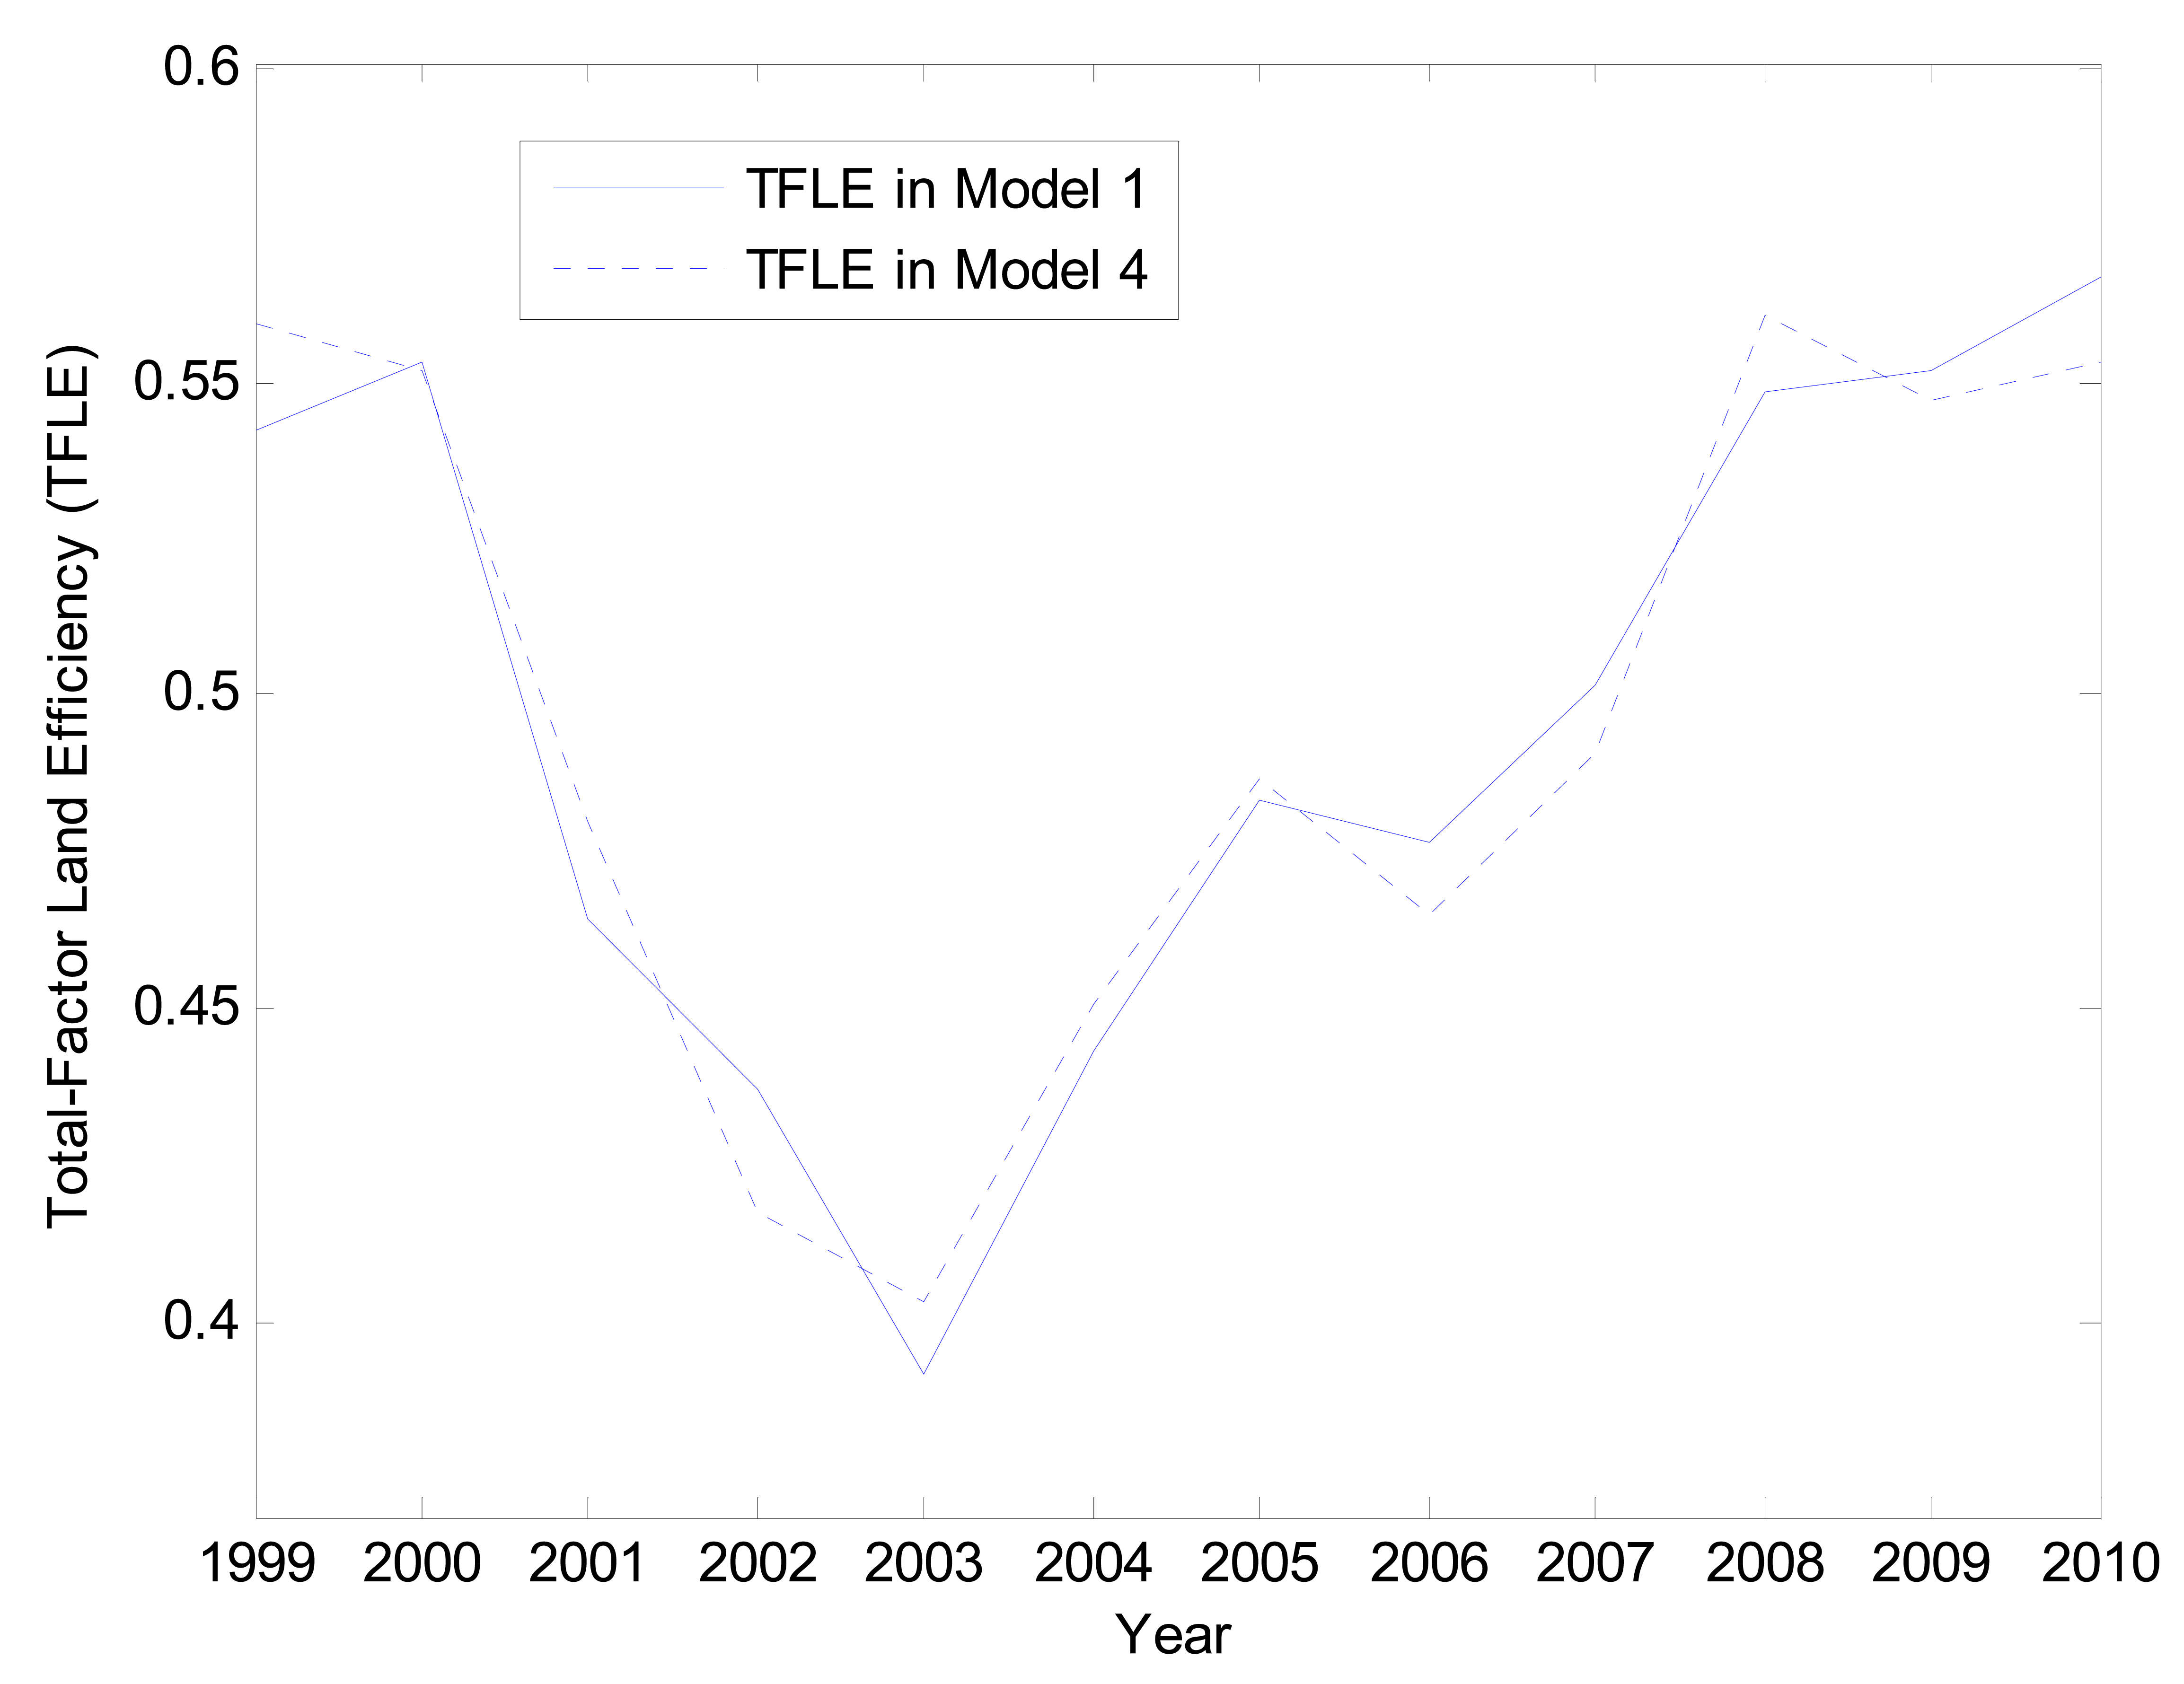
Figure 7 reveals that the TFLE estimated by Model 1 is very low during the process of land urbanization and heavy industrialization, though it declined firstly before 2003 and then rose again till 2010, too. In 2003, TFLE falls to the lowest value of 0.39; in 2010, it reached 0.56, even higher than the first peak of 0.55 in 2000. Land use and energy consumption are closely related. The adjustment of energy and environmental policy during the 11th Five-Year Plan includes restricting the development of energy-intensive projects from different channels such as land, credit and foreign investments, which also benefits the efficiency improvement of land allocation since 2006. Seeing Figure 6 again, the TFEE level estimated by Model 3 is also plotted. The difference between Model 1 and Model 3 is to consider the land factor in Model 1 and ignore the land factor in Model 3, in addition to the factors of capital, labor and energy. Seen from the figure, the two series are deviated very much, indicating that with and without the land factor greatly influences the estimated results of TFEE. Therefore, we conclude that the land factor has a significant influence on TFEE in China. It is confirmed by the hypothesis test reported in the last second row of Table 1. Whether the TFEE series estimated in Model 1 and Model 3 are statistically no different is tested also by two non-parametric tests (the Kolmogorov-Smirnov Z test and Wilcoxon rank sum test) and a paired-sample t statistic. Two nonparametric tests reject the null hypothesis that the TFEE indices in both models are the same at the 0.05 significance level, although the parametric t test does not. Figure 7 also depicts the TFLE series estimated by the target Model 1 and the benchmark Model 4. The only difference between Model 1 and Model 4 is to consider the energy factor or not. Seen from Figure 7, the two series estimated by two models are very close and have the similar changing pattern. In the last row of Table 1, both two non-parametric tests and a paired-sample t test do not reject the null hypothesis that the TFLE in two models are the same even at the 0.10 significance level. Thus, we can conclude that the energy factor does not have a significant influence on land efficiency in China.
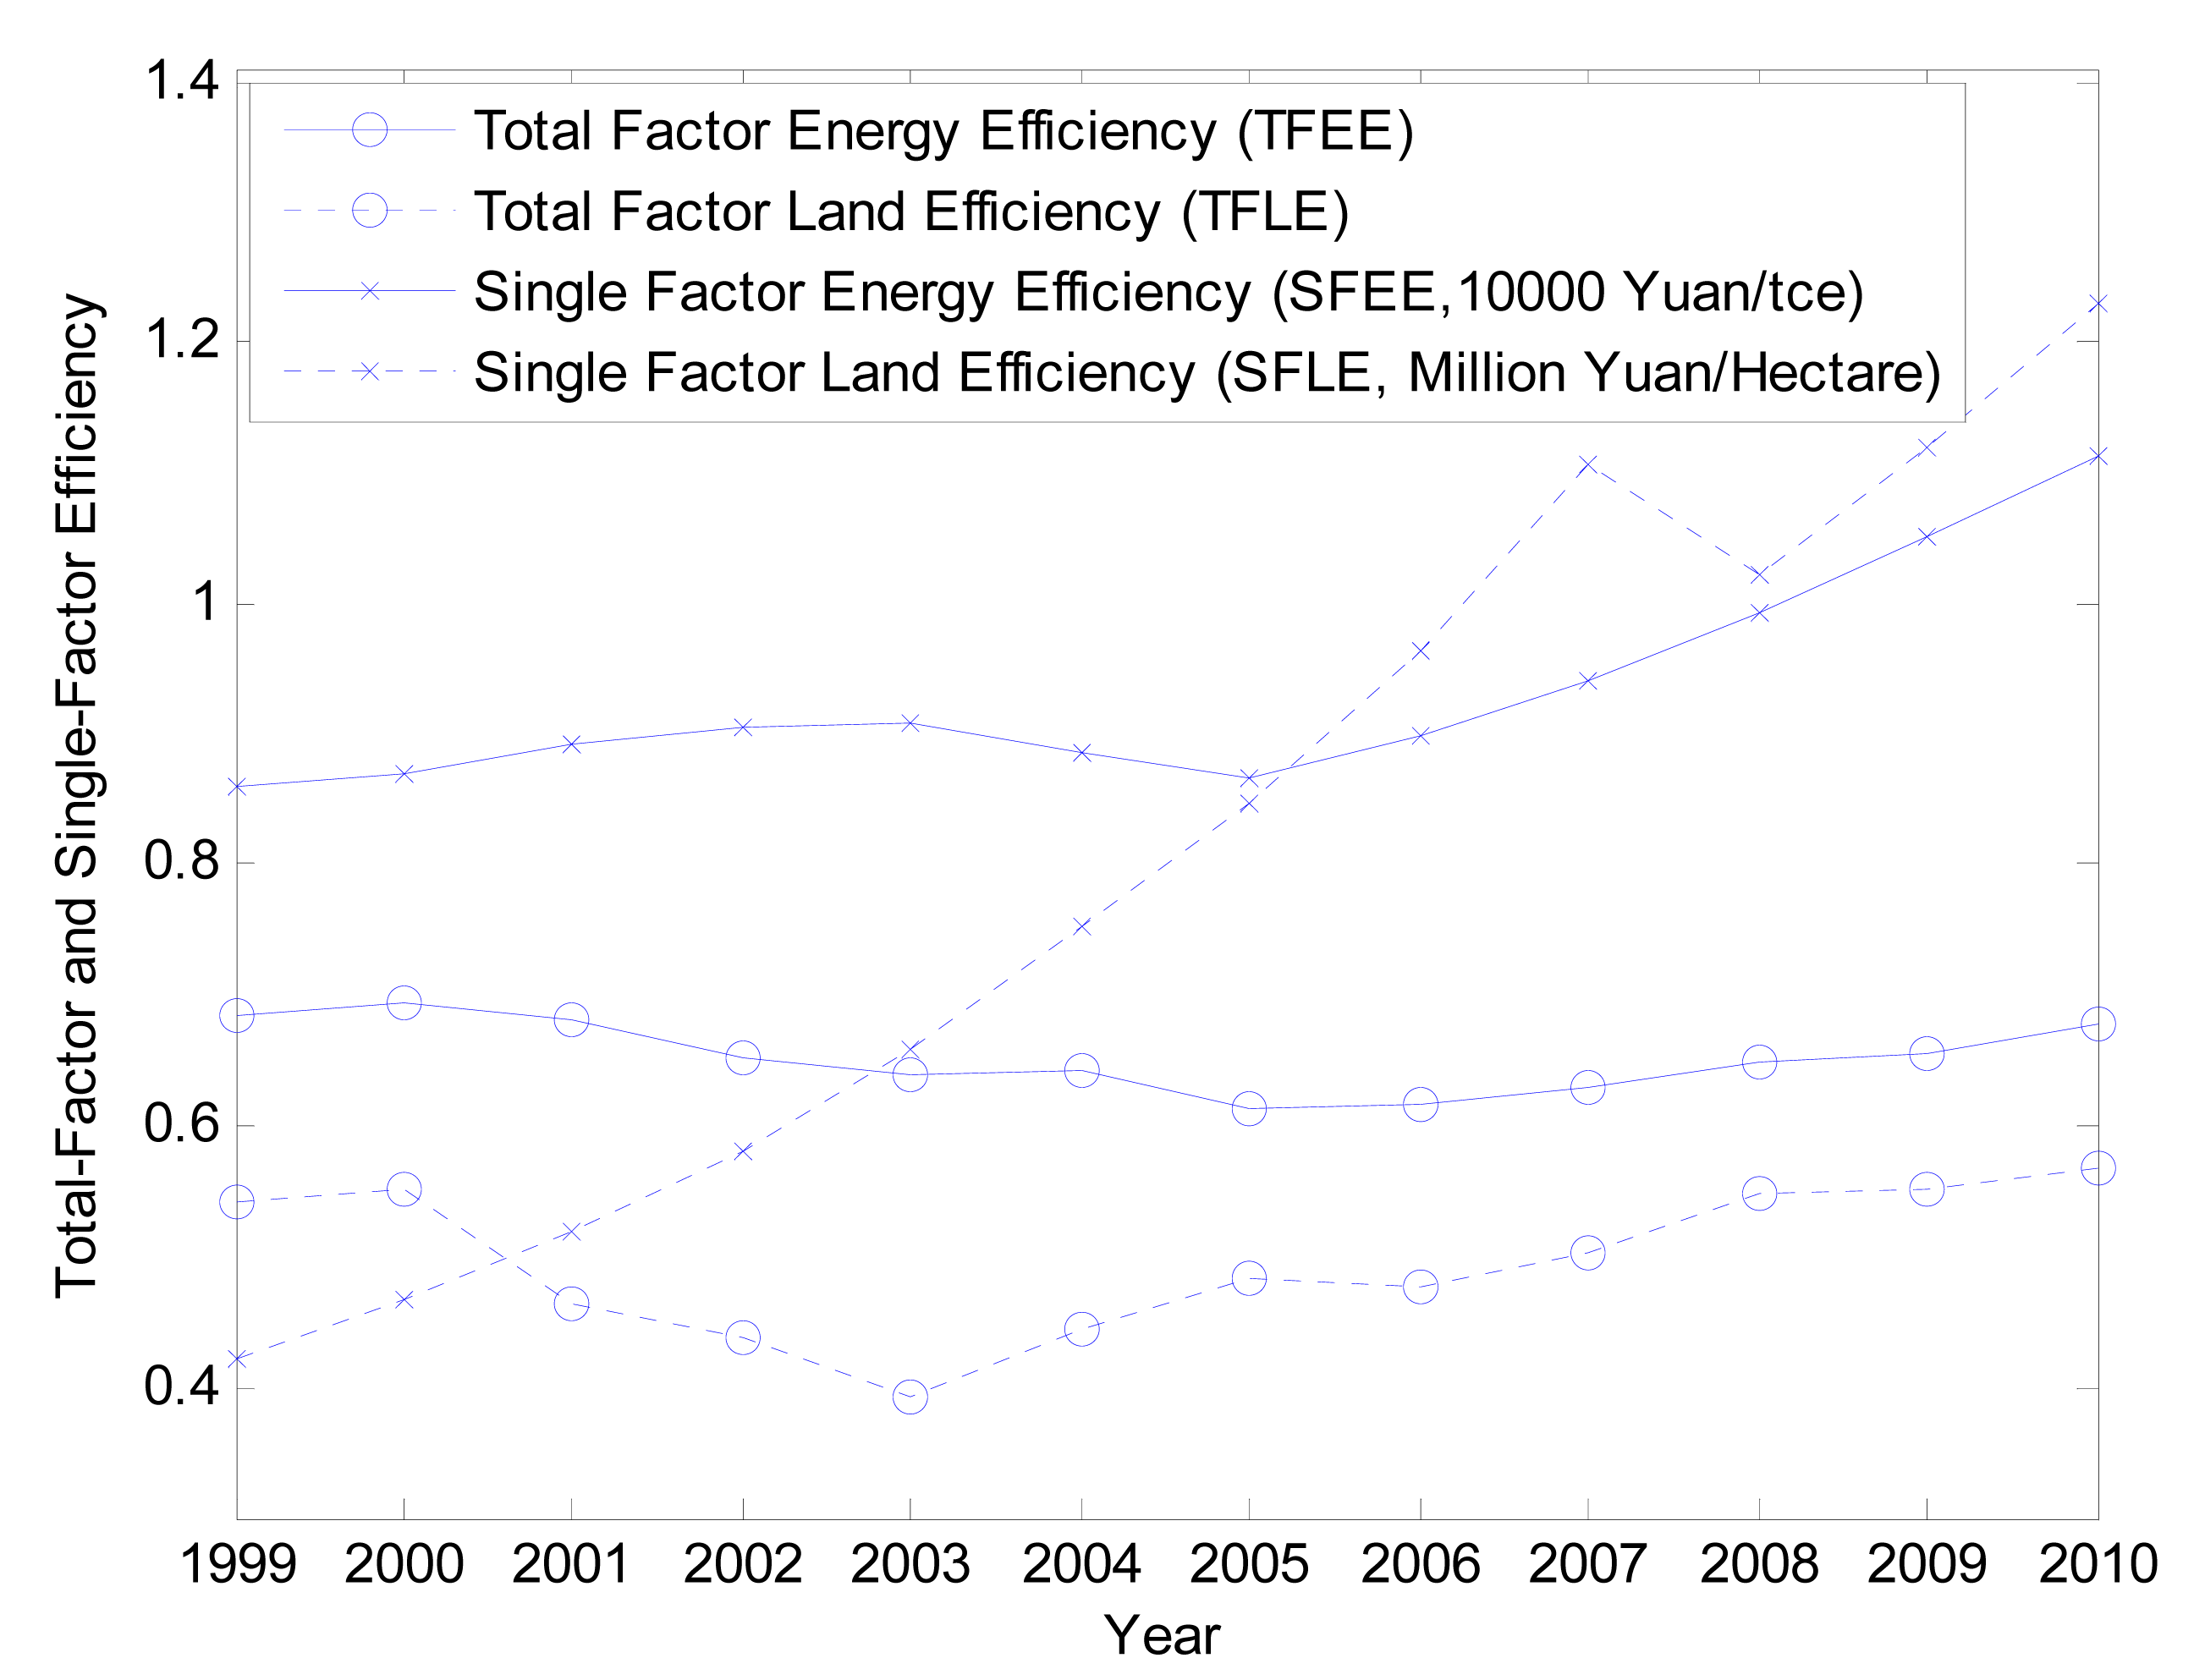
Before the concept of total factor productivity or efficiency was introduced by Solow [30], the single factor productivity was normally used to measure the efficiency of each factor, like labor productivity. In addition to total-factor energy/land efficiency, Figure 8 also describes the weighted averaging single-factor energy efficiency (SFEE) and single-factor land efficiency (SFLE) between 1999 and 2010.
As for the energy efficiency, the SFEE remains stable first and increases more rapidly than the TFEE since 2005. In 2010, SFEE attains a very high value of 11,129 RMB/tce. Comparing to SFEE, TFEE firstly experiences a declining trend and then displays a weak growth since 2005. Similar to energy efficiency, SFLE increases sharply and continuously from 1999 and achieves its first peak in 2007, being 1.1 million RMB per hectare, falls in 2008 and continues to rise in 2009 and 2010, reaching a very high 1.23 million RMB per hectare. You cannot see the negative influence of any other factors on the value of SFLE. Different from this, TFLE is able to reflect the influence of some factors like disordered land urbanization, serious heavy industrialization, and even over-investment and factor reallocation. Therefore, the TFLE displays a weak U shape, deteriorating first and then ameliorating but very little. It tells us that the single factor energy/land efficiency is not able to identify the negative externalities of overuse of energy and land, which provides us the misleading measure of factor efficiency. Only total-factor energy/land efficiency comprehensively reflects the reallocation efficiency of all the factors and is able to capture the negative influence of over use of resources like land, energy and capital, etc.
5. Conclusions
After the new millennium, heavy industrialization re-appeared and rapid land urbanization happened in China, leading to never seen before large-scale use of energy and land resources. Extensive studies have investigated the influence of energy and environment factors on the quality of economic growth in China. However, in the literatures, very few researchers have paid close attention to the impact of another important resource, land, on the productivity or efficiency performance in Chinese economy. To compensate for this literatures' gap, this paper aims to analyze the impact of land use, together with energy consumption, on the local TFE since 1999. The non-radial, non-angle SBM approach is chosen to estimate the actual TFE for 31 provinces in China between 1999 and 2010, in which the land finance is treated as an undesirable output, like energy-induced emissions, in order to reflect their negative externalities.
The main conclusions of this study include: (1) the factors of land and energy play a significantly negative role in changing the TFIE in China, leading the actual TFIE level in China to be only moderate on average (0.55) and not substantially improved during the sample period. Further, the TFIE in China is dominated by land factors rather than energy, confirming the relevance of large-scale land use in the efficiency studies; (2) the averaged TFEE of China is 0.71 and the TFLE is only 0.51 over the entire period, indicating that land efficiency has more room to improve its level than energy efficiency; as for the mutual impact, the land factor has a statistically significant influence on TFEE in China, but not vice versa, confirming again the importance of land issues; and (3) as compared to single-factor energy/land efficiency, the total-factor energy/land efficiency provides us a more precise measure of factor efficiency in China which is able to comprehensively reflect the reallocation efficiency of all the factors and capture the negative influence of over use of resources like land, energy and capital, etc., after the new millennium.
In this study, we assume the distance function of SBM model is the same for all the provinces and do not consider the regional heterogeneities in China like Zhang et al. [31]. The meta-frontier approach incorporating group heterogeneities may overcome this problem. Also, in the future study we can extend the static TFE into dynamic measures by using SBM-Malmquist-Luenberger index [11].
Acknowledgments
Shiyi Chen is grateful for the support from National Natural Science Foundation (71173048), National Social Science Foundation (12AZD047), Ministry of Education (11JJD790007), Shanghai Leading Talent Project, Fudan Zhuo-Shi Talent Plan and Fudan Tyndall Centre 985 Project (FTC98503B06).
Conflicts of Interest
The authors declare no conflict of interest.
References
- Hu, J.; Wang, S. Total-factor energy efficiency of regions in China. Energy Policy 2006, 34, 3206–3217. [Google Scholar]
- Zheng, J.; Bigsten, A.; Hu, A. Can China's growth be sustained? A productivity perspective. World Dev. 2009, 37, 874–888. [Google Scholar]
- Chang, T.; Hu, J. Total-factor energy productivity growth, technical progress, and efficiency change: An empirical study of China. Appl. Energy 2010, 87, 3262–3270. [Google Scholar]
- Wang, B.; Wu, Y.; Yan, P. Environmental efficiency and environmental total factor productivity growth in China's regional economies. Econ. Res. J. 2010, 5, 95–109. [Google Scholar]
- Wu, Y. Total factor productivity growth in China: A review. J. Chin. Econ. Bus. Stud. 2011, 9, 111–126. [Google Scholar]
- Wu, F.; Fan, L.W.; Zhou, P.; Zhou, D.Q. Industrial energy efficiency with CO2 emissions in China: A nonparametric analysis. Energy Policy 2012, 49, 164–172. [Google Scholar]
- Wang, Z.; Zeng, H.; Wei, Y.; Zhang, Y. Regional total factor energy efficiency: An empirical analysis of industrial sector in China. Appl. Energy 2012, 97, 115–123. [Google Scholar]
- Chen, S. Energy, Environment and Economic Transformation in China; Routledge: New York, NY, USA, 2013. [Google Scholar]
- Chen, S.; Santos-Paulino, A.U. Energy consumption and carbon emission based industrial productivity in China: A sustainable development analysis. Rev. Dev. Econ. 2013, 17, 644–661. [Google Scholar]
- Lin, B.; Du, K. Technology gap and China's regional energy efficiency: A parametric metafrontier approach. Energy Econ. 2013, 40, 529–536. [Google Scholar]
- Zhang, N.; Choi, Y. Total-factor carbon emission performance of fossil fuel power plants in China: A metafrontier non-radial Malmquist index analysis. Energy Econ. 2013, 40, 549–559. [Google Scholar]
- Tao, R.; Yuan, F.; Cao, G. Regional competition, land transfer and local fiscal effect. World Econ. 2007, 10, 15–27. [Google Scholar]
- Bulletin of China Land and Resources 2010; Ministry of Land and Resources of the People's Republic of China: Beijing, China, 2010. Available online: http://www.mlr.gov.cn/ (accessed on 30 January 2014).
- Kopits, G.; Craig, J. Transparency in Government Operations; Occasional Paper 158; International Monetary Fund (IMF): Washington, DC, USA, 1998. [Google Scholar]
- Alt, J.E.; Lassen, D. Transparency, political polarization, and political budget cycles in OECD countries. Am. J. Polit. Sci. 2006, 50, 530–550. [Google Scholar]
- Alt, J.E.; Lassen, D.; Skilling, D. Fiscal transparency, gubernatorial approval, and the scale of government: evidence from the states. State Polit. Policy Q. 2002, 2, 230–250. [Google Scholar]
- Liang, Y.; Gao, T. An empirical study of influential factors of housing price fluctuations in China. Manag. World 2006, 8, 76–82. [Google Scholar]
- Jiang, Q. An empirical study on vertical fiscal imbalance between central and local government: 1978–2003. Financ. Trade Res. 2006, 2, 78–84. [Google Scholar]
- Liang, R. Promotion incentives, department interests and violation of land-related laws. China Econ. Q. 2009, 9, 283–306. [Google Scholar]
- Li, B. Some thoughts on the phenomenon of land finance in China. Public Financ. Res. 2010, 7, 12–14. [Google Scholar]
- Tone, K. A slacks-based measure of efficiency in data envelopment analysis. Eur. J. Oper. Res. 2001, 130, 498–509. [Google Scholar]
- Zhou, P.; Ang, B.W.; Poh, K.L. Slacks-based efficiency measures for modeling environmental performance. Ecol. Econ. 2006, 60, 111–118. [Google Scholar]
- Färe, R.; Grosskopf, S. Directional distance functions and slacks-based measures of efficiency. Eur. J. Oper. Res. 2010, 200, 320–322. [Google Scholar]
- Zhang, N.; Choi, Y. Environmental energy efficiency of China's regional economies: A non-oriented slacks-based measure analysis. Soc. Sci. J. 2013, 50, 225–234. [Google Scholar]
- National Bureau of Statistics of China. In China Statistical Yearbook; China Statistics Press: Beijing, China; pp. 1999–2011.
- National Bureau of Statistics of China. In China Energy Statistical Yearbook; China Statistics Press: Beijing, China; pp. 1999–2011.
- Ministry of Land and Resources of China. In China Land & Resources Almanac; Geological Publishing House: Beijing, China; pp. 1999–2011.
- State Administration of Taxation. In China Taxation Yearbook; China Tax Publishing House: Beijing, China; pp. 1999–2011.
- National Bureau of Statistics. In China Compendium of Statistics 1949–2009; China Statistics Press: Beijing, China, 2010.
- Solow, R.M. Technical change and the aggregate production function. Rev. Econ. Stat. 1957, 39, 312–320. [Google Scholar]
- Zhang, N.; Zhou, P.; Choi, Y. Energy efficiency, CO2 emission performance and technology gaps in fossil fuel electricity generation in Korea: A meta-frontier non-radial directional distance function analysis. Energy Policy 2013, 56, 653–662. [Google Scholar]


| Null hypothesis | Kolmogorov-Smirnov Z test | Wilcoxon rank sum test | ||
|---|---|---|---|---|
| Statistics | Result | Statistics | Result | |
| TFIE in Model 1 = TFIE in Model 2 | 0.750 (0.010) | Reject | 42.000 (0.005) | Reject |
| TFEE in Model 1 = TFEE in Model 3 | 0.625 (0.050) | Reject | 46.000 (0.021) | Reject |
| TFLE in Model 1 = TFLE in Model 4 | 0.375 (0.519) | Not reject | 77.000 (0.382) | Not reject |
Note: Values in parentheses are p-values.
| Provinces | TFIE | 1999–2010 | |||||
|---|---|---|---|---|---|---|---|
| 1999–2001 | 2002–2004 | 2005–2007 | 2008–2010 | 1999–2010 | TFEE | TFLE | |
| Beijing | 0.4566 | 0.5013 | 0.8194 | 0.9126 | 0.6725 | 0.8554 | 0.7784 |
| Tianjin | 0.4902 | 0.4979 | 0.6016 | 0.8246 | 0.6036 | 0.7403 | 0.7122 |
| Hebei | 0.2623 | 0.2444 | 0.3278 | 0.3751 | 0.3024 | 0.3567 | 0.1945 |
| Shanxi | 0.2969 | 0.1661 | 0.2344 | 0.2512 | 0.2372 | 0.2553 | 0.2312 |
| Inner Mongolia | 0.2856 | 0.1798 | 0.2101 | 0.2555 | 0.2327 | 0.2329 | 0.1028 |
| Liaoning | 0.2513 | 0.2732 | 0.3341 | 0.3735 | 0.3080 | 0.3921 | 0.3319 |
| Jilin | 0.2475 | 0.2292 | 0.2690 | 0.3090 | 0.2637 | 0.3821 | 0.1637 |
| Heilongjiang | 0.3882 | 0.2135 | 0.2621 | 0.3292 | 0.2982 | 0.4584 | 0.2323 |
| Shanghai | 0.9390 | 0.9172 | 0.9068 | 0.9656 | 0.9322 | 0.9678 | 0.9658 |
| Jiangsu | 0.7581 | 0.5554 | 0.6086 | 0.9884 | 0.7276 | 0.8866 | 0.5954 |
| Zhejiang | 1 | 1 | 1 | 0.9863 | 0.9966 | 1 | 1 |
| Anhui | 0.2404 | 0.2329 | 0.2789 | 0.3305 | 0.2707 | 0.4824 | 0.1267 |
| Fujian | 1 | 0.9790 | 0.8365 | 0.9970 | 0.9531 | 0.9950 | 0.9930 |
| Jiangxi | 0.2616 | 0.3003 | 0.3404 | 0.3957 | 0.3245 | 0.5722 | 0.2222 |
| Shandong | 1 | 0.3790 | 0.4176 | 0.4781 | 0.5687 | 0.6242 | 0.4979 |
| Henan | 0.4795 | 0.2784 | 0.3336 | 0.3623 | 0.3635 | 0.5054 | 0.2405 |
| Hubei | 0.6591 | 0.2353 | 0.2649 | 0.2990 | 0.3646 | 0.5142 | 0.3360 |
| Hunan | 0.2847 | 0.2460 | 0.2722 | 0.3410 | 0.2860 | 0.4735 | 0.2558 |
| Guangdong | 0.8076 | 0.9669 | 0.8917 | 1 | 0.9166 | 0.9726 | 0.9195 |
| Guangxi | 0.2798 | 0.2765 | 0.2837 | 0.3195 | 0.2899 | 0.5194 | 0.1721 |
| Hainan | 0.5808 | 0.3625 | 0.3714 | 0.3706 | 0.4213 | 0.7393 | 0.2735 |
| Chongqing | 0.3243 | 0.3074 | 0.3126 | 0.3633 | 0.3269 | 0.5948 | 0.2059 |
| Sichuan | 0.2331 | 0.2098 | 0.2339 | 0.2927 | 0.2424 | 0.4194 | 0.1373 |
| Guizhou | 0.1709 | 0.1612 | 0.1760 | 0.2168 | 0.1812 | 0.2071 | 0.1561 |
| Yunnan | 0.2547 | 0.2371 | 0.2418 | 0.2501 | 0.2460 | 0.3591 | 0.2145 |
| Tibet | 1 | 1 | 0.9349 | 0.9201 | 0.9638 | 0.9962 | 0.9965 |
| Shaanxi | 0.2994 | 0.2429 | 0.2557 | 0.3082 | 0.2765 | 0.4771 | 0.1922 |
| Gansu | 0.3898 | 0.2093 | 0.2123 | 0.2369 | 0.2621 | 0.3326 | 0.1604 |
| Qinghai | 0.5679 | 0.3299 | 0.5549 | 0.3076 | 0.4401 | 0.4058 | 0.3109 |
| Ningxia | 0.2724 | 0.2301 | 0.2089 | 0.2264 | 0.2344 | 0.2568 | 0.1002 |
| Xinjiang | 0.2623 | 0.1849 | 0.2022 | 0.2274 | 0.2192 | 0.3204 | 0.1549 |
| China | 0.5795 | 0.4856 | 0.5160 | 0.6013 | 0.5456 | 0.7111 | 0.5153 |
© 2014 by the authors; licensee MDPI, Basel, Switzerland. This article is an open access article distributed under the terms and conditions of the Creative Commons Attribution license ( http://creativecommons.org/licenses/by/3.0/).
Share and Cite
Chen, S.; Zhang, S. Large-Scale Land Use for Construction and Energy Consumption after the New Millennium with Their Impact on Total-Factor Efficiency Change in China’s Regional Economy. Energies 2014, 7, 1986-2003. https://doi.org/10.3390/en7041986
Chen S, Zhang S. Large-Scale Land Use for Construction and Energy Consumption after the New Millennium with Their Impact on Total-Factor Efficiency Change in China’s Regional Economy. Energies. 2014; 7(4):1986-2003. https://doi.org/10.3390/en7041986
Chicago/Turabian StyleChen, Shiyi, and Shujian Zhang. 2014. "Large-Scale Land Use for Construction and Energy Consumption after the New Millennium with Their Impact on Total-Factor Efficiency Change in China’s Regional Economy" Energies 7, no. 4: 1986-2003. https://doi.org/10.3390/en7041986