Development and Field Test of a Real-Time Database in the Korean Smart Distribution Management System

Abstract
: Recently, a distribution management system (DMS) that can conduct periodical system analysis and control by mounting various applications programs has been actively developed. In this paper, we summarize the development and demonstration of a database structure that can perform real-time system analysis and control of the Korean smart distribution management system (KSDMS). The developed database structure consists of a common information model (CIM)-based off-line database (DB), a physical DB (PDB) for DB establishment of the operating server, a real-time DB (RTDB) for real-time server operation and remote terminal unit data interconnection, and an application common model (ACM) DB for running application programs. The ACM DB for real-time system analysis and control of the application programs was developed by using a parallel table structure and a link list model, thereby providing fast input and output as well as high execution speed of application programs. Furthermore, the ACM DB was configured with hierarchical and non-hierarchical data models to reflect the system models that increase the DB size and operation speed through the reduction of the system, of which elements were unnecessary for analysis and control. The proposed database model was implemented and tested at the Gochaing and Jeju offices using a real system. Through data measurement of the remote terminal units, and through the operation and control of the application programs using the measurement, the performance, speed, and integrity of the proposed database model were validated, thereby demonstrating that this model can be applied to real systems.1. Introduction
The difficulty of long-term power supply planning as evidenced by the recent rotating power outages in Korea as well as the regulations on CO2 emission around the World have encouraged the introduction of power systems using alternative energy, including renewable energy. Moreover, smart grids, which have been important in the field of power systems in recent years, have motivated the gathering of new information for the operation of power systems. Therefore, we believe that a distribution system with which small and medium-sized renewable energy systems can be interconnected should provide a stable and reliable power supply as it would alleviate the irregular output variance of renewable energy. The introduction of such a distribution system for renewable energy increases the instability of the system operation, and a number of application programs are therefore required for the accurate understanding and control of the system status.
Thus far, the abovementioned distribution system has been operated by the distribution automation system (DAS), of which the main function is supervised control and data acquisition (SCADA) for distribution. DAS monitors the distribution system and is responsible for failure removal and restoration, and operation management; its main job is the data processing for status monitoring to run the switches in the system [1]. Previously, a DAS database (DB) with an efficient graphic user interface (GUI) was proposed; this GUI showed the result of status monitoring influenced by the wide use of personal computers [2–4]. In addition, a DAS DB structure has been proposed that conducts load reconfiguration using remote switching in addition to basic monitoring functions [5–7]. DB structures for fast tracking have also been proposed to perform quick recovery during an outage occurrence [8,9]; reliability analysis in the distribution system was also conducted [10]. However, recent distribution systems have undergone many changes due to an increase in the number of distribution power systems; these changes include the use of renewable energy, replacement of experienced operators, and increase in the number of functional advancement requests of operation systems, including the addition of new models [11]. Due to such environmental changes in the distribution systems, even existing experienced operators cannot guarantee the stability of system operation using their intuitive judgment. Thus, the distribution management system (DMS), in which many operations that were previously carried out according to an operator's discretion are now dependent on various application programs, has been actively developed to cope with the abovementioned problems [12–14].
Most DMSs require the mounting of application programs for real-time system analysis and control in order to perform intelligent operation of responses and outage processes that are interconnected with renewable energy systems that have characteristics of high variance. However, in Korea, a single DMS is responsible for a number of systems that range from approximately 12 to 150 distribution lines (D/L), which is significantly large [15]. Thus, it is essential to design and implement a database for operational systems with specialized structures on which operations can be conducted and that can input/output necessary data within a short period of time in order to run real-time application programs in such large distribution systems. Most studies on database design and implementation for the DMS have focused on structure design for running application programs [16], standardized database design using a common information model (CIM) extensive mark-up language (XML) [17], and a common model of an energy management system (EMS) and DMS [18]. However, the related application programs, such as topology process and CIM standard-based off-line DB, were simple. The common model of EMS and DMS is not suitable for running real-time application programs since a number of nations (including Korea) use a separate operation for EMS and DMS and the DB size becomes excessively large. Thus, a new standardized DB structure is necessary that can run application programs quickly for real-time system analysis and control.
In this paper, we summarize the development and demonstration of a database for the Korean Smart DMS (KSDMS) that was recently developed in Korea. The developed database structure consists of a CIM-based off-line DB, a physical DB (PDB), and a real-time DB (RTDB) for a real-time server operation and remote terminal unit data interconnection, and an application common model (ACM) DB for running application programs. The proposed database model was implemented and tested at the Gochaing and Jeju offices using a real system. Through data measurement on remote terminal units and the operation and control of the application programs using the measurement, the performance speed and integrity of the proposed database model were validated, thereby demonstrating that this model can be applied to real systems.
2. Databases of Existing Distribution Automation Systems
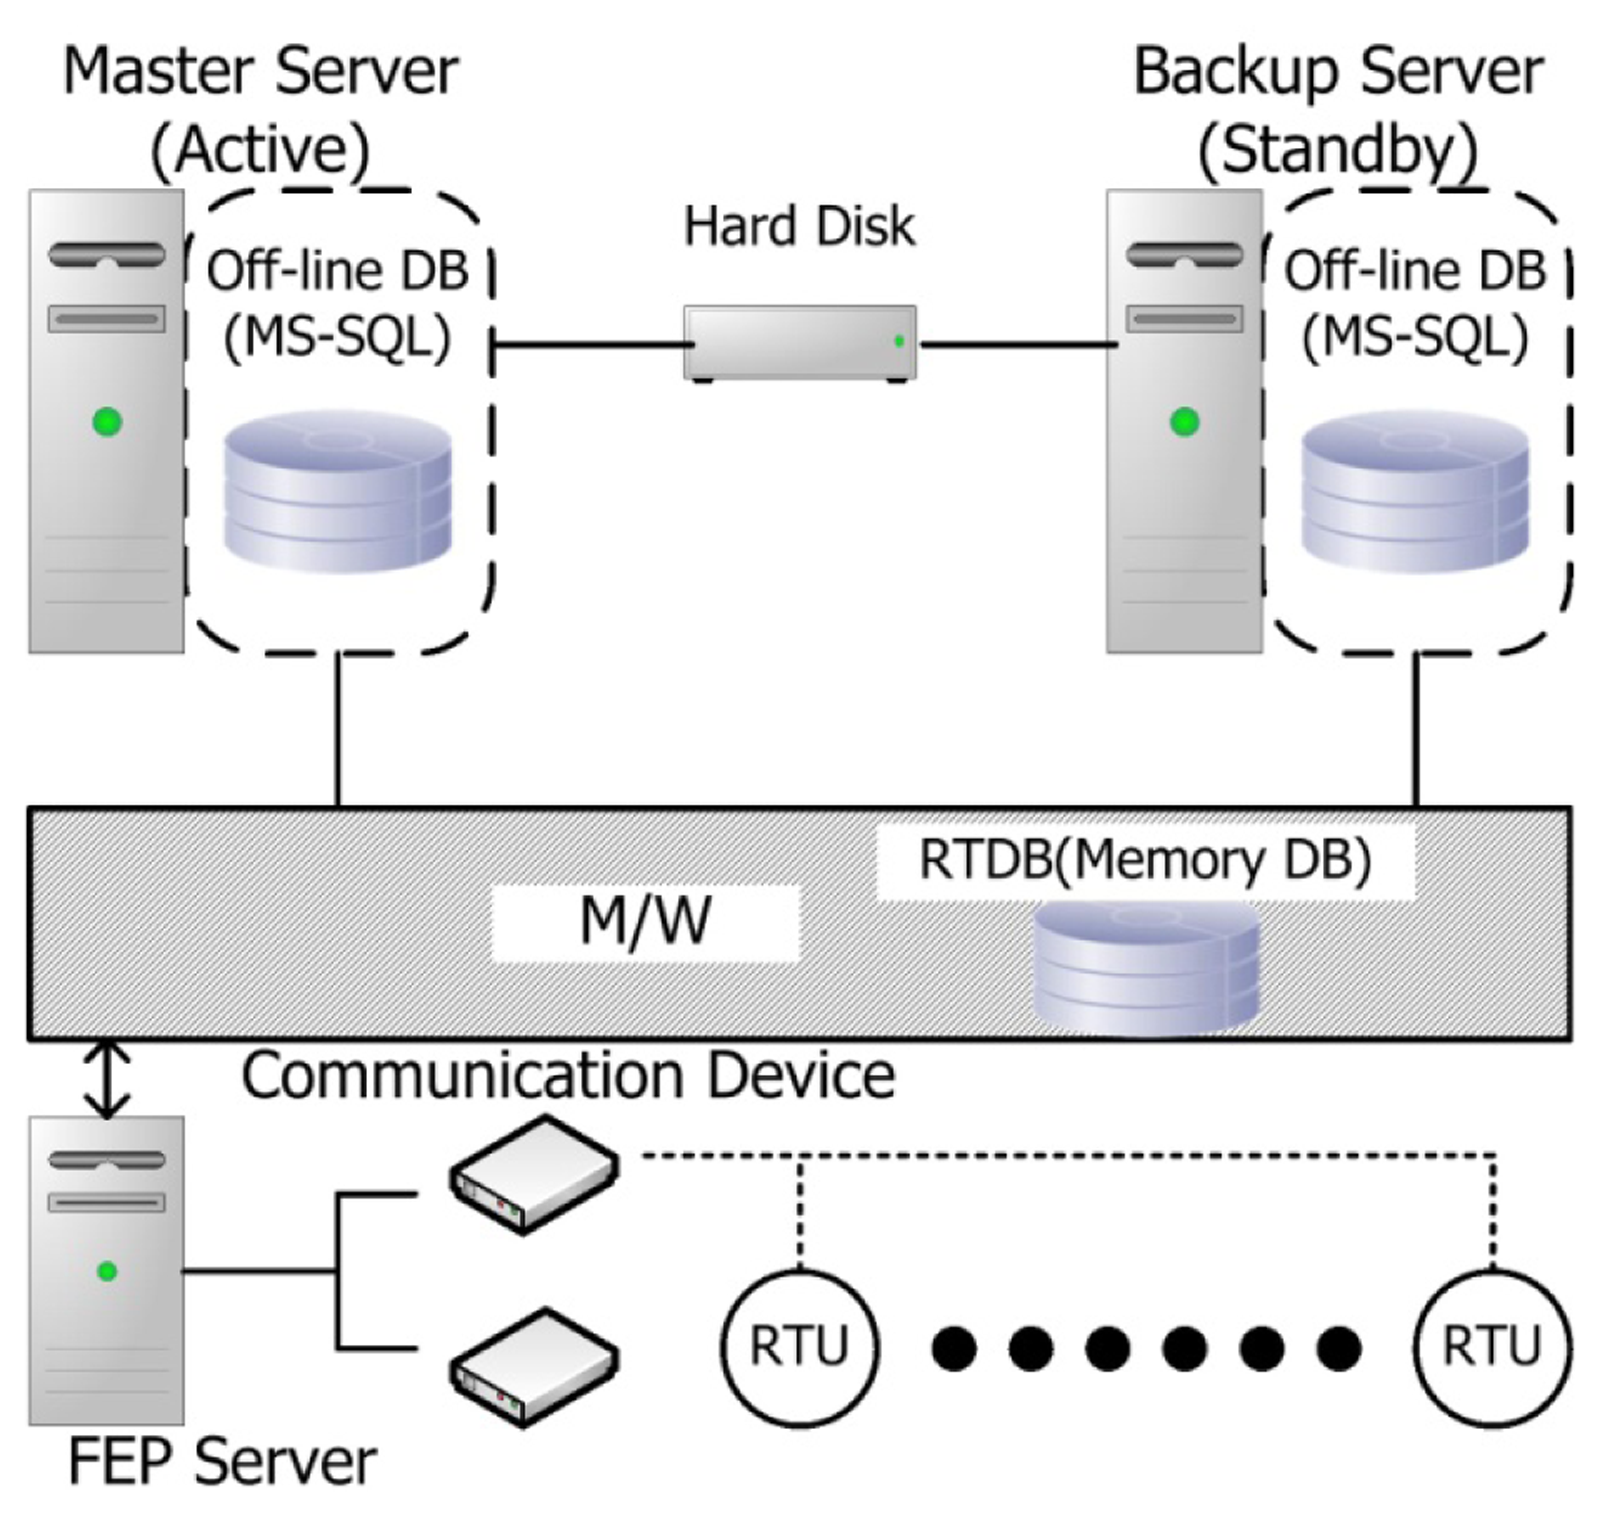
Figure 1 shows the interrelationship between the databases in the existing DAS in Korea [19,20].
As shown in Figure 1, real-time information (mainly switching information) acquired from the remote terminal unit (RTU) is stored in the RTDB of the middleware and is then stored in the off-line database. The RTDB is included in the middleware. This off-line database is managed by MS-SQL. When the master server experiences a problem, or when the DB is being updated, running operations that fail are sent to a backup server and the RTDB is recreated using the operation information stored in the hard disk via middleware, as shown in the figure. Therefore, the operation server should be re-booted to this end. In the DB structure of the current DAS, the configuration definition for RTDB and its creation is coded within the middleware, which is characterized by a dependent structure where the DB and the middleware are not separated. A code revision of the middleware is thus required; for example, a new RTU model is added.
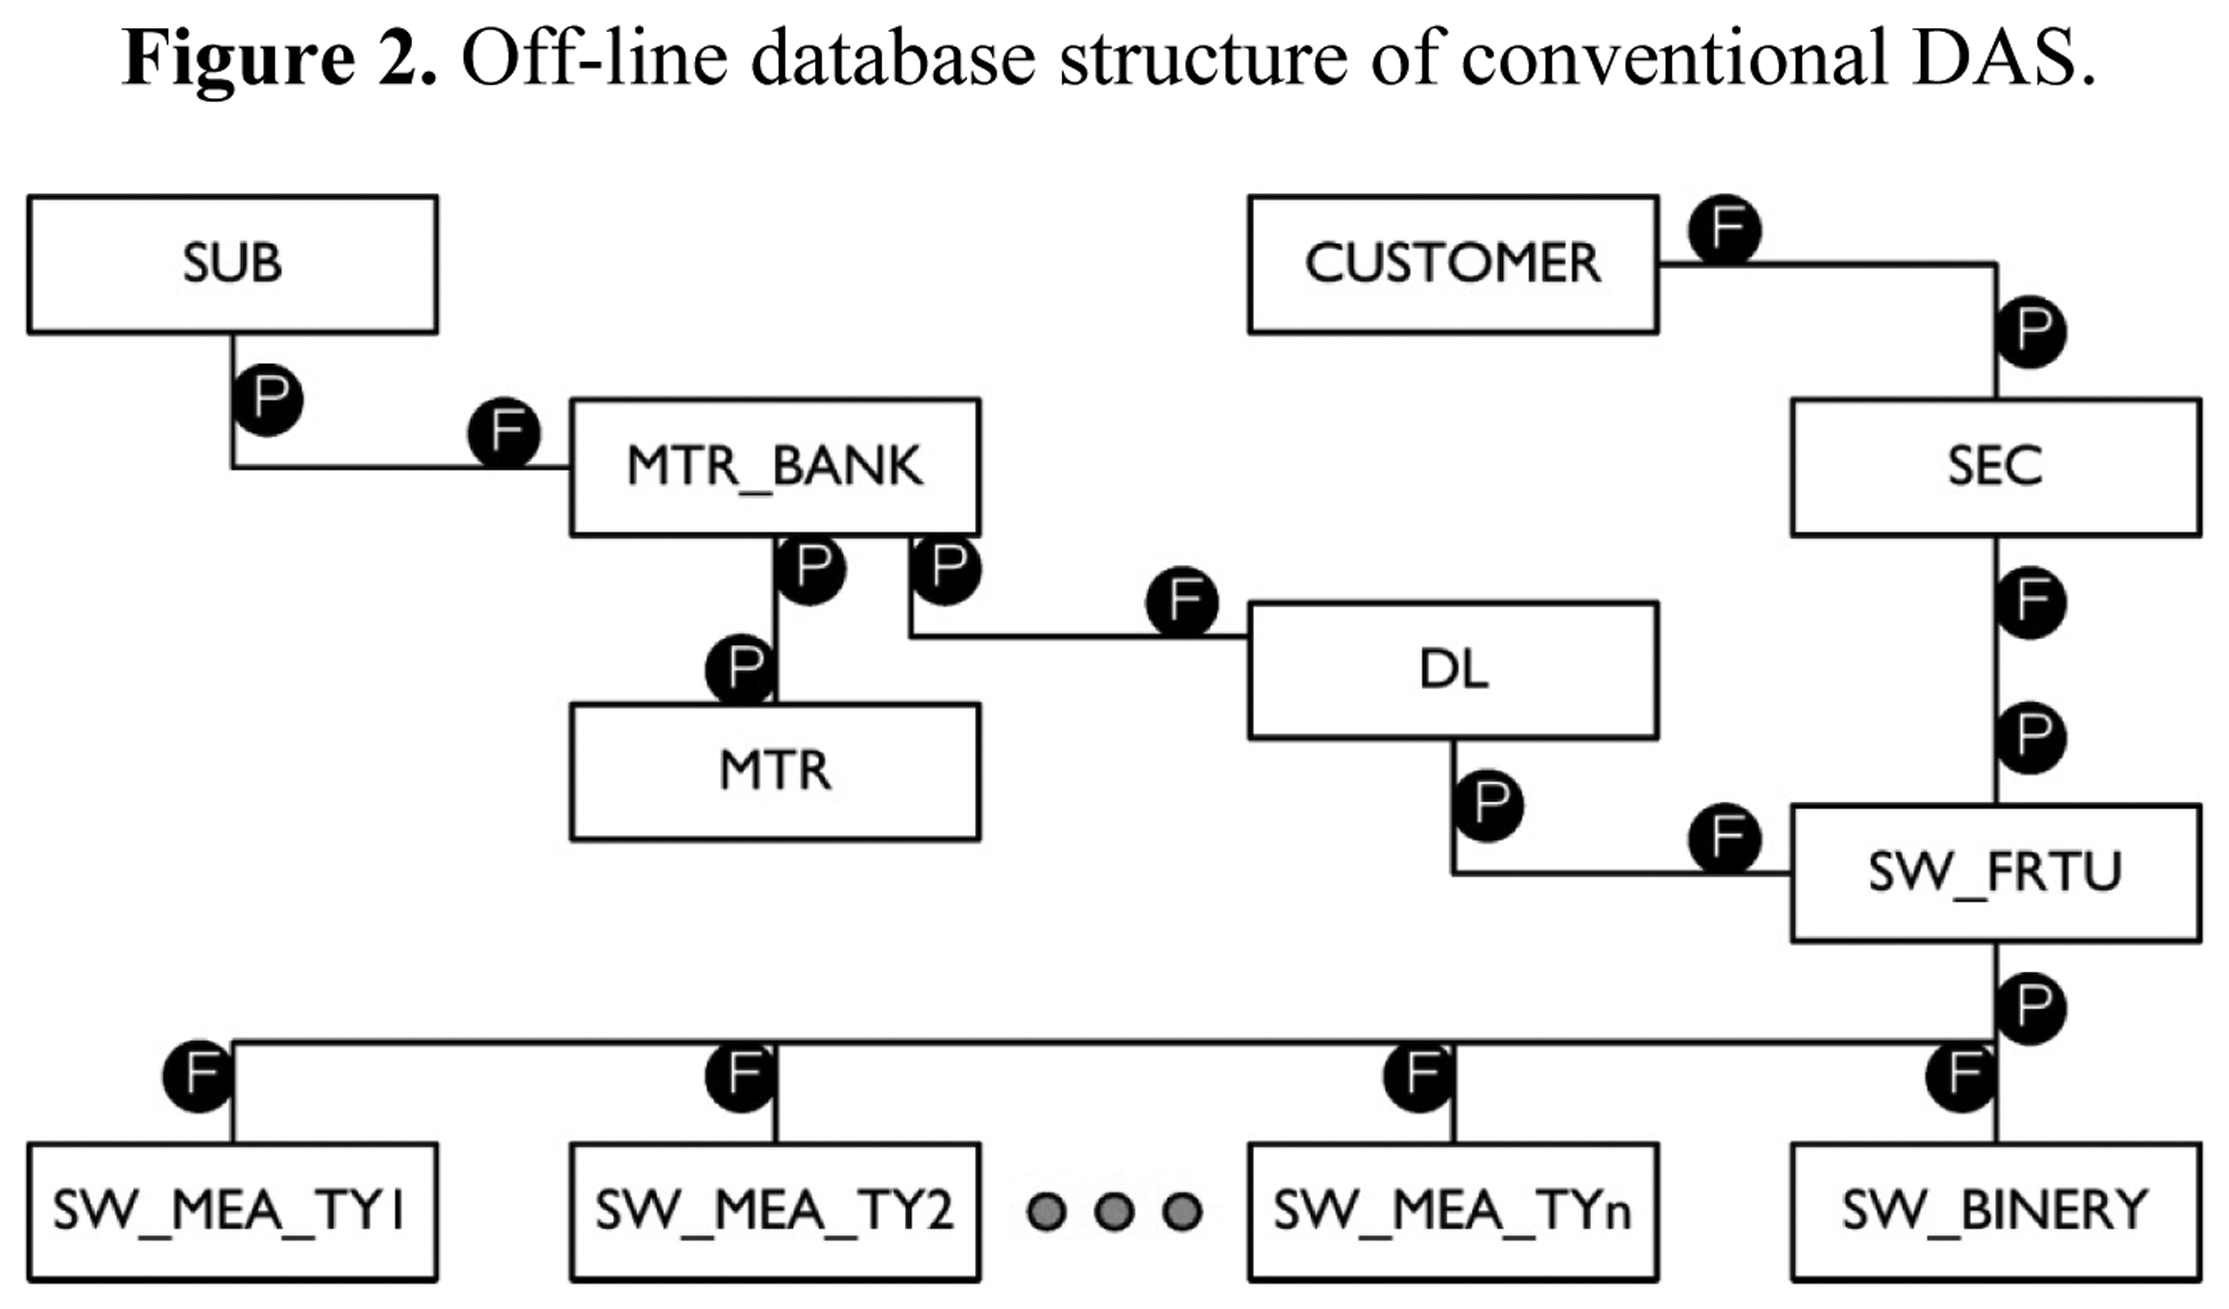
The RTDB simply consists of the address information of data points and their values as well as the mapping information of the off-line database. The detailed structure of the off-line database is shown in Figure 2.
Figure 2 shows the most important parts of the conventional DAS DB. P and F inside the circles in Figure 2 refer to the primary key and foreign key, respectively. As shown in Figure 2, the database is a relational database structure consisting of the hierarchical structure of a substation (SUB), main transformer (MTR_BANK), distribution line (DL), and switch unit (SW_FRTU). In the center of the overall structure, a switch unit is found and the distribution line (DL) has the identity (ID) of a starting point switch unit (D/L lead wire circuit breaker (CB)). The switch unit is associated with different measurement tables (SW_MEA_TY1, …, SW_MEA_TYn) depending on their types.
The characteristics of the existing DAS DB can be summarized as follows:
- (1)
It is a DB structure for measurement value acquisition and remote control of the switch for monitoring the distribution lines. Thus, the overall DB structure is configured on the basis of the switch unit (SW_FRTU).
- (2)
The database of the existing DAS does not provide a table structure for the operation of application programs for real-time analysis and control. Input/output data tables for the operation of the application programs, and tables for data sharing between the application programs do not exist. If application program B wants to refer to the result of an operation in application program A, application program B needs to have the duplicate code of application program A. Furthermore, the system model data (equivalent power at the transmission side, distributed power, transformer tab model, SVR and shunt cap, and SVC) for system analysis and control application programs are not defined.
- (3)
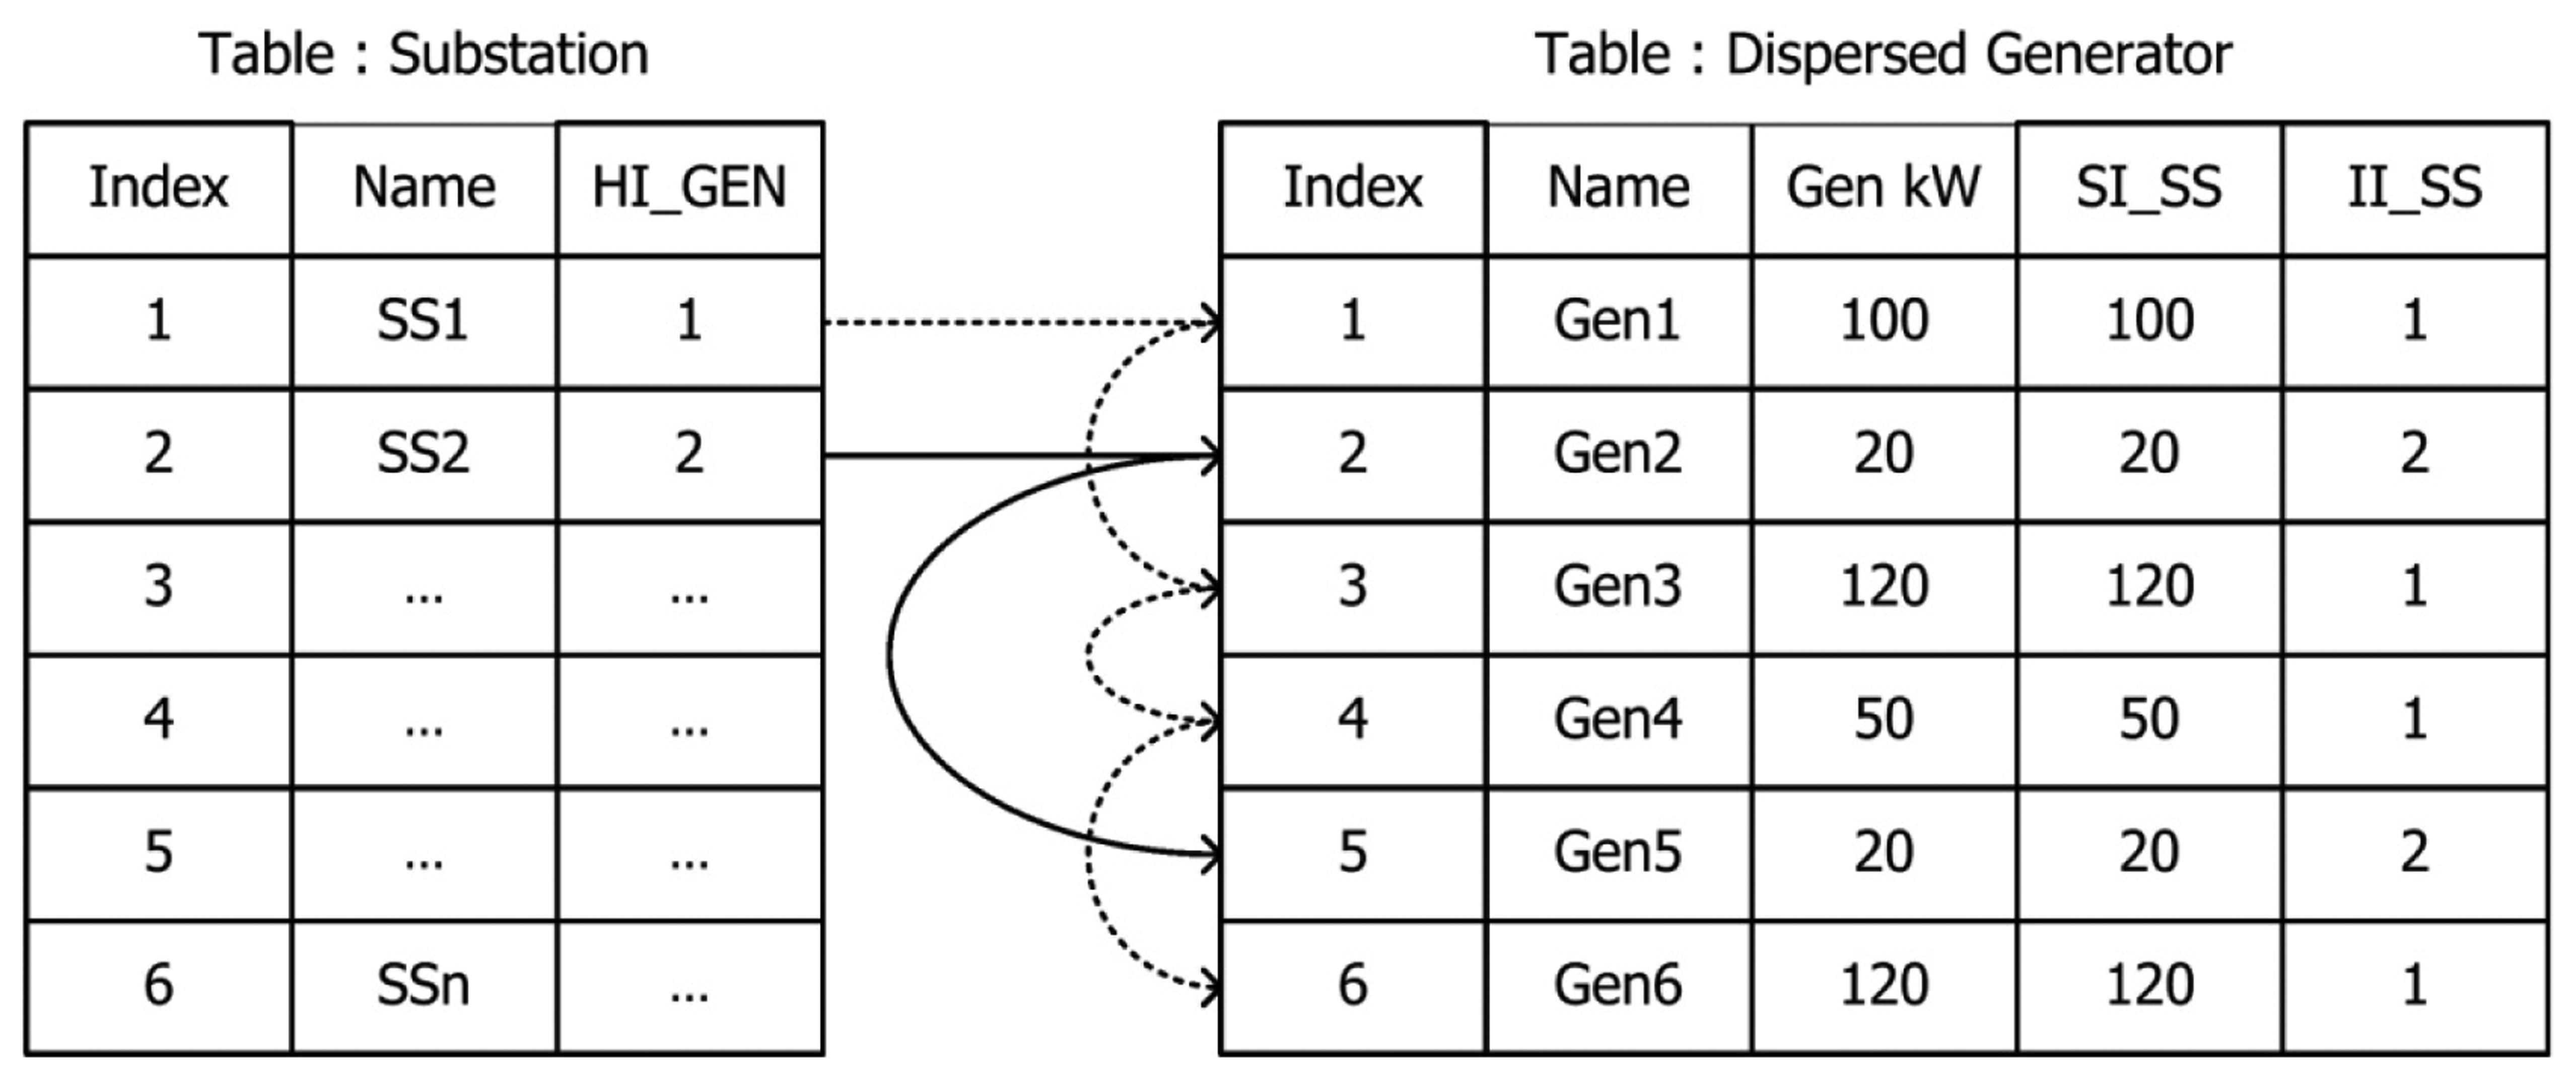
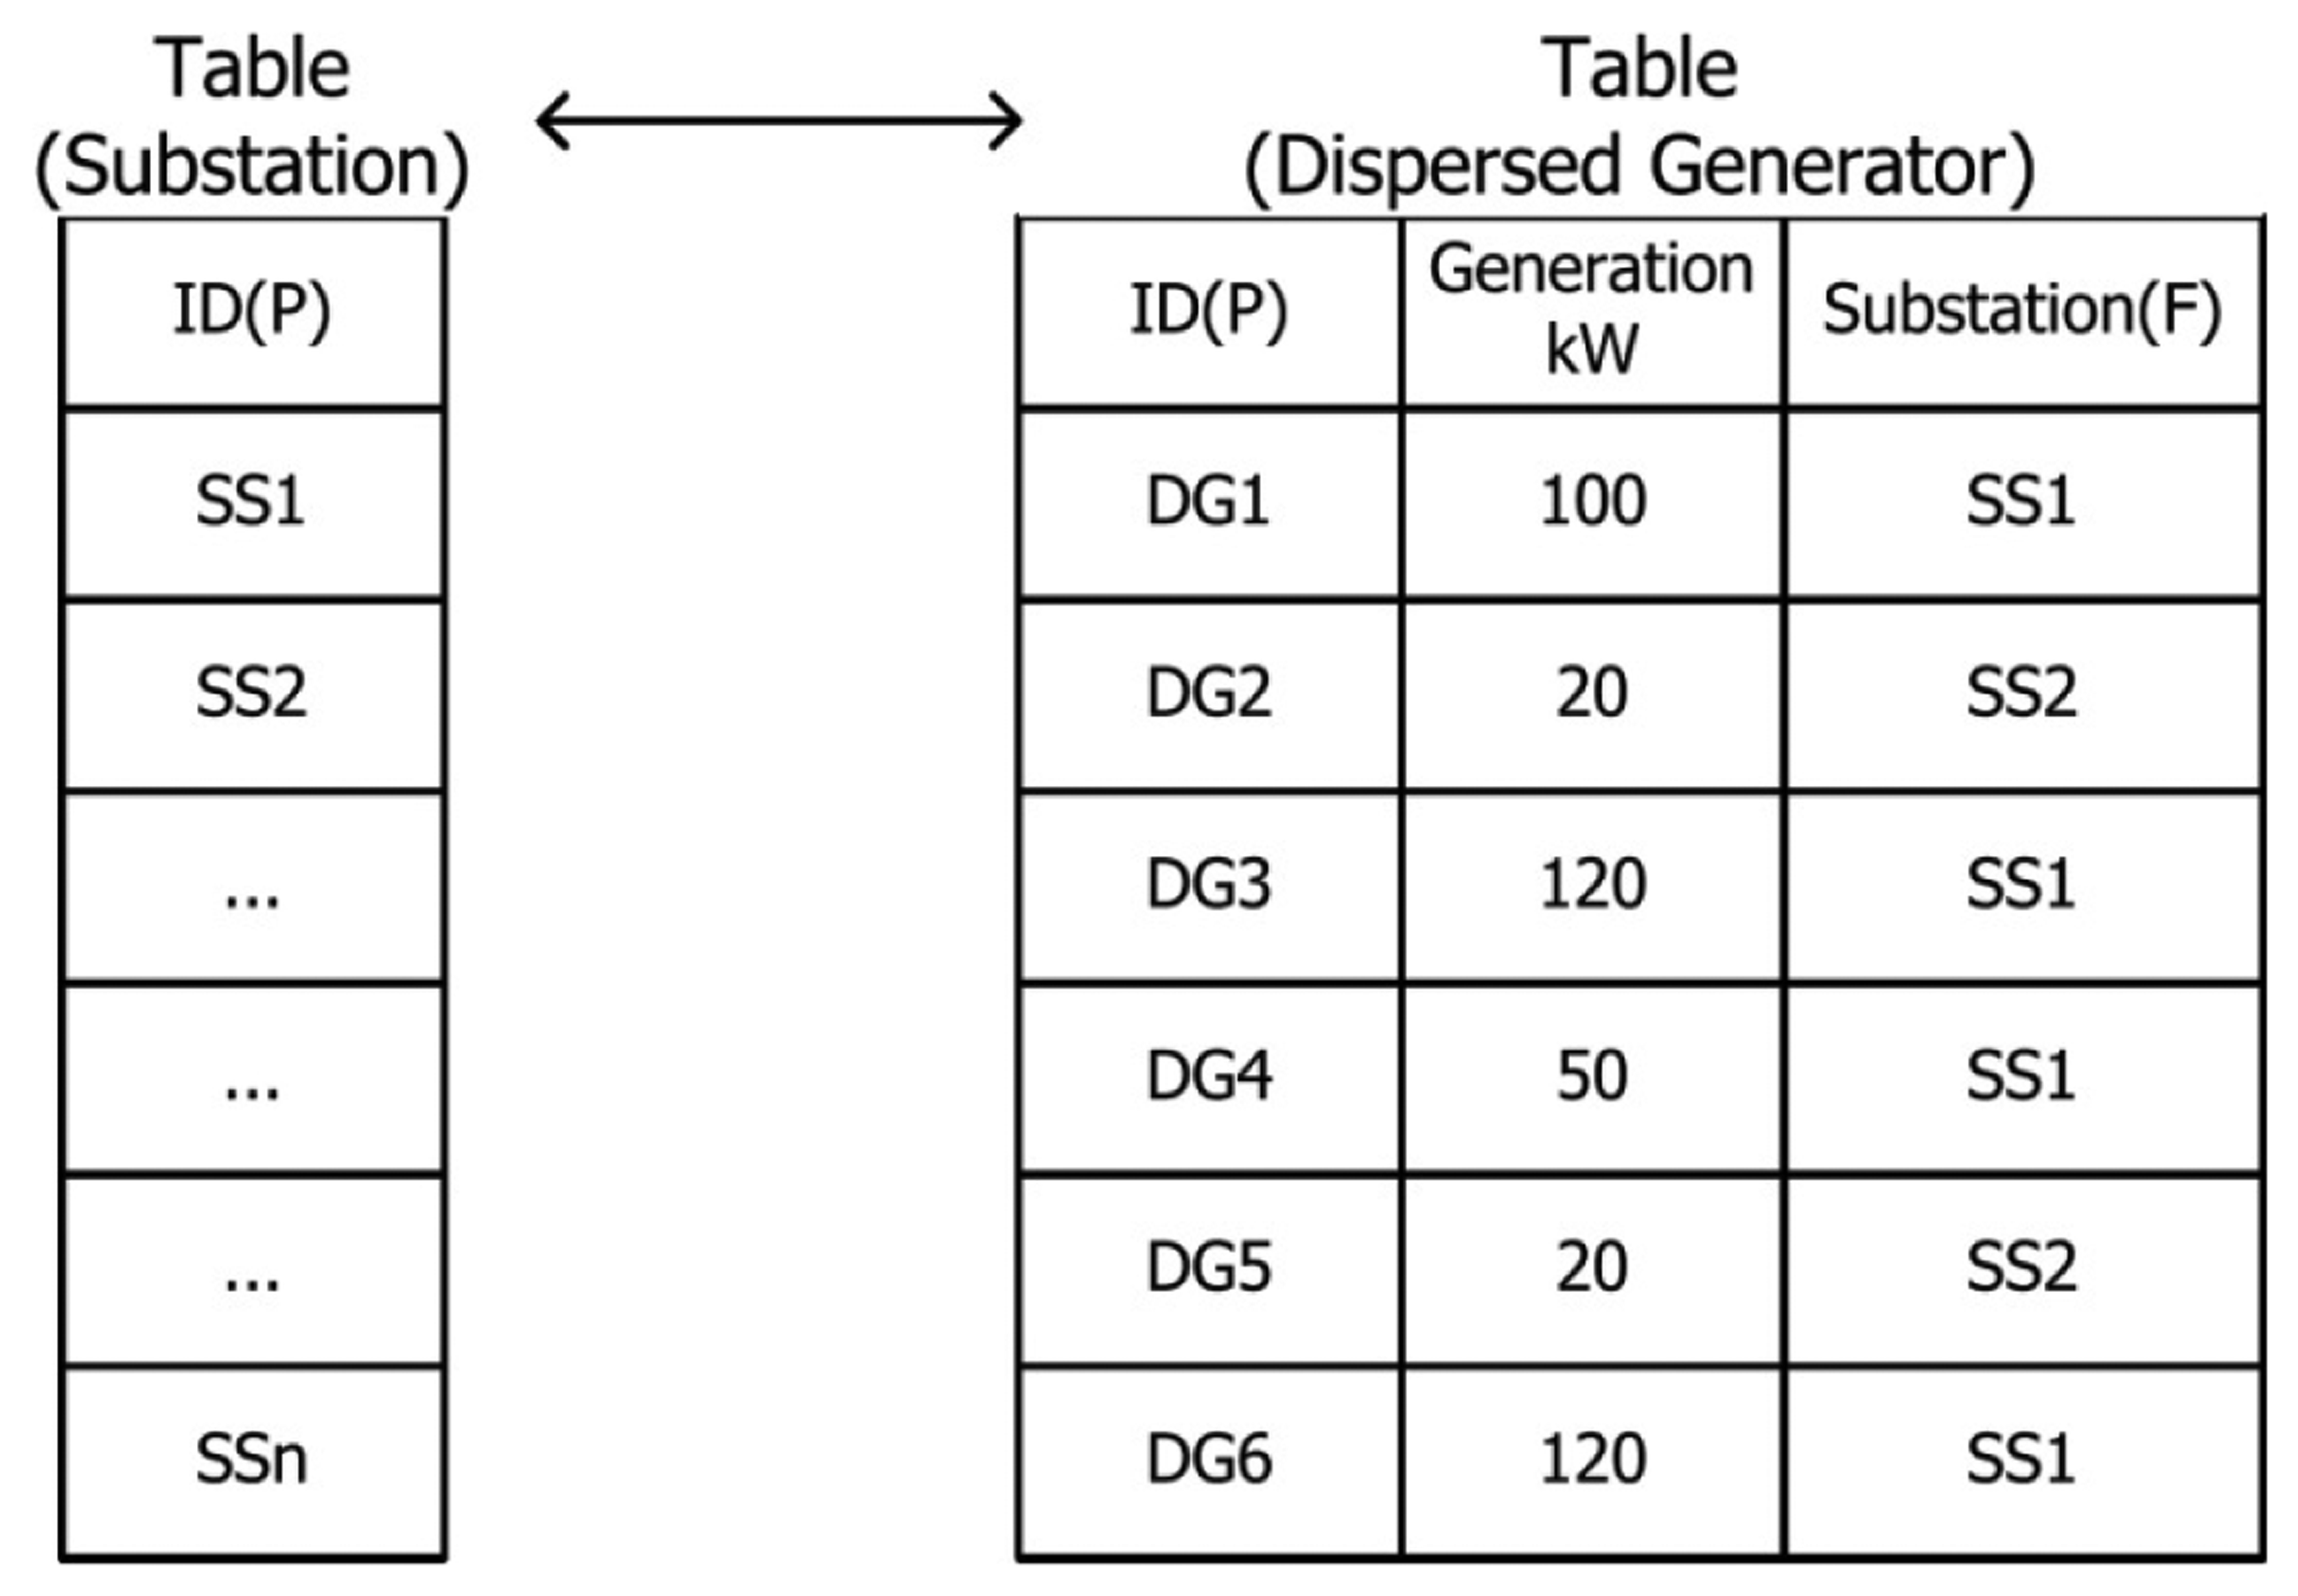
Application programs are run using the off-line database information. The association between tables for this relationship is achieved by ID. For example, when a relationship of table B with respect to a specific record in table A is defined and connected using ID, input and output becomes time-consuming since a record in table B (of which the ID is the same as that stored in the abovementioned specific record in table A) needs to be searched through a query. Figure 3 shows the DB characteristic of such an ID structure.
As indicated in Figure 3, the DB of the ID structure used in the current distribution operation system should check the ID of the substation field in the table generator; the DB thus performs an ID comparison with respect to “Substation 1” six times and conducts searches with respect to “Substation 2” six times in total in order to obtain the sum of the generation amount (kW) of the distributed generators that are affiliated with the same substation. The operational unit in the DMS in Korea is based on a branch office as the minimum unit. One branch office has as many as 10 substations and needs to monitor as many as 150 main D/L, thereby creating as many as 10,000 records per bus in a database. If the number of records as shown in the example of Figure 3 increases to several thousand or hundreds of thousands, the time taken for searching records will also increase exponentially, and this is not suitable for the execution of application programs for large systems that require periodical system analysis and control.
3. Development of KSDMS Database
The change in the operation of the recent distribution system has been accelerated because of the following problems:
- (1)
Increase in uncertainty due to the introduced system's increase in distributed power, including renewable energy.
- (2)
Combination of reduced operational knowledge and judgment due to the replacement of experienced operators with novice operators.
- (3)
Dissatisfaction of increased requirements of functional advancement for future operation systems, including the addition of new models.
Such problems are no exception in Korea; hence, the KSDMS project was undertaken from June 2009 to May 2013 to develop Korea's next-generation distribution operation system [21]. During the KSDMS development, we differentiated our system by defining it as a distribution management system that can be helpful for operators' decision making by mounting various application programs from the existing DAS; we call this system a monitoring system for distribution (SCADA for distribution). The aim of the system developed for this purpose was to achieve the following objectives:
- (1)
Cope with the uncertainty of distributed power and automation of fault recovery through mounting of real-time system analysis and control application programs.
- (2)
Support for new operators using the result of the application programs.
- (3)
Increase in the compatibility of DB structure through the use of standardized system structures.
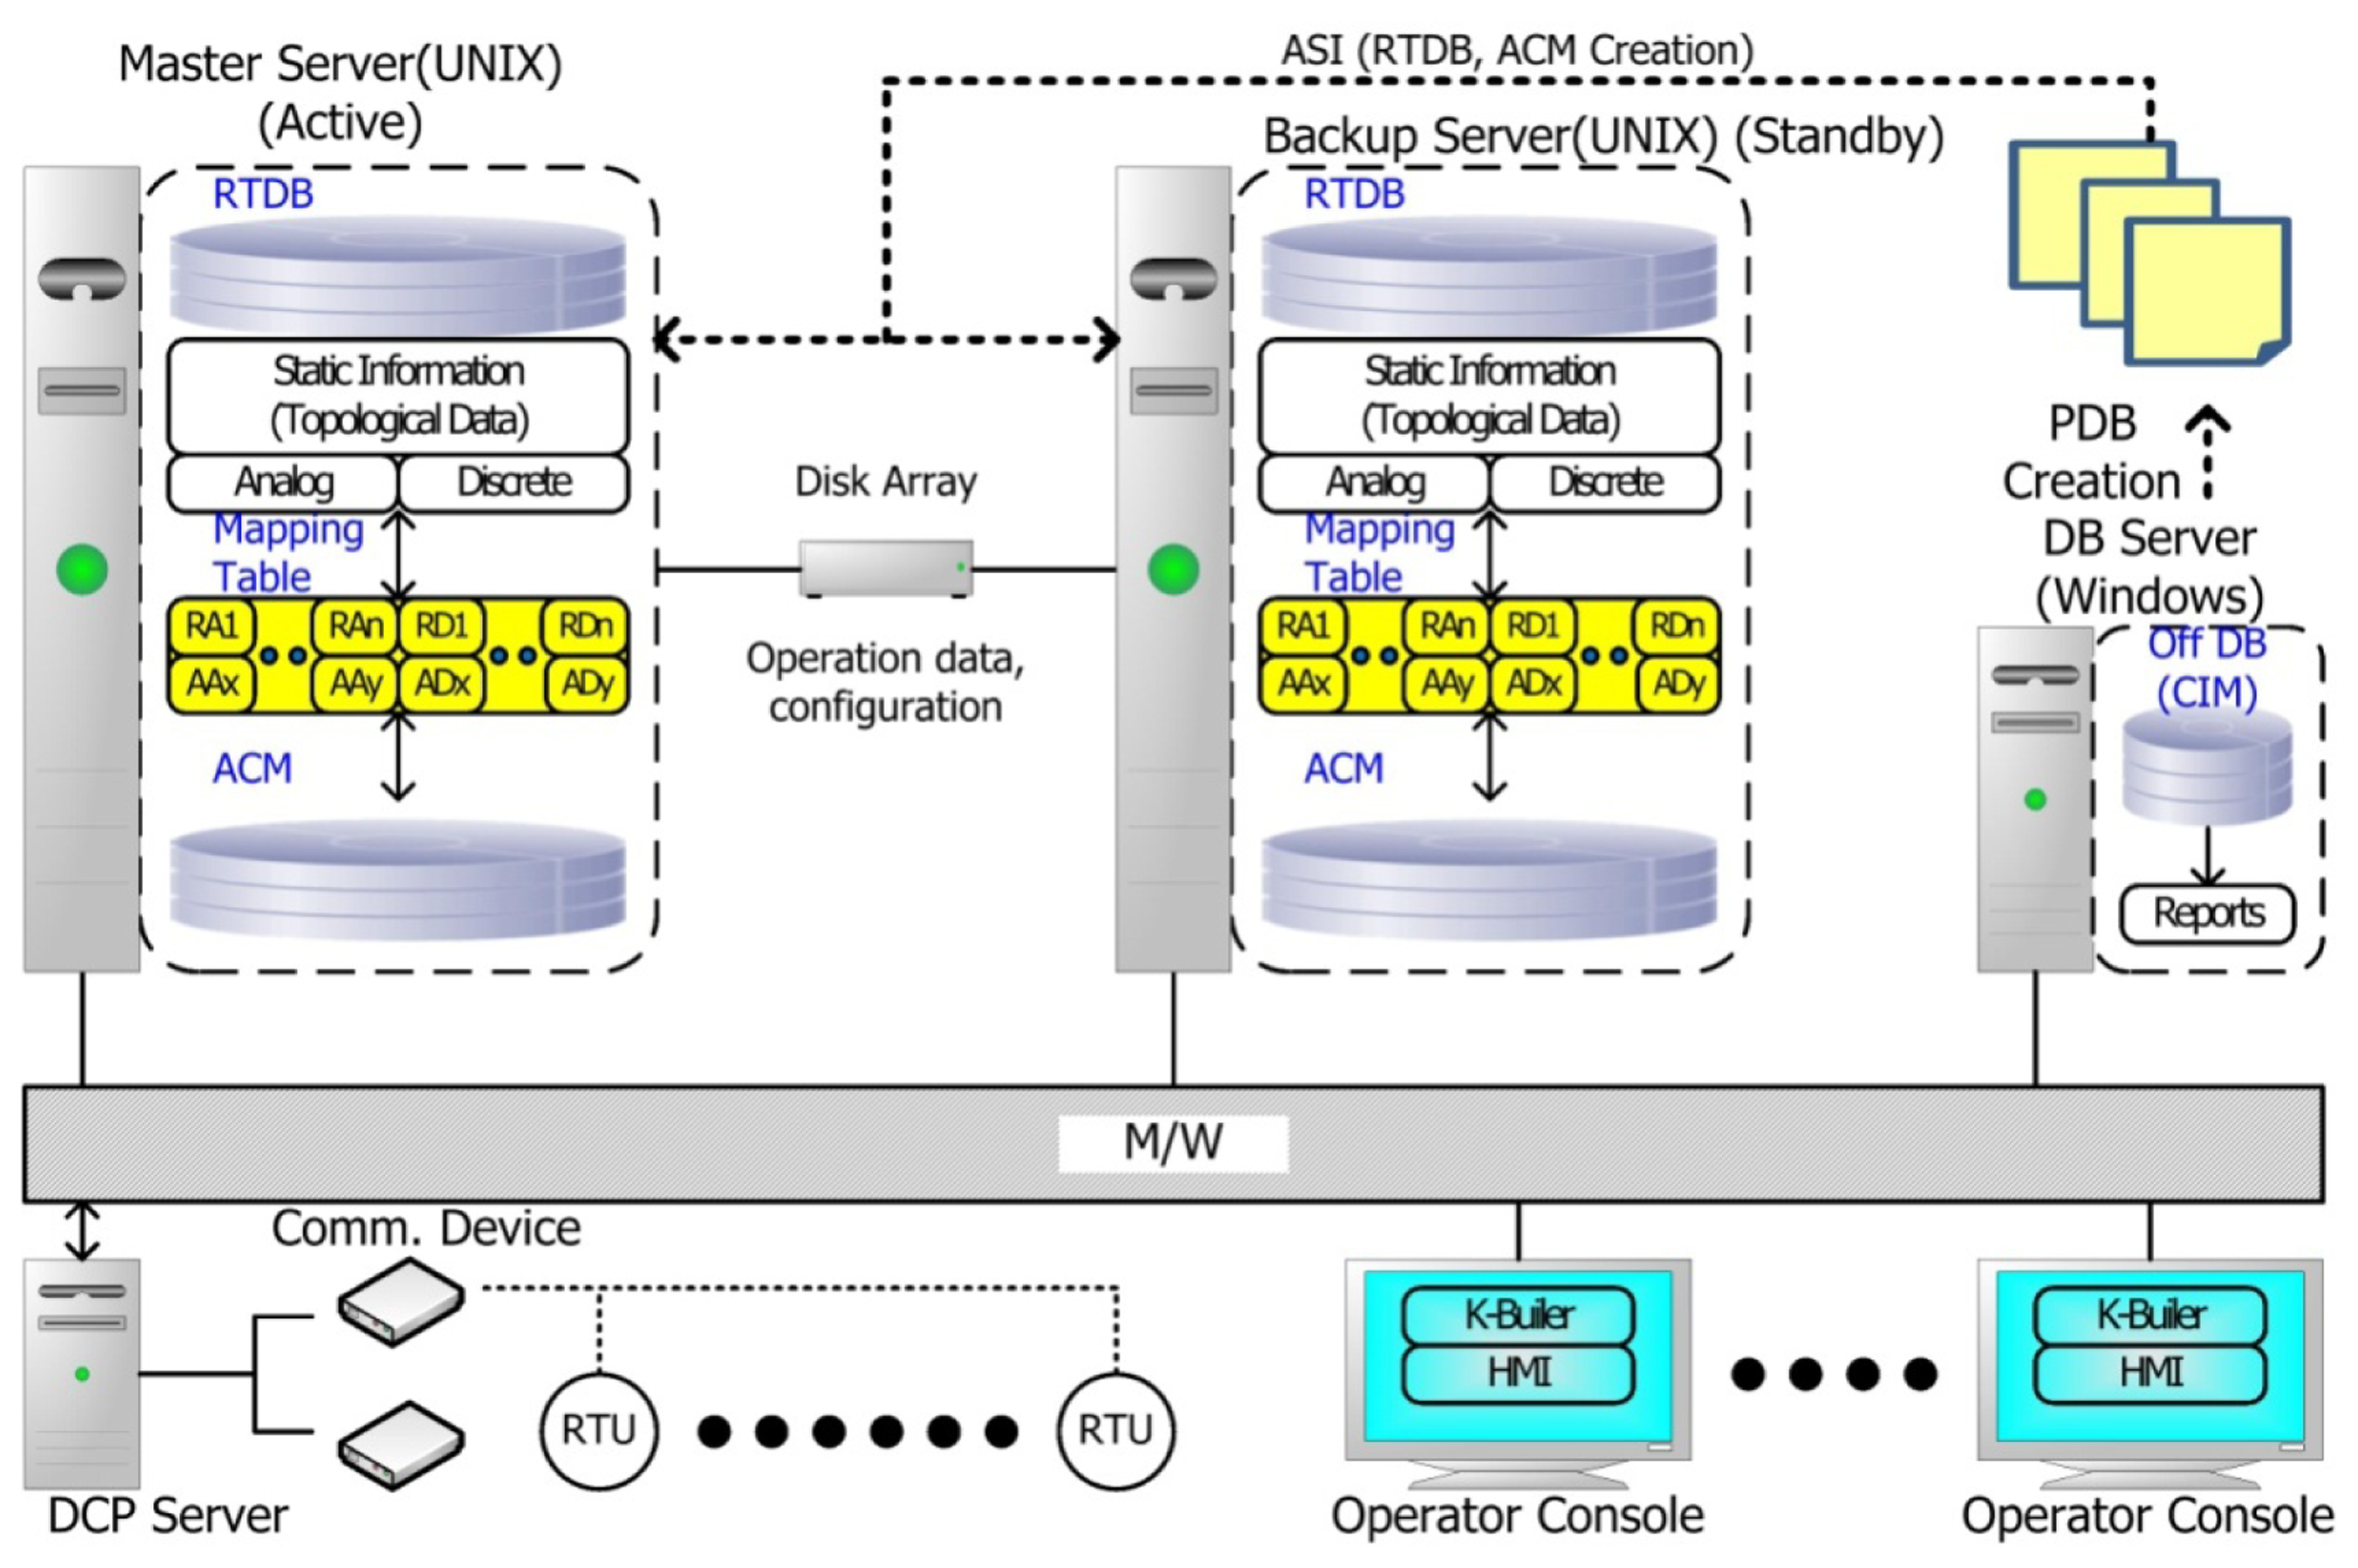
The relationship structure of the database used in the KSDMS is shown in Figure 4.
The following paragraphs explain the difference in structure between the KSDMS and the existing DAS.
- (1)
In the existing DAS, the memory database was subordinate to the middleware, and the off-line database was located in the operating server; this posed problems of maintenance/repair and server restart for database updating. Also, for the addition of a new equipment model, the middleware code should be corrected and recompiled. In response to these problems, two changes were made in KSDMS. First, a memory database (RTDB) for measurement information and the alarm processing of field devices, and a memory database (ACM) for the implementation of application programs were given independent structures in the middleware. While an inherent function of the middleware (data interface between a server and nodes) was intact, the function of DB creation was carried out using the application service interface (ASI) and the configuration file. Accordingly, an off-line DB was separated and all information required for memory DB creation was extracted and applied as a form of PDB; a configuration file was updated and stored in a disk array. Through this arrangement, DB update in the operation server can be carried out without interruption, while new RTU models can be added automatically through a configuration update (DB update). Second, the offline database was moved to a separate database server to enable an uninterrupted operation, irrespective of the operation server problems or database updating.
- (2)
ACM DB was developed to run the application programs. In this way, DB, RTDB, and ACM can be divided into run real-time system analysis and control application programs, while placing little burden on the field data measurement and transfer, in order to perform the SCADA function of the existing DAS.
- (3)
The off-line DB was constructed on the basis of an international standard, IEC61970 (CIM), to prepare for future compatibility. A tool called K-Builder was developed for engineering the off-line DB, of which the CIM DB and system line drawing could be edited.
3.1. System Modeling
Table 1 summarizes the data model of the KSDMS DB. As shown in Table 1, the CIM DB structure was configured following the code of the CIM standard. As can be seen from the top of Table 1, the starting point of each D/L has a generator that is equivalent to the transmission system followed by the main transformer and the lead point switch. The ACM model represents the relationship between the CIM terminal and the connectivity node according to the relationship between the facility and nodes. Furthermore, a switch for the measurement of equivalent power (P and Q voltage introduced to the transmission end) is added. The modeling of facilities used by the application program in the ACM DB, which is indicated at the bottom of Table 1, has the following characteristics:
- (1)
All measurements in the distribution system can be measured that can only be performed by switching to the attached RTU that can transmit the measurement remotely (generally called automated switch).
- (2)
The voltage in a node is either a measured value in a node, where an automated switch is attached, or the estimated value of the load flow and status estimation.
- (3)
The switch measures the voltage and current per phase, the voltage and current phase differences, and the operation values (P, Q, etc.) by using the abovementioned measured values.
- (4)
The line is modeled as a form of Π. While none of the lines in any section had measured values, those obtained in the automated switch are used. G and B, which are elements of the Y (admittance) matrix, can be modeled as follows:
- (5)
It is assumed that the transformer follows a tap model in the primary side. For the transformer tap, a three-winding transformer was modeled with three two-winding transformers. B11 and B12, which are elements of the Y matrix, can be modeled as follows:
where TRPri: nameplate voltage of transformer; TRPriNORkV: nominal voltage of transformer; TapEsti: current tap position; TapNor: nominal tap position; and TapStep: tap step (P.U.).- (6)
If the database hierarchy needs to be separated, the facilities should be separated over both ends in a specific hierarchy. In the proposed DB structure, the switches over both ends were modeled as a tie switch and assigned to the highest branch office.
- (7)
The structure was modeled with an assumption that a generator (distributed generator) has an automated switch that can always measure an electricity generation amount. It was assumed that a very small distributed generator may not have an automated switch.
- (8)
A parallel device (shunt capacitor/reactor) was modeled under the condition of switch input open.
- (9)
SVC, the same as that in the generator, was modeled assuming the presence of automated switches that can measure a reactive power amount.
- (10)
In the case of the load, it was assumed that individual load measurement cannot be performed. Thus, loads were modeled using the total load between automated switches, while it was assumed that the application program estimated the value using the measured value obtained in a switch.
3.2. Development of Off-Line DB and RTDB
The off-line DB in the KSDMS was developed in compliance with the IEC61970 standards. Since the CIM standard did not include all information required for the operation of the distribution system, the IEC61970 Package was modified to suit the required information, whereas the line and transformer model given in the WiresExt Package of IEC61968 was also adopted to take into consideration the distribution line and MTR as well as SVR. The modified CIM model is summarized in Table 2.
According to the following procedure, the CIM class was converted to a relational database management system (RDBMS), which is a type of off-line DB management. The conversion procedure is as follows:
| (Step 1) | Create tables to represent the classes. |
| (Step 2) | Create columns of tables to represent the attributes of the classes. |
| (Step 3) | Set the key referential relationships between tables to represent the relations of the classes. |
| (Step 4) | Operations of the classes are not used. |
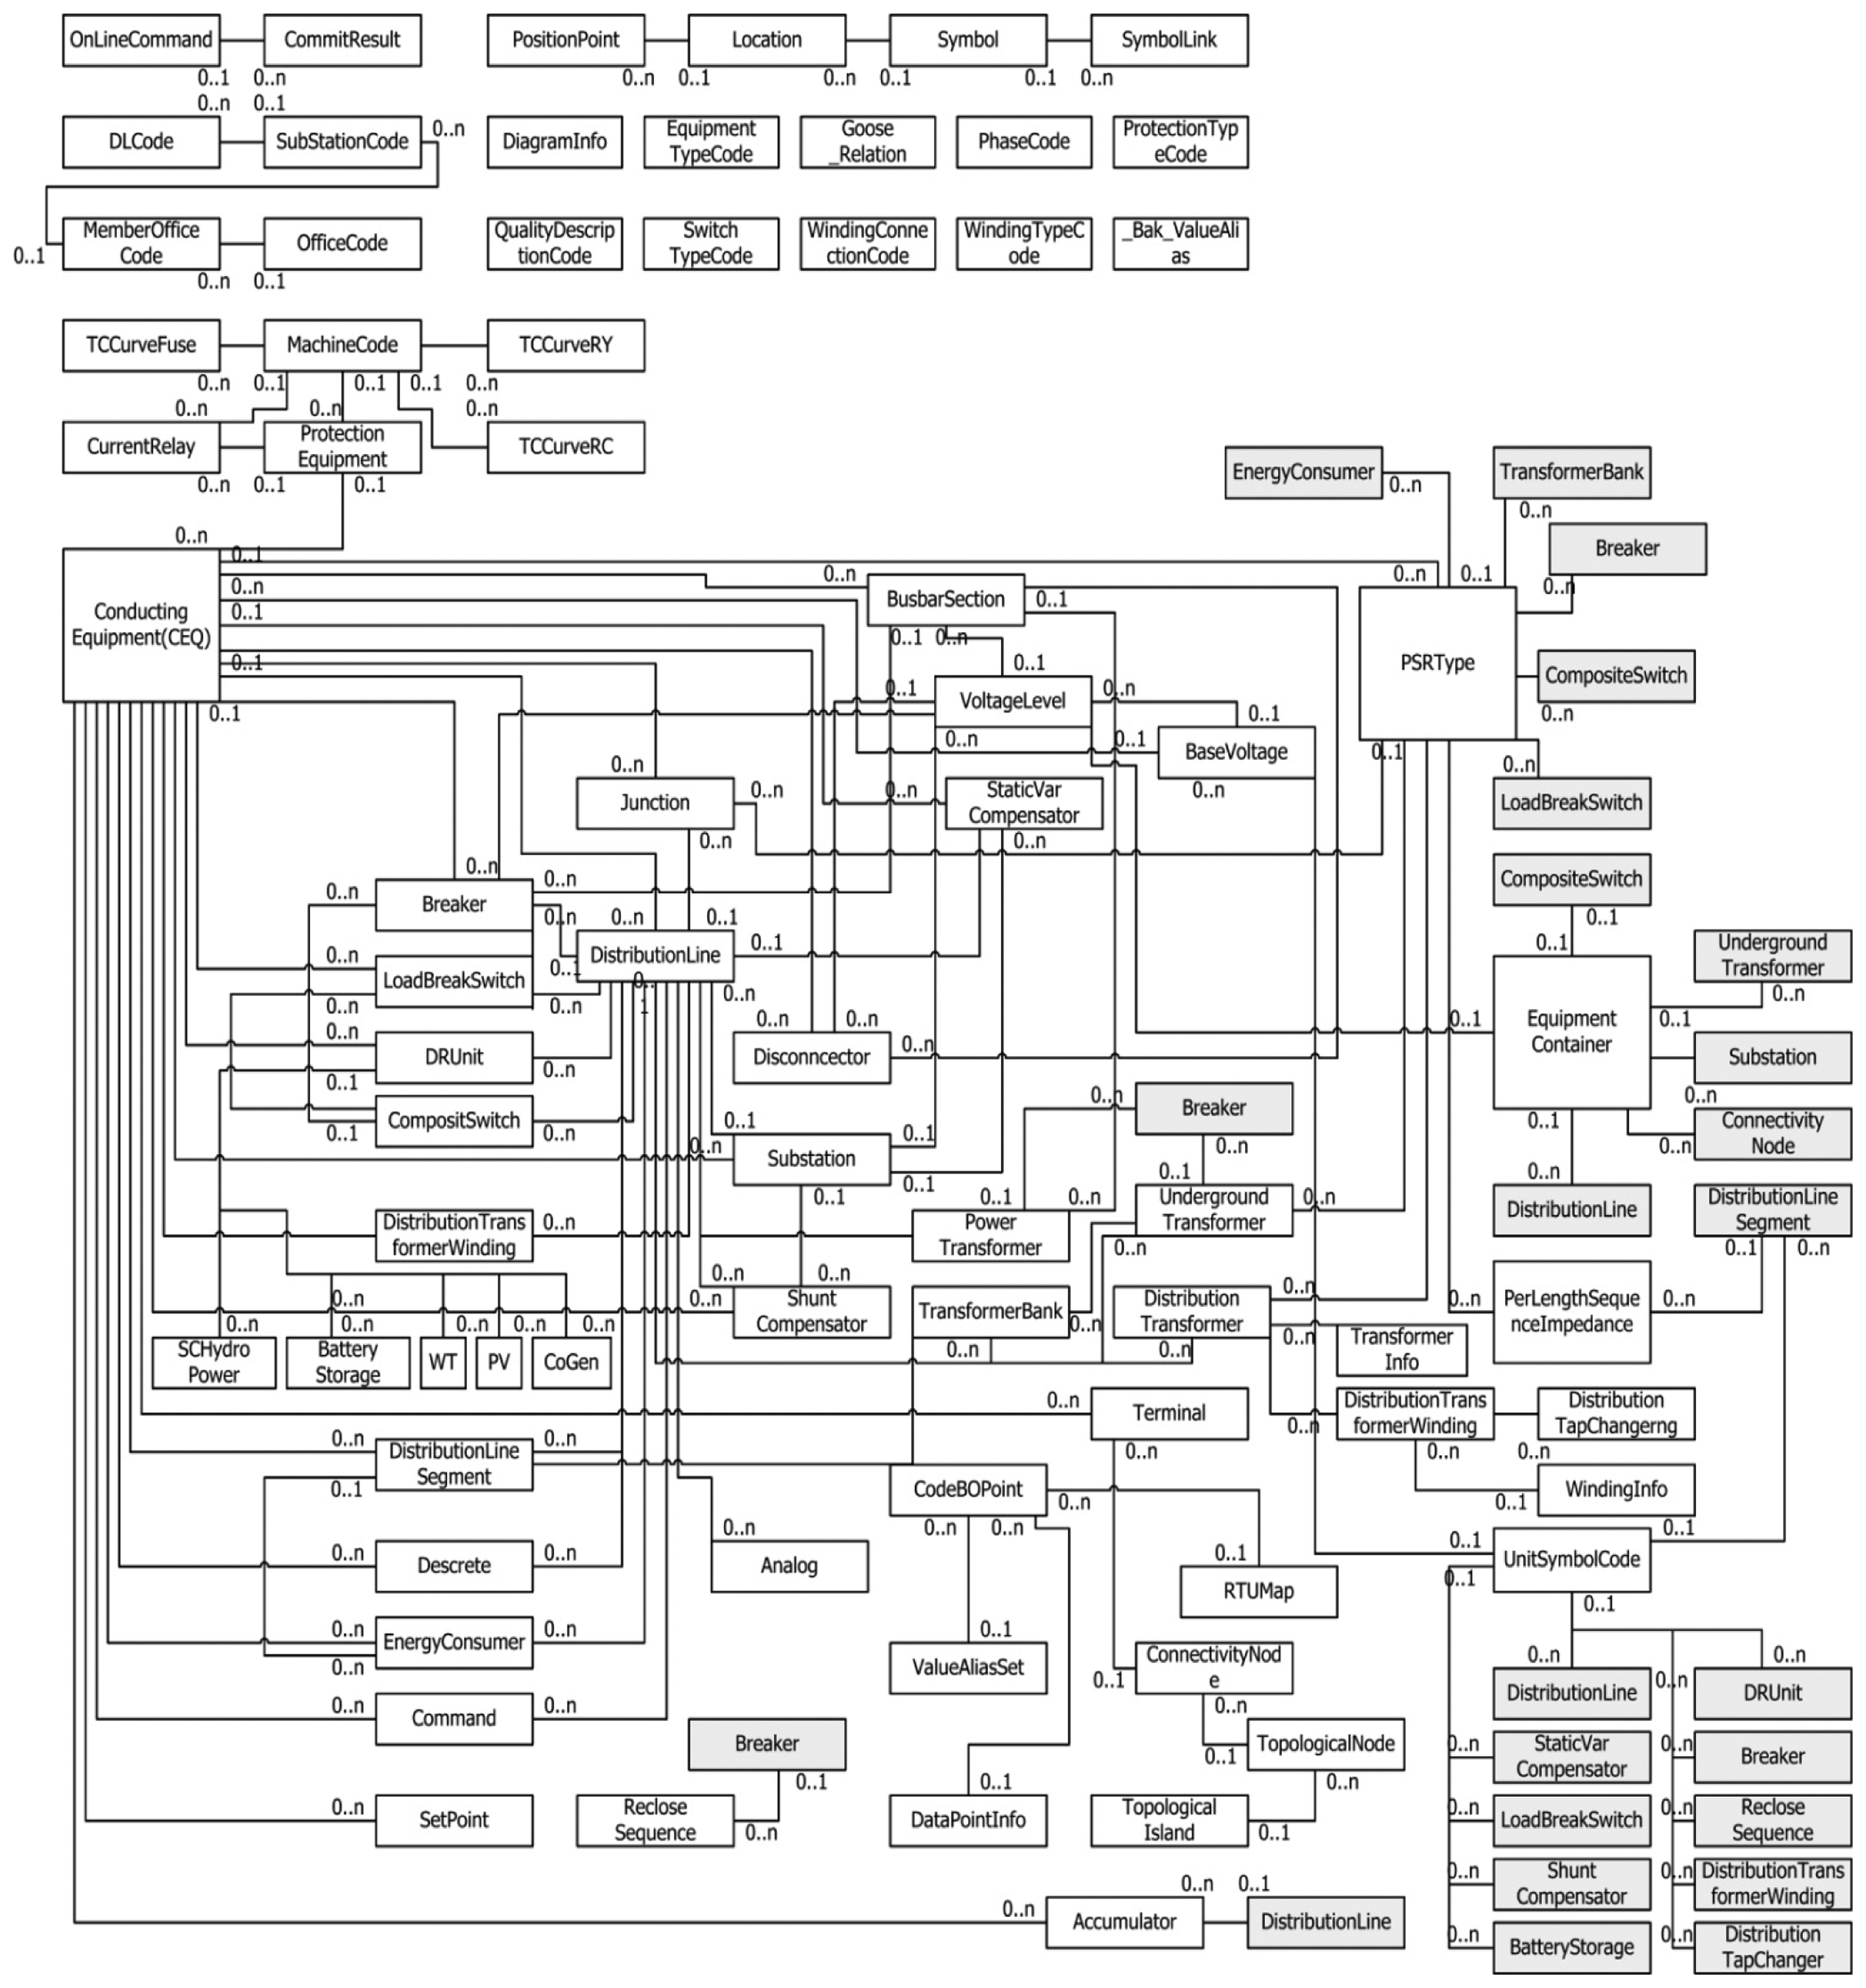
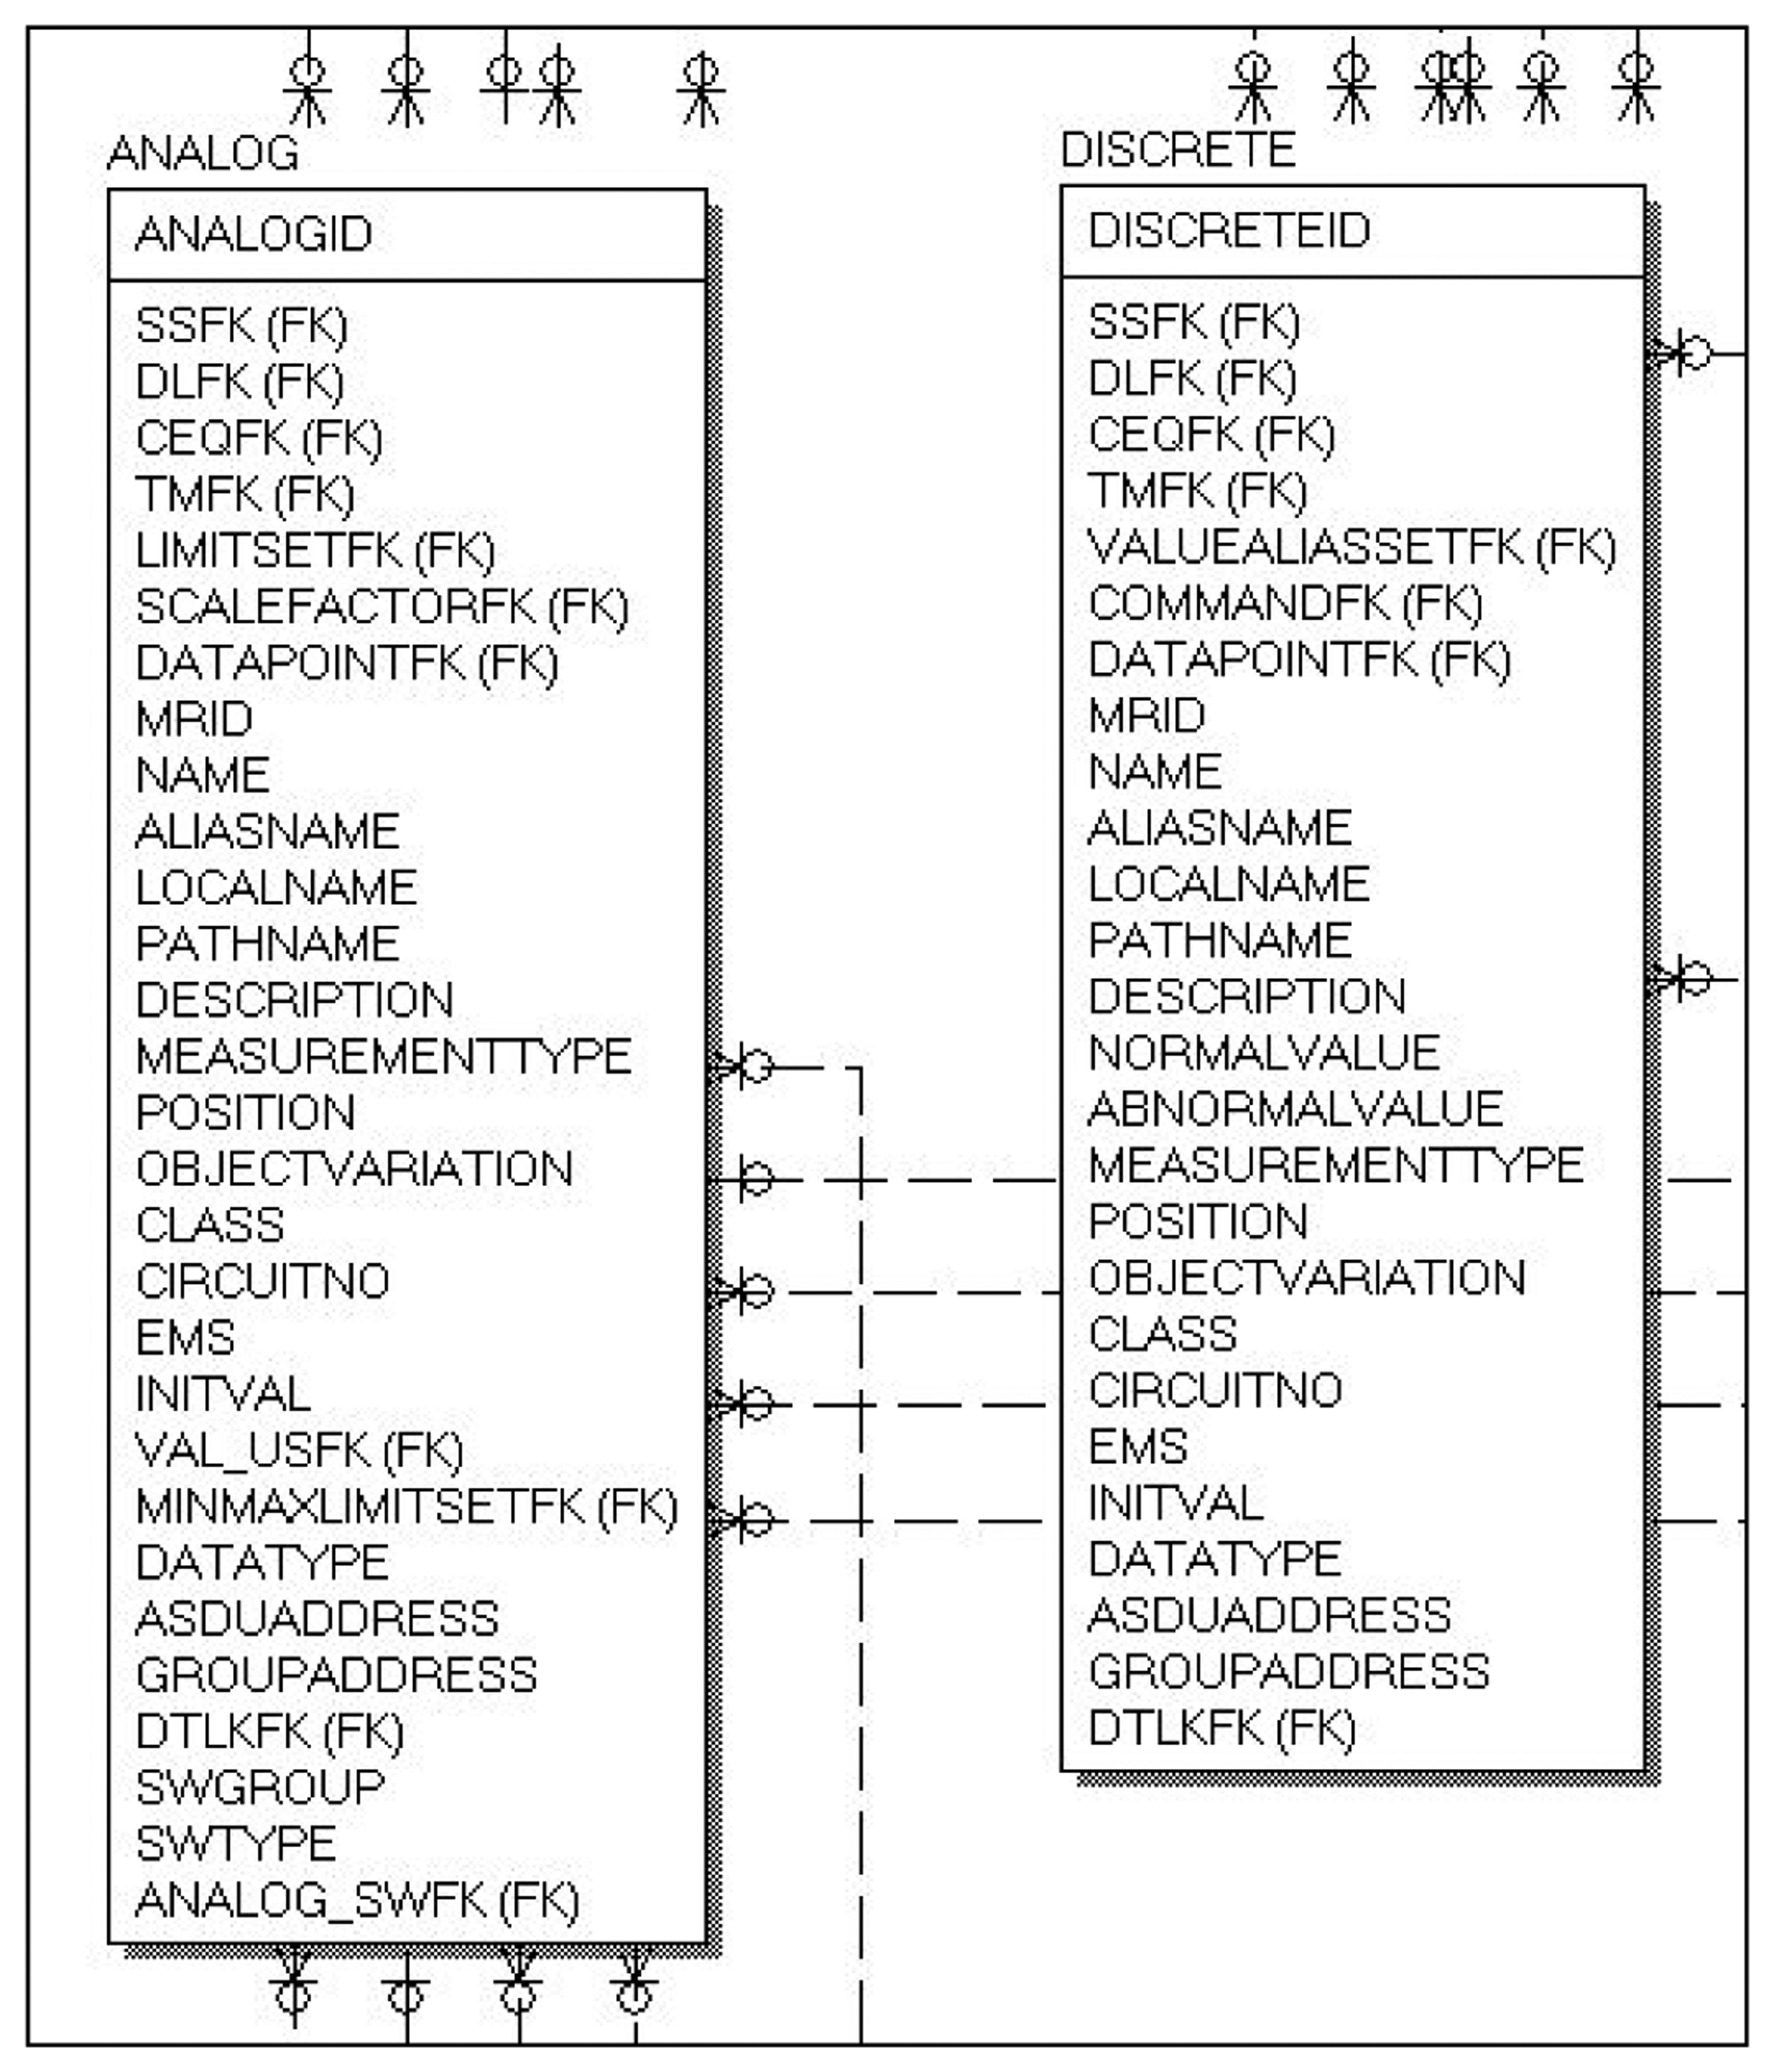
Figure 5 shows the CIM DB structure converted into RDBMS. Figure 6 shows the structures of the analog and discrete tables in the PDB. One of the fields, with the field name “EMS”, is an identifier that identifies the measured values that are essentially required for the system analysis and control application programs.
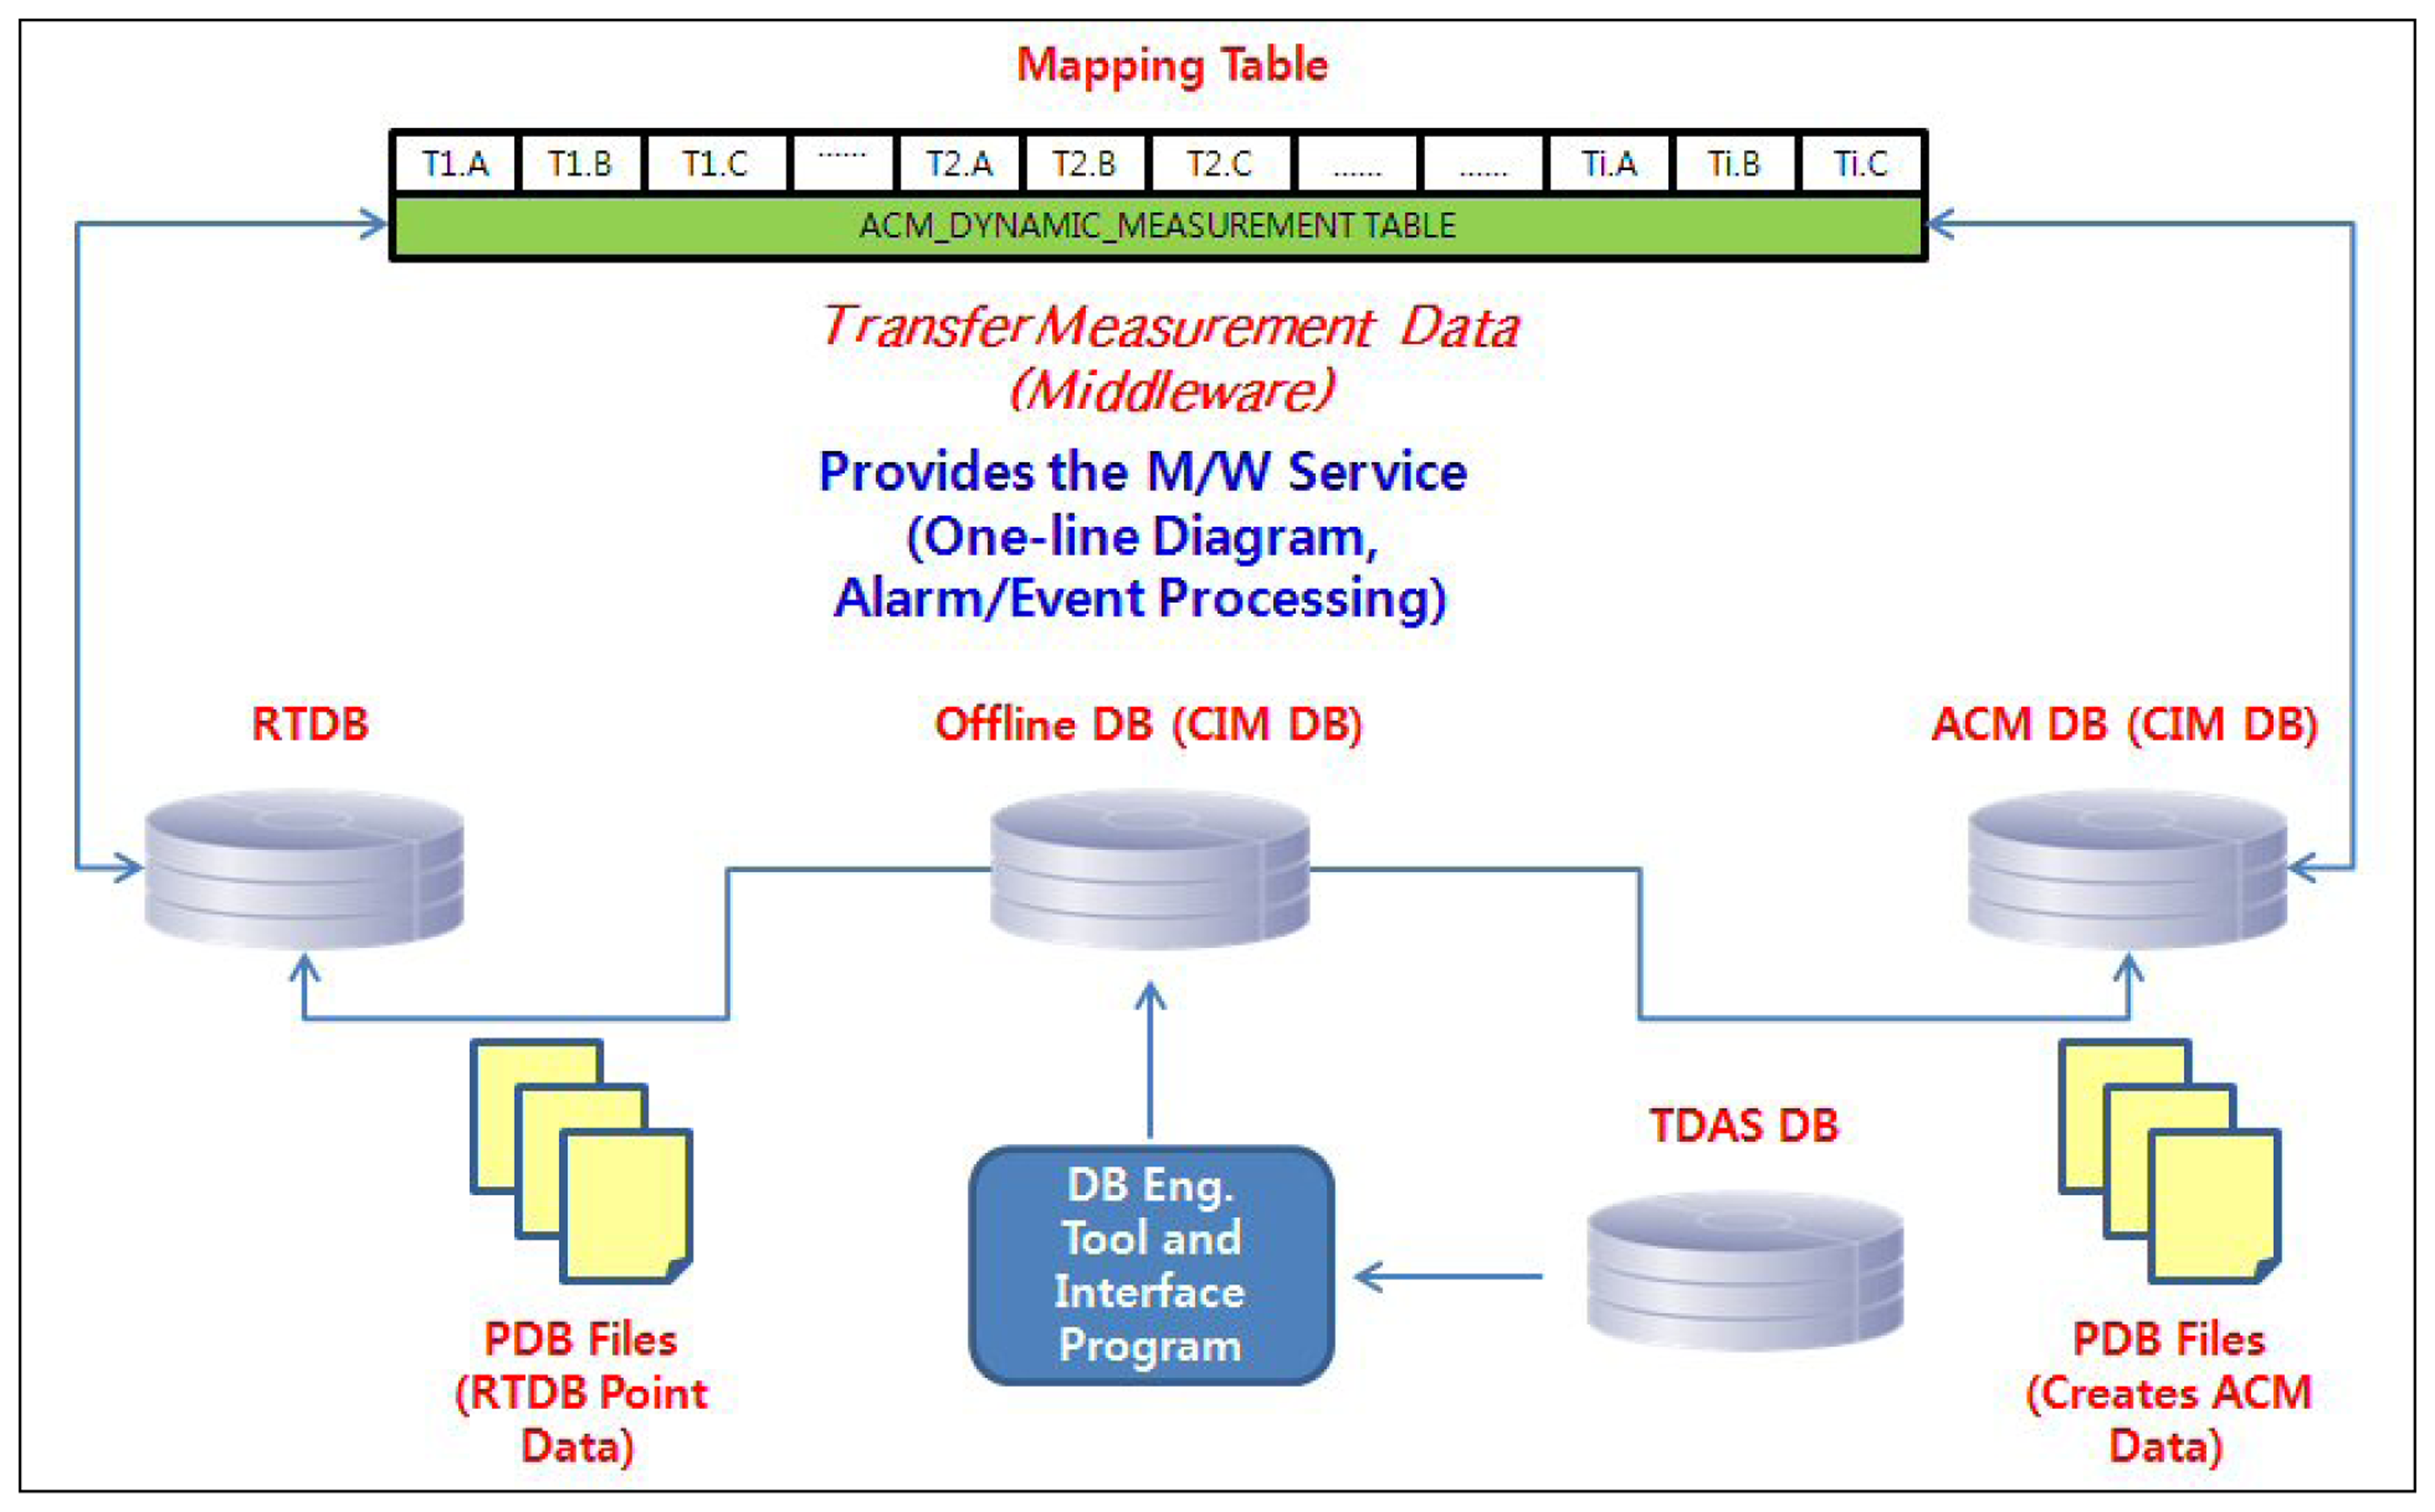
Figure 7 shows the relationship between RTDB and ACM in detail. As shown in the figure, fast data transfer can be executed by means of memory copy due to the relationship of mapping tables between RTDB and ACM.
3.3. Introduction of the System Reduction Technique
As mentioned previously, the operational unit in the KSDMS is based on a branch office as the minimum unit. One branch office has as many as 10 substations, and as many as 150 main distribution lines can be included. In the distribution system, because many simple diverged branches or connected lines are found, the database can become excessively large and the processing can be considerably time-consuming for the application programs if the lines are processed using a topology model. Furthermore, the singularity of an impedance characteristic matrix (Y matrix, gain matrix) can become large, thereby creating a problem, such as during operations of an inverse matrix. Therefore, in this paper, we proposed a system reduction model, the concept of which is as follows:
- (1)
Many simple diverged branches occur in the distribution system, and for most of the system analysis, no significant effect is observed, despite the removal of the simple diverged branches.
- (2)
Many successive branches are not connected to units (switch units, transformer, etc.) in the distribution system. From the viewpoint of system analysis, the integration of these successive branches is possible, and the line impedance and section load need to be recalculated.
- (3)
In order to analyze the voltage drop and protective coordination settings, terminals (or vulnerable branches) should be excluded from the aforementioned removal and integration.
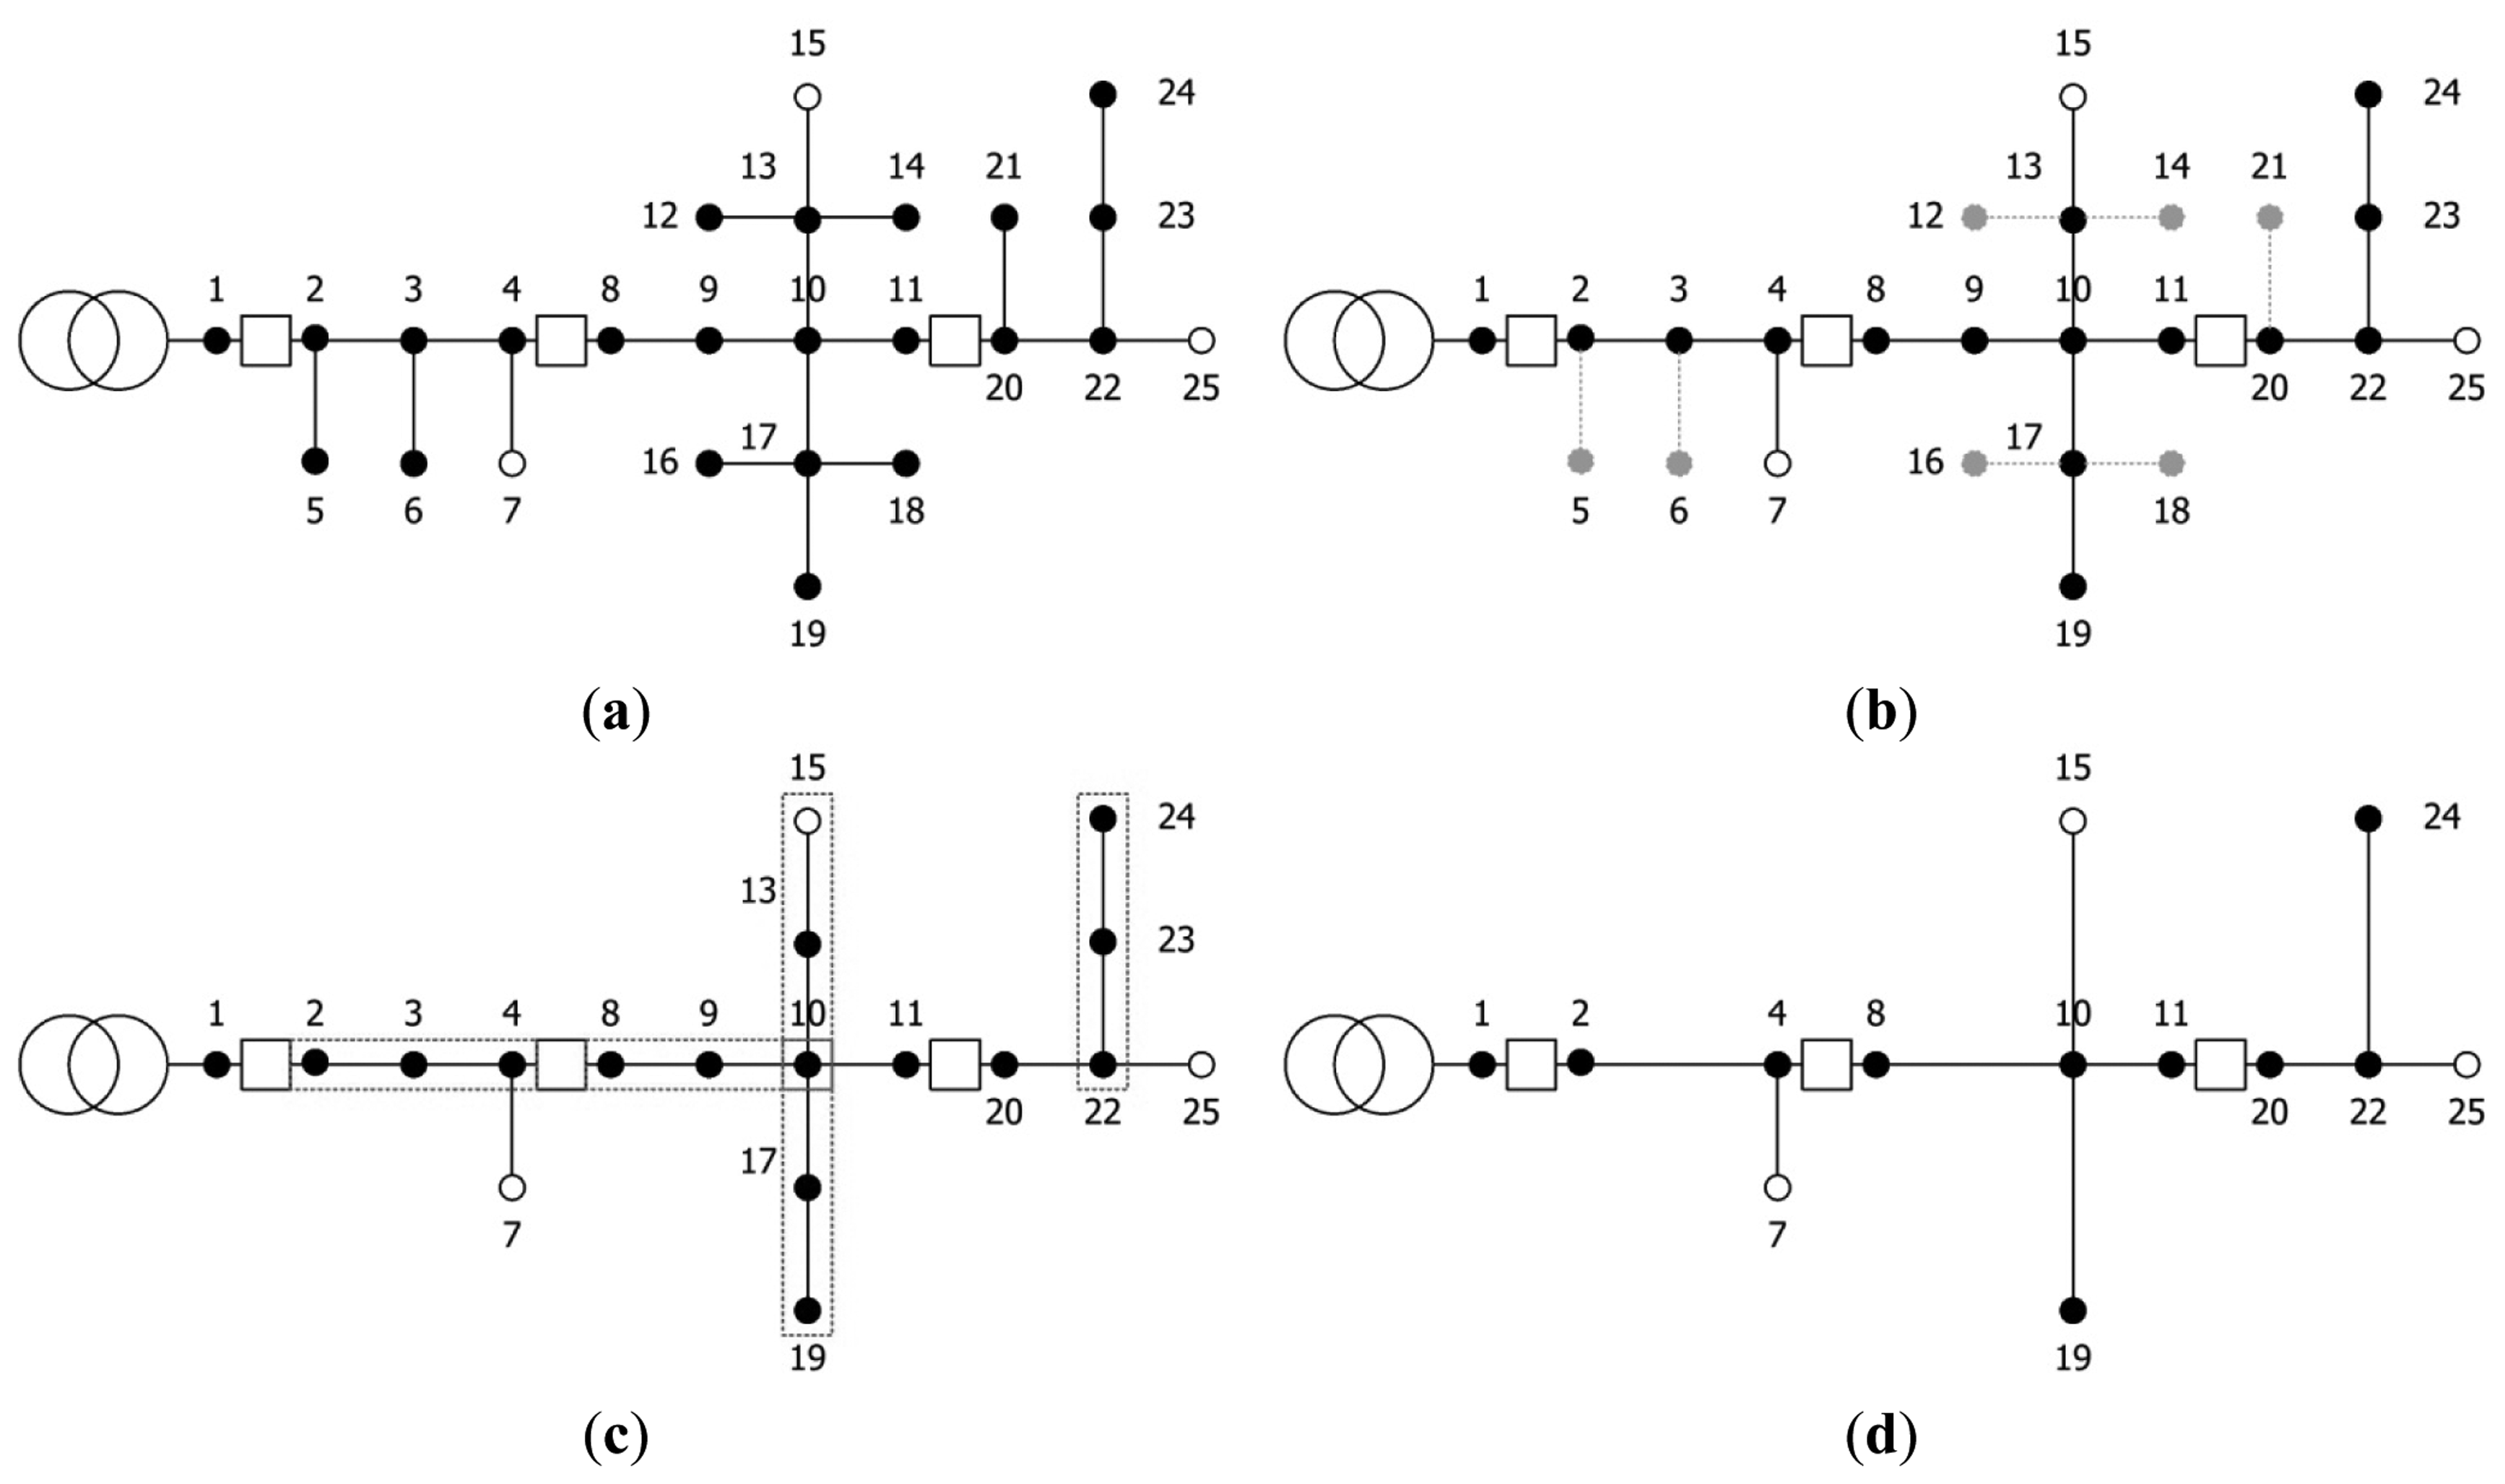
The step-by-step procedure for the system reduction method is explained below using the example shown in Figure 8. The black points in Figure 8 indicate nodes, whereas the white points indicate a terminal branch for the protective coordination setting.
| (Step 1) | Simple diverged branches are removed as shown in Figure 5b. However, terminal branches are excluded from the removal. |
| (Step 2) | Step 1 is iterated until all simple diverged branches are removed. |
| (Step 3) | Simple successive branches that are not connected to units are integrated as shown in Figure 5c, and impedance is recalculated. However, terminal branches are excluded from the removal. |
| (Step 4) | Step 3 is iterated until all simple successive branches are integrated. |
3.4. Application Common Model DB
The database model commonly used in software in the application program of the distribution operational system is named the Application Common Model (ACM). The ACM of KSDMS was designed using the modeling of the system facilities and the requirements of the application programs listed in Table 3.
The ACM is divided into hierarchical and non-hierarchical models and was designed by taking into consideration the execution of the application programs and the screen display for operators. In this study, a linked list model with an index was used for setting up the relationship between the tables, in contrast with the existing DAS [22]. Each table in the ACM database is basically configured using the following three types of data:
- (1)
Identifier of each data record in a table: successive integer values are used in general.
- (2)
Record value: name, name of upper hierarchy, and characteristic values (impedance, thermal limit, nominal voltage, etc.).
- (3)
Connection identifier to another table (or record): this identifier is divided into three indexes, the Head, Sibling, and Indirect indexes. The head index refers to a pointer pointing to the first record of the connected table, while the sibling index is a pointer pointing to the record next to the head index record. The indirect index is a pointer indicating a 1:1 link.
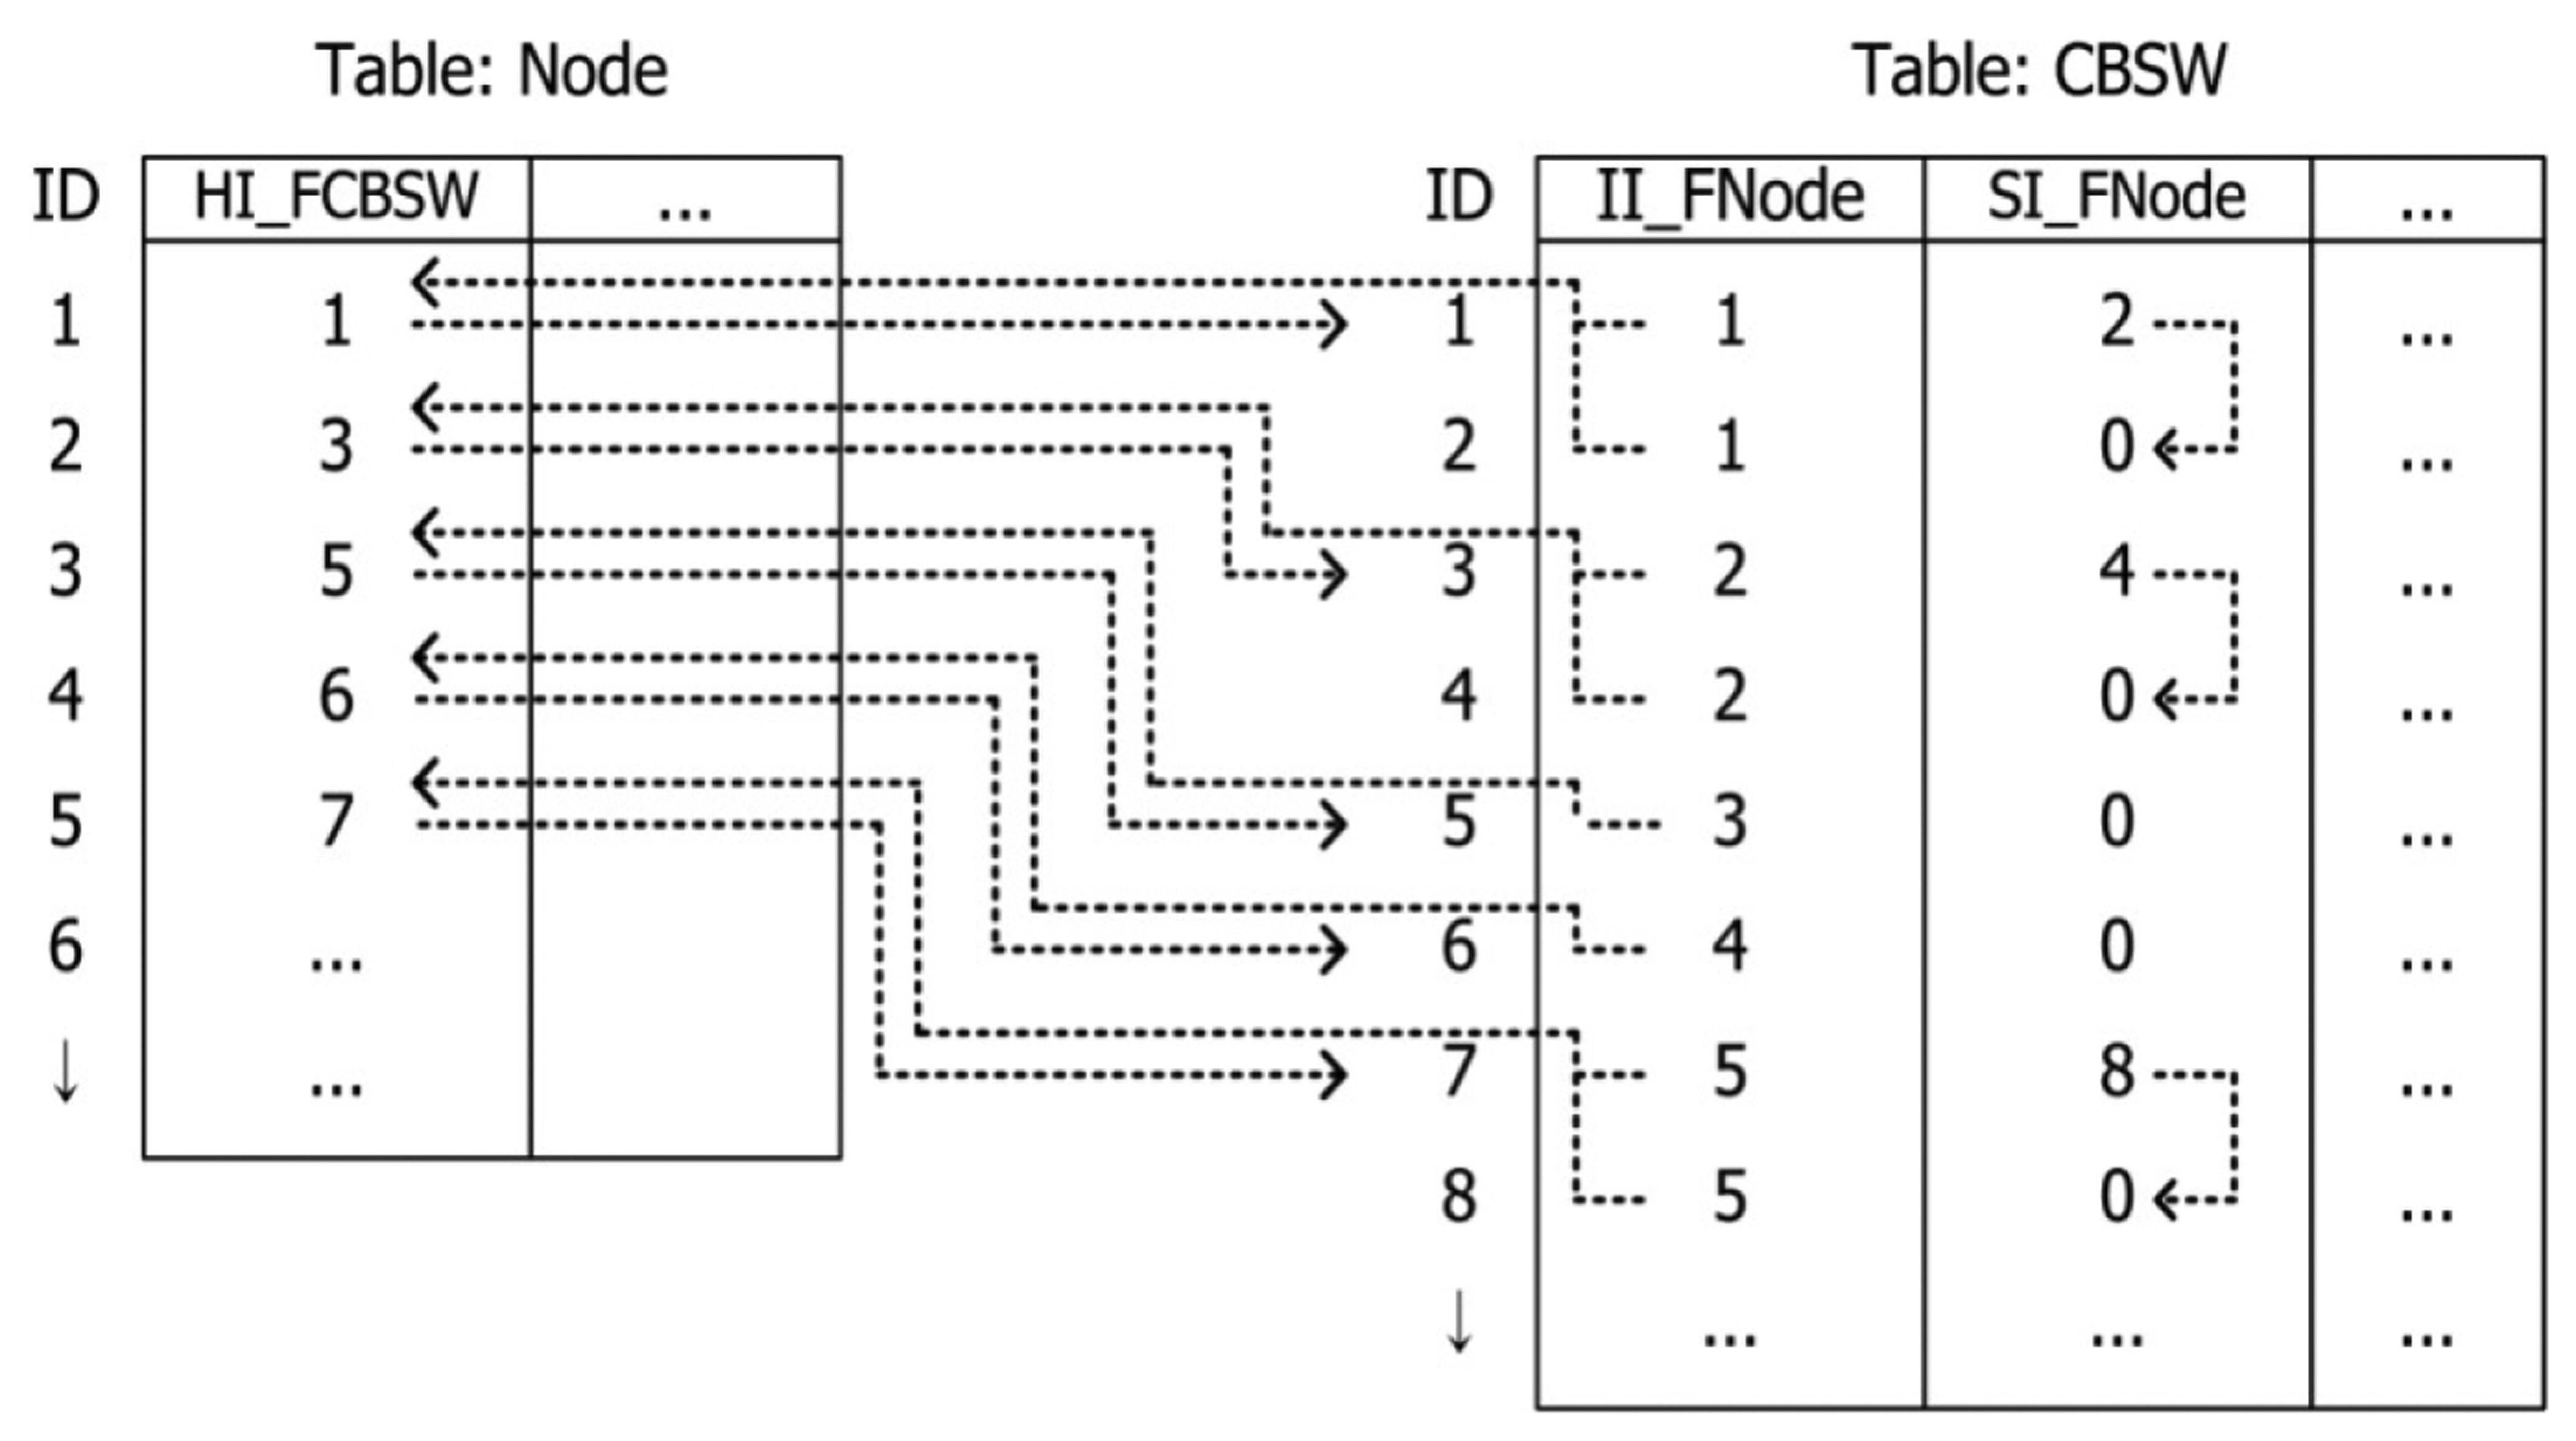
An interlinked example of tables using the link list in the ACM database is shown in Figure 9. If all switch units (CBSW) that have a specific node as a “from” side are searched, the Head index (HI_FCBSW) and the Sibling index (SI_FNode) are used to find all switch units. As shown in Figure 9, the head index at the “from” side of Node 1 indicates the No. 1 switch unit. In addition, the sibling index for Node 1 of the No. 1 switch unit is 2. Through the trace of the sibling index, switch units that have Node 1 as a “from” side node are No. 1 and 2, which are connected to each other. A sibling index of 0 implies the last record of the next record search. If topology information of switch units is searched, an indirect index (II_FNode) that points to a “from” side node can be used. The indirect index of the “from” side at the No. 5 switch unit shown in Figure 9 implies that the corresponding switch unit is connected to Node 3.
The index structure proposed in this paper is used in a database using the three types of indexes illustrated in Figure 9. This can be compared with the ID structure shown in Figure 3; the comparison is shown in Figure 10. As shown in Figure 10, the first generator assigned to “Substation 1” is the No. 1 generator followed by No. 3, 4, and 6, thereby executing four iterations in total. This is in contrast to the aforementioned search (checking whether or not the ID to be searched is the same) and is a type of repetitive operation that follows a link. With respect to “Substation 2”, two iterations are similarly performed. In the case of DB with the ID structure, 12 searches in total should be executed (because all sets of data should be searched).
As indicated in Figure 10, data extraction operations in all cases do not exceed the number of records on the side where more records are found because of the use of the link structure. Thus, even if the number of new records increases to several thousand or tens of thousands, only the repeated operations of the increased number of records is added; this differs from the case of the ID structure shown in Figure 3, which requires an exponential increase in repeated search operations. Therefore, the proposed structure is suitable for an application program for large systems of periodical system analysis and control.
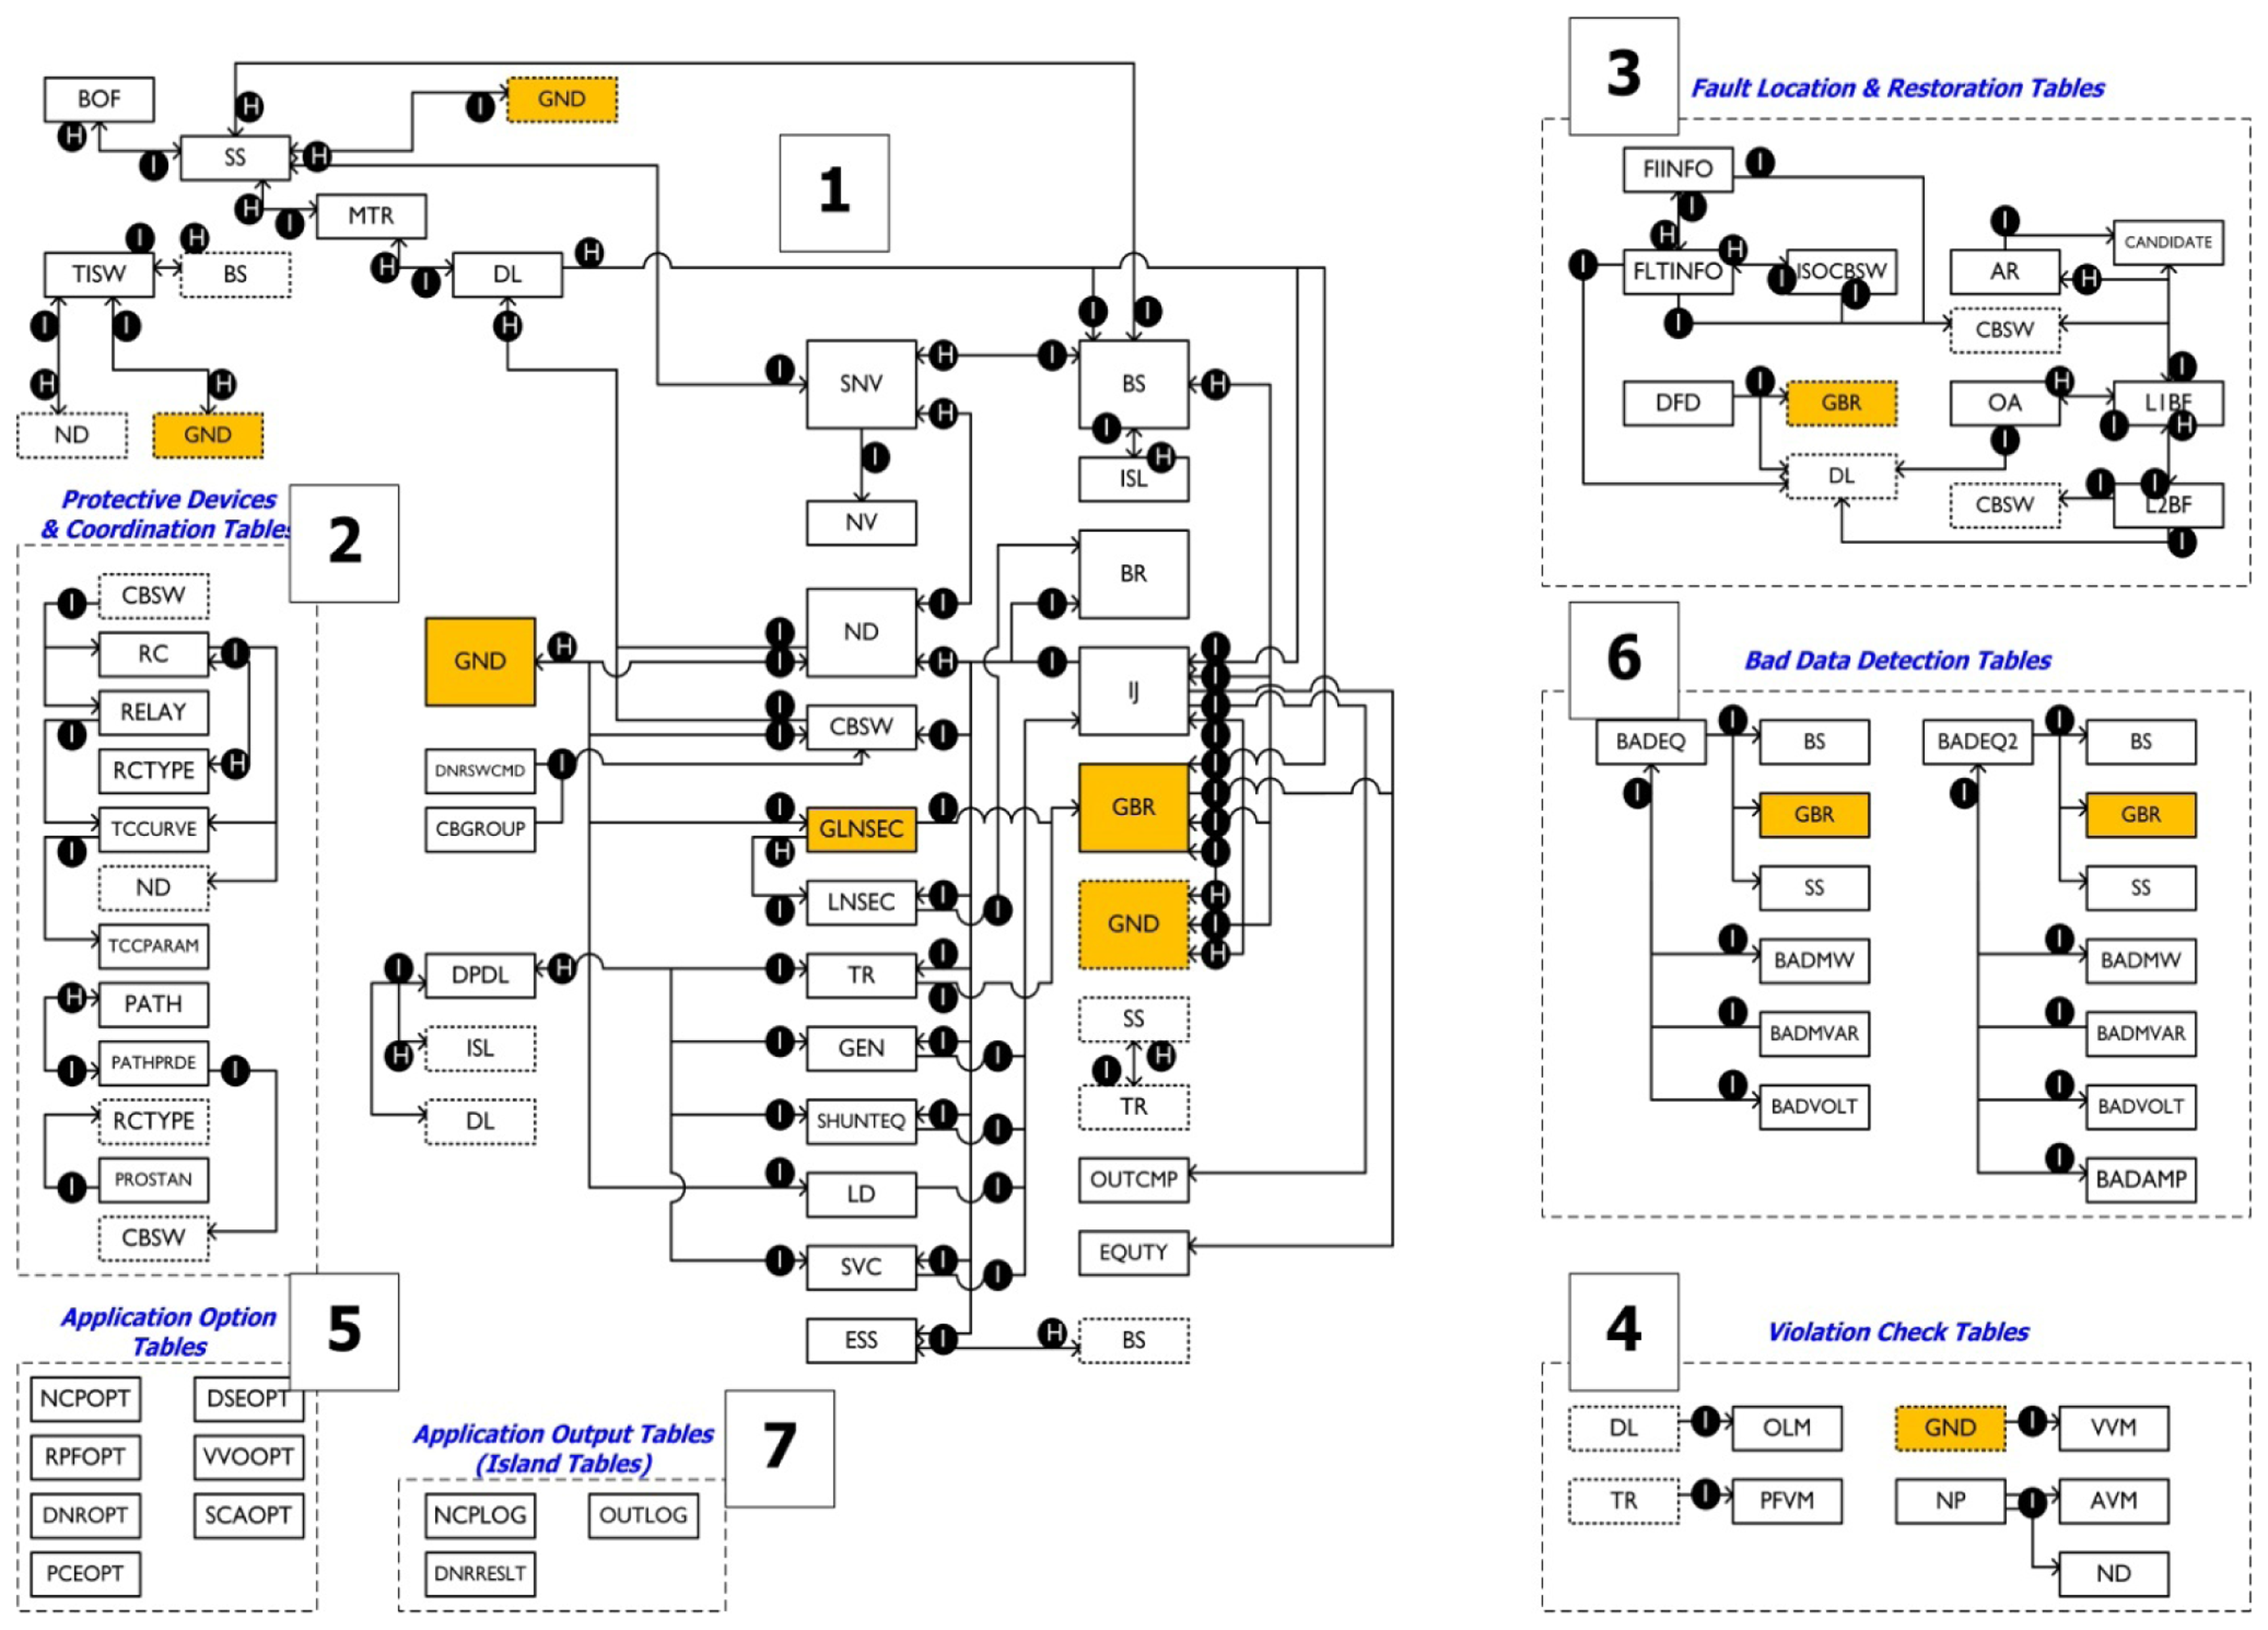
Figure 11 shows the structure of the common database. As shown in Figure 11, the database is configured as hierarchical and non-hierarchical structures. Figure 11 is explained below.
- (1)
Hierarchical structure (partial ①): Connection is realized as the distribution office (BOF) is placed into the highest hierarchy followed by the substations (SS), main transformer (MTR), and distribution line (DL). For the topology process, equipment including nodes and switch units is assigned to a substation, while the nodes, buses, branches (lines and transformers;, and injection (generator, load, shunt equipment, SVC, etc.) are assigned to a distribution line for screen display. The switch units responsible for connection between substations are named interconnection switches (TISW) and are assigned to BOF.
- (2)
System protection information (partial ②): Based on the switch units, the connection relationships between tables (TCCURVE, PATH, SECT, etc.) are configured for the protection equipment (PRED) and their setting.
- (3)
Fault section identification and system recovery information (partial ③): The operation information of protection equipment and FI information of each switch are configured using the Tables fault information (FLTINFO) and FI information (FIINFO;, and the operation results are stored in ISOCBSW. In addition, switch operation solutions are stored in CANDIDATE for system recovery.
- (4)
Alarm violation detection (Partial ④): This is configured with a table to store violation information such as voltage, overload, and MTR power factor violation, detected by the application programs.
- (5)
Option and log information (Partial ⑤): This is configured with a table of the execution option and execution result log information of the application programs that are not related to other tables. The operation result of system reconfiguration (DNR; is stored in Table DNRSWCMD.
- (6)
Error data (Partial ⑥): This table is configured with the information of the measurement error data detected via the status estimation operation.
- (7)
Independent table (Partial ⑦): This is configured with independent tables such as the operation execution log information.
The aforementioned tables for system reduction are defined in the shaded tables shown in Figure 11. The areas outlined by dashed lines in Figure 11 represent duplicate tables in the figure. The nodes and branches following the completion of the system reduction process are named “GND” and “GBR”. GND is in a relationship of 1:n with the Table Node (ND) before reduction, while GBR is in a relationship of 1:n with the Table BR. Table Injection (IJ) is automatically created in compliance with GND since it is created during DB creation. GND and GBR are also in a relationship of 1:n. The application program operation result shown earlier in Table 2 is inputted and outputted through the parallel table structure shown in the hierarchical structure of Figure 11. Figure 12 shows the parallel table structure. As shown in Figure 12, the parallel table structure includes a number of static and dynamic tables in a single table group, and the number of records in each table is the same as in the other tables. This functions to reduce the amount of data to be simultaneously inputted and outputted in the application program. The data in the detailed tables of the same record in the parallel table group refer to the data of the same object.
Other than the application programs of system analysis and control shown in Table 2, the DMS requires basic line monitoring and single line diagrams to display the results of line monitoring.
4. Field Test of KSDMS Database
It can be said that the DB was actually tested in the experiments for the KSDMS. Figure 13 shows the execution result of the application programs using 65 sets of D/L data in the Jeju branch of KEPCO. For the data for the test of KSDMS DB performance, synchronous D/L data (EMS data) were used in units of 1 min for two weeks in November 2011; they were obtained from the Korea Power Exchange (KPX). The measurement data (P/Q) per D/L were considered to be the total load of each D/L, and the data were distributed to the sub-load, thereby performing load flow to create the voltage, current, and phase data. Table 4 shows the facility status for tested systems.
Table 5 summarizes the database size before and after the reduction, as mentioned in Section 3.2. On the basis of the bus, an approximately 40% reduction effect was acquired. The execution speed of the real-time application programs using the proposed database model is examined as shown in Table 6. This table shows that all the application programs were executed within two seconds (topology processor: <1 s, load estimator: <2 s, state estimator: <2 s, real-time power flow: <2 s, voltage-VAr optimization: <2 s) with respect to the tested systems of approximately 5000 buses.
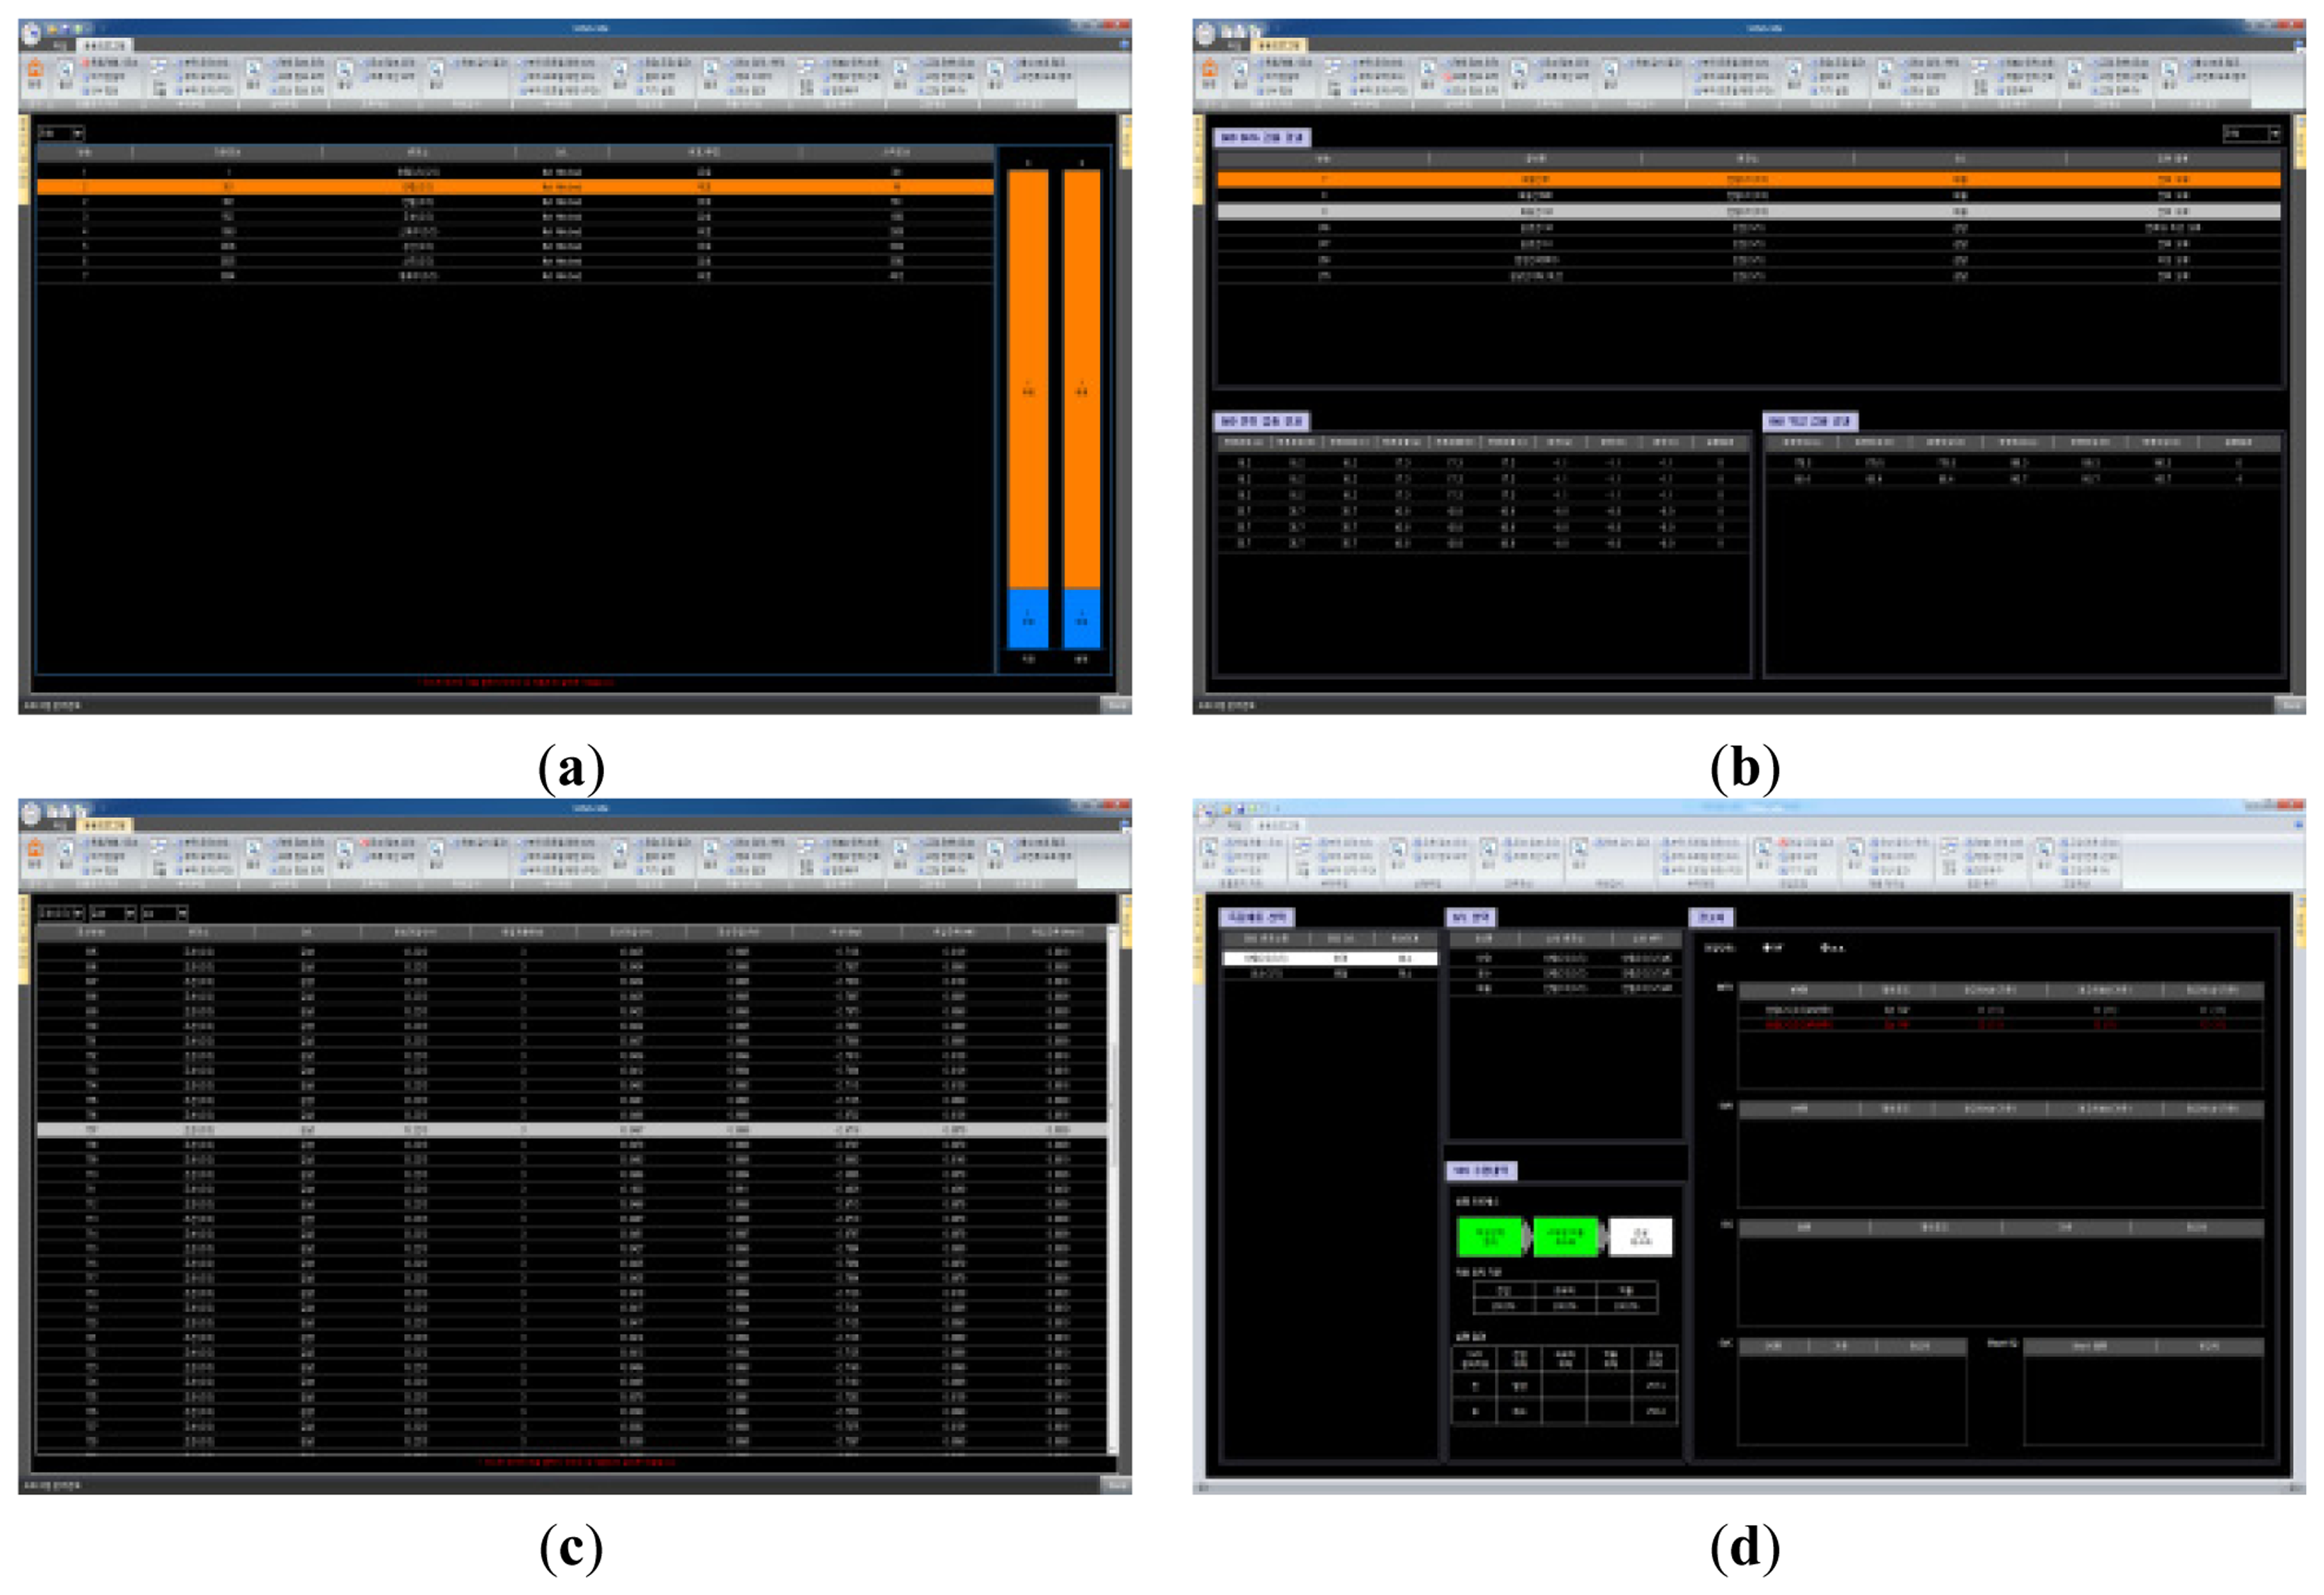
Figure 14 shows the execution result of the application programs in the SDMS system that adopted the proposed database model. It was validated that functional executions of the application programs developed in the KSDMS were performed without any problems.
5. Conclusions
This paper summarized the development and testing of the database in the KSDMS, which is a next-generation distribution operational system. The DB model proposed in this paper was explained by categorizing the various steps involved: CIM-based off-line DB, PDB for the DB development of the operation server, ACM DB for the application program execution, and RTDB for real-time server operation and data interconnection with terminals. The problem of the dependence of DB on the middleware, as experienced by the existing DAS, was solved by configuring RTDB and ACM and separating a DB server while running stable operations due to the completely redundant design.
Furthermore, the design of the ACM DB proposed in this paper focused on the development of a common model that can be used by all application programs, as well as a data reduction method that can increase the execution speed and the convergence of the application programs. The common model was designed by taking into consideration the topological structure and facility models of the distribution system and by considering that it consisted of hierarchical and non-hierarchical structures. Through the case study, using a large distribution real system, the proposed database model was validated as having no difficulty with application to a real environment, and the database size reduction and rapid execution of the application programs was proven through the reduction method. First, the analysis and control via the real-time and periodical application program execution could be achieved and compared to the existing distribution system operation system, which was run by existing line monitoring and fault recovery functions through the application of the database model proposed in this paper. Second, a distribution system that interconnected distributed power systems could be designed by accepting models such as distributed power and new control equipment. Thirdly, the memory burden of accepting a large database was relieved and the convergence and execution speed of the application programs were increased through system reduction.
In cases where the KSDMS using a real-time database as proposed in this paper is applied to real-system operations, various issues can arise, such as the increase of the establishment cost for the distribution control center, the operator's training to teach how to operate the new system, the development of the related HMIs, and the agenda for the maintenance/repair procedure of the new system. However, the introduction of the proposed system can result in the following operational advantages. First, real-time analyses and control operations are possible to enable adaptation to new equipment, such as integrating renewable energy resources, electric vehicles, and advanced metering infrastructure (AMI), which should be introduced into the electric power distribution system in the near future. Second, various application programs can be loaded into the system to support the operational tasks and decision-making of new operators who lack experience, and to enable the system operation using these support programs. Third, the interoperability of the system can be ensured, which substantially facilitates the application of new field devices. A recent trend in the field of power distribution networks leads us to believe that the additional burden will be easily outweighed by the abovementioned advantages that have been made available by the introduction of the new operating system; the establishment of a real-time database as proposed in the present paper is considered as an essential technique of this process.
Acknowledgments
This work was supported by Korea Institute of Energy Technology Evaluation & Planning (KETEP) grant funded by Korea Government Ministry of Trade, Industry & Energy (No. 20123010020080).
Conflicts of Interest
The authors declare no conflict of interest.
References
- Kim, H.-Y.; Ko, Y.-S.; Sohn, S.-K. Database for distribution system planning and operation. Trans. Korean Inst. Electr. Eng. 1988, 37, 513–520. [Google Scholar]
- Xing, W.; Yu, Y.; Xiao, J.; Wang, R. A PC-based distribution automated mapping/facility management system. Int. J. Electr. Power Energy Syst. 1998, 20, 405–409. [Google Scholar]
- Kamei, K.; Nakamura, Y.; Abe, S.; Takeda, S.; Tsukamoto, J.; Kage, T. Highly interactive operator workstation for distribution automation system using spatial data management. IEEE Trans. Power Syst. 1992, 7, 180–186. [Google Scholar]
- Kawamura, T.; Wakizono, R.; Tsuchiya, T.; Tanaka, T. Evaluation of Object-Oriented Database for Distribution Network Monitoring System. Proceedings of Intelligent Systems Applications to Power Systems, Orlando, Florida, USA, 28 January–2 February 1996.
- Patton, J.B.; Rizy, D.T.; Lawler, J.S. Applications software for modeling distribution automation operations on the Athens utilities board. IEEE Trans. Power Deliv. 1990, 5, 1019–1025. [Google Scholar]
- Choi, S.-Y. An feeder automation system using active database. J. Korean Inst. Illum. Electr. Install. Eng. 2003, 17, 94–102. [Google Scholar]
- Kim, J.-B.; Choi, S.-Y. Distribution automation system using web based active database. J. Inst. Electron. Eng. Korea 2004, 41, 103–110. [Google Scholar]
- Moon, Y.-H.; Cho, B.-H.; Park, M.-H.; Ryn, H.-S.; Ha, B.-N.; Lim, S.-I. Fault Restoration Algorithm Using Fast Tracking Technique Based on the Tree-Structured Database for the Distribution Automation System. Proceedings of the IEEE Power Engineering Society Summer Meeting, Seattle, WA, USA, 16–20 July 2000.
- Ko, Y.-S. Development of feeder automation software considering the diversity events of distribution systems. Trans. Korean Inst. Electr. Eng. 2003, 52A, 463–470. [Google Scholar]
- Hsu, Y.-Y.; Chen, L.-M.; Chen, J.-L.; Hsueh, M.-C.; Lin, C.-T.; Chen, Y.-W.; Chen, J.-J.; Liu, S.-S.; Chen, W.-C.; Chang, I.-S. Application of a microcomputer-based database management system to distribution system reliability evaluation. IEEE Trans. Power Deliv. 1990, 5, 343–350. [Google Scholar]
- McDonald, J.; Fan, J. Integrated Distribution Automation/Distribution Management Systems and Advanced Applications in Smart Distribution (UU104); DistribuTECH: San Diego, CA, USA, 2013. [Google Scholar]
- Mamo, X.; McGranaghan, M.; Dugan, R.; Maire, J.; Devaux, O. A Roadmap for Development Real Time Distribution System Simulation Tools for the Smart Grid. Proceedings of the International Conference on Electricity Distribution, Frankfurt, Germany, 23–24 June 2008.
- Sebastian, M.; Devaux, O.; Huet, O. Description and Benefits of a Situation Awareness Tool Based on a Distribution State Estimation and Adapted to Smart Grids. Proceedings of the International Conference on Electricity Distribution, Frankfurt, Germany, 23–24 June 2008.
- Fan, J. The evolution of distribution. IEEE Power Energy Mag. 2009, 7, 63–68. [Google Scholar]
- Ha, B.-N. Large-scale distribution automation system. Electr. J. 2002, 306, 18–26. [Google Scholar]
- Geisler, K.I.; Neumann, S.A.; Nielsen, T.D.; Bower, P.K.; Hughes, B.A. A generalized information management system applied to electrical distribution. IEEE Comput. Appl. Power 1990, 4, 9–13. [Google Scholar]
- Wang, X.; Schulz, N.; Neumann, S. CIM extensions to electrical distribution and CIM XML for the IEEE radial test feeders. IEEE Trans. Power Syst. 2003, 18, 1021–1028. [Google Scholar]
- Singh, N.; Kliokys, E.; Feldmann, H.; Kussel, R.; Chrustowski, R.; Jaborowicz, C. Power system modeling and analysis in a mixed energy management and distribution management system. IEEE Trans. Power Syst. 1998, 13, 1143–1149. [Google Scholar]
- Ha, B.-N. Development of Master Station for Intelligent Distribution Automation System; Final Report, TR.H02.C2010.1344; Korea Electric Power Corporation: Daejeon, Korea, 2010. [Google Scholar]
- Ha, B.-N. Comparison with DAS technologies of domestic and foreign countries. Electr. J. 2002, 308, 47–56. [Google Scholar]
- Song, I.-K. Smart Distribution Management System; Final Report, TR.1324.S2012.0346; Korea Electric Power Corporation: Daejeon, Korea, 2012. [Google Scholar]
- Soman, S.A.; Khaparde, S.A.; Pandit, S. Computational Methods for Large Sparse Power Systems Analysis-An Object Oriented Approach; Kluwer Academic Publishers: Boston, MA, USA, 2002. [Google Scholar]


| Items | CIM | ACM | ||
|---|---|---|---|---|
| Topology | 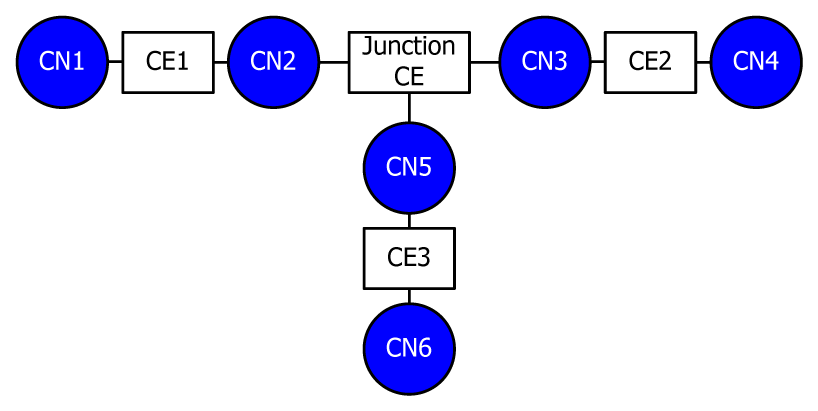 | 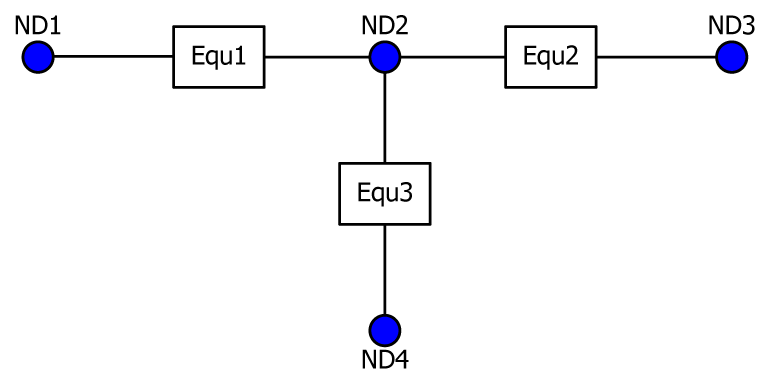 | ||
| CIM Network Connectivity |  | |||
| ACM Network Connectivity | 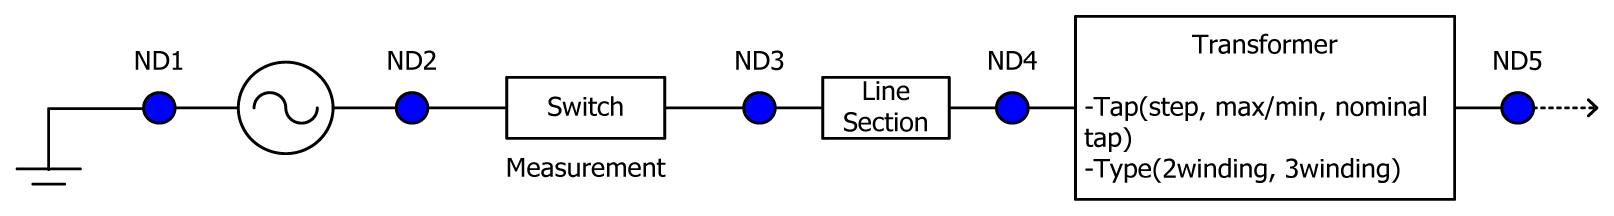 | |||
| ACM Network Modeling | ||||
| Node(Bus) | 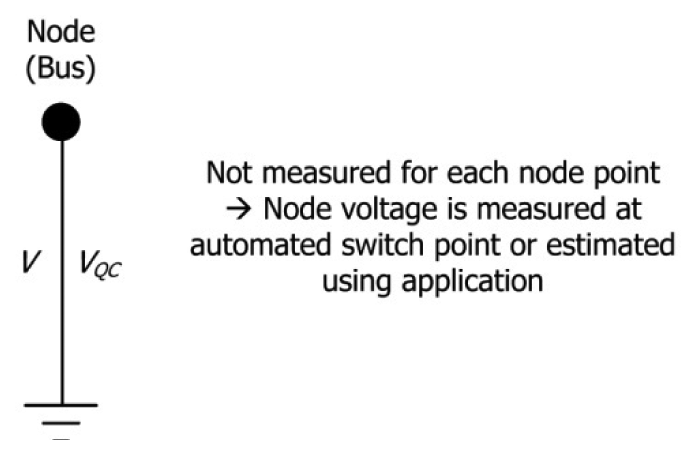 | Switches | 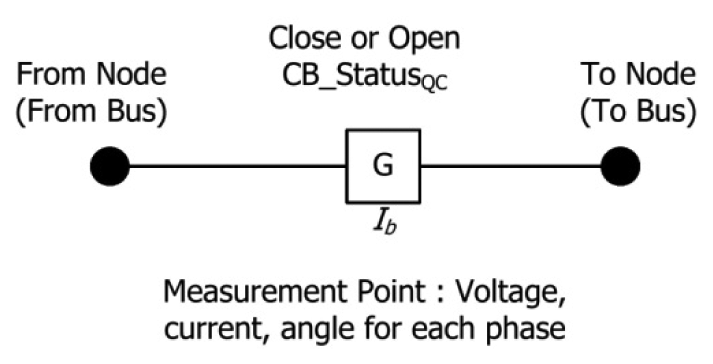 | |
| Line | 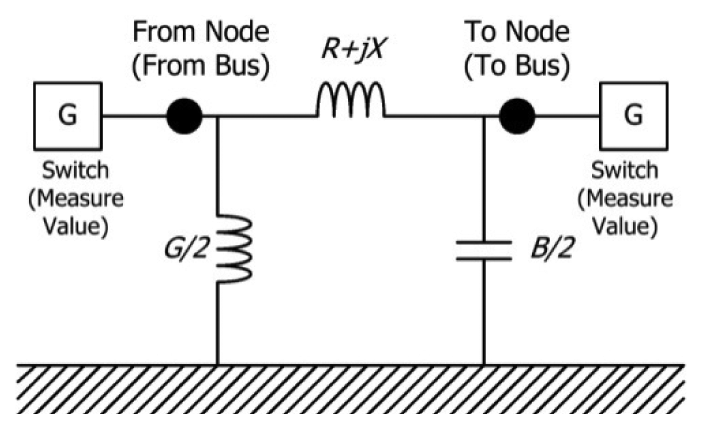 | Transformer (2 winding) | 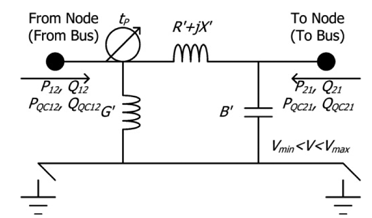 | |
| Tie Switch |  | Generator | 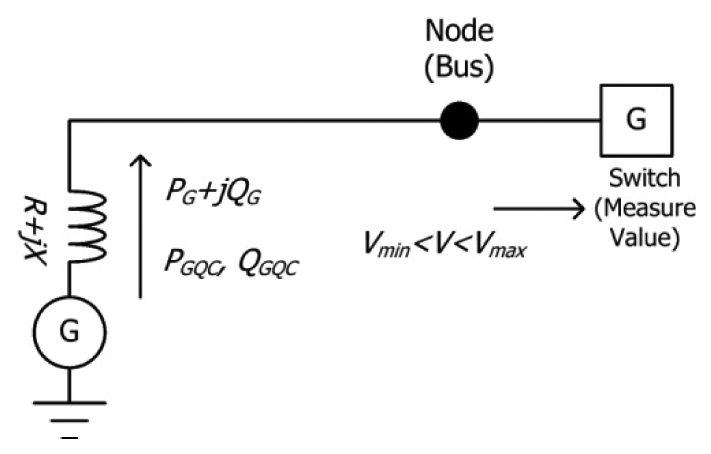 | |
| Shunt Capacitor |  | SVC | 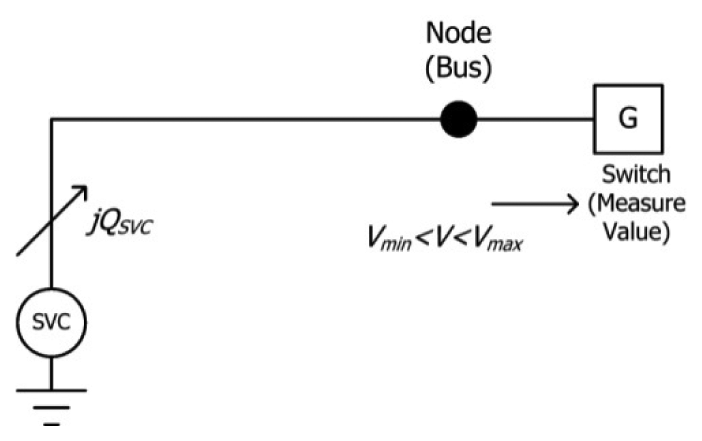 | |
| Load | 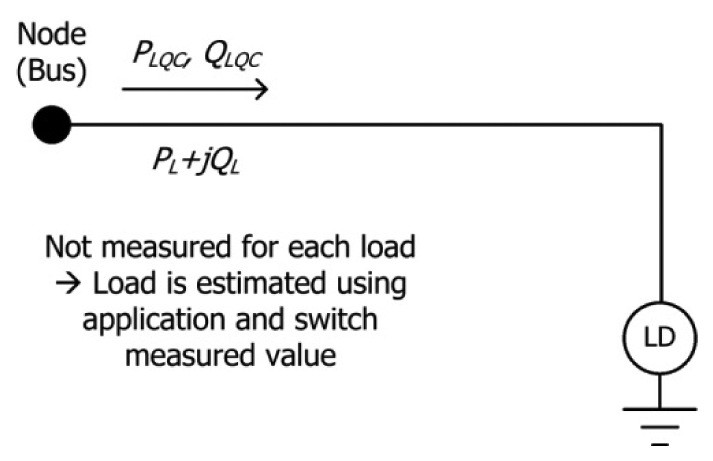 | |||
| Package category | Modified part |
|---|---|
| Core | All equipment is inherited from IdentifiedObject and modeled as it is divided by electrical connection relationships. IEC61970 Bay was modified into DistributionLine to place distribution facilities at DistributionLine in compliance with the current distribution management system. |
| Generation | To process the distributed power operated as included in the distribution line, GeneratingUnit model of IEC61970 was modified and applied, and facilities that have connection relationships between distributed power and power generation to be connected were modeled to be placed in the lower hierarchy. |
| Meas | This was modeled to enable the use of different categories of measurement with the point configuration of the currently available distribution FRTU, and the points are divided as follows:
|
| Protection | This was modeled to set the operation status and condition of Relay and Reclose among the circuit breakers or switches. |
| SCADA | This was modeled to set up a connection relationship and management structure that can measure corresponding information through FRTU/FIED while DCP was added to the model. |
| Wires | This was modeled to add the LineModel and TransformerModel of IEC61968 to accept the LineSegment and Transformer of the distribution facility. |
| Application | Requirement |
|---|---|
| Topology Processor | Function: Creation of electrical bus/links/independent system, validation check |
| Input: Switch condition, facility connection information, user option information | |
| Output: Link between facility and bus, independent system-related data | |
| State Estimator | Function: Voltage, current bad data detection, voltage/load estimation |
| Input: Topology process result, various measurements, pseudo-measurement | |
| Output: Bad data process information, summary of status estimation, load estimation | |
| Real-time Power Flow | Function: Performing load flow per independent system, convergence-related setting function |
| Input: Bus, branch, injection information, facility parameters | |
| Output: Summary per independent system/transformer/MTr/DL, detection of violation amount | |
| Voltage VAr Optimization | Function: Voltage violation resolution, switching and loss minimization |
| Input: Load flow result, control unit information, user setting values | |
| Output: Recommended value for control, summary of system status before and after recommended value application | |
| Protective Coordination | Function: Over-current and communication protection coordination setting function |
| Input: Protection device characteristic information, fault current calculations, the existing setting values | |
| Output: Setting value of protection devices | |
| Load Pattern | Function: Generation of load pattern over weekday and weekend period and D/L |
| Input: Result of status estimation and load flow, execution time | |
| Output: Data of load pattern for unit of 15 minutes per day | |
| Fault Location | Function: Identification of fault occurrence section, FI error data filtering |
| Input: Information of protection devices, values of switch unit FI and fault current | |
| Output: Switch list for fault section and isolation of fault section | |
| Service Restoration | Function: Determination of the spare capacity of interconnected lines, recovery solution output function |
| Input: Protection devices, switch units, information of section load and interconnected lines | |
| Output: Recommended value of switch operation for recovery | |
| Network Reconfiguration | Function: Loss minimization, recommendation of reconfiguration for the purpose of load balancing |
| Input: Topology information, load pattern data | |
| Output: Recommended value of switch operation for recovery | |
| Short Circuit Analysis | Function: IEC60909 compliant fault analysis, renewable fault contribution calculation |
| Input: Topology information, facility impedance information, fault contribution, percentage of inverter-interconnected distributed power (user) | |
| Output: Calculation of fault current for each bus/lines/fault types/per–time | |
| Equipment | Type | Number of Devices |
|---|---|---|
| Substation | - | 7 |
| Main Transformer | - | 17 |
| Distribution Line | - | 69 |
| Switch | Overhead Line Switch | 1350 |
| Recloser | 164 | |
| Multi-Circuit Switch | 542 | |
| Multi-Circuit Breaker | 2 | |
| Transformer | Overhead | 10 |
| Underground | 435 |
| Type | Before Reduction | After Reduction | Reduction % |
|---|---|---|---|
| Node | 12,343 | 8,240 | 33 |
| Branch | 8,970 | 4,867 | 46 |
| Injection | 10,283 | 5,858 | 43 |
| Bus | 8,401 | 4,874 | 42 |
| Application | Average Running Speed (for 4,874 buses network) |
|---|---|
| Network topology processor | Less than 1 s |
| Section load estimator | Less than 2 s |
| Distribution state estimator | Less than 2 s |
| Real-time power flow | Less than 2 s |
| Voltage-VAr Oprimization | Less than 2 s |
© 2014 by the authors; licensee MDPI, Basel, Switzerland. This article is an open access article distributed under the terms and conditions of the Creative Commons Attribution license ( http://creativecommons.org/licenses/by/3.0/).
Share and Cite
Yun, S.-Y.; Choi, J.-H. Development and Field Test of a Real-Time Database in the Korean Smart Distribution Management System. Energies 2014, 7, 1852-1875. https://doi.org/10.3390/en7041852
Yun S-Y, Choi J-H. Development and Field Test of a Real-Time Database in the Korean Smart Distribution Management System. Energies. 2014; 7(4):1852-1875. https://doi.org/10.3390/en7041852
Chicago/Turabian StyleYun, Sang-Yun, and Joon-Ho Choi. 2014. "Development and Field Test of a Real-Time Database in the Korean Smart Distribution Management System" Energies 7, no. 4: 1852-1875. https://doi.org/10.3390/en7041852