Article

New Power Quality Analysis Method Based on Chaos Synchronization and Extension Neural Network

Department of Electrical Engineering, National Chin-Yi University of Technology, No. 57, Sec. 2, Zhongshan Rd., Taiping Dist., Taichung 41170, Taiwan
*
Author to whom correspondence should be addressed.
Energies 2014, 7(10), 6340-6357; https://doi.org/10.3390/en7106340
Submission received: 25 August 2014 / Revised: 18 September 2014 / Accepted: 23 September 2014 / Published: 8 October 2014
(This article belongs to the Special Issue Microgrids)

Abstract

:
A hybrid method comprising a chaos synchronization (CS)-based detection scheme and an Extension Neural Network (ENN) classification algorithm is proposed for power quality monitoring and analysis. The new method can detect minor changes in signals of the power systems. Likewise, prominent characteristics of system signal disturbance can be extracted by this technique. In the proposed approach, the CS-based detection method is used to extract three fundamental characteristics of the power system signal and an ENN-based clustering scheme is then applied to detect the state of the signal, i.e., normal, voltage sag, voltage swell, interruption or harmonics. The validity of the proposed method is demonstrated by means of simulations given the use of three different chaotic systems, namely Lorenz, New Lorenz and Sprott. The simulation results show that the proposed method achieves a high detection accuracy irrespective of the chaotic system used or the presence of noise. The proposed method not only achieves higher detection accuracy than existing methods, but also has low computational cost, an improved robustness toward noise, and improved scalability. As a result, it provides an ideal solution for the future development of hand-held power quality analyzers and real-time detection devices.

1. Introduction

The term power quality is commonly defined as “the degree of user satisfaction with the quality of the power supplied by power utilities” and is generally quantified in terms of the reliability, compatibility or fundamental characteristics of the power supply signal [1]. Ensuring the quality of the power supply is essential in meeting the needs of modern high-tech industries and high-speed electrified transportation systems [1,2,3]. However, in practice, extreme weather conditions, natural disasters, human factors, external object contact, equipment deterioration, and non-linear loads may result in non-fundamental frequency current flows into the power system. As a consequence, the power system signal may exhibit various quality disturbances, including voltage sag, voltage swell, interruption and harmonics [4]. Consequently, a requirement exists for systems capable of performing the real-time monitoring and analysis of the power supply quality such that appropriate remedial actions can be taken as required.
To accurately analyze and diagnose the power quality disturbance, it is essential that the power system signal is properly detected and classified [5]. However, most if not all existing power quality analysis instruments identify the state of the power system signal based on long-term voltage measurements (e.g., the root-mean-square or variance), or by detecting changes in the voltage peak or frequency over time. Furthermore, in accurately analyzing different power quality problems, it is commonly necessary to measure multiple electric power characteristics simultaneously. As a result, the power quality monitoring and analysis process is both time consuming and complex [6,7]. In [8], a method was proposed for extracting the unique features associated with particular power quality disturbance events from the frequency characteristics of the voltage and/or current waveform of the power supply system by means of Fourier and wavelet transforms. However, in implementing the proposed method, the voltage/current waveforms must be monitored continuously over a long period of time, and thus the goal of real-time power analysis cannot be achieved. Moreover, the correlation between the frequency characteristics of the power system signal and the time-domain is lost following the transformation process. This problem can be resolved by means of the Short-Time Fourier Transform (STFT) method proposed in [9]. However, the window used in the STFT method has a constant size. As a result, when a higher resolution of the time-domain is required, the resolution of the frequency-domain is inevitably reduced. Consequently, the STFT method is poorly suited to the analysis of instantaneous electric power signals or to the detection of electric power signals with significant noise. To address the limitations of the STFT method, Yilmaz et al. [10] proposed a lifting-based wavelet transform method for power quality analysis, in which the window width was optimized in such a way as to provide a higher time-domain resolution for the high frequency part of the signal and a higher frequency-domain resolution for the lower frequency part of the signal. Many researchers have used the wavelet transform method to extract the fundamental characteristics of the power signal for subsequent power disturbance event classification by means of artificial intelligence (AI) algorithms such as Neural Networks (NNs) [11], Fuzzy Theoretic (FT) schemes [12], and Genetic Algorithms (GAs) [13]. However, the wavelet transformation process not only yields a large number of characteristic features, but also has poor robustness to noise. As a result, the complexity of the AI classification process is increased and the accuracy of the classification results reduced.
Chaos detection theory has been applied to many different fields in recent years; including that of power quality disturbance analysis [14]. Huang et al. [15] proposed a chaos synchronization (CS)-based detector for classifying power quality disturbances, in which a Particle Swarm Optimization (PSO) algorithm was used to optimize the detector parameters. The experimental results showed that the proposed detector had both a high classification accuracy and good robustness. Similarly, Yalcin et al. [16] proposed a power quality analysis system in which the power signal was processed using a CS method and was then classified by a Particle Swarm Optimization Probabilistic Neural Network (PSO-PNN). In existing CS-based power quality analysis systems, the detection results are based on an observation of the underlying chaos waveform. However, identifying the nature of the power quality disturbance requires a complex classification process. As a result, real-time power quality disturbance monitoring and analysis is not easily achieved. Moreover, the existing literature contains no proposals for CS-based detection schemes with good robustness towards noise in the power supply signal.
To resolve the limitations of the existing methods presented in the literature, the present study proposes a new power quality analysis system based on a CS detection method and an Extension Neural Network (ENN) [16,17]. In the proposed approach, the CS method is used to identify noise within the power signal and to extract a small number of characteristic features from the power supply waveform. The extracted features are then classified by the ENN in order to determine the state of the power supply signal, namely normal, voltage sag, voltage swell, interruption or harmonics. In contrast to existing methods, the CS-based feature extraction method has an improved robustness towards noise and yields a smaller (and thus more reliable) set of characteristic features for subsequent classification purposes. Moreover, in contrast to most existing AI algorithms, the ENN classification scheme proposed in the present study utilizes an extension distance metric rather than the conventional Euclidian distance to evaluate the similarity between the test data and the cluster domain. As a result, the ENN has both a shorter learning time and a more rapid detection time than existing neural network (NN)-based approaches.

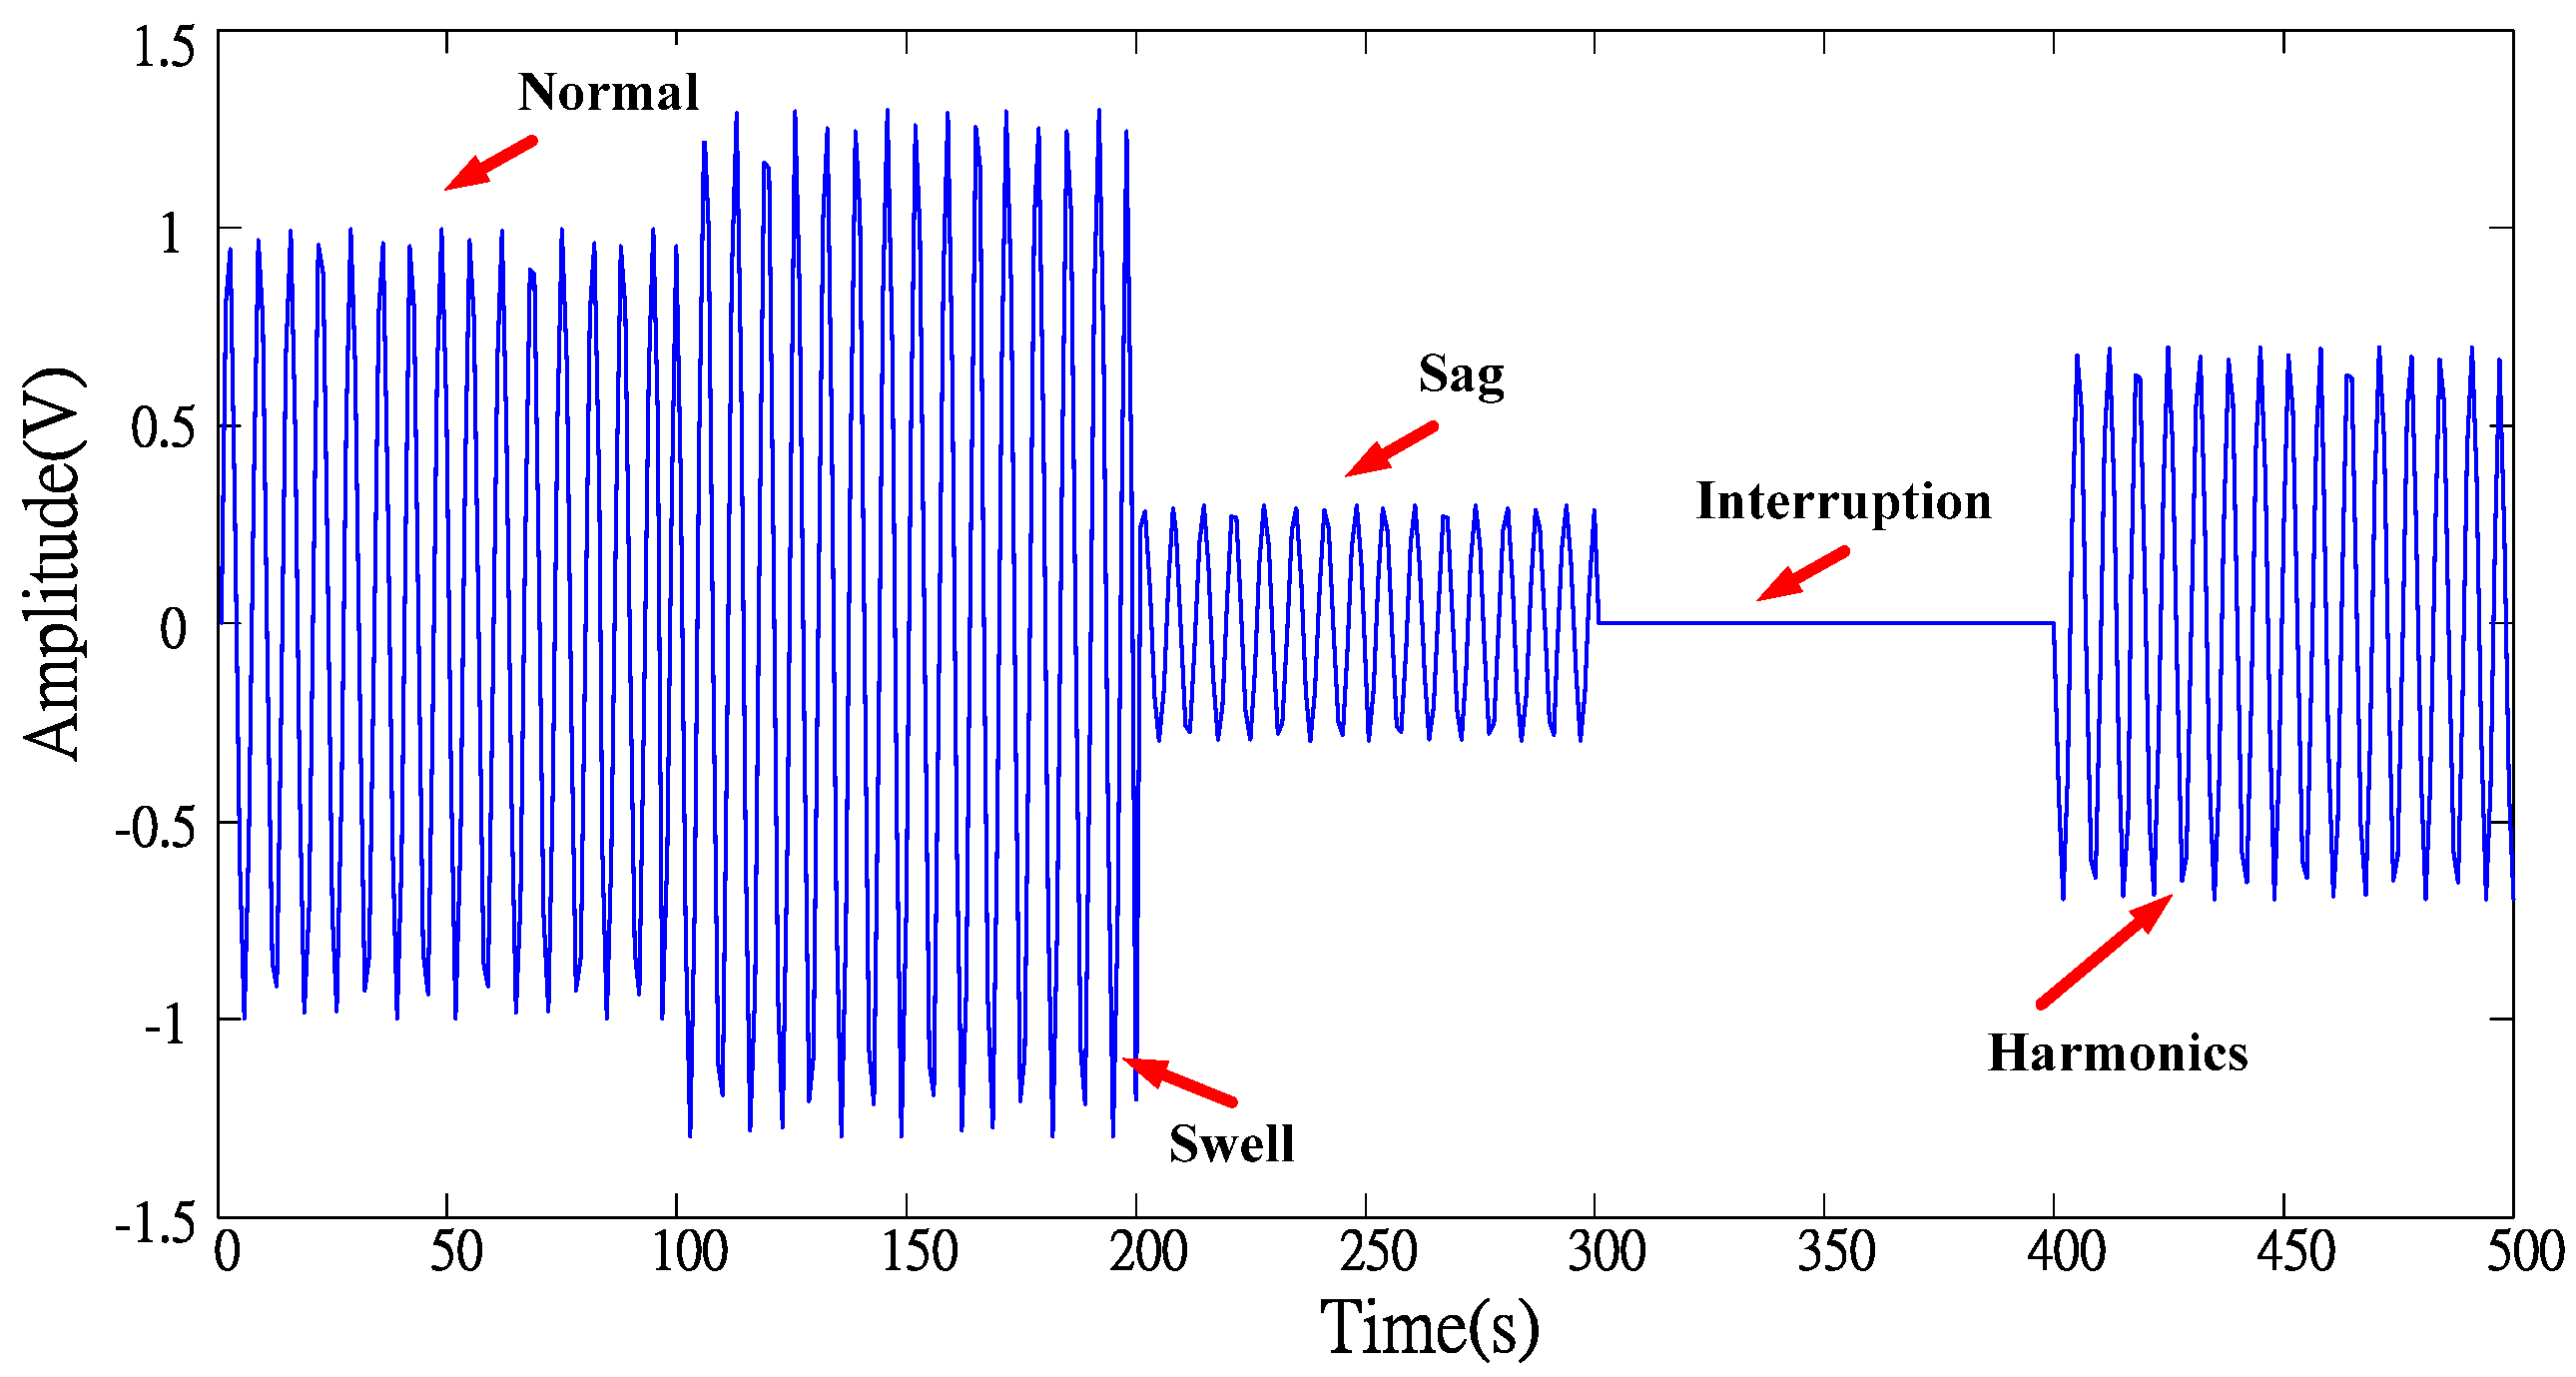
2. Power Quality Disturbances and Basic Architecture of Proposed Power Quality Analysis System

In theory, the voltage and current signals provided by a power utility should have the form of an ideal sine wave. However, due to human factors, extreme weather conditions, natural disasters, unanticipated non-linear loads, equipment deterioration, and so on, the power signal commonly exhibits voltage and/or current disturbances; with unpredictable effects on the power grid and electrical equipment. The present study considers four common power quality disturbances, namely voltage sag, voltage swell, interruption and harmonics. The details of each disturbance are provided in [17].
Existing power quality analysis instruments test for the existence of voltage sag, voltage swell or power interruption, by means of long-term voltage monitoring, e.g., calculating the RMS of the voltage per unit time and observing the variance of this value over time. Furthermore, existing instruments detect power harmonic disturbances by monitoring changes in the voltage peaks and/or frequencies over time. As a result, existing systems are unable to detect the four waveform disturbances defined above on a real-time basis. Furthermore, to accurately determine the precise nature of the power quality event, multiple electrical power characteristics (e.g., voltage, power, current, and so forth) must be measured. Finally, existing methods have a poor detection performance when the power system signal is contaminated by noise.
Accordingly, the present study proposes a new power quality analysis system in which the limitations described above are addressed by integrating a CS-based detection system with an ENN clustering algorithm. In the proposed approach, the power system signal is converted into the form of a chaotic dynamic error trajectory, and a small number of characteristic features are then extracted from this chaotic trajectory and processed by the ENN in order to determine the state of the power system signal, i.e., normal, sag, swell, interruption or harmonics. Figure 1 illustrates the basic architecture of the proposed system.
Figure 1. Proposed power quality detection system.
Energies 07 06340 g001

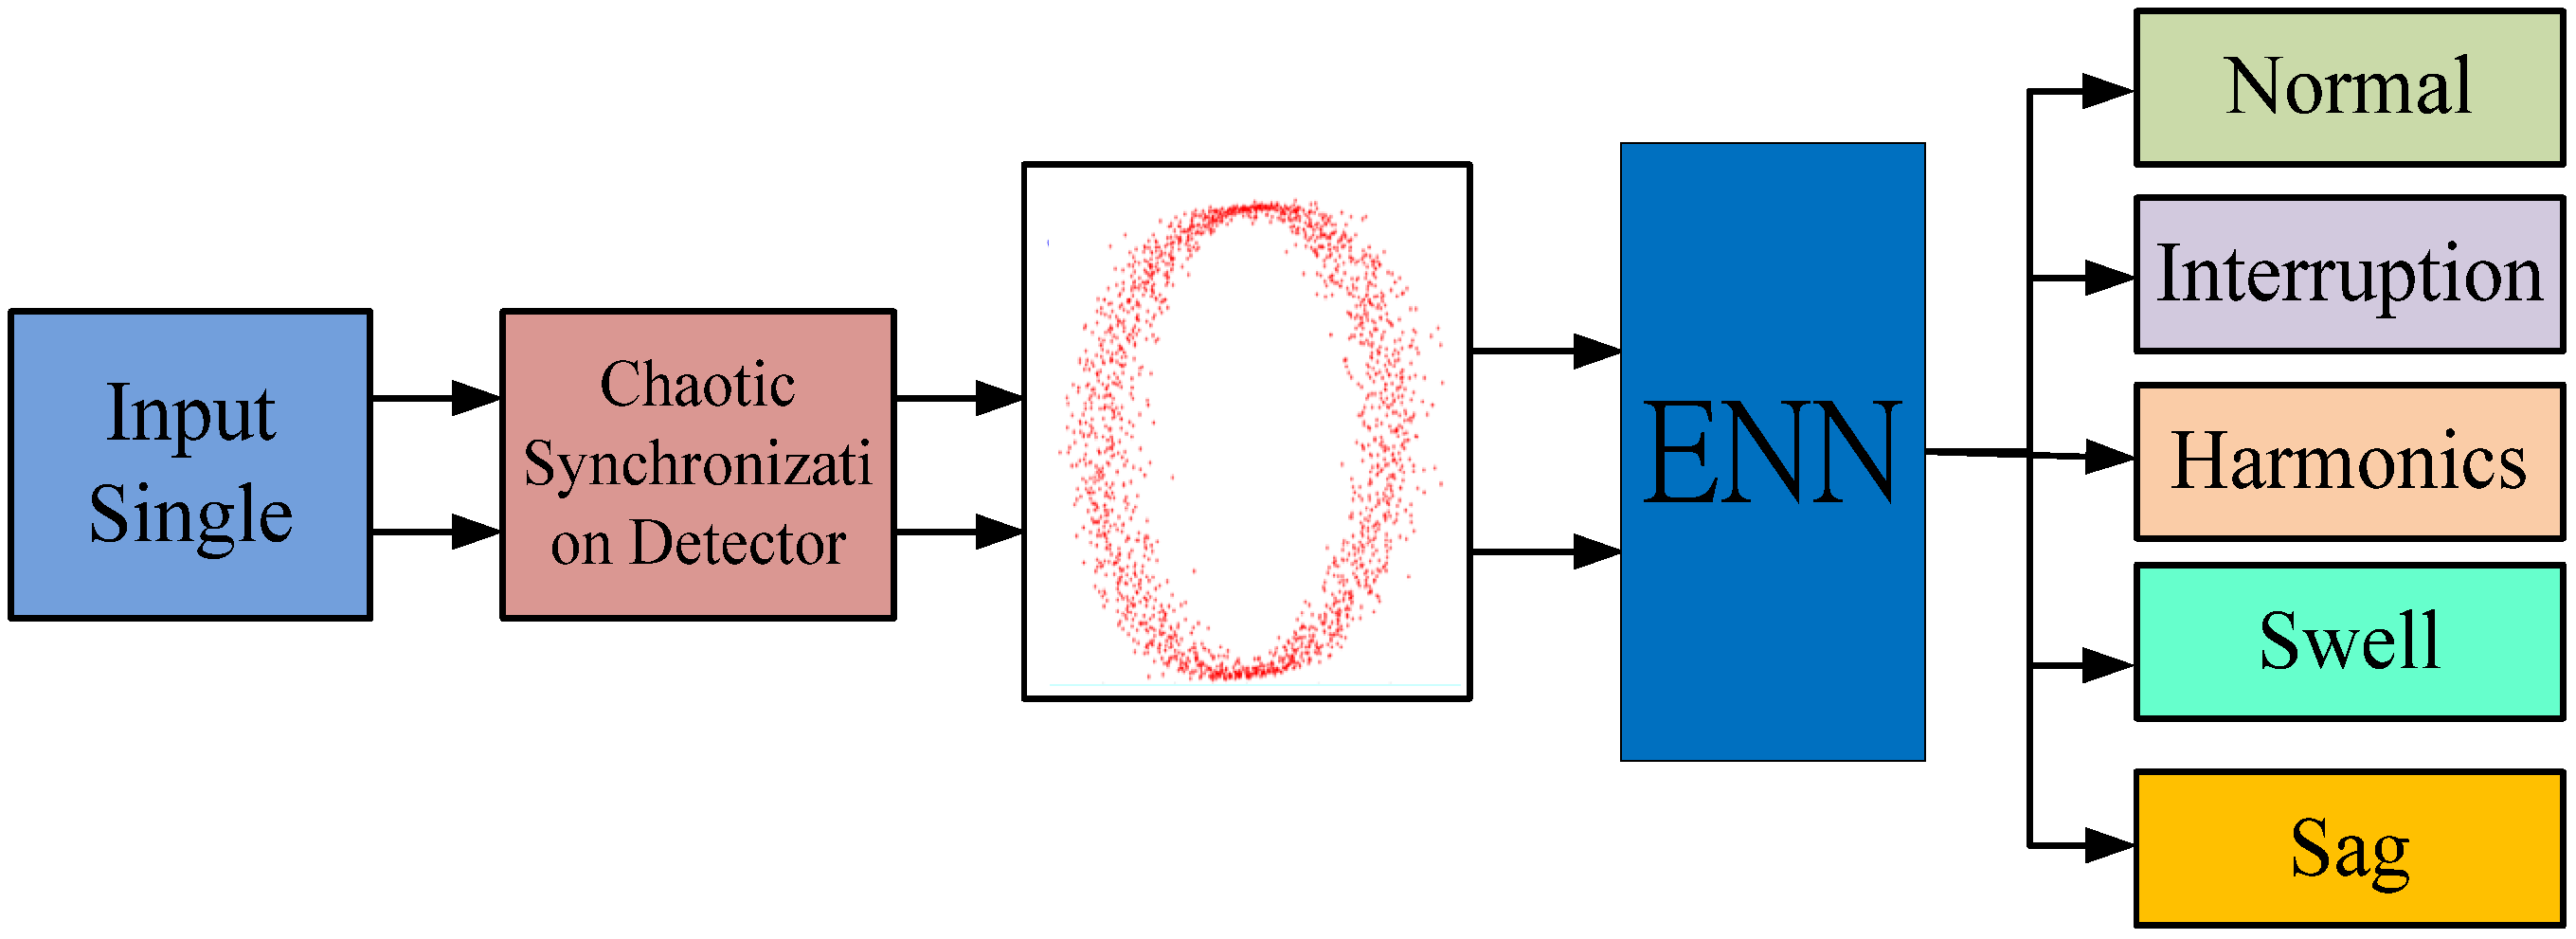
3. Proposed Power Quality Detection Method

The CS-based detection method proposed in this paper identifies the nature of the quality disturbance event from the highly sensitive characteristics of the converted chaotic dynamic error trajectory. As a consequence, the detection results are more reliable than those obtained from existing systems based on direct measurements of the power system signal. Furthermore, the classification process is performed using an ENN scheme (based on an extension distance matrix) rather than a traditional BPN scheme (based on the Euclidean distance), and thus the learning time and classification time are both significantly reduced. Finally, in contrast to existing methods, in the proposed detection scheme, thus, the robustness toward noise in the power system signal is significantly improved.

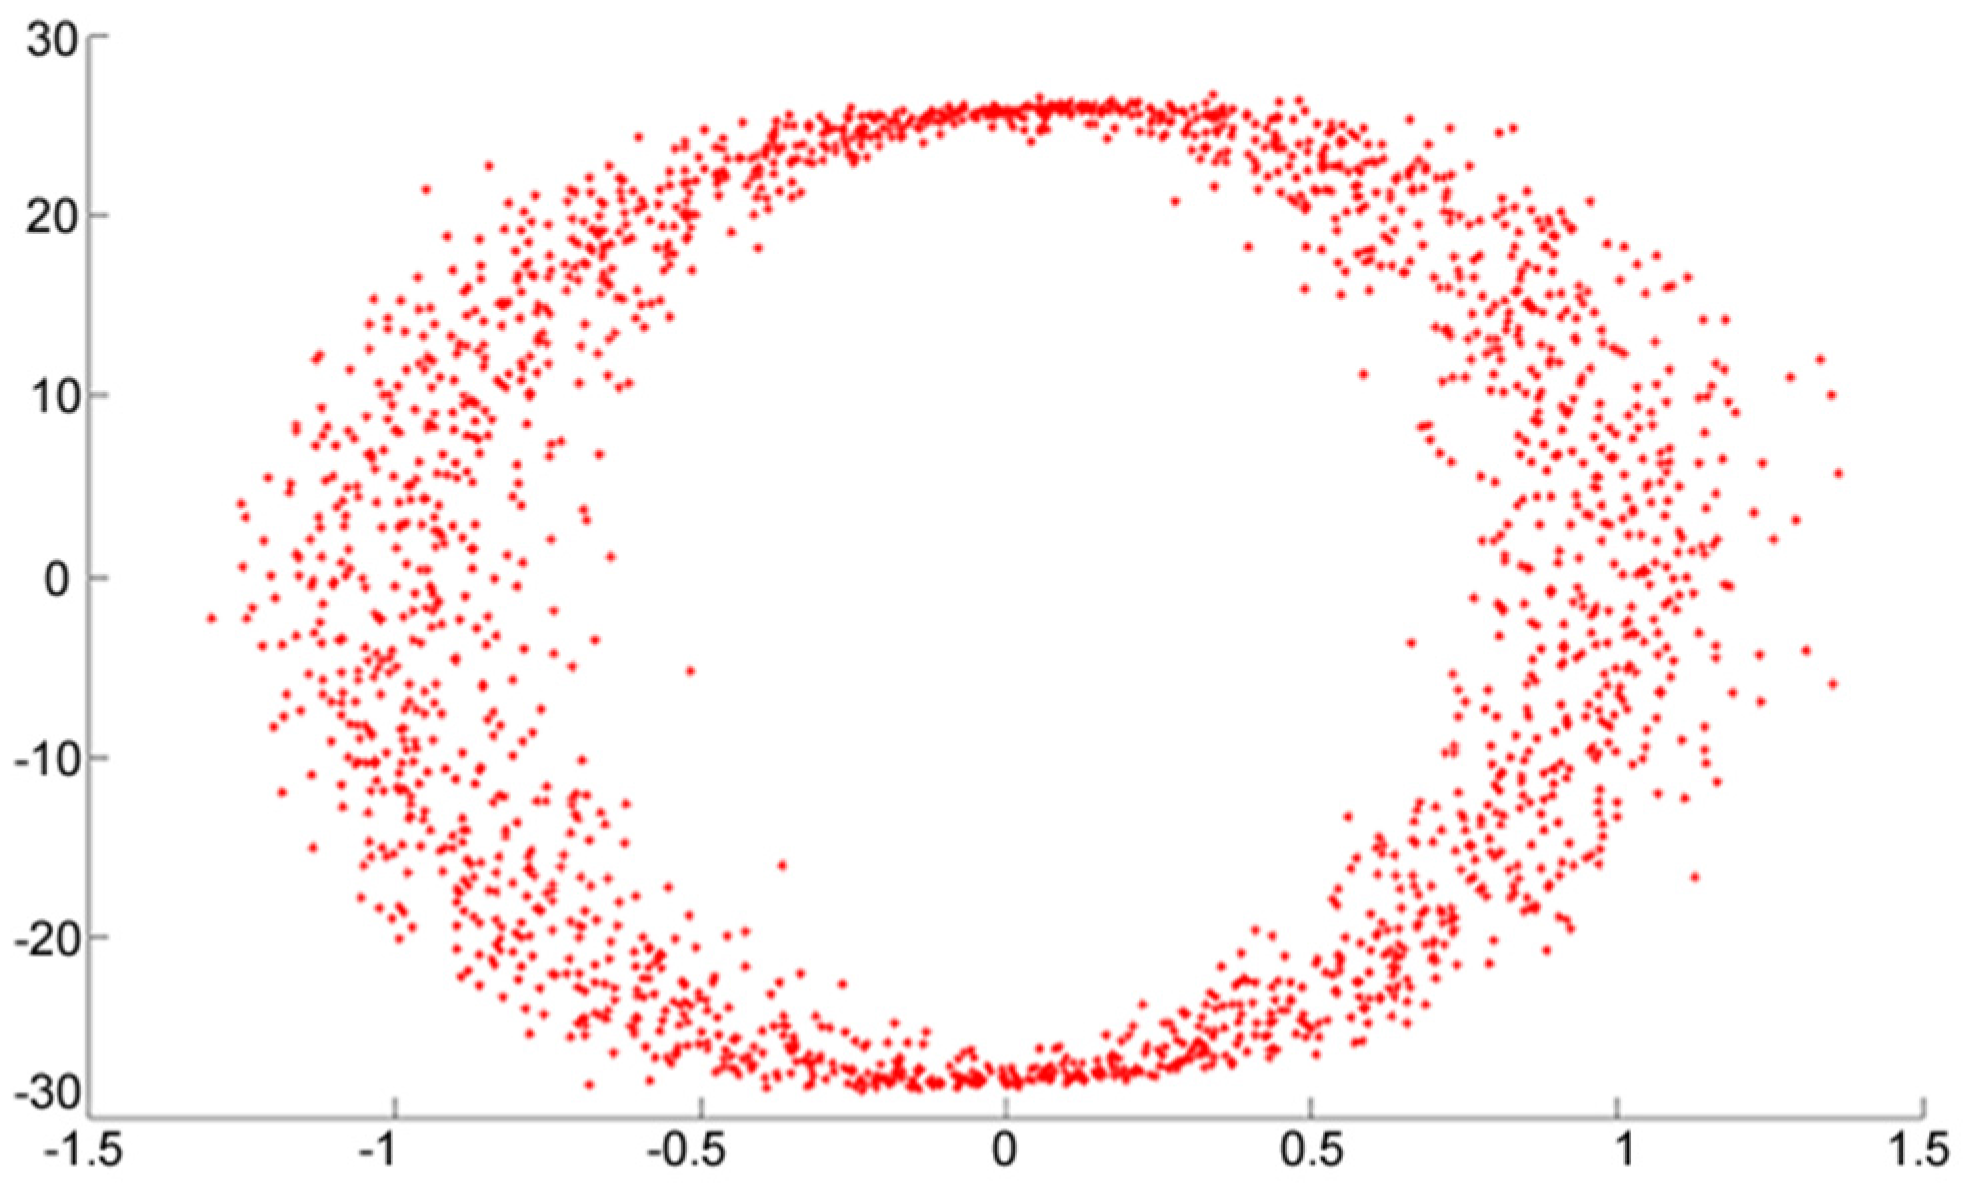
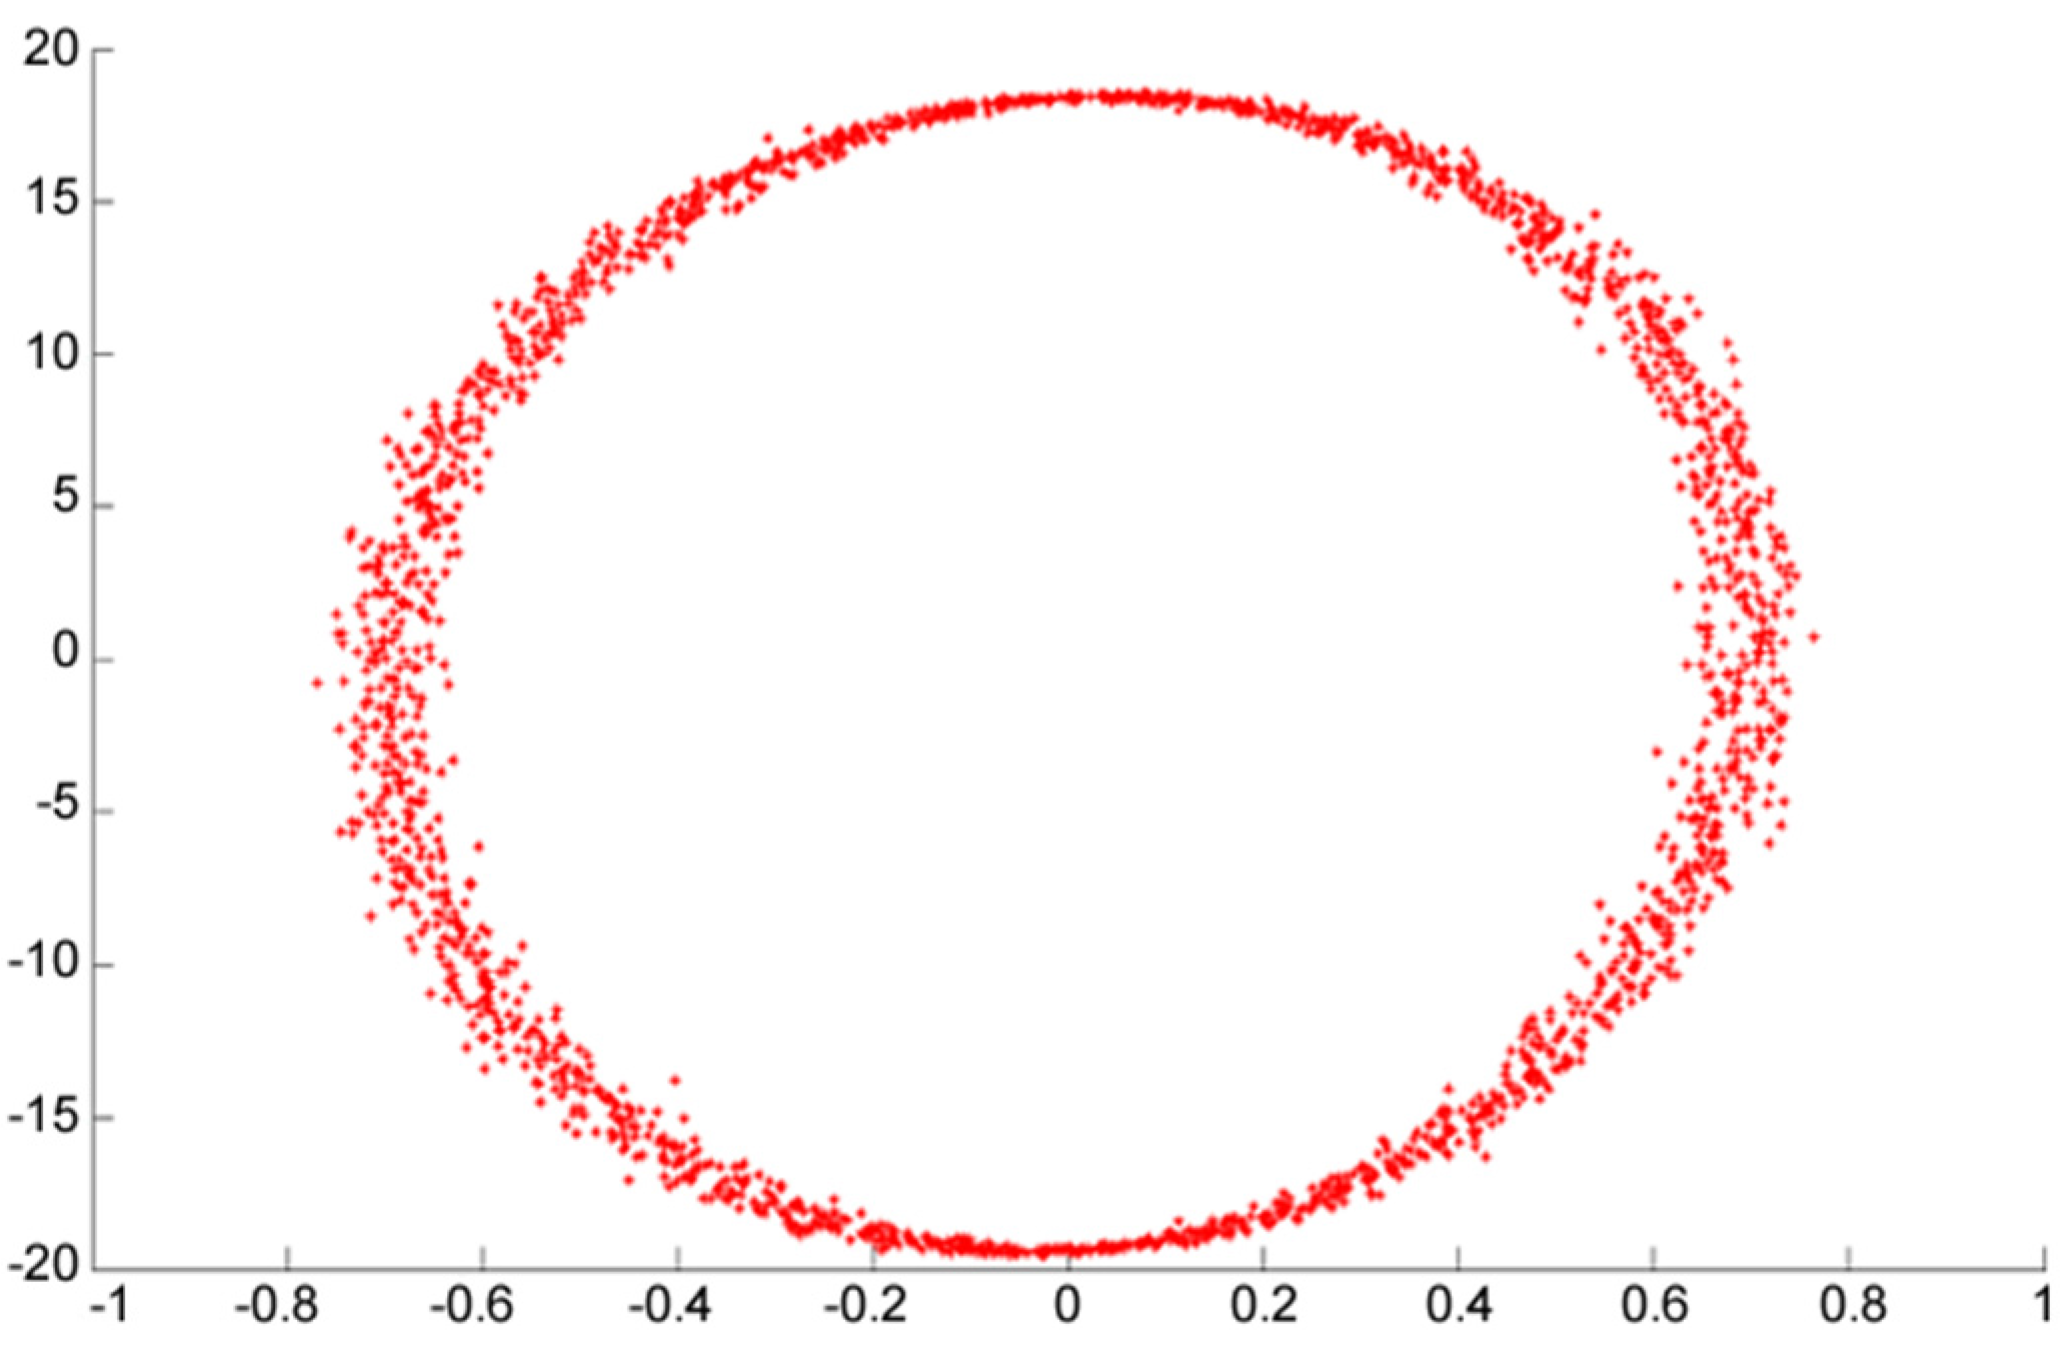
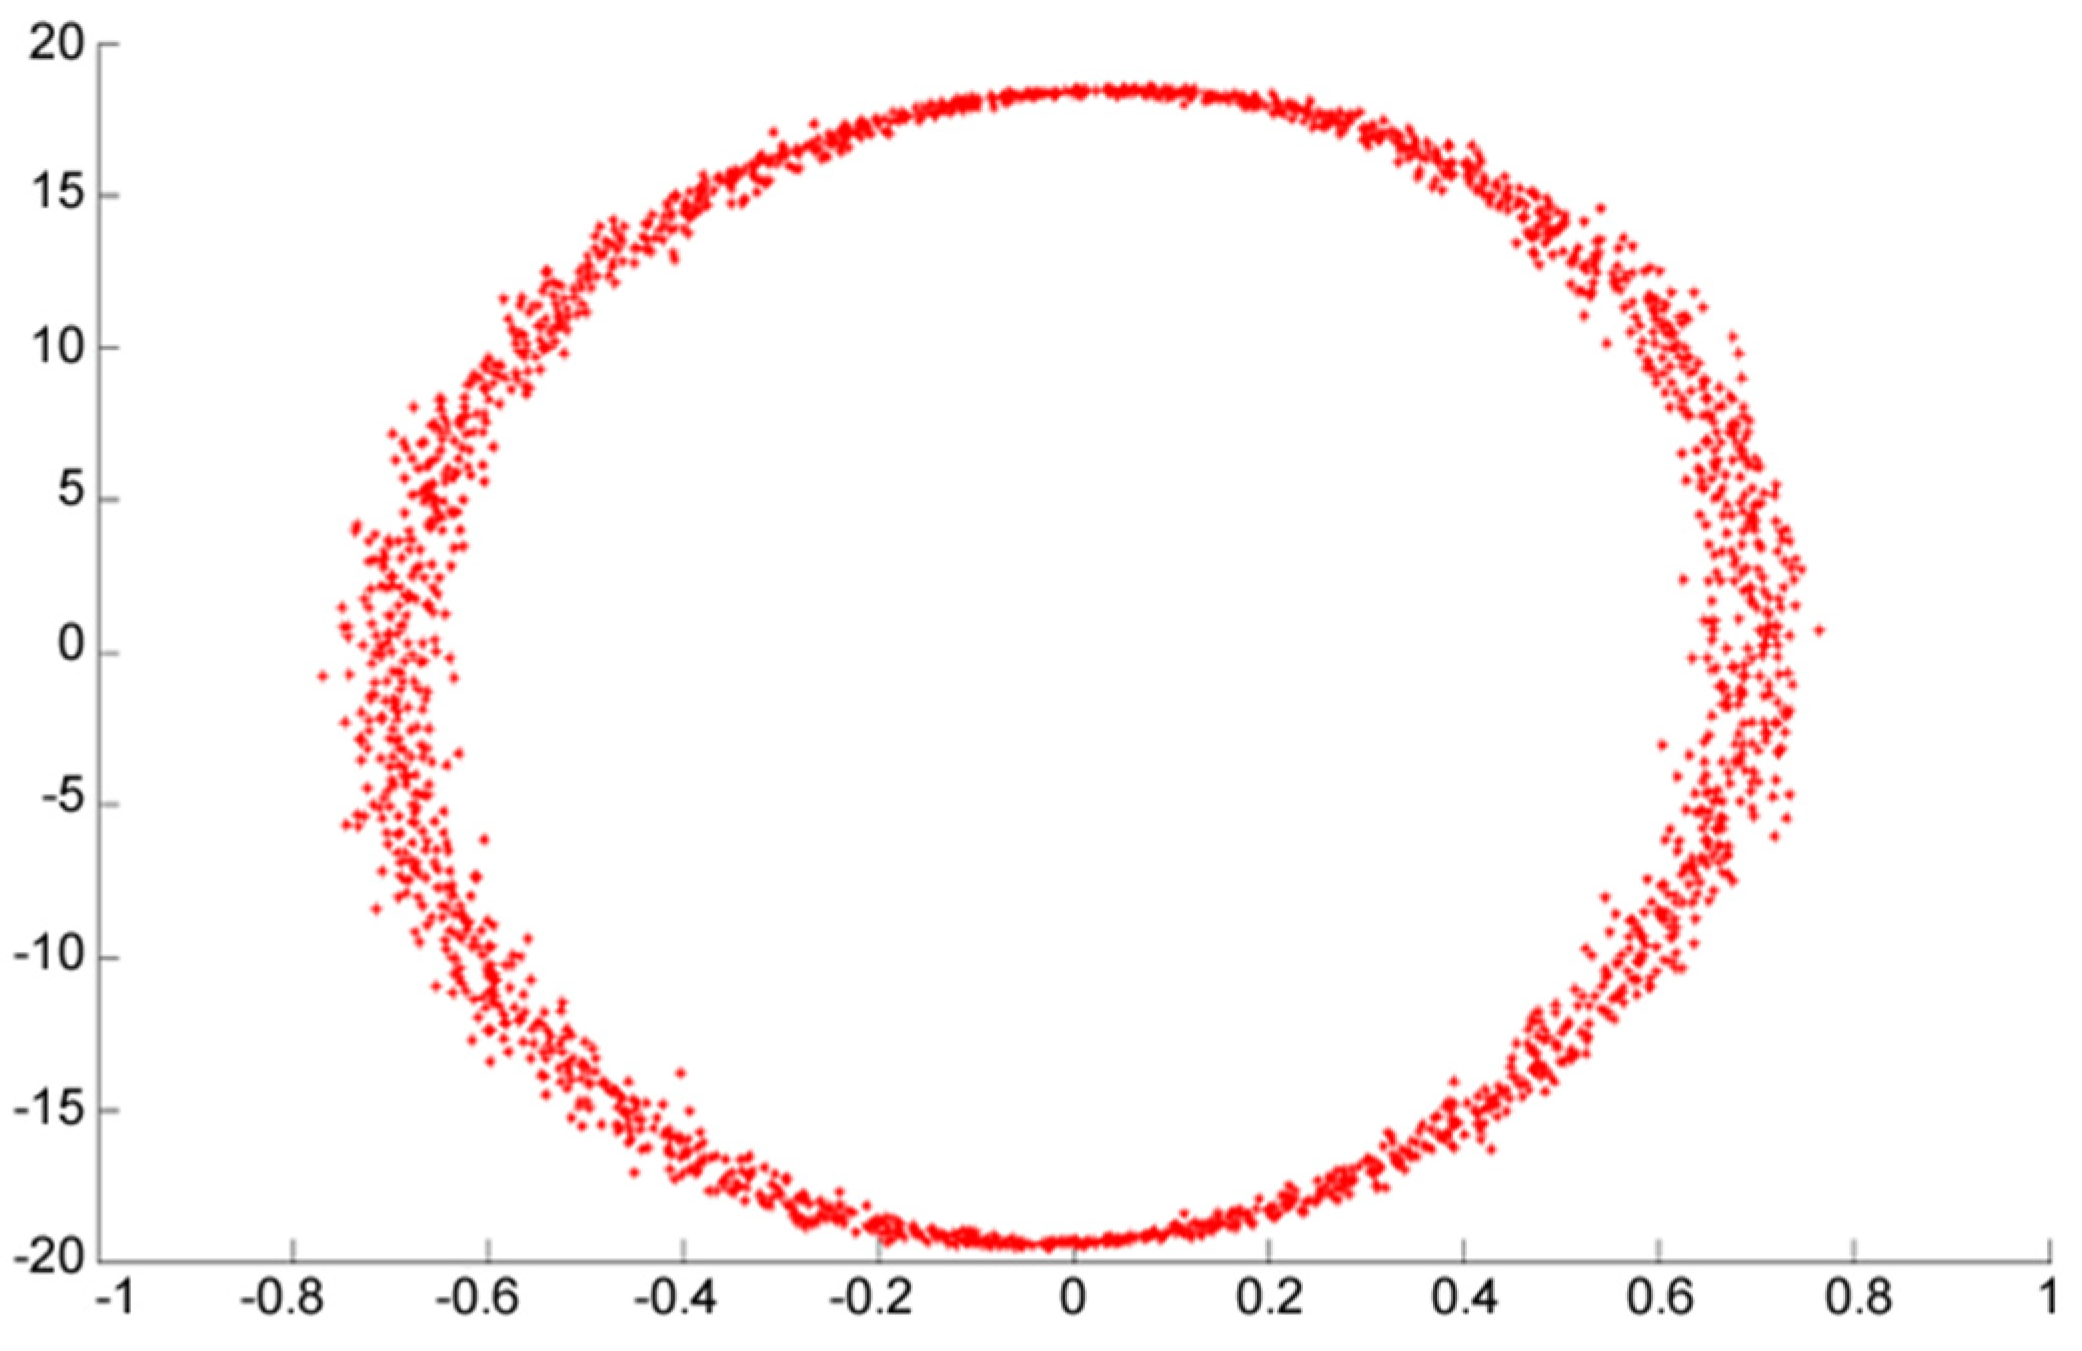
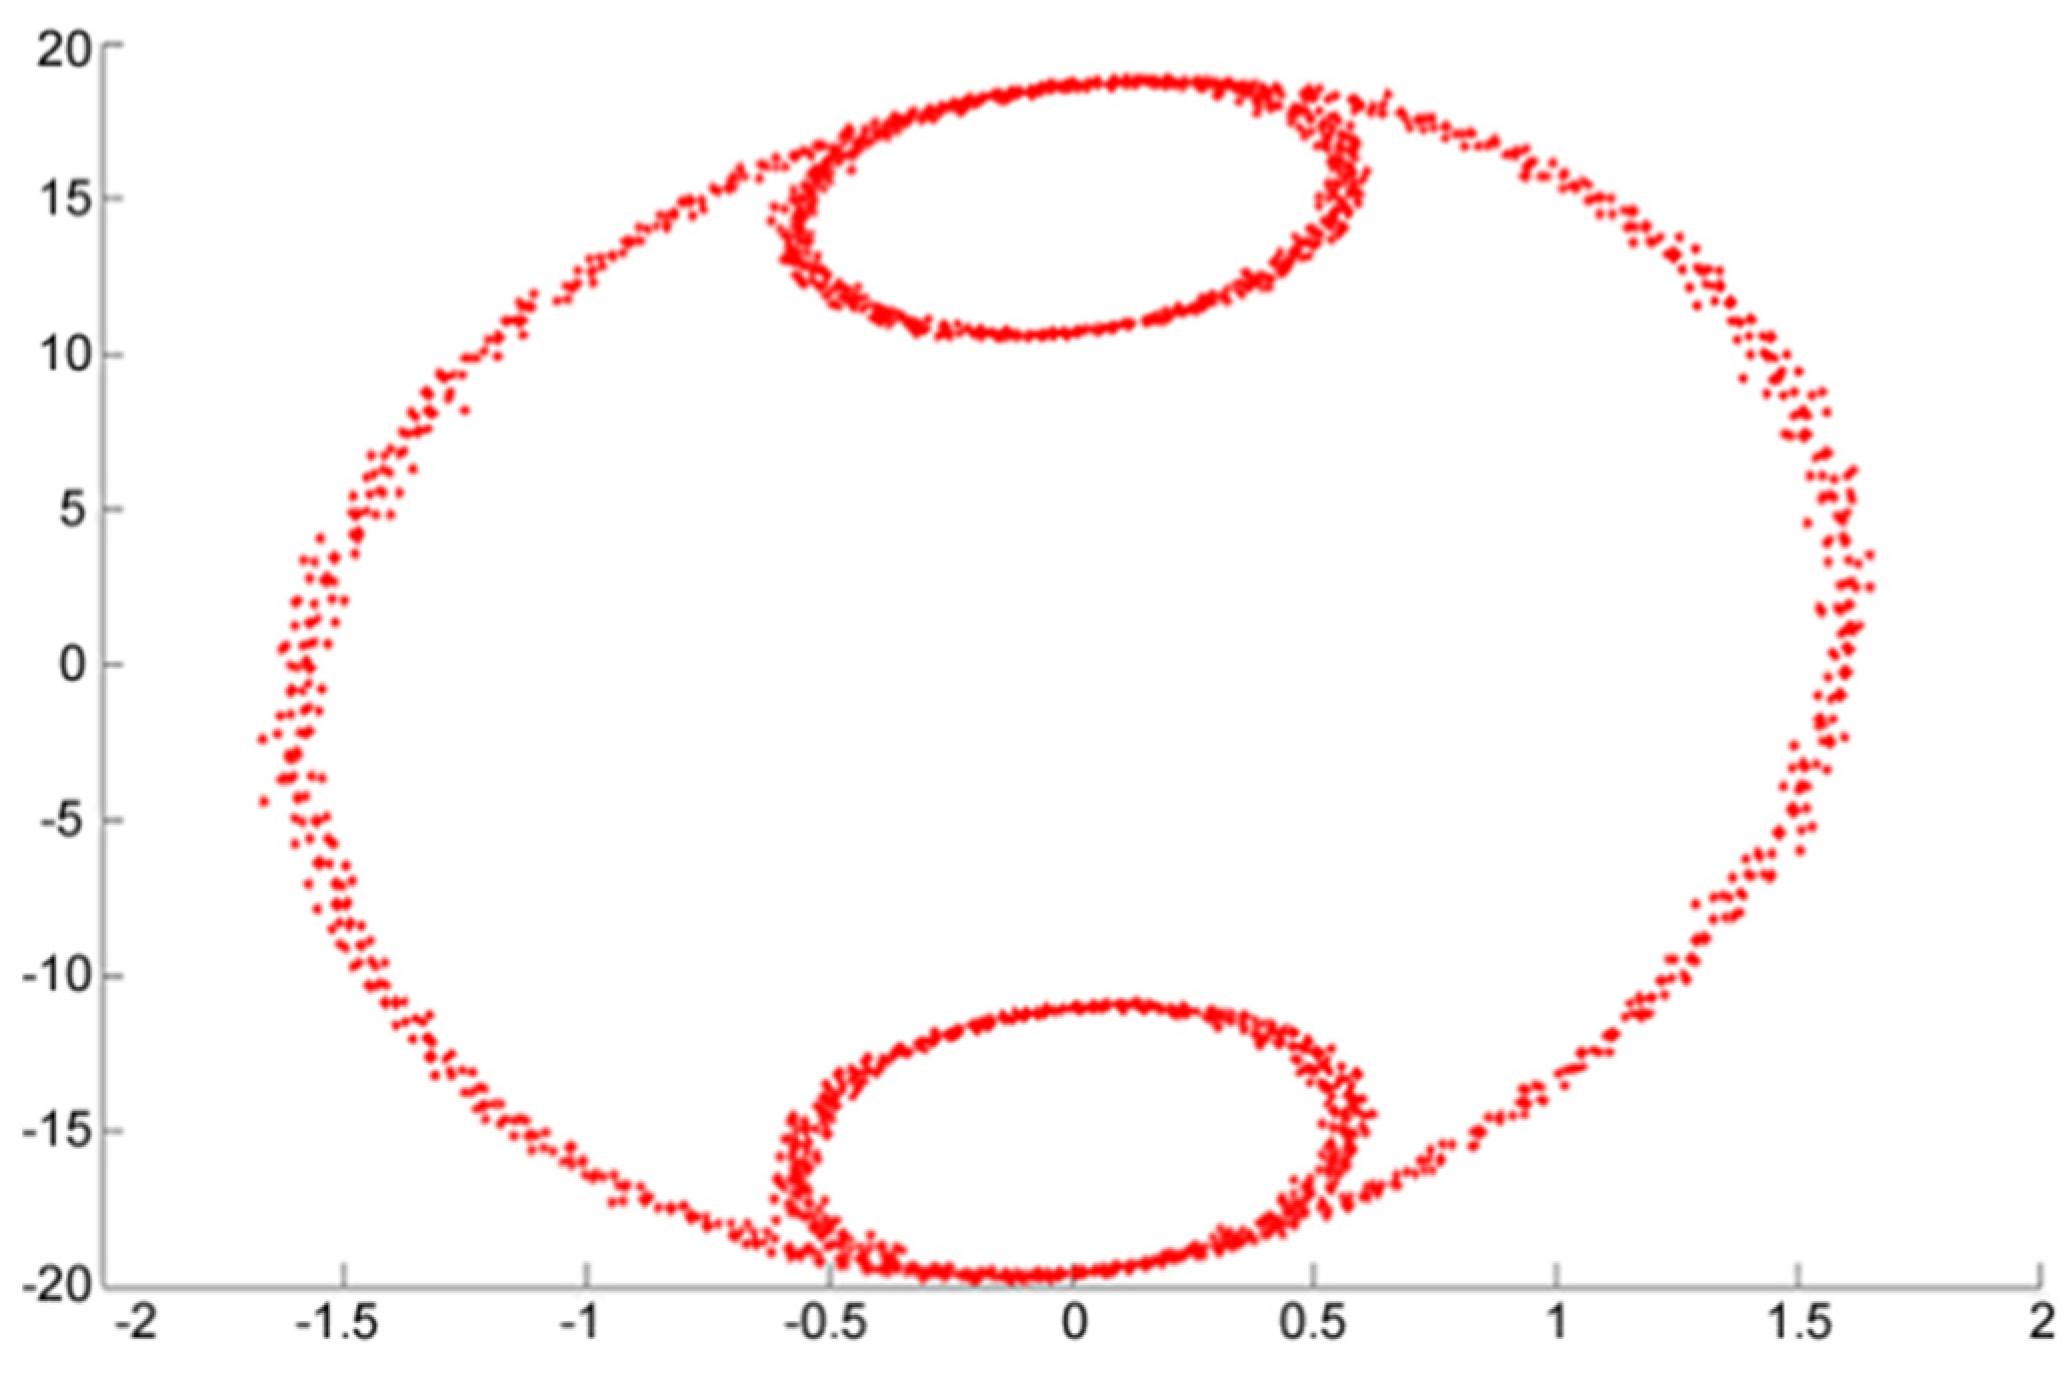
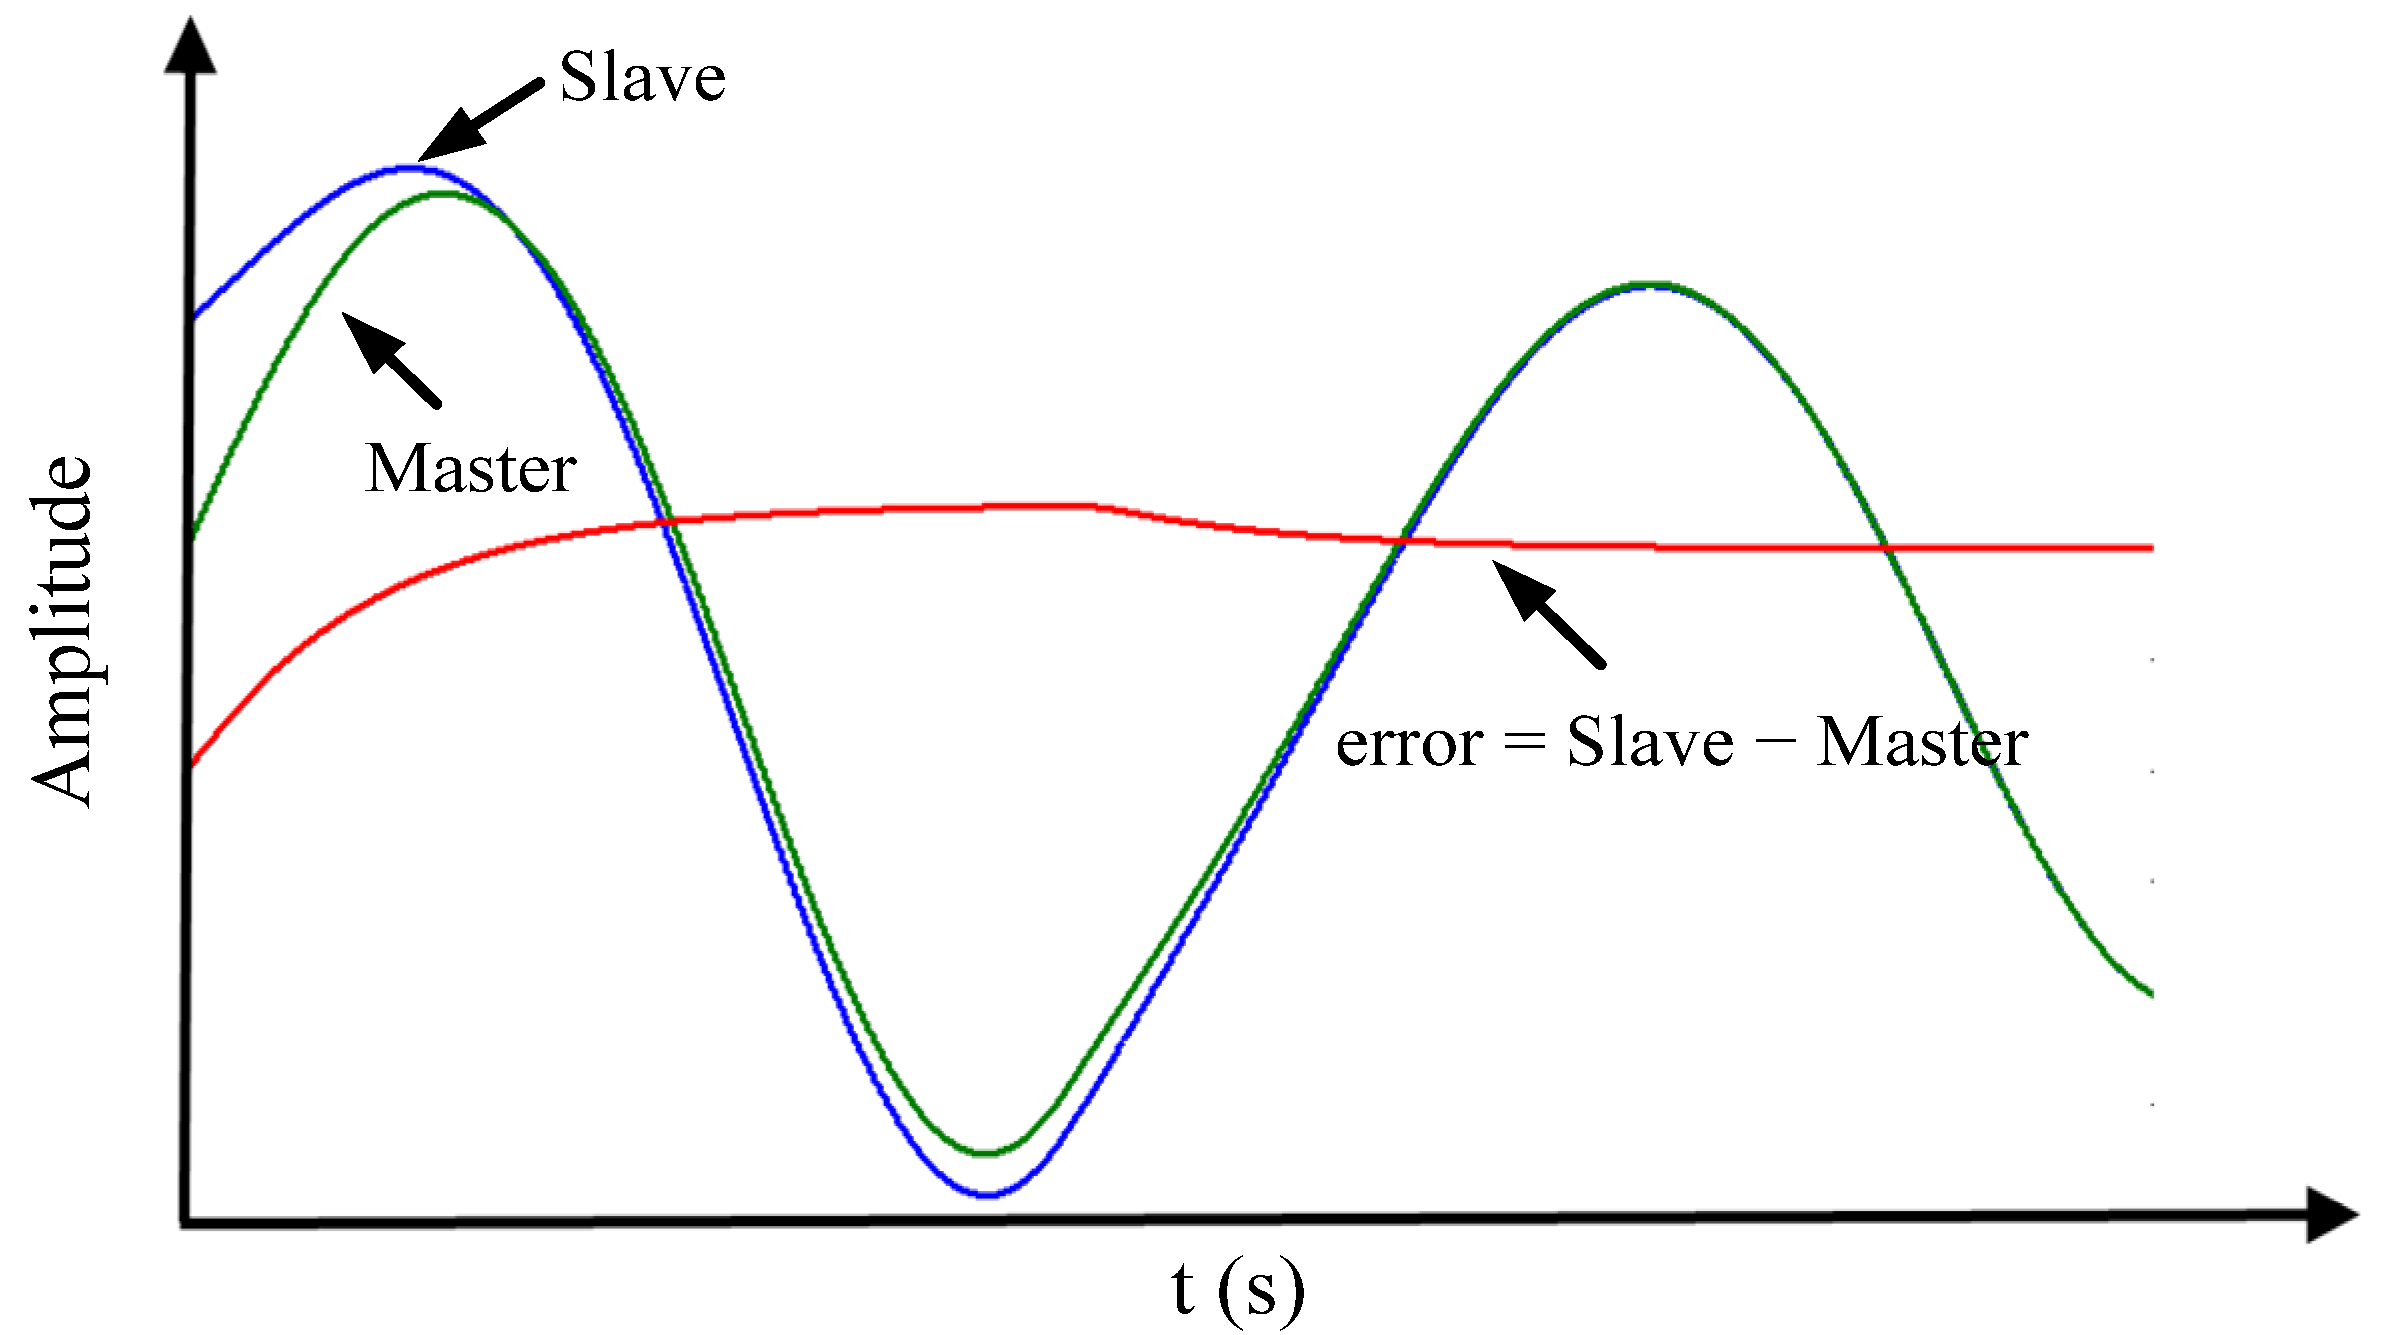
3.1. Chaos Synchronization Detection Method

Modern chaos theory was initiated by meteorologist Edward N. Lorenz in 1963 [18]. In general, a chaotic system is defined as a system in which any subtle change in the initial conditions causes the system to remain in a perturbed state for an extended period of time. Significantly, given two chaotic systems with the same initial conditions but slightly different parameters, a significant difference exists in the states of the two perturbed systems following a long period of time. In practice, it is commonly necessary to synchronize the dynamic response of two chaotic systems. Accordingly, the notion of chaos synchronization was proposed by many researchers [19,20,21,22,23,24] as a means of synchronizing the dynamic state trajectories of two chaotic systems; generally referred to as the Master System and the Slave System, respectively (see Figure 2).
Figure 2. Synchronization of two chaotic systems.
Energies 07 06340 g002
When the Master and Slave systems have different initial values, the dynamic trajectories of the two systems are very different. In [19], a controller was applied to the back end of the Slave system to enable it to track the state of the Master system and achieve synchronization accordingly, i.e.,
lim t | | X Slave , i ( t ) X Master , i ( t ) | | = 0 , i = 1 , 2 , ... , n
In the present study, the Master-Slave concept is applied to analyze the power system signal in order to detect the existence of power quality disturbance events. In the proposed approach, the Master and Slave chaotic systems are expressed respectively as:
Master:
{ x ˙ 1 = F 1 ( x 1 , x 2 , x 3 , ... , x n ) x ˙ 2 = F 2 ( x 1 , x 2 , x 3 , ... , x n ) x ˙ n = F n ( x 1 , x 2 , x 3 , ... , x n )
Slave:
{ y ˙ 1 = F 1 ( y 1 , y 2 , y 3 , ... , y n ) y ˙ 2 = F 2 ( y 1 , y 2 , y 3 , ... , y n ) y n = F n ( y 1 , y 2 , y 3 , ... , y n )
where Fi (i = 1, 2, ..., n) is a non-linear function. For the dynamic system given in Equations (2) and (3), the error state and dynamic error are given respectively as
e 1 = y 1 x 1 , e 2 = y 2 x 2 , ... , e n = y n x n
{ e ˙ 1 = F 1 ( x 1 , x 2 , x 3 , ... , x n ) F 1 ( y 1 , y 2 , y 3 , ... , y n ) = G 1 e ˙ 2 = F 2 ( x 1 , x 2 , x 3 , ... , x n ) F 2 ( y 1 , y 2 , y 3 , ... , y n ) = G 2 e ˙ n = F n ( x 1 , x 2 , x 3 , ... , x n ) F n ( y 1 , y 2 , y 3 , ... , y n ) = G n
where Equation (5) represents a chaotic system whose response is described by a non-linear equation (i.e., Gi (i = 1, 2, ..., n)). It is a coupling equation between the master system in Equation (4) and slave system in Equation (5). The coupling equation can describe the error behavior of two same identical system with different initial conditions.
In the detection system proposed in this study, the dynamic trajectory of the chaotic system derived from the power supply signal is used to identify the operating state of the power supply system (e.g., periodic, non-periodic or random) so as to identify the nature of the power quality disturbance. In implementing the proposed approach, the multiple dynamic error data are expressed as:
{ e ˙ 1 [ j ] = y ˙ 1 [ j ] x ˙ 1 [ j ] e ˙ 2 [ j ] = y ˙ 2 [ j + 1 ] x ˙ 2 [ j + 1 ] e ˙ n [ j ] = y ˙ n [ j + n 1 ] x ˙ n [ j + n 1 ] , j = 1 , 2 , 3 , ... , j n
where xi (i = 1, 2, 3) is the normal (i.e., ideal sine) signal of the power system and yi (i = 1, 2, 3) is the measured signal of the power system. The dynamic error data are then substituted into the chaotic dynamic error equation (i.e., Equation (5)) in order to obtain an output waveform. Finally, three fundamental characteristics of this waveform are extracted and input to the ENN in order to identify the type of waveform disturbance event.
In the detection system proposed in this study, the Master System and Slave system are both modeled as Lorenz chaotic systems [21], as formulated in Equations (7) and (8), respectively. The chaotic dynamic error state equation is then expressed in the matrix form shown in Equation (9):
Master : { x ˙ 1 = α ( x 2 x 1 ) x ˙ 2 = β x 1 x 1 x 3 x 2 x ˙ 3 = x 1 x 2 γ x 3
Slave : { y ˙ 1 = α ( y 2 y 1 ) y ˙ 2 = β y 1 y 1 y 3 y 2 y ˙ 3 = y 1 y 2 γ y 3
[ e ˙ 1 e ˙ 2 e ˙ 3 ] = [ a a 0 b 1 0 0 0 g ] [ e 1 e 2 e 3 ] + [ 0 y 1 y 3 x 1 x 3 y 1 y 2 + x 1 x 2 ]
where α, β and γ are positive constants. The eigenvalues of Equation (9) are then obtained as:
λ 1 = α + 1 2 + 1 2 ( α + 1 ) 2 + 4 α ( β 1 ) λ 2 = α + 1 2 1 2 ( α + 1 ) 2 + 4 α ( β 1 ) λ 3 = γ
The chaotic dynamic error system will be described by the selected of parameters in Equation (9) to produce three eigenvalues with a stranger attracter [15]. In this case, the d(e2)/dt upper half waveform can be extracted from the output waveform, which can then be assigned one of three different characteristics depending on the value of d(e2)/dt, i.e.,
c k = 1 n i = 1 n e 2 k , i , k = 1 , 2 , 3
where e21,i, e22,i, and e23,i (i = 1, 2, ..., n) represent the chaotic dynamic error values in three different error intervals, respectively. (Note that d(e2)/dt > 0).
In the power quality analysis system proposed in the present study, the average characteristic values of c1, c2 and c3 calculated by Equation (11) are taken as the input to an ENN clustering scheme designed to classify the power system signal as either normal, voltage swell, voltage sag, interruption or harmonic. The details of the ENN classification scheme are provided in the following section.

3.2. Extension Neural Network Classification Scheme

Extension set theory was originally proposed by Cai [25] in 1985 and was subsequently integrated with Neural Network technology to realize so-called ENNs for a range of classification and optimization-type problems characterized by a continuous input and a discrete output. Compared to traditional neural networks and fuzzy classification schemes, ENNs not only have a faster learning speed, but also a greater classification accuracy and a lower memory requirement. In the present study, an ENN is used to classify the characteristic features of the chaotic waveform detected by the CS scheme in order to recognize the nature of the power system signal disturbance.

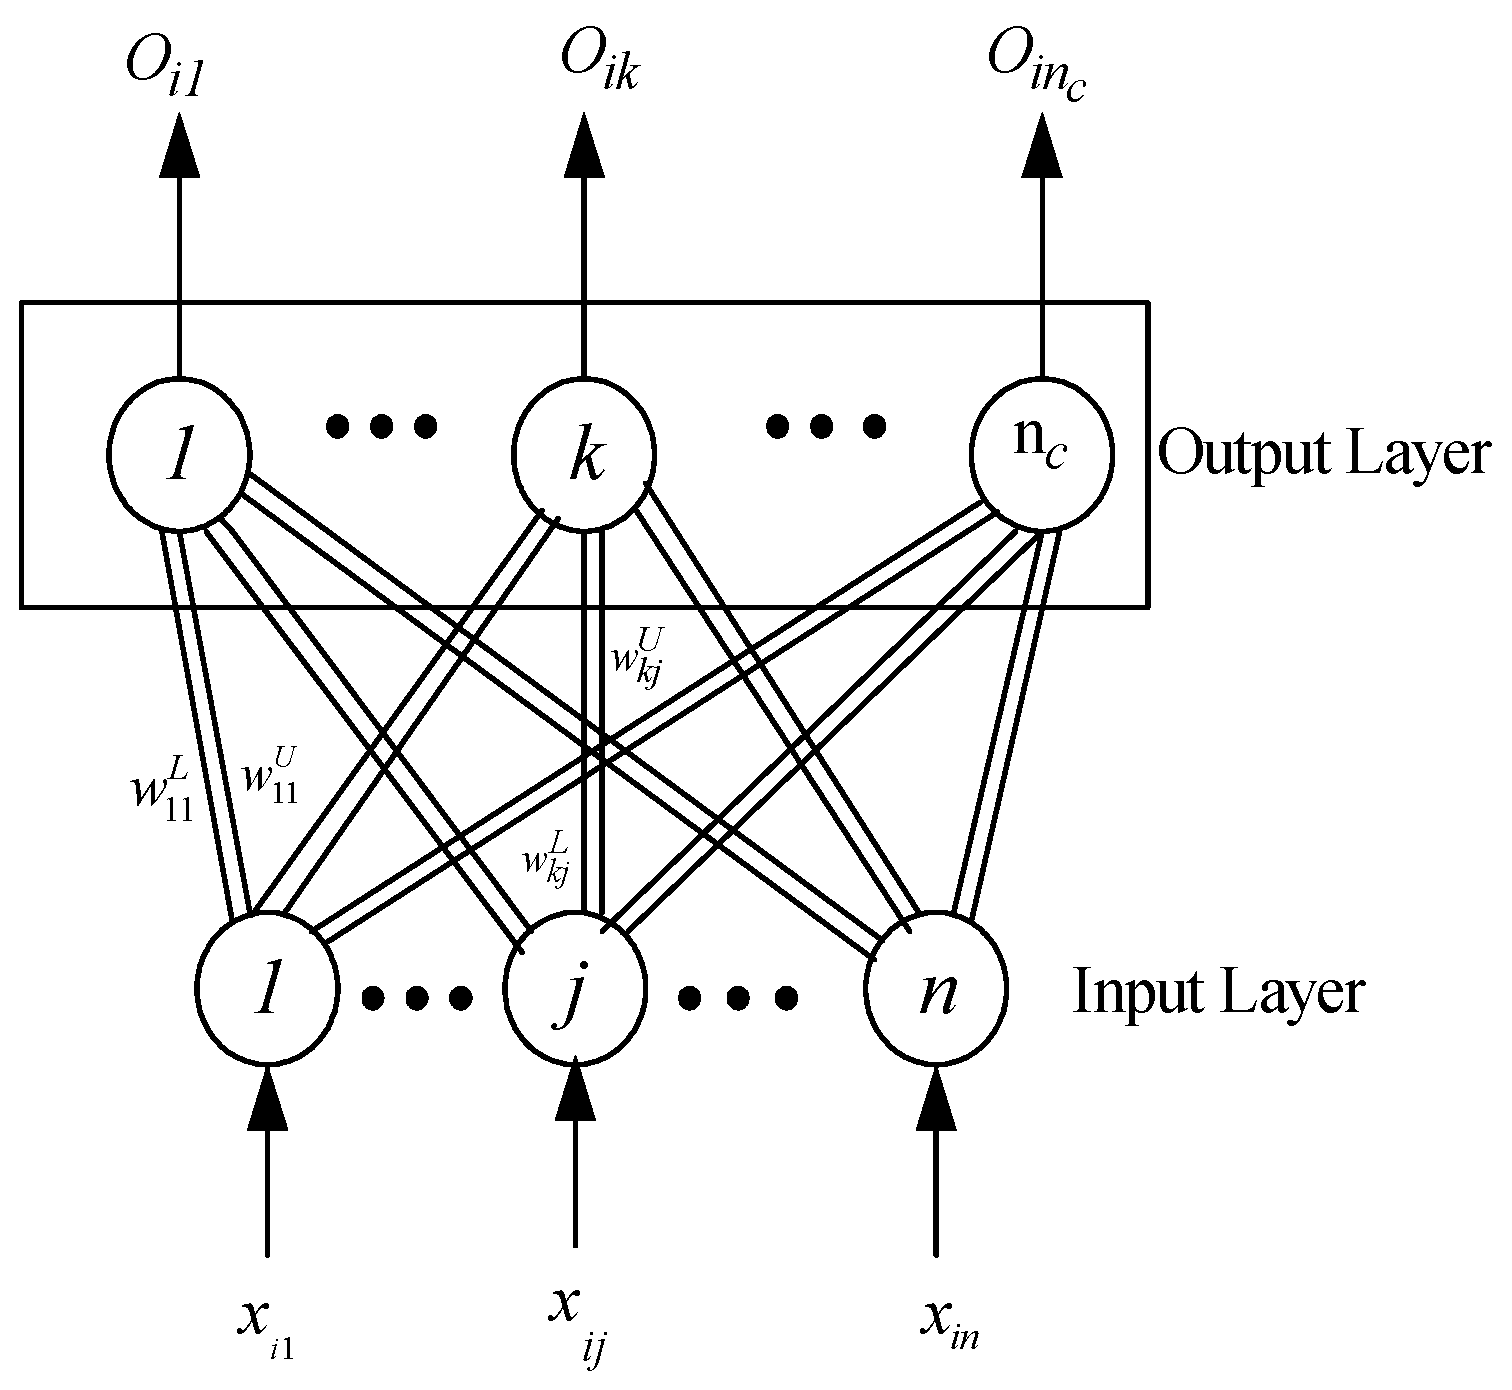
3.2.1. Structure of Extension Neural Network

In the clustering problem considered in the present study, the signal features and associated disturbance types cover a range of values and are therefore ideally suited to processing using an ENN-based scheme. Figure 3 presents a schematic representation of the ENN structure. As shown, the ENN comprises only an input layer and an output layer (i.e., there are no hidden layers as in a traditional NN). The nodes in the input layer receive the input features and apply a set of weighted parameters to generate an image of the input pattern, which is then output by the nodes in the output layer. As shown in Figure 3, each of the input nodes is connected to each of the output nodes via two weighted connections, where one weight represents the lower bound of the corresponding feature in the classical domain, while the other weight represents the upper bound. For convenience, let the connections between the j-th input node and the k-th output node be denoted as w kj L and w kj U , respectively. The output layer is a competitive layer. That is, each node corresponds to one prototype pattern, and only one output node has a non-zero output; indicating the prototype pattern which is closest to the input vector. The operation mode of an ENN comprises two phases, namely a learning phase and a testing phase. The details of the two phases are described in the following sections.
Figure 3. Basic structure of Extension Neural Network (ENN).
Energies 07 06340 g003

3.2.2. Learning Phase

The ENN learning phase is a supervised process, in which the aim is to tune the weights of the ENN in such a way as minimize the clustering error. Before the learning process can be performed, several variables must be defined. For example, let the training set be defined as{X1, T1}, {X2, T2}, …, {XQ, TQ}, where Q is the total number of training patterns, Xi is an input vector to the ENN and Ti is the corresponding target output. Furthermore, let the i-th input vector be denoted as Xi = {Xi1, Xi2, …, Xin}, where n is the total number of features. In evaluating the learning performance, the error function is defined as follows:
E t = 1 2 i = 1 Q j = 1 n c ( t i j o i j ) 2
where tij is the desired j-th output for the i-th input pattern and Oij is the actual j-th output for the i-th input pattern. The detailed supervised learning algorithm can be described as follows:
Step 1:
Set the connection weights between the input nodes and the output nodes in accordance with the ranges of the corresponding features in the classical domain. Note that these ranges can be obtained directly from previous experience, or determined from the training data as follows:
w k j L = min T i k { x i j }
w k j U = max T i k { x i j } for  i = 1, 2, …, Q;  j = 1, 2, …, n;  k = 1 , 2 , …,  n c
Step 2:
Read the i-th training pattern and its cluster number p:
X i = { x i 1 , x i 2 , ... x i n }
Step 3:
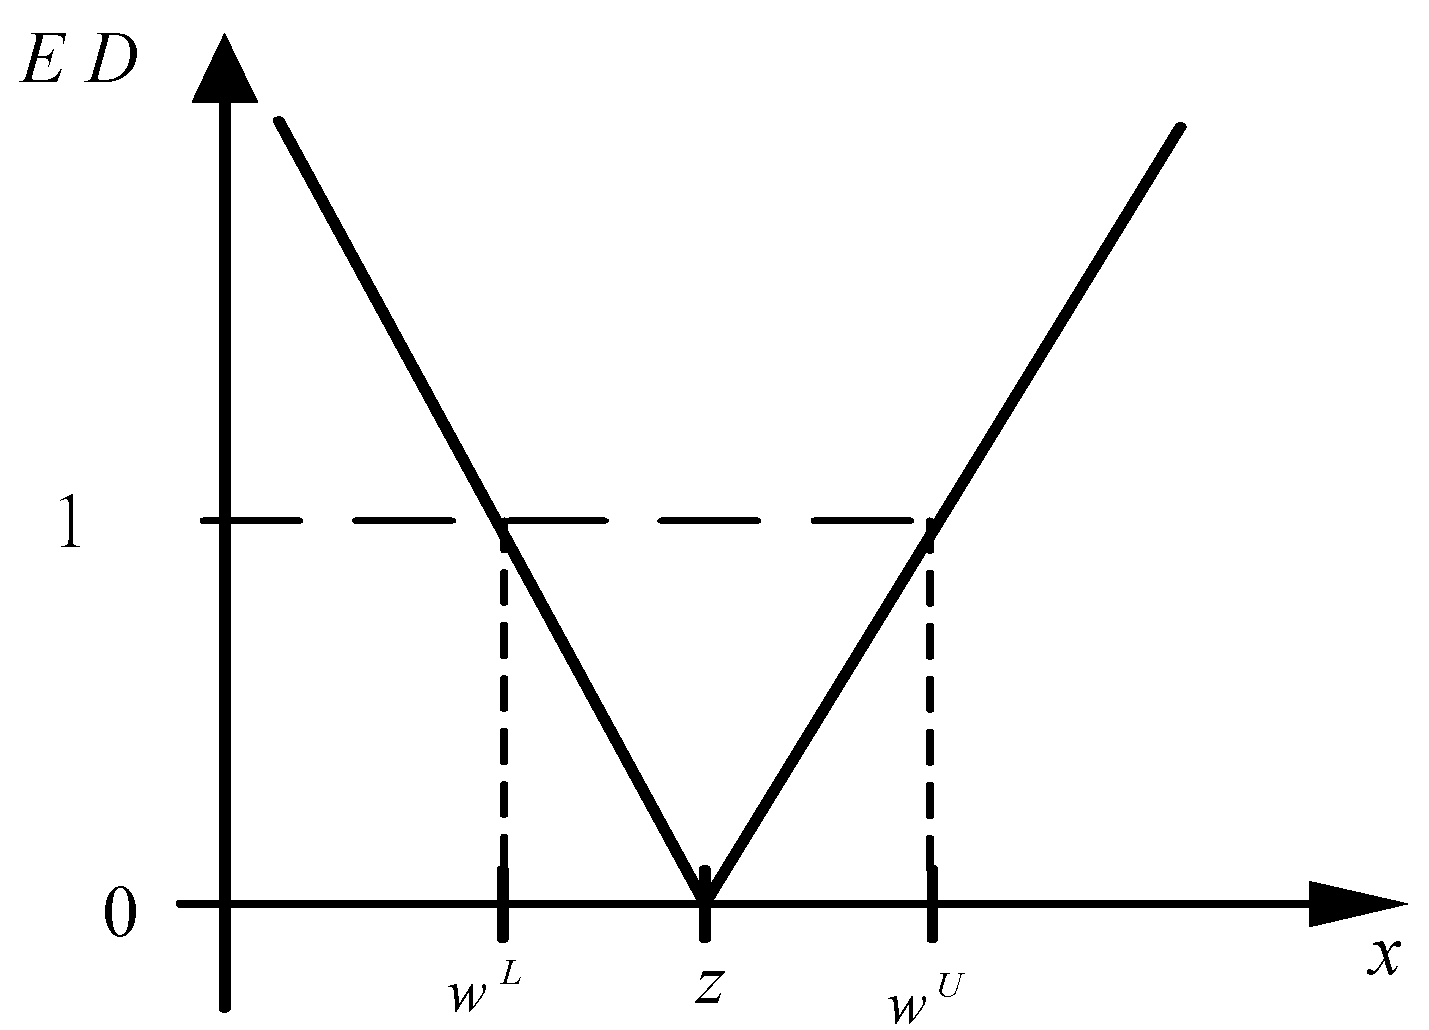
Use the extension distance (ED) metric to calculate the distance between the input pattern Xi and the k-th cluster as follows:
E D i k = j = 1 n ( | x i j ( w k j U + w k j L ) / 2 | ( w k j U w k j L ) / 2 ( w k j U w k j L ) / 2 + 1 ) for  k = 1 , 2 , …, n c
The ED metric is shown graphically in Figure 4. It is noted that the ED metric describes the distance between the input pattern Xi and a range <wL, wU>, and is therefore different from the traditional Euclidean distance. As shown in Figure 4, the input pattern is located at difference distances from the ranges associated with the different features due to different sensitivities in every case. In terms of classification applications, this is a significant advantage since it is very simple. By contrast, in traditional BPN architectures based on the Euclidean distance, if the feature covers a large range, the data requirement is fuzzy or low in sensitivity to distance, while if the feature covers a small range, the data precision requirement and sensitivity to distance are high.
Figure 4. Proposed extension distance (ED) metric.
Energies 07 06340 g004
Step 4:
Find the cluster m which satisfies the condition EDim = min{EDik}. If m = p (where p is the target cluster for the given input), then skip to Step 6; otherwise proceed to Step 5.
Step 5:
Update the weights of the p-th and m-th clusters as follows:
{ w p j L ( n e w ) = w p j L ( o l d ) + η ( x i j w p j L ( o l d ) + w p j U ( o l d ) 2 ) w p j U ( n e w ) = w p j U ( o l d ) + η ( x i j w p j L ( o l d ) + w p j U ( o l d ) 2 )
{ w m j L ( n e w ) = w m j L ( o l d ) η ( x i j w m j L ( o l d ) + w m j U ( o l d ) 2 ) w m j U ( n e w ) = w m j U ( o l d ) η ( x i j w m j L ( o l d ) + w m j U ( o l d ) 2 ) for  j = 1 , 2 , …, n c
where η is the learning rate (specified as 0.1 in the present study).
Step 6:
Repeat Step 2 to Step 5 for the next training pattern. If there are no further training patterns to be classified, terminate the learning epoch.
Step 7:
If the clustering process has converged, or the error satisfies the predetermined criterion, terminate the learning process; else return to Step 3.

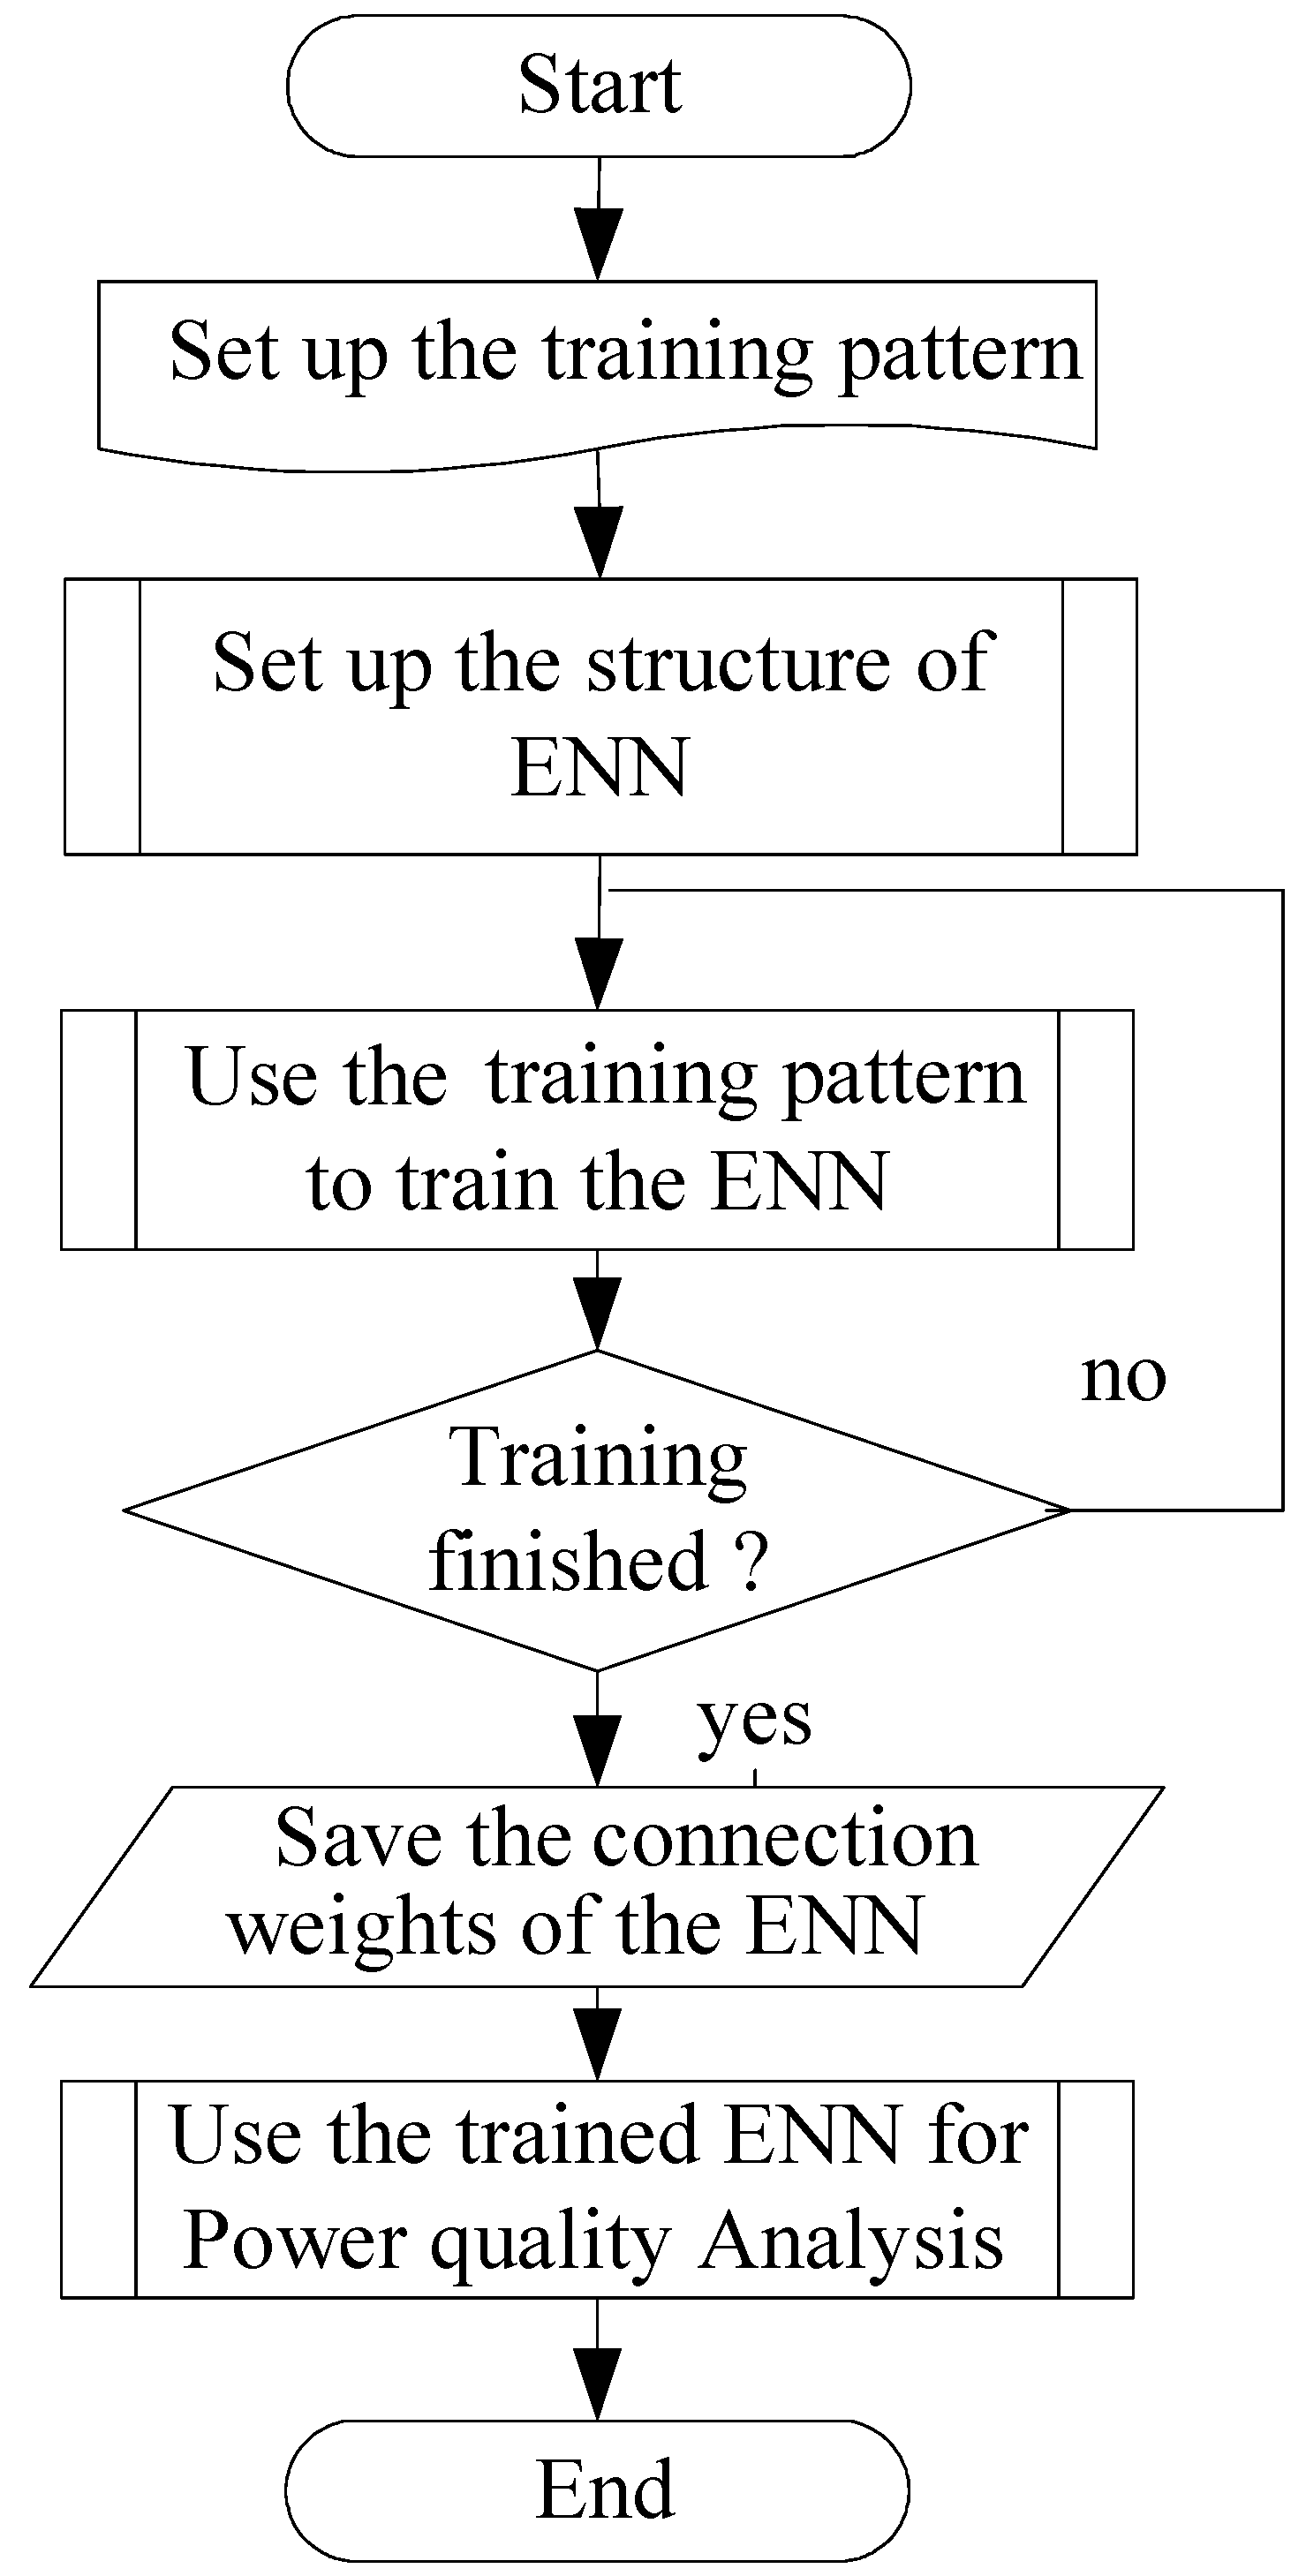
3.2.3. Operation Flowchart of Extension Neural Network

The overall operation flowchart of the proposed ENN is shown in Figure 5. The basic steps in the ENN classification process can be summarized as follows:
Step 1:
Prepare the training samples.
Step 2:
Construct the ENN structure with three input nodes and six output nodes.
Step 3:
Train the ENN using the learning algorithm described in Section 3.2.2.
Step 4:
Return to Step 3 if training process is not finished; else go to Step 5.
Step 5:
Save the connection weights of the trained ENN.
Step 6:
Use the trained ENN to identify the state of the power supply system signal.
Figure 5. Overall operation flowchart of ENN.
Energies 07 06340 g005

4. Simulation Results and Discussion

MATLAB simulations were performed to generate a power signal with five different states, namely normal, voltage swell, voltage sag, interruption and harmonics (see Figure 6). (Note that the power waveform disturbances were generated in accordance with the definitions laid down in IEEE 1159 (1995)). A white Gaussian noise waveform (5% noise) was then generated (see Figure 7) and added to the original power signal (see Figure 8).
Figure 6. Simulated power system signal with various disturbances.
Energies 07 06340 g006
Figure 7. White Gaussian noise waveform (5% noise).
Energies 07 06340 g007
Figure 8. Power system signal with 5% noise addition.
Energies 07 06340 g008
Existing power quality analysis instruments are generally designed to measure the voltage characteristics of the power system. As a result, they are only able to detect disturbances which result in a change in the voltage amplitude (e.g., voltage sag or voltage swell). In other words, disturbances which result in changes in the voltage frequency or the generation of frequency harmonics cannot be directly determined. Moreover, the detection performance of such instruments is seriously degraded by the presence of noise in the power system signal. By contrast, in the chaotic synchronization (CS)-based system proposed in the present study, any changes in the power system signal caused by waveform disturbances or noise result in a significant change in the characteristic features of the chaotic dynamic error trajectory. As a result, the power quality disturbances (i.e., voltage swell, voltage sag, interruption or harmonics) can be directly determined with a high degree of reliability.
Note that in implementing the proposed approach, chaotic waveform conversion is carried out for both the original power system signal (Figure 6) and the power signal with noise (Figure 8). Figure 9, Figure 10, Figure 11 and Figure 12 show the chaotic trajectories of the normal, voltage sag, voltage swell, and harmonics regions of the power system signal shown in Figure 6. The corresponding trajectories for the noisy power system signal shown in Figure 8 are presented in Figure 13, Figure 14, Figure 15 and Figure 16, respectively.
Figure 9. Chaotic trajectory for normal power system signal.
Energies 07 06340 g009
Figure 10. Chaotic trajectory for power system signal with voltage sag disturbance.
Energies 07 06340 g010
Figure 11. Chaotic trajectory for power system signal with voltage swell disturbance.
Energies 07 06340 g011
Figure 12. Chaotic trajectory for power system signal with harmonics disturbance.
Energies 07 06340 g012
Figure 13. Chaotic trajectory for normal power system signal with 5% noise.
Energies 07 06340 g013
Figure 14. Chaotic trajectory for power system signal with voltage sag disturbance and 5% noise.
Energies 07 06340 g014
Figure 15. Chaotic trajectory for power system signal with voltage swell disturbance and 5% noise.
Energies 07 06340 g015
Figure 16. Chaotic trajectory for power system signal with harmonics disturbance and 5% noise.
Energies 07 06340 g016
As expected, the results presented in Figure 9, Figure 10, Figure 11 and Figure 12 show that the chaotic trajectories of the power system signal are all centered at coordinates (0, 0) in the phase plane. Comparing the chaotic trajectory of the normal signal in Figure 9 with that of the voltage sag waveform in Figure 10, it is seen that the attractors in Figure 10 are closer to the center point (0, 0) than those in Figure 9. In other words, the attraction of the center point is stronger in the latter case. By contrast, the attractors in Figure 11 and Figure 12 are further from the center point than those in Figure 8; indicating that the attraction of the center point is weakened in the former cases.
Comparing the chaotic trajectories shown in Figure 9, Figure 10, Figure 11 and Figure 12 with those shown in Figure 13, Figure 14, Figure 15 and Figure 16 it is seen that the attractors of the chaotic trajectories derived from the noisy signal are significantly denser. Thus, in the present study, the characteristics of the chaotic attractors are used to detect the possible existence of external noise interference to the chaotic motion trajectory.
It is observed in Figure 9, Figure 10, Figure 11, Figure 12, Figure 13, Figure 14, Figure 15 and Figure 16, that all of the chaotic trajectories are symmetrical about the origin in both the horizontal direction and the vertical direction. Accordingly, in extracting the three features of the chaotic waveform for classification purposes, the present study selects only those equalization point values of the upper half waveform e2 and lower half waveform e1 within intervals (−1.5, −0.5), (−0.5, 0.5) and (0.5, 1.5), respectively.
To evaluate the performance of the proposed CS-based power quality analysis system, 100 power system signals (with and without noise) were simulated with the five signal states shown in Figure 6 and Figure 8. Furthermore, to demonstrate the versatility of the proposed method, the simulated signals were converted into three different chaotic systems, namely the Lorenz system, the New Lorenz system [23] (see Equation (19)) and the Sprott system [23] (see Equation (20)):
New Lorenz system: { x ˙ 1 = a x 1 b x 2 x 3 x ˙ 2 = c x 2 + e x 3 + x 1 x 3 x ˙ 3 = f x 3 + x 1 x 2
Sprott system:  { x ˙ 1 = x 2 x ˙ 2 = x 3 x ˙ 3 = α x 1 x 2 a x 3 + 2 s i g n ( x 1 )
Note that a, b, c, d, e, f, k, g, h and α in Equations (19) and (20) are positive constants, whose values are determined from the eigenvalues of the corresponding chaos equations [24]. Furthermore, sign (.) in Equation (20) is defined as follows:
s i g n ( x 1 ) = { 1 1 , , x 1 > 0 x 1 < 0
The error states of all three chaotic systems were calculated using the method described in Section 3.1. Table 1 indicates the detection performance of the three CS-based systems for each of the considered system states (namely, normal, voltage sag, voltage swell, interruption and harmonics). Note that results are presented for both the original power system signal and the noisy power system signal, respectively.
The results presented in Table 1 show that the detection accuracy of all three schemes is greater than 95% for each of the considered signal states. Furthermore, it is observed that all of the considered systems have a high robustness toward noise in the power system signal. Finally, it is seen that the Lorenz system yields a marginally better detection performance than the New Lorenz system or Sprott system. In general, the results presented in Table 1 confirm the effectiveness and versatility of the CS-based power quality analysis system proposed in this study.
Table 1. Comparison of detection performance of three CS-based systems.
Chaotic system signalLorenzNew LorenzSprott
NormalWith noise98.5%96%96%
Without noise99.5%97%98.5%
SagWith noise98.%97%97%
Without noise99%97.5%98%
SwellWith noise97%96.5%96.5%
Without noise99.5%98.5%98.5%
InterruptionWith noise98.5%98%97.5%
Without noise100%98.5%99%
HarmonicsWith noise97.5%96%98%
Without noise99.5%98.5%98.5%
Total average With noise98.%96.7%97%
Without noise99.5%98%98.5%
Table 2 compares the detection performance of the proposed Lorenz-based and Sprott-based systems (without noise) with that of five detection systems reported in the literature. It is observed that both CS-based systems yield a higher detection accuracy than the existing methods.
Table 2. Comparison of detection performance of proposed CS-based methods with that of existing methods.
Testing methodSignal processingAccuracy (%)
K-means clusteringWavelet Transform59.2
Fuzzy C-means clusteringWavelet Transform61.2
Extension theoryWavelet Transform85.4
Extension genetic algorithmWavelet Transform91.7
Extension theoryLorenz chaotic system97
Extension Neural NetworkLorenz chaotic system99.5
Extension Neural NetworkSprott chaotic system98.5

5. Conclusions

This study has proposed a hybrid scheme comprising a chaos synchronization (CS)-based detection system and an Extension Neural Network (ENN) clustering algorithm for analyzing four power quality disturbance events, namely voltage sag, voltage swell, interruption and harmonics. In the proposed approach, the ideal power signal and recorded power signal are converted into chaotic trajectories and the dynamic error between the two trajectories is then derived. Three fundamental characteristics of the chaotic dynamic error trajectory are then extracted and supplied to the ENN classification scheme in order to determine the state of the power system signal. The major findings of this study can be summarized as follows:
(1)
The simulation results have shown that given the use of the Lorenz chaotic system, the proposed detection method achieves an average detection accuracy of 99.5% given the absence of noise in the power system signal and 98% given the presence of 5% noise in the power signal.
(2)
The simulation results have confirmed that the proposed detection system can be implemented using various chaotic systems, including the Lorenz system, the New Lorenz system and the Sprott system. In addition, it has been shown that the detection systems based on the Lorenz system and Sprott system, respectively, yield a higher detection accuracy than five existing methods presented in the literature.
(3)
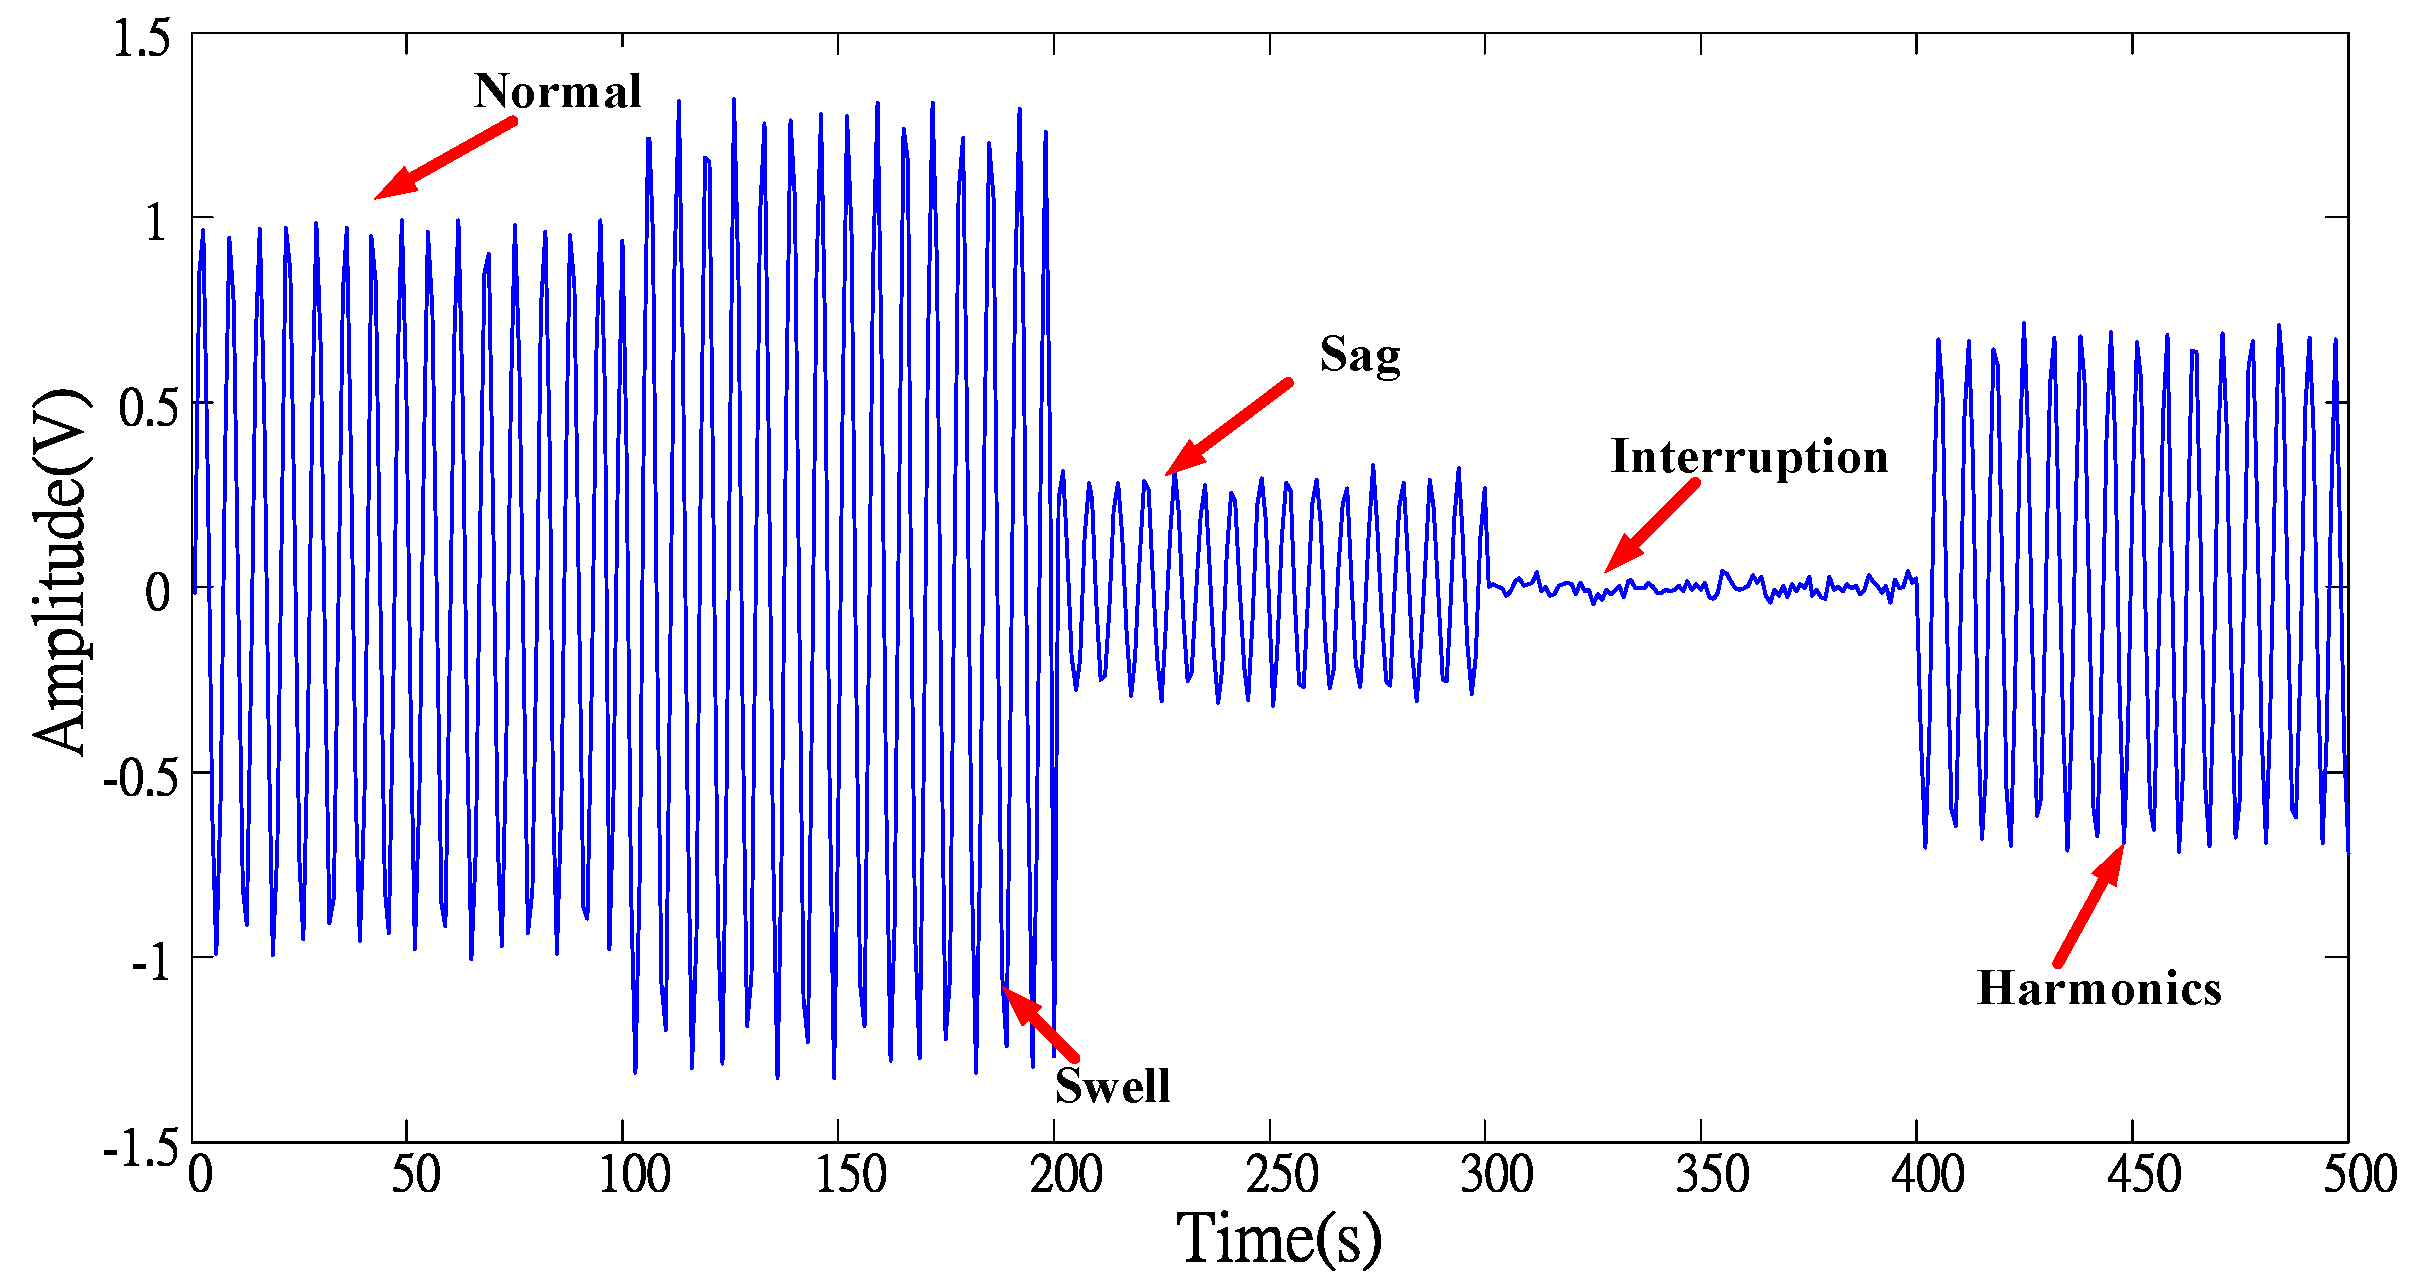
In the ENN classification scheme proposed in this study, the state of the power system signal (i.e., normal, voltage sag, voltage swell, interruption or harmonics) is identified using just three fundamental characteristics of the chaotic dynamic error waveform. Importantly, these fundamental characteristics can be reliably determined even when the power system signal is contaminated by noise. Thus, in contrast to existing methods, the proposed scheme has an improved detection performance when applied to real-world power quality monitoring and analysis applications characterized by the presence of noise.
(4)
The proposed ENN classification scheme has a short learning time, a rapid computation time, a low memory requirement, a high classification accuracy, and good scalability. As a result, it provides an ideal solution for the future development of hand-held power quality analyzers and real-time detection devices.

Acknowledgments

This research was supported by the Ministry of Science and Technology of Taiwan, under Grant MOST 103-2622-E-167-007-CC3 and MOST 103-2221-E-167-034.

Author Contributions

Meng-Hui Wang and Her-Terng Yau developed the theoretical analysis of power system signals by chaos synchronization and then to compare our new method with other method. All authors have read and approved the final manuscript.

Conflicts of Interest

The authors declare no conflicts of interest.

References

  1. Dugan, R.C. Electrical Power Systems Quality 2E; McGraw-Hill, Inc.: New York, NY, USA, 2002. [Google Scholar]
  2. 1159-2009—IEEE Recommended Practices for Monitoring Electric Power Quality; Institute of Electrical and Electronics Engineers: New York, NY, USA, 2009.
  3. Liu, Y.Q.; Wu, G.P.; Hua, H.S.; Wang, L. Research for the effects of high-speed electrified railway traction load on power quality. In Proceedings of the 2011 4th International Conference on Electric Utility Deregulation and Restructuring and Power Technologies, Weihai, Shandong, China, 6–9 July 2011; pp. 569–573.
  4. Arrillaga, J.; Bradley, D.A.; Bodger, P.S. Power System Harmonics; Wiley: Hoboken, NJ, USA, 1985. [Google Scholar]
  5. Gilbert, D.M.; Morrison, I.F. A statistical method for the detection of power system faults. Int. J. Electr. Power Energy Syst. 1997, 19, 269–275. [Google Scholar] [CrossRef]
  6. Yilmaz, S.A.; Alkan, A.; Asyali, M.H. Applications of parametric spectral estimation methods on detection of power system harmonics. Electr. Power Syst. 2008, 78, 683–693. [Google Scholar] [CrossRef]
  7. Chen, L.J. Study of partial discharge measurement in power equipment using acoustic technique and wavelet transform. IEEE Trans. Power Deliv. 2007, 22, 1575–1580. [Google Scholar] [CrossRef]
  8. Santoso, S.; Grady, W.M.; Powers, E.J.; Lamoree, J.; Bhatt, S.C. Characterization of distribution power quality events with Fourier and wavelet transforms. IEEE Trans. Power Deliv. 2000, 15, 247–254. [Google Scholar] [CrossRef]
  9. Pei, S.C.; Yeh, M.H.; Luo, T.L. Fractional Fourier series expansion for finite signals and dual extension to discrete-time fractional Fourier transform. IEEE Trans. Signal Process. 1999, 47, 2883–2888. [Google Scholar] [CrossRef]
  10. Yilmaz, A.S.; Subasi, A.; Bayrak, M.; Karsli, V.M.; Ercelebi, E. Application of lifting based wavelet transforms to characterize power quality events. Electr. Power Syst. Res. 2008, 48, 683–693. [Google Scholar] [CrossRef]
  11. Santoso, S.; Powers, E.J.; Grady, W.M.; Hofmann, P. Power quality assessment via wavelet transform analysis. IEEE Trans. Power Deliv. 1996, 11, 924–930. [Google Scholar] [CrossRef]
  12. Meher, S.K.; Pradhan, A.K. Fuzzy classifiers for power quality events analysis. Electr. Power Syst. Res. 2010, 80, 71–76. [Google Scholar] [CrossRef]
  13. Wang, M.H.; Tseng, Y.F. A novel analytic method of power quality using extension genetic algorithm and wavelet transform. Expert Syst. Appl. 2011, 38, 12491–12496. [Google Scholar] [CrossRef]
  14. Su, H.S.; Zhao, F. Chaos detection method for power quality disturbance. Intell. Control Autom. 2006, 1, 5003–5007. [Google Scholar]
  15. Huang, C.H.; Lin, C.H.; Kuo, C. Chaos synchronization-based detector for power-quality disturbances classification in a power system. IEEE Trans. Power Deliv. 2011, 26, 944–953l. [Google Scholar] [CrossRef]
  16. Yalcin, M.E.; Suykens, J.A.K.; Vandewalle, J. Master slave synchronization of Lur’e systems with time-delay. Int. J. Bifurc. Chaos 2001, 11, 1707–1722. [Google Scholar] [CrossRef]
  17. Dash, P.K. Power quality analysis using S-transform. IEEE Trans. Power Deliv. 2003, 18, 406–411. [Google Scholar] [CrossRef]
  18. Lorenz, E.N. Deterministic nonperiodic flows. J. Atmos. Sci. 1963, 20, 130–141. [Google Scholar] [CrossRef]
  19. Yau, H.T.; Wang, C.C.; Hsieh, C.T.; Cho, C.C. Nonlinear analysis and control of the uncertain micro-electro-mechanical system by using a fuzzy sliding mode control design. Comput. Math. Appl. 2011, 61, 1912–1916. [Google Scholar] [CrossRef]
  20. Pecora, L.M.; Carroll, T.L. Synchronization in chaotic systems. Phys. Rev. Lett. 1990, 64, 821–824. [Google Scholar] [CrossRef] [PubMed]
  21. Chen, G.; Dong, X. From Chaos to Order: Methodologies, Perspectives and Applications; World Scientific: Singapore, 1998. [Google Scholar]
  22. Xu, D.G. Chaos synchronization between two different Sprott systems. Adv. Theory Appl. Mech. 2010, 3, 195–201. [Google Scholar]
  23. Balanov, A.; Janson, N.; Postnov, D.; Sosnovtseva, O. Synchronization: From Simple to Complex; Springer: Berlin, Germany, 2009. [Google Scholar]
  24. Bolotin, Y.; Tur, A.; Yanovsky, V. Chaos: Concepts, Control and Constructive Use; Springer: Berlin, Germany, 2009. [Google Scholar]
  25. Wang, M.H.; Hung, C.P. Extension neural network and its applications. Neural Netw. 2003, 16, 779–784. [Google Scholar] [CrossRef] [PubMed]

