1. Introduction
Biomass gasification technology has a long history worldwide. As early as in 1664, Thomas Shirley started to conduct a simple gasification test [
1]. However, biomass gasification is a relatively new practice in China. Not until the end of the 1980s did China invest much effort in research on gasification technology [
2].
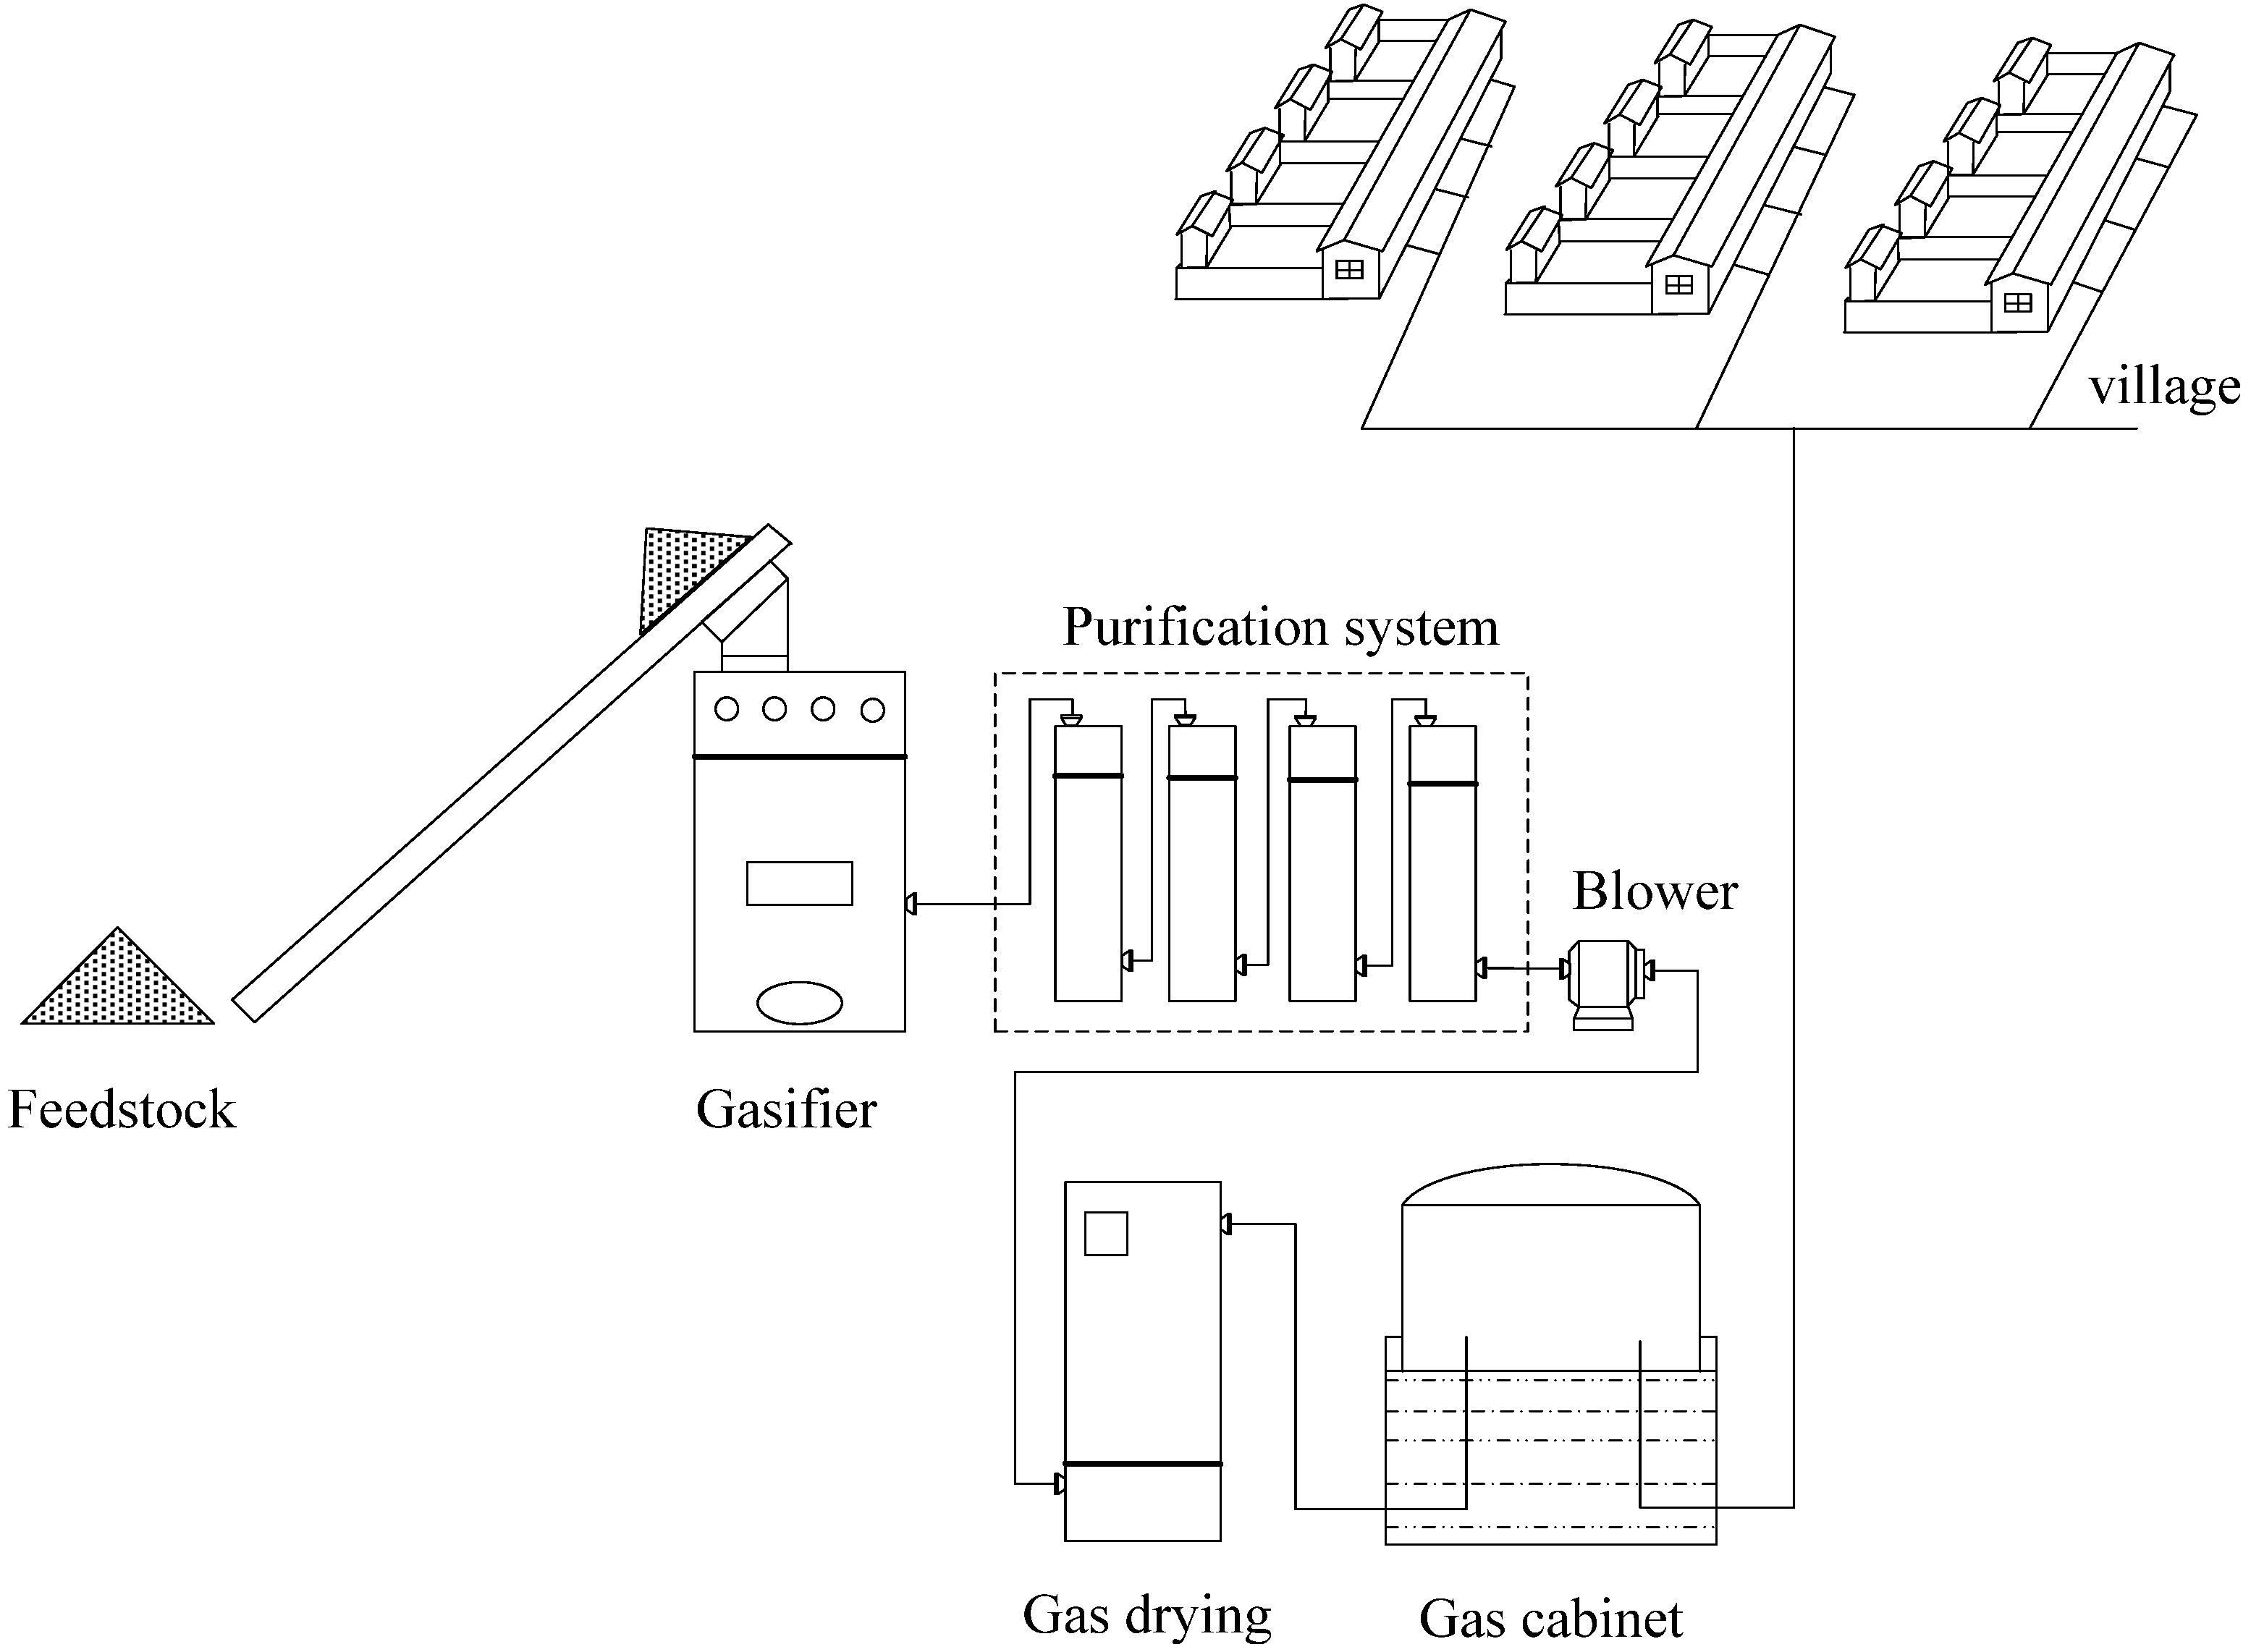
Among various gasification technologies, village-level biomass gasification technology is developed in China’s rural areas to increase income and improve the life of the peasants. It is one kind of pyrolysis gasification technology (a partial oxidation technology) for converting biomass to domestic cooking gas, and it is well favored in rural areas because of its full use of crop stalks and forestry residues and the fact that it is a rather technically feasible and cheap technology compared with other bio-energy technologies [
3,
4,
5,
6]. In about 1997, China started several rural biomass gasification demonstration projects [
4,
7]. By the end of 2005, more than 1000 village-level biomass gasification stations had been constructed, mainly in rural areas of eastern and south-eastern provinces such as Beijing, Shandong and Zhejiang [
3,
4,
8]. Along with other bio-energy technologies such as anaerobic digestion and bio-fuel solidification, biomass gasification has been identified as an important and promising alternative to fossil-fuel energy [
3]. However, with regard to renewable energy initiatives, high-quality, non-renewable energy from the human economy is necessary and is utilized to capture and concentrate lower-quality, renewable resources to deliver energy to society [
9,
10]. The same applies to biomass gasification projects,
i.e., large quantities of external energy and resources are needed to facilitate their construction and operation. Considering the potential widespread adoption in the near future, it is important to characterize the energy and emissions of biomass gasification systems from a life-cycle perspective.
Life-cycle assessment (LCA) is a systematic tool to trace the major stages and processes involved over the entire life cycle of a product from raw-material extraction to end-of-life decommissioning and to quantify environmental burdens at each stage [
11,
12]. As a matter of fact, biomass gasification technology itself has been involved in previous LCA studies. For example, Carpentieri
et al. compared a biomass gasification combined cycle (IBGCC) and a coal gasification combined cycle (ICGCC) and found environmental advantages of IBGCC in terms of reduction of both GHG emissions and natural resource depletion [
13]. The work of Koroneos
et al. focused on the environmental impact and efficiency of producing hydrogen from two different biomass gasification processes,
viz, biomass gasification followed by reforming of the syngas and gasification followed by electricity generation and electrolysis [
14]. It is very important to note that Lu and Zhang conducted a life cycle analysis of biomass energy conversion technologies including crop residue gasification in China using hybrid life-cycle method [
15], the results of which was adopted for comparison. Overall, most studies available focus on the LCA of biomass gasification and power generation or on gasification and combined heat and power, while China’s rural-village-level biomass gasification system has not been sufficiently addressed as well as the accounting of its nonrenewable energy cost and GHG emissions [
16]. In addition, it is worth noting that previous LCA studies of biomass gasification projects have employed mainly the process-based life cycle assessment method, which is the conventional and better-known approach and has received attention in much of the work of the U.S. Environmental Protection Agency (USEPA) [
17] and the Society for Environmental Toxicology and Chemistry [
18,
19]. By its nature, the process-based LCA method implies a degree of truncation error due to the exclusion of processes because it is impossible to trace all the direct and indirect interactions and the environmental burdens considering that each industry is dependent, directly or indirectly, on all other industries [
12]. To reduce truncation error, hybrid LCA approaches have been developed by combining process-based and economic input-output LCA (EIO-LCA) approaches to describe the complex interdependencies of industrial sectors within a national economy [
20,
21]. The EIO-LCA method is an extension of economic input-output analysis to the physical realm that has been developed in the USA by researchers at Carnegie Mellon University (CMU) [
22,
23].
This paper aims to systematically evaluate the renewability of a typical village-level biomass gasification system in rural China from the perspective of nonrenewable energy cost and GHG emissions. The nonrenewable material and energy inputs and related GHG emissions over the entire life cycle of this gasification system were taken into consideration,
i.e., from station construction, equipment manufacturing, operation and maintenance, and lastly to its disassembly and disposal. The rest of this paper is structured as follows:
Section 2 introduces the hybrid method and then main parameters of the village-scale biomass gasification system are described in
Section 3; in
Section 4, the main results for nonrenewable energy cost and associated GHG emissions are reported and compared with natural gas production in China and then discussions focusing on the shortcomings are presented;
Section 5 illustrates a sensitivity analysis; Conclusions are given in the final section.
2. Methodology
To assess the net environmental impacts associated with delivering a product or service in its life cycle as popularly known as LCA, three methods can be used,
i.e., process-based, EIO and hybrid. The process-based LCA is commonly used according to guidelines and principles delineated by the International Standards Organization (ISO). It is based on a bottom-up model of a supply chain in which each constituent process is described in terms of material inputs and environmentally significant releases or outputs. The inventory compilation method ranges from the simple constituent summing of a supply chain to a matrix formulation that holistically accounts for circularity [
12]. The EIO-LCA is a top-down approach based on economic input-output (IO) tables. The EIO model was developed by Wassily Leontief to quantify the relationships between different sectors of an economic system by considering monetary transactions amongst them [
24]. The most detailed IO tables in China divide the economy into 135 sectors. The most important characteristic of an EIO-LCA model is that both direct and indirect (embodied) inputs are taken into consideration. It is worth noting that calculation of embodied energy inputs and environmental burdens can be easily accomplished by matrix inversion. Material use in the supply chain or emissions associated with manufacturing a product can be determined by multiplying the supply intensity of the relevant sector by the cost price of the product [
22].
Both methods have advantages and disadvantages. The process-based LCA method can describe elements in a supply chain accurately, but lack of data leads to truncation error due to excluded processes, especially production of capital goods and input of services. The EIO-LCA models, which are based on national or regional sectoral data, are holistic but suffer from aggregation error due to coarse graining of processes. Hybrid LCA methods have been explored to reduce these two errors, by combining bottom-up process-based and top-down economic input-output methods [
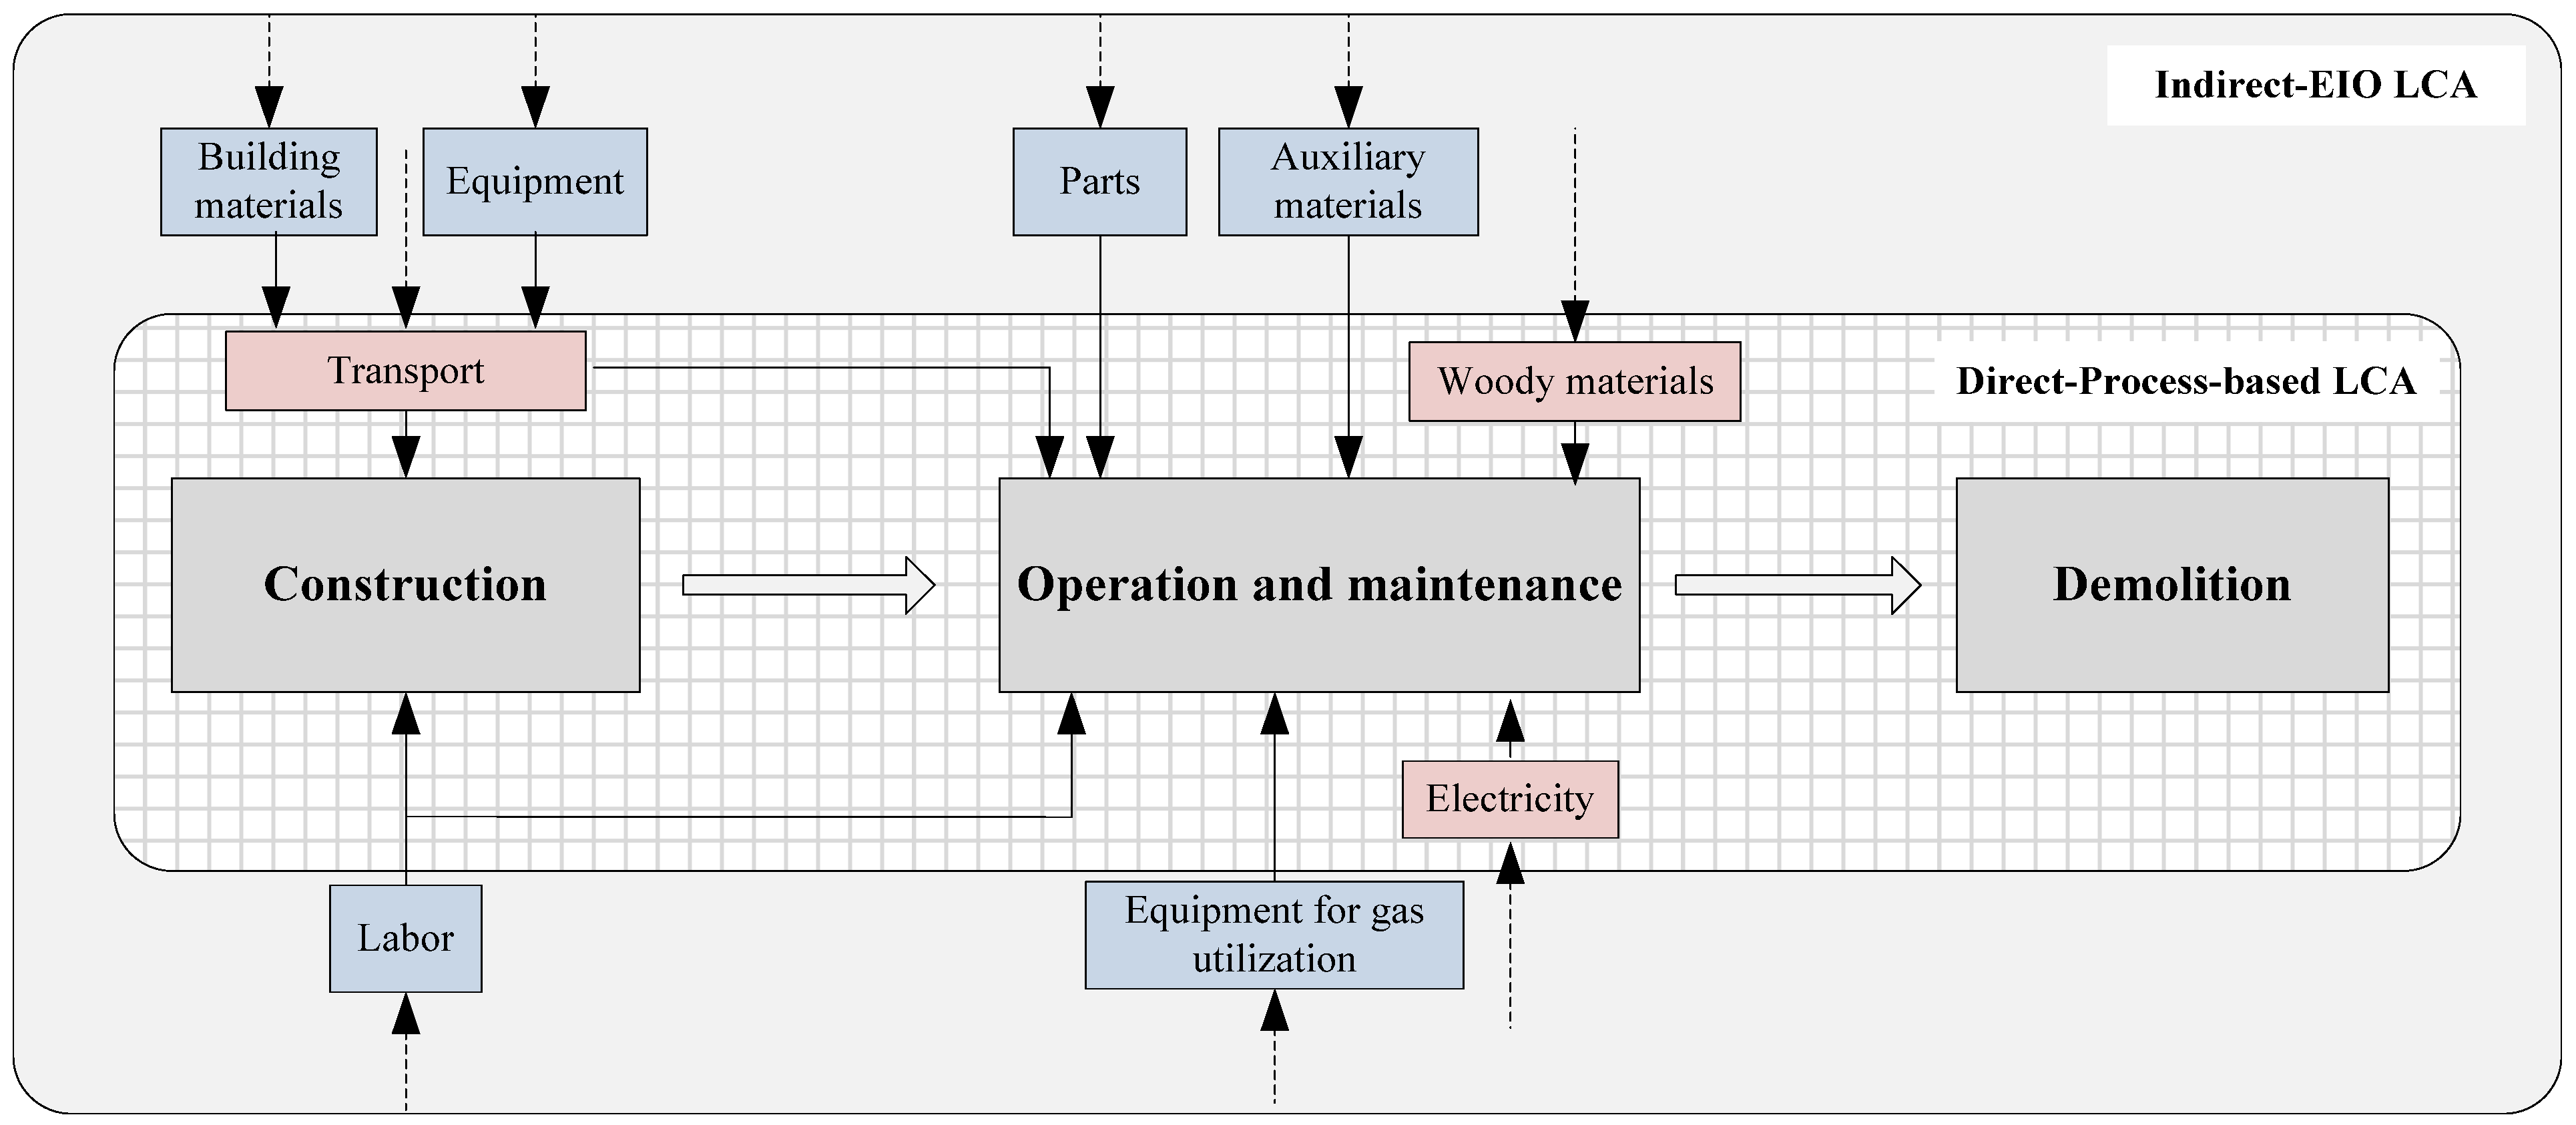
25]. This study uses an additive hybrid method based on the following fundamental equations,
i.e., process-based LCA is used to quantify the direct energy inputs and direct GHG emissions associated with fuel combustion within a life cycle, while the EIO-LCA is used to trace all the indirect energy use and the indirect GHG embodied in the materials and services necessary for construction, operation and demolition of the gasification project:
where E
total and NE
total are the total energy and nonrenewable energy invested in the village-level biomass gasification project, respectively. GHG
total is the total GHG emissions associated with nonrenewable energy use. E
p, NE
p and GHG
p are direct energy and nonrenewable energy input and GHG emissions due to fossil fuel combustion during the process of gasification station building, equipment manufacturing, operation and maintenance, and demolition, expressed as the sum of the product of fuel combustion and direct energy intensity or emission factors. E
EIO, NE
EIO and GHG
EIO are the indirect energy, nonrenewable energy and GHG emissions of the project from EIO-LCA, which accounts for the indirect fossil-fuel energy needed and emissions associated with resource and labor inputs during their production within the national economic system. In our previous work on the hybrid LCA assessment of a household biogas project, an EIO-LCA model based on a 43-sector IO table was adopted [
26,
27], while in the present study we constructed a more exhaustive model based on the 135-sector IO table.
4. Results and Discussion
4.1. NE Cost and GHG Emission Cost
The total energy requirement (Etotal) of the village-level biomass gasification system is accounted to be 9.19 × 10⁷ MJ, according to Equations (1–3), of which about 30% is derived from nonrenewable energy (NEtotal). As mentioned above, two joint products are produced from this gasification system, i.e., biomass gas and charcoal, with annual outputs of 4.50× 10⁻² million m3 and 27 tons, respectively. The energy inputs and associated emissions from the entire life cycle of this project are allocated to these two outputs on the basis of their energy content. Therefore, the energy cost ratio of the biomass gas production is 2.93, and more importantly, the nonrenewable energy cost ratio is 0.89, indicating that 0.89 J of nonrenewable energy is needed to produce one joule of biomass gas. Dividing total NE invested by annual energy output, the energy payback time (EPBT) is calculated to be 17.82 years, indicating a poor energy input-output efficiency.
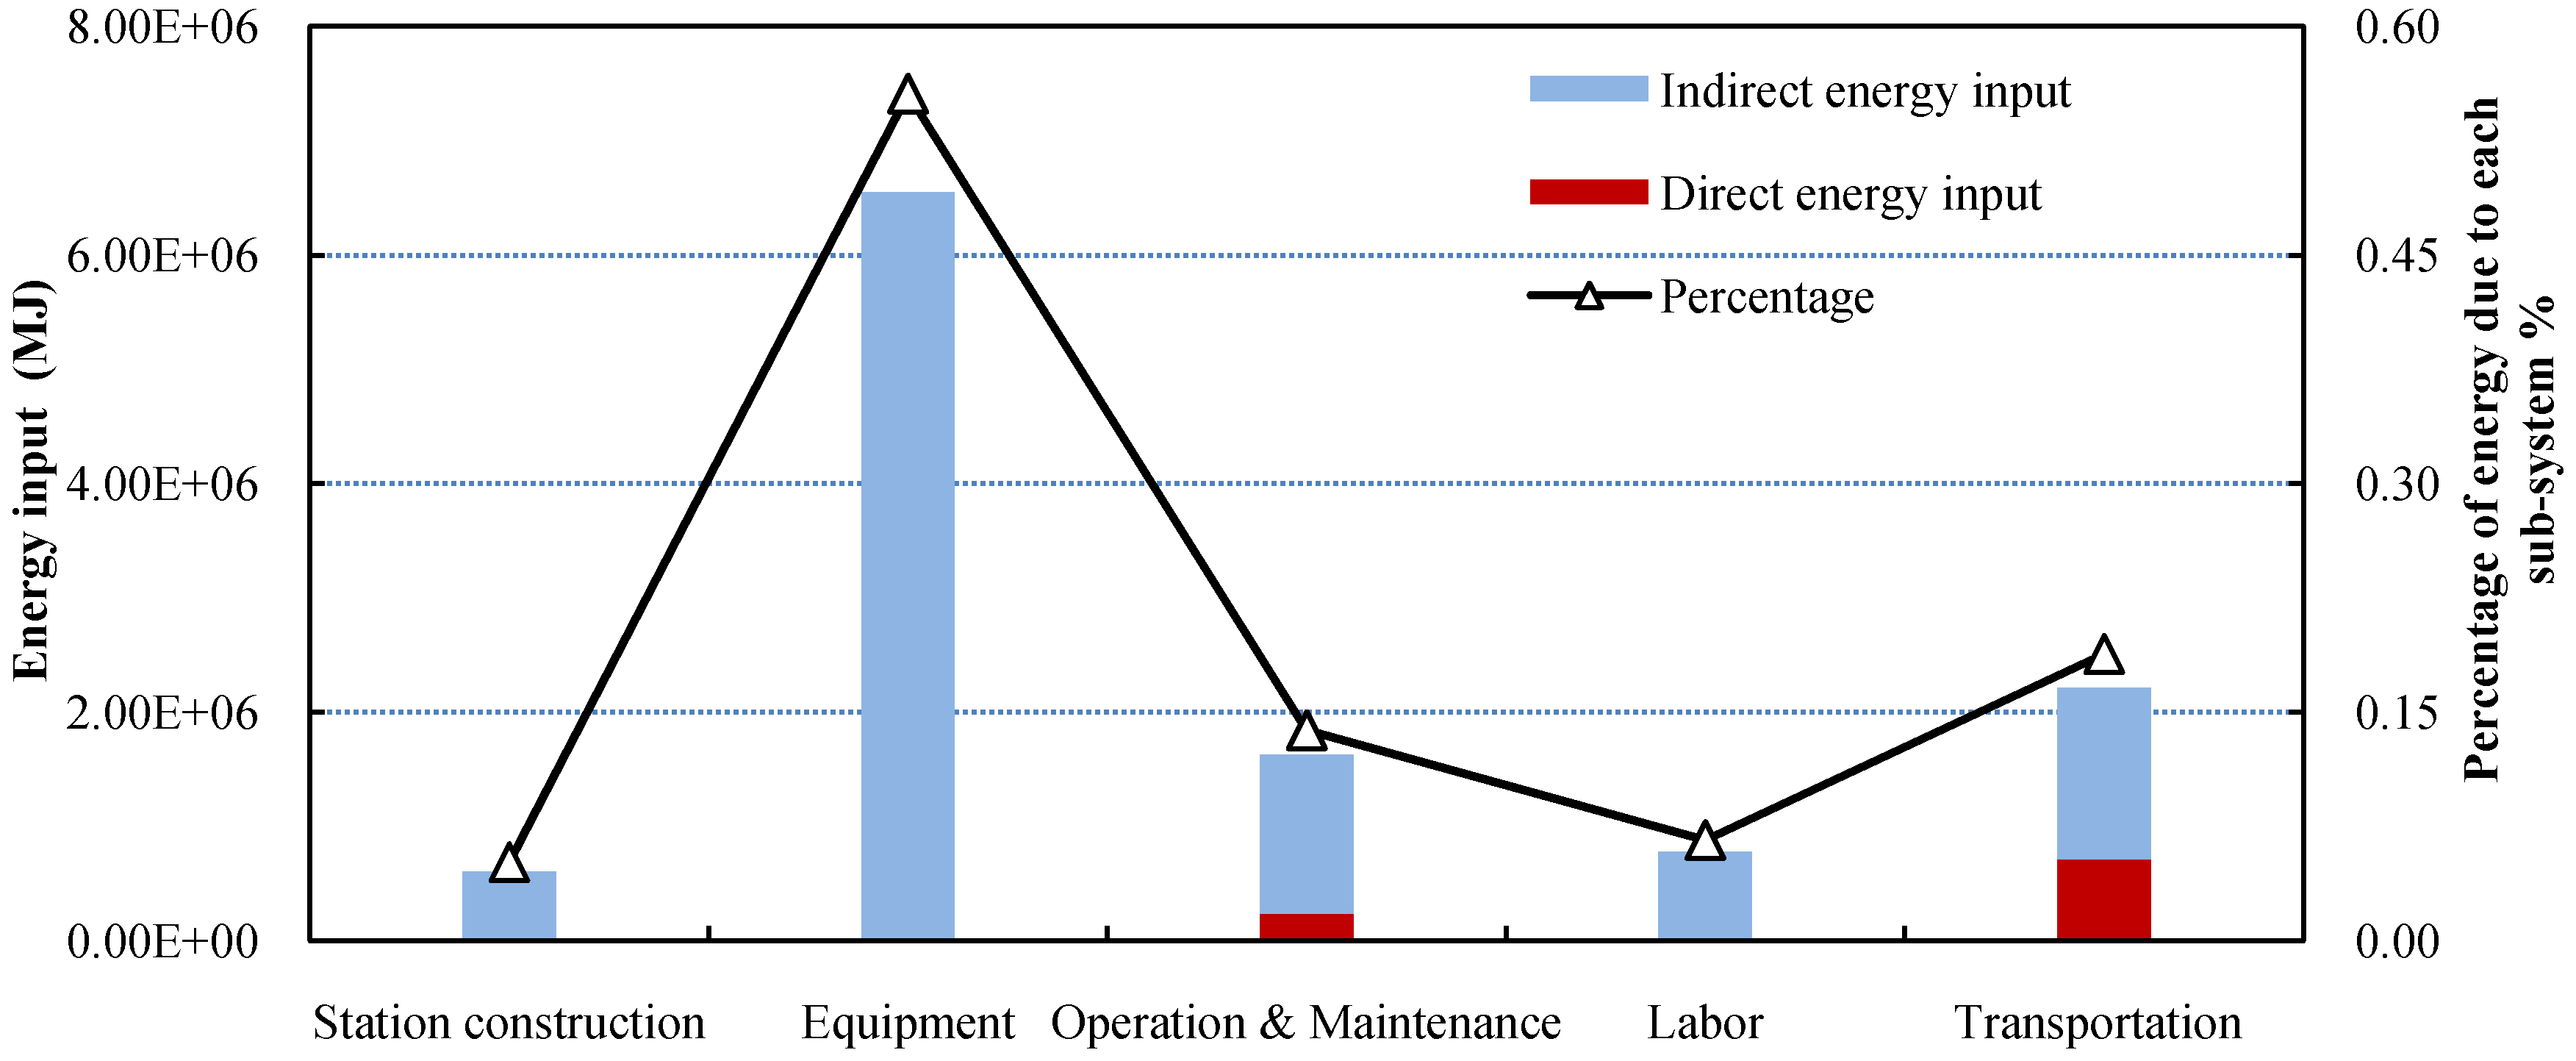
With regard to the direct and indirect energy inputs of this system, the direct nonrenewable energy from electricity and oil use is 9.54 × 10
5 MJ, accounting for only 8.10% of the total, while most of the NE cost is due to indirect energy use (see
Figure 3). Further analysis of the NE investment in each component shows that the largest contributor to NE consumption is equipment manufacturing, accounting for 55.61% of the total. About 18.83% of the NE investment is derived from transportation (of which 49% is from the construction stage and 51% is from operation and maintenance), nearly 70% of which is related to the NE calculated by EIO-LCA, indicating a high NE intensity for oil production. Operation and maintenance also contribute a considerable percentage of the NE requirement (13.83%), nearly 90% of which is attributable to the production of woody materials (including woody materials for combustion and gasification) and electricity consumption.
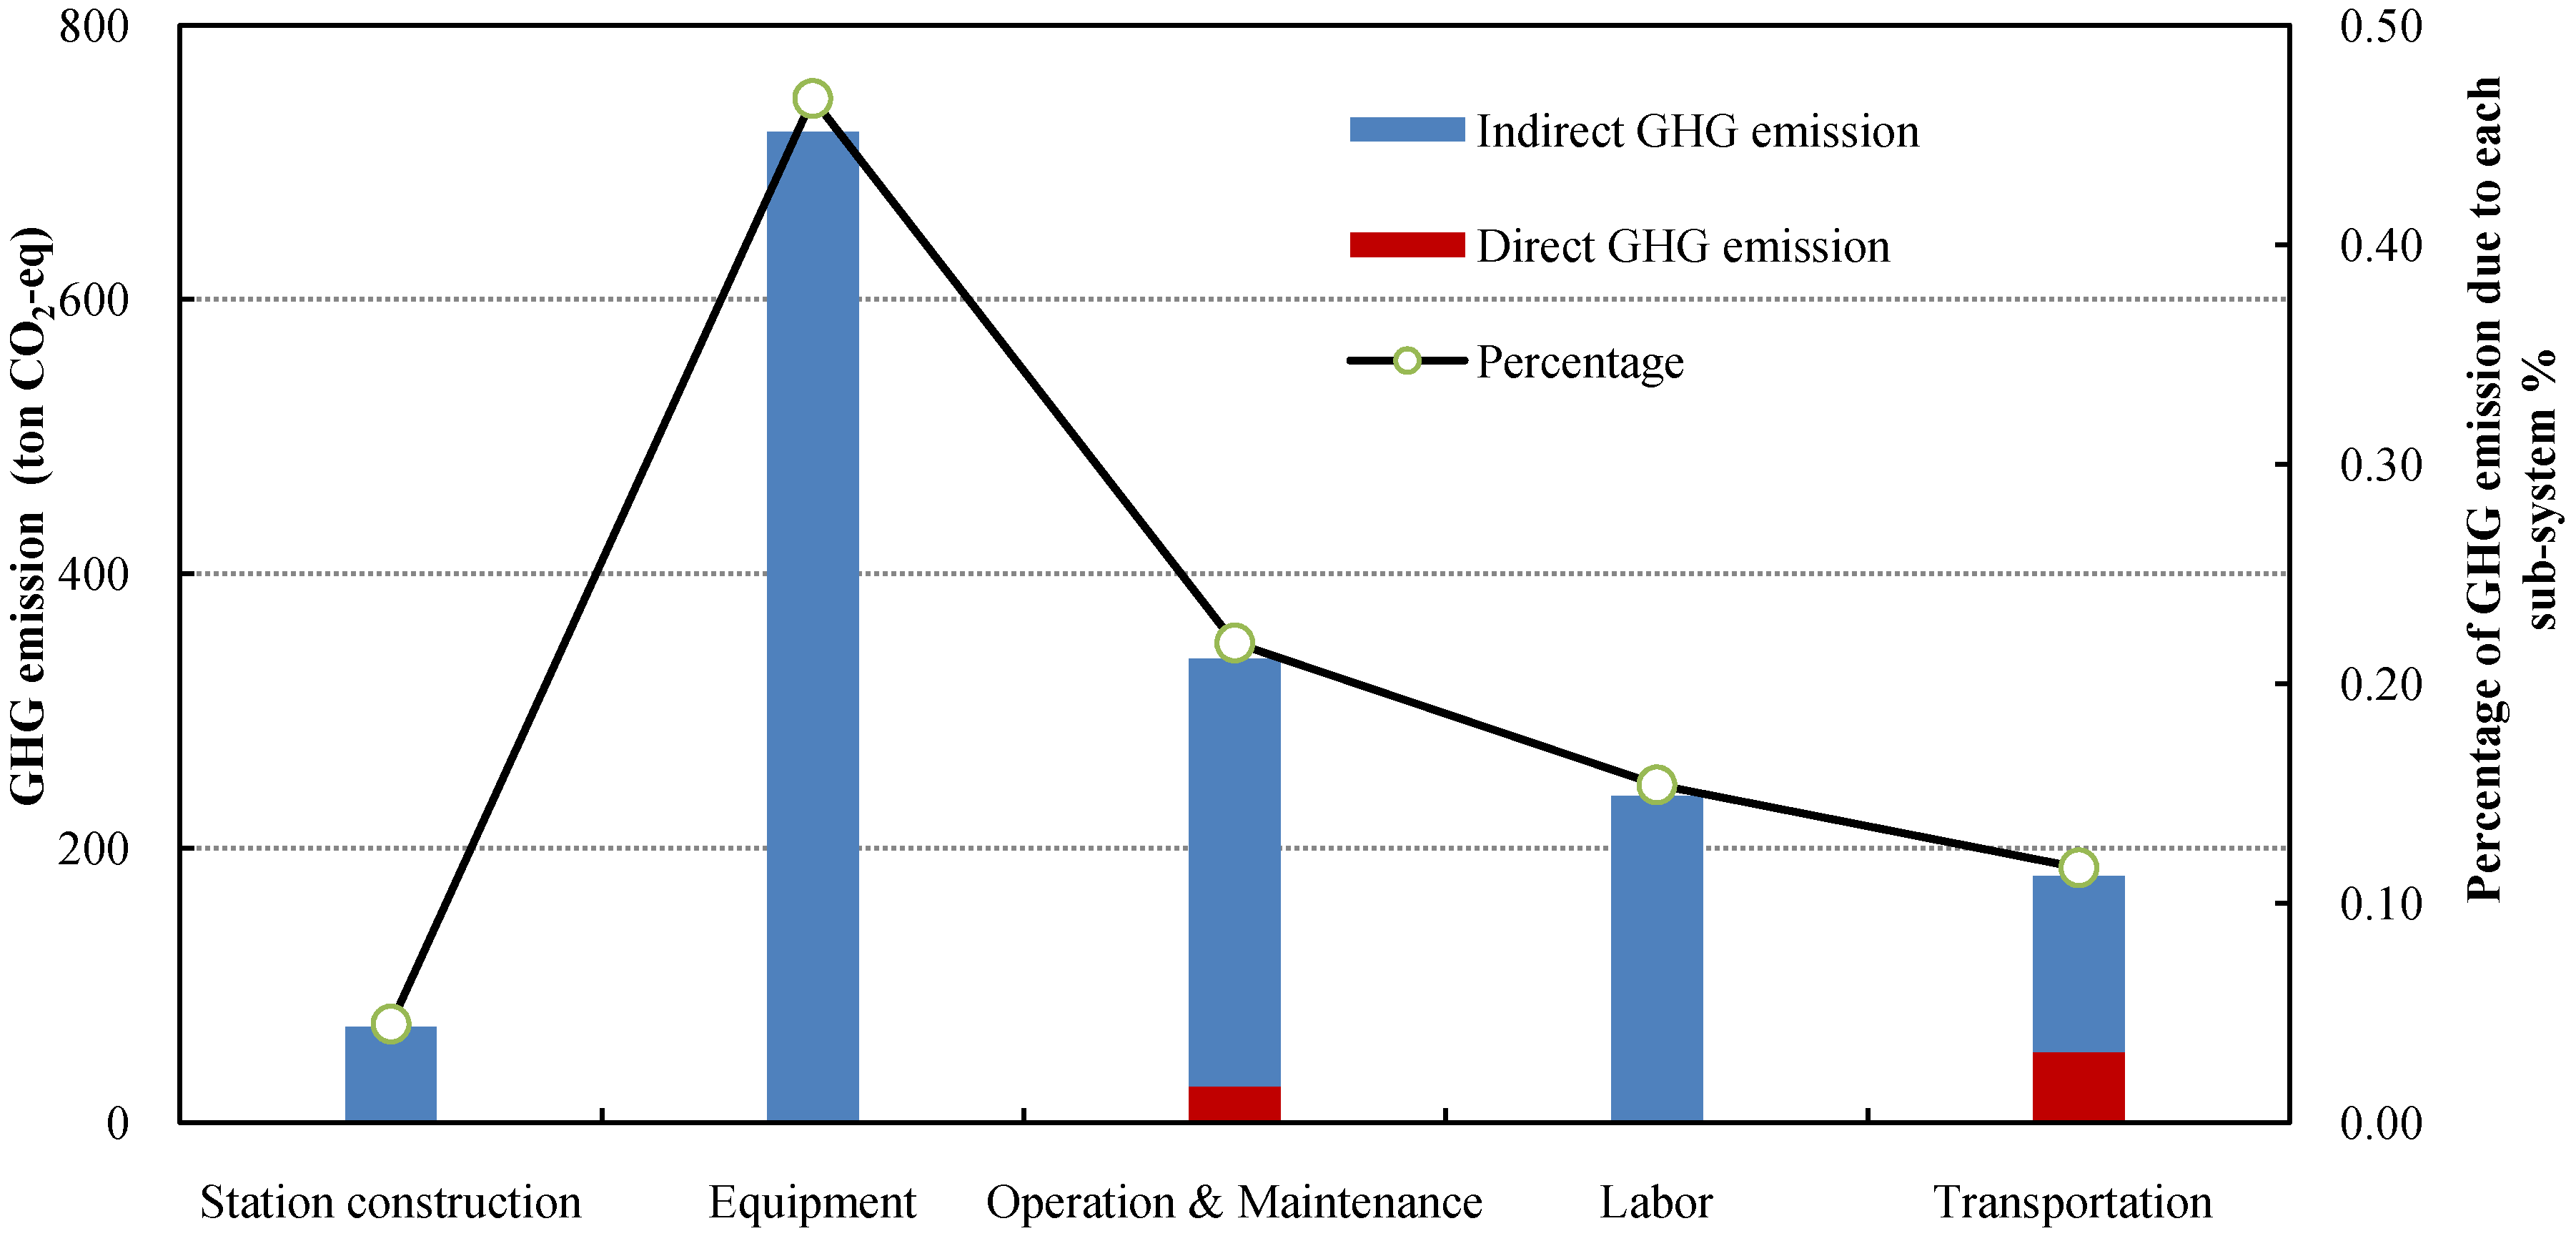
GHG emissions caused by the project have been analyzed in a similar way. It must be noted that CO
2 emissions from combustion of woody materials are not taken into consideration because the process is carbon neutral. However, Other GHGs (CH
4 and N
2O) and indirect emissions from woody material production are calculated. The total GHG emissions for a 20-year village-level biomass gasification project are estimated to be 1.55 × 10
3 tons CO
2-eq (allocated to biomass gas output). Thus, an embodied GHG emission of 1.17× 10
−4 g CO
2-eq/J is found for the gas produced from this biomass gasification project. As shown in
Figure 4, indirect GHG emissions account for nearly 95% of the total, while only 5.04% of emissions are caused by direct woody material and oil consumption. In addition, GHG emissions due to equipment manufacturing and operation and maintenance also account for large proportions of the totals (47% and 20%, respectively). To account for the indirect GHG emissions from labor input by the EIO-LCA model, the matching sector is usually approximated as a sector of the main product of the system [
35]. In the present study, the focused product is cooking gas, which belongs to the forestry sector. Although the sector has a low embodied GHG emission intensity, the input of labor accounts for a relatively large percentage of total emissions (15.38%), of which about 95% is caused by annual labor input in operation and maintenance and small part derived from construction stage.
Figure 3.
NE cost due to each sub-system in the life cycle of a village-level biomass gasification project.
Figure 3.
NE cost due to each sub-system in the life cycle of a village-level biomass gasification project.
Figure 4.
GHG emissions associated with each sub-system in the life cycle of a village-level biomass gasification project.
Figure 4.
GHG emissions associated with each sub-system in the life cycle of a village-level biomass gasification project.
The energy inputs and GHG emissions to gasifying one ton of woody materials are 1.35 × 10
4 MJ and 0.54 tons CO
2-eq, respectively, during the entire life cycle, which is nearly seven times higher and 65% lower than the results reported by Lu and Zhang [
15]. In the gasification case by Lu and Zhang, the feedstock is corn stover and GHG emissions derived from the production of feedstock accounts for nearly 98% of totals due to crop cultivation, corn stover collection and land use change. However, the relatively low energy cost of their study is due to the exclusion of equipment invested in gasification and related indirect energy inputs from the inventory list. For bio-energy projects, such as corn ethanol production, it is commonly found that the operational NE or GHG emission costs contribute to the majority of totals because of large feedstock and labor inputs [
36,
37]. However, the percentage of operational cost in this gasification project is relatively lower than that of capital inputs, which can only partly be explained in terms of the high equipment investment and to a greater extent, is attributed to the low operating efficiency (cannot operating at full capacity).
4.2. Comparison with Natural Gas Production
Mainly used for cooking, gas produced from a village-level biomass gasification project can be regarded as an alternative to natural gas, which also consumes nonrenewable energy and hence emits GHG, mainly during the production and combustion processes. According to the available results, the national NE intensity and GHG emissions of natural gas production are 4.60 × 10
11 J/10
4 m
3 and 8.08 tons CO
2-eq/10
4 m
3, respectively [
38]. The NE and GHG caused by natural gas combustion are included, while GHG emissions of biomass gas are ignored because of the carbon-neutral consideration [
31,
32,
33]. Due to the differences of calorific value and thermal efficiency of these two kinds of cooking gas, one cubic meter (m
3) of biomass gas can only substitute 0.38 m
3 of natural gas to provide equivalent effective value for cooking [
39,
40,
41], from which it can be calculated that more life cycle fossil energy cost by 0.07 J and GHG emissions cost by 8.92 × 10
−5 g CO
2-eq to use 1 J of gas from biomass gasification than natural gas. Correspondingly, the total fossil energy and GHG emission increments will be 8.82 × 10
5 MJ and 1.18 × 10
3 tons CO
2-eq, respectively, compared with natural gas, with regard to the total life cycle biomass gas production of 6.62 × 10
5 MJ.
4.3. Discussion
The calculations and comparison results of NE and GHG emission intensity indicate a low renewability of the village-level biomass gasification project and a disappointing GHG emission mitigation effect. According to the analysis above, about half of NE and GHG emissions are derived from equipment manufacturing, which can be assessed during the lifespan of the project. However, as an emerging source of renewable energy, it has been reported that nearly 70% of the demonstration projects have been abandoned or demolished [
42,
43,
44]. For example, a case study of seven biomass gasification projects in Shandong Province found only one station that was still in operation and in good condition; the others had been scrapped [
3]. Also, from results of local investigation, nine village-level projects were established in Miyun County of Beijing from 2005 to 2007, but five of them have been scrapped so far. The gasification station has provided cheap and convenient cooking fuel to local village, but the high operational costs are mostly undertaken by local government. The small-scale bio-energy project concerned in this study has also fallen into dilemma and is estimated to be scrapped within several years. The main shortcomings contributing to these disappointing performances are decentralized construction, low technical level and low utilization rate of by-products, as shown in our research and in previous studies [
45,
46].
The decentralized construction of a biomass gasification project is adaptable to the distribution of villages in rural areas. However, decentralized distribution also brings high cost of raw material collection and low efficiency of the gasification system. In the present case study, to produce 1 m3 of biomass gas, 5.80 kg woody materials are needed, i.e., an annual requirement of 261 ton (including wood for gasification and gasifier heating). The woody materials are all bought from Hebei Province (a province close to Beijing) because of shortage in local areas, leading to a high operational cost of the project because of increasing price (from 300 CNY/ton in 2007 to 420 CNY/ton in 2011). In addition, the biomass gas outputted cannot be adequately stored due to the unmatched gas cabinet, leading to idling of equipment. In our research, the gasification project is run every two days. If the gasification system can be operated at full capacity, the NE cost and GHG emissions will decrease to 0.57 J/J and 8.01× 10⁻⁵ g CO2-eq/J, strengthening competitiveness to natural gas and also increasing economic returns.
Pyrolysis gasification technology was designed two decades ago for application in rural areas. To lower cost, the gasification equipment often has a simple structure and insufficient purification devices, resulting in tar jamming. The gasification station was originally conceived to make full use of local agricultural and forestry residues, while it actually used crop stalks as raw materials for only two months because of technical obstacles in tar treatment and calorific value stability. The calorific value of cooking gas produced by the system is too low compared with natural gas or liquefied petroleum gas (LPG). To achieve the goal of providing alternatives to fossil-fuel energy and thus GHG emission mitigation, much effort must be made to improve the technology of village-level biomass gasification. The economic efficiency of village-level bio-energy plays an important role in its promotion or demission. Byproducts such as tar and wood vinegar produced by the gasification project should be fully used to increase incomes because of the low price of cooking gas. In the studied project, most of the tar was mixed with waste wood and combusted to heat the gasifier, while the wood vinegar was contained in the pool and treated as complete waste. In reality, tar and vinegar are excellent raw materials for industry. They can be processed to produce preservatives, softeners, organic fertilizer and other products. Even if sold as primary product, they can also increase the economic returns of projects. However, a systematic assessment is also required to determine whether the deep processing of tar and vinegar has positive or negative impact on energy saving and emission reduction.
5. Sensitivity Analysis
It is important to note that our study suffers from some uncertainty. In addition to uncertainty inherent in EIO-LCA model, such as aggregation from coarse graining of processes into sectors [
45], the results of our analyses of the life cycle inventory are subject to the changes in several parameters, such as LHV of gas, gas generation capacity, capital costs, gasifier costs, feedstock supply price as well as transportation and labor in the plant building and equipment manufacturing [
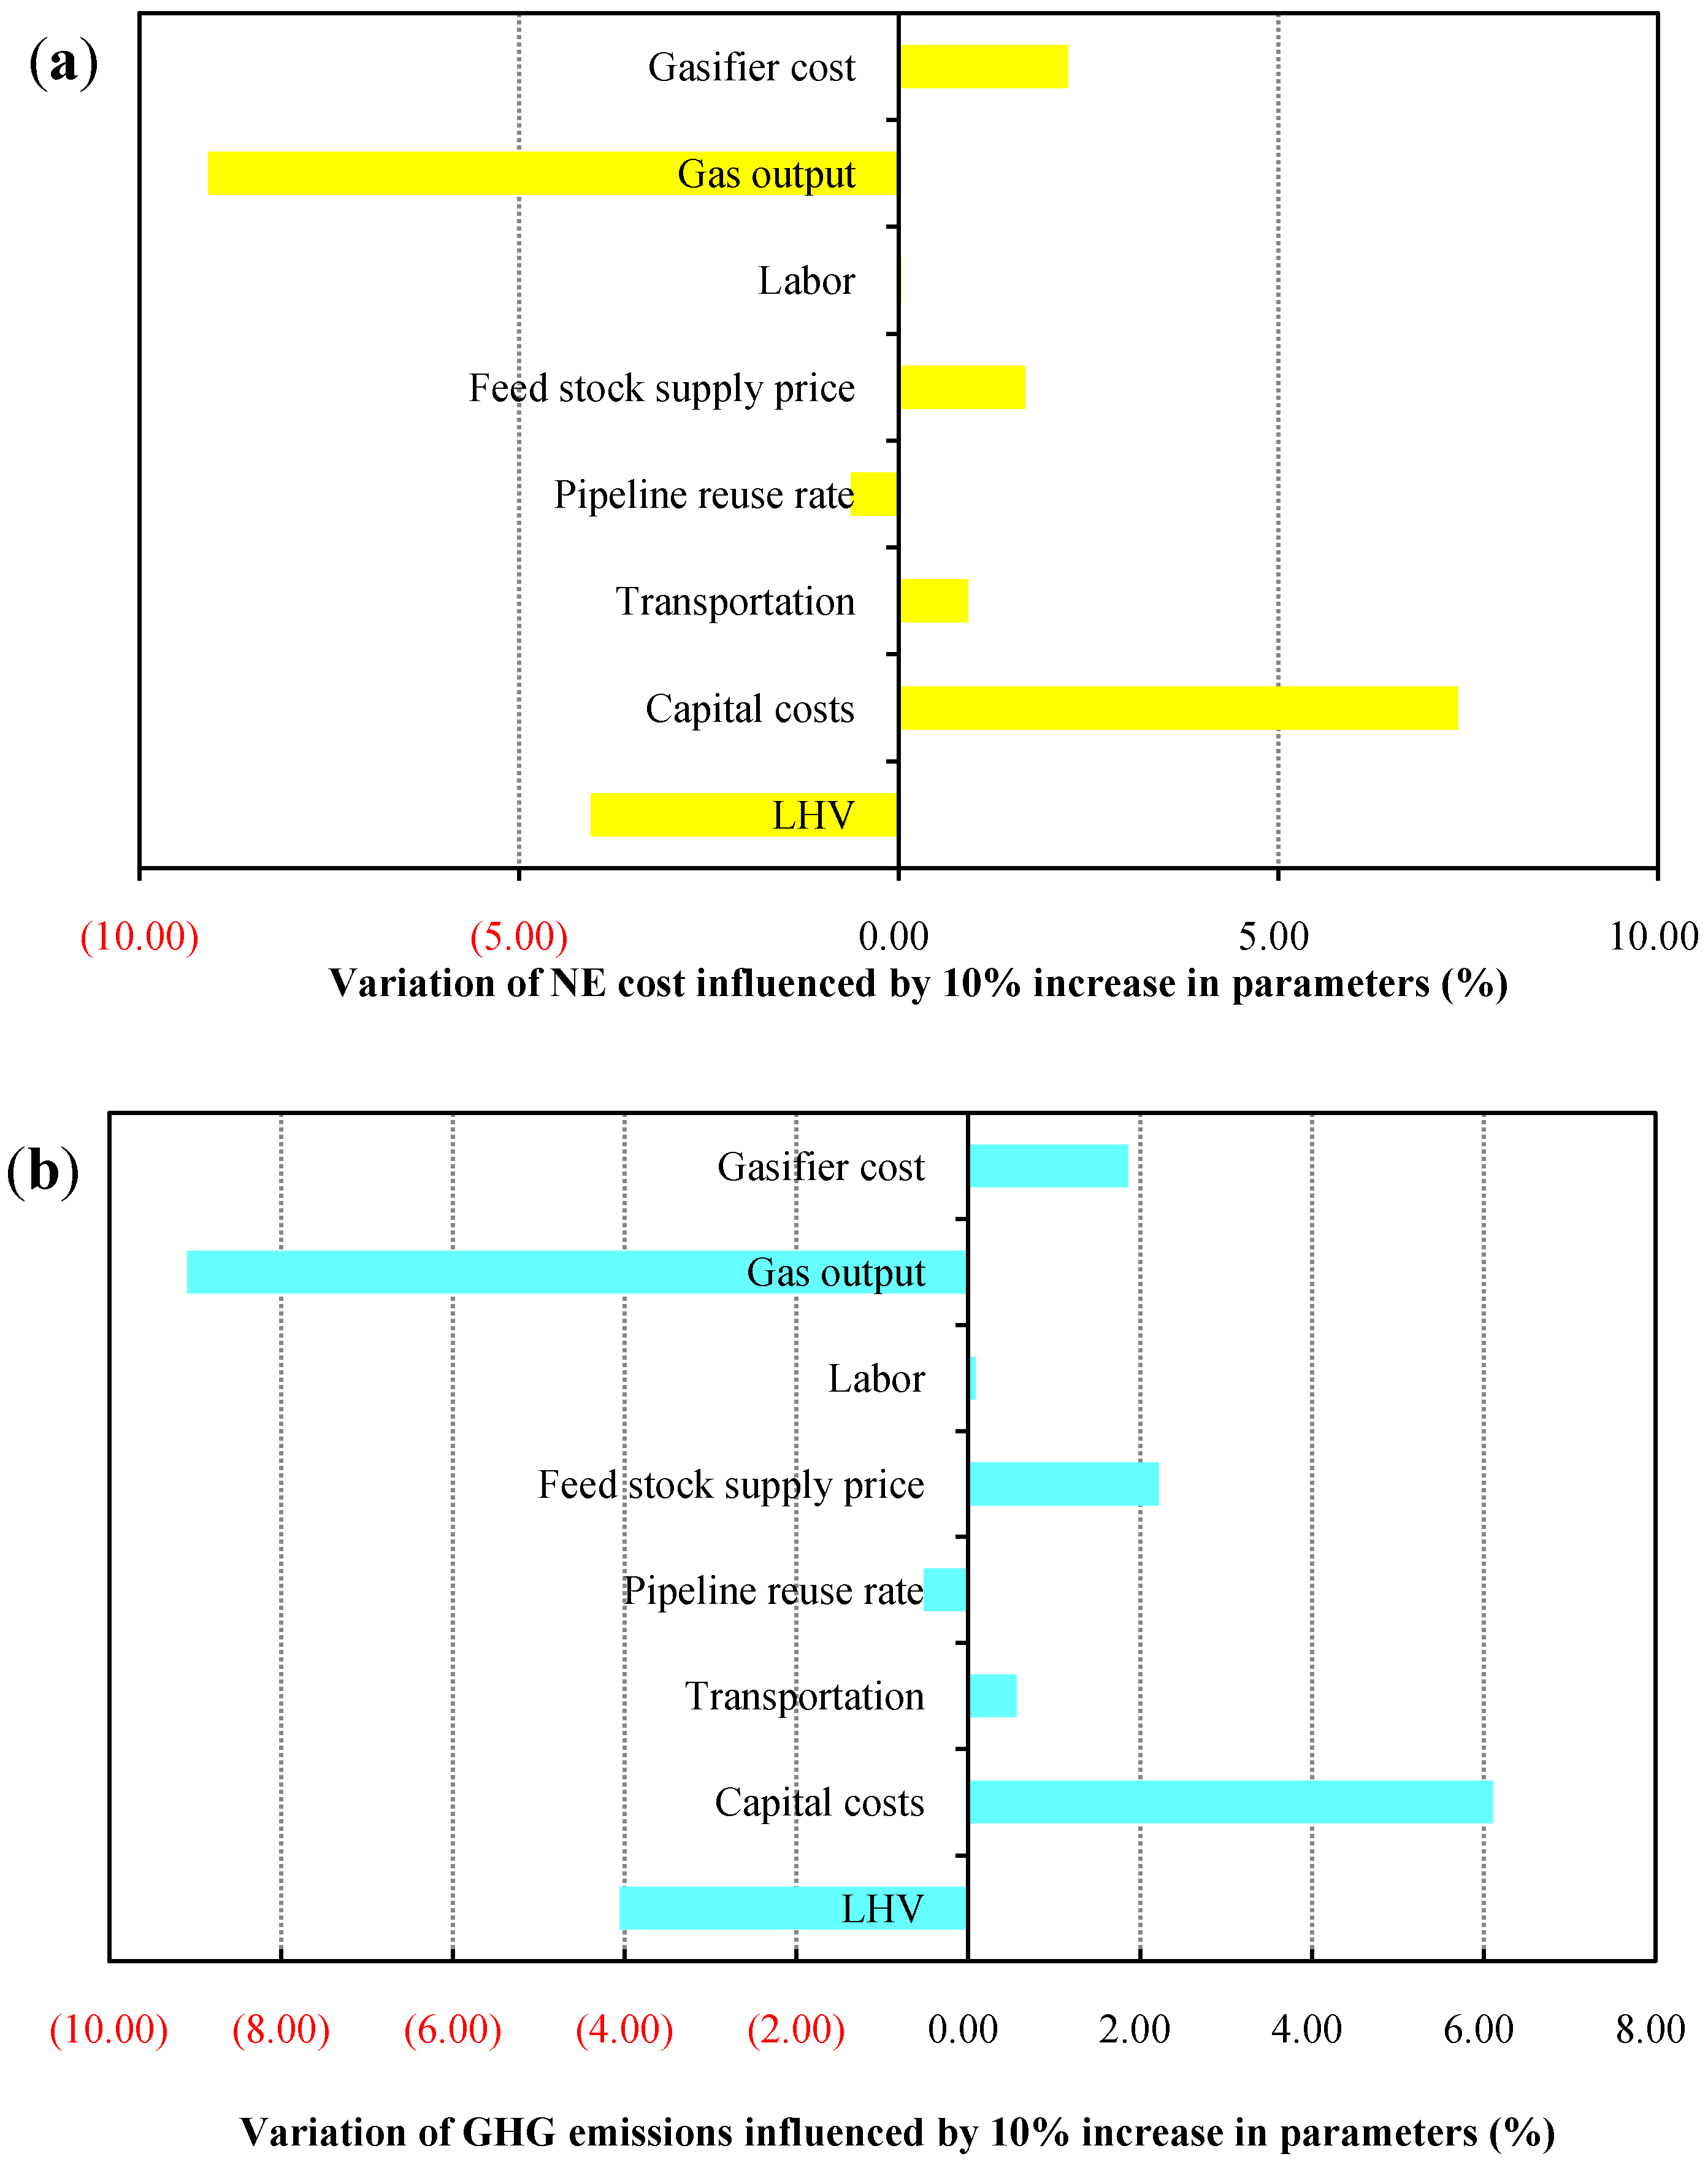
15]. Therefore, a sensitive analysis was conducted to find to what extent of uncertainty of these parameters influence the NE cost and associated GHG emissions. As shown in
Figure 5(a,b), all parameters variation by 10% have similar effects on both nonrenewable energy cost and GHG emissions from the life cycle of the gasification project, since nonrenewable energy consumption and GHG emission are correlated with each other. Nevertheless, the most sensitive parameter is gas output with regard to the NE cost and its varying by ±10% affects the NE cost with an uncertainty of ±9.09%. In addition, the same magnitude of variation in LHV of gas and capital costs also significantly impact NE cost by ±4.05% and ±7.37%, respectively. As the most perishable equipment of the gasification system, variation of up to ±10% in gasifier costs causes changes in NE cost of ±2.23%. Correspondingly, the gas output and capital costs are also the most two sensitive factors to the GHG emissions, with uncertainties of ±9.09% and ±6.11%, respectively. Uncertainties about other factors were found to weakly affect the NE cost and GHG emissions (about ±1%).
Figure 5.
Sensitivity analysis of parameters (variation by 10%) related to NE cost (a) and associated GHG emissions (b).
Figure 5.
Sensitivity analysis of parameters (variation by 10%) related to NE cost (a) and associated GHG emissions (b).
The sensitive factors should be paid attention to by policy-makers in China over decisions about the future development of village-level biomass gasification project, e.g., increasing gas generation capacity and its quality as well as decreasing the equipment inputs by technological innovation. Moreover, the results of sensitive analysis also suggest that the data accuracy of equipment is important to accurate accounting of NE cost and GHG emissions. In this study, the related data of equipment is from the design report for the project. The feedstock supply price is constantly increasing during recent years, but it is less sensitive to the results. Also, the estimation uncertainties of transportation and labor inputs in the plant building and equipment manufacturing are not significant for the overall assessment since they affect the results less than ±1%.
6. Conclusions
Instead of focusing on economic performance, the nonrenewable energy cost and associated GHG emissions of a village-level biomass gasification projects are estimated with a hybrid LCA method. The results show that the village-level project has an embodied energy intensity of 2.93 J/J, of which 0.89 J is from nonrenewable energy, and the related GHG emission cost is 1.17 × 10⁻⁴ g CO2-eq, indicating a low renewability of the project. Most of the fossil-fuel energy cost and GHG emissions are derived from equipment manufacturing, with percentages of 56% and 47%, respectively. In addition, the biomass gasification project demonstrates disappointing performance in fossil-fuel energy saving and GHG emission reduction under the scenario of natural gas substitution. These unsatisfactory performances are mainly attributed to high cost and low efficiency caused by decentralized construction, low technical level and low utilization rate of by-products
As a whole, the current village biomass gasification project suffers from low efficiency due to diverse bottleneck factors. Gasification stations should not be widely and blindly spread in rural areas of China before major technological progress has been achieved. It certainly requires much effort to research and develop biomass gasification technology and to provide a better assessment of the scale of bio-energy production under various socio-economic and environmental conditions [
3]. Despite having no obvious advantages currently, the small-scale bio-energy projects deserve further research and may be an important energy resource in the future because of depletion of fossil fuels and pressure to reduce GHG emission.


