1. Introduction
Road transport today is responsible for a significant and growing share of global CO
2 emissions. In 2008, the transport sector consumed 38% of the total energy used in Spain. Within the sector road transport is still almost entirely dependent on oil-derived fuels (about 98%), and is therefore highly vulnerable to possible oil price fluctuations and supply disruptions. The transport sector is responsible for more than 25% of CO
2 emissions in Spain, and road transport is responsible for 90% of the CO
2 emissions in this sector, with an energy consumption of about 80% of the sector’s total [
1].
Looking at these data, a change process in the automotive sector which involves a reduction in both CO2 emissions and energy consumption of vehicles running in Spain is necessary. To achieve this, the government has begun to develop strategies to drive the change, among which one is the promotion of alternative propulsion technologies to conventional ones (MOVELE project).
A transition to EV (electrically-powered vehicles) has been proposed because they have the potential for significantly reducing CO
2 emissions. This can be justified, in the first place, since the electric motor is more energy efficient than the internal combustion engine [
2]. The “Well-To-Wheel” model is used to compare emissions from both engines [
3]. Besides the direct CO
2 emissions from the exhaust, the use of a vehicle also causes indirect CO
2 emissions emanating from the fuel supply chain. The sum of the direct emissions and the emissions from the fuel chain are the Well-To-Wheel. In the case of the internal combustion engine, only a performance that at best does not reach 20% can be obtained, while for the electric vehicle, with electric power from the current mix, it is about 30% [
2,
4]. The electric vehicle produces no polluting emissions during its use due to the electric motor. However, electric vehicles will not be completely exempt from emissions as such. There will be some emissions to compute, depending on where electrical energy is obtained. Accordingly, for the electric vehicle to generate no emissions during its use, the electricity must come from CO
2-free sources, such as renewable sources.
As expected, the change will not be easy. The task is certainly complex: changing consumer habits after many years of using one kind of vehicle with a range of benefits that, in some way, will cease to exist.
Regarding the conventional vehicle, electric vehicles currently available usually have a higher purchase price and shorter lifetime than conventional power trains [
5]. Electric vehicles are in the early phases of the adoption process [
6] and it is important to analyze whether the characteristics of the electric vehicle actually meet the consumers’ needs.
As mentioned, the first deterrent the customer finds is the purchase price difference (essentially the cost of the battery) described by previous works [
7]. However, this cost is compensated by the lower cost of electricity compared to gasoline and the lower cost of maintenance [
8]. This paper examines individuals’ motivations when purchasing vehicles, focusing upon what economic factors would encourage consumers to purchase an electrical vehicle or a conventional vehicle.
This research attempts to ascertain, from an economic point of view, if reductions in fuel costs, mechanical damage to the engine (due to its simplicity), or greenhouse gas emissions would encourage individuals to purchase an electric or a conventional vehicle in the next 10 years. To do this, we consider no only the costs when acquiring the vehicle, but also the costs over its useful life (including oil and electricity price fluctuations, taxes, garage conditioning for recharging, etc.), in order to determine the years of repayment on the purchase of an electric vehicle compared to a conventional one.
Nowadays, there is much literature on electric vehicles, including some very detailed works, such as “
On the Road 2035” [
2], the Electric Power Research Institute (EPRI) Reports [
9,
10,
11], and the research by the Institute of Transportation Studies at UC Davis [
12,
13]. This paper, however, mainly examines the economic influence at the time of purchasing the vehicle, but also the costs over its lifetime use, focused on the Spanish context. Regarding the Spanish sector, there are not many policymaker studies [
14], and even fewer focused on the policies necessary for the integration of electric vehicles in society and the methodology used, a question that motivates the creation of this paper.
3. General Model Description
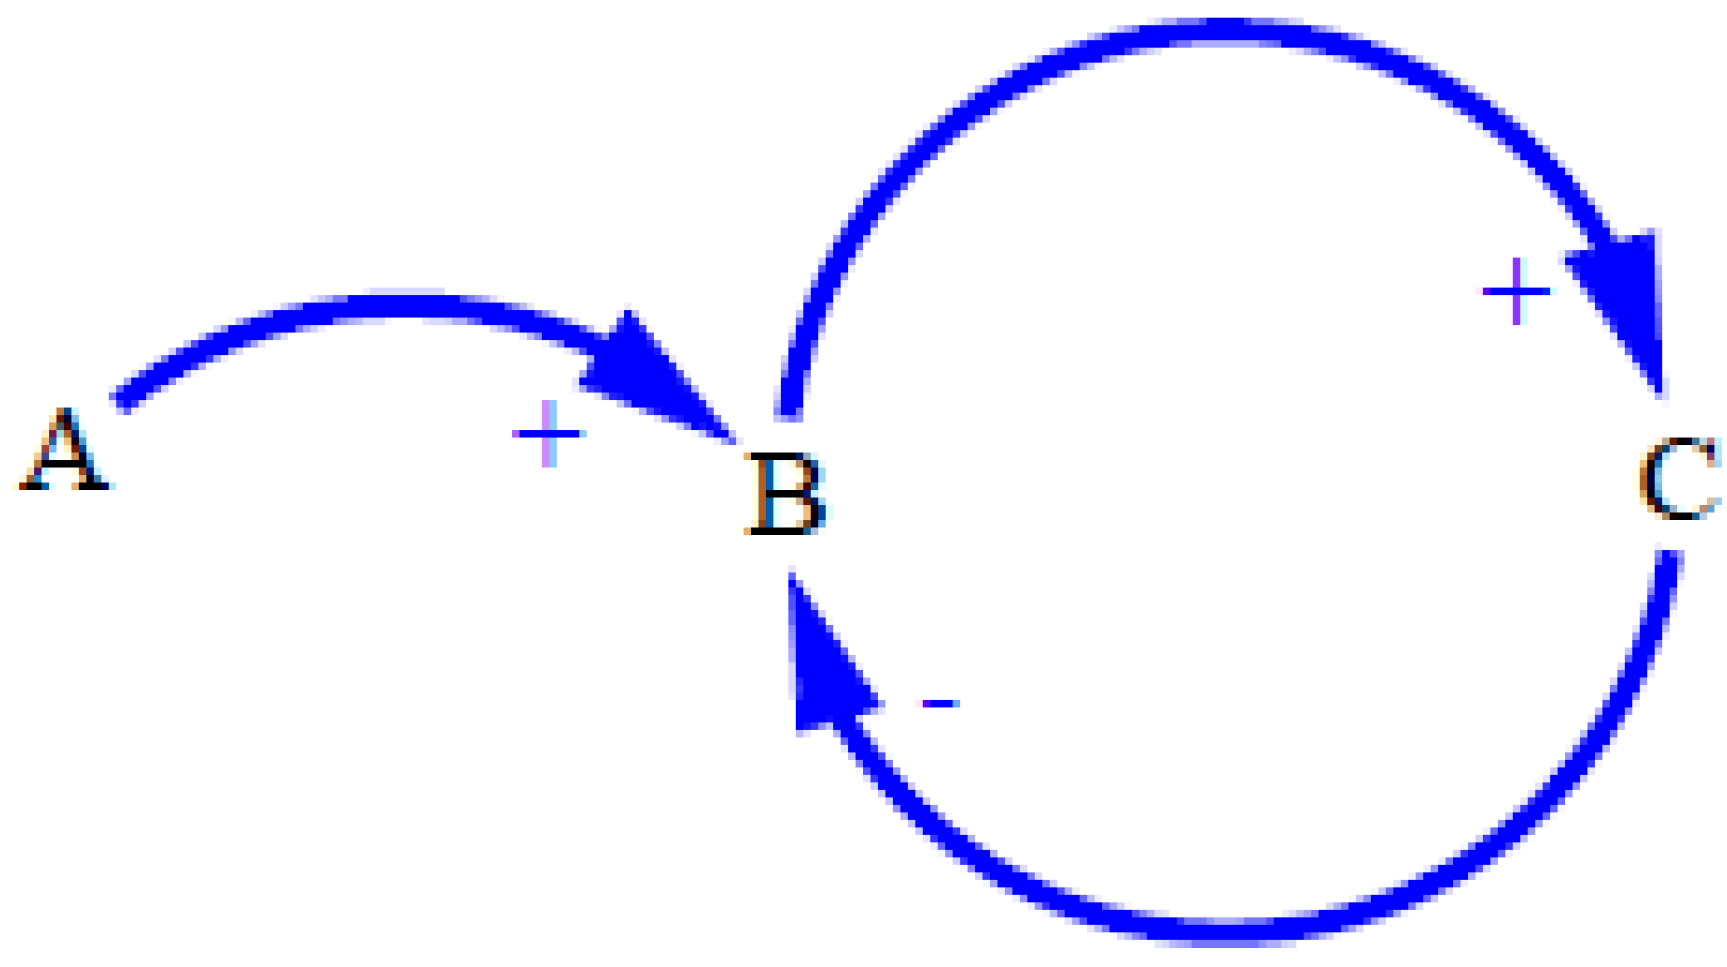
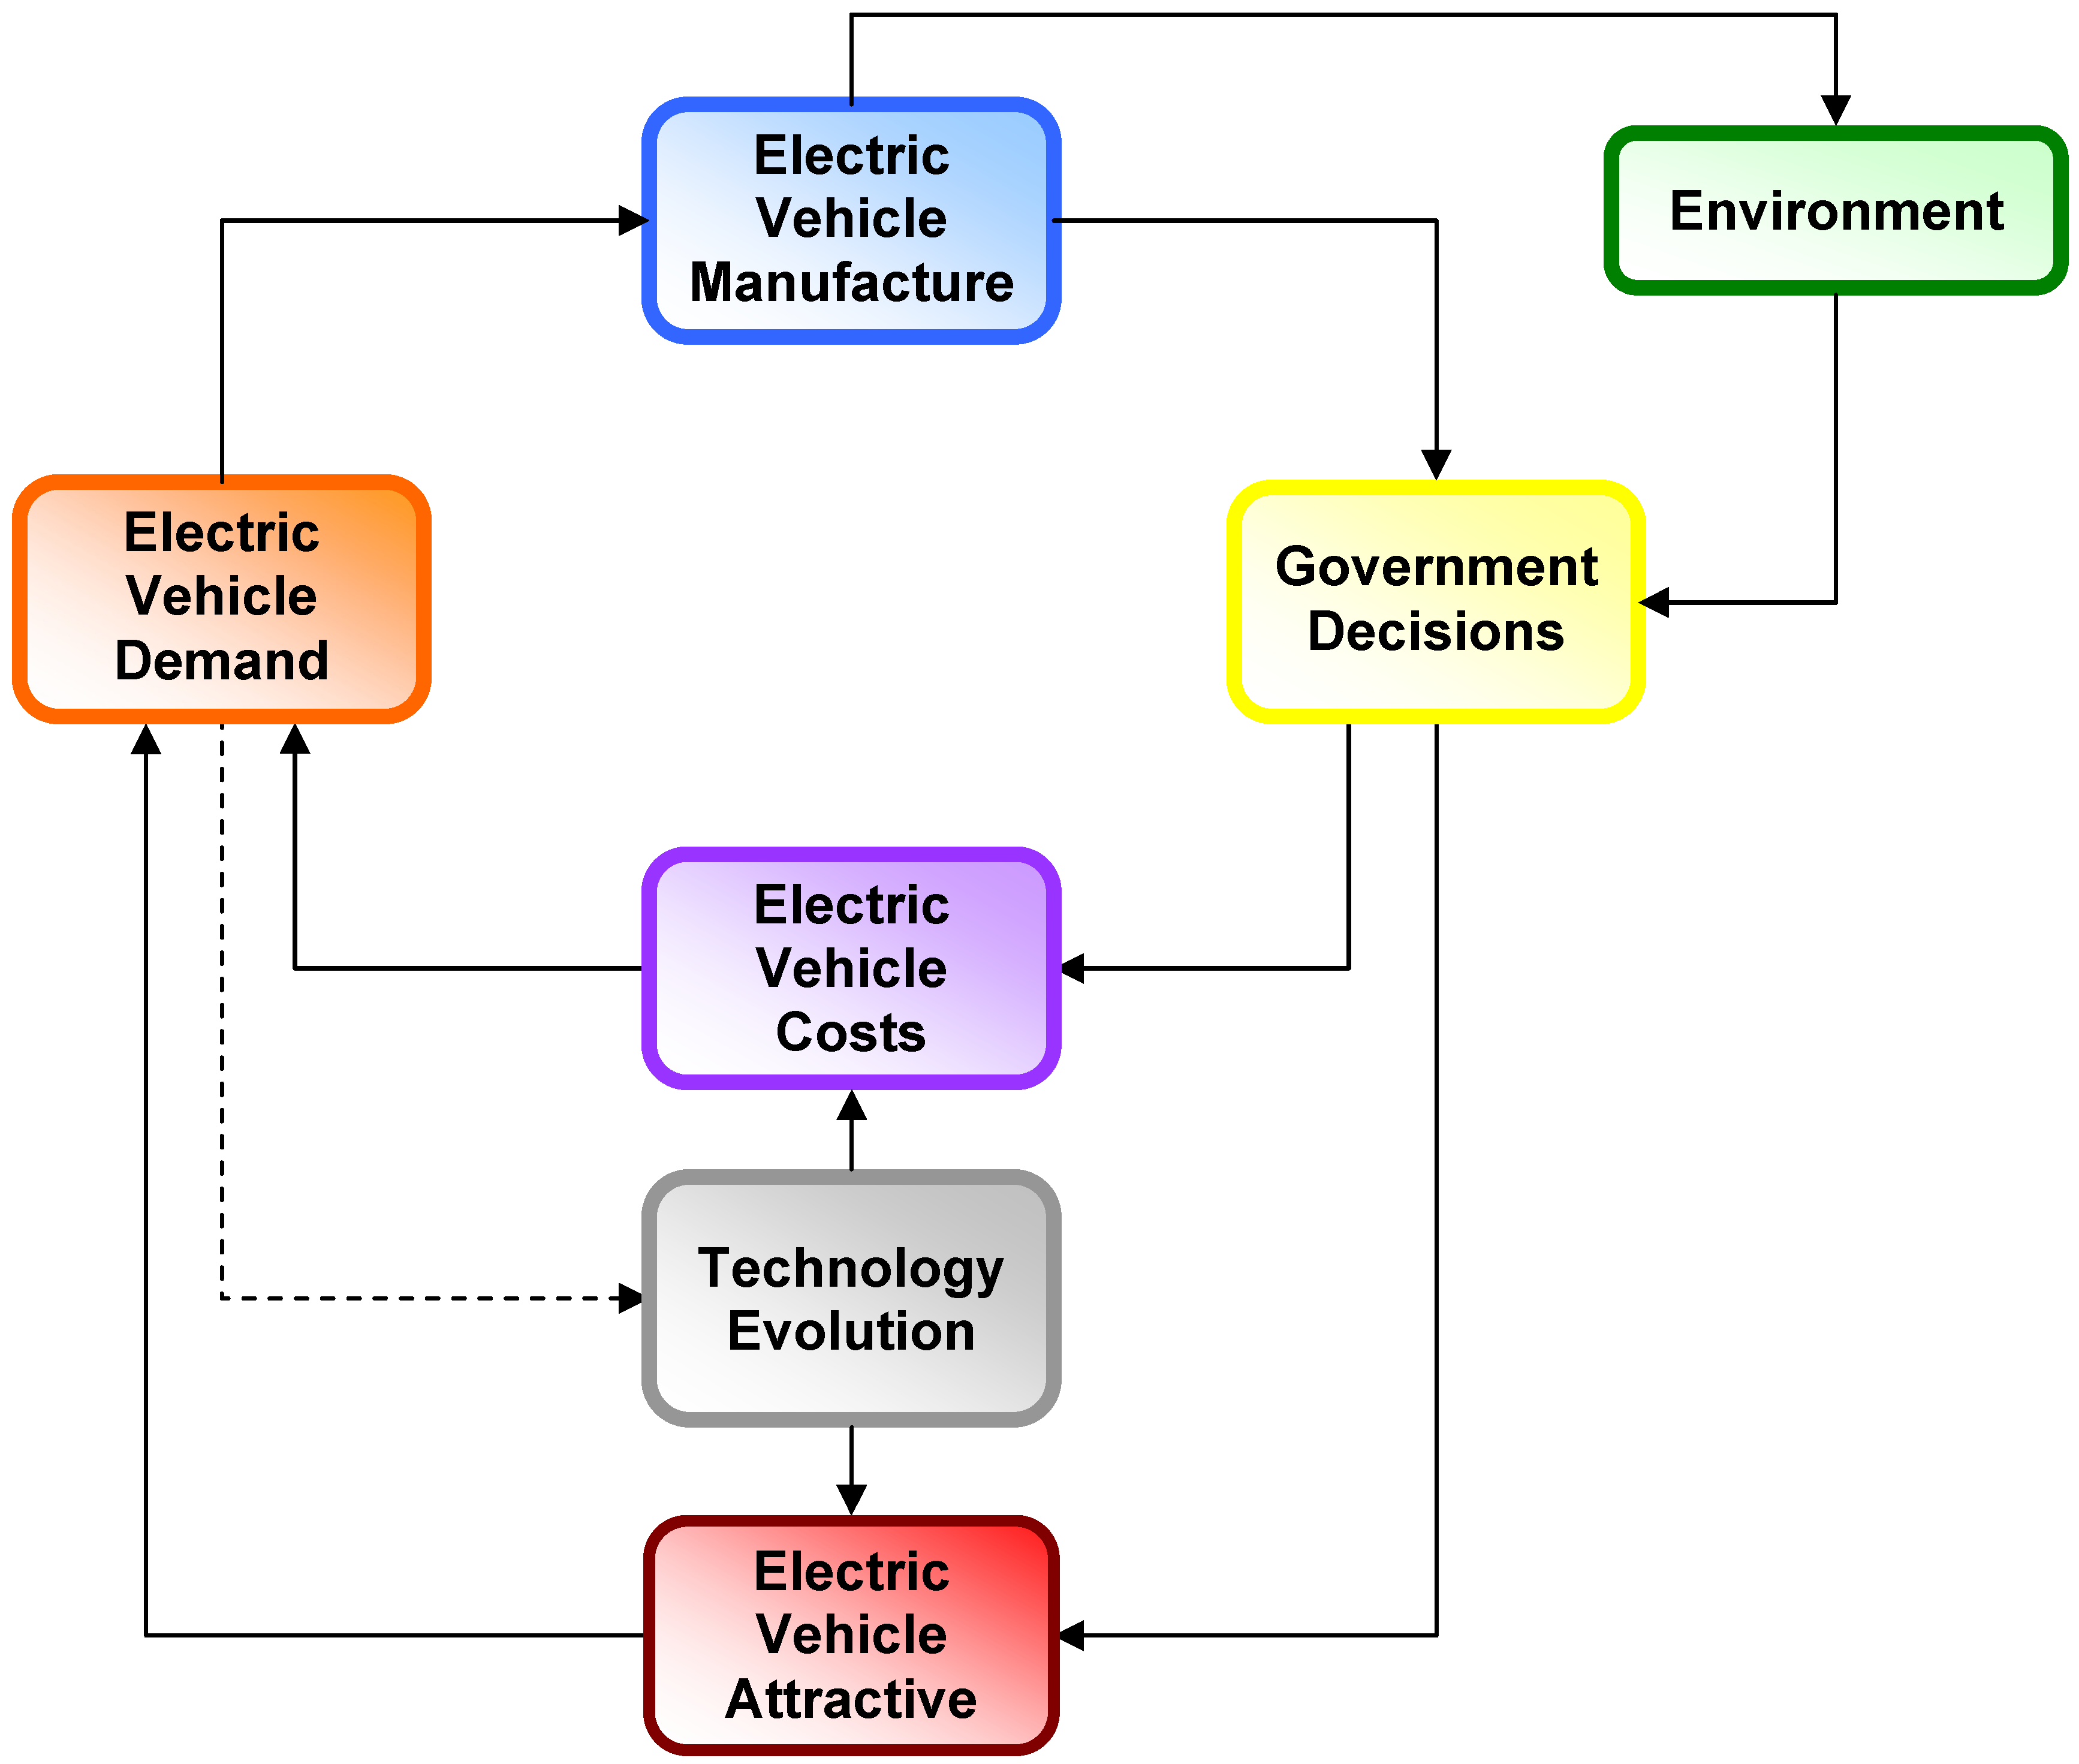
Figure 2 shows a general vision of the model’s blocks and the interrelations between them.
Initially, there is a demand for electric vehicles. The vehicles manufactured must satisfy this demand. For the study, the vehicles manufactured for the Spanish market are considered, not taking into account the country in which they are manufactured. As the number of manufactured vehicles increases, the electric vehicle park will also grow, which will clearly affect CO2 emissions included in the environmental block and, subsequently, the policies options that the Government can use, either in the form of subsidies or special cargo rates, or an increase in the number of charging points, etc. The Government’s policies will also be influenced by the environmental block, since the subsidies will be amended to reduce CO2 emissions to the atmosphere.
The Government’s policies will significantly influence the cost that the potential customer perceives when purchasing electric vehicles, due to subsidies, and the costs over the life of the vehicle by reduced overnight charge rates, etc. In addition, the Government’s policies will also affect the attractiveness of electric vehicles for the consumer in comparison to a conventional vehicle. This is motivated by the advantages or disadvantages that buying an electric vehicle may have, such as the autonomy, the lack of charging points, the cost of recharging the electric vehicle, etc.
Both the cost of the electric vehicle and its attractiveness to the consumer are directly related to the evolution that the technology of electric vehicles will have in the coming years. This is because a very important part of the purchase price of electric vehicles is the battery, and one of the main factors of concern for potential buyers is the autonomy they have.
To close the loop, electric vehicle demand will evolve over time, influenced by the amount of money the buyer will have to pay (at the initial time of purchase and throughout the life of the vehicle), and its attractiveness.
It is interesting to note that, in global terms, the evolution of the technologies associated with electric vehicles will also be influenced by the demand for them. In this study, it is not considered in this way, since the demand for electric vehicles in Spain is very small in comparison to global demand, which will motivate technological advances in this field.
The same happens with other blocks, that is, the system being treated is not an isolated system. The global market for electric vehicles will influence the system, but for this study, we have considered various data as exogenous variables, i.e., the value of these variables is determined by factors not included in the model being used. According to this, we can determine that the study covers worldwide developments.
Figure 2.
General model schema.
Figure 2.
General model schema.
4. Block: Electric Vehicle Cost
Although all the blocks are treated in the full study, for this paper, only the block containing the electric vehicle costs and its comparison with the conventional vehicle are explained. This model’s block analyzes the costs of both electric and conventional vehicles at time of purchase by the customer and during the vehicle’s lifetime. To do this, data is considered as an evolution of oil prices and electricity, maintenance costs, etc.
To analyze the economic efficiency of electric vehicles, the total costs of ownership (TCO) of both vehicles (electric and conventional) are analyzed [
17]. TCO describes costs over the lifetime of a vehicle: purchasing costs and costs of operation (annual costs). A comparison of the TCO of electric vehicles with the reference vehicles provides indications of the economic efficiency of the former. The battery plays a major role in the TCO, so battery costs are looked at in detail.
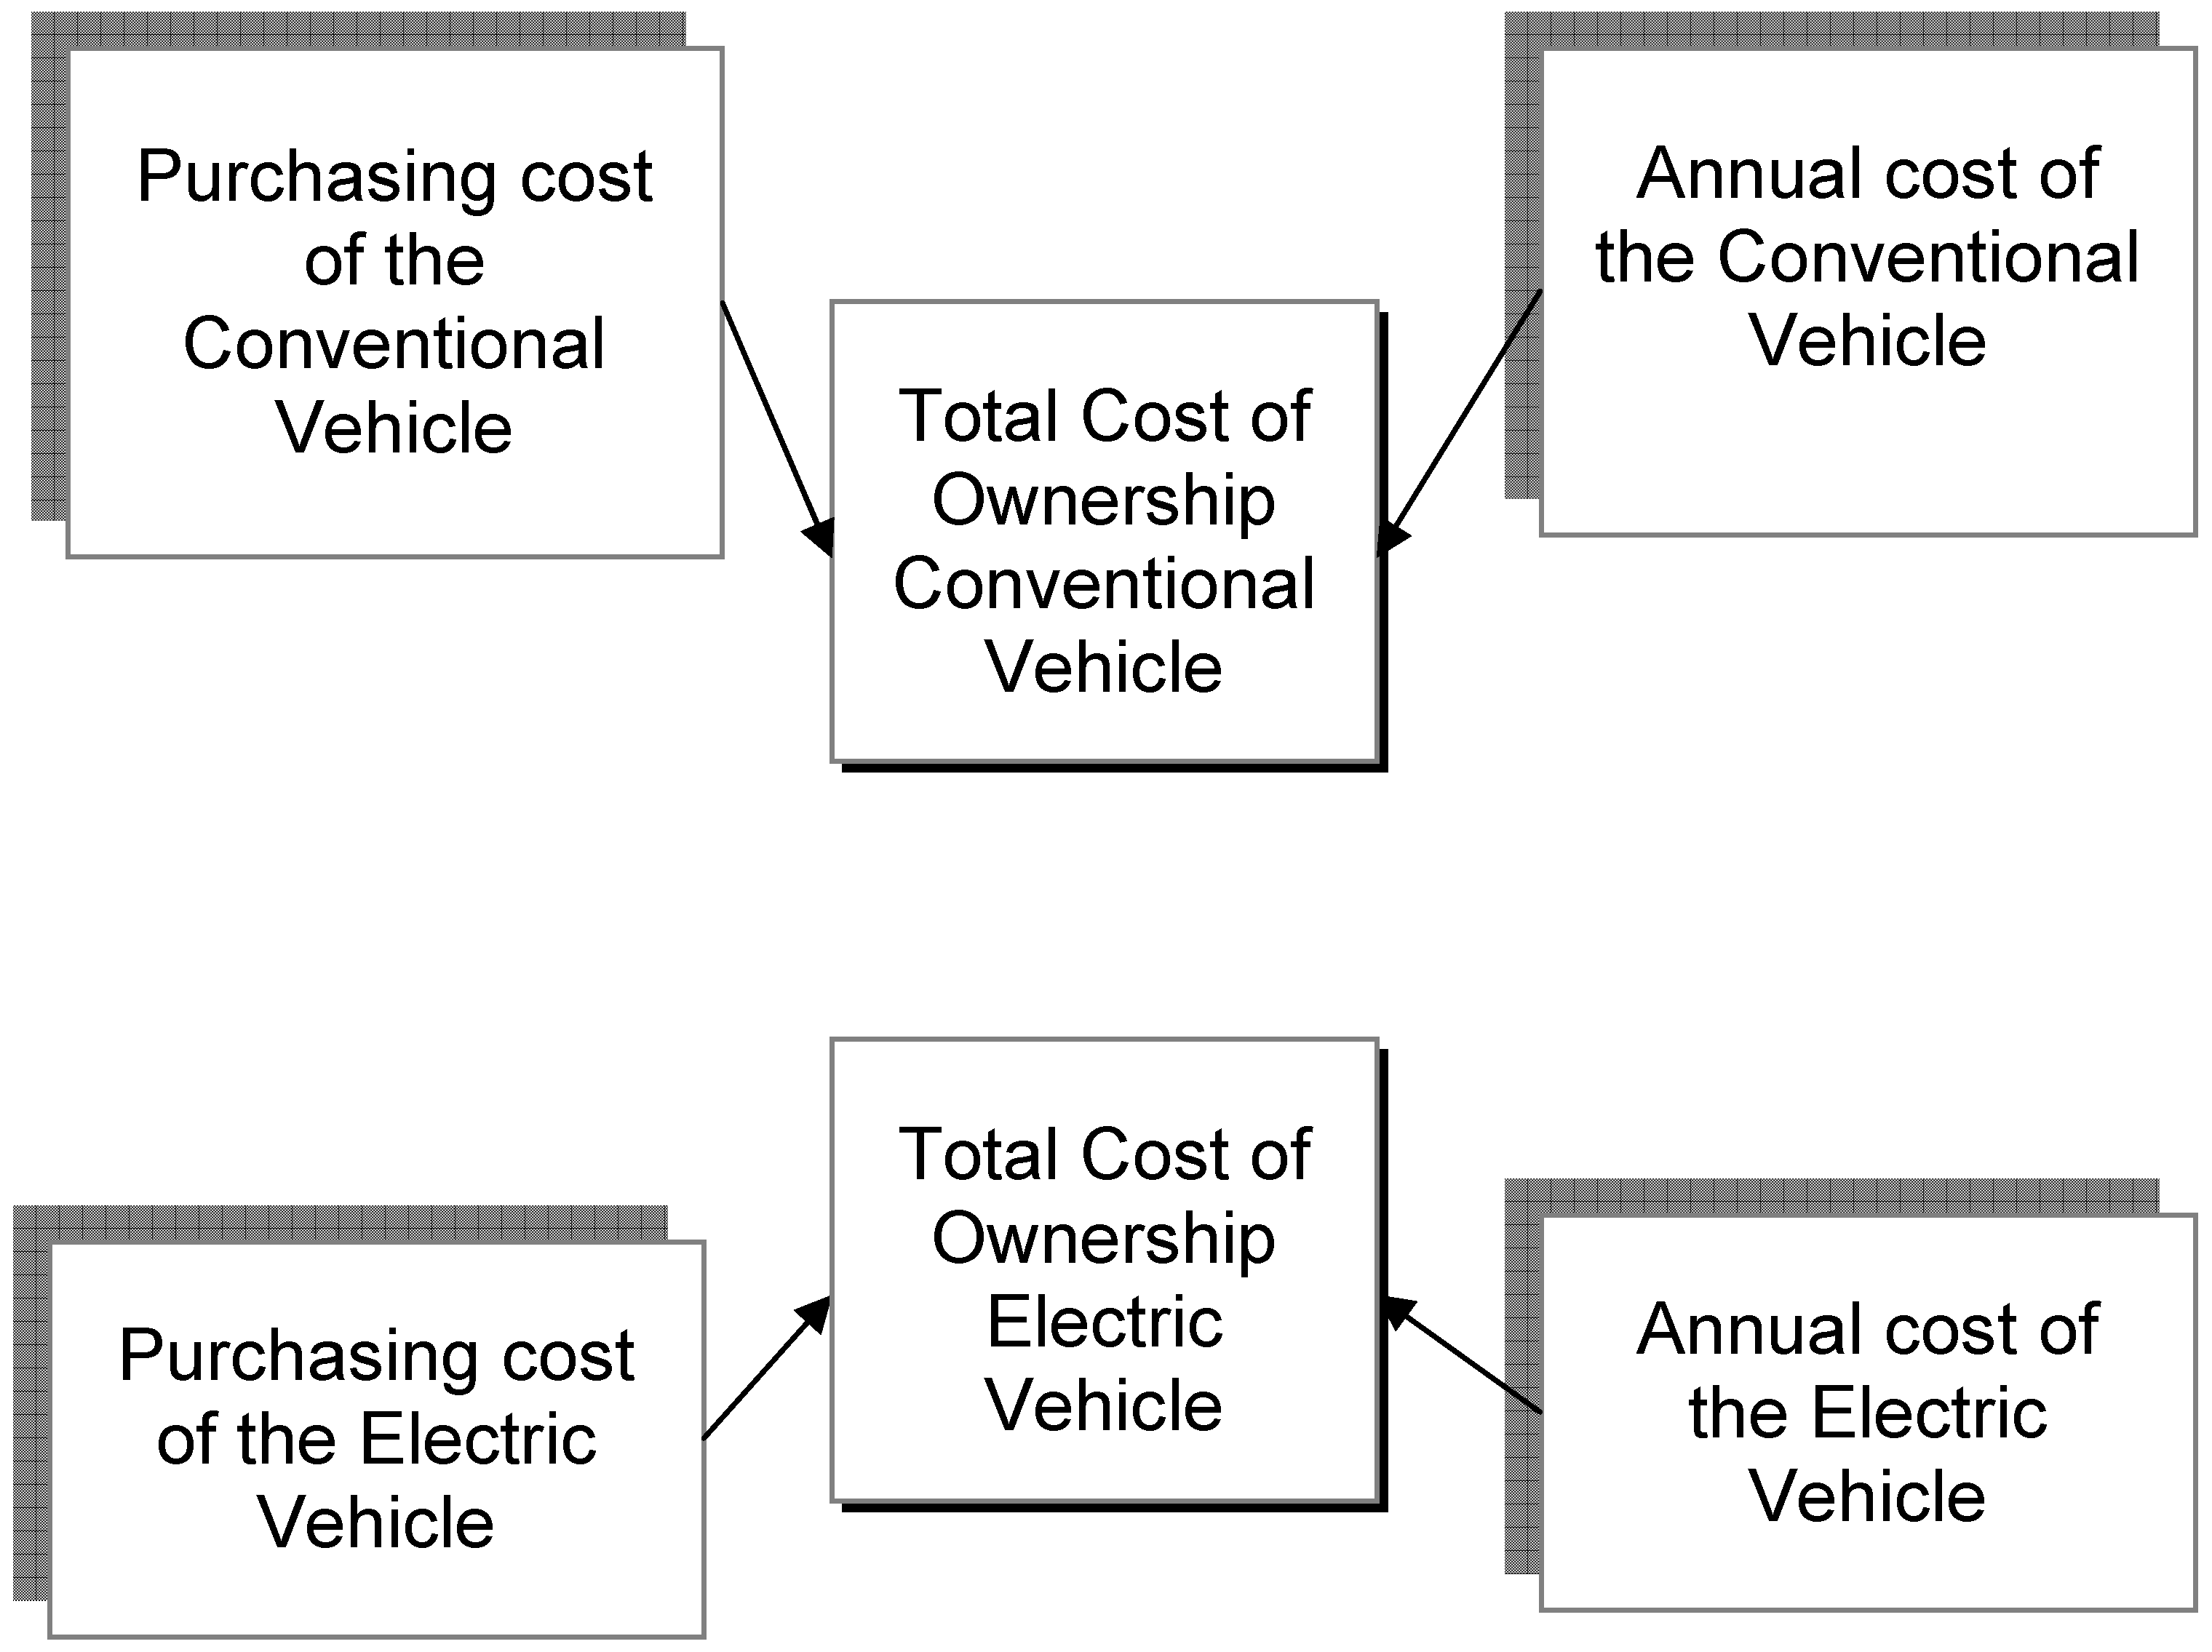
The model has been divided into four sections: the purchase cost of the electric vehicle, the cost of the electric vehicle during its life, the purchase cost of the conventional vehicle, and the cost of operation of the conventional vehicle during its life. The total cost of electric vehicles consists of the sum of the purchase cost and the running costs of electric vehicles. In the same way, the total cost of conventional vehicles consists of the sum of the purchasing cost and the running costs of conventional vehicles.
Figure 3 shows a summary of the overall functioning of the block.
Figure 3.
Schema of the electric vehicle block.
Figure 3.
Schema of the electric vehicle block.
The simplest section corresponds to the purchasing cost of the conventional vehicle by the customer. The conventional vehicles that can potentially compete with electric vehicles are relatively compact, so that, based on statistical data and purchasing trends in Spain, a reference price has been set for the conventional vehicle.
Once the reference value of the conventional vehicle has been set, the purchase cost of electric vehicles is determined by the reference value of the conventional vehicle, adding some kind of costs, but also eliminating others.
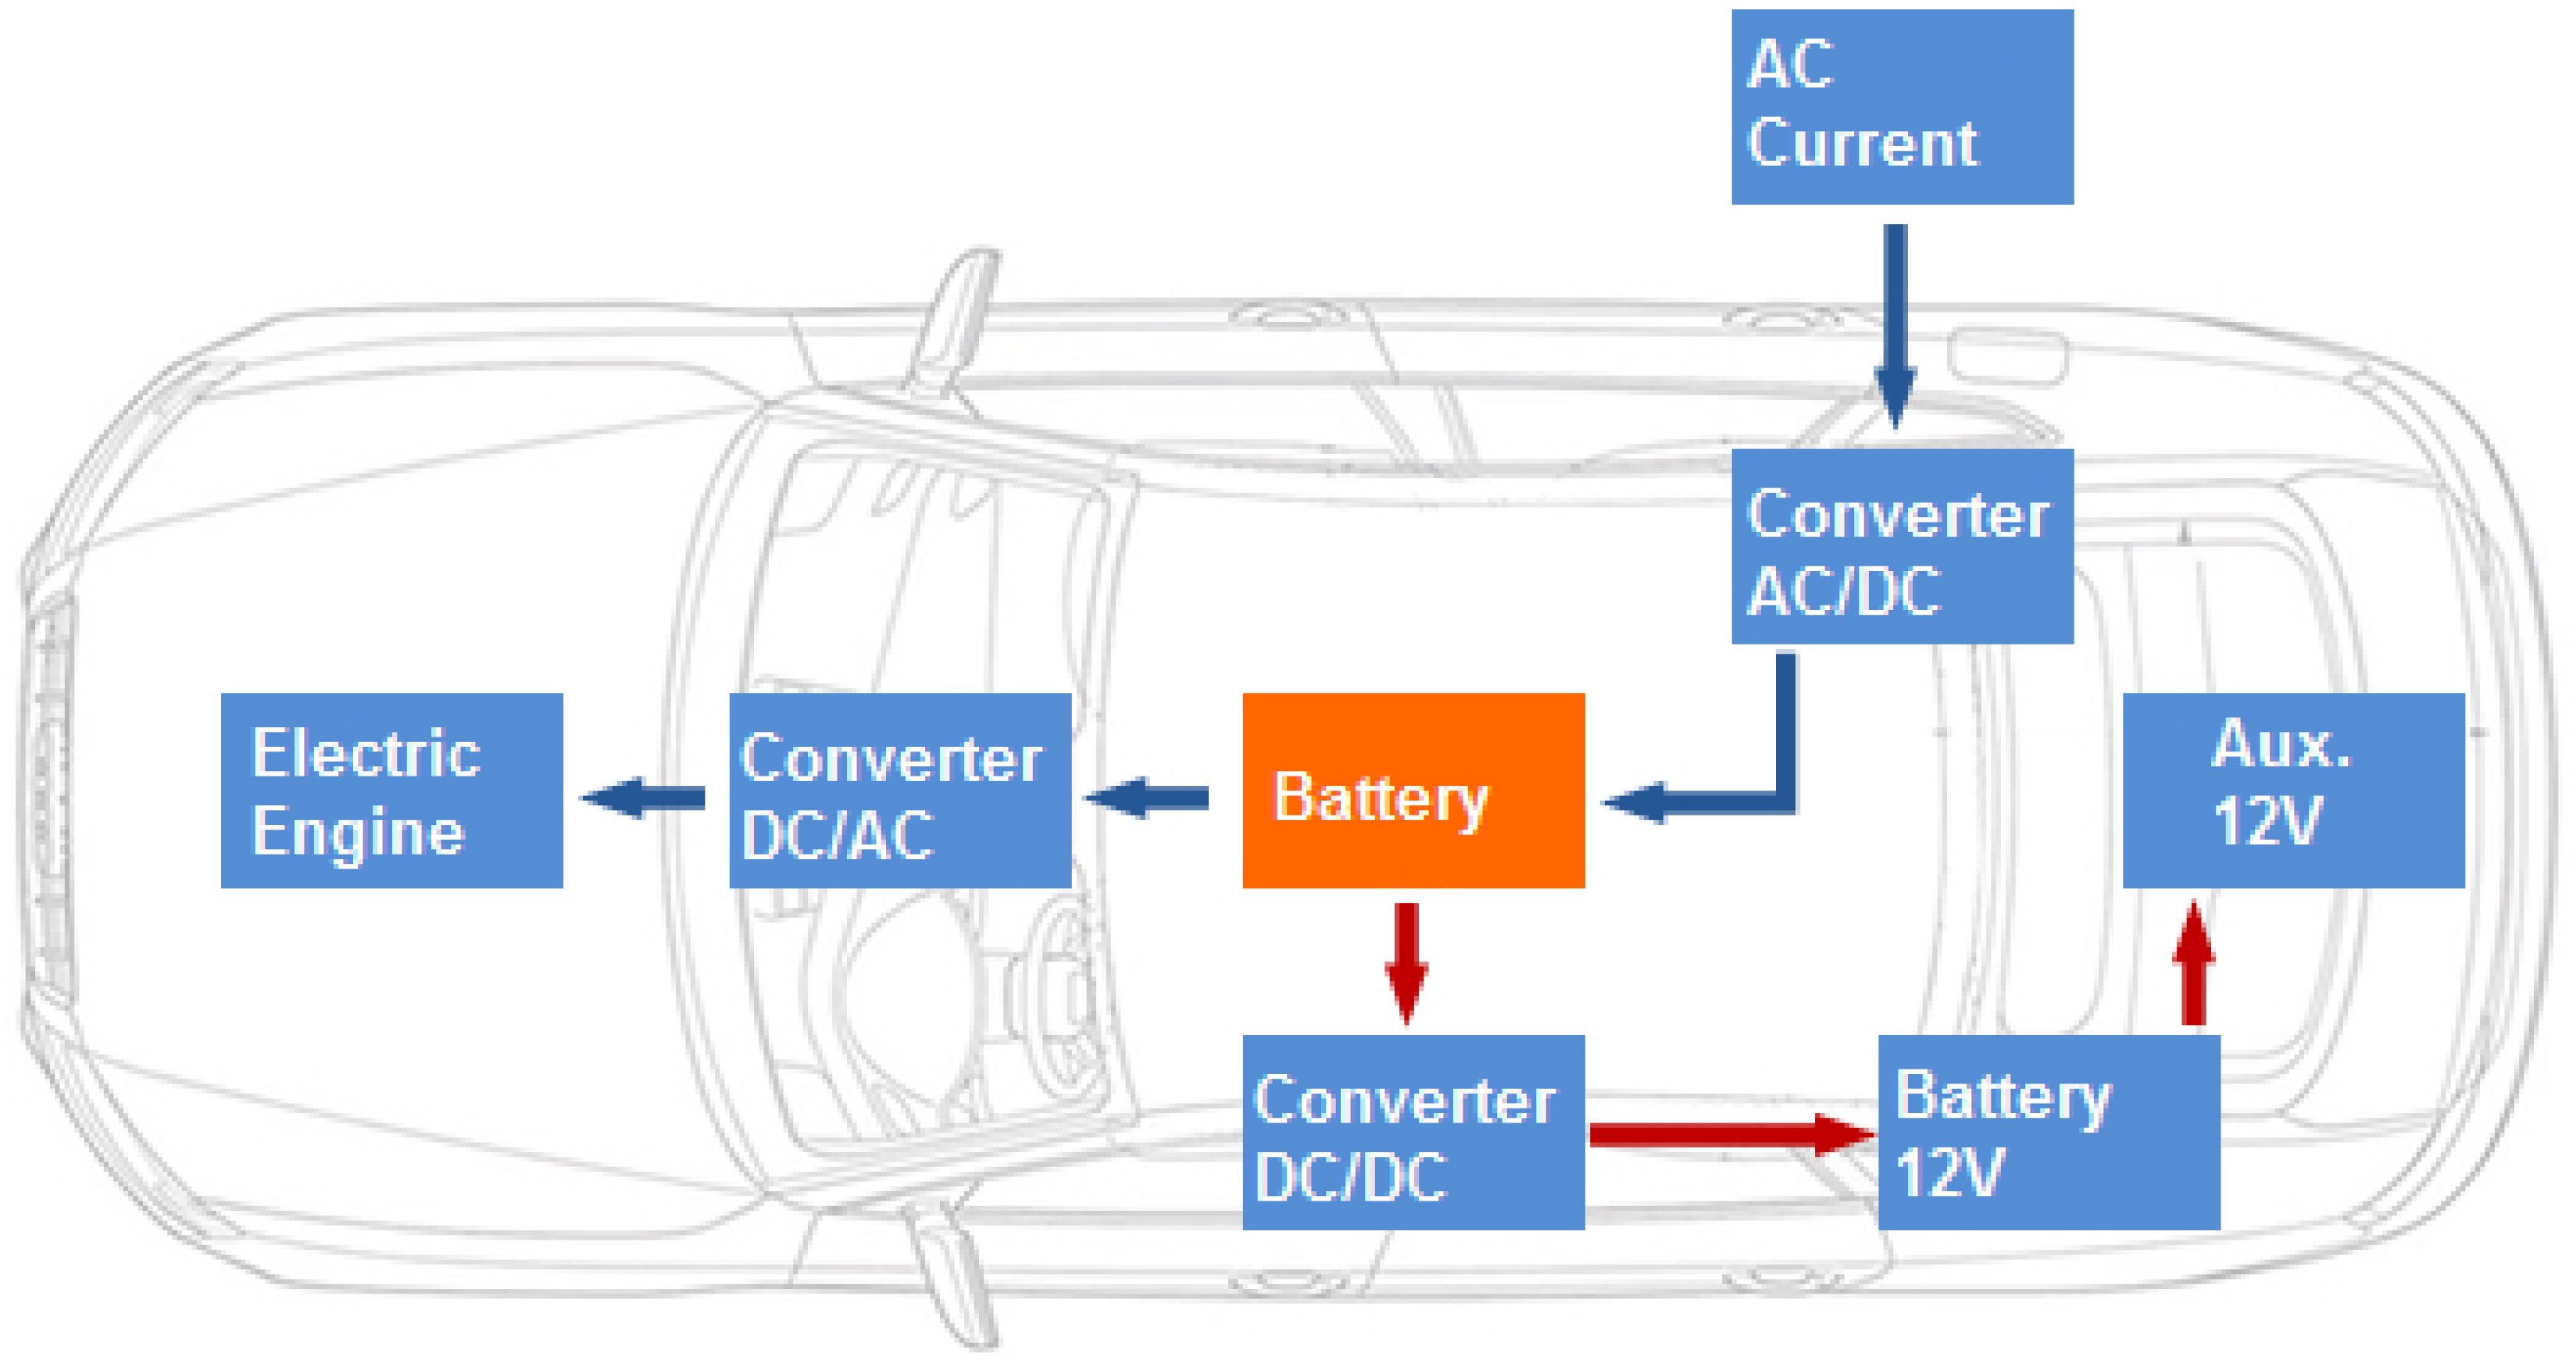
Figure 4 shows a simplified diagram of the electric vehicle.
Figure 4.
Electric vehicle schema.
Figure 4.
Electric vehicle schema.
The most significant additional costs of electric vehicles will be the necessary wiring and charger for charging the vehicle both slowly and rapidly [
2], the different motor drive required and, of course, the cost of the batteries, which is the most significant contributor.
According to the available information [
2], the extra charger and wiring costs in Spain will cost about 480 €, while the cost of the motor drive will be 160 €. In contrast, the motor simplification leads to a reduction of product cost. It is estimated that a gasoline engine will cost about 2,400 €, while the electric motor will only cost 1,200 €, so there is an interesting reduction.
Moreover, the electric motor requires an additional component: an engine control system that allows the required torque or speed to be adjusted for every load point. The cost of this control is now about 1,020 € but a significant reduction is expected to result from mass production, with the price reaching 70% of its current value [
18].
In electric vehicles, an additional component called a DC/DC converter is also required. This is used to convert the voltage from 100 V to 12 V, which is necessary for the auxiliary systems required for the vehicle. The cost will depend heavily on the input voltage, but should be around 300 € [
18].
In addition to this converter, an AC/DC converter, used to recharge the battery by connecting it to an external AC power, is also needed. The cost of this converter is approximately 400 € [
18].
One of the key factors in the evolution of the purchasing price of electric vehicles will be the reduction in the battery costs in the coming years. To predict these developments, there is a model which includes forecasted values of the reducing cost of the kWh, and the evolution that the battery capacity will undergo in the coming years in both optimistic and pessimistic scenarios [
19], developed in the Technology Block, mainly using works by Kromer and Heywood [
20], Duvall [
9] and Kurani [
13].
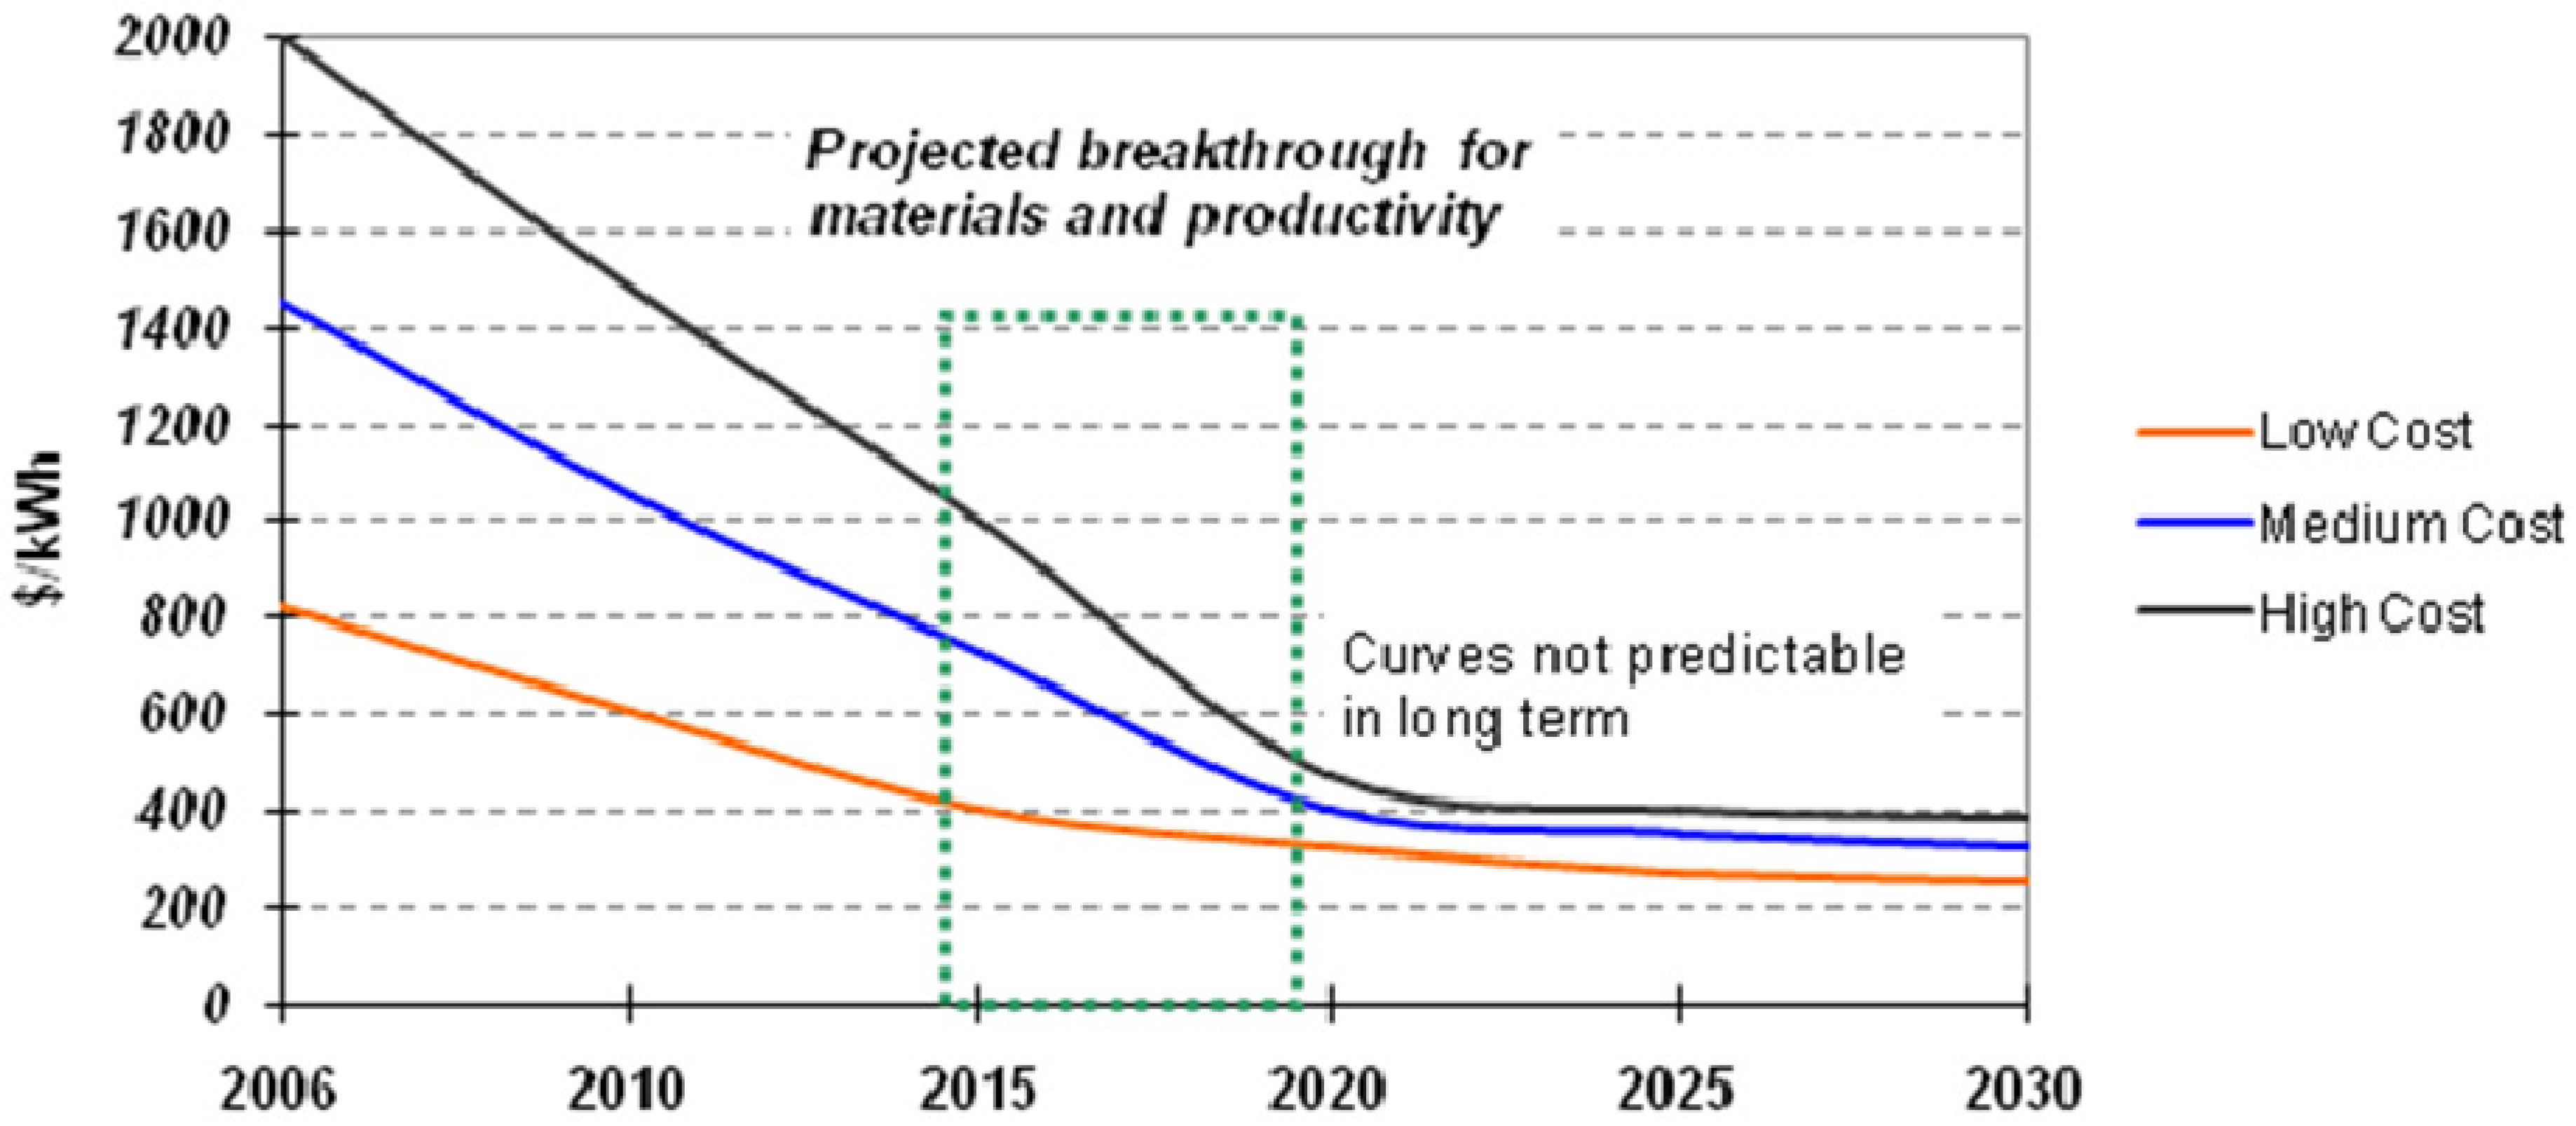
To calculate this, it is also necessary to know the battery’s capacity and the manufacturing cost of the battery. For the cost estimate, we use a graph of the expected price per kWh reduction over the next 10 years. To do this, we use the following reference data [
19] from the Technology Block.
As can be seen in the graph (
Figure 5), there are several scenarios for the cost of batteries, but what is quite clear is that they provide a very significant decrease. So far, the rate of decline in the cost of the batteries has been between 6% and 8% per year [
21]. Many analysts predict that the price will continue to fall over the next 10 years in the same way, due to increased production volumes.
A cost that has also been considered for this study is the upgrading cost of the garage, in appropriate cases, to be able to recharge the battery there. Taking into account the potential population living in apartment buildings, in single-family houses, and the Spanish law, the upgrading cost will vary significantly.
According to a RACE (Royal Automobile Club of Spain) study [
22], 80% of the population would choose the nighttime to charge electric vehicles, so to simplify the model it is assumed that in these early years of commercialization of electric vehicles a customer acquiring an electric vehicle will also charge it in his garage during the night.
At this point it is very important to know whether the available garage is individual or community property, because, though the charging systems are similar, the method for calculating electricity consumption differs considerably in each case. On the one hand, in an individual garage, all electricity consumed (either by charging an electric vehicle or by having a computer connected, or air conditioner for example) will be billed to a single consumer. On the other hand, in the community garage, it is necessary to discriminate the source of consumption in order to know whom it will be charged to.
Figure 5.
Forecast of the battery price [
19].
Figure 5.
Forecast of the battery price [
19].
According to data from the INE (National Institute of Statistics), 28% of the population lives in a single-family house, while 72% live in a flat. While not 100% of the population has a garage, this study has ignored that fact, since, according to all surveys [
22], the potential client owns a garage.
In a single-family house garage, it is simply necessary to have a 230 V and 16 A household outlet, for which the cost has been estimated at approximately 100 € for a basic installation in an environment with electric service available.
In the case of collective garages, the required system is slightly more complex. While the law already authorizes and provides facilities in such collective garages (Law 49/1960, of July 21st), in this case, as well as having a socket of similar dimensions to those of an individual garage, a counter to discriminate the source of consumption is also needed. Thus, the residents pay the total electricity consumed, then that cost is distributed among users of existing electric vehicles in proportion to their consumption. However, in anticipation of widespread recharging of electric vehicles in collective garages, several brands of electric circuits are beginning to market solutions for collective garages such as charging system monitoring interfaces, or in its simplest case, individual recharging points activated by an identification system to eliminate potential vandalism.
In view of the electrical systems that must be installed in the collective garage, it is logical to expect that the cost of installation will be very superior to that in the individual garage. Taking into account actual budgets, and also taking into account the need for the implementation of a certification for it to be a new installation, the estimated average cost for charging an electric vehicle in a community garage is 900 €.
A final factor to consider in the purchase price of electric vehicles is the subsidies that the government can provide at the specific time of purchase. For this calculation, we use three interrelated variables: the value of the subsidy, the budget that the IDAE (Spanish Energy Institute) can spend on subsidies for the purchase [
1] and, finally, the money already being spent on subsidies.
Currently, 7,000 Euros has been taken as the purchase subsidy [
1], which is the average subsidy for this type of vehicle in Spain. The government budget is 240 million Euros in 2011 and 2012. For 2012, no data or estimations of subsidies have yet been delivered.
Once the purchasing costs for both vehicles have been established, it is now necessary to determine the running costs, which in both cases are mainly the cost of fuel (and its consumption) and the cost of vehicle maintenance.
For the conventional vehicle, the analysis of the annual fuel consumption begins with the average consumption of an internal combustion vehicle today in Spain, taking into account the average consumption of diesel and gasoline vehicles, as well as the percentage of population using each kind of vehicle. It is considered that the average consumption of a gasoline engine is 8 liters per 100 km (20.4 miles per gallon), while the average consumption of a diesel vehicle is 6 liters per 100 km (39.2 miles per gallon) [
23]. Given that in Spain 53% of vehicles are gasoline and 47% diesel [
24], the current average consumption of an internal combustion vehicle is the product of the consumption of gasoline vehicles times their percentage product, added to the consumption of diesel vehicles multiplied by their percentage. After obtaining some reference data, some improvements in the efficiency of the engines that will be developed in coming years have been added as well as aerodynamic improvements that will dynamically change vehicle consumption [
2,
18].
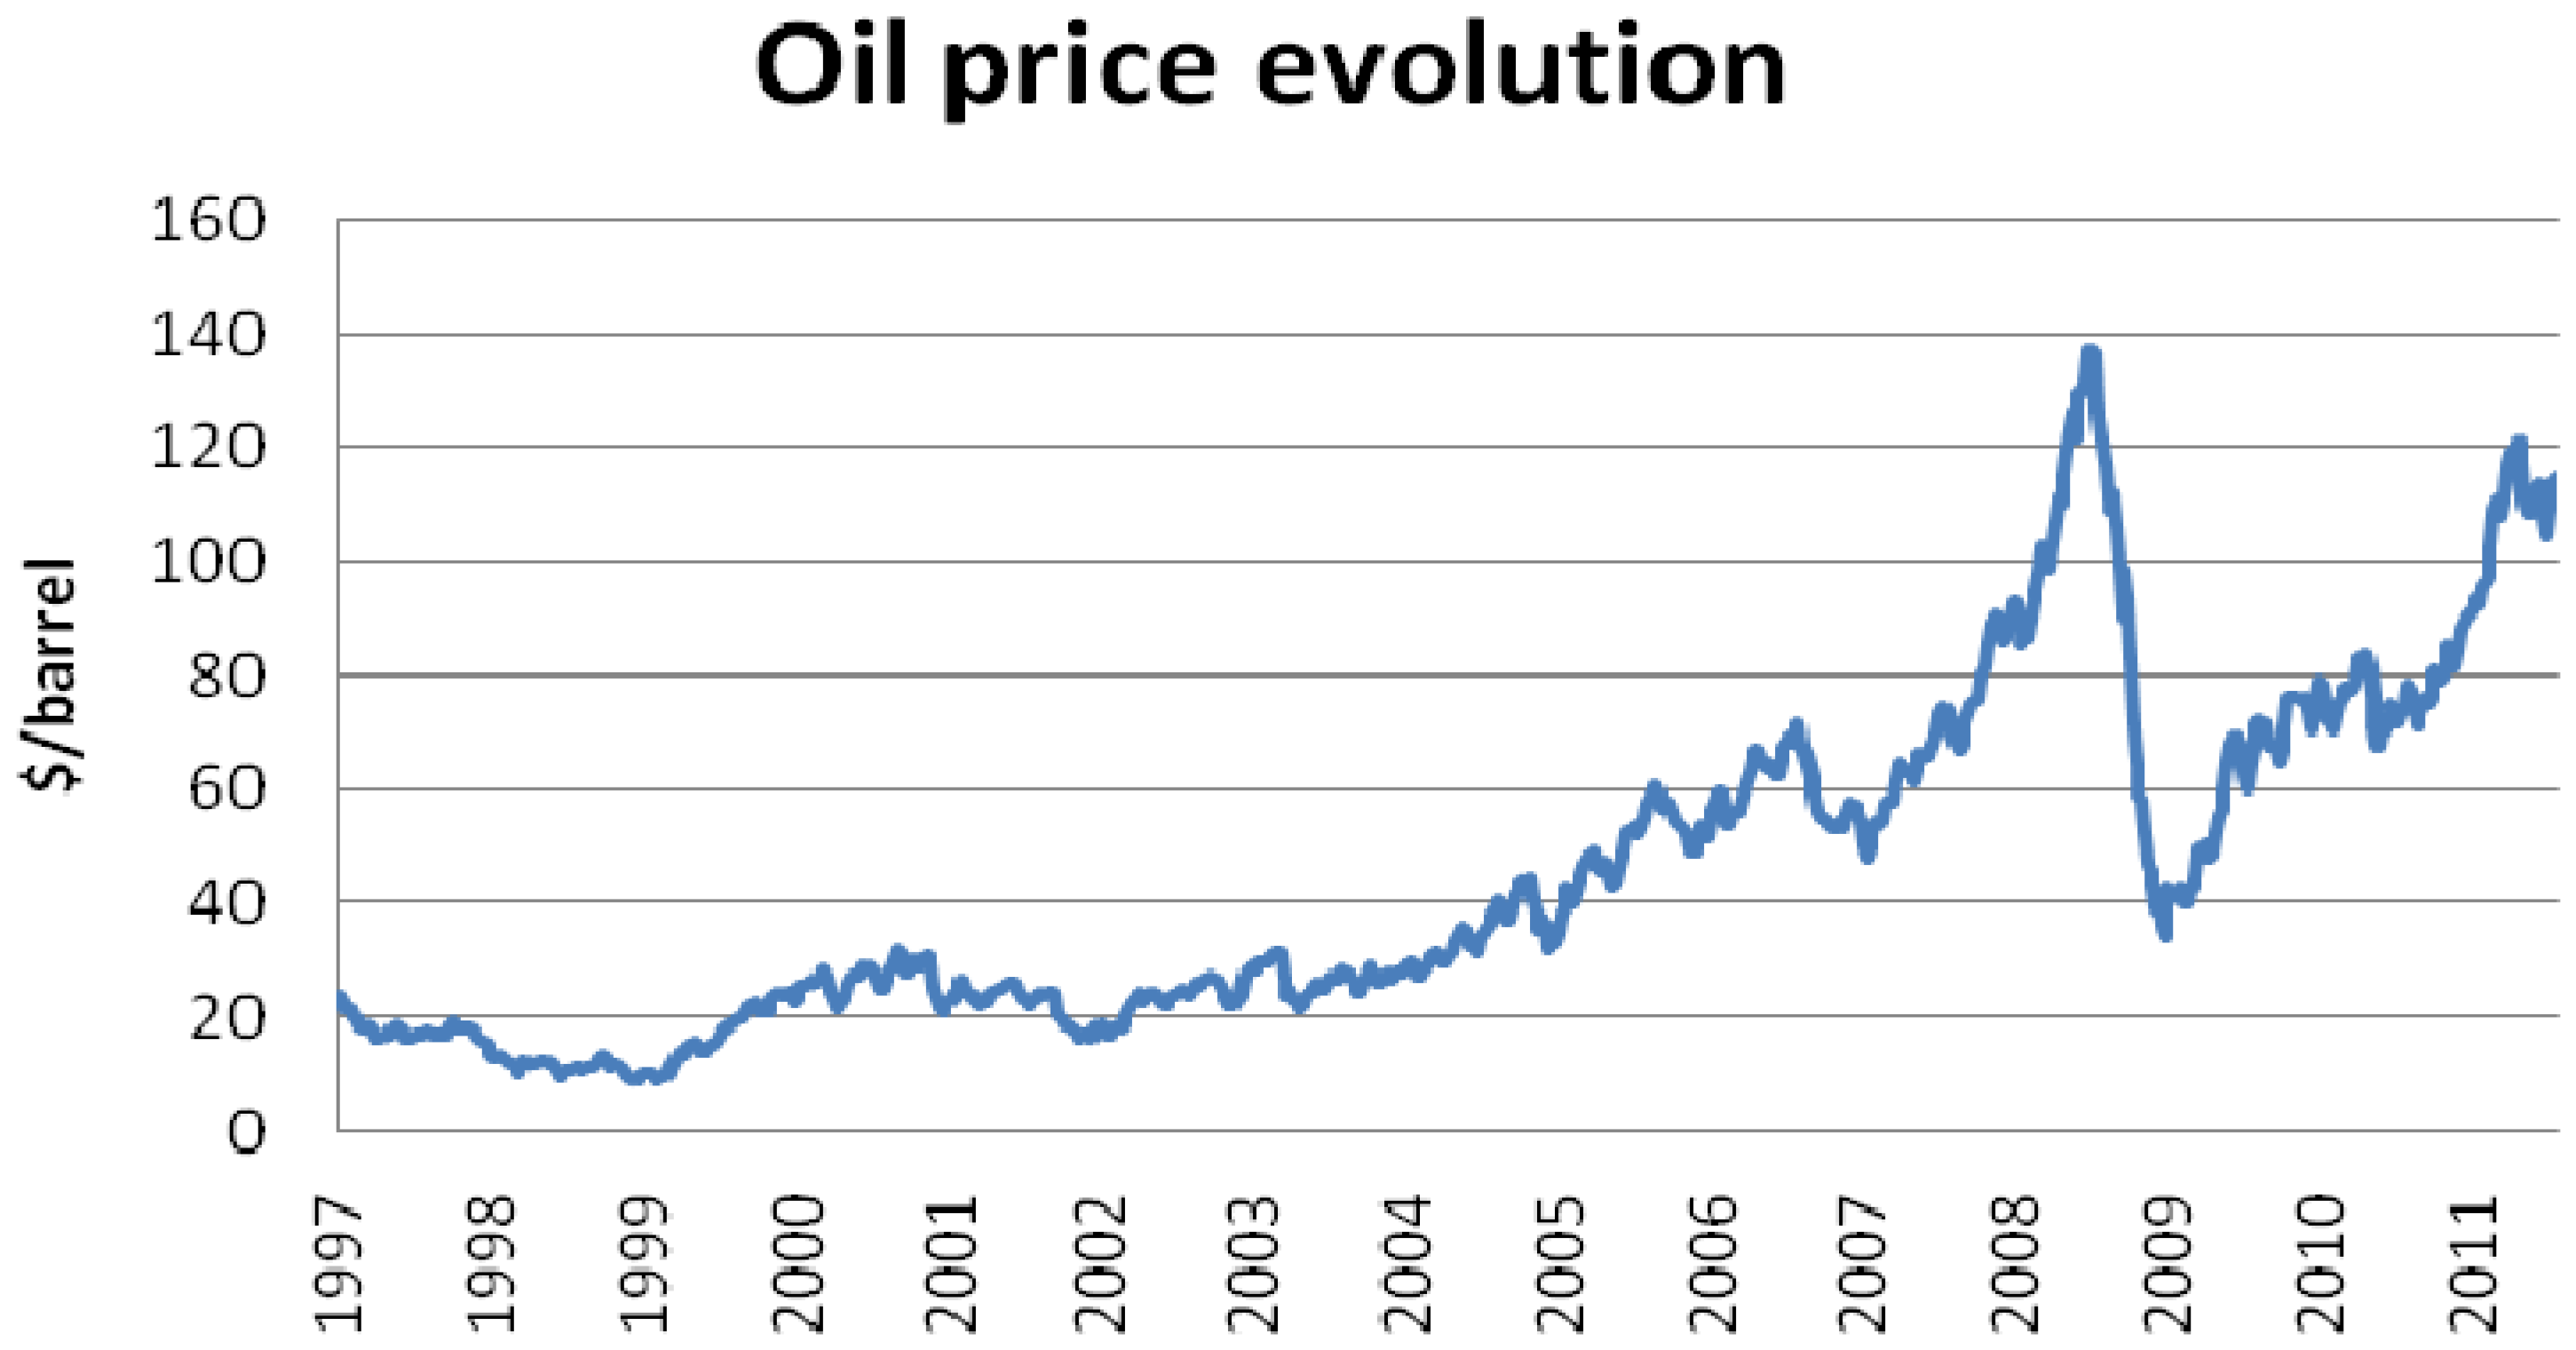
Estimating how oil prices will evolve over the next 10 years is a task of great complexity with a high rate of failure. The price of oil depends on many factors. There are few reserves in the World and it is a scarce commodity (referring to what can be extracted with current technology, and whose extraction would be profitable at current oil prices).
Figure 6.
Oil price evolution [
25].
Figure 6.
Oil price evolution [
25].
Another important factor to consider is the large scale financial speculation, apart from the ongoing geo-political conditions (oil prices may rise due to political situations involving producing countries).
Figure 6 shows the evolution of oil prices in recent decades. It shows the great variability of the price and the mathematical complexity of this development model [
25]. However, to obtain a more realistic model, the fixed oil price (the value at the beginning of 2010) has been included [
26]. The forecast values in oil prices in dollars/barrel are:
Table 1.
Oil prices forecasted [
26].
Table 1.
Oil prices forecasted [26].
| YEAR | 2010 | 2011 | 2012 | 2013 | 2014 | 2015 | 2016 | 2017 | 2018 | 2019 | 2020 |
|---|
| PRICE | 70.30 | 73.06 | 79.41 | 85.74 | 90.91 | 94.52 | 98.23 | 101.23 | 104.41 | 106.47 | 108.28 |
The tax regulations fixed by Spanish legislation need to be added to this oil price, as well as transport and the profit margin of gas stations. According to data from the “Market Observatory for Energy” [
26], indirect taxes for gasoline are 436.47 € per 1000 liters, while for diesel fuels they are 340.36 € per 1000 liters. The V.A.T. tax in Spain is at 18%, and the profit margin of gas stations in Spain is about 25%.
Finally, we estimated the maintenance costs that conventional vehicles will have on an annual basis. For this, we estimated the maintenance costs that a conventional vehicle has over its useful lifetime, and this estimation has been done taking into account the number of kilometers a vehicle does on average before it needs to be replaced. The value will be set by external studies that determine the value as 0.03 € per kilometer covered [
11,
27]. If this value is multiplied by the average annual kilometers traveled by a vehicle, this will have, as a result, an economic value which is the amount that the customer spends on an annual basis on conventional vehicle maintenance.
For the running costs of the electric vehicle, the schema is similar to that of the conventional vehicle: There is an annual cost due to vehicle consumption and other costs due to maintenance.
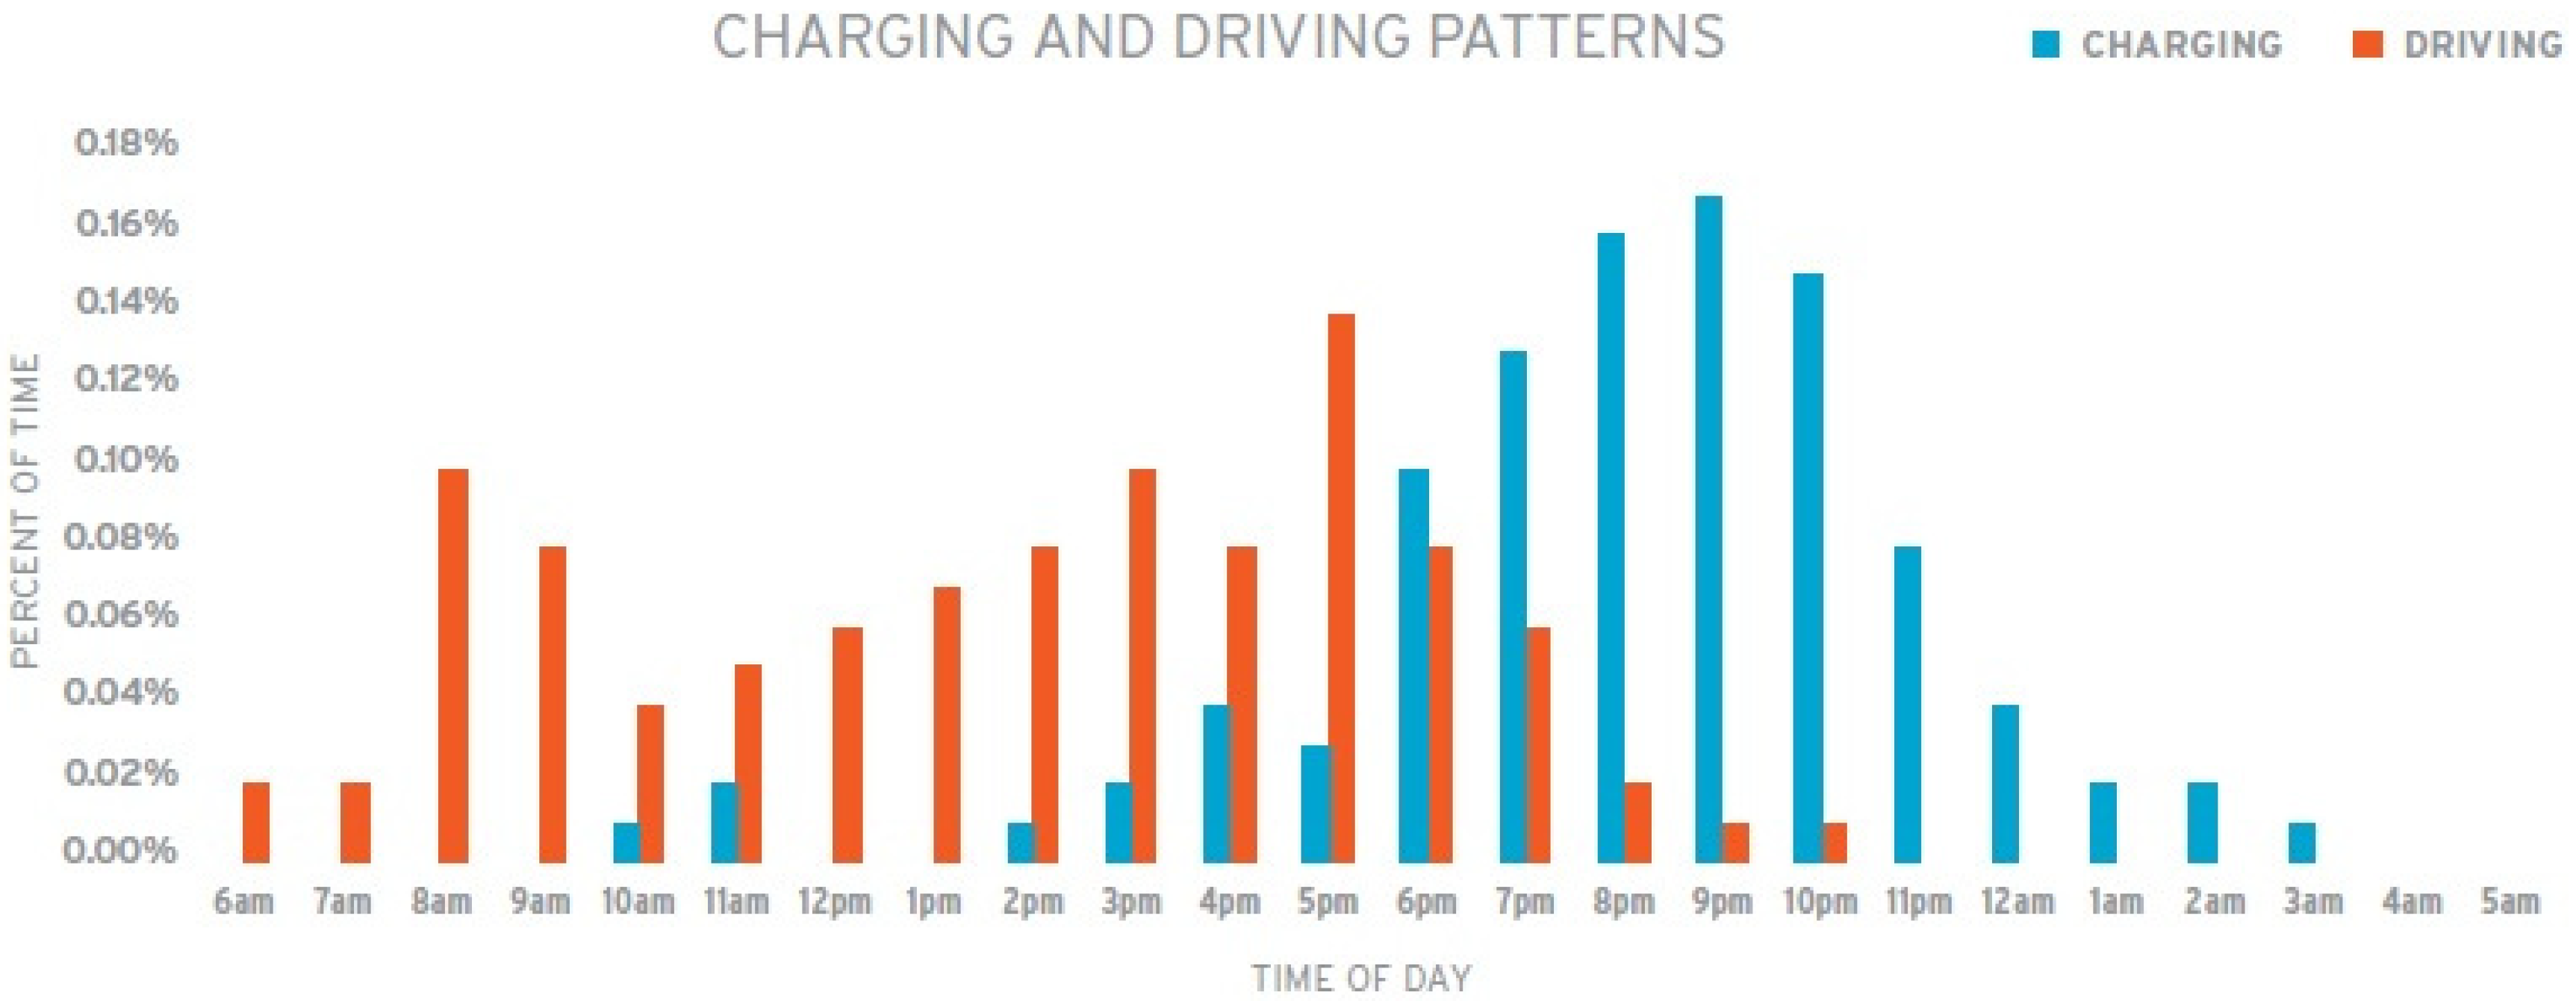
The annual cost derived from the electric vehicle consumption is calculated based on the price of electricity, but it is necessary to take into account various considerations: the number of users that will have a suitably equipped garage, the number of users that will recharge by night, by day, the driving patterns [
21],
etc.
Figure 7.
Driving patterns [
21].
Figure 7.
Driving patterns [
21].
The first consideration is to assume that most users with electric vehicles will have a garage (as seen before) and most of them (80% [
22]) will recharge the car at night. This value is also supported by studies in pilot positions analyzing the patterns of use of the electric vehicle and its recharge rate.
Figure 7 shows the results of a study of “The Idaho National Laboratory” [
21]. It can be clearly seen how the majority of recharges are done during a period when the vehicle is not in use, at nighttime.
According to this, the prices of recharge during the day, the evening and at the reduced rate called “Super Off-peak Tariff”, given by the Government of Spain, were studied. The last rate is designed to support the charges of electric vehicles made during the night, and thereby improve the recharge curve as explained above, as reflected in the “Strategy to Promote Electric Vehicles in Spain” [
28]. Since there is still no information on this rate, we estimated a maximum cost per kWh that would give this rate-calculated value at 50% of the cost of electricity during the night. This value has been taken in a somewhat arbitrary way, since, as mentioned above, there is no information yet on this rate, but it is considered that this value of kWh could achieve the results anticipated at this rate.
With the values of all rates and the estimations of the potential users of each rate, the average price of electricity has been obtained. As happened with oil prices, obtaining an estimate of the price of electricity in Spain is extremely difficult, but it has been necessary to make this estimate for a more realistic model. Data based on from the values from recent years cannot be extrapolated, given the continuous modification of the rates due to a tariff deficit of the electrical system.
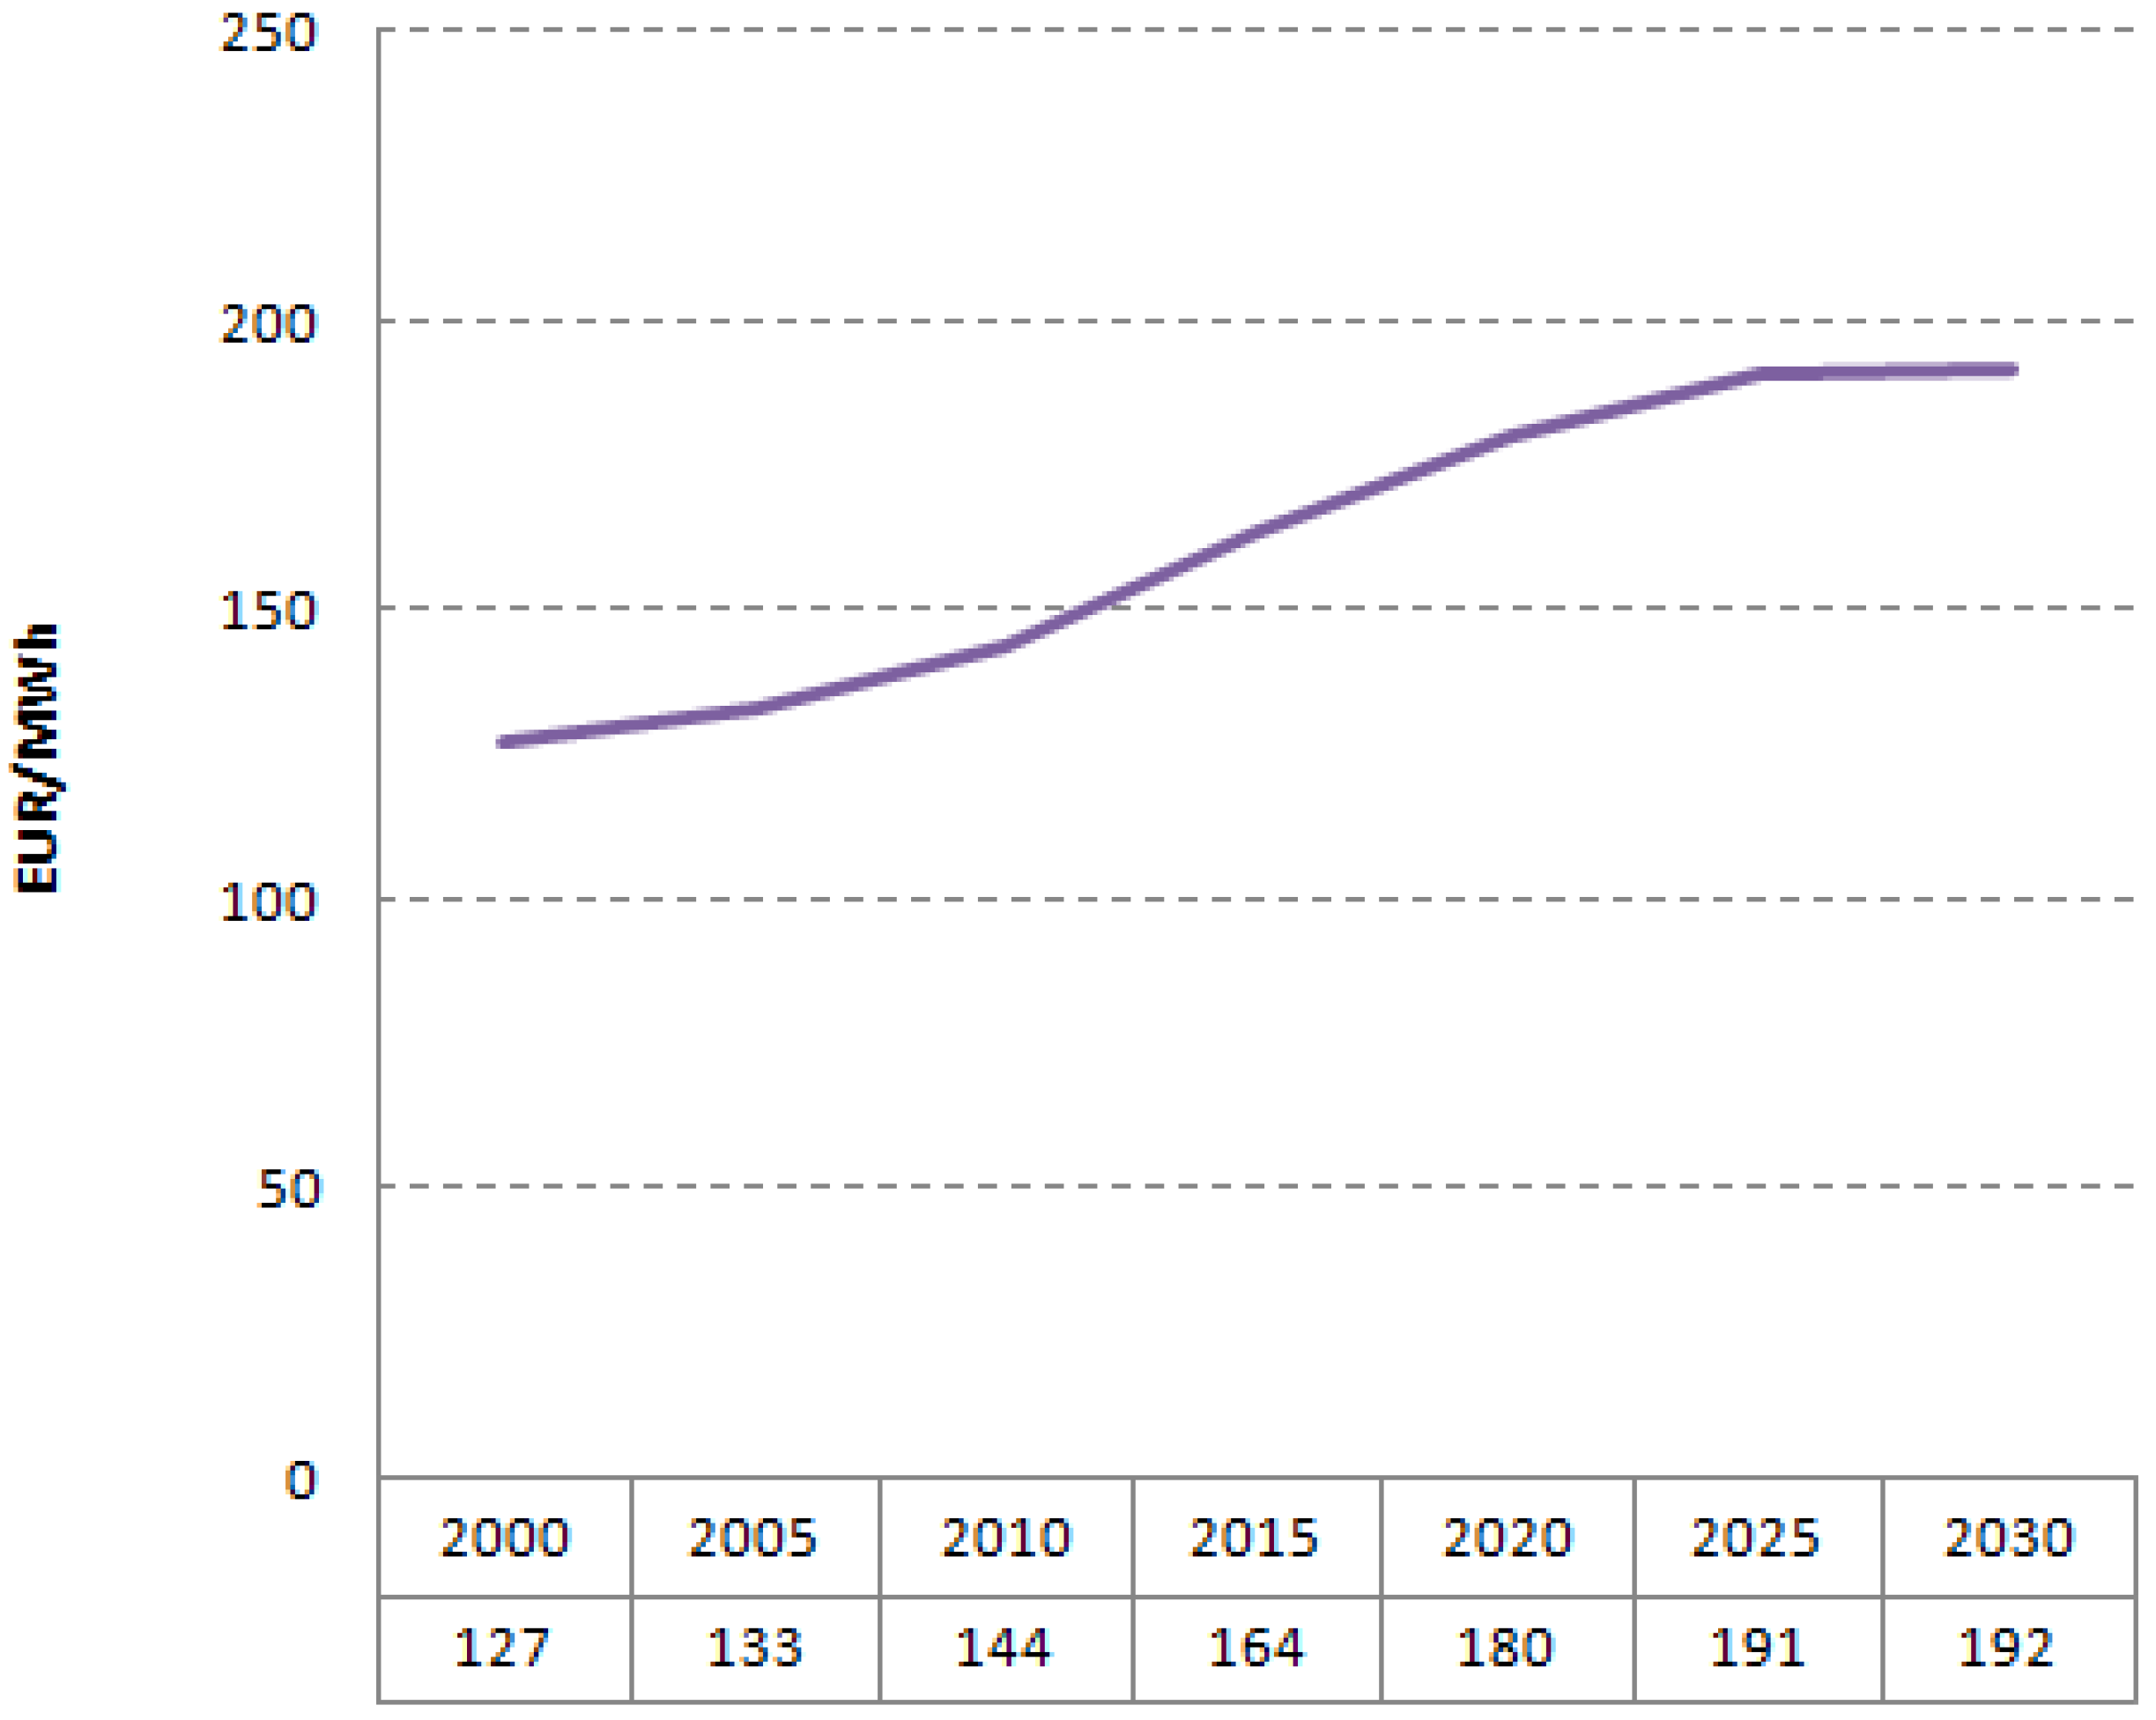
The tariff deficit is the difference between the actual cost of electricity production (both production and transport and distribution) and the fixed rate. This generates a debt that is accumulated every year. Because of this, the fluctuation in prices is difficult to quantify. According to this, the approach indicated by the European Commission for Energy has been used, given by the curve shown in the
Figure 8.
Figure 8.
Electricity price forecast [
29].
Figure 8.
Electricity price forecast [
29].
Finally, it is necessary to estimate the maintenance costs in the same way as for conventional vehicles, that is, relative to the number of kilometers a vehicle does on average before it needs to be replaced. In this case, the value will be set by external studies that determine the value as 0.02 € per kilometer [
11,
30].
By multiplying this value by the average annual miles traveled by a vehicle, you get the economic value that the customer spends annually to maintain the electric vehicle. As can be seen, the maintenance cost per kilometer is significantly lower compared to the conventional vehicle (33% lower). This is because electric motors do not have a large variety of working parts, which means that a continuous maintenance, as exhaustive as in internal combustion engines, is not necessary. In fact, the electric motor has one moving part, the shaft, which is very reliable and requires little or no maintenance. Another important factor is the elimination of oil, which implies that it is not necessary to make periodic oil changes. In the electric vehicle, drive systems do not exist, as nor do fuel pumps or injection, which also minimizes maintenance [
8]. The fact that the electric motor is simpler than the internal combustion engine reduces the risk of breakdowns.
To summarize, we can determine that the TCO is described by the following expression:
where “
y” is the year of purchase. As explained above, the annual costs for both kinds of vehicles are determined by fuel costs and maintenance costs from the vehicle purchasing year until the year 2020, the year when the simulation ends. Obviously, these costs are variable in time due to variations in the fuel prices previously explained, as well as the number of kilometers traveled on average each year.
Once all input data have been determined and modeled, the output data is the number of years that the potential clients take to recover their investment, comparing how long it takes for it to be more profitable to buy an electric vehicle than a conventional vehicle. This value will depend on the timeframe when purchasing the vehicle.
According to the number of years for repayment, the purchase of electric vehicles, compared to conventional vehicles, will have a different appeal to the potential customer, resulting in a percentage of the population that will potentially want to buy an electric vehicle in Spain.
This result, added to the rest of the results from the other blocks of the model, enables us to obtain the estimated number of vehicles that could run on Spanish roads in the coming years under our assumptions.
It is important to note that, although the economic is the main factor when purchasing a new vehicle, there is no direct correlation between the price of the vehicle and the number of existing electric vehicles on the roads. For the full study and the final results, other factors have been used, such as the autonomy of electric vehicle, advertisements and information, recharging points and “word of mouth”.
6. Results
As explained before, the scenarios to analyze are related with the economic factor, keeping the baseline scenario for the other variables not analyzed in this paper. The first scenario to be analyzed corresponds to the baseline model, based on data that we know today for Spain; that is, a forecast model in terms of the likely evolution of the batteries and the non-implementation of battery exchange stations [
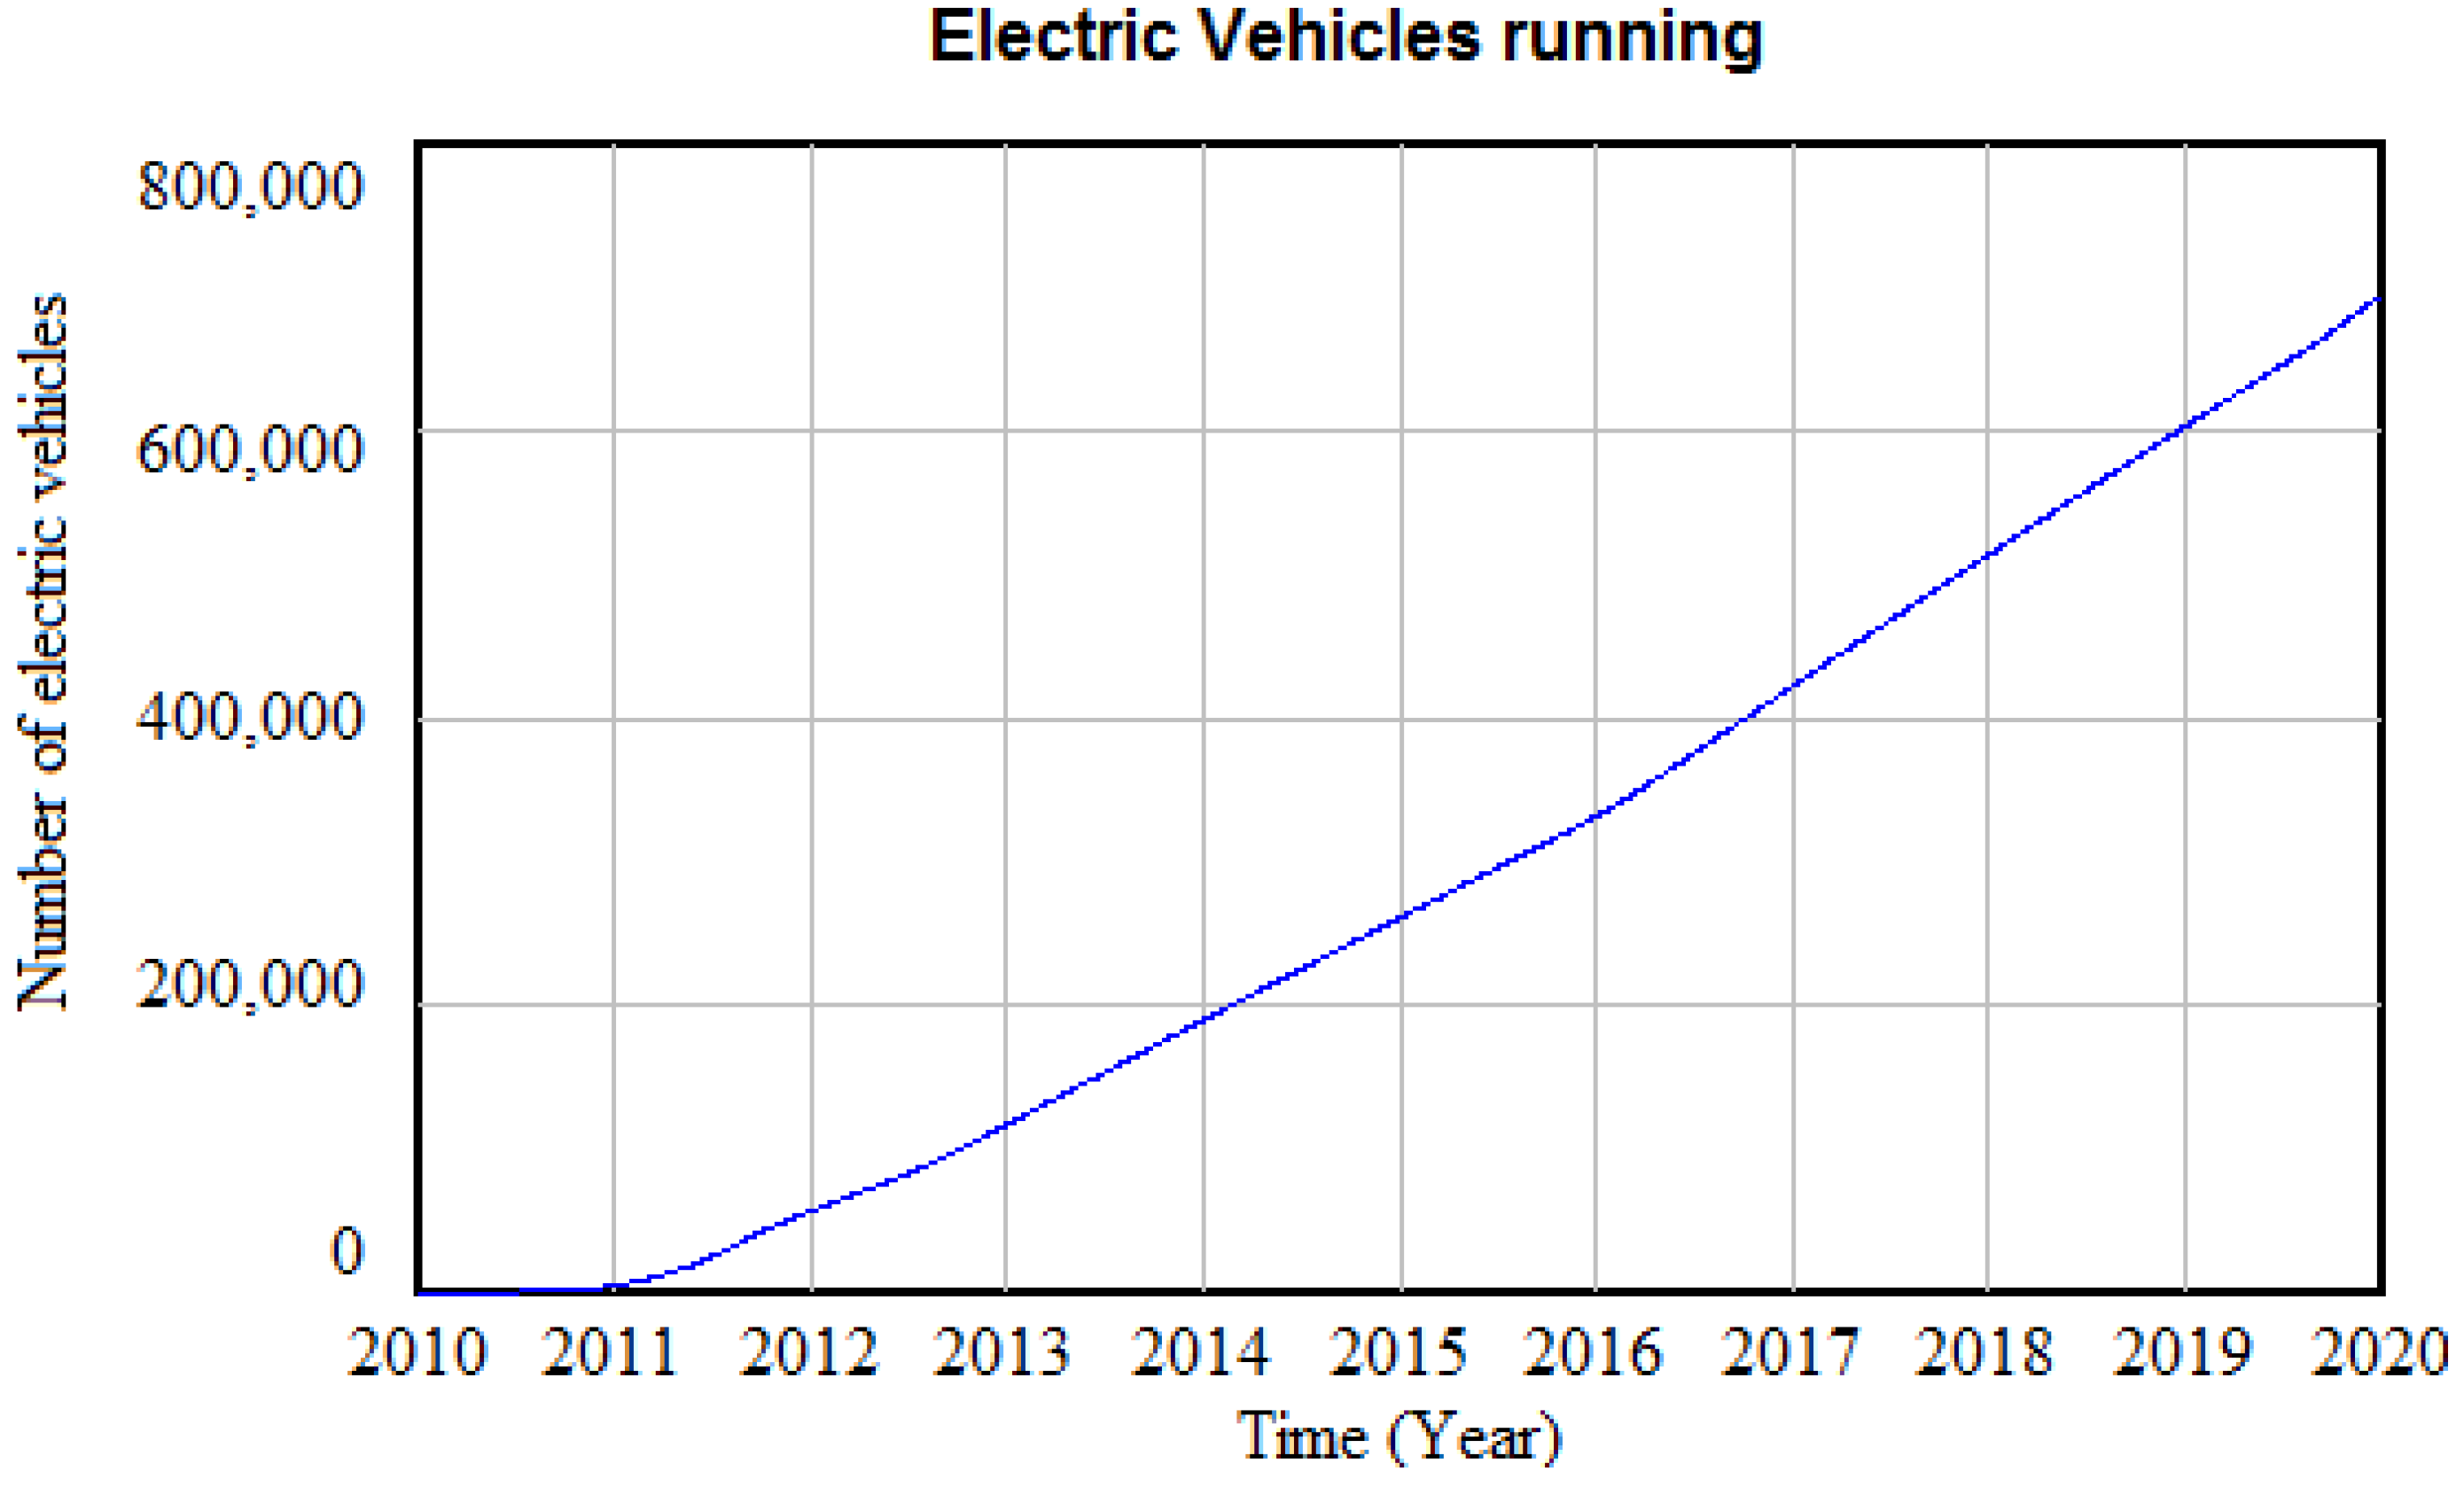
31] and with the estimated average battery cost. We could say that this is the reference state. To combine these data, it is assumed that government subsidies are known until this time,
i.e., 7,000 € for the purchase. As for the cost of the battery, according to the average forecast in 2020, the cost per kWh will be close to 243 € [
21], implying that a full battery will cost about 6,500 €. According to the model and the average forecasts in all fields, we find that the number of vehicles in 2020 would be around 700,000 (
Figure 9).
Figure 9.
Electric vehicles on Spanish roads (the authors’ calculations).
Figure 9.
Electric vehicles on Spanish roads (the authors’ calculations).
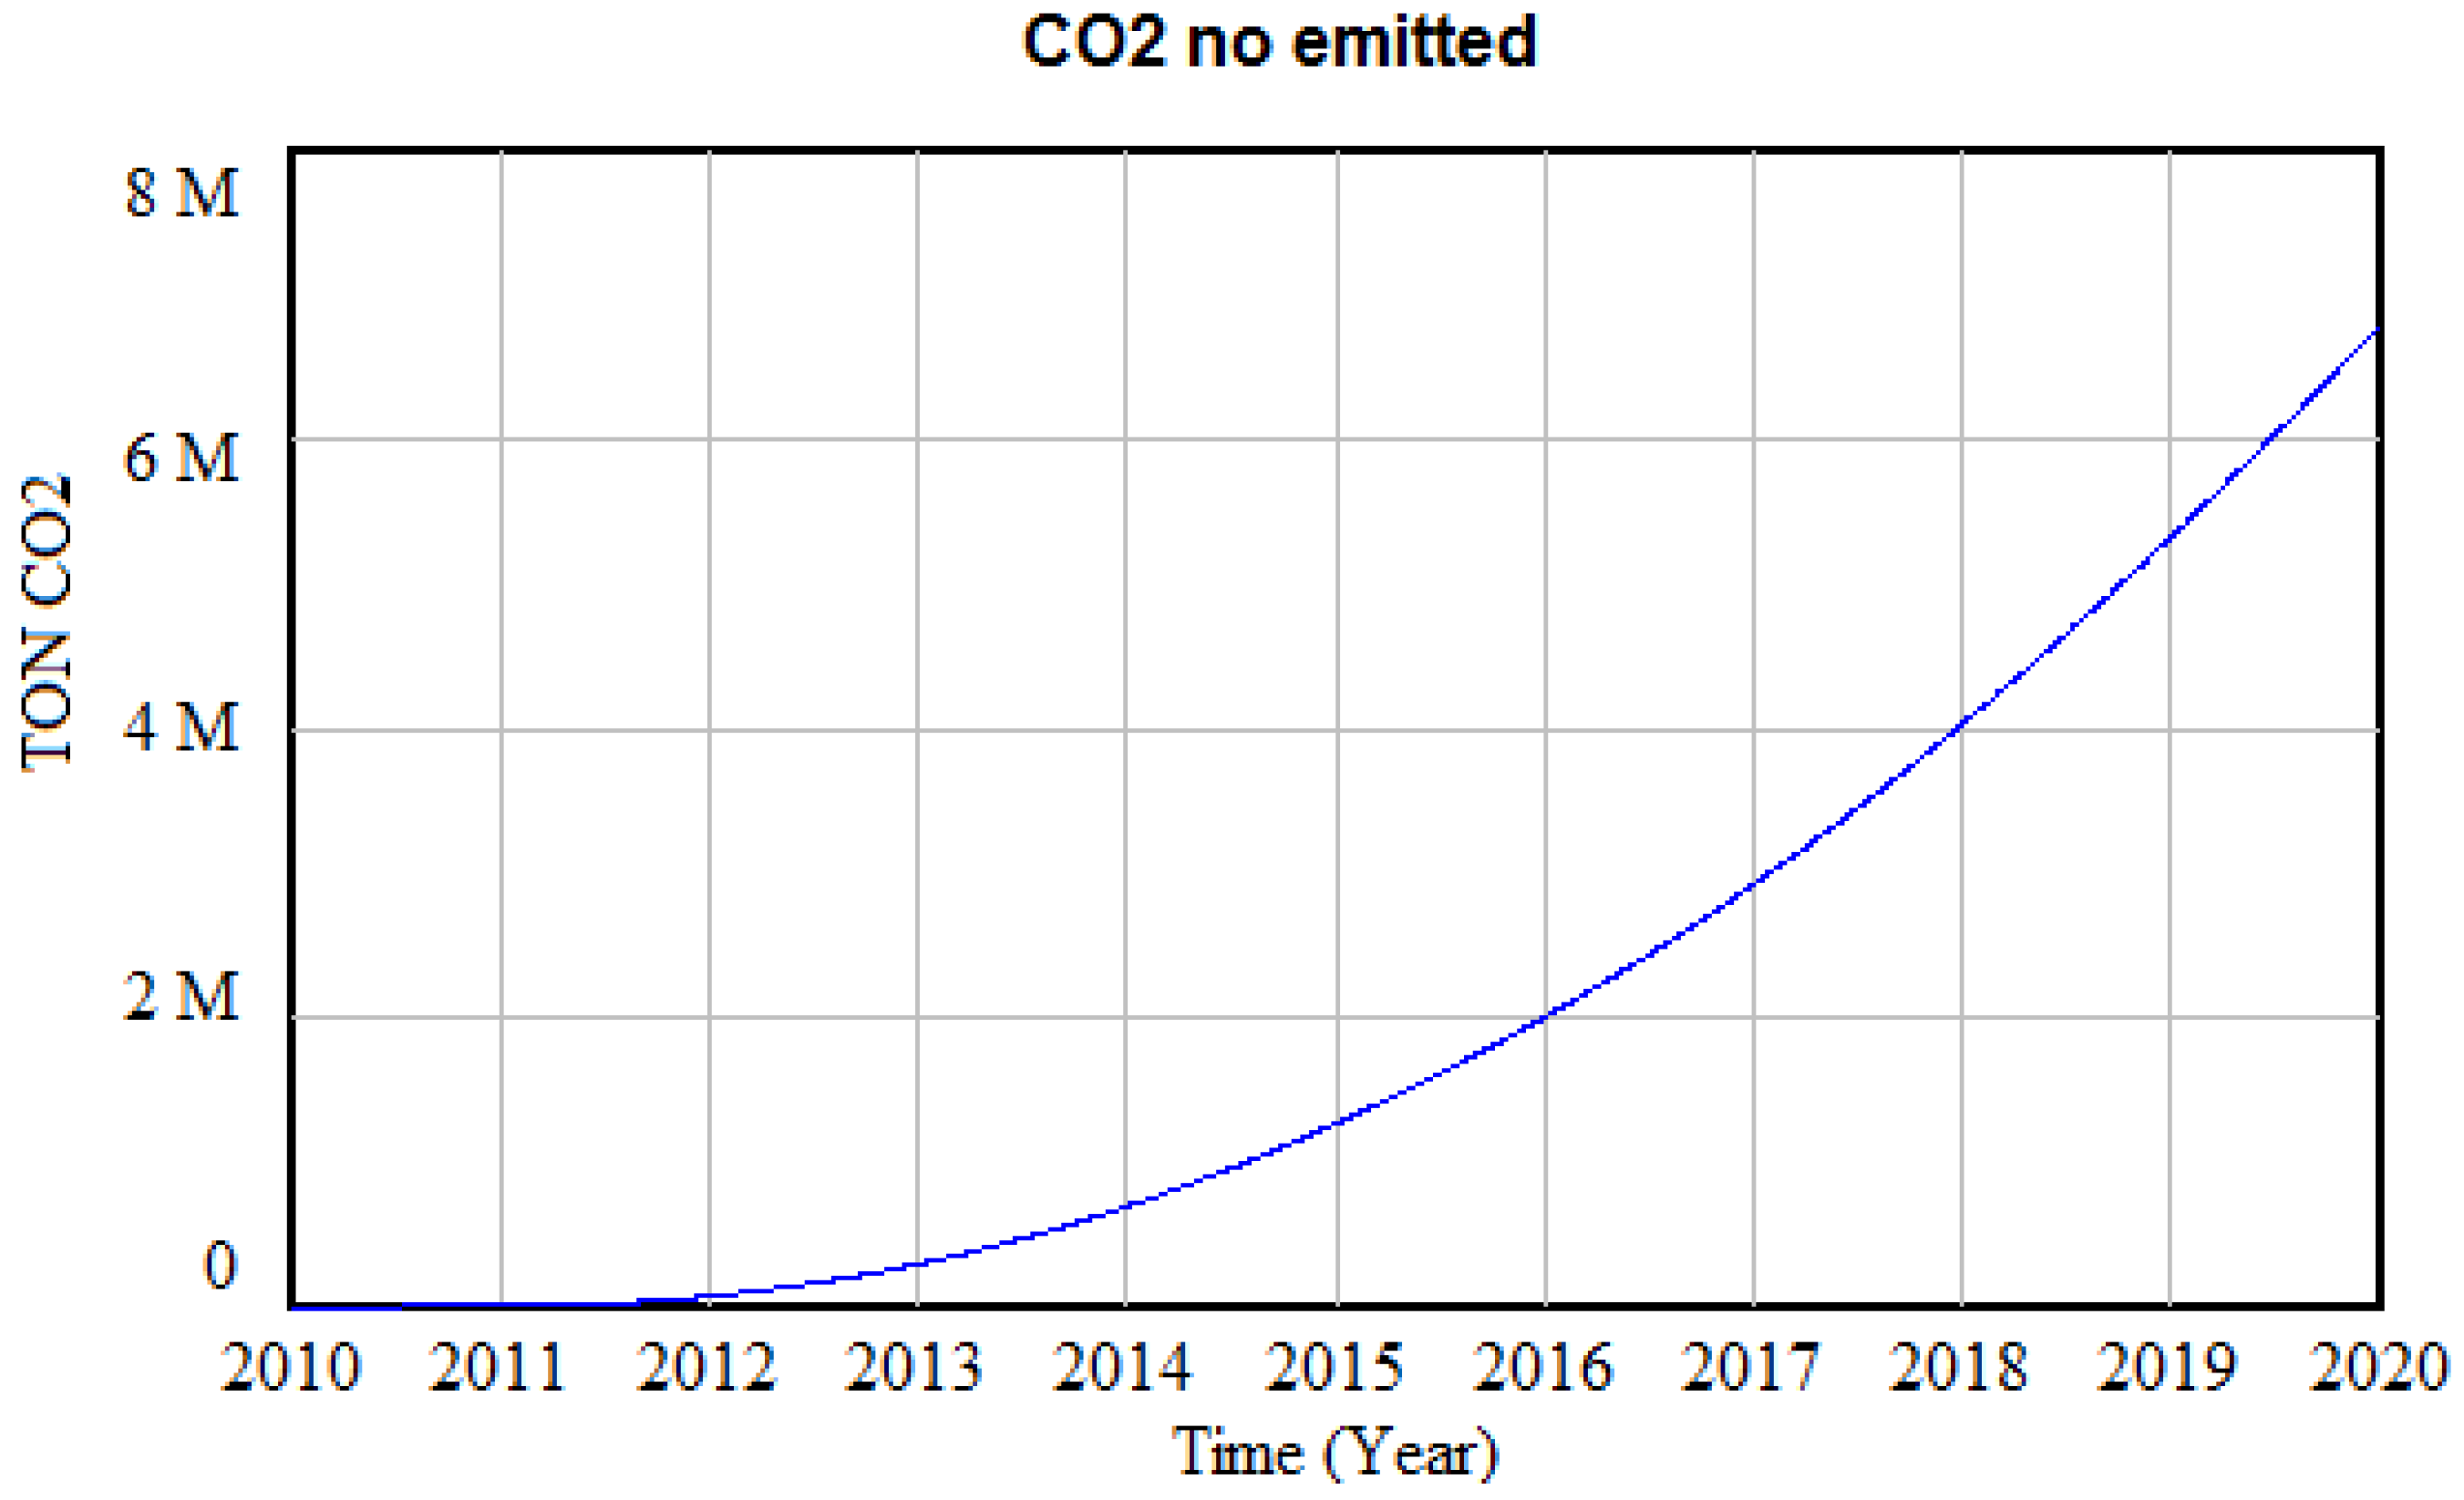
Figure 10.
TON of CO2 not emitted (the authors’ calculations).
Figure 10.
TON of CO2 not emitted (the authors’ calculations).
This figure corresponds to a number of CO
2 tons not emitted to the atmosphere of more than 6 million (
Figure 10). To calculate the CO
2 not emitted, the replacement of a conventional vehicle by an electric vehicle is assumed. In this first stage of the electric vehicle commercialization, it is only expected to reach the “early market”, that is, the market formed by the “innovators” such as car enthusiasts and environmentalists [
30]. Due to the small size of this group (less than 2.5% of global demand), the so-called “rebound effect” due to the temporal space covered by the study is not expected [
32].
Although the electric vehicle obtains a reduction in CO
2 emissions because it does not generate emissions during its use due to the electric engine, there are emissions generated in the production of the electrical energy used by the vehicle. Accordingly, there is an emission displacement, but as mentioned above, the total energy balance (Well-To-Wheel) still indicates a significant reduction in CO
2 emissions [
33].
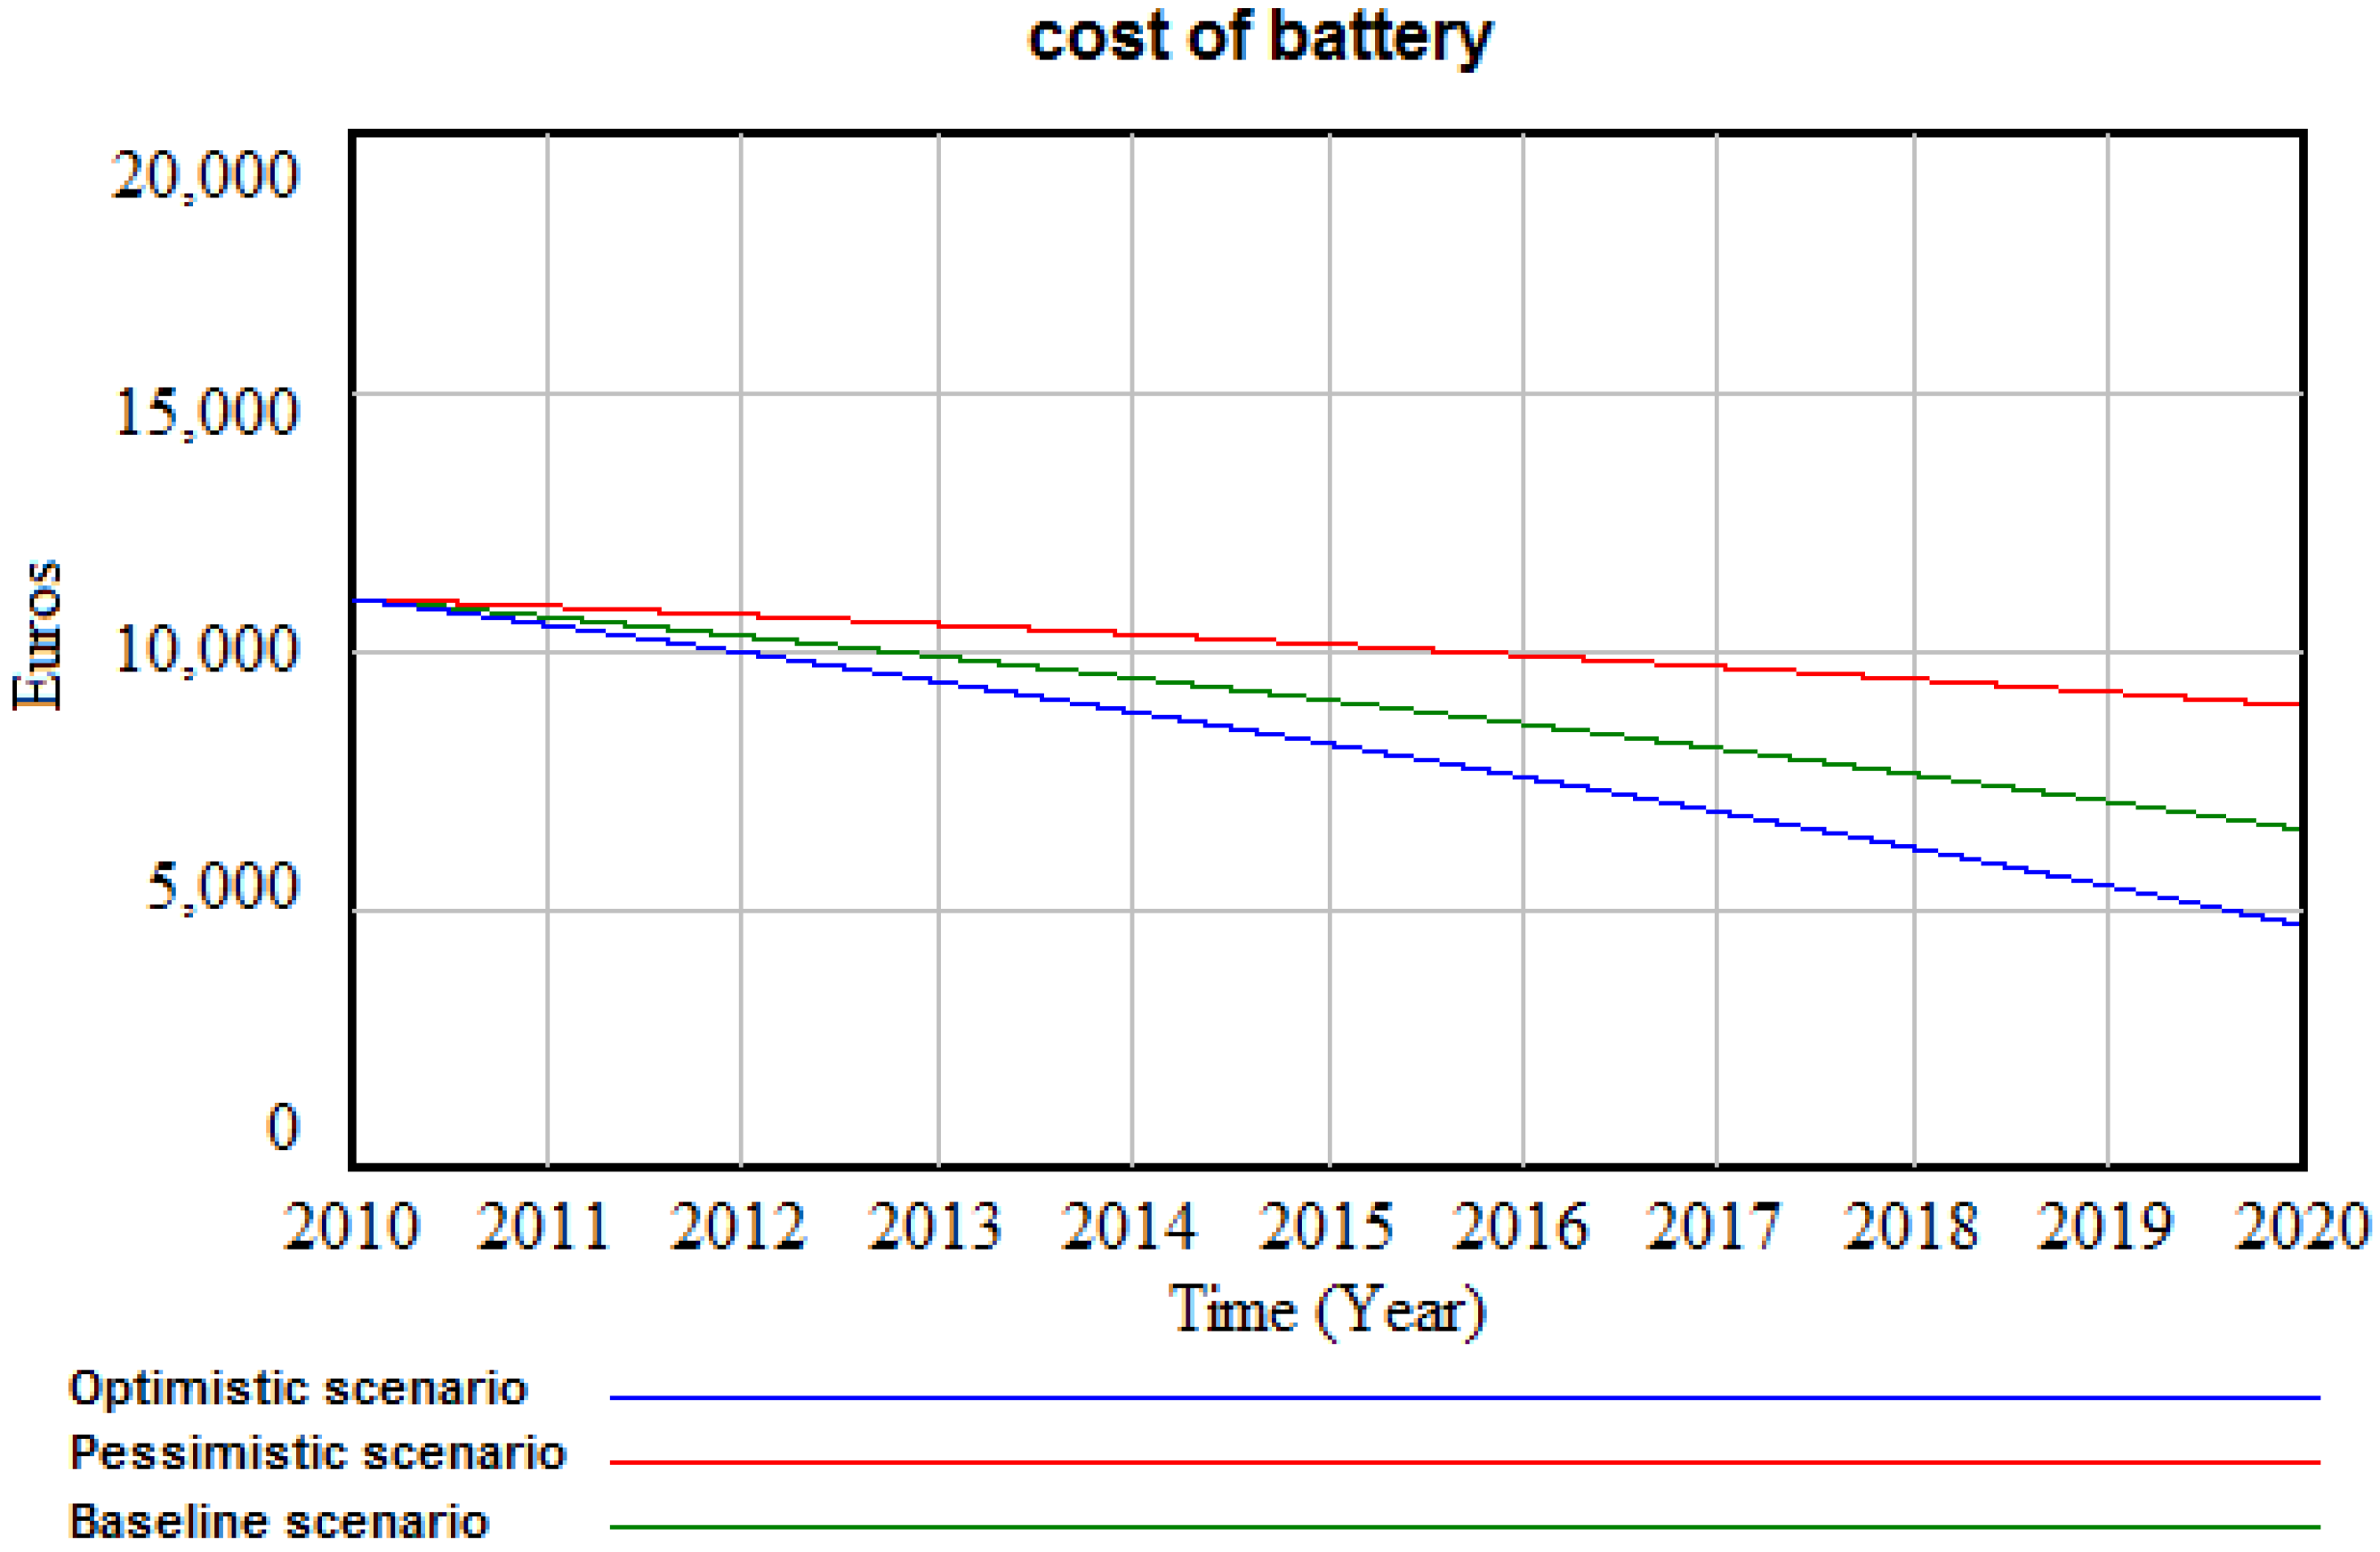
The following scenarios are designed to study the evolution of the cost of the battery. As seen before, the cost of the battery is decisive in the evolution of electric vehicle demand. For the analysis of this battery development, two scenarios are considered in addition to the baseline: the optimistic scenario with an annual decrease of 10% in kWh of the battery (corresponding to a major evolution of electric vehicle sales worldwide, making the cost of the battery dramatically lower due to mass production), and one pessimistic, with an annual decrease of 4% in the price of the battery (this scenario represents a poor use of electric vehicles, where mass production of batteries has failed to take off sufficiently in order to achieve a significant reduction in the price). The baseline scenario is a decrease of 7%.
Figure 11 shows the cost of the battery under the various scenarios.
Figure 11.
Forecast of battery cost in the optimistic, pessimistic and baseline scenarios (own calculations).
Figure 11.
Forecast of battery cost in the optimistic, pessimistic and baseline scenarios (own calculations).
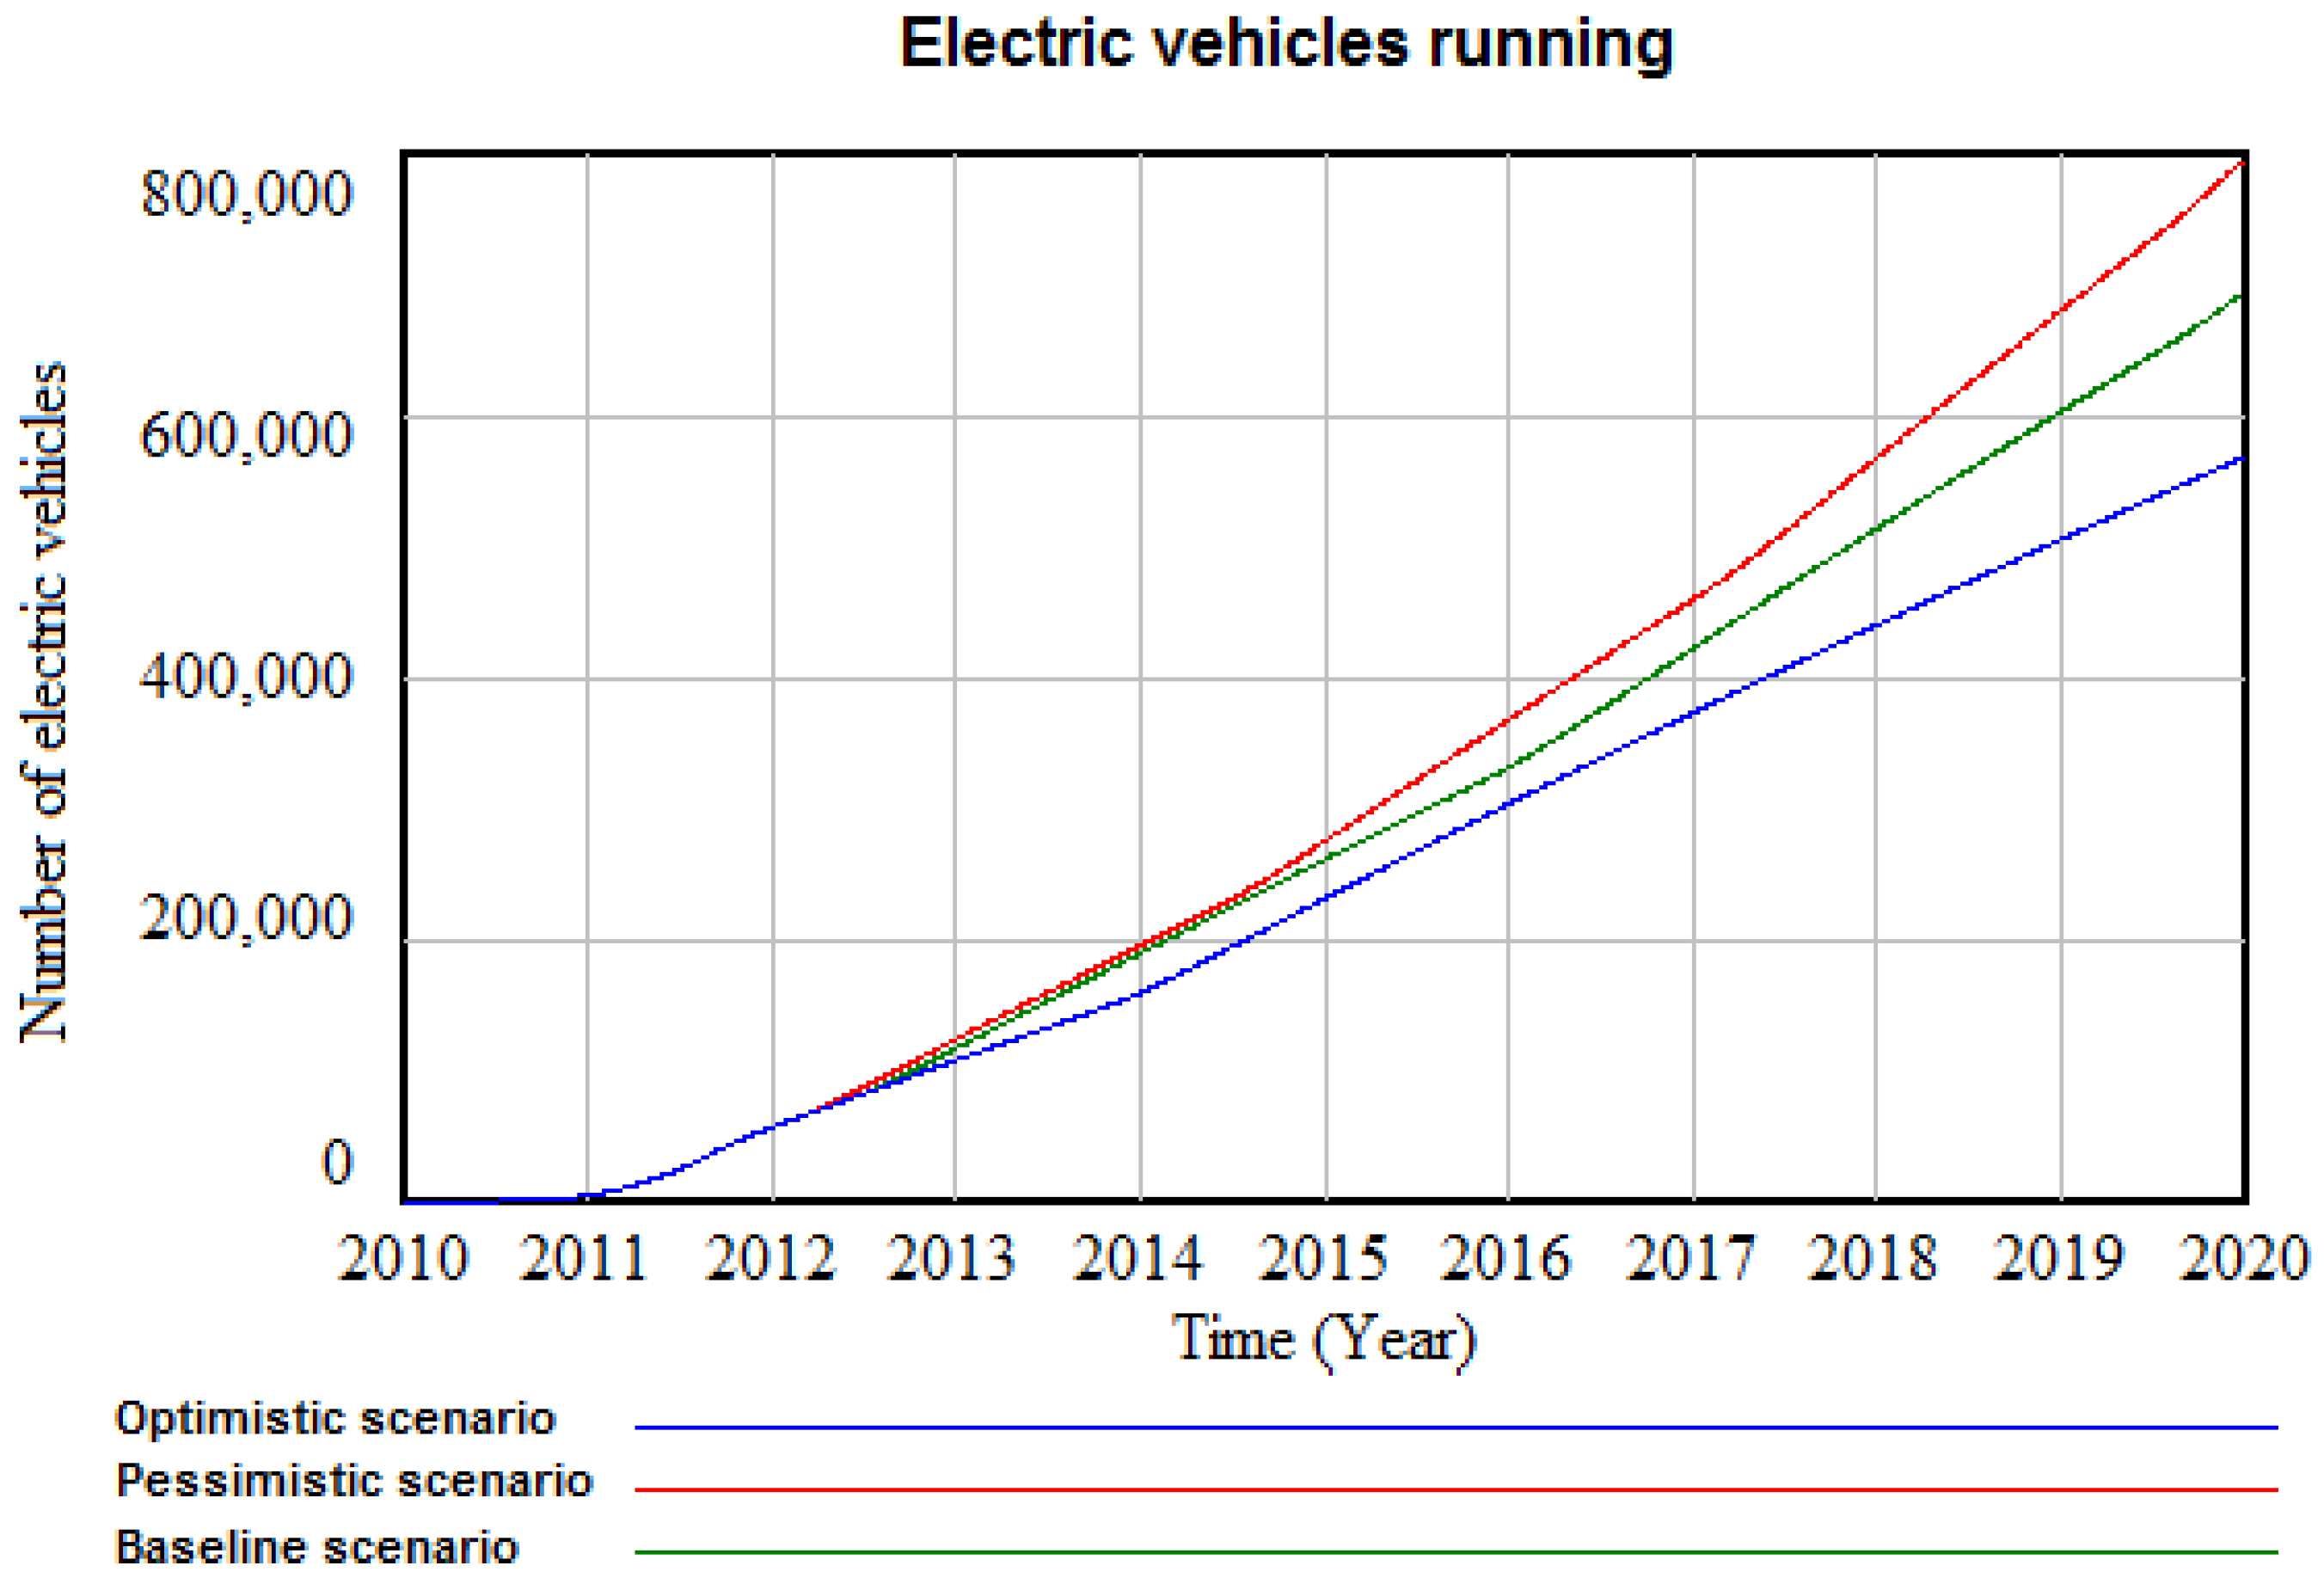
In these three cases, the electric vehicle fleet evolves as follows (
Figure 12):
Figure 12.
Electric vehicles on roads for the optimistic, pessimistic and baseline scenarios (the authors’ calculations).
Figure 12.
Electric vehicles on roads for the optimistic, pessimistic and baseline scenarios (the authors’ calculations).
It can be seen that, in 2013 and the following years, there is a clear difference between the various scenarios. This is because the battery capacity in these early years of commercialization of electric vehicles is relatively small (22 kWh). The value of kWh between scenarios in 2013 ranged between values of 364 and 442 €,
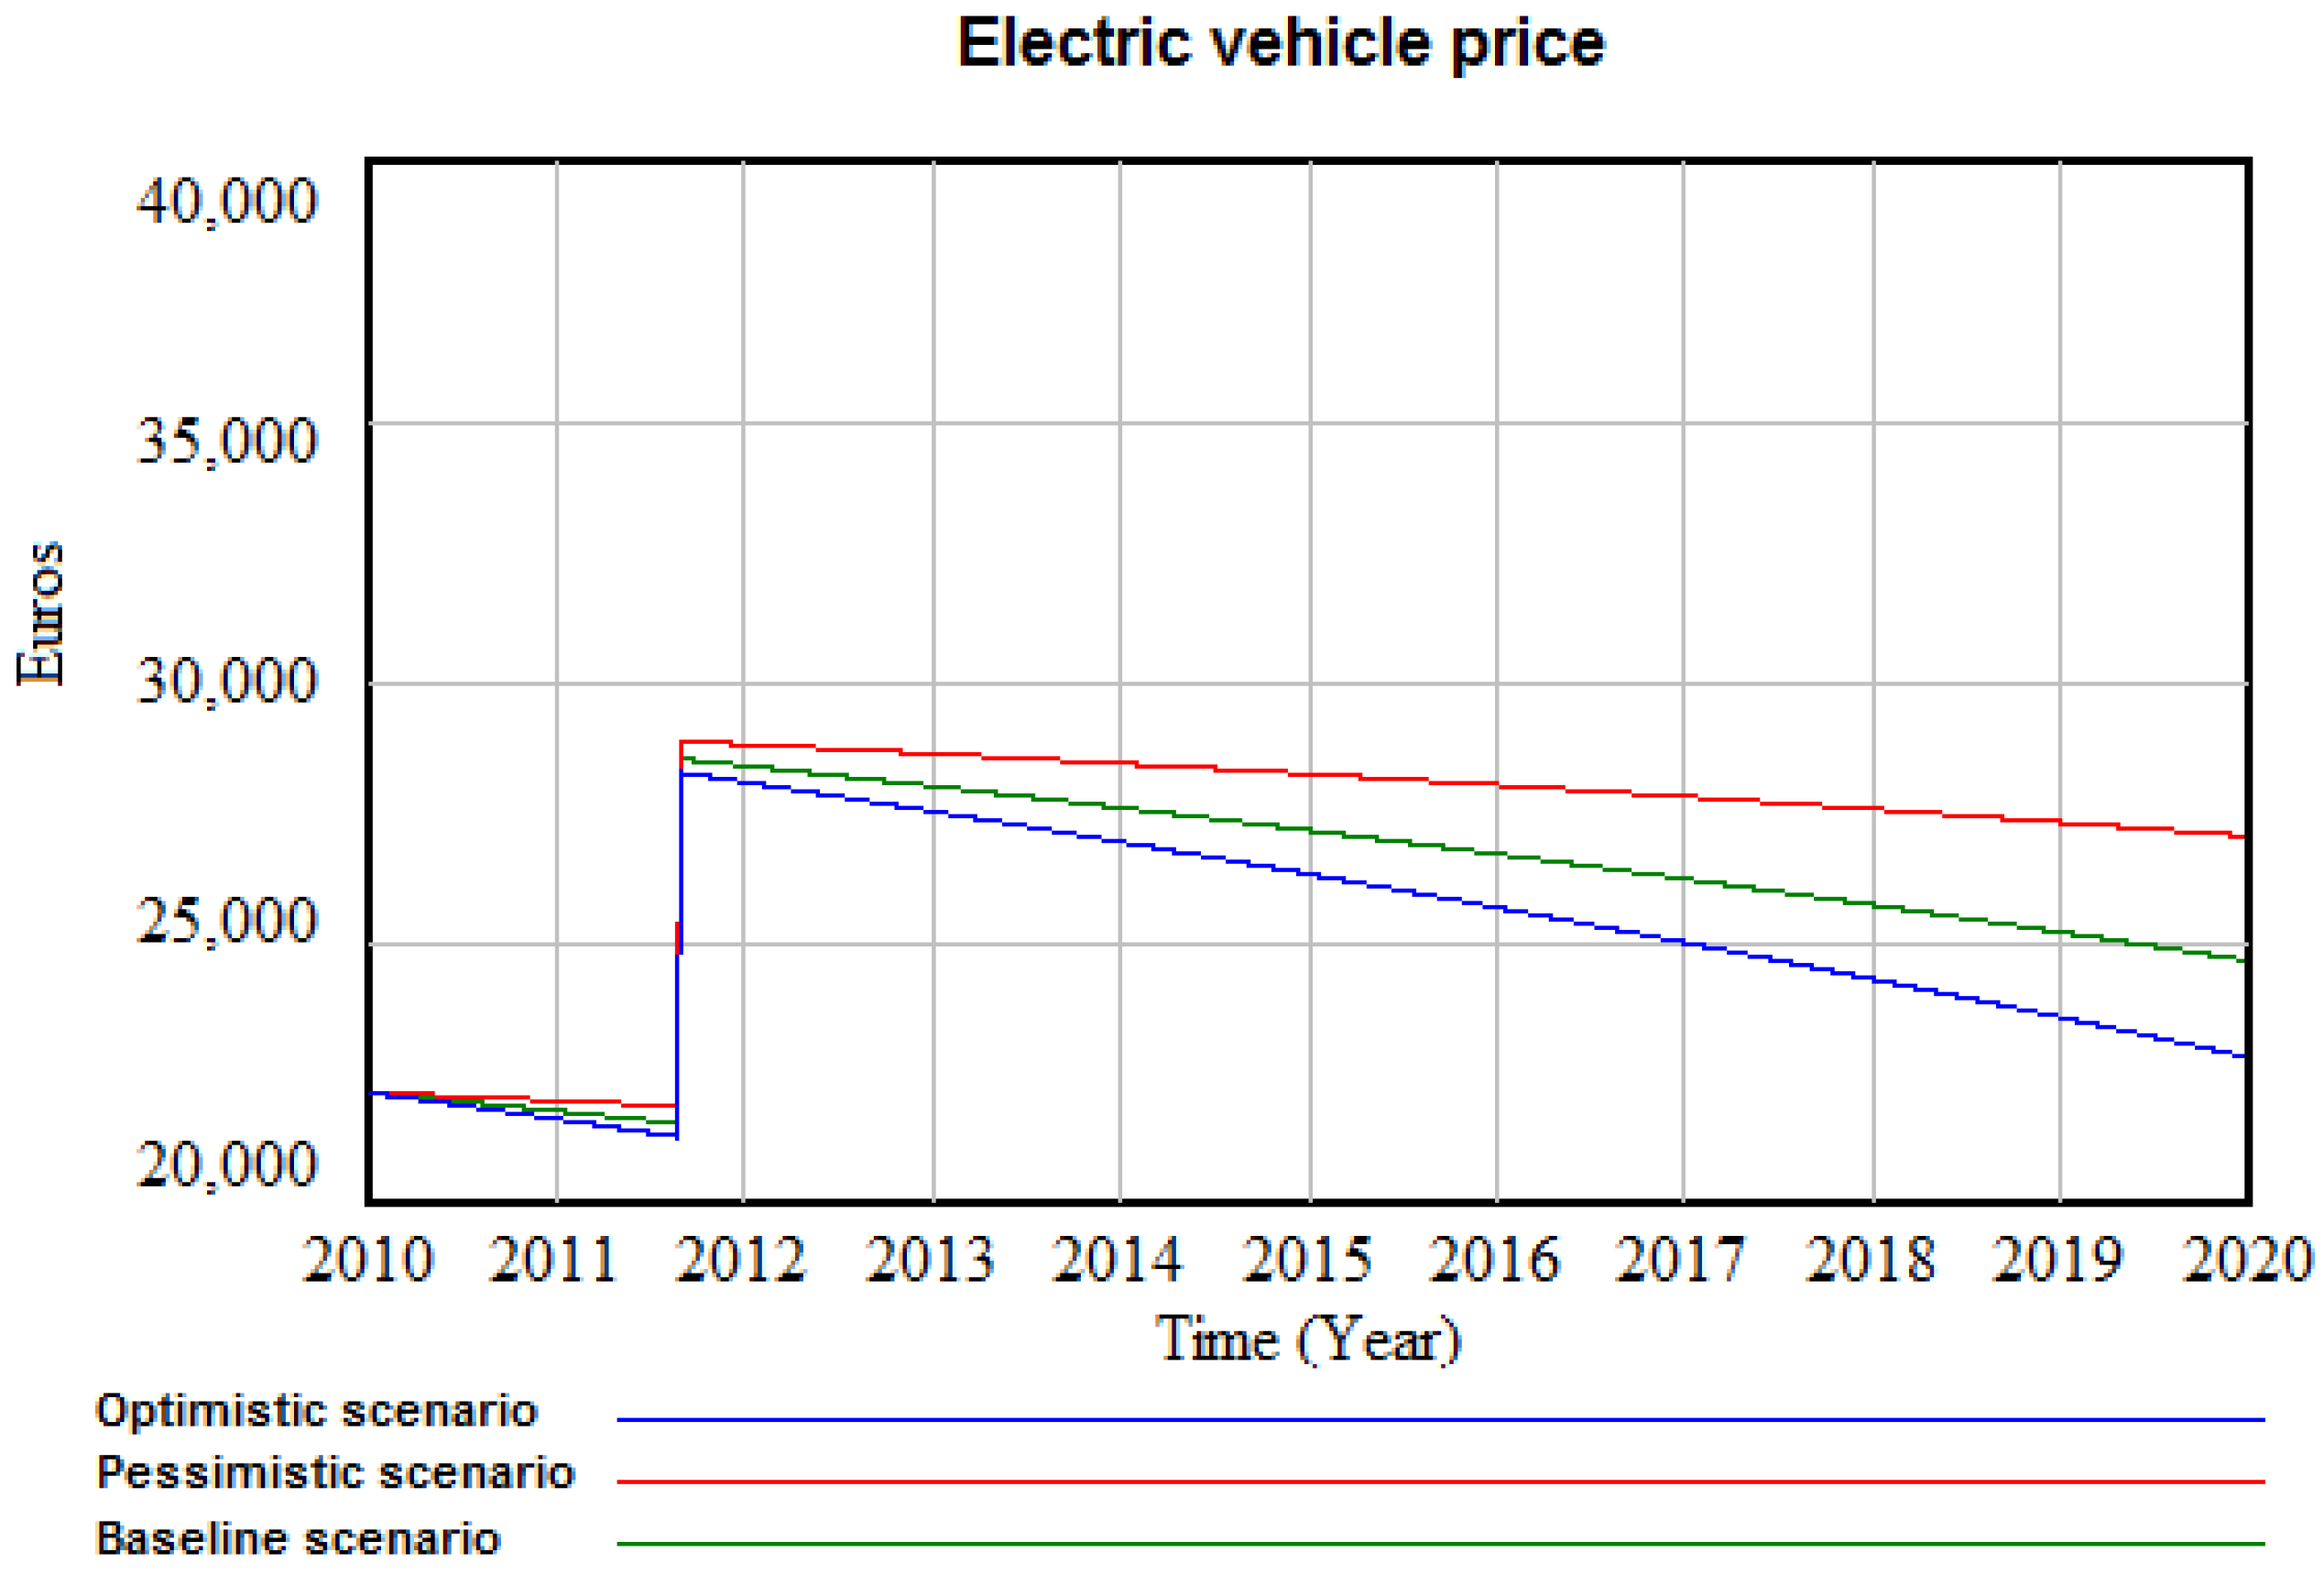
i.e., about 80 € of difference, which, increased by 22 kWh, is approximately 1,700 €. As the battery increases in capacity, this price difference becomes more significant. This can clearly be seen in the graph of the average price of electric vehicles with the current values of the facilities (
Figure 13).
Figure 13.
Electric vehicle price for the optimistic, pessimistic and baseline scenarios (own calculations).
Figure 13.
Electric vehicle price for the optimistic, pessimistic and baseline scenarios (own calculations).
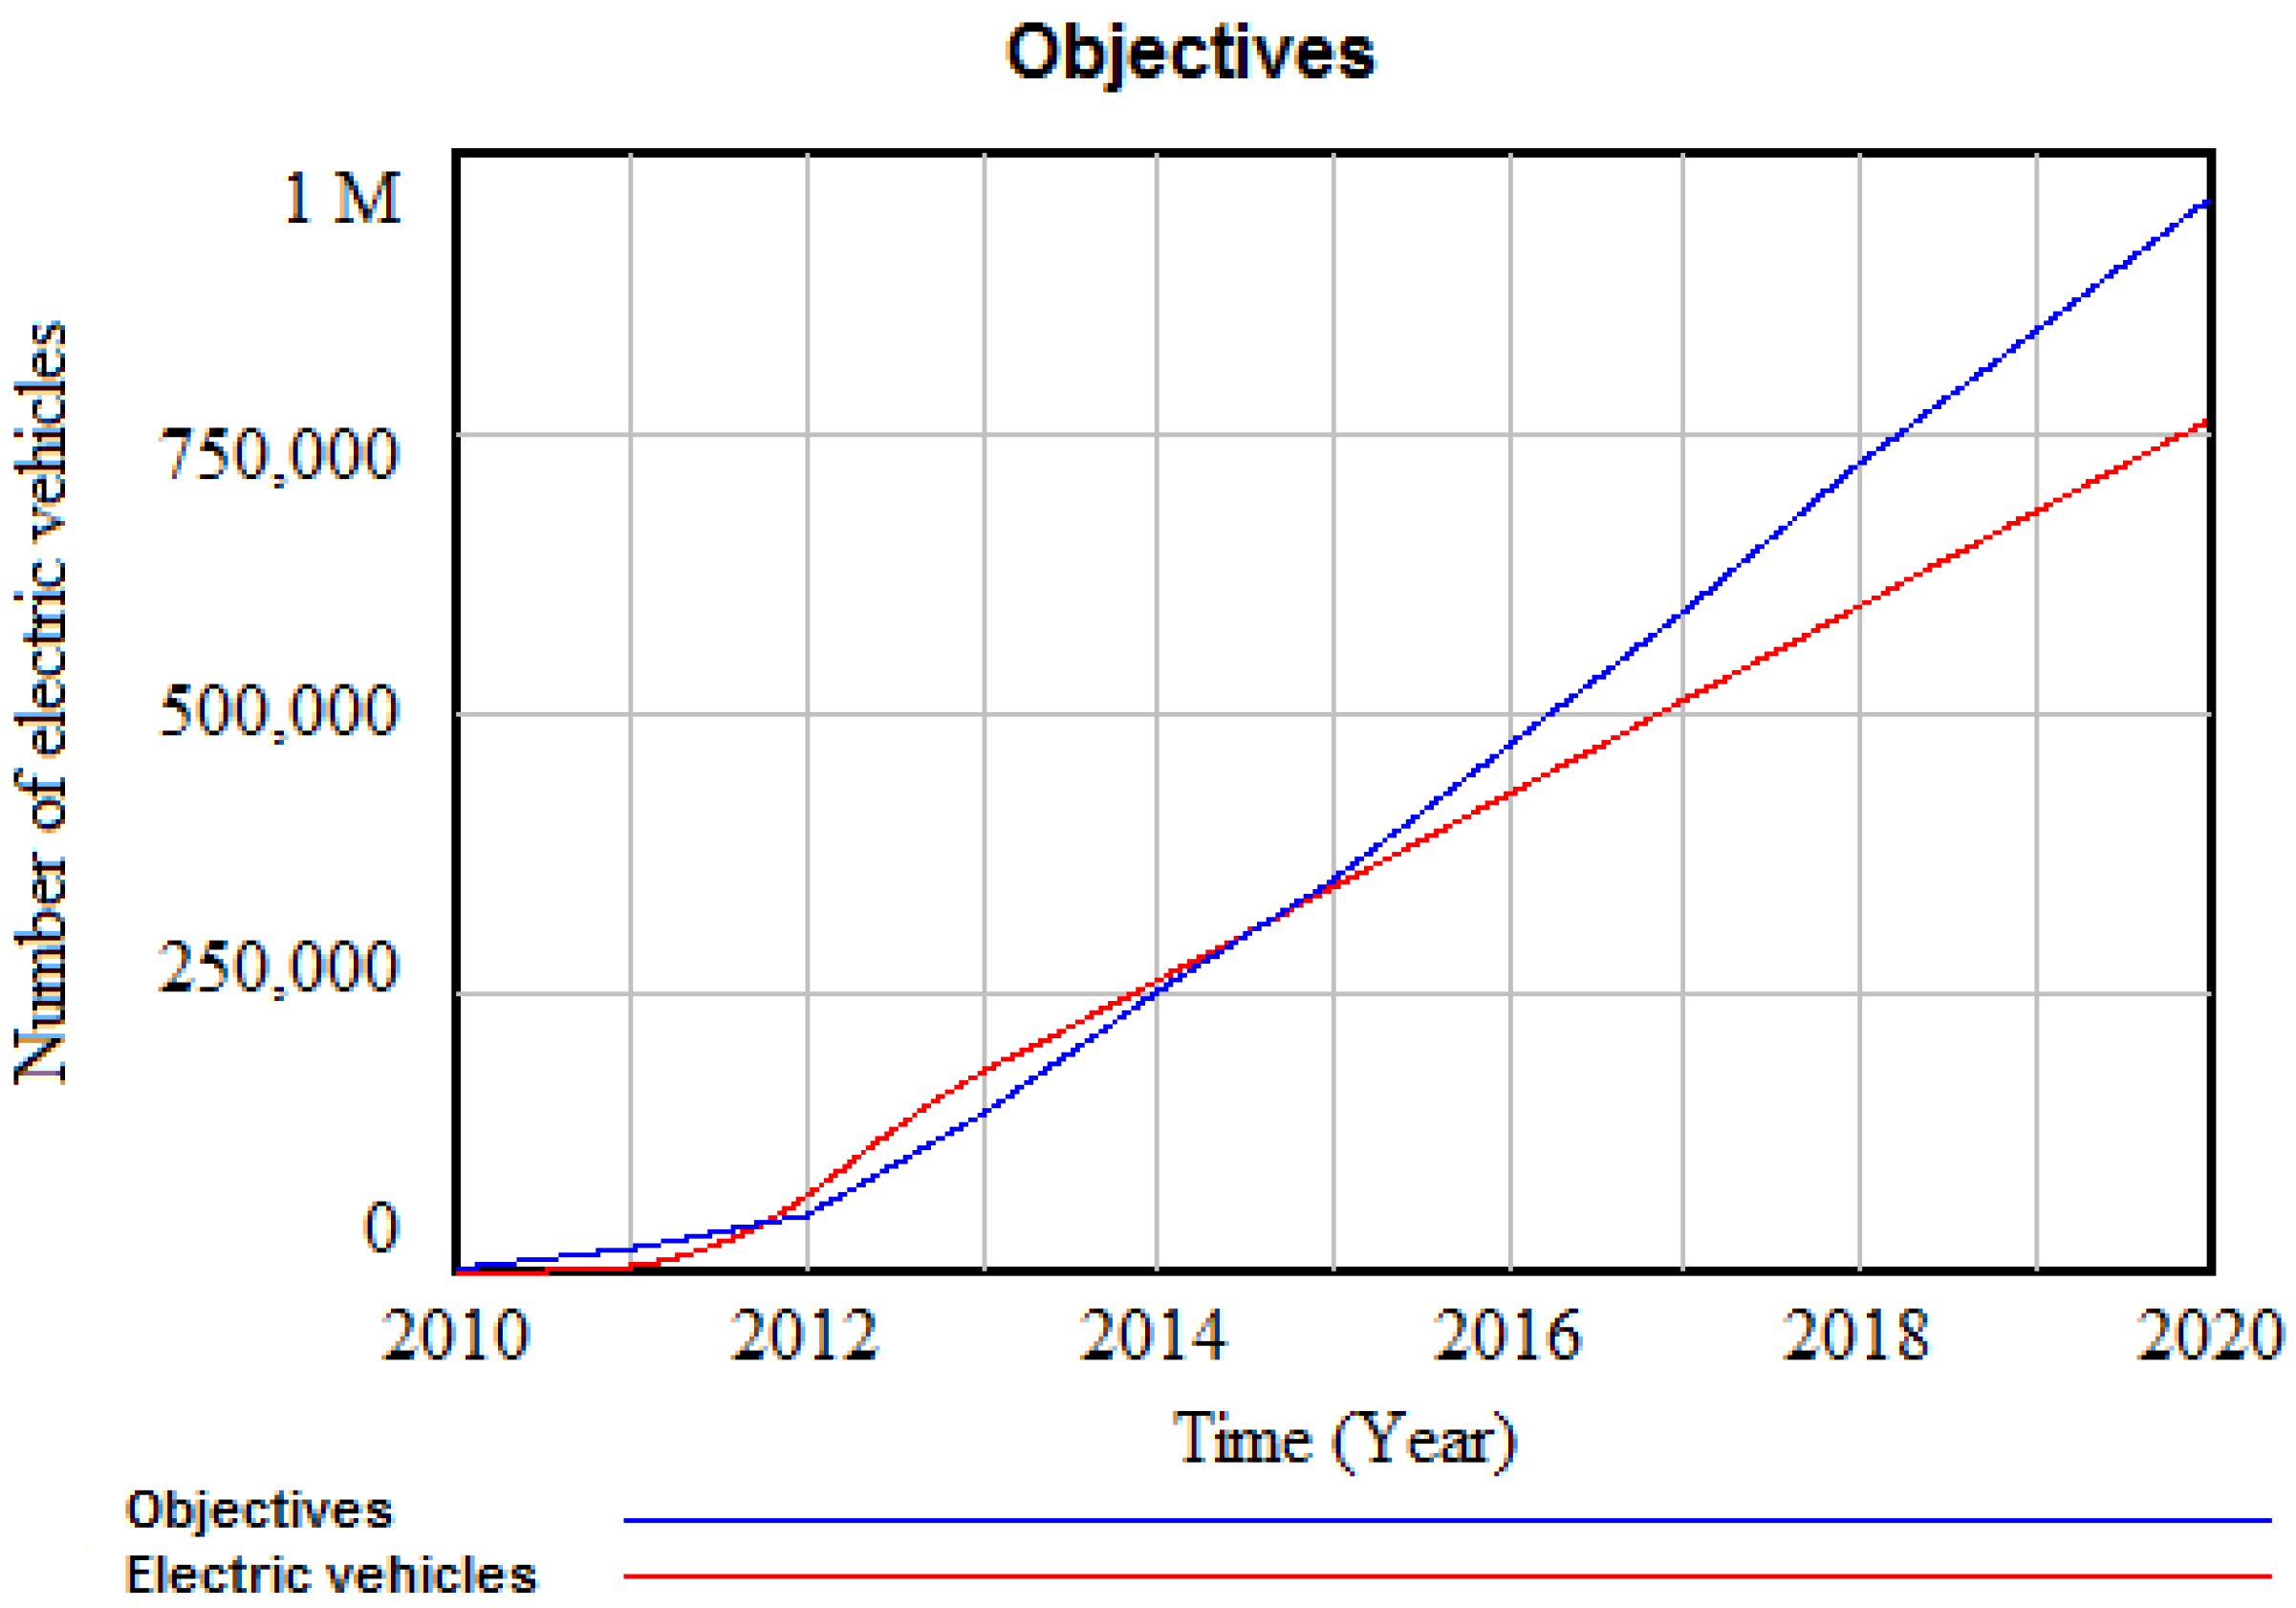
As seen before, the price of the electric vehicle grows so much during 2012 due to the end of subsidies currently approved by the Spanish government. If government support in the form of a subsidy for purchasing electric vehicles is stopped, the targets will not be achieved.
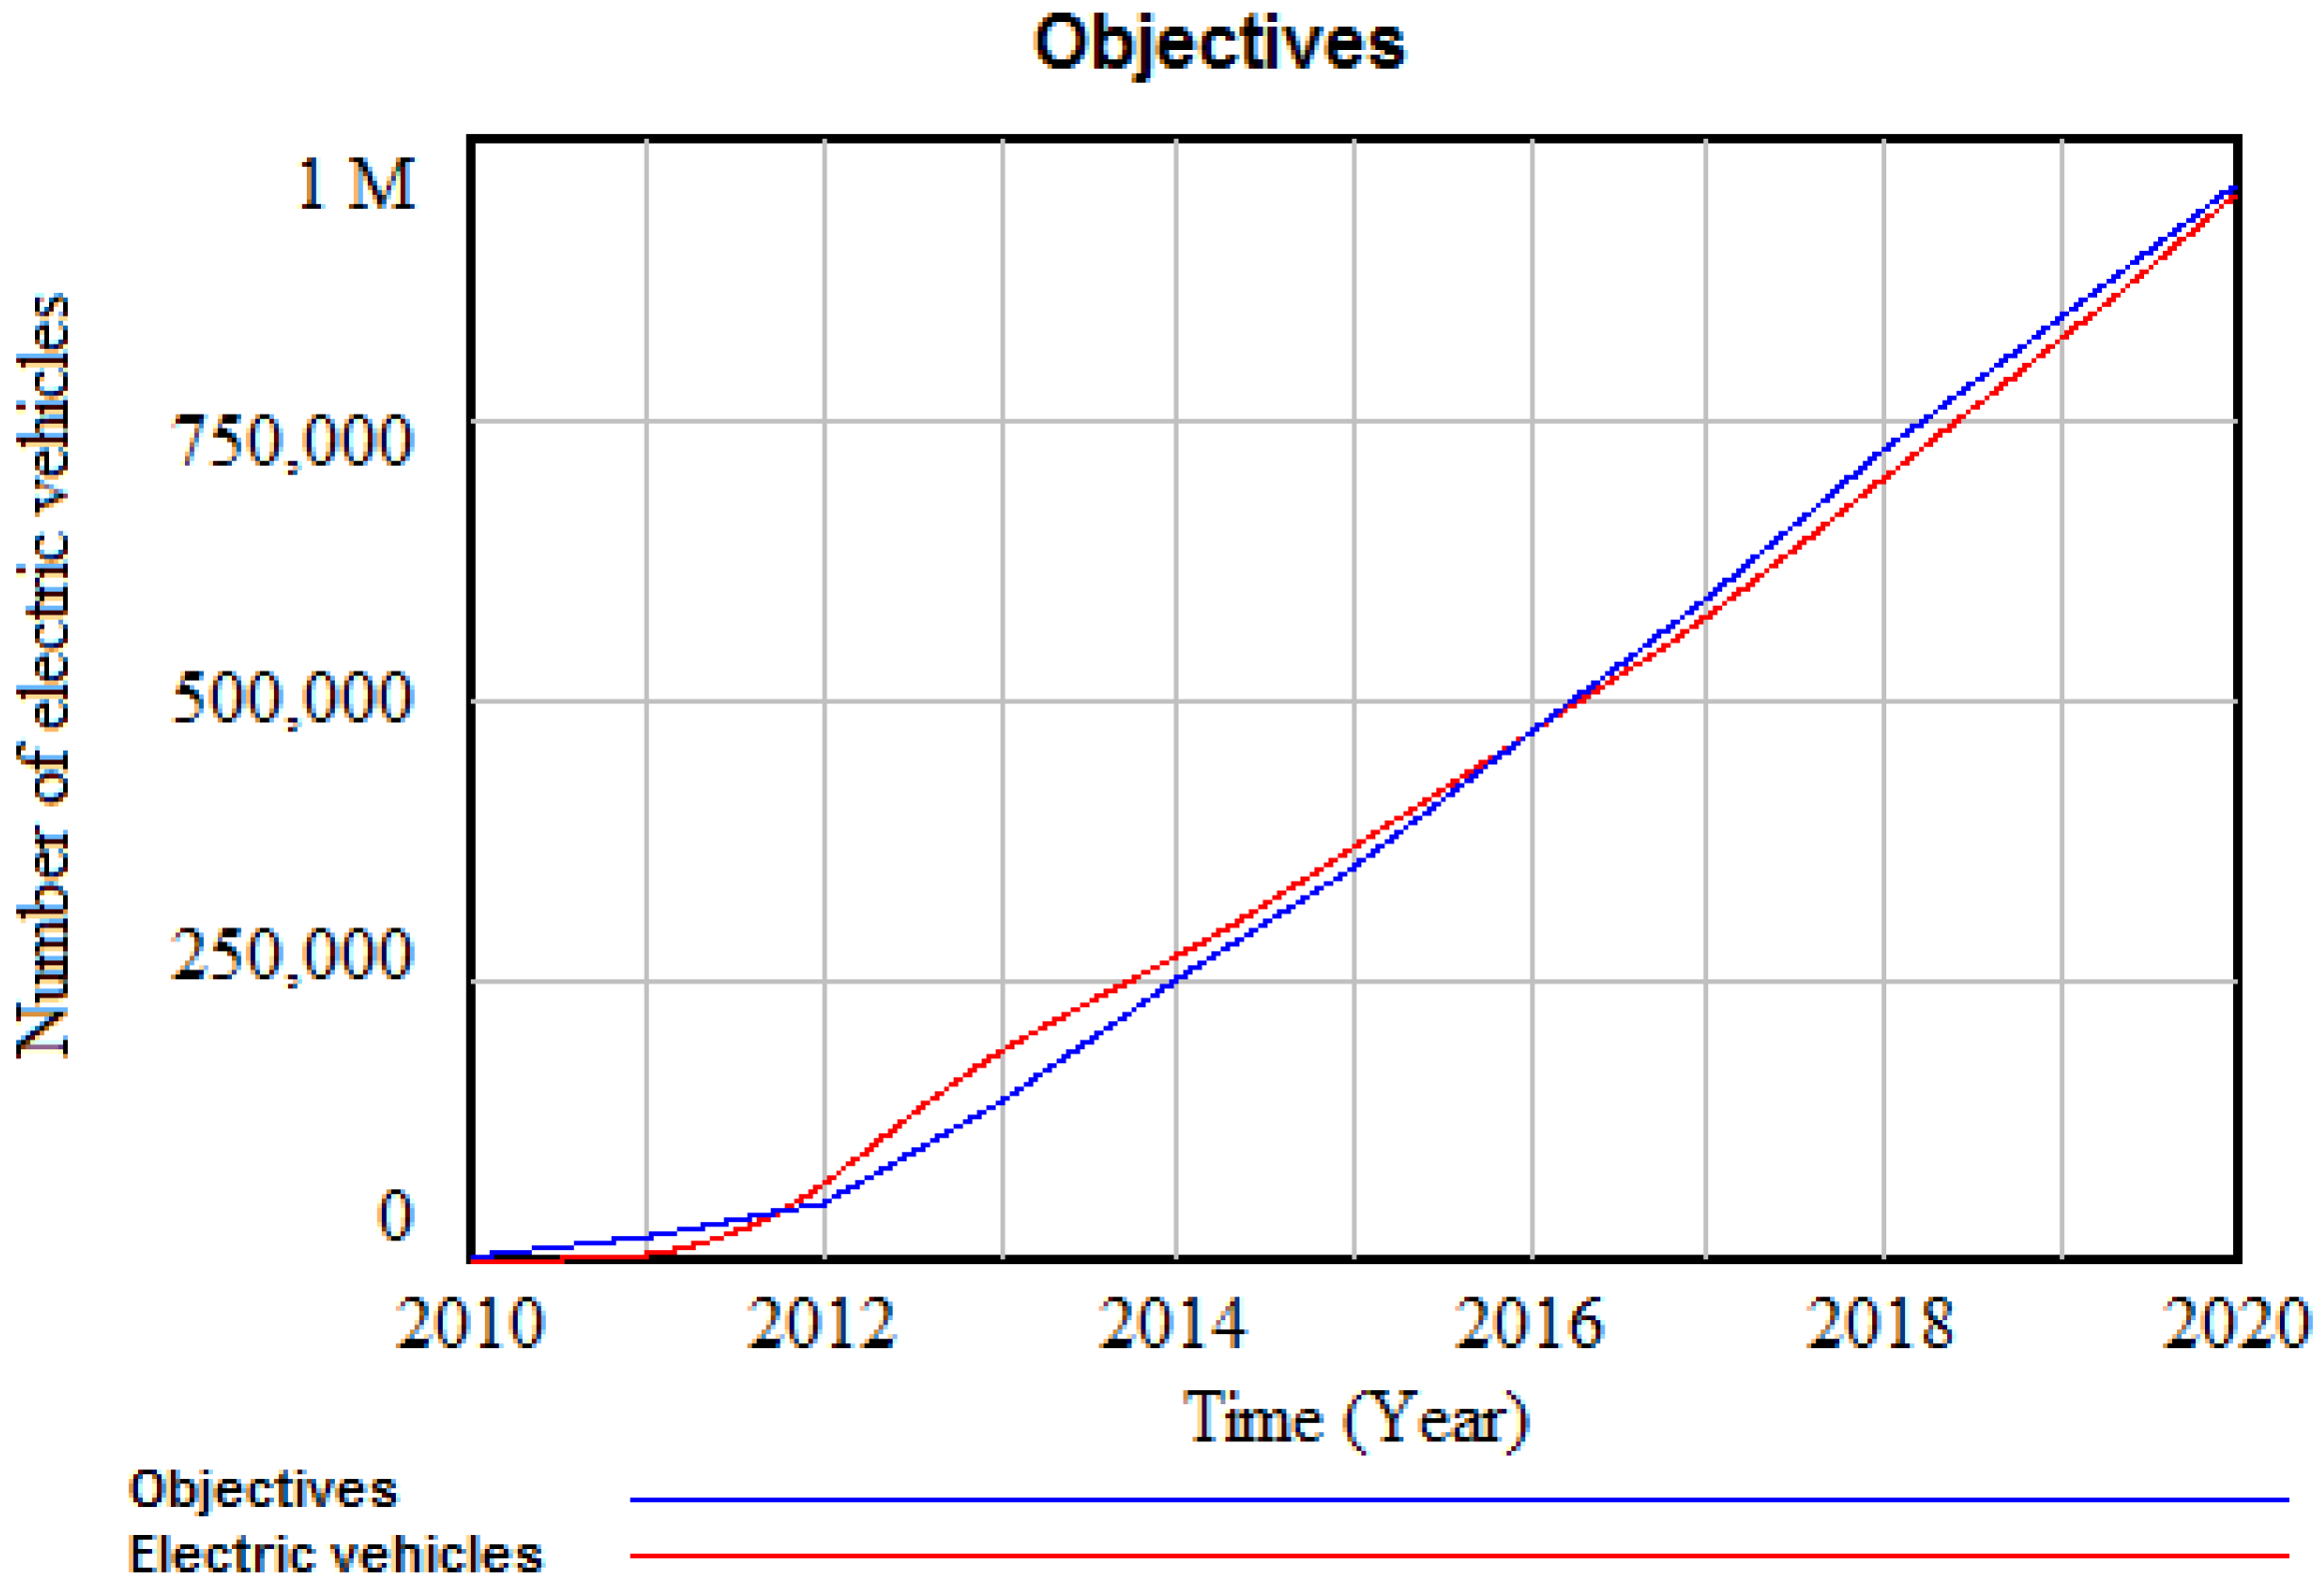
Figure 14 shows the optimistic scenario of reducing the cost of the battery in relation to government objectives.
Figure 14.
Electric vehicle fleet compared to the Government target for the optimistic scenario without subsidies in 2013 (the authors’ calculations).
Figure 14.
Electric vehicle fleet compared to the Government target for the optimistic scenario without subsidies in 2013 (the authors’ calculations).
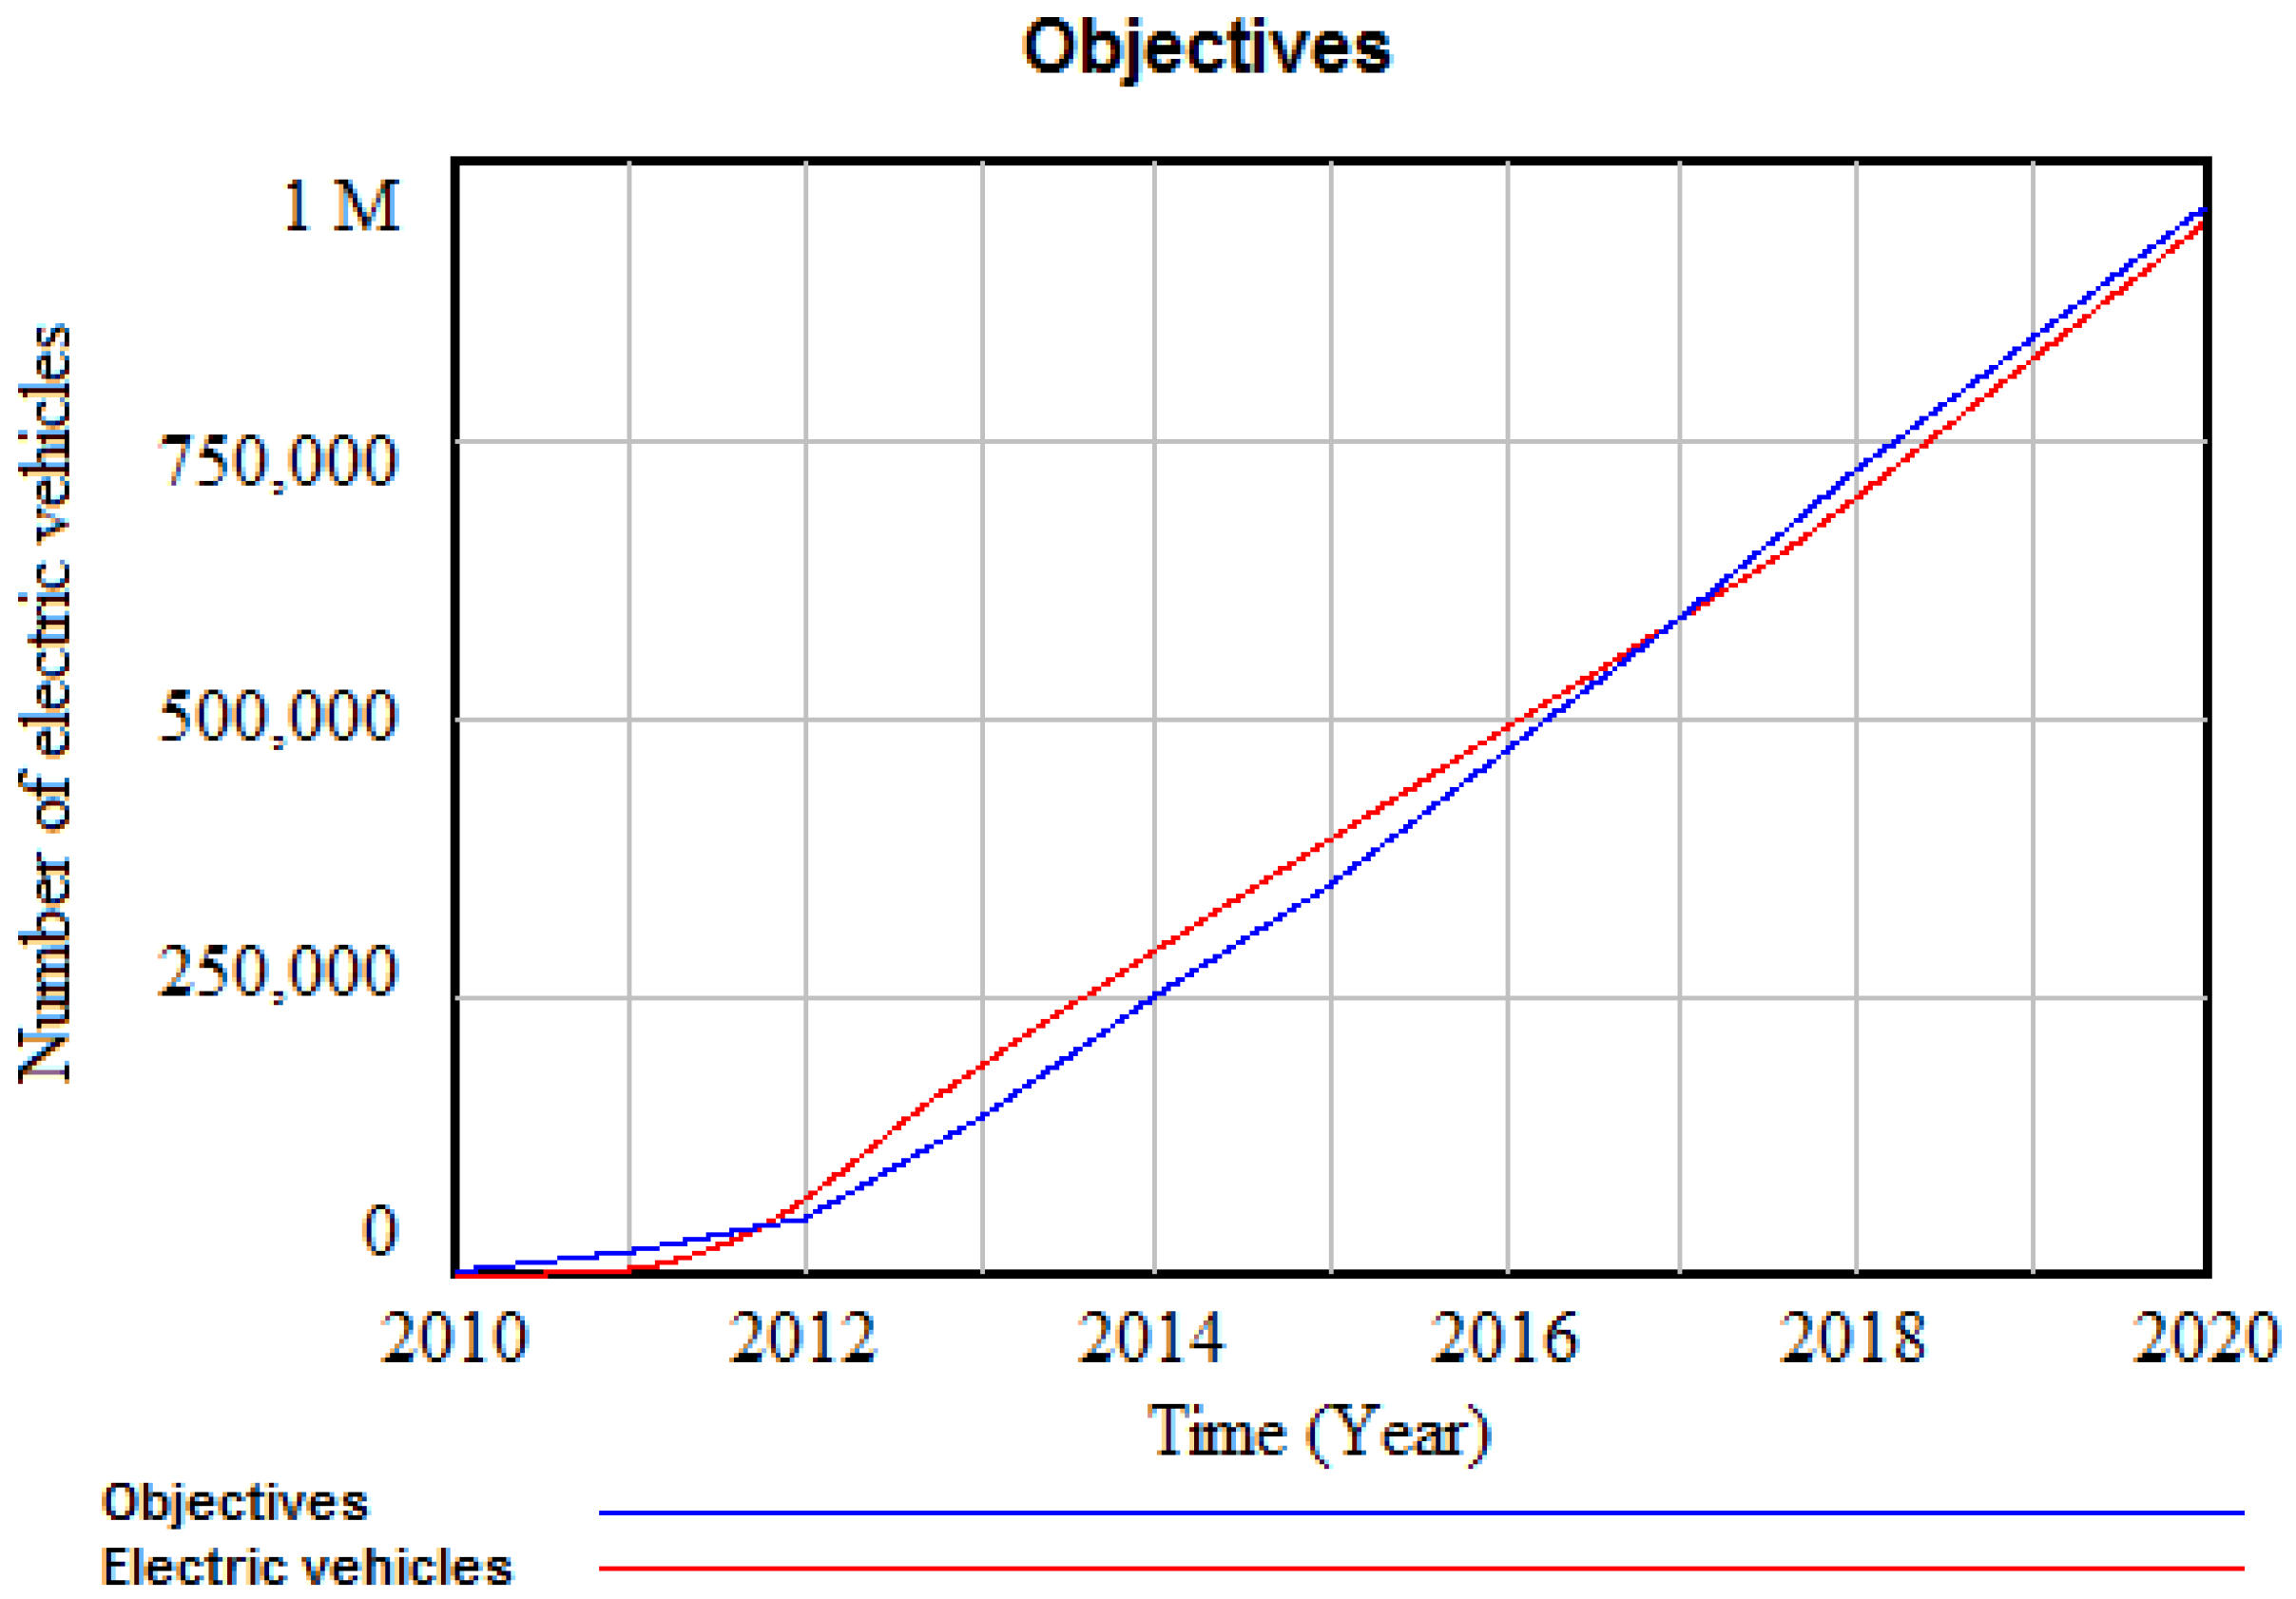
If we keep the subsidies of 7,000 € constant in time for the optimistic scenario, the following results are obtained (
Figure 15).
Figure 15.
Electric vehicle fleet compared to the Government target for the optimistic scenario with subsidies until 2020 (the authors’ calculations).
Figure 15.
Electric vehicle fleet compared to the Government target for the optimistic scenario with subsidies until 2020 (the authors’ calculations).
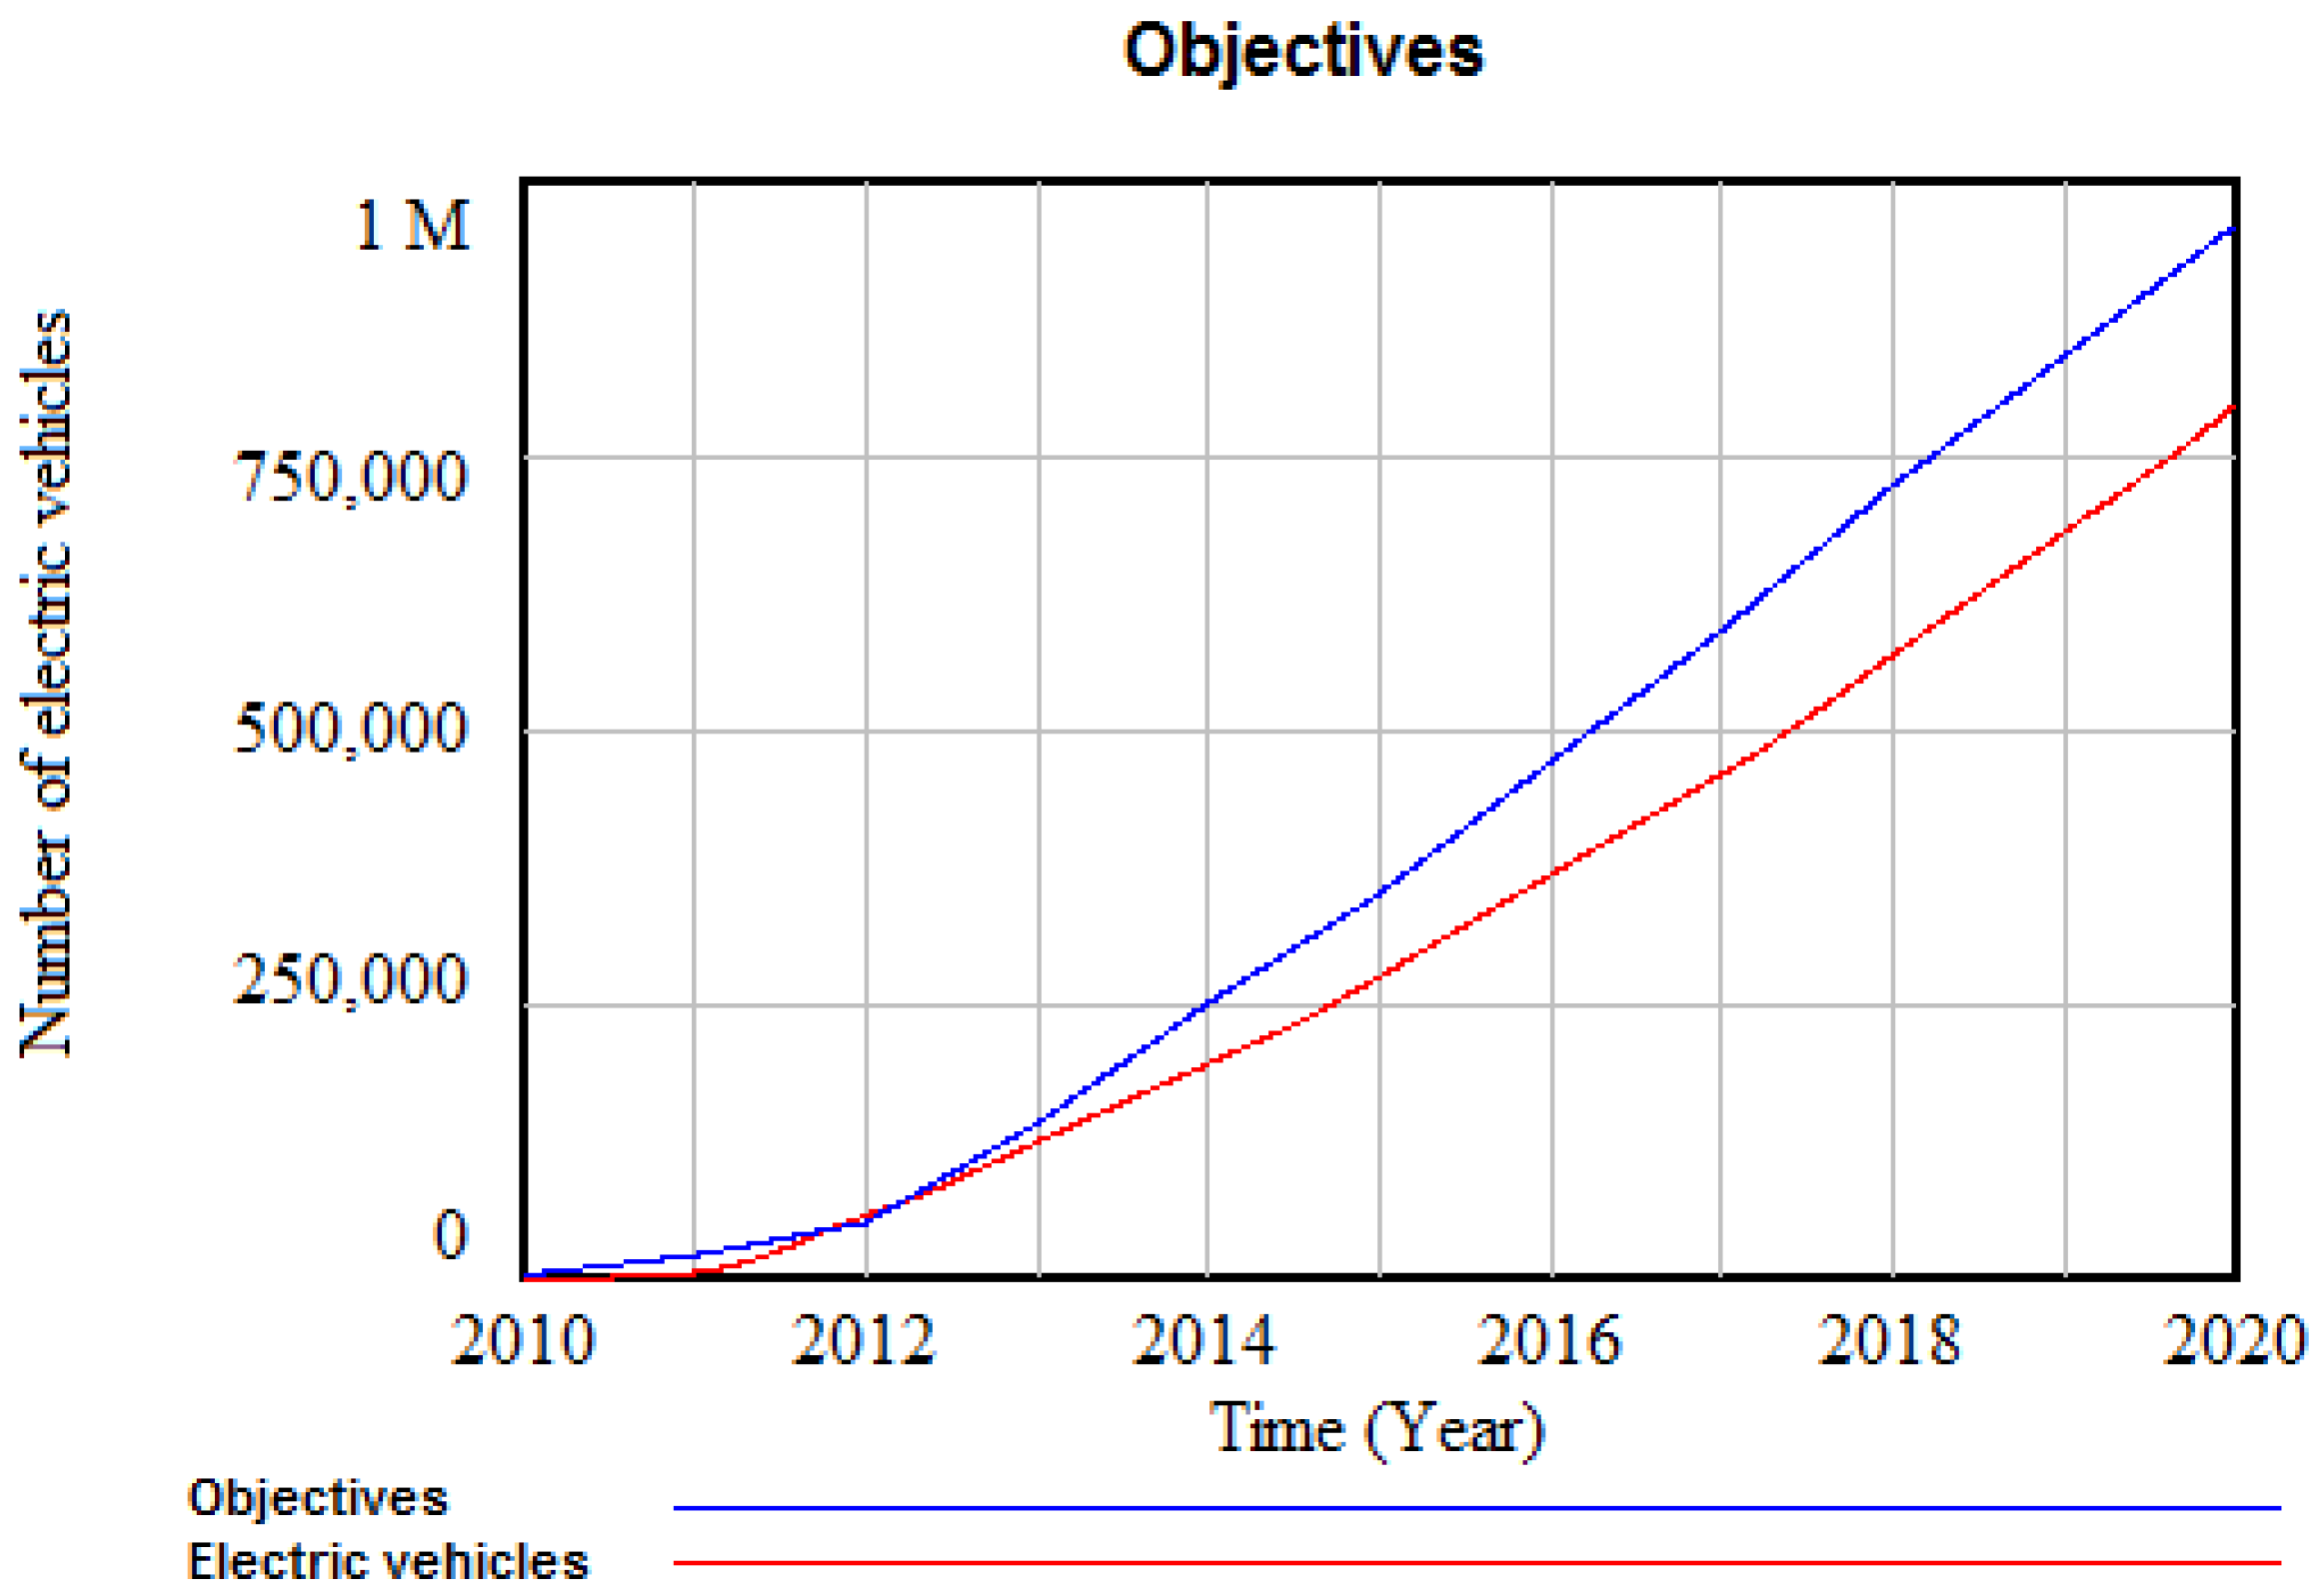
In this case, the results are well above the targets set, but at an exorbitant cost (close to 14,000 million Euros). By performing various simulations, we can determine that in the optimistic scenario of reducing the cost of the battery, with a subsidy value of 2,000 € from 2012, the government achieves the objectives until at least 2016, and there is a slight difference in subsequent years, only converging after 2020.
Figure 16.
Electric vehicle fleet compared to the Government target for the optimistic scenario with optimal subsidies until 2020 (the authors’ calculations).
Figure 16.
Electric vehicle fleet compared to the Government target for the optimistic scenario with optimal subsidies until 2020 (the authors’ calculations).
For 2,000 € of subsidy, the total government expenditure will be slightly in excess of 3,000 million Euros, which is a value quite consistent with the current government budget (remember that, for the years 2011 and 2012, the budget was 240 million Euros) (
Figure 17).
Figure 17.
Electric vehicle fleet compared to the Government target for the pessimistic scenario without subsidies until 2020 (the authors’ calculations).
Figure 17.
Electric vehicle fleet compared to the Government target for the pessimistic scenario without subsidies until 2020 (the authors’ calculations).
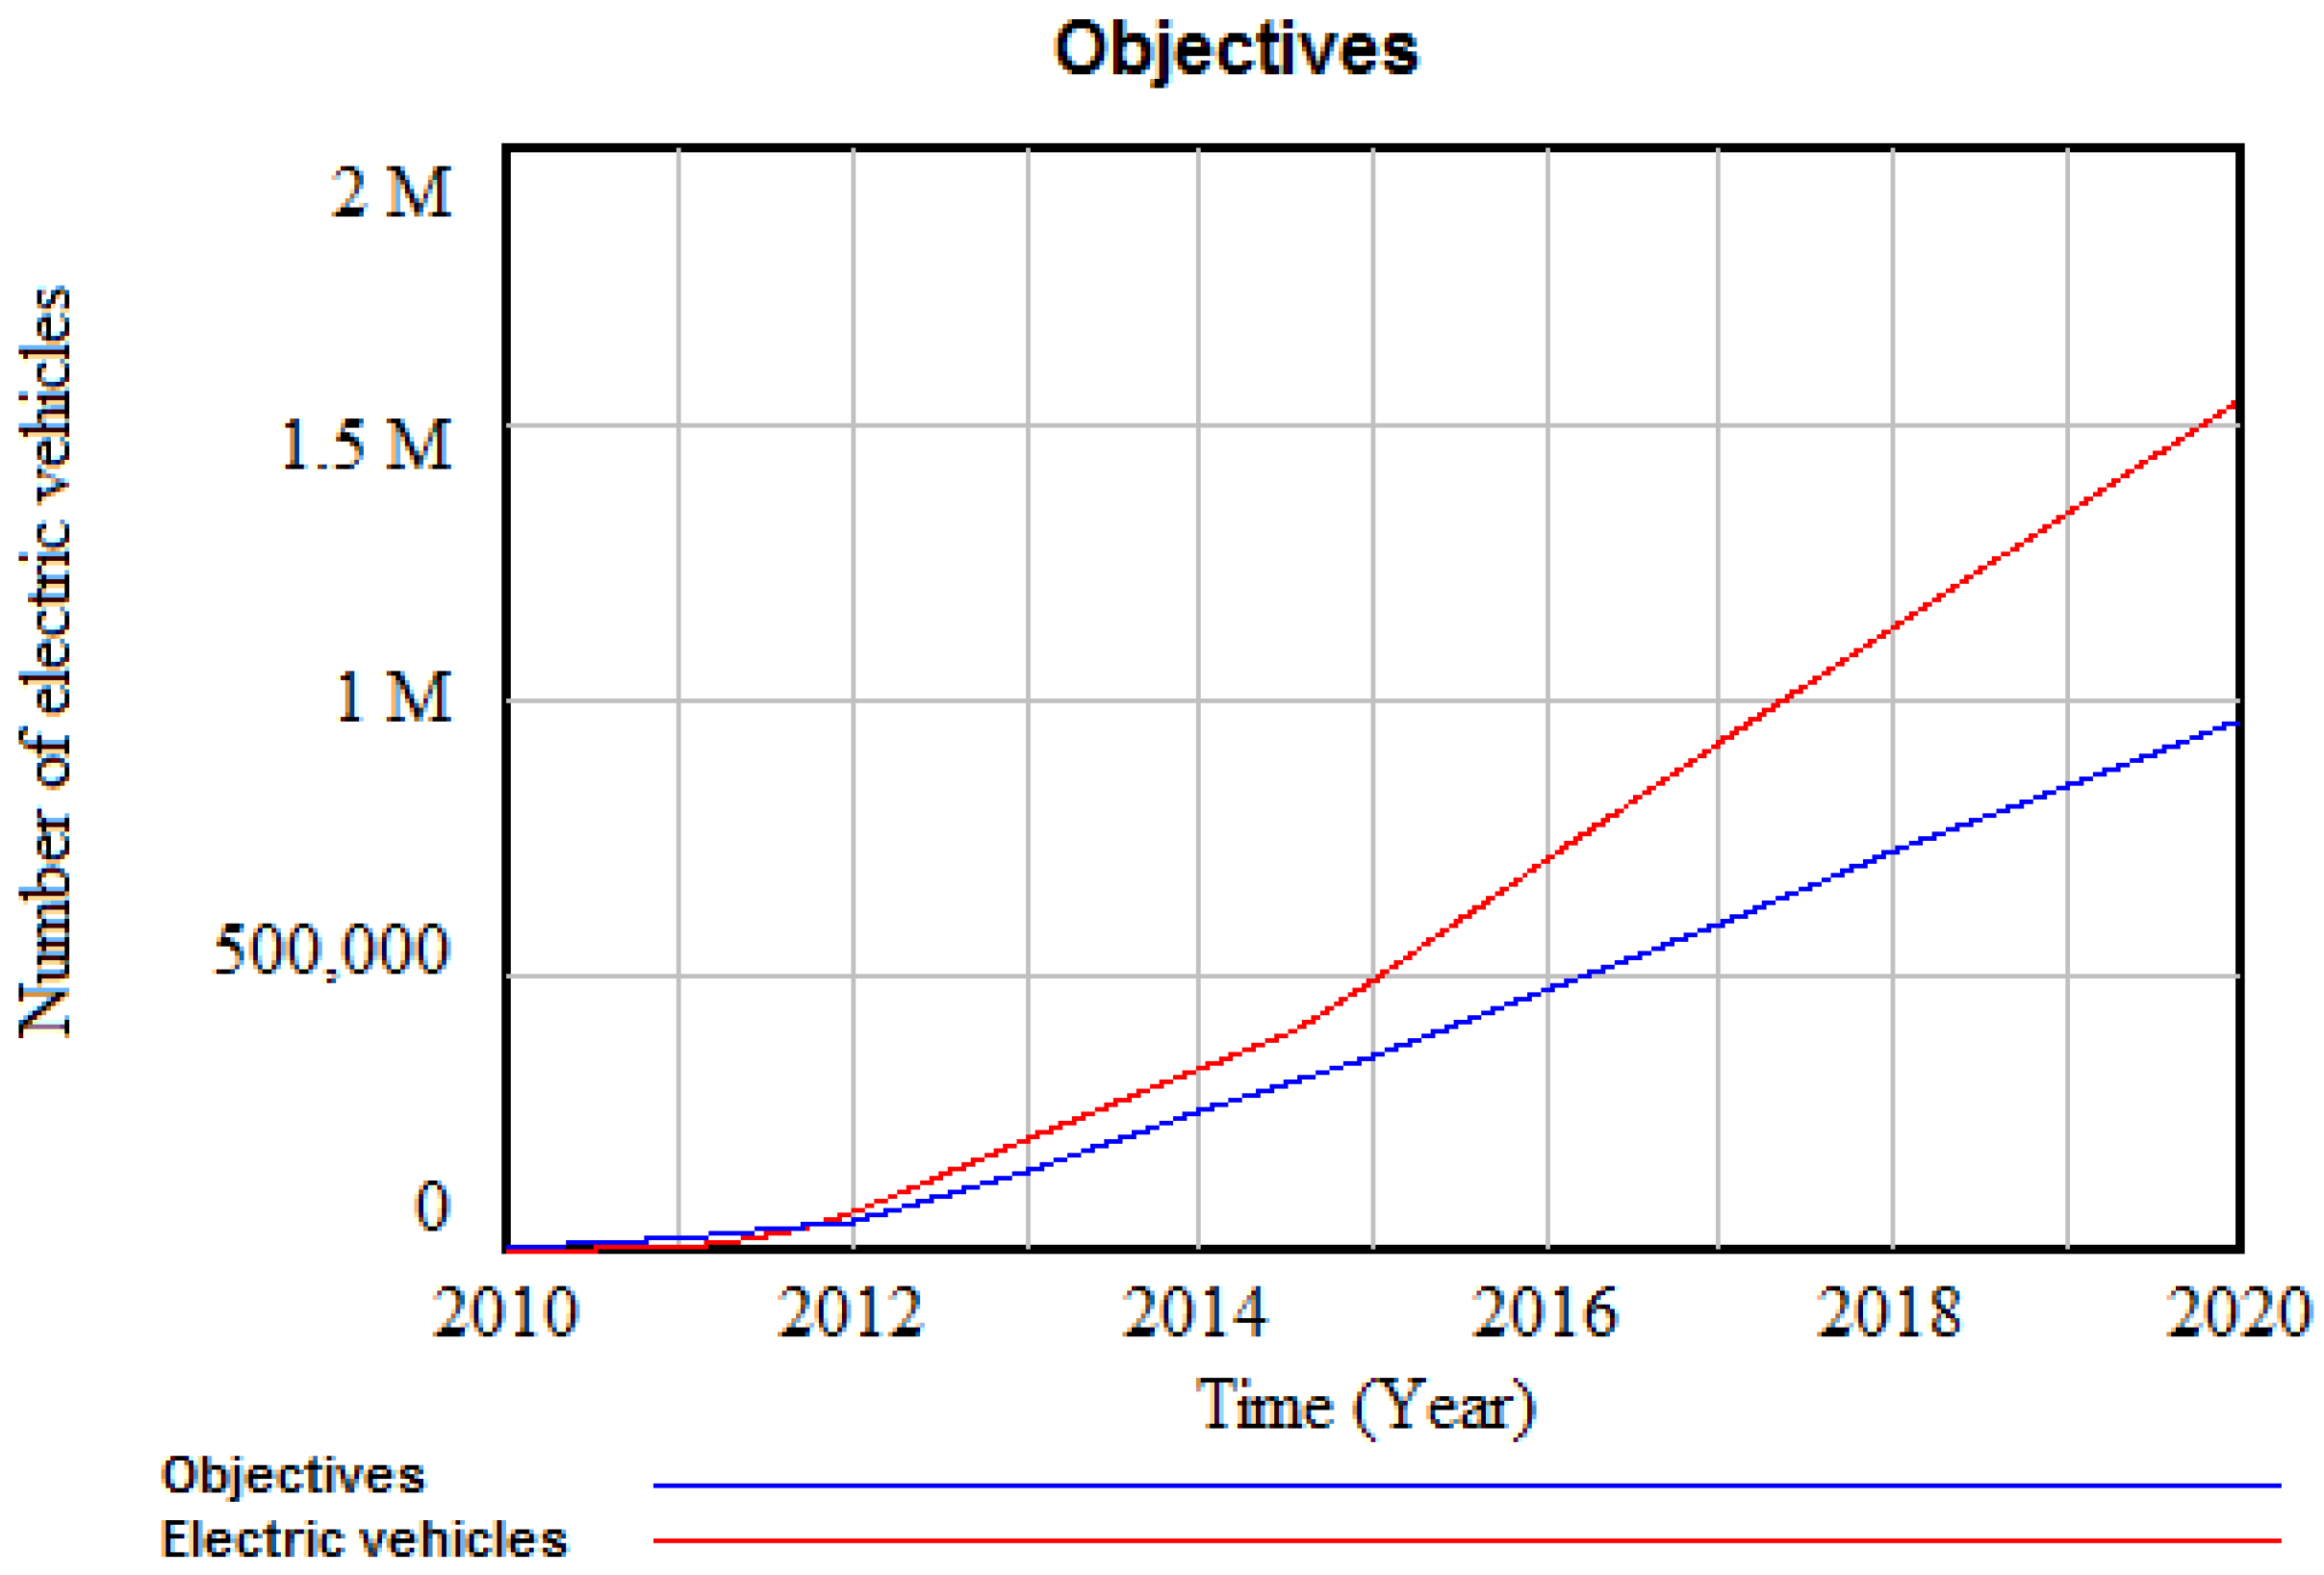
The case of the pessimistic scenario is quite different from the optimistic one, given the value of the subsidies necessary to achieve the objectives. When using the estimated value of 2,000 € for the optimistic scenario, we find that the goal is met until 2014, but as the battery capacity increases over time, demand for electric vehicles will decrease, since they will lose competitiveness against conventional vehicles, due to high additional costs. In this case, the optimal value of the subsidies, after making several simulations, were obtained for values between 4,500 € and 5,000 €, implying a cost to the government of nearly 6,000 million Euros (
Figure 18).
Figure 18.
Electric vehicle fleet compared to the Government target for the pessimistic scenario with the optimal subsidies until 2020 (the authors’ calculations).
Figure 18.
Electric vehicle fleet compared to the Government target for the pessimistic scenario with the optimal subsidies until 2020 (the authors’ calculations).
In view of the results, which can be determined taking into account the decrease in the cost of the kWh battery that will exist in coming years, the value of the subsidies to be given for the purchase of electric vehicles will range from 2,000 € in the optimistic case and up to 5,000 € in the pessimistic case.


