1. Background
China has experienced rapid urbanization during the last two decades. Since 2002, the urbanization rate has been 1% to 1.2% annually, and the number of cities has increased from 193 to 661 over the last three decades. At the end of 2006, China had 577 million people living in urban areas, which accounted for 44% of its total population [
1]. It is predicted that the Chinese urban population will reach 1.12 billion between 2025 and 2030, thereby accounting for 70% of the country’s total population [
2]. With the brisk urbanization, the demand for mobility and motorization has increased dramatically. Shanghai, where the total trips increased from 28.3 million person-trips per day in 1995 to 41 million in 2004, the travel intensity increased from 1.97 trips per day per person in 1995 to 2.36 in 2004, and the average travel distance increased from 4.5 km per trip in 1995 to 6.9 km in 2004, provides an example of this trend. More significantly, the total car trips increased from 1.5 million per day in 1995 to 5 million in 2004 [
3]. Along with the increase in travel, the structure of transportation modes has also changed. Taking Shanghai as an example again, from 1986 to 2004 the share of non-motorized transportation (NMT), which includes mainly biking and walking, decreased from 72.0% to 59.8%, while private car use increased from less than 3% to 16.5% [
3]. In Beijing, the city with the largest vehicle population in China, the mode share of private cars increased from 5% in 1986 to 23.2% in 2000 and to 29.8% in 2005 [
4].
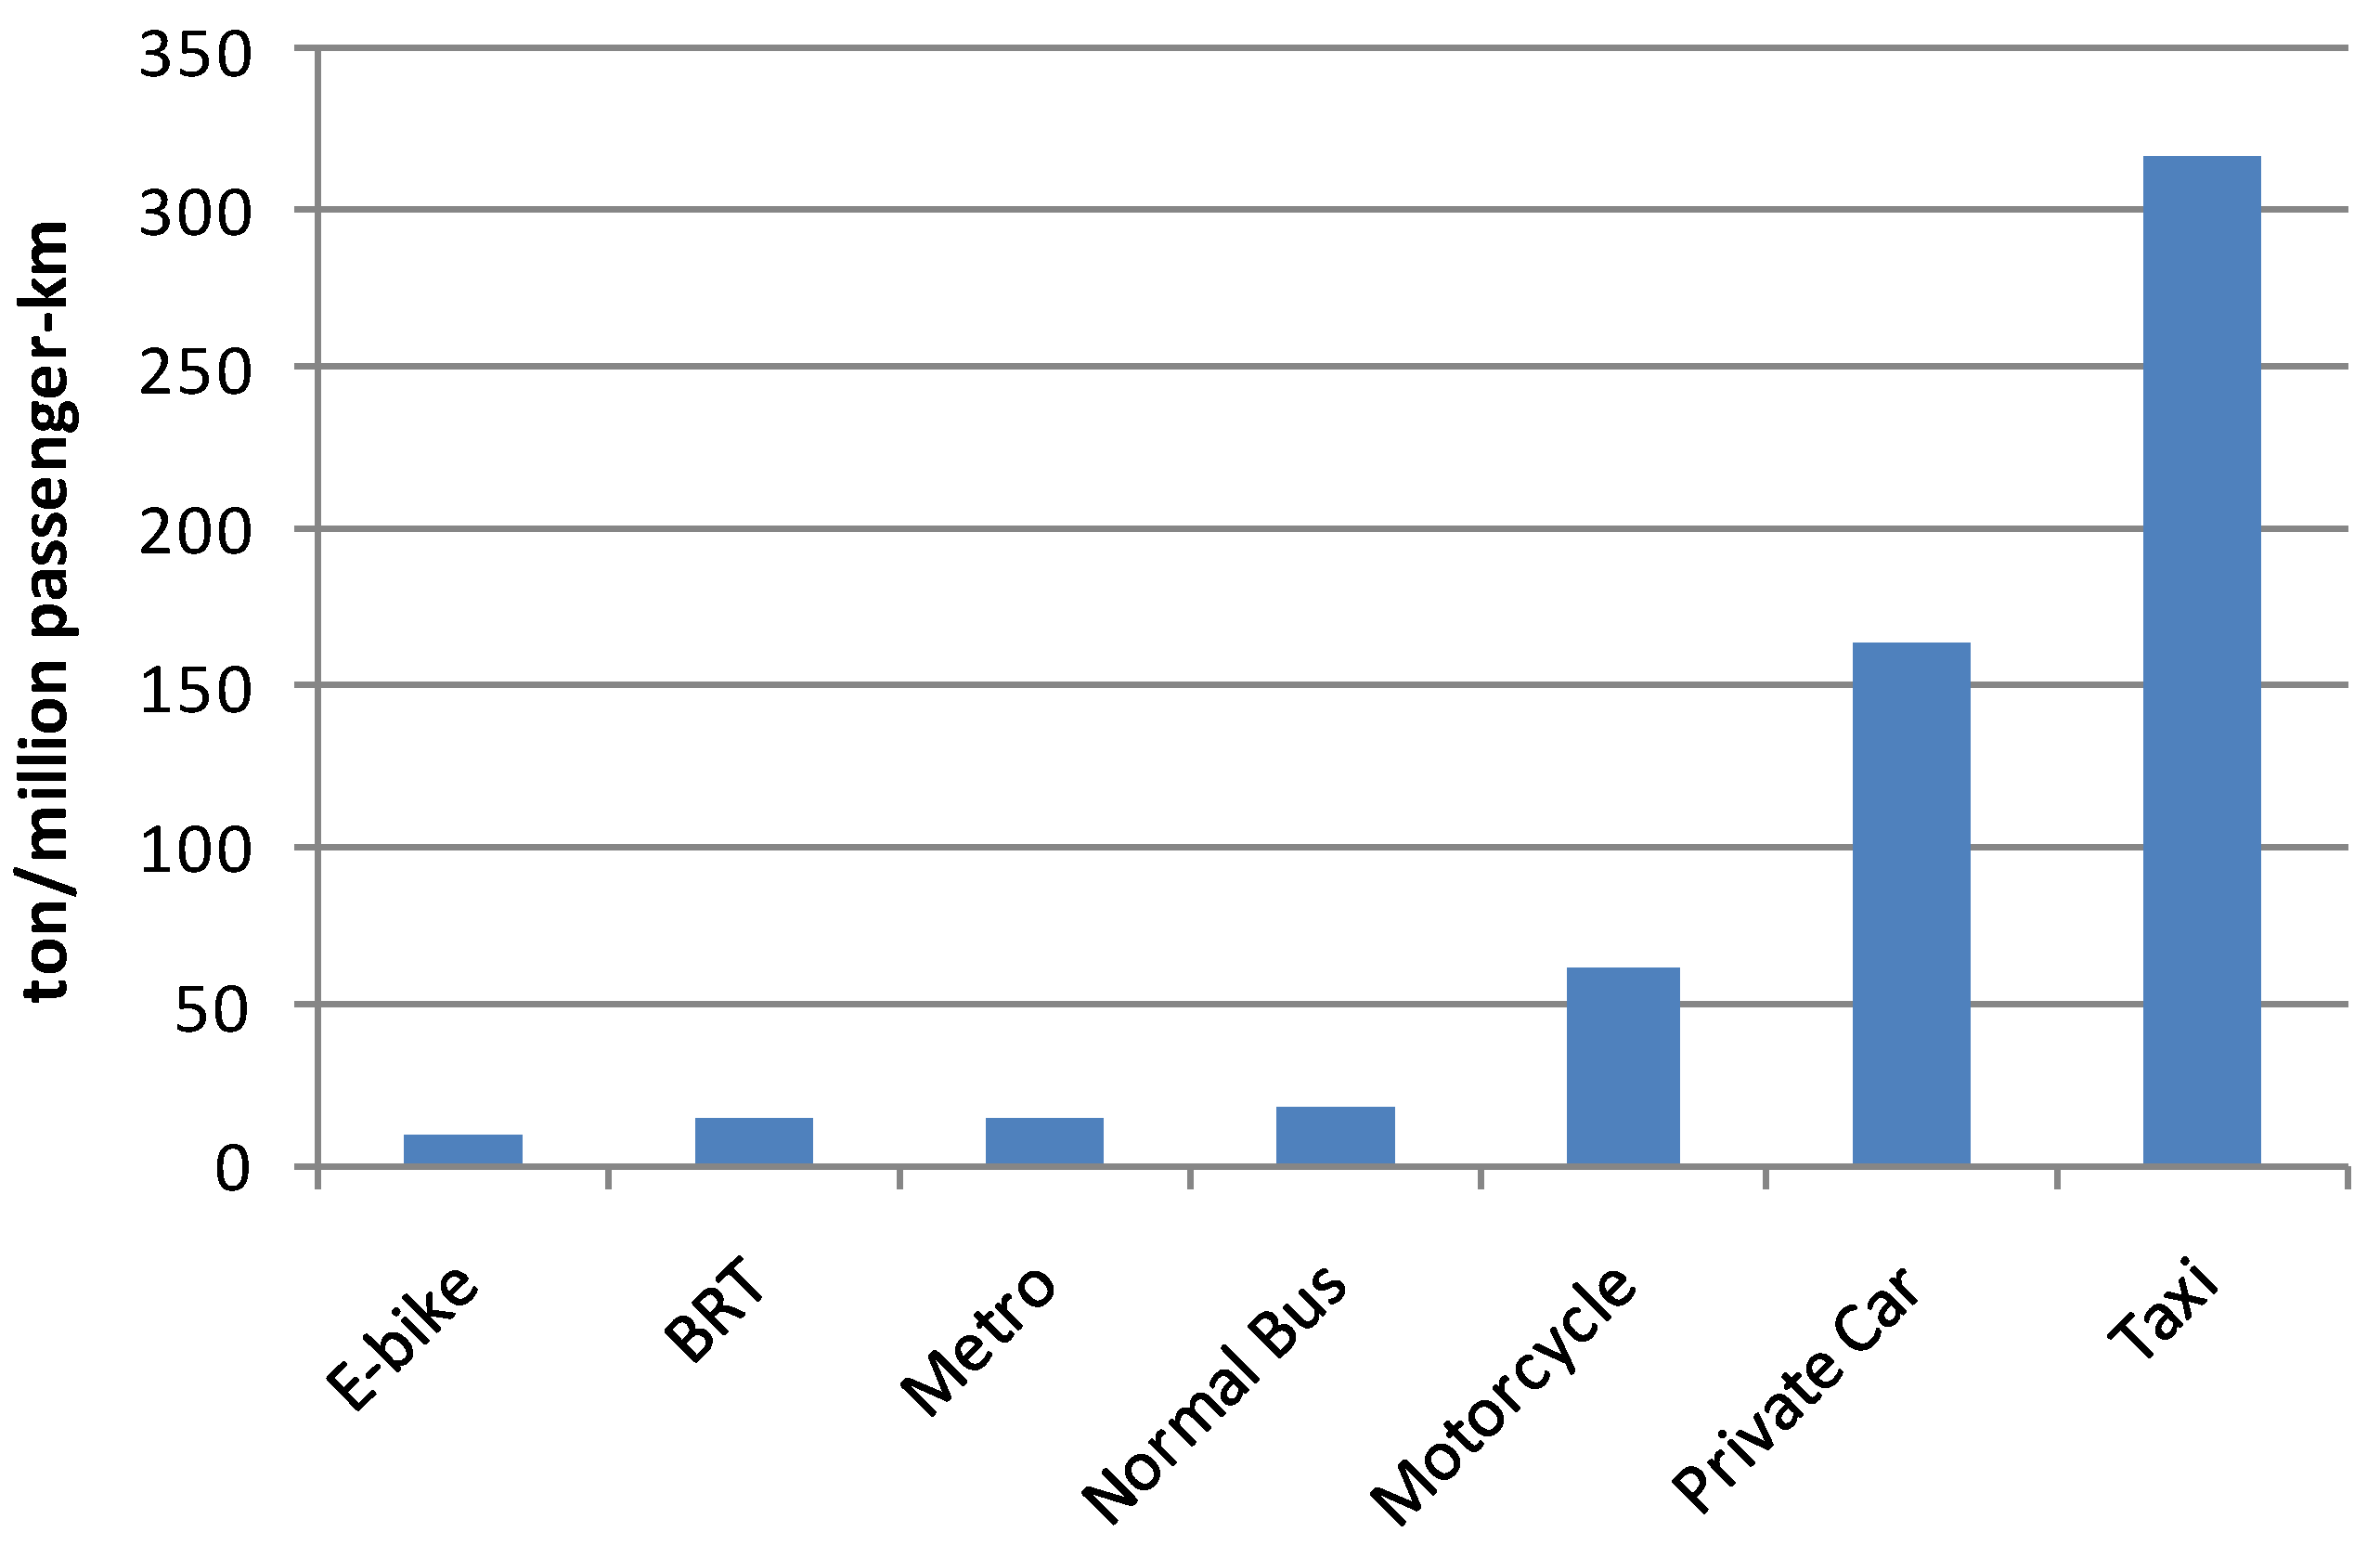
Two main approaches facilitate the reduction of carbon emissions from the urban transportation sector: producing improvements in vehicle technology and shifting the urban transport modes to public transit and NMT. While the estimation of energy and emission effects derived from improved vehicle technology is straightforward, the estimation for the latter is more complicated, and the impacts are more difficult to identify. Lee
et al. have calculated that, in European countries, an efficient bus could replace 5–50 cars in terms of energy use and land occupancy [
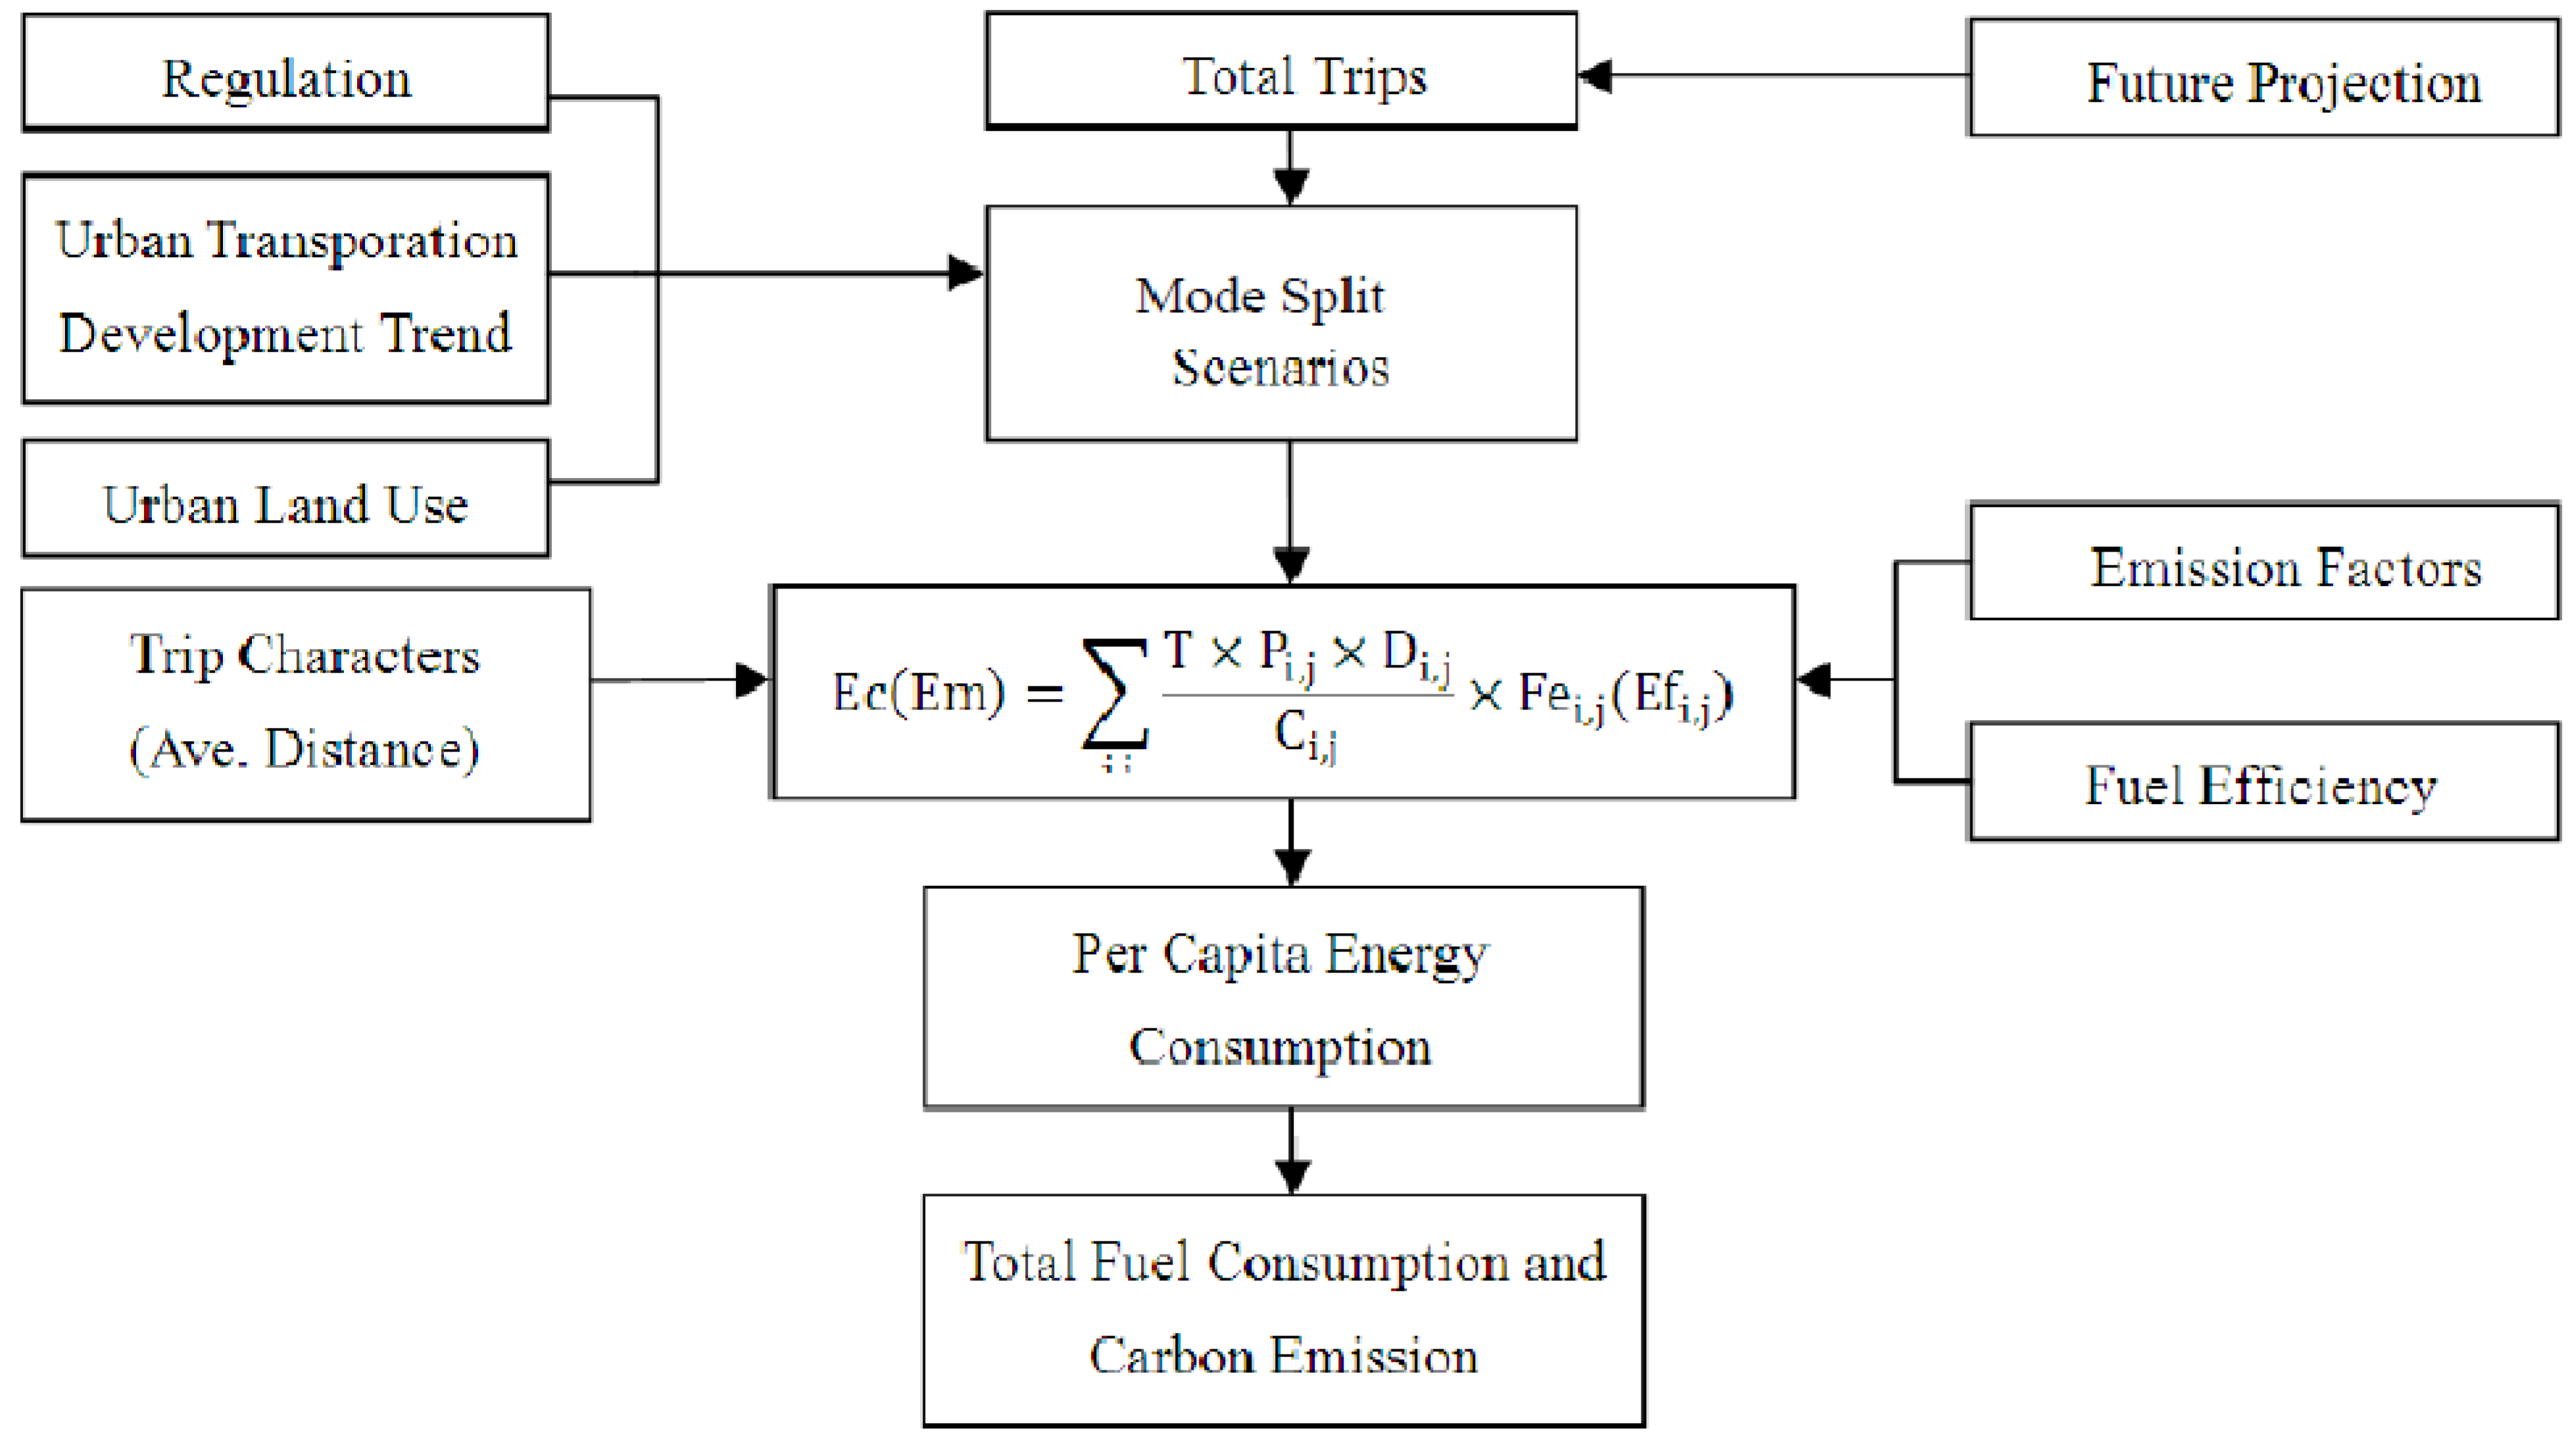
5]. Wright and Fulton have developed a methodology that calculates the carbon emissions as the product of vehicle population, average travel distance, and fuel efficiency standards. They have applied this methodology for the bus rapid transit (BRT) system in Bogota, with the assumption that the private transportation mode remains stable [
6]. Another way to address this issue is to use the Long-range Energy Alternatives Planning (LEAP) methodology to project vehicle mileage and carbon emissions. With the LEAP model, Chen
et al. have predicted carbon emissions in Shanghai in 2020 and have recommend policy solutions to transportation energy problems [
7]. In addition, R.K. Bose and the Institute of Global Environmental Strategy (IGES) have taken similar approaches to study the carbon impacts from mode splits in Dehli, India and Katmandu, Nepal, respectively [
8]. Finally, other researchers have relied on linear planning measures for transportation structure optimization. Lu and Shen have used the concept of environmental capacity to optimize the transportation structure for Beijing [
9,
10].
The above-mentioned approaches present challenges. First, little data are available in developing countries, so most of the studies have used general data from developed countries. As a consequence, the findings are not city- or country-specific. Second, also because of limited data, some simplistic assumptions have been made during the studies; for example, many parameters were assumed to be constant over time. Third, it is difficult to link the results to specific policy implications because: (a) the analyses are not local-specific, and (b) the scenarios are defined in a general way. Since transportation energy consumption is one of the greatest contributors to carbon emissions, it is critical to quantify the impacts in order to guide city policies toward reducing the carbon emissions from urban transportation.
The purpose of this study was to establish a methodology to analyze carbon emissions from the urban transportation sector at the city level. The key technical contents include collecting data and surveying upon the local availability, calculating measures to be refined for adaption to local situations, and linking with the policy developments. It should be noticed that we try to utilize as much as of the available data from various sources and purposes. The sizes of the data set we collected do not necessarily match the need of our study. We have selected Jinan as the case study for this analysis. Jinan, the capital city of Shandong Province, China, has a population of 6.0 million within its metropolitan area. The total area of the Jinan metropolitan area is about 8100 square km, and the urban area is 3257 square km. According to the urban development plan for Jinan (Jinan City Master Plan, 2005–2020), the urban population is projected to increase from 3.4 million in 2004 to 4.5 million in 2020—and this is viewed as a very conservative projection. The rapid urbanization in Jinan is a reflection of the city growth in China. Therefore, the government views the development of a sound transit system as the key element for sustainable urbanization.
5. Conclusions
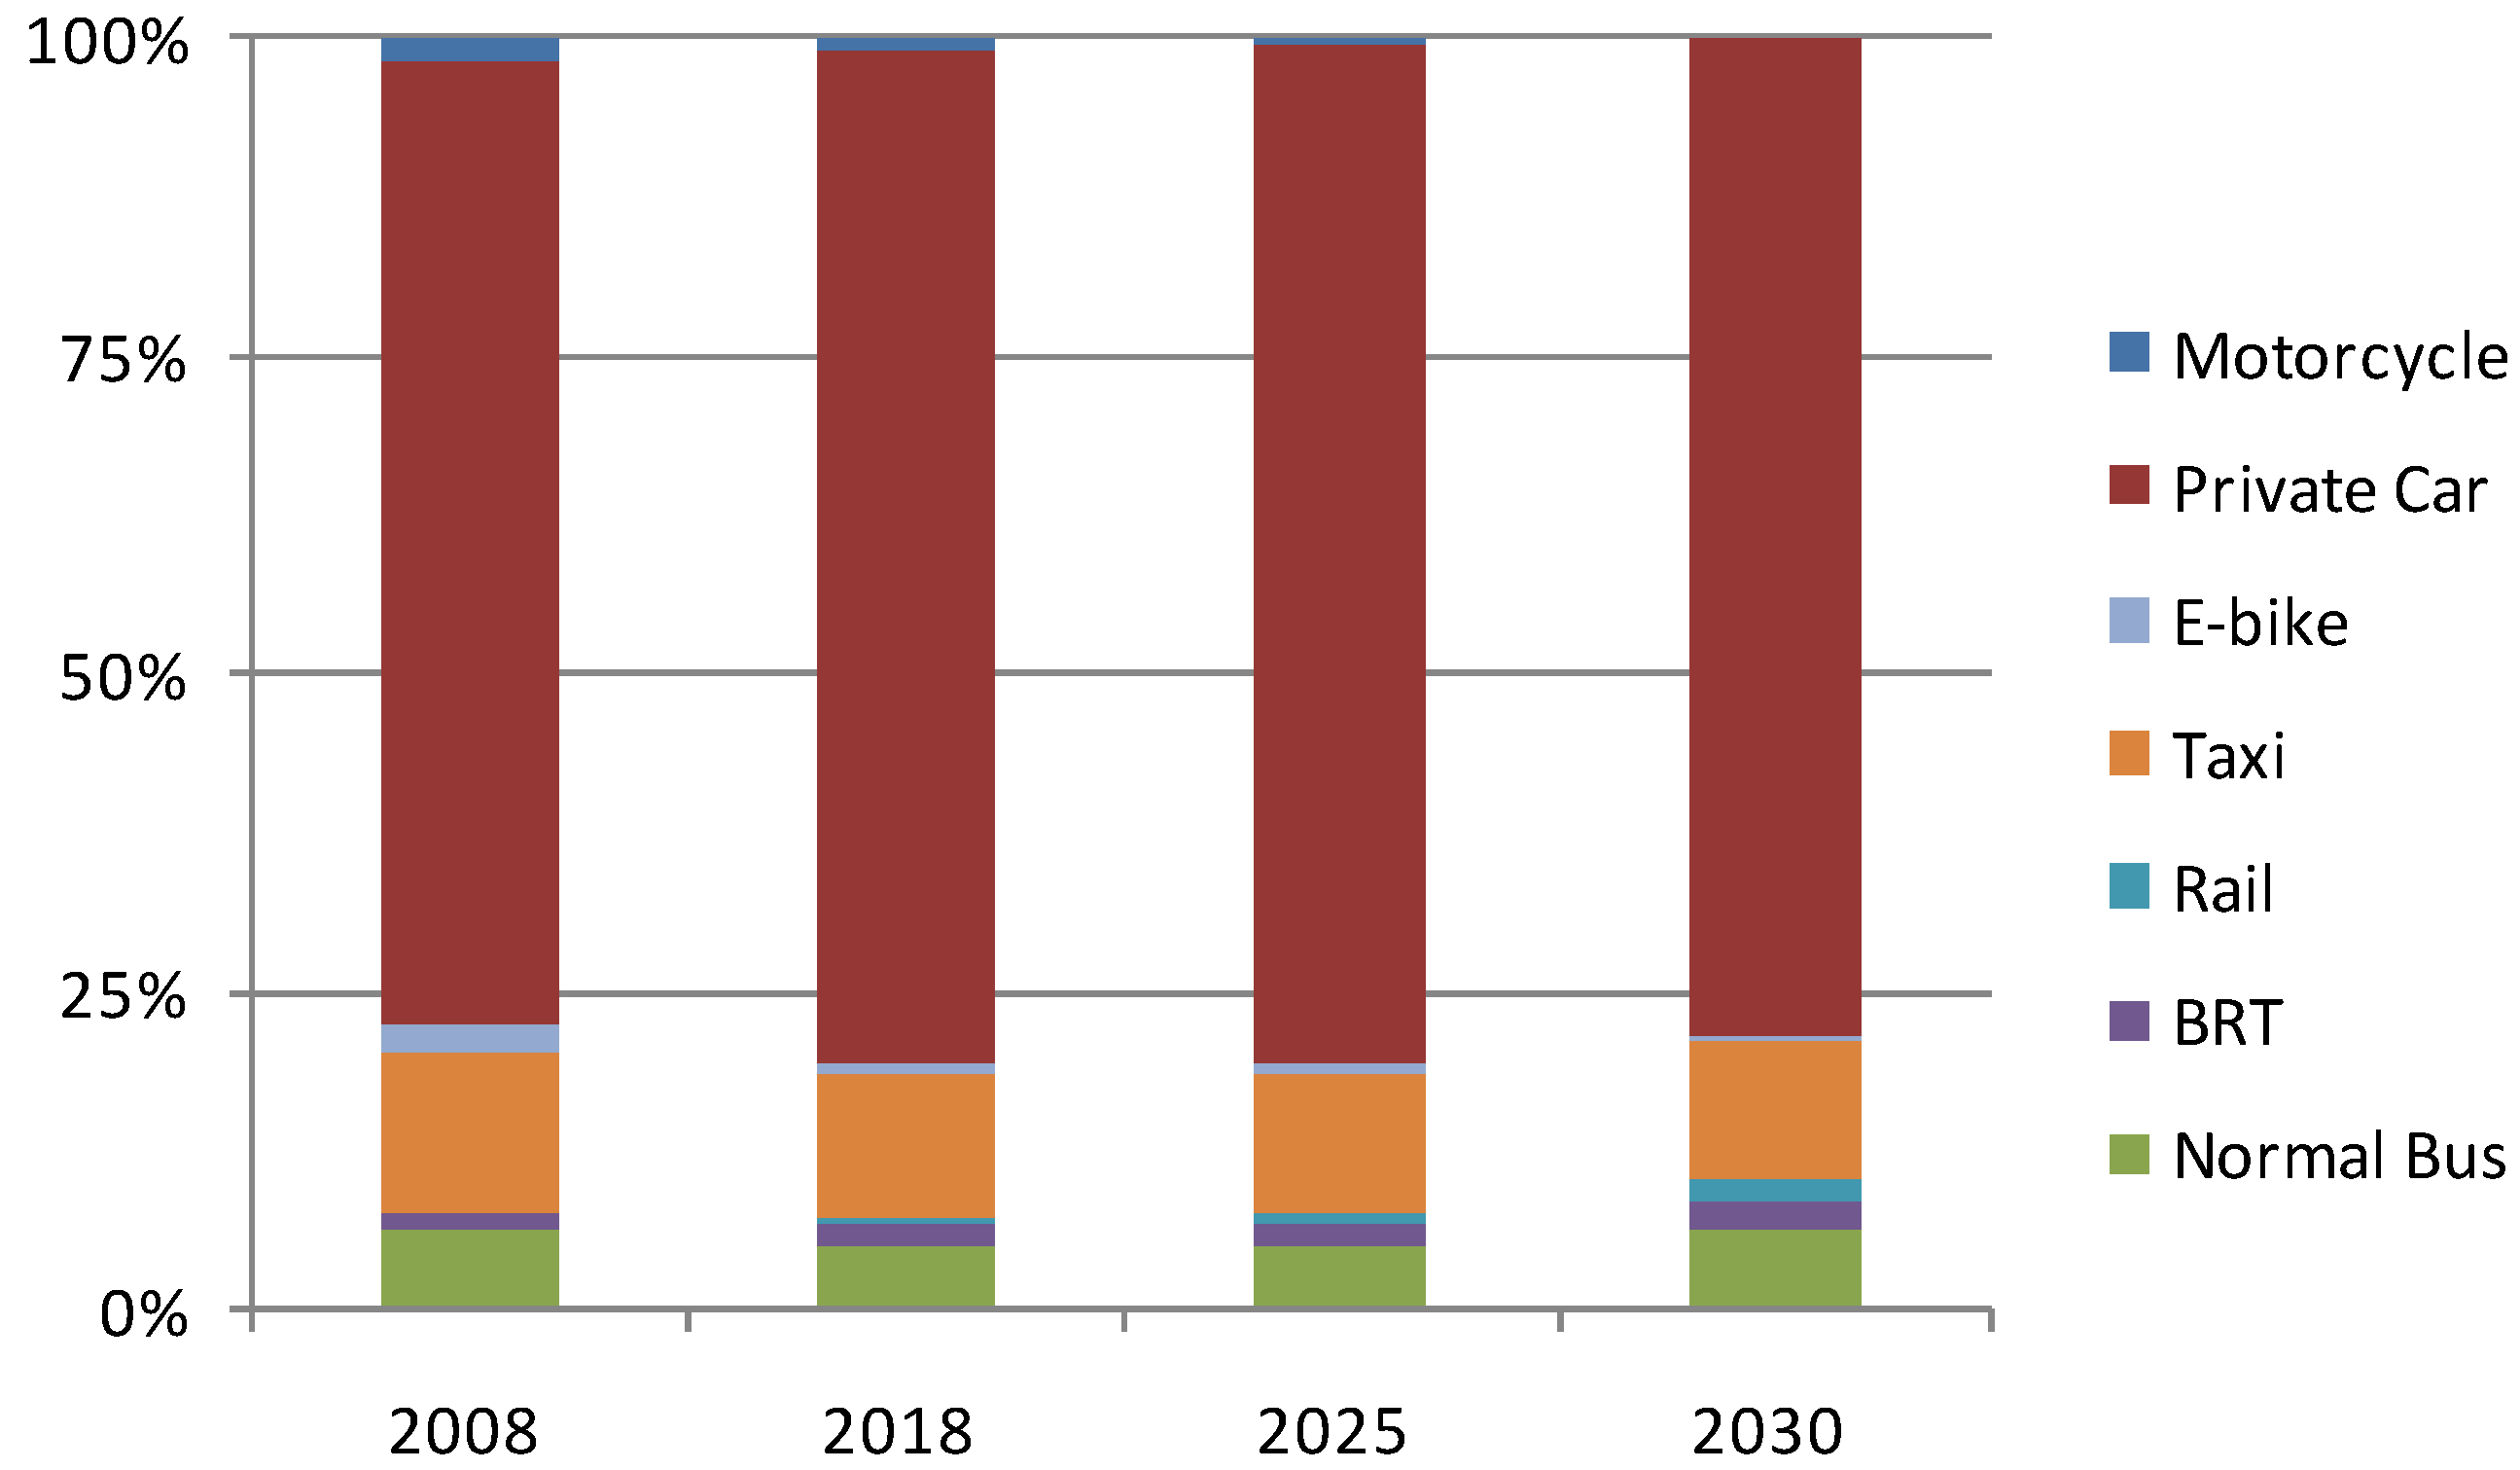
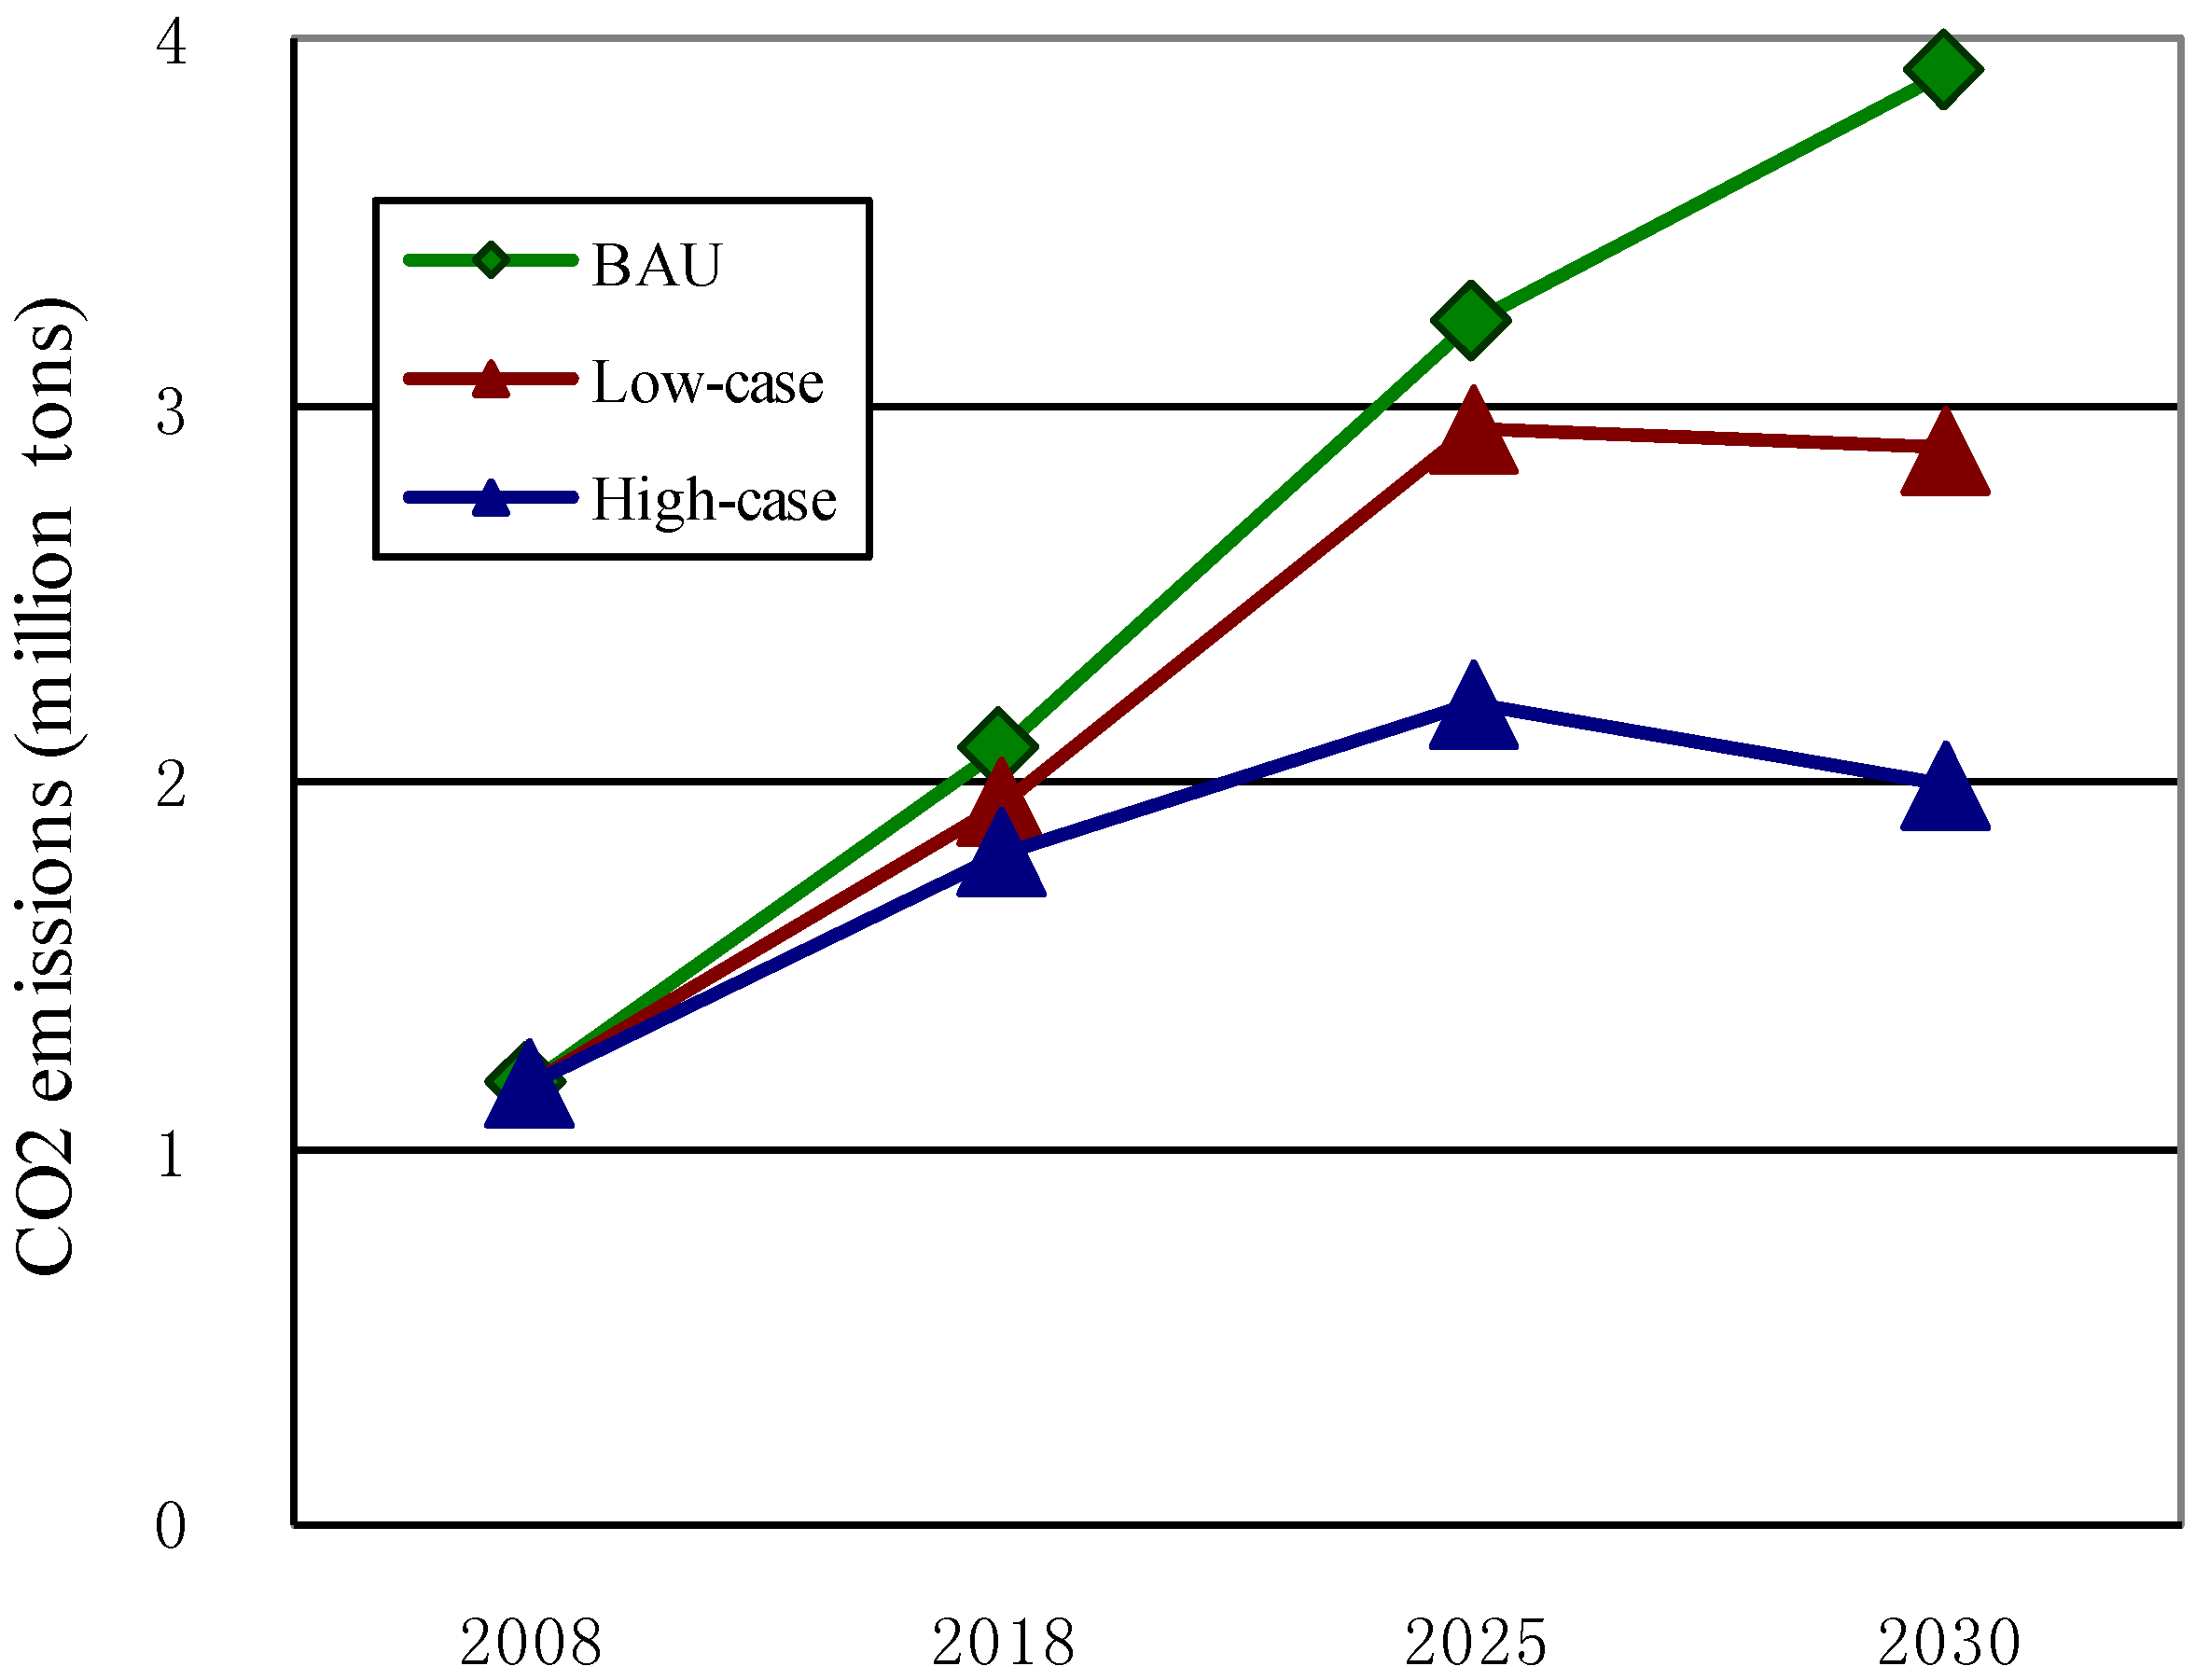
The purpose of this study was to establish a methodology to analyze carbon emissions from the urban transportation sector at the city level. This paper examines a modeling system to evaluate various urban transportation development scenarios by determining the energy use and CO2 emission impacts from various mode split scenarios. During this study, we identified several issues that require further investigation. These issues are summarized below.
A significant challenge for this type of study is the lack of statistics about Chinese cities. In this study, we used data from various sources with different measures for data collection and calibration. However, we realize that a gap exists between these available data and the real-world data. Therefore, for China we recommend that considerable efforts should be directed toward overcoming both capacity and institutional issues and establishing comprehensive databases for urban development and evaluation.
The method used in this study provides a simple means to analyze the changes in transportation behavior over time, especially during the rapid urbanization process in China. Additional studies are necessary to link urban patterns and urban development policies. The model in this study is static. Further studies should address the dynamics of urban development policies, economic development, and personal behaviors (especially travel behaviors).


