Embodiment Analysis for Greenhouse Gas Emissions by Chinese Economy Based on Global Thermodynamic Potentials

Abstract
:1. Introduction
2. Methodology and Data Sources
2.1. Global Thermodynamic Potentials

| Emission Type | Exergy Factors (kJ/g) | GTPs |
|---|---|---|
| Carbon dioxide (CO2) | 0.45 | 1 |
| Methane (CH4) | 51.98 | 115.51 |
| Nitrous oxide (N2O) | 2.40 | 5.33 |
2.2. Input-Output Analysis and Data Sources
| Code | Sector |
|---|---|
| 1 | Farming, Forestry, Animal Husbandry, Fishery and Water Conservancy (Agriculture) |
| 2 | Coal Mining and Dressing |
| 3 | Petroleum and Natural Gas Extraction |
| 4 | Ferrous and Nonferrous Metals Mining and Dressing |
| 5 | Nonmetal and Other Minerals Mining and Dressing |
| 6 | Food Processing, Food Production, Beverage Production, Tobacco Processing |
| 7 | Textile |
| 8 | Garments and Other Fiber Products, Leather, Furs, Down and Related Products |
| 9 | Timber Processing, Bamboo, Cane, Palm and Straw Products, Furniture Manufacturing |
| 10 | Papermaking and Paper Products, Printing and Record Medium Reproduction, Cultural, Educational and Sports Articles |
| 11 | Petroleum Processing and Coking, Gas Production and Supply |
| 12 | Raw Chemical Materials and Chemical Products, Medical and Pharmaceutical Products, Chemical Fiber, Rubber Products, Plastic Products (Chemical Products Related Industry) |
| 13 | Nonmetal Mineral Products |
| 14 | Smelting and Pressing of Ferrous and Nonferrous Metals |
| 15 | Metal Products |
| 16 | Ordinary Machinery, Equipment for Special Purpose |
| 17 | Transportation Equipment |
| 18 | Electric Equipment and Machinery |
| 19 | Electronic and Telecommunications Equipment |
| 20 | Instruments, Meters Cultural and Office Machinery |
| 21 | Other Industrial Activities |
| 22 | Electric Power/Steam and Hot Water Production and Supply |
| 23 | Construction |
| 24 | Transport, Storage, Postal and Telecommunications Services |
| 25 | Wholesale, Retail Trade, Hotels, Catering Service |
| 26 | Other Service Activities |
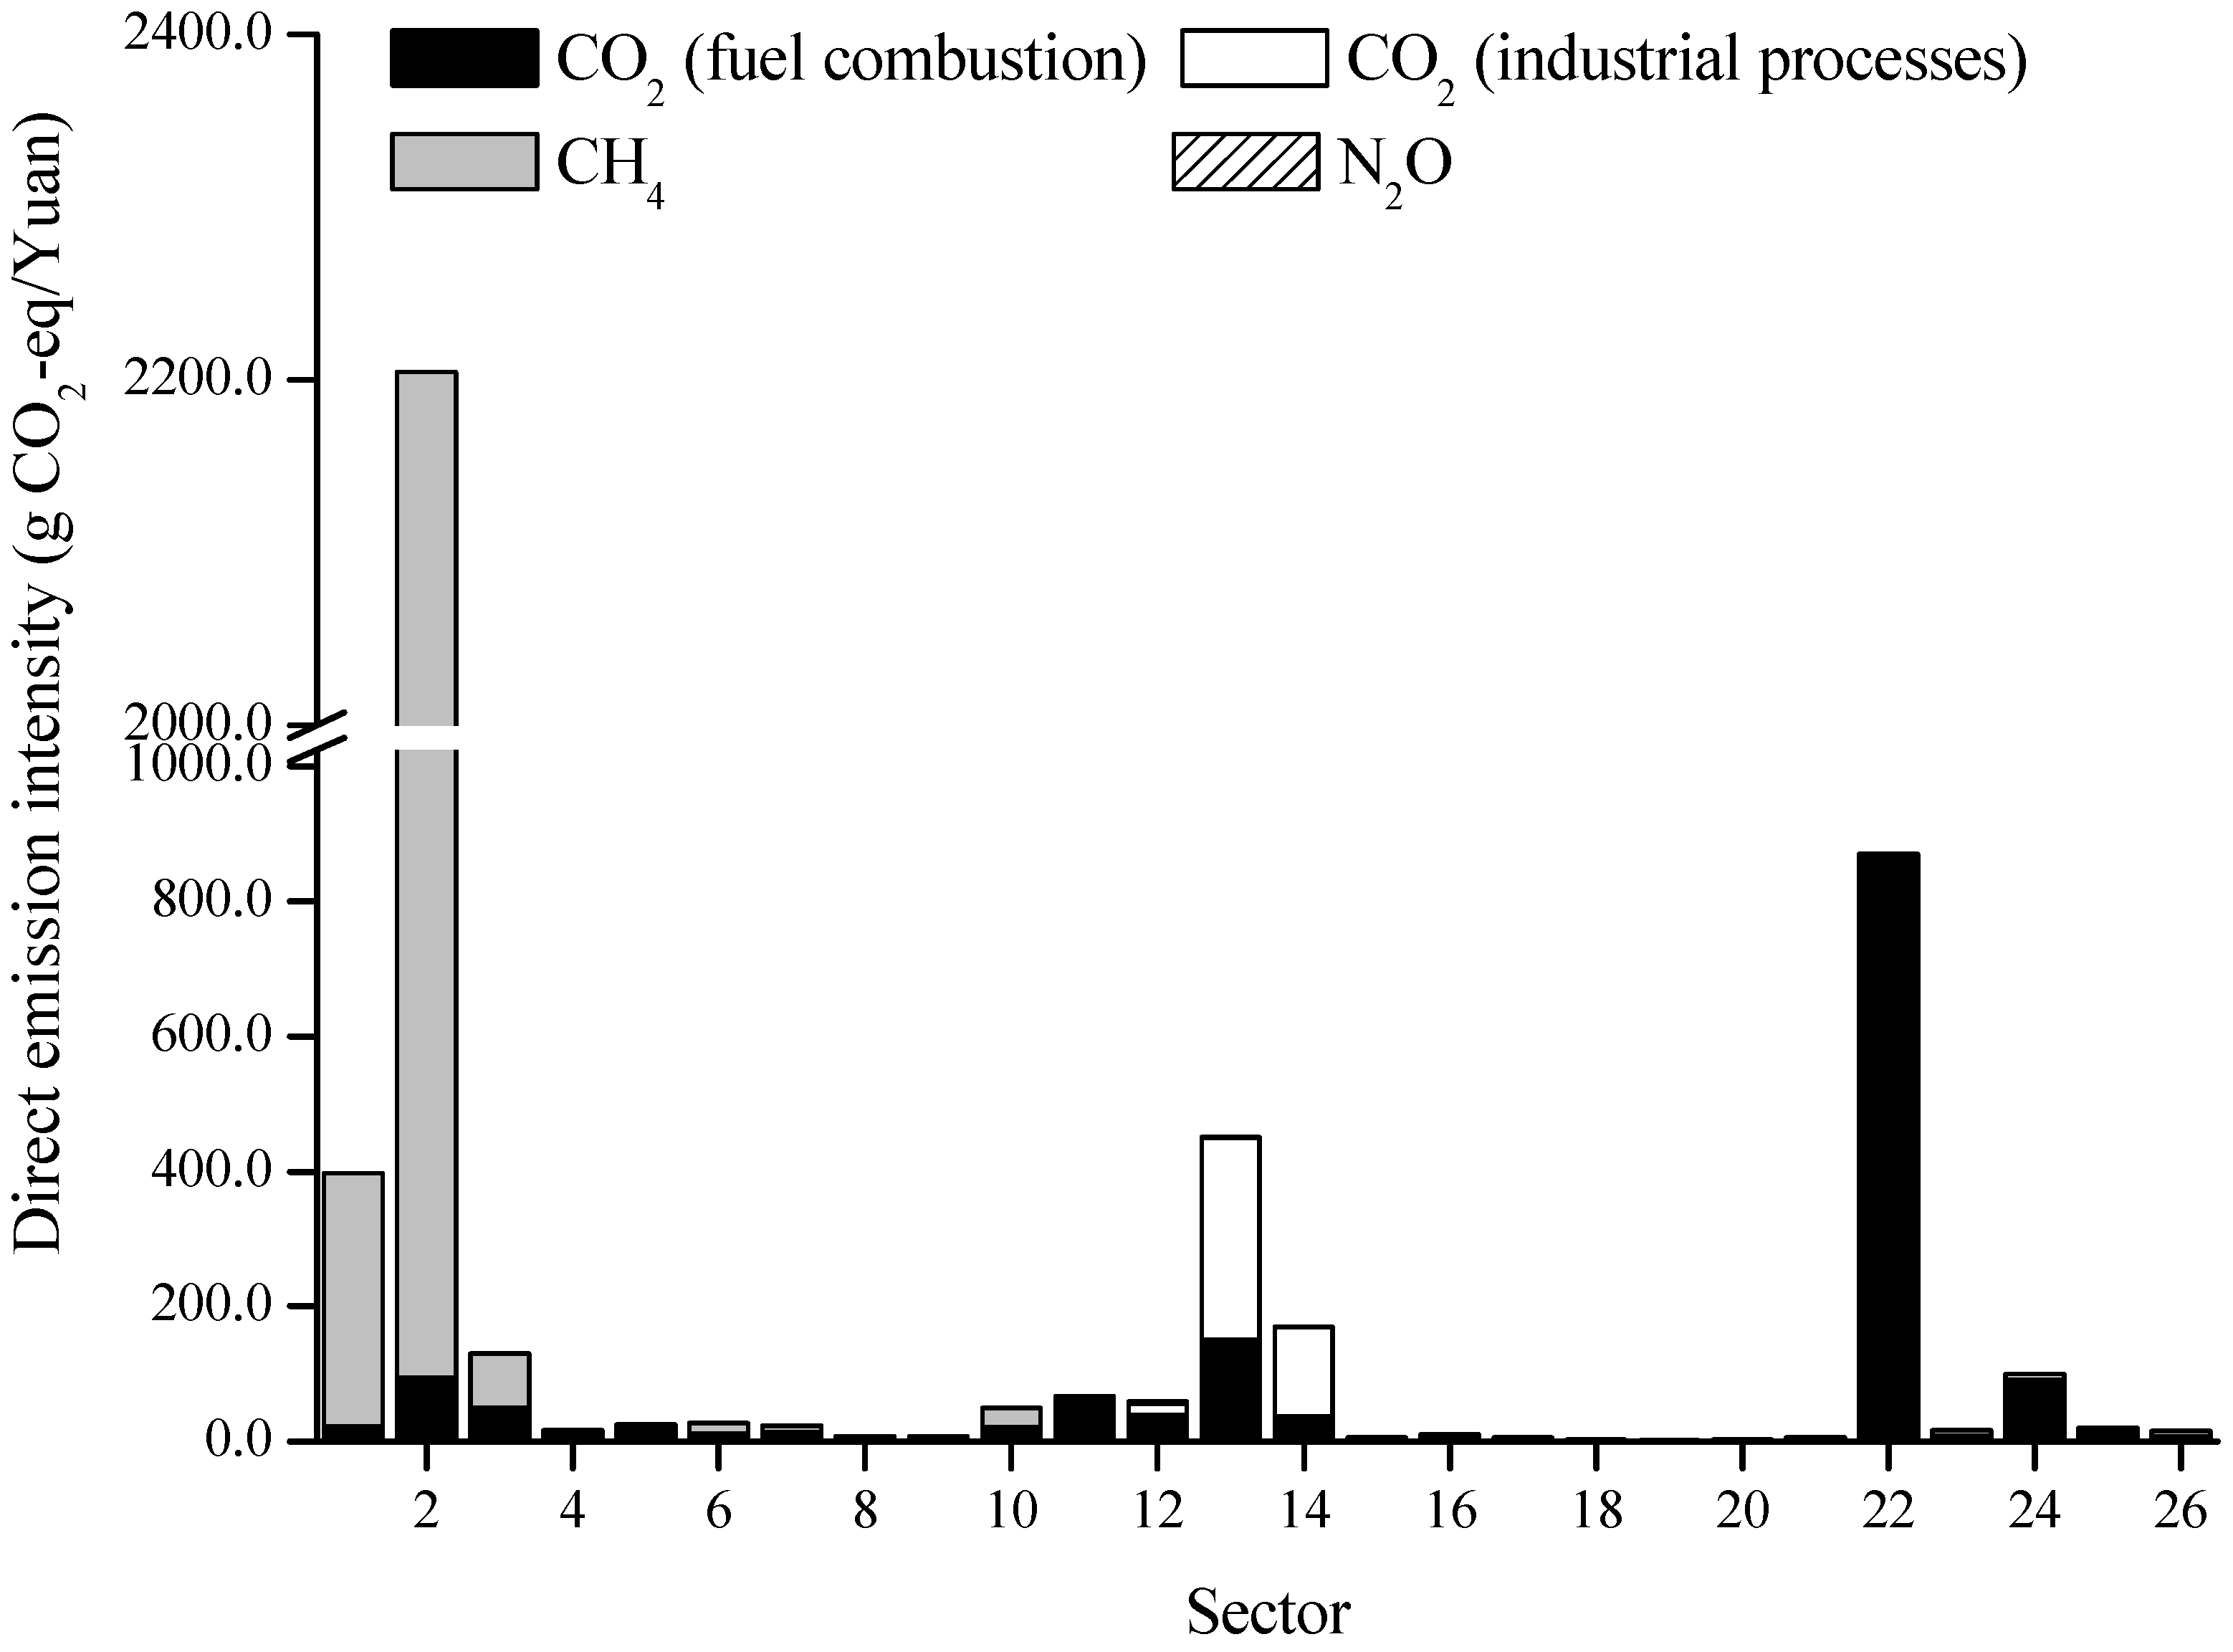
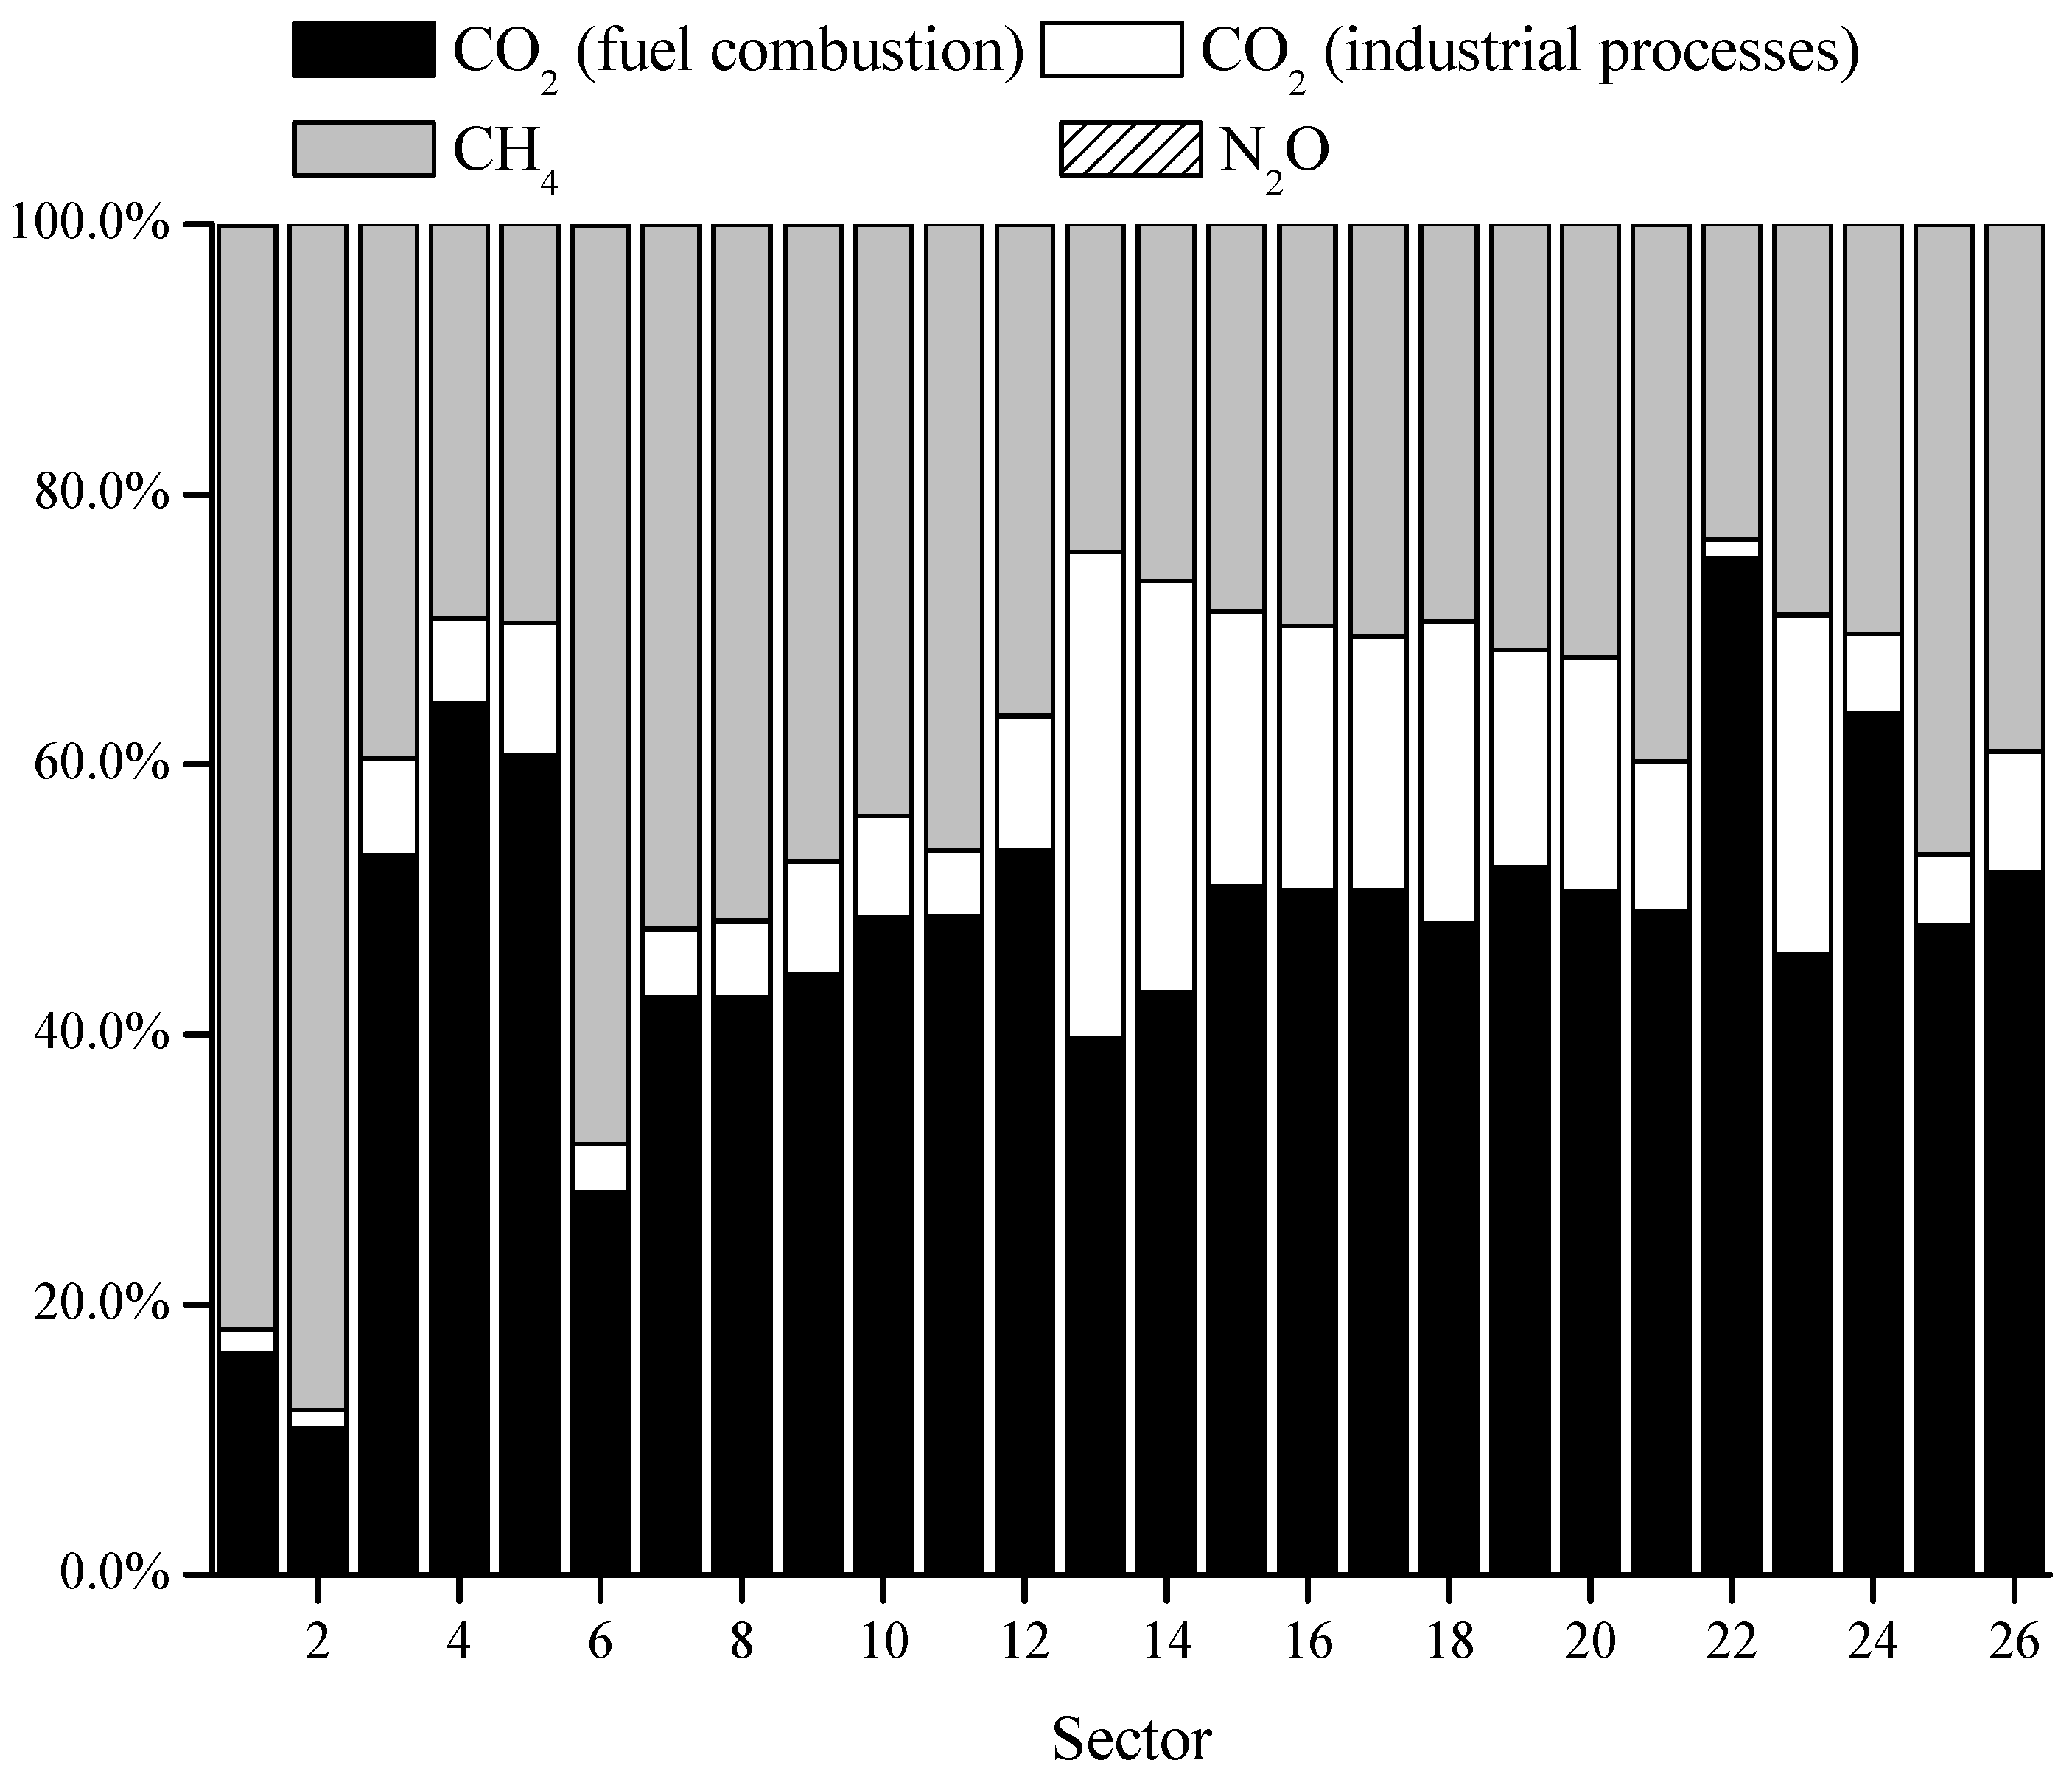
3. Direct GHG Emissions
| Sector | CO2 (Fuel Combustion) | CO2 (Industrial Processes) | CH4 | N2O | GHGs |
|---|---|---|---|---|---|
| 1 | 107.6 | 1832.6 | 3.50 | 1943.7 | |
| 2 | 90.7 | 2035.5 | 0.01 | 2126.2 | |
| 3 | 47.0 | 76.6 | 0.00 | 123.6 | |
| 4 | 9.1 | 0.7 | 0.00 | 9.8 | |
| 5 | 9.3 | 0.2 | 0.00 | 9.5 | |
| 6 | 46.9 | 65.4 | 0.00 | 112.3 | |
| 7 | 31.9 | 28.3 | 0.00 | 60.2 | |
| 8 | 7.1 | 5.8 | 0.00 | 12.9 | |
| 9 | 7.2 | 0.3 | 0.00 | 7.5 | |
| 10 | 31.7 | 40.9 | 0.00 | 72.6 | |
| 11 | 144.6 | 4.2 | 0.01 | 148.8 | |
| 12 | 237.0 | 105.8 | 19.1 | 0.41 | 362.3 |
| 13 | 342.9 | 683.9 | 1.1 | 0.03 | 1028.0 |
| 14 | 223.6 | 808.4 | 3.5 | 0.02 | 1035.5 |
| 15 | 10.7 | 0.4 | 0.00 | 11.1 | |
| 16 | 39.0 | 0.5 | 0.00 | 39.5 | |
| 17 | 18.2 | 0.4 | 0.00 | 18.6 | |
| 18 | 6.5 | 0.2 | 0.00 | 6.7 | |
| 19 | 6.0 | 0.6 | 0.00 | 6.6 | |
| 20 | 0.9 | 0.1 | 0.00 | 1.0 | |
| 21 | 6.3 | 0.6 | 0.00 | 6.9 | |
| 22 | 2736.9 | 4.5 | 0.23 | 2741.7 | |
| 23 | 50.0 | 50.6 | 0.00 | 100.6 | |
| 24 | 388.1 | 35.9 | 0.02 | 424.1 | |
| 25 | 53.9 | 35.2 | 0.00 | 89.1 | |
| 26 | 73.1 | 85.7 | 0.00 | 158.8 | |
| Total | 4726.3 | 1598.1 | 4328.8 | 4.25 | 10,657.5 |

4. Embodied GHG Emissions
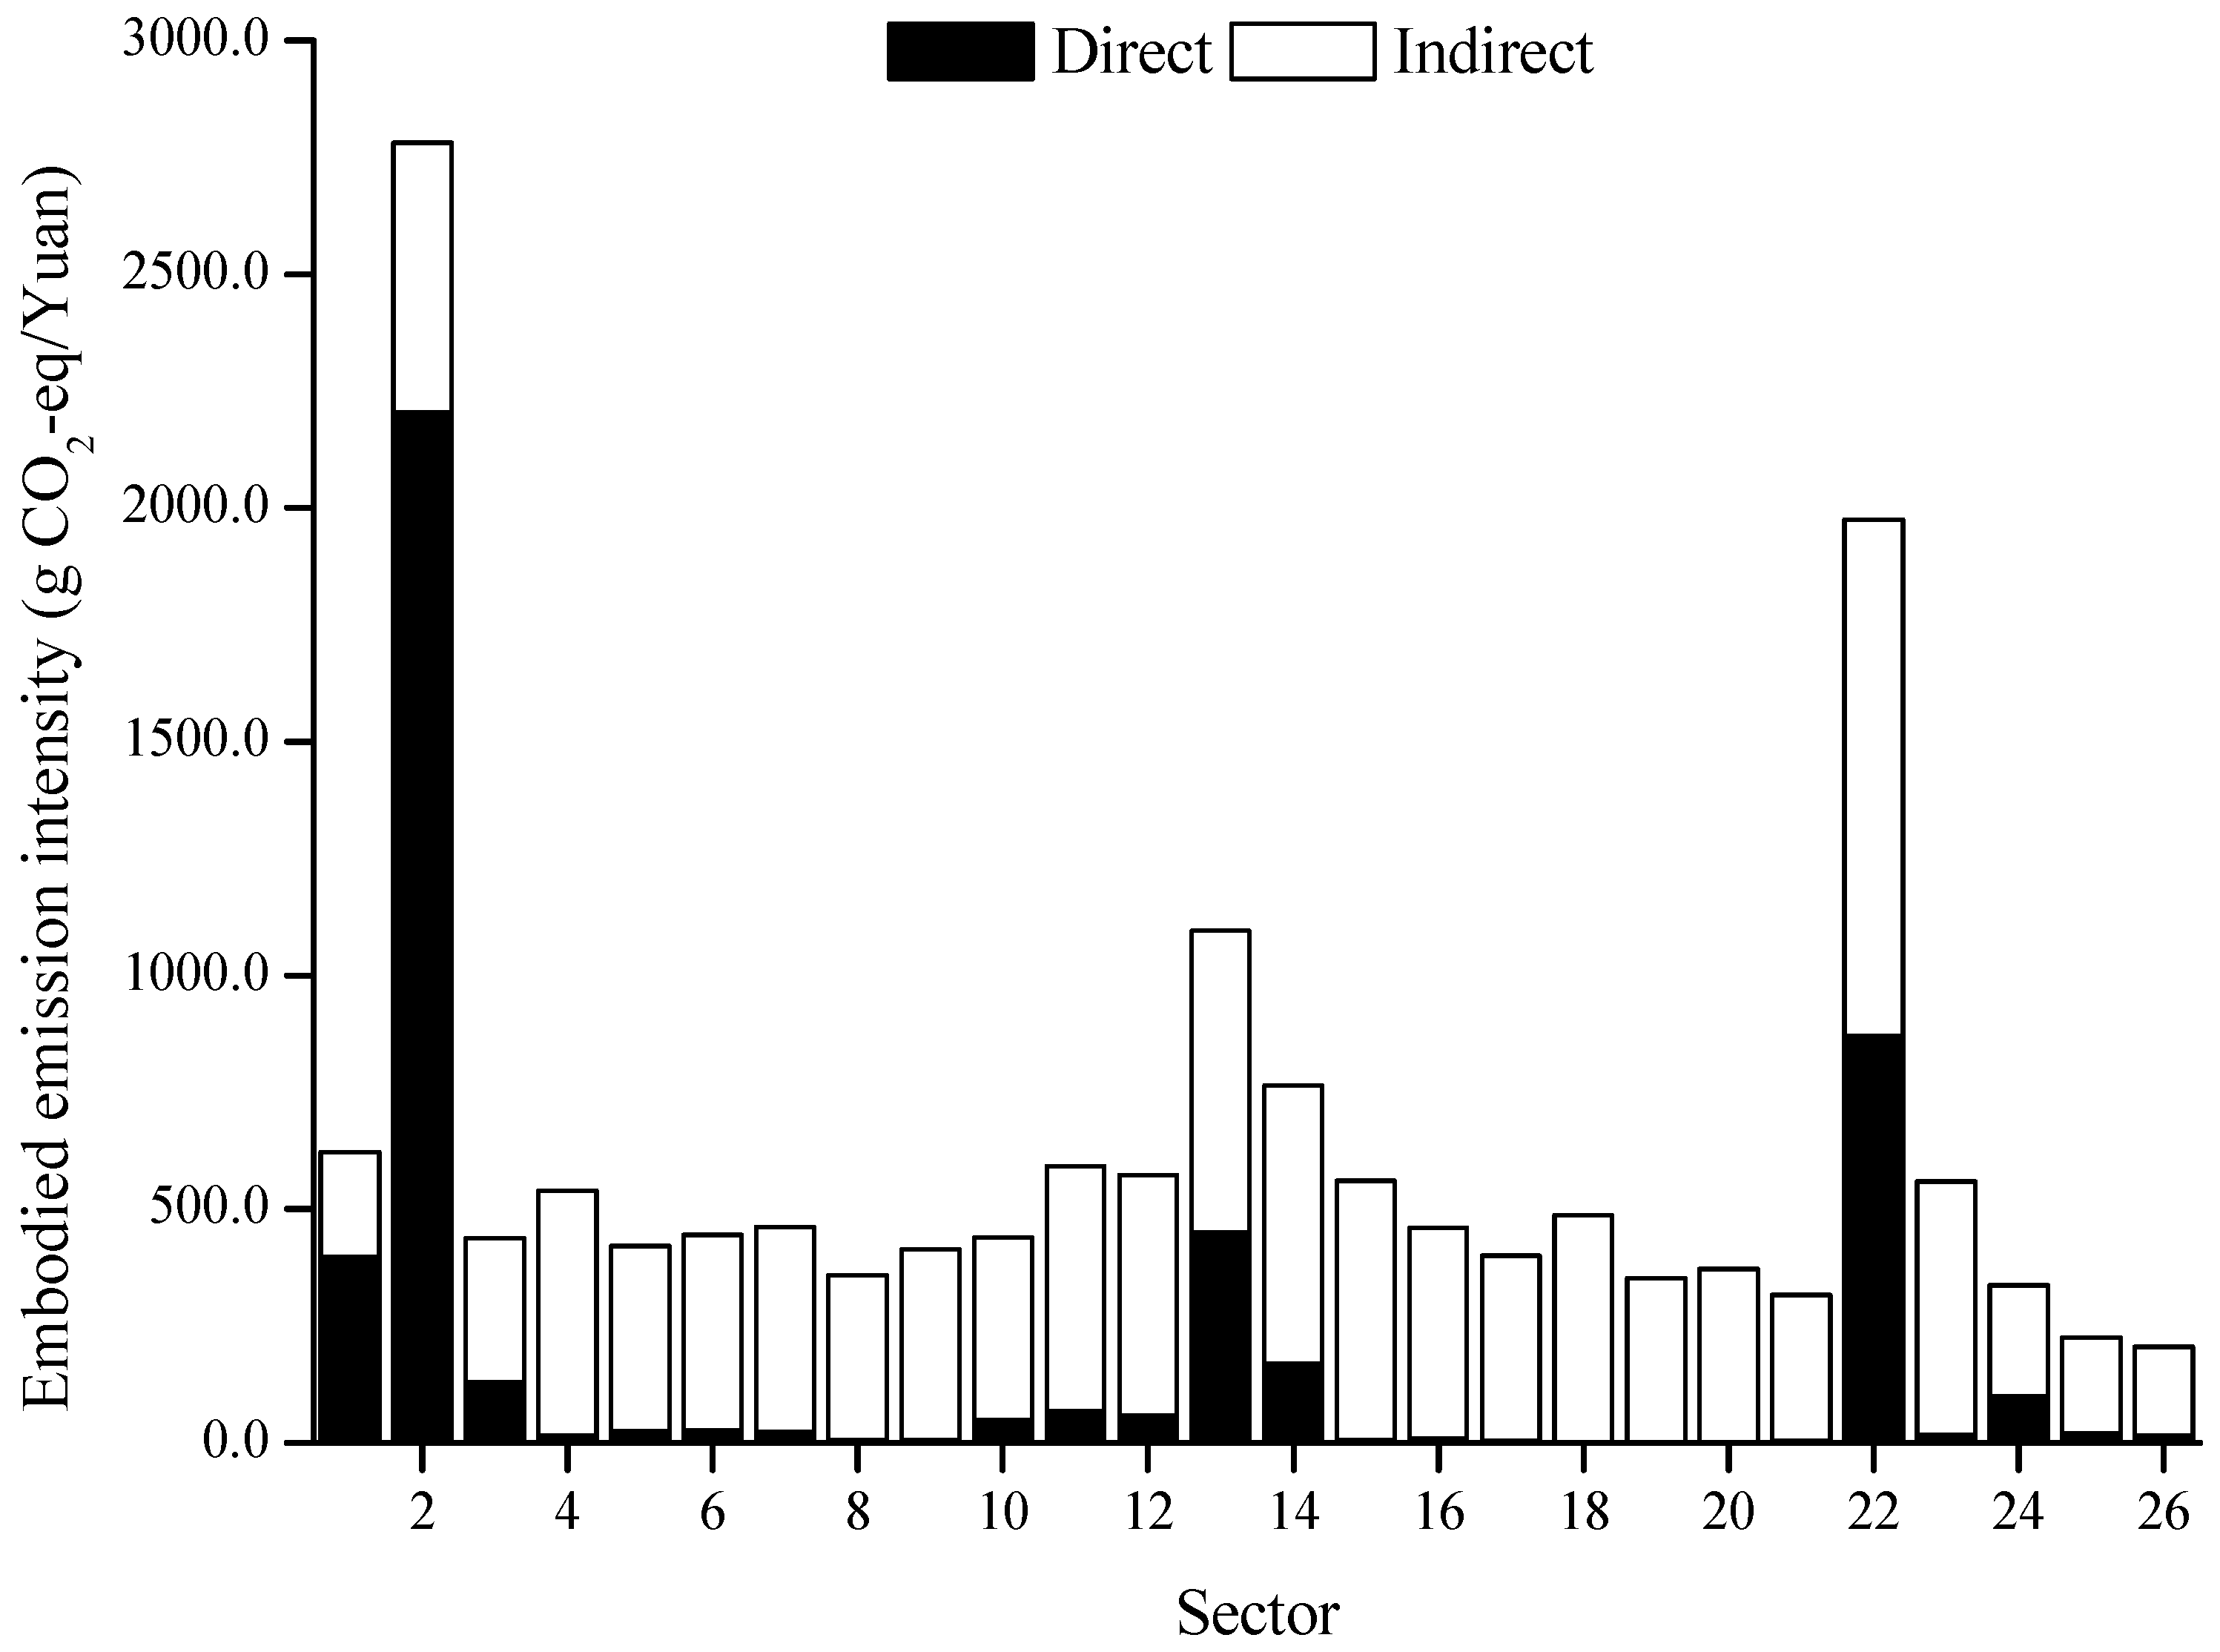
4.1. Embodied Emission Intensities

4.2. Emissions Embodied in Final Consumption

| Money | GHG | CO2 | CH4 | |||||
|---|---|---|---|---|---|---|---|---|
| 104 Yuan | Fraction (%) | Mt CO2-eq | Fraction (%) | Mt | Fraction (%) | Mt CO2-eq | Fraction (%) | |
| Total Production | ||||||||
| Domestic (GDP) | 2.7 × 10⁹ | 78.2 | 10657.5 | 75.7 | 6324.4 | 74.6 | 4328.9 | 77.5 |
| Import | 7.4 × 10⁸ | 21.8 | 3415.9 | 24.3 | 2159.0 | 25.4 | 1256.0 | 22.5 |
| Total | 3.4 × 10⁹ | 100.0 | 14073.5 | 100.0 | 8483.4 | 100.0 | 5584.9 | 100.0 |
| Final Demand | ||||||||
| Rural | 2.4 × 10⁸ | 7.2 | 1045.9 | 7.4 | 445.3 | 5.2 | 599.8 | 10.7 |
| Urban | 7.2 × 10⁸ | 21.2 | 2831.0 | 20.1 | 1454.2 | 17.1 | 1375.1 | 24.6 |
| Government | 3.5 × 10⁸ | 10.4 | 761.1 | 5.4 | 459.7 | 5.4 | 301.2 | 5.4 |
| Gross capital formation | 1.1 × 10⁹ | 32.6 | 5484.1 | 39.0 | 3758.4 | 44.3 | 1724.7 | 30.9 |
| Exports | 9.6 × 10⁸ | 28.1 | 4232.9 | 30.1 | 2663.3 | 31.4 | 1568.3 | 28.1 |
| Others | 1.9 × 10⁷ | 0.6 | −281.4 | −2.0 | −297.5 | −3.5 | 15.8 | 0.3 |
| Total | 3.4 × 10⁹ | 100.0 | 14073.5 | 100.0 | 8483.4 | 100.0 | 5584.9 | 100.0 |
| Year | GDP (Billion Yuan) | Gross Capital Formation Rate (%) | Final Consumption Rate (%) | Net Exports of Goods and Services Rate (%) |
|---|---|---|---|---|
| 2001 | 10,897.2 | 36.49 | 61.37 | 2.13 |
| 2002 | 12,035.0 | 37.86 | 59.57 | 2.57 |
| 2003 | 13,639.9 | 41.03 | 56.78 | 2.19 |
| 2004 | 16,028.0 | 43.15 | 54.30 | 2.54 |
| 2005 | 18,869.2 | 42.74 | 51.84 | 5.42 |
| 2006 | 22,165.1 | 42.59 | 49.90 | 7.51 |
| 2007 | 26,324.3 | 42.33 | 48.79 | 8.88 |
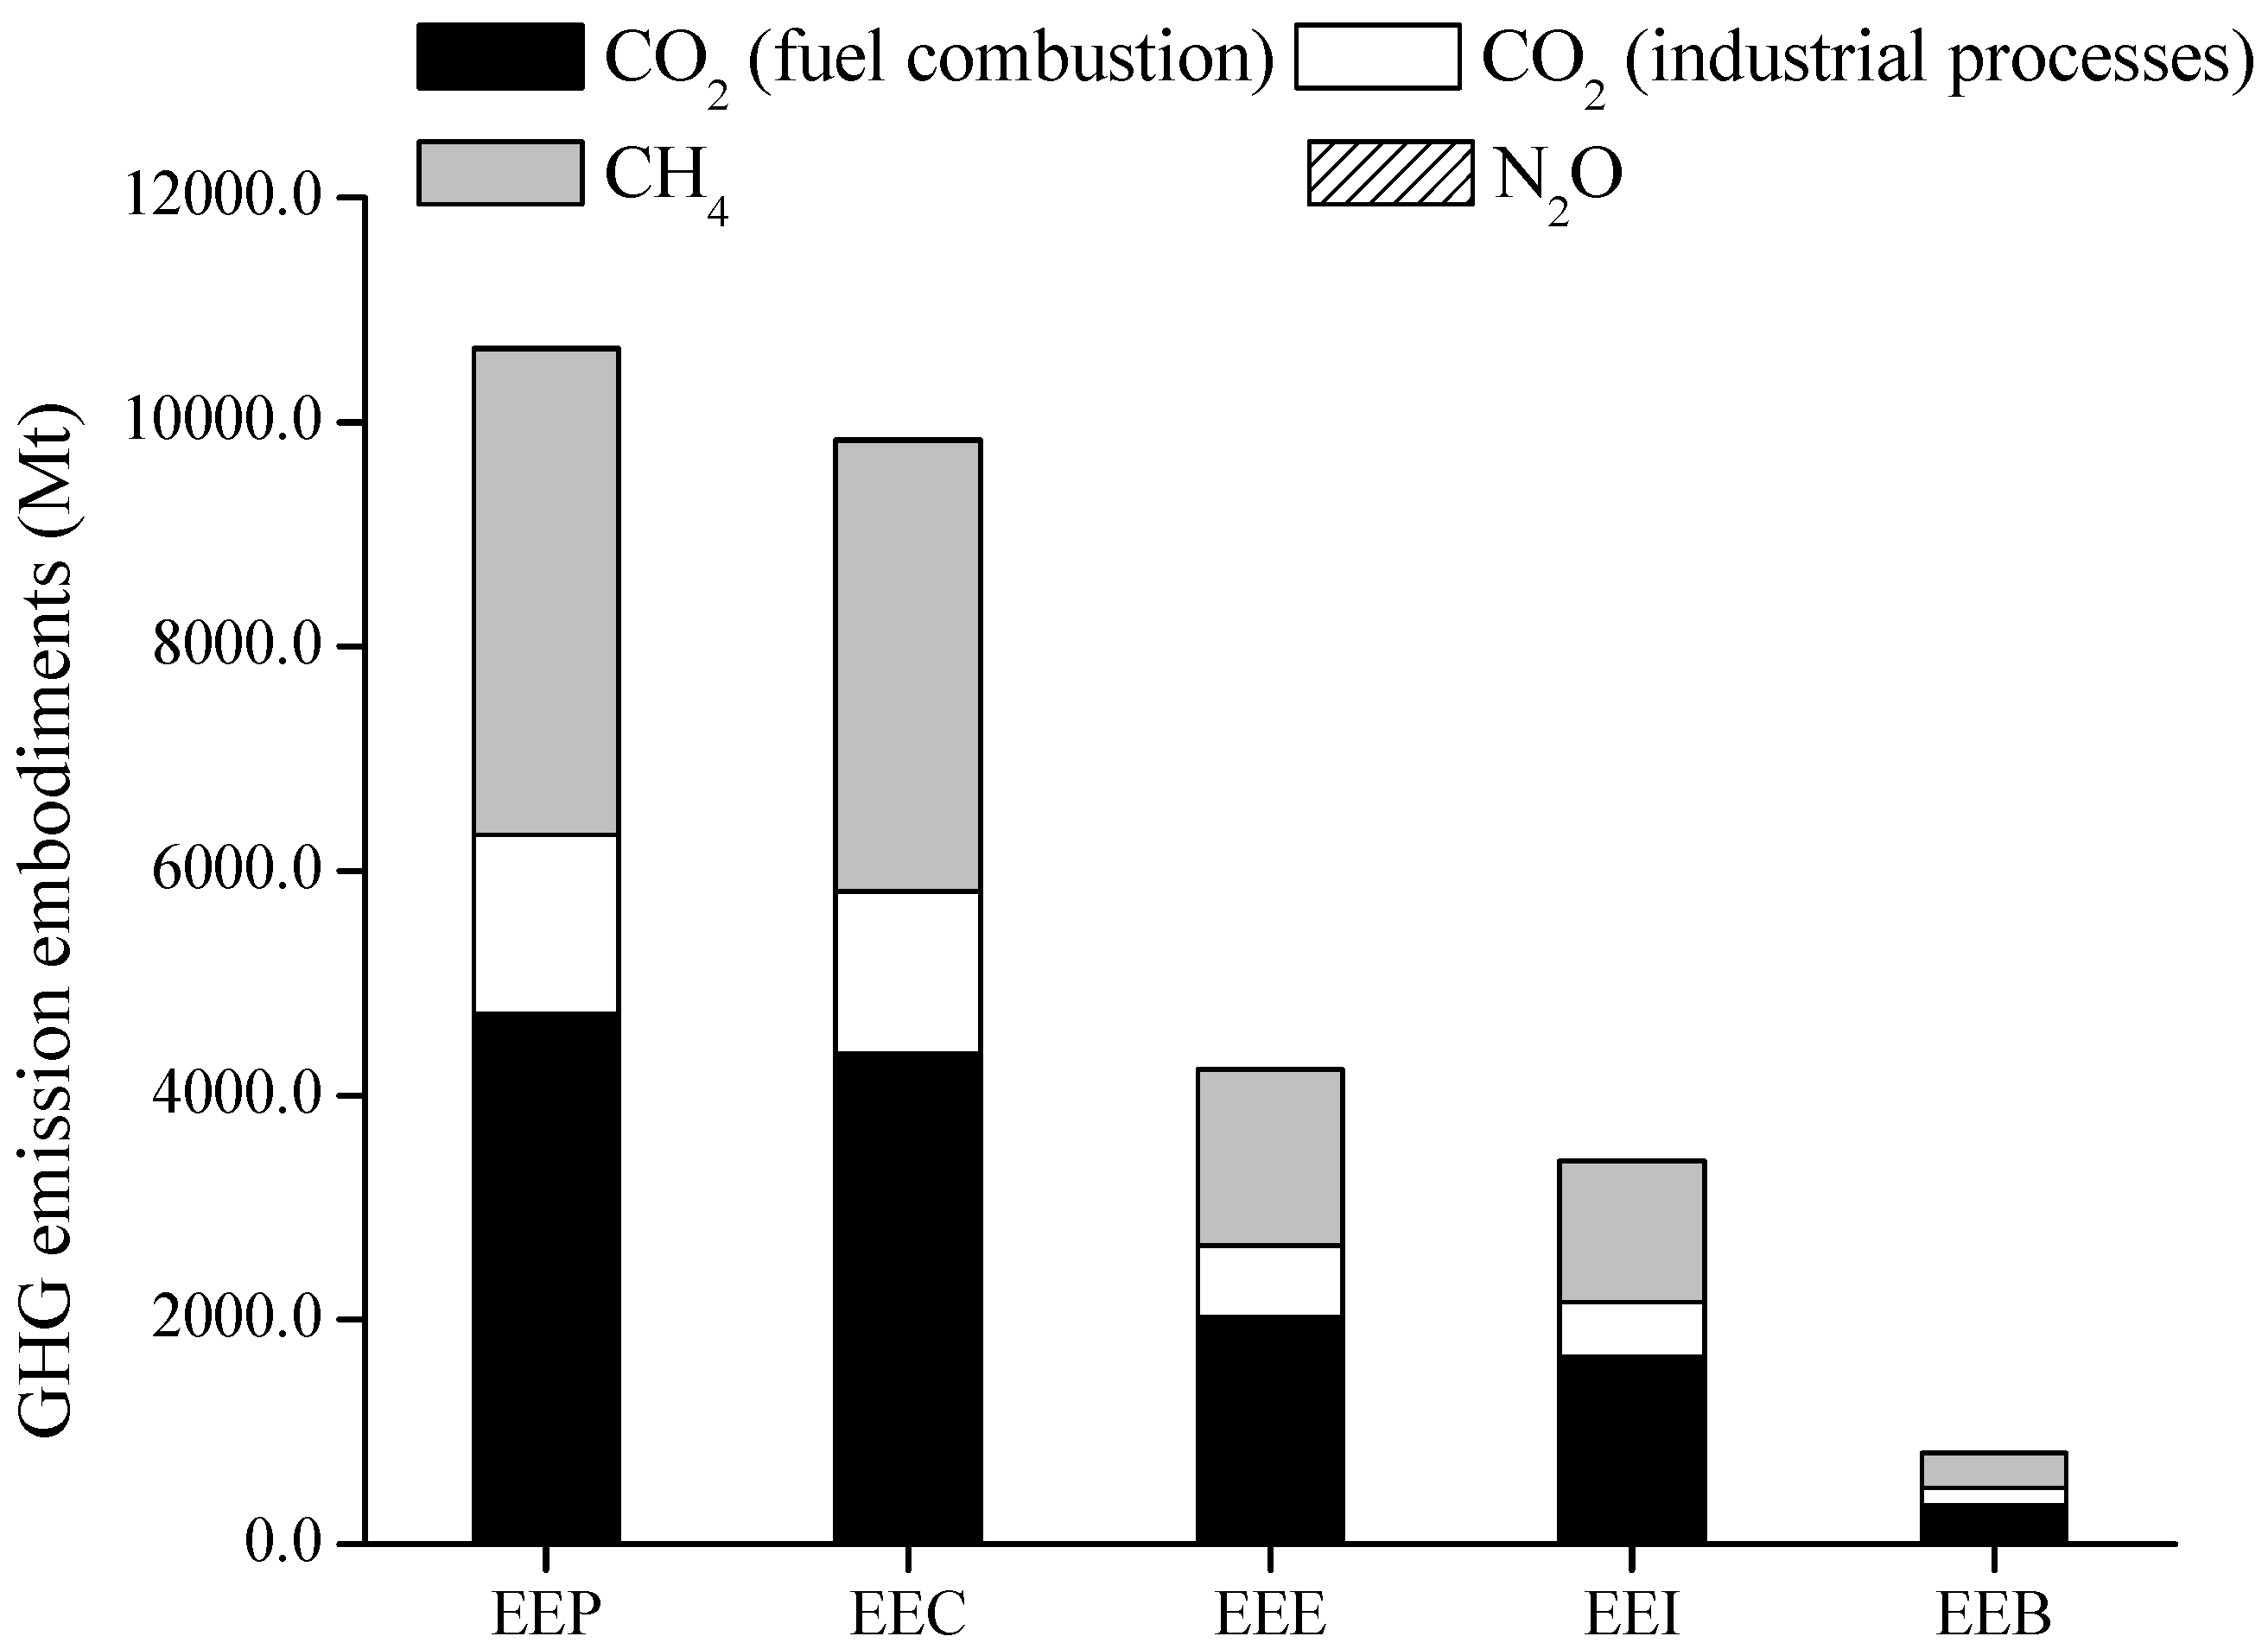
4.3. Emissions Embodied in International Trade
| Sector | EEE | EEI | EEB | ||
|---|---|---|---|---|---|
| Emission Embodiment (Mt CO2-eq) | Fraction | Emission Embodiment (Mt CO2-eq) | Fraction | Emission Embodiment (Mt CO2-eq) | |
| 1 | 41.4 | 1.0% | 144.8 | 4.2% | −103.4 |
| 2 | 65.0 | 1.5% | 53.5 | 1.6% | 11.6 |
| 3 | 7.6 | 0.2% | 252.9 | 7.4% | −245.3 |
| 4 | 4.4 | 0.1% | 219.8 | 6.4% | −215.4 |
| 5 | 6.3 | 0.2% | 12.7 | 0.4% | −6.3 |
| 6 | 85.0 | 2.0% | 70.3 | 2.1% | 14.7 |
| 7 | 379.0 | 9.0% | 37.7 | 1.1% | 341.3 |
| 8 | 203.9 | 4.8% | 21.9 | 0.6% | 182.0 |
| 9 | 100.5 | 2.4% | 11.2 | 0.3% | 89.3 |
| 10 | 99.6 | 2.4% | 36.4 | 1.1% | 63.2 |
| 11 | 45.4 | 1.1% | 85.8 | 2.5% | −40.4 |
| 12 | 415.3 | 9.8% | 522.4 | 15.3% | −107.1 |
| 13 | 162.5 | 3.8% | 41.3 | 1.2% | 121.2 |
| 14 | 394.9 | 9.3% | 330.9 | 9.7% | 64.0 |
| 15 | 200.0 | 4.7% | 32.9 | 1.0% | 167.2 |
| 16 | 264.2 | 6.2% | 324.4 | 9.5% | −60.2 |
| 17 | 131.8 | 3.1% | 120.6 | 3.5% | 11.2 |
| 18 | 332.5 | 7.9% | 167.3 | 4.9% | 165.2 |
| 19 | 752.7 | 17.8% | 573.8 | 16.8% | 178.8 |
| 20 | 120.7 | 2.9% | 146.5 | 4.3% | −25.8 |
| 21 | 42.6 | 1.0% | 51.7 | 1.5% | −9.2 |
| 22 | 12.9 | 0.3% | 3.6 | 0.1% | 9.3 |
| 23 | 22.9 | 0.5% | 12.4 | 0.4% | 10.5 |
| 24 | 151.1 | 3.6% | 50.7 | 1.5% | 100.4 |
| 25 | 107.2 | 2.5% | 11.8 | 0.4% | 95.4 |
| 26 | 83.4 | 2.0% | 78.4 | 2.3% | 5.0 |
5. Conclusions
- (1)
- The estimated total direct GHG emissions by the Chinese economy in 2007 amount to 10,657.5 Mt CO2-eq by the Global Thermodynamic Potentials with 40.6% from CH4 emissions in magnitude of the same importance as CO2 emissions. On a sectoral basis, the five primary sectors of the Electric Power/Steam and Hot Water Production and Supply, Coal Mining and Dressing, Agriculture, Smelting and Pressing of Ferrous and Nonferrous Metals, and Nonmetal Mineral Products are responsible for 83.3% of the total GHG emissions with different GHG emission structures.
- (2)
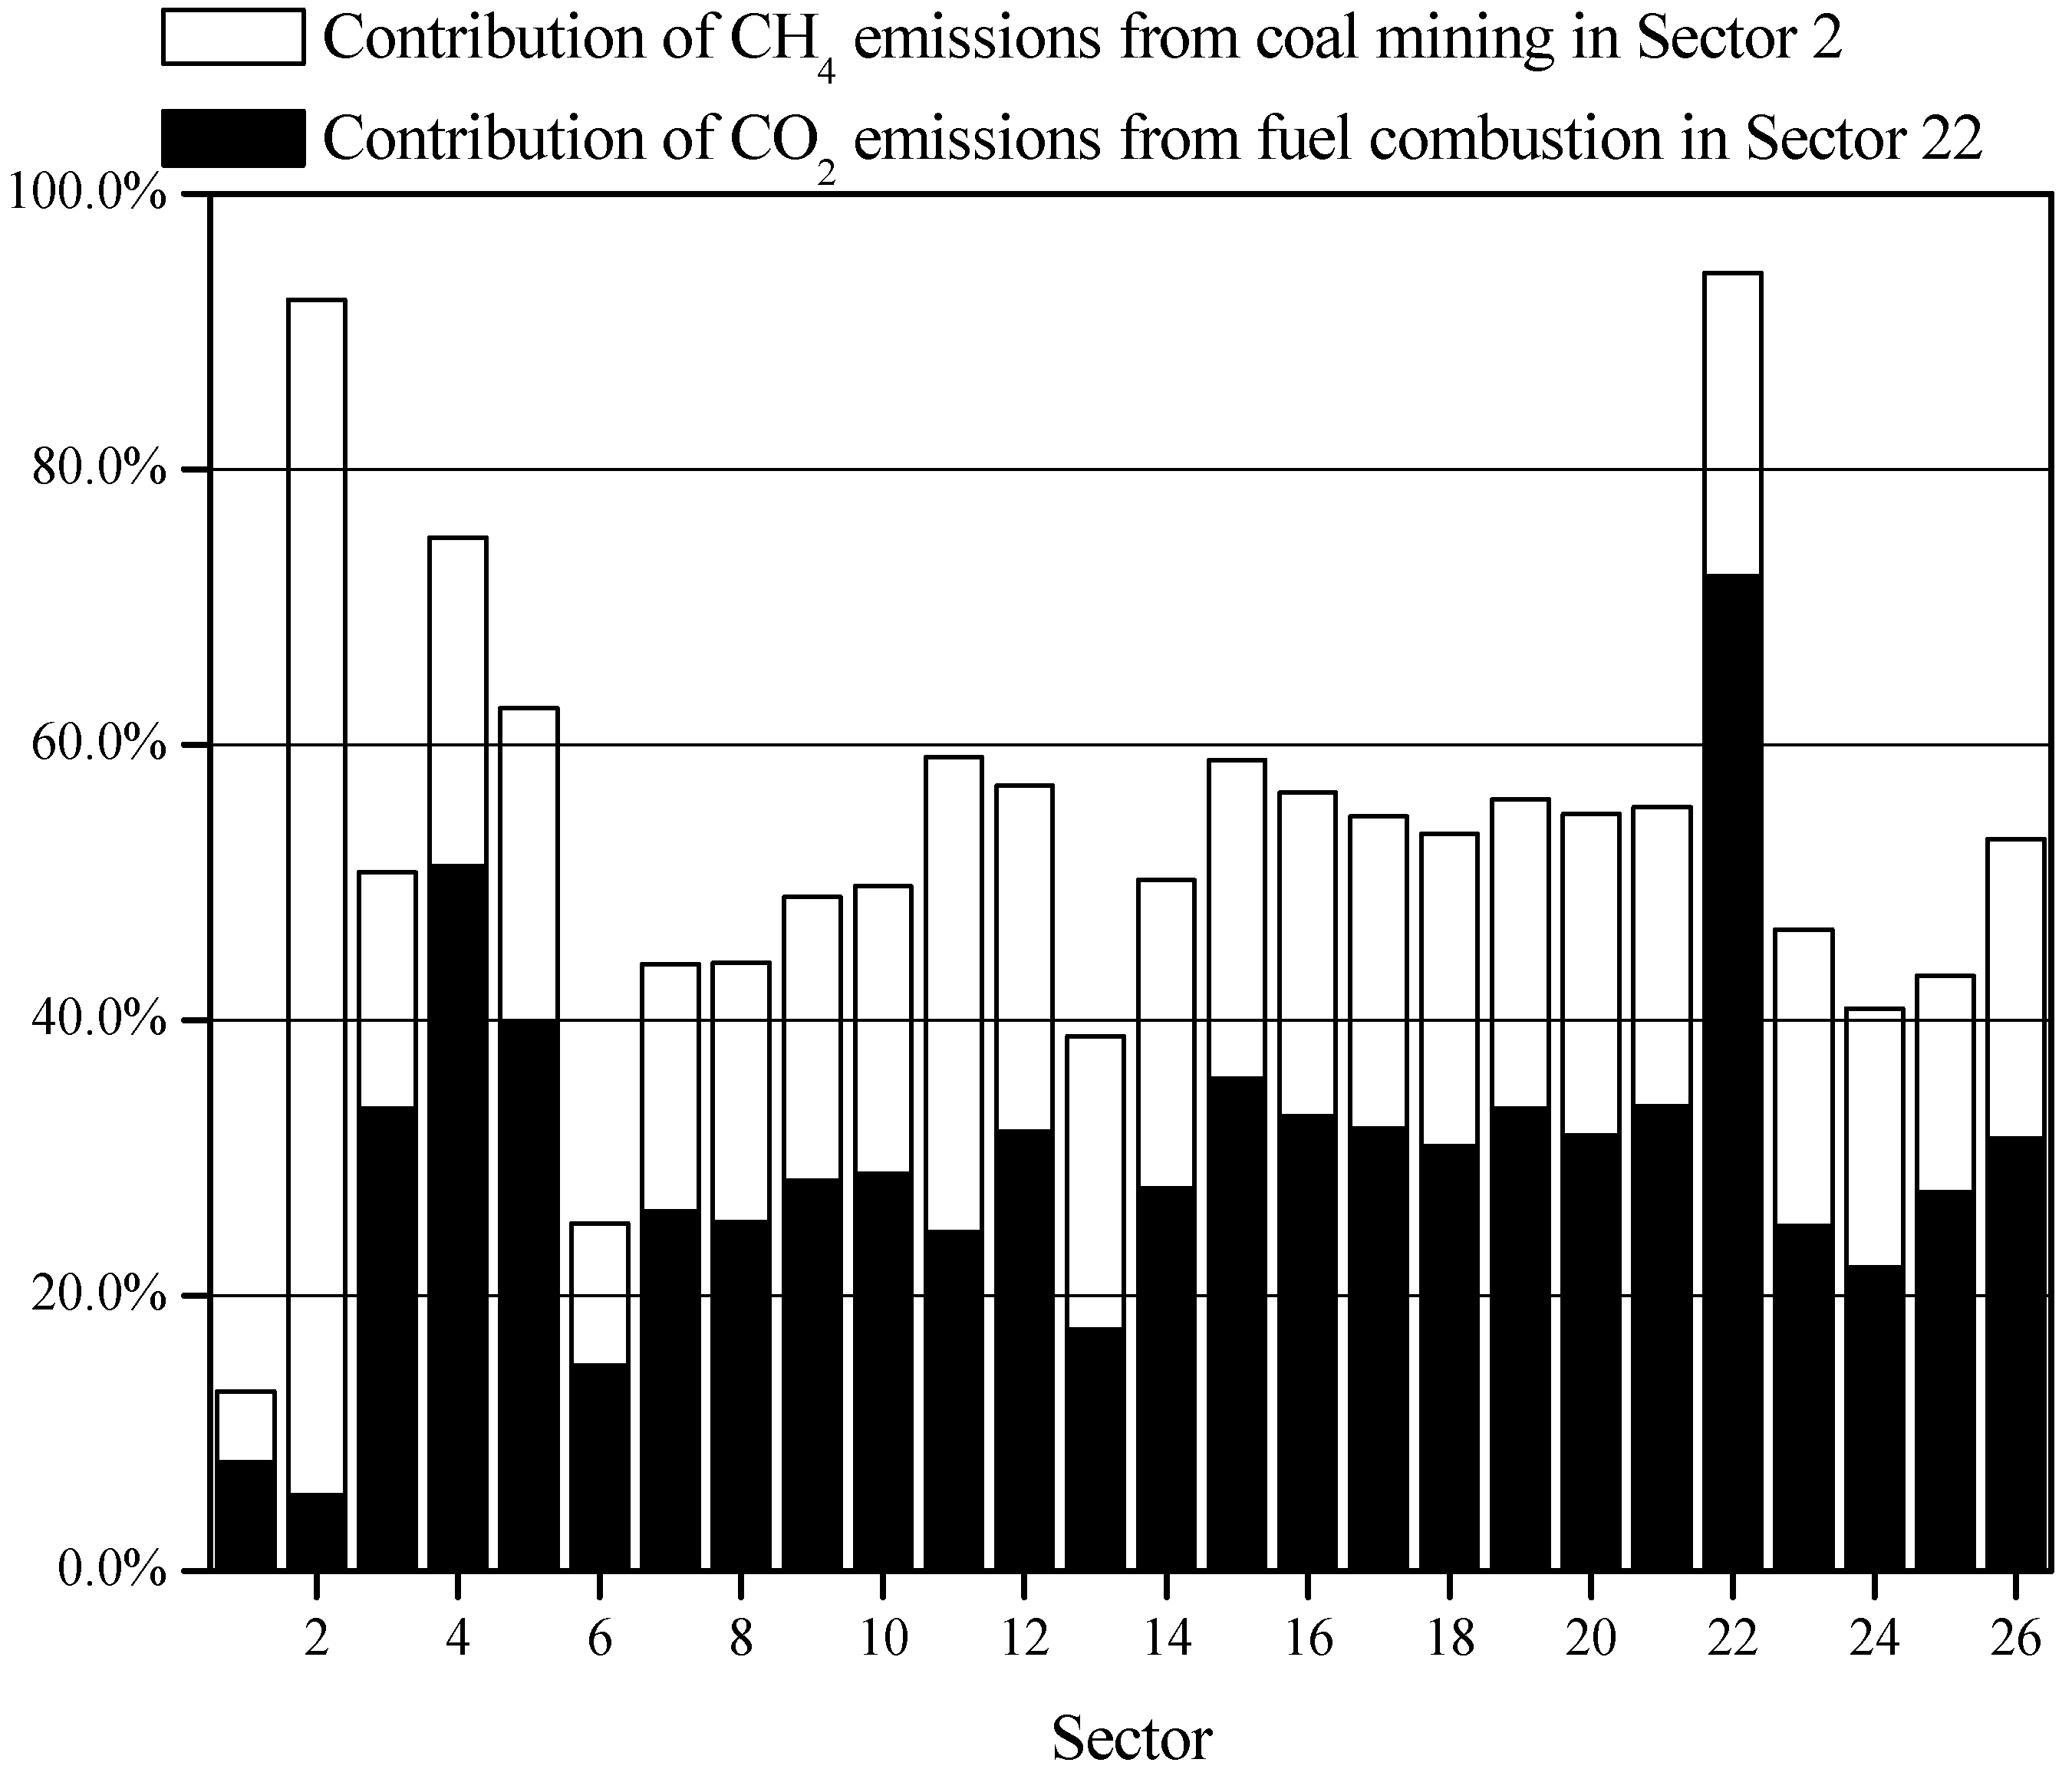
- The demands of coal and coal-electricity determine the structure of emission embodiment to an essential extent. Embodied GHG emission intensities in most manufacturing and service sectors are highly related to the direct CH4 emissions from coal mining in the Coal Mining and Dressing sector and CO2 emissions from fuel combustion in the Electric Power/Steam and Hot Water Production and Supply sector. The Construction sector holds the top GHG emissions embodied in both domestic production and domestic consumption. Household consumption which is CH4 emission intensive to some extent is responsible for 27.5% of the total GHG emission embodied in the final demand. However, the GHG emission embodied in gross capital formation is the largest in the final demand categories. Extensive investment and limited consumption by Chinese economy can be partly reflected by the profile of GHG emission embodiment.
- (3)
- China is a net exporter of embodied GHG emissions, with a remarkable share of direct emission induced by international trade. The amount of GHG emissions embodied in China’s exports (EEE) is equal to 39.7% of the total direct domestic emission. Of the total EEE, 47.8% is due to the CO2 emission from fuel combustion, 37.1% due to CH4 emission, and 15.1% due to the CO2 emissions from industrial processes. China also avoids emitting 3416.0 Mt CO2-eq GHGs as a result of importing goods from the rest of the World. In international trade balance, China’s textile products, industrial raw materials, and primary machinery and equipment products exports have a significant impact on embodied GHG emissions.
- (4)
- Although the main conclusions of GHG emission embodiment based on Global Thermodynamic Potential (GTP) equivalent are similar to those based on Global Warming Potential (GWP) equivalent, CH4 emissions based on GTP equivalent have remarkable influence in the structure of embodied GHG emissions in the final demand. For instance, CH4 emissions comprise 57.3%, 48.6%, 39.6%, 31.4% and 37.1% of the total embodied GHG emission for the rural consumption, urban consumption, government consumption, gross capital formation, and exports, respectively, much greater than corresponding fractions calculated based on the GWP in [3]. These results highlight the importance of CH4 emissions for the case of China and indicate the essential effect of CH4 emissions on global climate change.
Acknowledgments
References
- International Energy Agency (IEA). CO2 Emissions from Fuel Combustion 2009—Highlights, 2009. Available online: http://www.iea.org/co2highlights/co2highlights.pdf (accessed on 3 May 2010).
- Zhang, Z.X. China in the transition to a low-carbon economy. Energy Policy 2010, 38, 6638–6653. [Google Scholar] [CrossRef]
- Chen, G.Q.; Zhang, B. Greenhouse gas emissions in China 2007: Inventories and input-output analysis. Energy Policy 2010, 38, 6180–6193. [Google Scholar] [CrossRef]
- Wiedmann, T.; Lenzen, M.; Turner, K.; Barrett, J. Examining the global environmental impact of regional consumption activities—Part 2: Review of input–output models for the assessment of environmental impacts embodied in trade. Ecol. Econ. 2007, 61, 15–26. [Google Scholar] [CrossRef]
- Miller, R.E.; Blair, P.D. Input-Output Analysis: Foundations and Extensions, 2nd ed.; Cambridge University Press: London, UK, 2009. [Google Scholar]
- Wiedmann, T. A review of recent multi-region input-output models used for consumption-based emission and resource accounting. Ecol. Econ. 2009, 69, 211–222. [Google Scholar] [CrossRef]
- Shui, B.; Harriss, R.C. The role of CO2 embodiment in US-China trade. Energy Policy 2006, 34, 4063–4068. [Google Scholar] [CrossRef]
- Peters, G.P.; Weber, C.L.; Guan, D.; Hubacek, K. China’s growing CO2 emissions—A race between lifestyle changes and efficiency gains. Environ. Sci. Technol. 2007, 41, 5939–5944. [Google Scholar]
- Wang, T.; Watson, J. Who Owns China’s Carbon Emissions? Tyndall Centre for Climate Change Research: Sussex, UK, 2007. [Google Scholar]
- Pan, J.H.; Phillips, J.; Chen, Y. China’s balance of emissions embodied in trade: Approaches to measurement and allocating international responsibility. Oxf. Rev. Econ. Policy 2008, 24, 354–376. [Google Scholar] [CrossRef]
- Guan, D.; Hubacek, K.; Weber, C.L.; Peters, G.P.; Reiner, D. The drivers of Chinese CO2 emissions from 1980 to 2030. Glob. Environ. Change Hum. Policy Dimens. 2008, 18, 626–634. [Google Scholar] [CrossRef]
- Weber, C.L.; Peters, G.P.; Guan, D.; Hubacek, K. The contribution of Chinese exports to climate change. Energy Policy 2008, 36, 3572–3577. [Google Scholar] [CrossRef]
- Guan, D.; Peters, G.P.; Weber, C.L.; Hubacek, K. Journey to world top emitter: An analysis of the driving forces of China’s recent CO2 emissions surge. Geophys. Res. Lett. 2009, 36, L04709. [Google Scholar] [CrossRef]
- Zhang, Y. Supply-side structural effect on carbon emissions in China. Energy Econ. 2010, 32, 186–193. [Google Scholar] [CrossRef]
- Liu, X.; Ishikawab, M.; Wang, C.; Dong, Y.; Liu, W. Analyses of CO2 emissions embodied in Japan–China trade. Energy Policy 2010, 38, 1510–1518. [Google Scholar] [CrossRef]
- Chen, Z.M.; Chen, G.Q. Embodied carbon dioxide emission at supra-national scale: A coalition analysis for G7, BRIC, and the rest of the world. Energy Policy 2011, 39, 2899–2909. [Google Scholar] [CrossRef]
- INCCCC. Initial National Communication on Climate Change of China, 2004. Available online: http://www.ccchina.gov.cn/file/en_source/da/da2004110901.pdf (accessed on 5 April 2011).
- Zhang, B.; Chen, G.Q. Methane emissions by Chinese economy: Inventory and embodiment analysis. Energy Policy 2010, 38, 4304–4316. [Google Scholar] [CrossRef]
- Zhou, J.B. Embodied Ecological Elements Accounting of National Economy. Ph.D. Dissertation, Peking University, Beijing, China, 2008. [Google Scholar]
- Chen, Z.M.; Chen, G.Q.; Zhou, J.B.; Jiang, M.M.; Chen, B. Ecological input–output modeling for embodied resources and emissions in Chinese economy 2005. Commun. Nonlinear Sci. Numer. Simul. 2010, 15, 1942–1965. [Google Scholar] [CrossRef]
- Chen, G.Q.; Chen, Z.M. Carbon emissions and resources use by Chinese economy 2007: A 135-sector inventory and input-output embodiment. Commun. Nonlinear Sci. Numer. Simul. 2010, 15, 2647–2732. [Google Scholar]
- Chen, G.Q.; Chen, Z.M. Greenhouse gas emissions and natural resources use by the world economy: Ecological input-output modeling. Ecol. Model. 2011, 222, 2362–2376. [Google Scholar] [CrossRef]
- IPCC. IPCC Fourth Assessment Report: Climate Change 2007 (AR4), 2007. Available online: http://www.ipcc.ch/publications_and_data/publications_and_data_reports.htm (accessed on 22 February 2011).
- Wall, G. Exergy—A Useful Concept within Resource Accounting, Research Report No. 77–42; Institute of Theoretical Physics: Goteborg, Sweden, 1977. [Google Scholar]
- Rosen, M.A.; Dincer, I. Exergy analysis of waste emissions. Int. J. Energy Res. 1999, 23, 1153–1163. [Google Scholar] [CrossRef]
- Wall, G.; Gong, M. On exergy and sustainable development—Part 1: Conditions and concepts. Exergy Int. J. 2001, 1, 128–145. [Google Scholar] [CrossRef]
- Rosen, M.A.; Dincer, I. Exergy as the confluence of energy, environment and sustainable development. Exergy Int. J. 2001, 1, 3–13. [Google Scholar] [CrossRef]
- Szargut, J. Exergy Method: Technical and Ecological Applications; WIT Press: Southampton, UK, 2005. [Google Scholar]
- Chen, G.Q. Scarcity of exergy and ecological evaluation based on embodied exergy. Commun. Nonlinear Sci. Numer. Simul. 2006, 11, 531–552. [Google Scholar] [CrossRef]
- Gasparatos, A.; El–Haram, M.; Horner, M. A longitudinal analysis of the UK transport sector, 1970–2010. Energy Policy 2009, 37, 623–632. [Google Scholar] [CrossRef]
- Ometto, A.; Roma, W.N.L. Atmospheric impacts of the life cycle emissions of fuel ethanol in Brazil: Based on chemical exergy. J. Clean. Prod. 2010, 18, 71–76. [Google Scholar] [CrossRef]
- Chen, B.; Chen, G.Q. Ecological footprint accounting and analysis of the Chinese Society 1981–2001 based on embodied exergy. Ecol. Econ. 2007, 61, 355–376. [Google Scholar] [CrossRef]
- Gong, M.; Wall, G. On exergy and sustainable development—Part 2: Indicators and methods. Exergy Int. J. 2001, 1, 217–233. [Google Scholar] [CrossRef]
- Ji, X.; Chen, G.Q.; Chen, B.; Jiang, M.M. Exergy–based assessment for waste gas emissions from Chinese transportation. Energy Policy 2009, 37, 2231–2240. [Google Scholar] [CrossRef]
- Ayres, R.U.; Ayres, L.W.; Martinás, K. Exergy, waste accounting, and life cycle analysis. Energy 1998, 23, 355–363. [Google Scholar] [CrossRef]
- Rosen, M.A.; Dincer, I. On exergy and environmental impact. Int. J. Energy Res. 1997, 21, 643–654. [Google Scholar] [CrossRef]
- Dincer, I. The role of exergy in energy policy making. Energy Policy 2002, 30, 137–149. [Google Scholar] [CrossRef]
- Rosen, M.A. Assessing energy technologies and environmental impacts with the principles of thermodynamics. Appl. Energy 2002, 72, 427–441. [Google Scholar] [CrossRef]
- Rosen, M.A.; Dincer, I.; Kanoglu, M. Role of exergy in increasing efficiency and sustainability and reducing environmental impact. Energy Policy 2008, 36, 128–137. [Google Scholar] [CrossRef]
- Chen, G.Q. Exergy consumption of the earth. Ecol. Model. 2005, 184, 363–380. [Google Scholar] [CrossRef]
- Ji, X.; Chen, G.Q. Unified account of gas pollutants and greenhouse gas emissions: Chinese transportation 1978–2004. Commun. Nonlinear Sci. Numer. Simul. 2010, 15, 2710–2722. [Google Scholar] [CrossRef]
- Chen, G.Q.; Chen, B. Extended-exergy analysis of the Chinese society. Energy 2009, 34, 1127–1144. [Google Scholar] [CrossRef]
- Gasparatos, A.; Ei-Haram, M.; Horner, M. Assessing the sustainability of the UK society using thermodynamic concepts: Part 2. Renew. Sustain. Energy Rev. 2009, 13, 1074–1081. [Google Scholar] [CrossRef]
- Zhang, B.; Chen, G.Q. Physical sustainability assessment for the China society: Exergy-based systems account for resources use and environmental emissions. Renew. Sustain. Energy Rev. 2010, 14, 1527–1545. [Google Scholar] [CrossRef]
- Gasparatos, A.; Ei-Haram, M.; Horner, M. A critical review of reductionist approaches for assessing the progress towards sustainability. Environ. Impact Assess. Rev. 2008, 28, 286–311. [Google Scholar] [CrossRef]
- Morris, D.R.; Szargut, J. Standard chemical exergy of some elements and compounds on the planet earth. Energy 1986, 11, 733–755. [Google Scholar] [CrossRef]
- NBS, National Bureau of Statistics. Input-Output Tables of China; China Statistic Press: Beijing, China, 2009. (in Chinese)
- Zhang, B. Methane Emissions in China: Time Series Inventories and Systems embodiment Analysis. Ph.D. Dissertation, Peking University, Beijing, China, 2011. [Google Scholar]
- CSY. China Statistical Yearbook. National Bureau of Statistics of China, 2008. Available online: http://www.stats.gov.cn/tjsj/ndsj/2008/indexch.htm (accessed on 1 June 2011).
- Jiang, P.; Tovey, N.K. Opportunities for low carbon sustainability in large commercial buildings in China. Energy Policy 2009, 37, 4949–4958. [Google Scholar] [CrossRef]
- Ahmad, N.; Wyckoff, A. Carbon Dioxide Emissions Embodied in International Trade of Goods, STI Working Paper (15); Organisation for Economic Co-operation and Development (OECD): Paris, France, 2003. [Google Scholar]
- Lenzen, M.; Pade, L.L.; Munksgaard, J. CO2 multipliers in multi-region input-output models. Econ. Syst. Res. 2004, 16, 391–412. [Google Scholar] [CrossRef]
- Li, Y.; Hewitt, C.N. The effect of trade between China and the UK on national and global carbon dioxide emissions. Energy Policy 2008, 36, 1907–1914. [Google Scholar] [CrossRef]
- Xu, M.; Allenby, B.; Chen, W.Q. Energy and air emissions embodied in China–U.S. Trade: Eastbound assessment using adjusted bilateral trade data. Environ. Sci. Technol. 2009, 43, 3378–3384. [Google Scholar] [CrossRef] [PubMed]
- Guo, J.; Zou, L.L.; Wei, Y.M. Impact of inter–sectoral trade on national and global CO2 emissions: An empirical analysis of China and US. Energy Policy 2010, 38, 1389–1397. [Google Scholar] [CrossRef]
- Yan, Y.F.; Yang, L. China’s foreign trade and climate change: A case study of CO2 emissions. Energy Policy 2010, 38, 350–356. [Google Scholar] [CrossRef]
- Peters, G.P.; Hertwich, E.G. CO2 embodied in international trade with implications for global climate policy. Environ. Sci. Technol. 2008, 42, 1401–1407. [Google Scholar] [CrossRef] [PubMed]
- Lin, B.; Sun, C. Evaluating carbon dioxide emissions in international trade of China. Energy Policy 2010, 38, 613–621. [Google Scholar] [CrossRef]
© 2011 by the authors; licensee MDPI, Basel, Switzerland. This article is an open access article distributed under the terms and conditions of the Creative Commons Attribution license (http://creativecommons.org/licenses/by/3.0/).
Share and Cite
Zhang, B.; Peng, S.; Xu, X.; Wang, L. Embodiment Analysis for Greenhouse Gas Emissions by Chinese Economy Based on Global Thermodynamic Potentials. Energies 2011, 4, 1897-1915. https://doi.org/10.3390/en4111897
Zhang B, Peng S, Xu X, Wang L. Embodiment Analysis for Greenhouse Gas Emissions by Chinese Economy Based on Global Thermodynamic Potentials. Energies. 2011; 4(11):1897-1915. https://doi.org/10.3390/en4111897
Chicago/Turabian StyleZhang, Bo, Suping Peng, Xiangyang Xu, and Lijie Wang. 2011. "Embodiment Analysis for Greenhouse Gas Emissions by Chinese Economy Based on Global Thermodynamic Potentials" Energies 4, no. 11: 1897-1915. https://doi.org/10.3390/en4111897
APA StyleZhang, B., Peng, S., Xu, X., & Wang, L. (2011). Embodiment Analysis for Greenhouse Gas Emissions by Chinese Economy Based on Global Thermodynamic Potentials. Energies, 4(11), 1897-1915. https://doi.org/10.3390/en4111897