Article

Alternative Scenarios for the Development of a Low-Carbon City: A Case Study of Beijing, China

State Key Joint Laboratory of Environmental Simulation and Pollution Control, School of Environment, Beijing Normal University, Beijing 100875, China
*
Author to whom correspondence should be addressed.
Energies 2011, 4(12), 2295-2310; https://doi.org/10.3390/en4122295
Submission received: 31 October 2011 / Revised: 30 November 2011 / Accepted: 9 December 2011 / Published: 20 December 2011
(This article belongs to the Special Issue Low Carbon Transitions Worldwide)

Abstract

:
The establishment of low-carbon cities has been suggested all over the World, since cities are key drivers of energy usage and the associated carbon emissions. This paper presents a scenario analysis of future energy consumption and carbon emissions for the city of Beijing. The Long-range Energy Alternatives Planning (LEAP) model is used to simulate a range of pathways and to analyze how these would change energy consumption and carbon emissions from 2007 to 2030. Three scenarios have been designed to describe future energy strategies in relation to the development of Beijing city, namely a reference scenario (RS), control scenario (CS), and integrated scenario (IS). The results show that under the IS the total energy demand in Beijing is expected to reach 88.61 million tonnes coal equivalent (Mtce) by 2030 (59.32 Mtce in 2007), 55.82% and 32.72% lower than the values under the RS and the CS, respectively. The total carbon emissions in 2030 under the IS, although higher than the 2007 level, will be 62.22% and 40.27% lower than under the RS and the CS, respectively, with emissions peaking in 2026 and declining afterwards. In terms of the potential for reduction of energy consumption and carbon emissions, the industrial sector will continue to act as the largest contributor under the IS and CS compared with the RS, while the building and transport sectors are identified as promising fields for achieving effective control of energy consumption and carbon emissions over the next two decades. The calculation results show that an integrated package of measures is the most effective in terms of energy savings and carbon emissions mitigation, although it also faces the largest challenge to achieve the related targets.

1. Introduction

Cities are centers of high population density, economic activity, and energy consumption throughout the World. Although they occupy just 2% of the land, they account for approximately 75% of the World’s energy usage, and contribute to 80% of global greenhouse gas emissions [1,2]. In China, the 35 largest cities contain about 18% of the country’s population and contribute to 40% of the country’s energy usage and CO2 emissions [3]. Therefore, they have become hotspots and major areas where viable solutions are being sought to tackle climate change [4,5,6]. Correspondingly, new ideas and concepts associated with development models such as the sustainable city, the eco-city, and the low-carbon city have been put forward by research groups and environmental organizations as possible solutions to the issues of energy savings and emissions reduction. In fact, the idea of a low-carbon economy was first proposed in a UK White Paper on energy [7] and then supported by the Bali Roadmap. Afterwards, such concepts and policies as low-carbon development, low-carbon cities, and the low-carbon society came into being, and have been warmly welcomed and listed as a priority item on the agenda by governments around the world. A large number of municipalities have released their own low-carbon goals and plans targeting dates after 2020 (Table 1). Detailed studies of how to define, benchmark and evaluate these plans have yet to be conducted, which makes it necessary to measure their success and to compare their progress with that in other areas. Nevertheless, the low-carbon city, which integrates elements of both the low-carbon economy and the low-carbon society, provides a new model of sustainable urbanization for China directed toward ecological civilization and scientific development [8,9]. At least 100 Chinese cities have announced plans to become low-carbon cities, and have taken many different approaches.
Table 1. Long-term carbon reduction targets for cities of the world [10].
CityTarget Year (Base Year)Reduction Target (%)
Copenhagen2025 (2005)Carbon neutral
London2025 (1990)−60%
Boston2050 (1990)−80%
Melbourne2020 (1996)Carbon neutral
Sydney2050 (1990)−70%
Toronto2050(1990)−80%
Stockholm2050Carbon neutral
As the capital of China, Beijing has a large energy consumption and suffers from serious pollution. The population of Beijing exceeded 19.61 million [11] and according to the Beijing Traffic Management Bureau the civil motor vehicle fleet exceeded 4.80 million units (including 194,000 trucks and 4.26 million passenger cars) at the end of 2010 [12]. The Beijing metropolis is also characterized by a scarcity of natural resources, demonstrated by the fact that all of the natural gas and crude oil consumed by the city, as well as 95% of the coal, 64% of the electricity, and 60% of the refined oil consumed has to be imported from outside [13]. In 2009, the total energy consumption reached 65.70 Mtce [14] and, correspondingly, the per capita energy consumption was 3.74 tce, 1.6 times the national average, ranking second amongst Chinese cities, only inferior to Shanghai. The high levels of energy consumption have, in turn, resulted in high carbon emissions. The per capita CO2 emissions reached 6.91 tonnes in 2009, 1.3 times the national average. Therefore, the municipal government of Beijing is determined to create a low-carbon city in the future and has already launched a series of explorations and practical steps to meet the requirements of low-carbon development in its 11th Five-Year Plan (FYP) [15].
This paper presents energy modeling and various development scenarios as useful tools for exploring the energy and carbon emission pathways in Beijing, thus providing insights relevant to the policy of a low-carbon transition for the Beijing government. To do this, a detailed Long-range Energy Alternatives Planning (LEAP) model has been developed and applied to analyze the future trends in energy demand and carbon emissions in the city of Beijing from 2007 to 2030 under three scenarios, namely a reference scenario (RS), a control scenario (CS), and an integrated scenario (IS). We believe that our study of Beijing is of very high reference value for both the local government and the Chinese government in their efforts to make policies relevant to the development of low-carbon cities.

2. Methodology

2.1. The LEAP Model

The Long-range Energy Alternatives Planning (LEAP) system is a scenario-based modeling tool for energy analysis and climate change assessment, developed by the Stockholm Environment Institute. It designs scenarios for future energy demand and environmental impact based on how energy is consumed, converted, and produced in a given region or economy under the assumption of a range of values for parameters such as population increase, economic development, technology utilization, and inflation [16]. It has been extensively used on the local, national, and global scales to project energy supply and demand, predict the environmental impact of energy policies, and identify potential problems. For instance, LEAP was adopted for a scenario analysis of the energy consumption and CO2 emissions of the industrial, transport, and building sectors on a global scale [17]. On a national scale, researchers have employed the LEAP model to study the potential for emissions reductions and mitigation opportunities in China’s five major emission sectors [18]. At the local level, it has been used to model the total energy consumption and associated emissions of the household sector in Delhi, India [19]. It has also been widely used to study the energy and environmental impacts of the transport sector [20,21], of electricity generation [22,23], and of the utilization of biomass energy [24]. However, there have been few studies using LEAP to comprehensively evaluate the efficiency of city-level policies and measures aimed at reducing energy demand and greenhouse gas (GHG) emissions, and covering all urban sectors [6,25,26].

2.2. Calculation of Energy Consumption

The LEAP model developed for Beijing (hereafter referred to as the LEAP-Beijing model) in this study considers both the energy consumption and the energy transformation sectors, covering all major primary and secondary energy used in Beijing. The time period of the analysis spans the years 2007 to 2030, with 2007 as the base year. The driving factors of the model comprise economic growth, population size, adjustment of industrial structure, technological progress, improvements in energy efficiency, and so on. Six end-use sectors are included in the model, namely the agriculture, industry, construction, transport, commercial, and residential sectors. Depending on the characteristics of the energy demand in each sector, we have included subsectors, energy-using devices, and fuel types in the scenario modeling. For example, the transport sector is divided into three subsectors including freight, intercity passenger, and intracity passenger transport, and the household sector into urban and rural residents. The energy conversion system comprises four parts: transmission and distribute ion, electricity generation, heat supply, and combined heat and power (CHP) generation. Each part includes the process of conversion and the output. The framework for the calculation of energy consumption and carbon emissions in the LEAP model is presented below.
The total final energy consumption is calculated as follows:
E C n = i j A L n , j , i × E I n , j , i
where EC is the aggregate energy consumption of a given sector, AL is the activity level, EI is the energy intensity, n is the fuel type, i is the sector, and j is the device. The net energy consumption due to transformation is calculated as follows:
E T s = m t E T P t , m × ( 1 f t , m , s 1 )
where ET is the net energy consumption due to transformation, ETP is the energy transformation product, f is the energy transformation efficiency, s is the type of primary energy, m is the type of equipment, and t is the type of secondary energy. The carbon emission from the final energy consumption is calculated as follows:
C E C = i j n A L n , j , i × E I n , j , i × E F n , j , i
where CEC is the carbon emission, AL is the activity level, EI is the energy intensity, and EFn,j,i is the carbon emission factor for fuel type n, equipment type j, and sector i. The carbon emission from energy transformation is calculated as follows:
C E T = s m t E T P t , m × 1 f t , m , s × E F t , m , s
where CET is the carbon emission, ETP is the energy transformation product, f is the energy transformation efficiency, and EFt,m,s is the emission factor for one unit of primary fuel type s, consumed to produce secondary fuel type t using equipment type m.

2.3. Scenario Settings

A scenario is a self-consistent description of how an energy system might evolve over time under a given set of conditions. In this paper, we have chosen one reference scenario (RS) as a benchmark scenario and two other alternative scenarios, i.e., the control scenario (CS) and the integrated scenario (IS), to analyze and compare the possible effects of different low-carbon pathways with respect to energy savings and emissions mitigation. The RS represents a base case without any extra policy interventions in comparison with current conditions. It was designed according to the policies of 2007, and basically reflects the current status of economic development and emissions. The CS takes a further step to direct the future trajectory of low-carbon policy by including a mix of some planned government policies, most of which have been proposed in the government’s 12th FYP for Beijing. The IS was conceived as a comprehensive and more intensive model for the development of controls on carbon emissions. In this scenario, we assume the optimization of both the industrial structure and the energy structure, a dramatic transformation of the models of production and consumption, and further progress in reforming the socio-economic structure. The key assumption parameters of the LEAP-Beijing model for each scenario are listed in Table 2, while Table 3 lists the detailed assumptions for the IS with respect to the respective sectors and measures.
Table 2. Key assumption parameters of the LEAP-Beijing model under the three scenarios.
2007RSCSIS
202020302020203020202030
GDP annual growth rate (%)119 a7.5 b8 a6 b7 a5 b
Population (millions)16.3325.4234.1624.1731.8523.6129.93
Urbanization rate (%)85858590
Share of primary industry (%)1.0111
Share of secondary industry (%)25.5241914
Share of tertiary industry (%)73.5758085
a GDP annual growth rate for the time period 2010–2020; b GDP annual growth rate for the time period 2020–2030.
Table 3. Description of alternative policies assumed in the IS.
SectorPolicy or MeasureAssumptions
IndustryEnergy efficiencyThe energy efficiency of the main energy-consuming industrial equipment (furnaces, motors, etc.) will increase to 25% by 2030.
Energy substitutionSome of the coal and fuel oil used in industry will be replaced by natural gas, accounting for 60% and 30% replacement, respectively.
TransportTraffic modal shiftThe contribution of mass transit to passenger capacity will reach 78% in 2030.
Vehicle fuel efficiencyThe fuel efficiency of vehicles will increase to 25% by 2030.
Energy substitutionHybrid and hydrogen-fuel-cell taxis will substitute for conventional taxis, for up to 43.5% and 8%, respectively, of the fleet.
Buses fueled by compressed natural gas (CNG) and clean fuels (including hybrid, hydrogen-fuel-cell, and electric buses) will substitute for conventional buses, for up to 40% and 18%, respectively, of the fleet.
Private cars fueled by diesel, CNG, and clean fuels (including hybrid, hydrogen-fuel-cell, and electric cars) will substitute for up to 10%, 10%, and 47%, respectively, of conventional cars.
Commercial/residentialEnergy-efficient appliancesConventional household appliances will be replaced by energy-efficient ones (e.g., the energy savings from efficient air-conditioning will reach 40%) by 2030.
The efficiency of electrical equipment in public buildings will be increased by 30%.
Heat supplyThe energy intensity of heat supply will be decreased by 35% by 2030.
Behavioral change10% energy savings will be achieved by 2030, driven by behavioral change.
Energy supplyCHPThe proportion of CHP plants will be increased (to an installed capacity of 14,890 MW in 2030, accounting for 80% of the total capacity), and natural-gas-fueled plants will account for 80%.
Electricity generationNew and renewable energy sources, such as solar power, wind power, and biomass power, will be developed and installed up to a capacity of 1050 MW in 2030.
The total and sectoral energy data for the base year 2007 were obtained from the Statistical Yearbook of Beijing and the survey data of government departments, including the Beijing Development and Reform Commission, the Beijing Transportation Bureau, the Beijing Statistical Bureau, and the National Energy Administration of China. The driving variables and the basic social and economic data were determined from government and special-sector planning documents, and reports from academic institutions in various sectors, e.g., the Beijing 12th FYP; the Beijing Overall Urban Planning (2004–2020), Energy-Saving in Long-term Special Program; and the Outline of Beijing Traffic Development (2004–2020). The core task in producing the scenario definitions was to identify trends in technology development and to choose values for the proportions of specific technologies. Our scenario settings are primarily based on the information contained in these documents. Some other related studies have given us abundant inspiration and information [27,28,29,30,31,32,33,34].

3. Results and Discussion

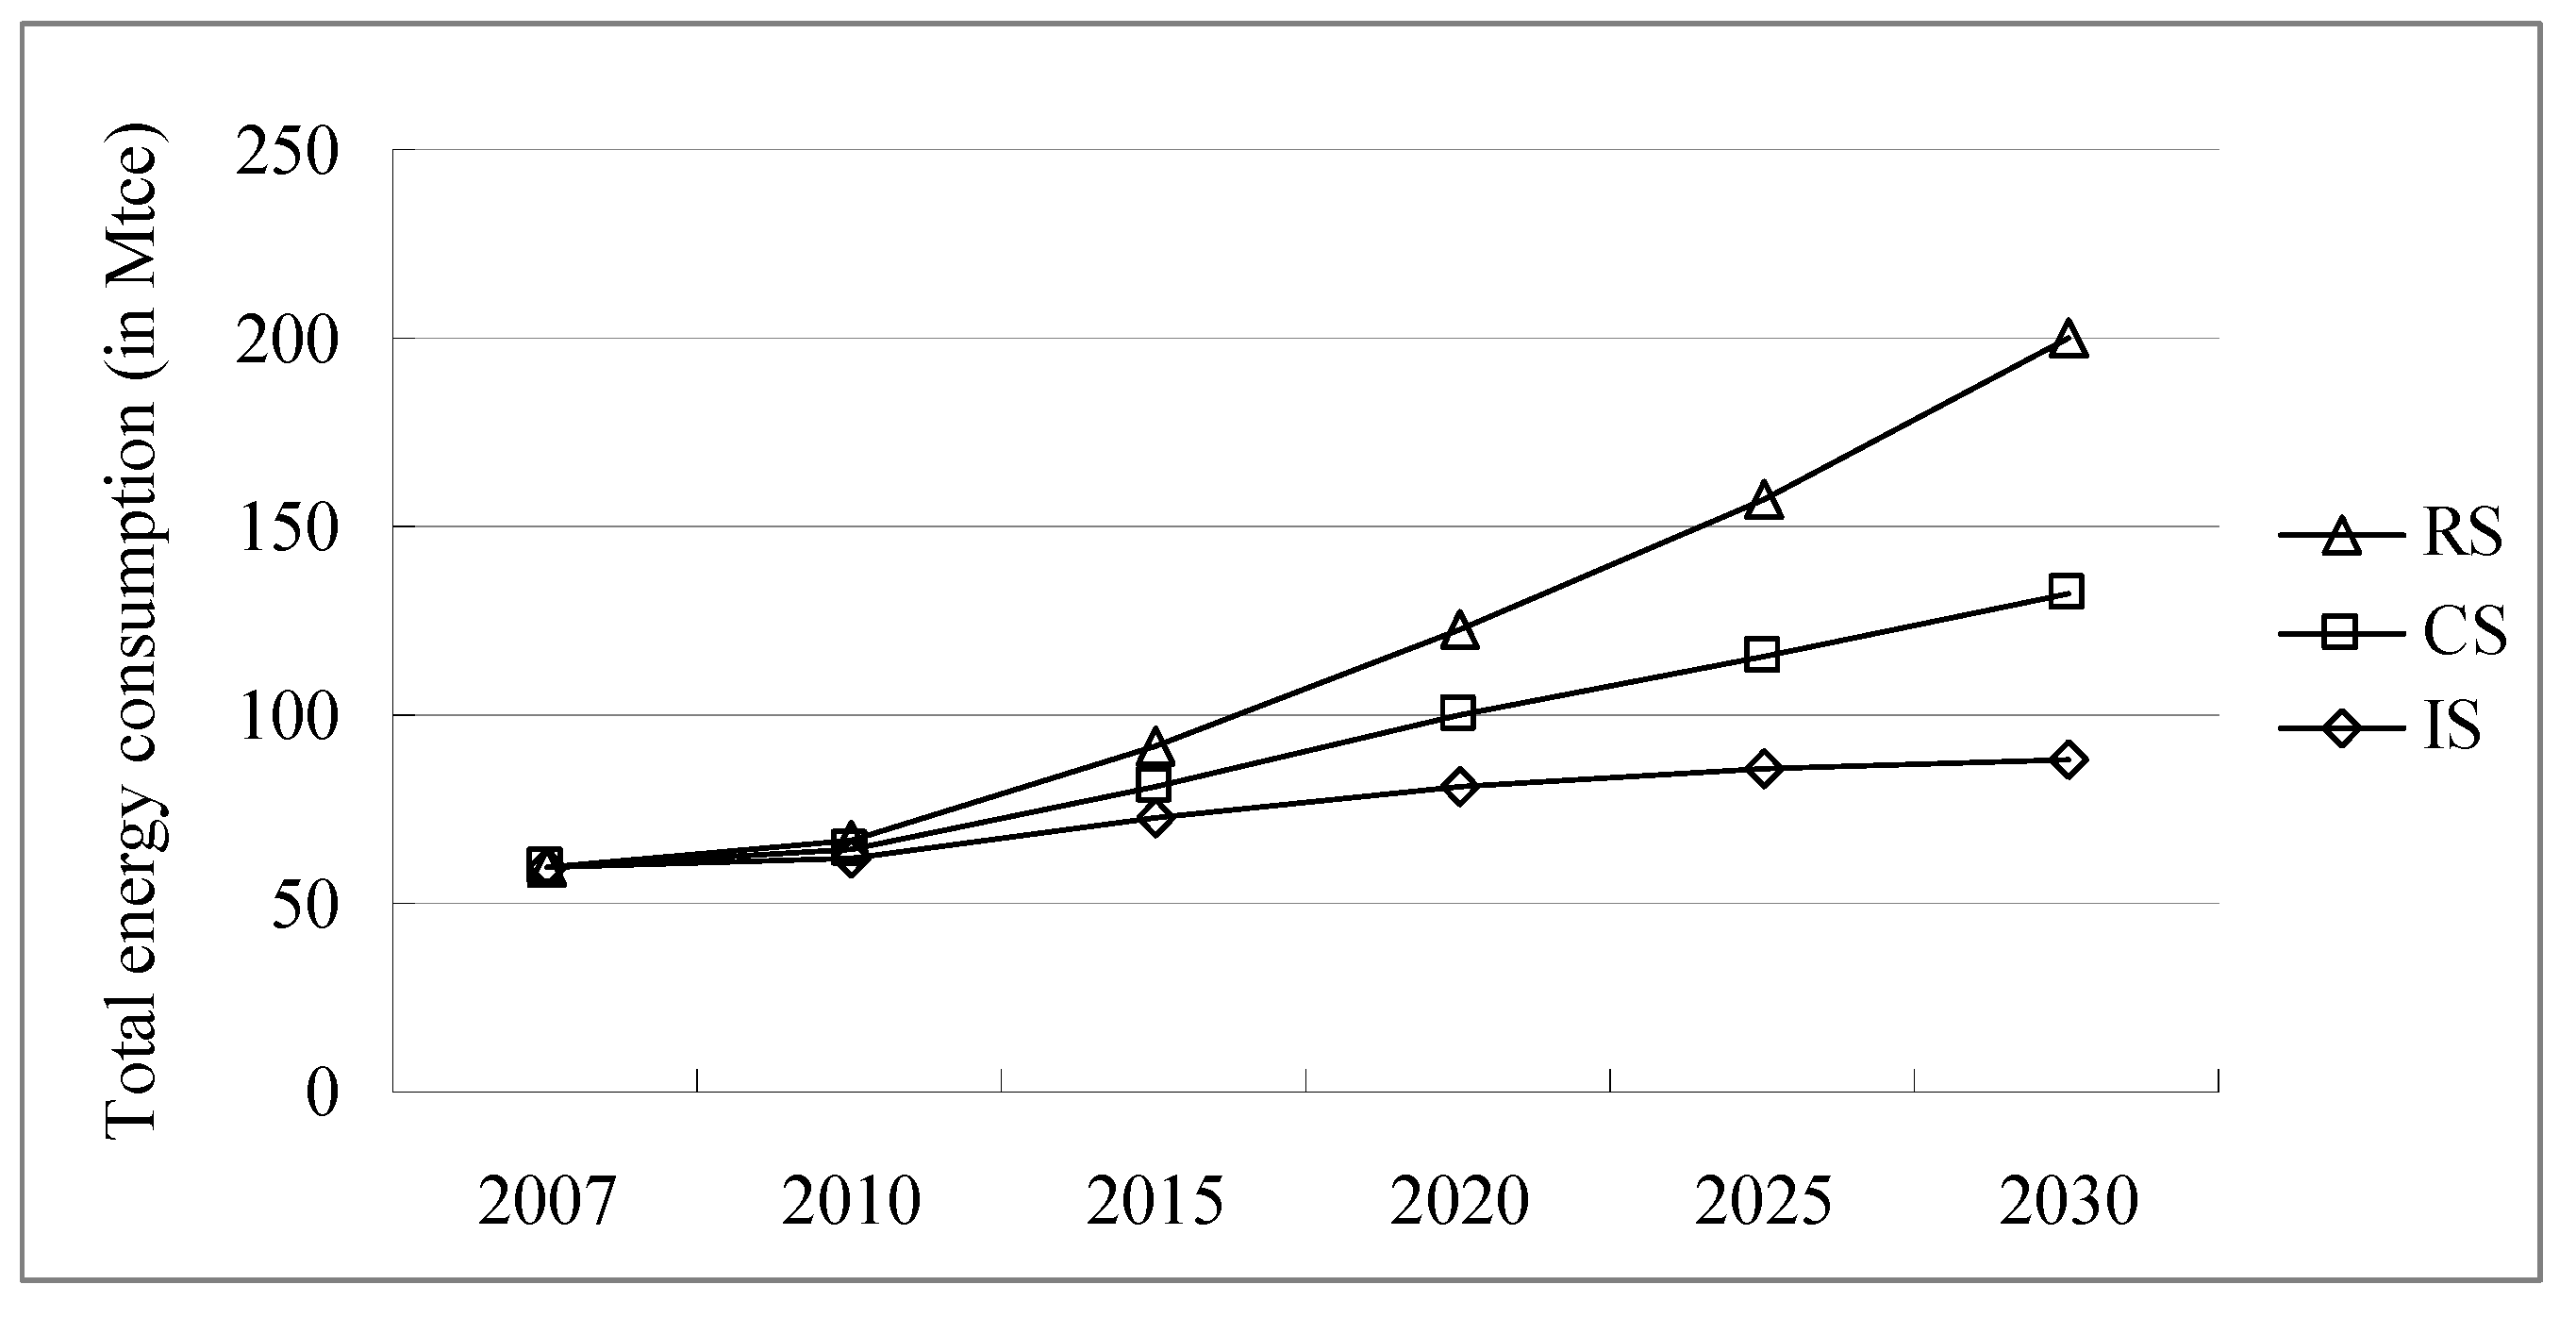
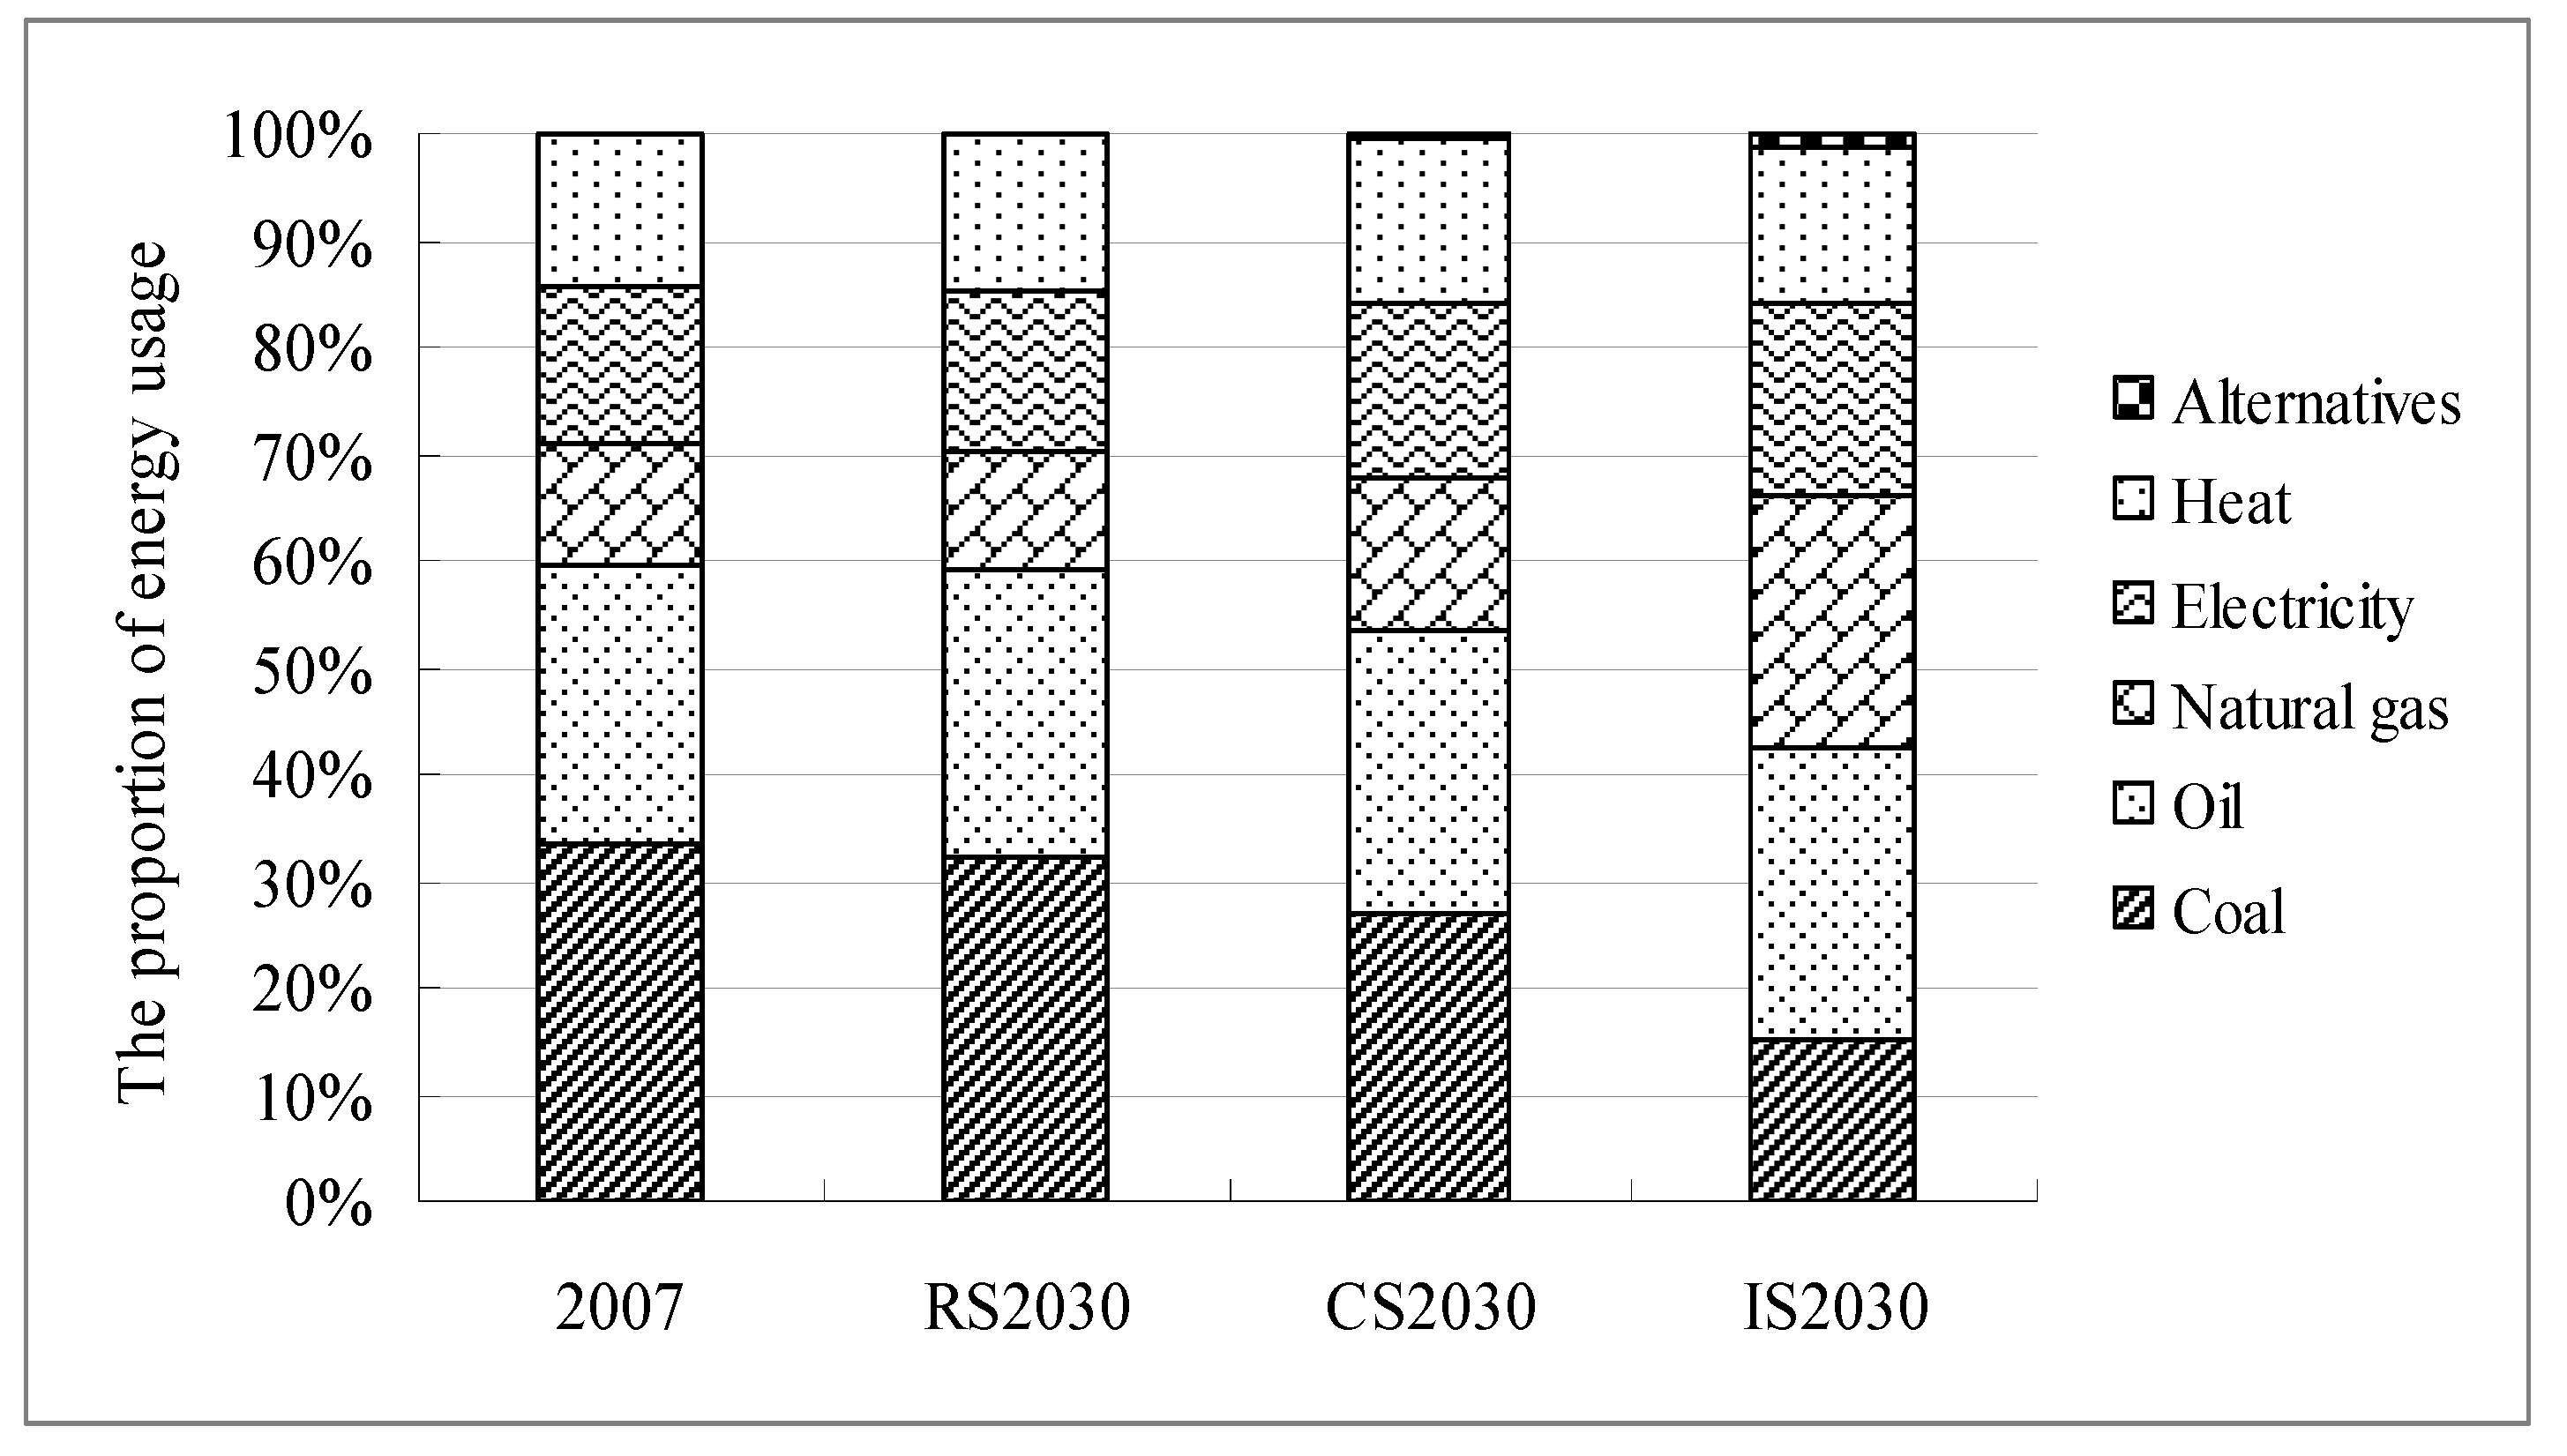
3.1. Energy Consumption

Based on the assumptions about socio-economic development in Beijing and the various parameters listed in Section 2.3, the values of the total energy consumption predicted by the LEAP-Beijing model for the RS, CS, and IS from 2007 to 2030 are shown in Figure 1. On the whole, energy consumption will increase steadily up to 2030 under each scenario, but with different growth rates. The energy consumption under the RS will reach 200.56 Mtce in 2030, with an annual growth rate of 5.44%, the highest amongst the three scenarios. Owing to a series of energy-saving and emissions reduction policies and measures, the growth rate of the total energy consumption will be slower under the CS than under the RS, i.e., energy consumption will be 131.70 Mtce with a 3.53% annual growth rate in 2030. As expected, under the IS, the growth rate of energy consumption is reduced significantly to 1.76%, resulting a total consumption of 88.61 Mtce, much less than that under the RS.
Figure 1. Energy consumption under the three scenarios from 2007 to 2030.
Energies 04 02295 g001
Correspondingly, the energy consumption intensity, measured by consumption per unit GDP, will reduce from 0.67 tce/10,000 yuan in 2007 to 0.32 tce/10,000 yuan and 0.26 tce/10,000 yuan in 2030 for the RS and CS, respectively (Table 4). Therefore, the annual rate of decrease of the energy intensity is 3.16% for the RS and 4.03% for the CS. Importantly, under the IS, the energy intensity will decrease to 0.22 tce/10,000 yuan, with an average annual rate of decrease of 4.73%. Certainly, the IS has the largest capability for energy savings and emissions reductions in terms of slowing down the growth rate, although it does not achieve a real decline in total energy consumption.
Table 4. Final energy consumption intensity for the RS, CS, and IS (units: tce/10,000 yuan).
Scenario200720202030
RS0.670.400.32
CS0.670.360.26
IS0.670.320.22
The elasticity coefficient of energy consumption is the ratio of the growth rate of energy consumption to the growth rate of GDP. The values for the three scenarios are shown in Table 5. Under the RS, the elasticity coefficient will be 0.67–0.70, basically in agreement with the value for 2007, indicating that economic development will still depend heavily on energy. Under the CS, it will be 0.48–0.56, a little higher than that for Germany and the USA, suggesting that Beijing will still have room for improvement in energy efficiency. Finally, under the IS, the elasticity coefficient will fall to 0.17–0.39, implying that Beijing would have achieved steady economic growth strongly decoupled from energy consumption.
Table 5. Elasticity coefficient of energy consumption for the RS, CS, and IS.
ScenarioTime PeriodAnnual Growth Rate of Energy ConsumptionAnnual Growth Rate of GDPElasticity Coefficient of Energy Consumption
RS2010–20206.27%9%0.70
2020–20305.04%7.5%0.67
CS2010–20204.44%8%0.56
2020–20302.85%6%0.48
IS2010–20202.71%7%0.39
2020–20300.87%5%0.17
The structural changes in energy usage in 2030 under the three scenarios are shown in Figure 2. It is apparent that under the RS, the energy usage structure will remain nearly the same as that in 2007, while under the CS, coal and oil will still dominate the final energy consumption system, although the proportion of natural gas will increase. In contrast, under the IS, the proportion of coal consumption will decrease to 15.06%, i.e., 16.98% and 11.73% lower than the values for the RS and the CS, respectively. Moreover, the proportion of clean energy usage, including electricity, heat, and natural gas, will increase rapidly, reaching a total of 57.75% in 2030, nearly 1.5 times higher than the 2007 value. Overall, under the IS, the energy usage structure will gradually become environmentally friendly in Beijing, with rapid growth in the use of alternative clean energy. This, in turn, will play an important role in the mitigation of carbon emissions (see Section 3.2).
Figure 2. Structure of final energy usage under the RS, CS, and IS in 2030.
Energies 04 02295 g002

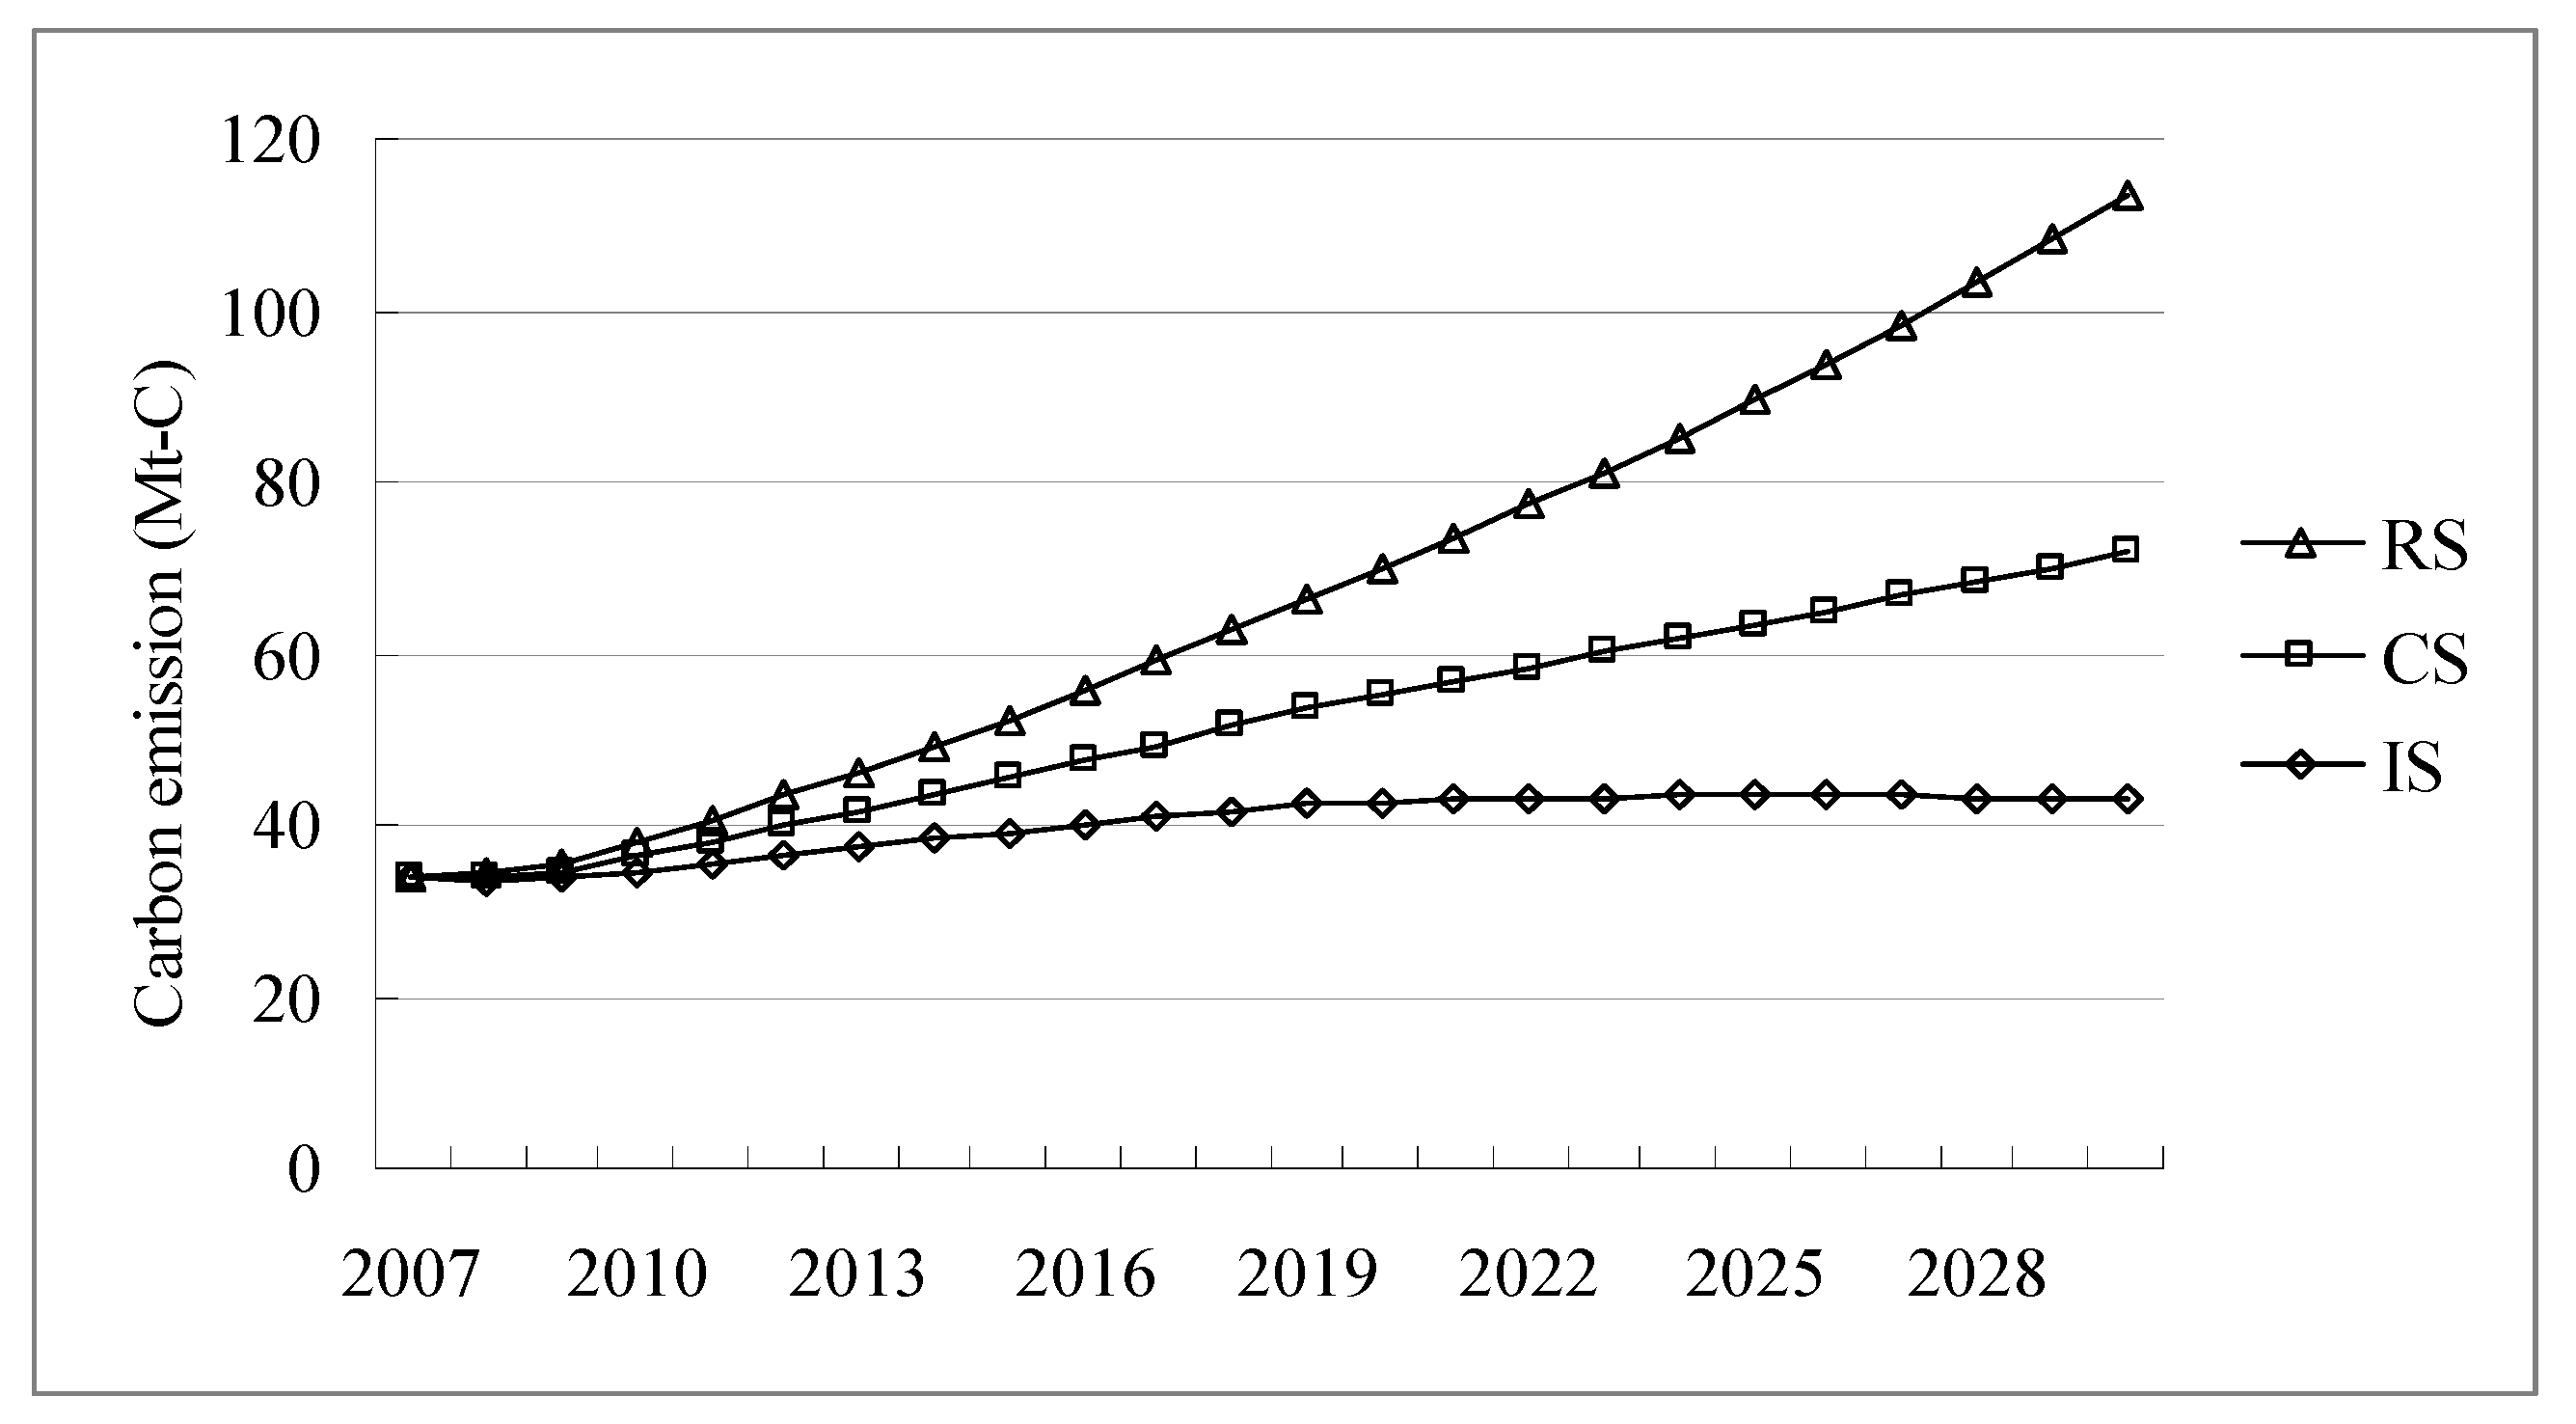
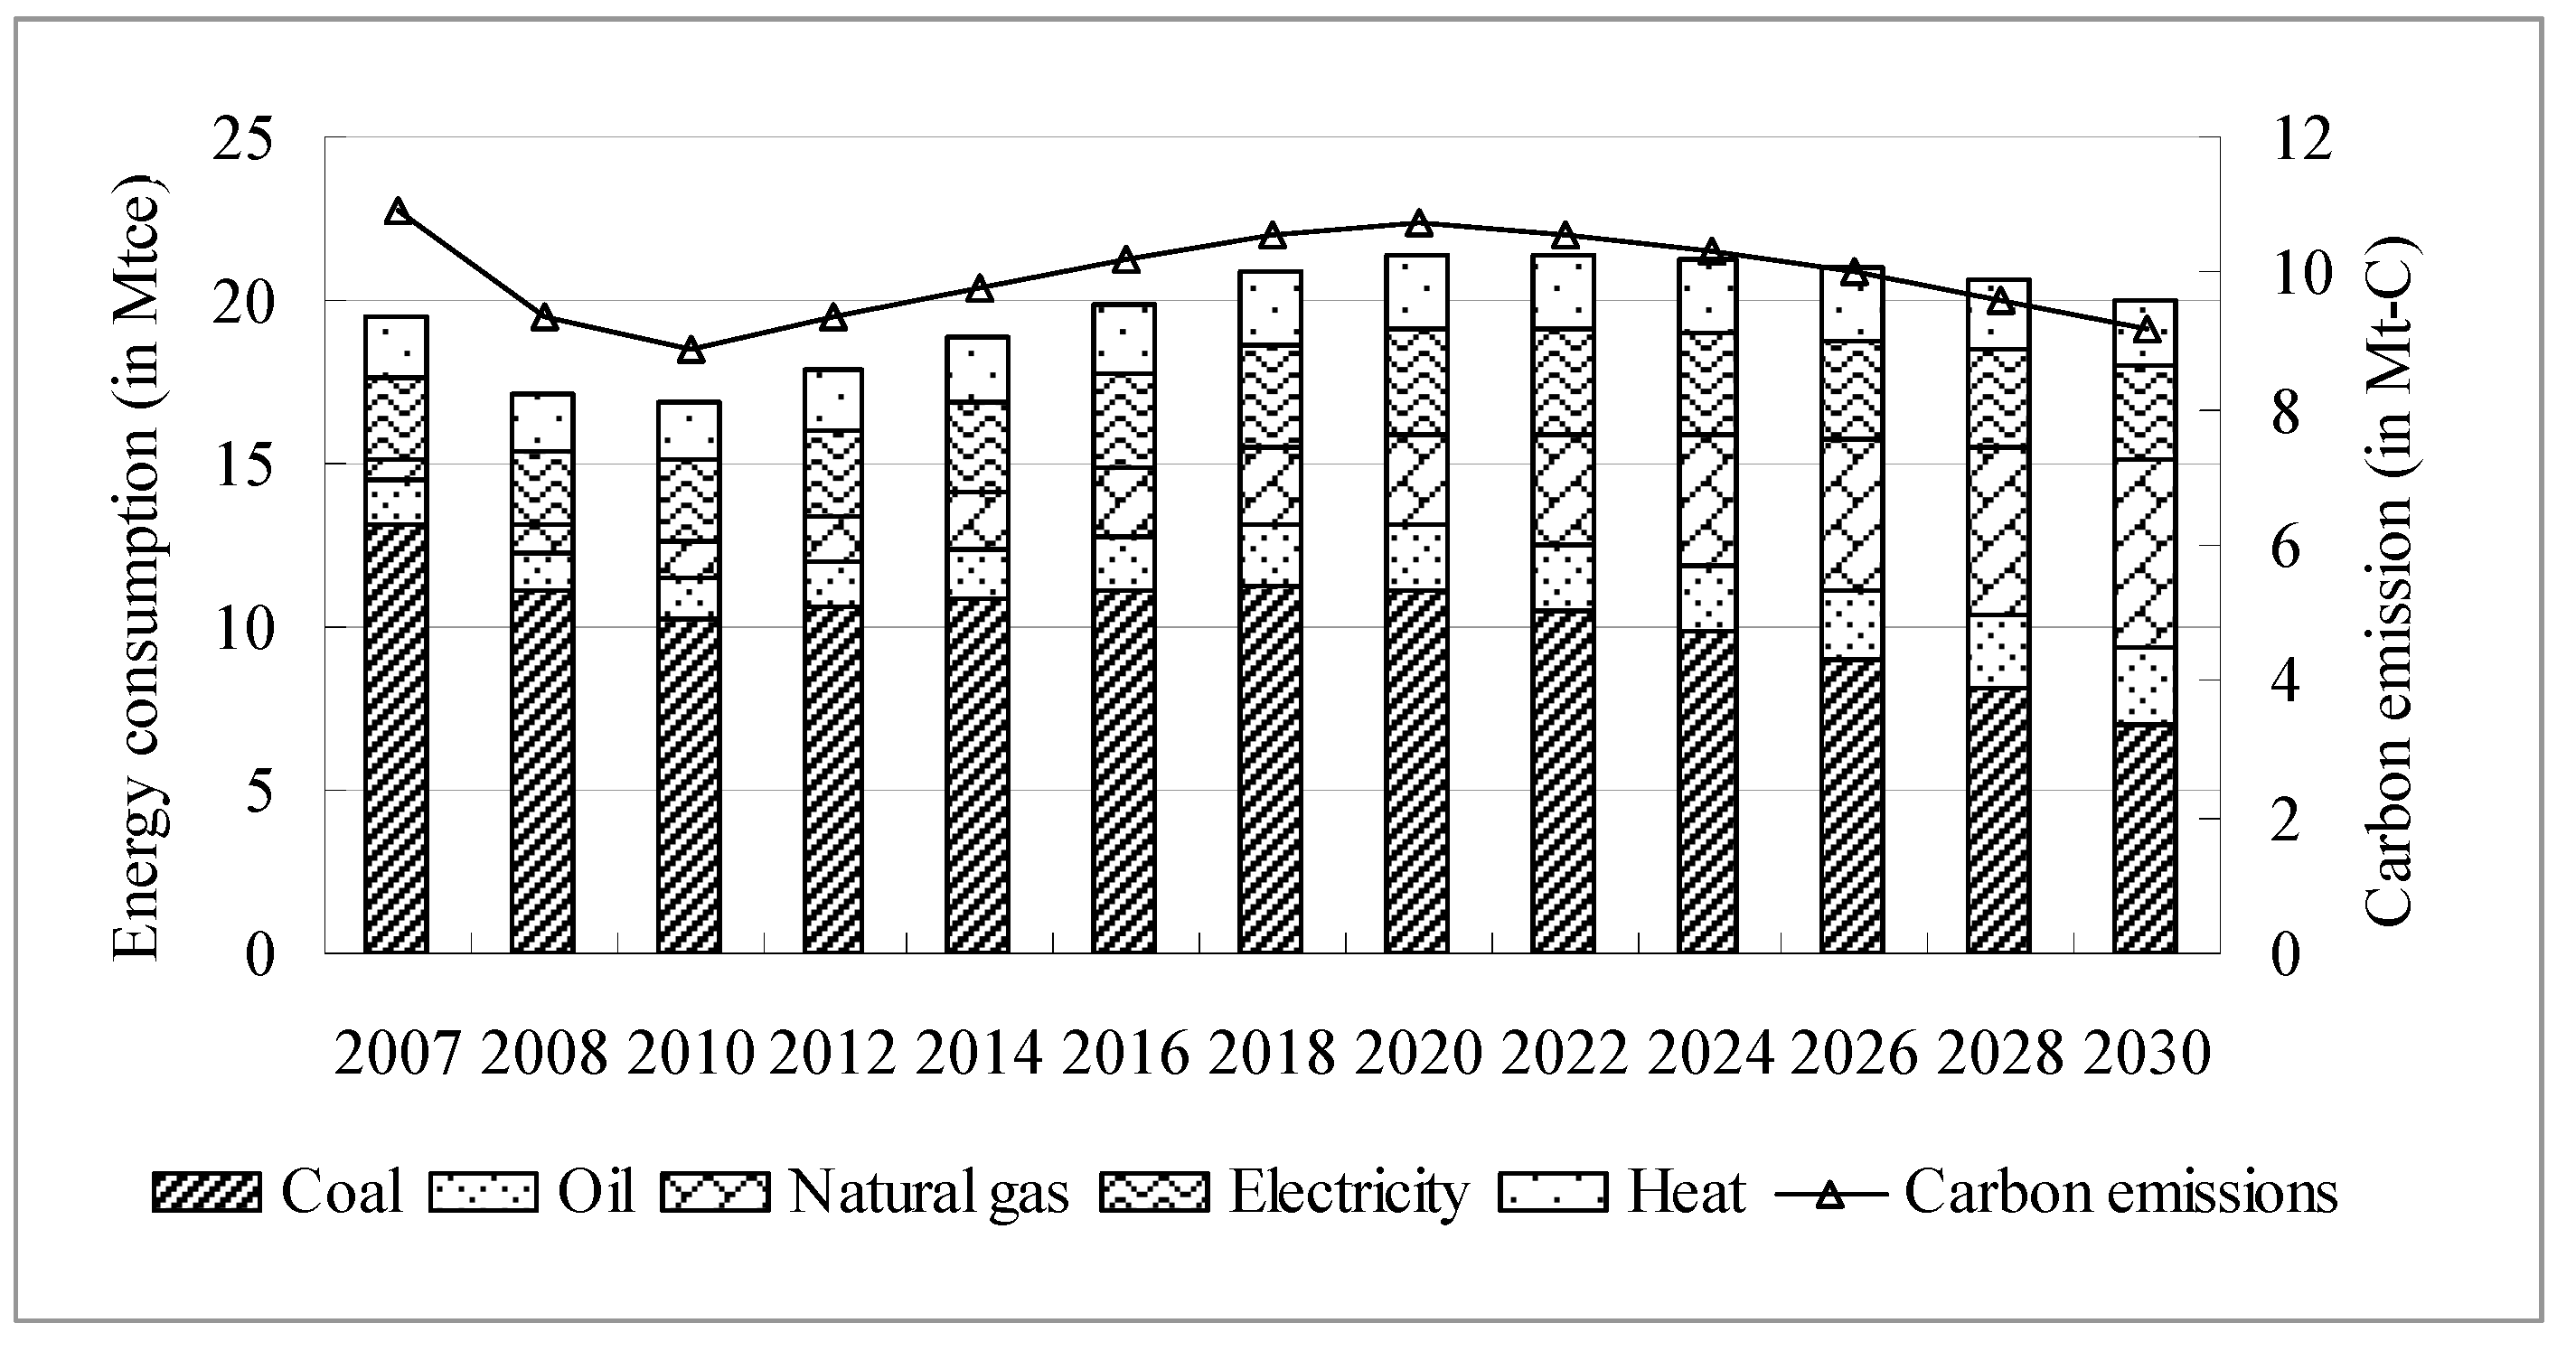
3.2. Carbon Emissions

Figure 3 shows the carbon emissions performance under the three scenarios from 2007 to 2030. Under the RS, carbon emissions will increase from 34.10 million tonnes C (hereafter abbreviated to Mt-C) in 2007 to 113.57 Mt-C in 2030 with an annual growth rate of 5.37%. The rate of carbon emission can be correlated directly to the rate of energy consumption that will be observed in this scenario (compared with Figure 1). Under the CS, emissions will increase to 71.84 Mt-C in 2030 at a significantly lower annual rate of 3.29%, which is in line with the total energy consumption trend predicted for the CS in Figure 1. However, under the IS, the emissions will reach a peak value of 43.34 Mt-C in 2026 at a rate of 1.27%, and then gradually decrease. This turning point in the carbon emissions is probably due to optimization of the energy structure and the introduction of clean energy, which is positive signal toward building a low-carbon city within the period considered in this study.
The per capita carbon emissions under the three scenarios are presented in Table 6. With regard to this indicator, a turning point occurs under both the CS and the IS. The per capita carbon emissions will reach a peak value of 2.29 t-C in 2022 and then decrease under the CS, while under the IS, they decrease steadily from 2.09 t-C in 2007 to 1.43 t-C in 2030.
Figure 3. Carbon emissions under the three scenarios from 2007 to 2030.
Energies 04 02295 g003
However, under the RS, this value will be 3.32 t-C in 2030, up 1.6-fold from the 2007 value, with an average annual growth rate of 2.03%. Reports show that China’s per capita carbon emissions were 1.85 t-C in 2010, while the per capita emissions levels of the United States, Australia, and the EU-27 countries were 4.61 t-C, 4.91 t-C, and 2.21 t-C, respectively [35]. Although Beijing’s per capita carbon emissions are currently higher than the national average, they are still significantly lower than those of the United States and many developed countries, and are relatively close to those of Europe.
Table 6. Per capita carbon emissions under the three scenarios (units: t-C/person).
Scenario200720202030
RS2.092.753.32
CS2.092.282.26
IS2.091.811.43
Table 7 shows the carbon emission intensity values under the three scenarios considered in this paper, which all present an overall declining trend, with average annual rates of 2.84%, 3.73%, and 5.05% for the RS, CS, and IS, respectively. Moreover, this study predicts that the carbon emission intensity for 2020 will be reduced by 42.86% compared with the 2005 level under the CS, and by 51.43% under the IS. At local level, this achieves the target set by the Chinese government at the 2009 Copenhagen Climate Conference, where it promised to reduce GHG emissions per unit GDP by 40–45% by 2020 compared with the 2005 level [36].
Table 7. Carbon emission intensity under the three scenarios (units: t-C/10,000 yuan).
Scenario200720202030
RS0.350.230.18
CS0.350.200.14
IS0.350.170.11

3.3. Potential of Each Sector for Reduction of Energy Consumption and Carbon Emissions

Taking the RS as a reference, the total energy consumption and carbon emissions of each sector were analyzed to determine the potential for reduction under the CS and IS (Table 8). The results show that the industrial sector will have the largest potential for energy savings, followed by the commercial and residential sector. Correspondingly, the industrial sector will also be the biggest contributor in terms of carbon emissions reductions, followed by the energy transformation sector. In contrast, the contribution of the transport sector to energy savings and emissions reductions will be low under all scenarios. Under the CS and IS, the transition that will occur in the development of the industrial sector as a result of strong policies and measures will have a far-reaching influence on energy consumption and on carbon emissions.
Table 8. Comparison of potential for energy savings and carbon emissions reductions during the period studied.
CS, Compared with RSIS, Compared with RS
Reduction in total consumption (Mtce)68.86111.95
Contributions of each sector
Industry48.77%46.21%
Transport15.95%14.26%
Commercial and residential23.94%29.98%
Energy transformation12.10%9.55%
Reduction in carbon emissions (Mt-C)41.7370.66
Contributions of each sector
Industry43.60%40.09%
Transport14.59%19.11%
Commercial and residential16.36%13.76%
Energy transformation25.45%27.04%
Figure 4 shows the variation of the energy structure of the industrial sector under the IS during the period studied.
Figure 4. Energy consumption of the industrial sector under the IS, 2007–2030.
Energies 04 02295 g004
The total energy consumption of the industrial sector will peak in 2020, after which the energy structure will change dramatically, with declining coal usage and increasing utilization of natural gas. However, even under the scenario of integrated development, the industrial sector will account for 25% of the total energy consumption and 23% of carbon emissions in 2030. Hence, this sector will continue to be the focus of much attention with regard to energy savings and emissions reductions in Beijing.
Notably, with accelerated urbanization and improvement of living standards in Beijing, the energy consumption of the building and transport sectors is predicted to increase greatly in the future, directly affecting total energy consumption and the energy structure. Therefore, it is not surprising to find that in 2030 the contribution of the building sector to energy savings will reach 23.94% and 29.98% under the CS and IS, respectively, second only to the industrial sector. Moreover, under the CS and IS, the contribution of the transport sector to carbon emissions reductions by 2030 will be 14.59% and 19.11%, so that this sector will play an important role in the low-carbon development of Beijing. The contribution of the transport sector will gradually increase through traffic mode optimization and technological progress in the form of clean-fuel vehicles and improvements in fuel efficiency. The energy transformation sector shows great potential for carbon abatement, owing to the rapid development of CHP and the transition from coal to natural gas, as represented in Table 3.

3.4. Discussion

As a prominent global city, Beijing will be under pressure to reduce its carbon emissions, or at least reduce the rate of growth, by a large amount. Among the three scenarios, the control scenario will achieve some amelioration, with a reduction of 37% compared with the reference scenario. Under the integrated scenario, the emissions will be 62% lower than under the reference scenario, peaking in 2026 and then leveling off. Obviously, the IS shows a favorable development trajectory toward a low-carbon transition for Beijing, demonstrating that more carbon emissions cutbacks are possible by implementing additional plans and policies. Specific measures can be recommended for certain sectors to sustain low-carbon development.
For the industrial sector, optimization of the production structure and improvements in energy efficiency are essential to achieving a low carbon footprint; this can be promoted by energy auditing in major energy-consuming enterprises. Although it is difficult to implement on a short timescale, natural-gas substitution will play an important role in the reduction of industrial emissions. Moreover, financial policies such as energy-saving funds, subsidies, and financial incentives will help to promote enterprise transformation.
For the commercial and residential sectors, the emphasis should be on improving the efficiency of space heating and reducing electricity consumption by appliances, lights, and office equipment inside buildings. An energy-efficient-design code for civil buildings has been adopted in Beijing, with an ongoing code for 65% savings and a code for 75% savings under development. Two specific measures should be adopted to reduce electricity consumption in buildings: one is the implementation of efficiency standards and labels to encourage the production of efficient appliances and office equipment, and the other is subsidies for customers to purchase and use efficient appliances.
For the transport sector, the use of public transit, including subways, light rail, and bus rapid transit (BRT) systems, should be encouraged; this can be done by controlling the number of private cars. In fact, the Beijing government has already announced a policy of a license plate lottery to “put a brake” on cars. Also, the implementation of alternative vehicle fuels such as CNG, electricity, and hydrogen will reduce the dependence on carbon-containing fuels, although there is still a large gap between mastering the technologies and making those technologies affordable.
In terms of the energy supply sector, the implementation of CHP measures will enhance fuel efficiency. The modification of coal-fired heating and power plants to run on natural gas, and the development of new and renewable energy sources such as solar and wind energy should be promoted; this will lead to the diversification of the structure of power sources and reduce carbon emissions.
To gain further insight into low-carbon development pathways, we can compare the above results with the results of parallel studies of low-carbon scenarios for Jilin City [37] and the whole of China [38,39,40,41,42,43,44,45,46,47]. In the case study of Jilin City, the emissions under the low-carbon scenario will reach their peak value around 2020 and decline to 60% of the value under the business-as-usual scenario by 2030; in the study of China, the emissions under an enhanced low-carbon scenario will decline by an obvious amount after 2030. It is an encouraging breakthrough that China and some Chinese cities are promising to achieve absolute cuts in emissions levels on the way to a low-carbon transition, but we still need 10 to 20 years to achieve such goals.
Even so, we cannot judge in a simple way whether or not a city will achieve the goal of constructing a low-carbon city. In our understanding, “low-carbon” is a future direction or model of development to be pursued, not a point that we need to reach, although we need a goal point that will push our efforts toward low-carbon development and allow us to periodically test those efforts. A city’s low-carbon target is dynamic and needs to be adjusted constantly at various stages of development. It should be noted that the scenarios presented in this paper are not being suggested as the most likely or the most desirable scenarios. Instead, they have been chosen to explore alternative low-carbon development futures for Beijing, providing policy-relevant insights into the changes that might be required on the way to the low-carbon transition.

4. Conclusions and Policy Implications

In this study, three alternative scenarios were conceived to check different low-carbon development pathways for Beijing from 2007 to 2030 using the LEAP modeling tool. The results show that the choice of the development model adopted by the city will have a significant impact on energy consumption and carbon emissions.
Under the reference scenario, the energy demand in 2030 will be 3.2 times that of 2007, with a corresponding increase in carbon emissions, i.e., 3.3 times that of 2007, which could definitely create an enormous burden on the energy supply and carbon mitigation systems; this stresses the urgent need for energy savings and emissions reductions. Under the control scenario, the energy demand and carbon emissions in 2030 will be lower than under the RS by 34.33% and 36.74%, respectively. Under the integrated scenario, the energy demand and carbon emissions in 2030 will be 55.82% and 62.22% lower, with carbon emissions peaking in 2026 and then leveling off. Thus, to bring about such large reductions, policy constraints and technological measures alone are not sufficient, although they have played a major role in reducing energy demand and mitigating carbon emissions in Beijing. A transition in the development model is essential, besides government policy interventions to promote energy savings and carbon emissions reductions.
The proportion of coal will decrease to only 15.06% of the final energy consumption in 2030 under the IS, in contrast to a contribution of 32.04% and 26.79% to the total energy consumption under the RS and the CS, respectively. Moreover, clean and efficient energy will account for 57.75% of the 2030 energy consumption under the IS, 16.93% and 11.25% higher than under the RS and the CS, respectively. Since the carbon contents of the various energy types differ, an optimization of the energy structure focusing mainly on a shift from coal to high-quality energy (natural gas and electricity), as in the IS, will play a key role in the carbon emissions of Beijing.
This study also shows that the industrial sector will make the greatest contribution to energy savings in Beijing, followed by the commercial and residential sector. In terms of carbon abatement, the industrial sector shows the greatest potential, followed by the energy transformation sector, with the contribution of the transport sector continuously increasing. Overall, while the industrial sector is the key area for low-carbon development in Beijing, the building and transportation sectors are also identified as promising fields for achieving effective energy control over the next few decades.
It can be concluded that the implementation of low-carbon development strategies could not only alleviate the pressures caused by energy demand and carbon emissions, but also bring about multiple positive effects with respect to environmental protection (by reduction in the emissions of air pollutants such as SO2, NOx, CO, PM10, PM2.5, and VOCs) in Beijing. However, we should not ignore the other side of the coin; this path faces many challenges. For example, the use of clean energy in the IS will impose increased pressure on the energy supply system, especially because of the need to increase the supply of natural gas and electricity in Beijing, and will require a concurrent development of the supply infrastructure. Additionally, the IS requires a huge capital investment. As shown during the period of the 11th Five-Year Plan, the cost of carbon abatement in China is about 94 yuan per tonne, which makes cost information an important consideration when devising climate policies.
Nevertheless, several policy implications can be obtained from the results of this study. First, it is essential for Beijing to transform its economic and social development pattern and set out on a path of balanced and sustainable development, which will in turn have a positive impact on Beijing’s future energy conservation and carbon reduction. Second, it is imperative to establish energy and environmental policies in favor of cleaner energy as early as possible to accelerate the changes in energy structure required to support sustainable economic development. Third, a comprehensive low-carbon development mode is the right choice for the city of Beijing in the later stages of industrialization; this should cover almost all fields, from energy supply to energy consumption, including the development and utilization of new energy sources, green buildings, sustainable transport, and low-carbon consumption patterns.

References

  1. International Energy Agency. World Energy Outlook 2008; Head of Communication and Information Office: Paris, France, 2008. [Google Scholar]
  2. C40 Cities Climate Leadership Group. Cities and Climate Change. 2009. Available online: http://www.c40cities.org/climatechange.jsp (accessed on 26 September 2011).
  3. Dhakal, S. Urban energy use and carbon emissions from cities in China and policy implications. Energy Policy 2009, 37, 4208–4219. [Google Scholar] [CrossRef]
  4. UN-HABITAT. Hot Cities: Battle-Ground for Climate Change. 2011. Available online: http://www.unhabitat.org/downloads/docs/GRHS2011/P1HotCities.pdf (accessed on 26 September 2011).
  5. Zhang, L.X.; Yang, Z.F.; Liang, J.; Cai, Y.P. Spatial variation and distribution of urban energy consumptions from cities in China. Energies 2011, 4, 26–38. [Google Scholar] [CrossRef]
  6. Phdungsilp, A. Integrated energy and carbon modeling with a decision support system: Policy scenarios for low-carbon city development in Bangkok. Energy Policy 2010, 38, 4808–4817. [Google Scholar] [CrossRef]
  7. Department of Trade and Industry. UK Energy White Paper: Our Energy Future—Creating a Low Carbon Economy; Department of Trade and Industry: London, UK, 2003. [Google Scholar]
  8. Wang, J.N.; Cai, B.F.; Liu, L.C.; Cao, D. Research and Practice of Low Carbon Society in China. 2010. Available online: http://www.caep.org.cn/english/paper/Research-and-Practice-of-Low-Carbon-Society-in-China-20100827.pdf (accessed on 26 September 2011).
  9. Liu, Z.L.; Dai, Y.X.; Dong, C.G.; Qi, Y. Low carbon city: Concepts, international practice and implications for China. Urban Studies 2009, 16, 1–7. (in Chinese). [Google Scholar]
  10. Lechtenböhmer, S. Paths to a Fossil CO2-free Munich. In 100% Renewable: Energy Autonomy in Action; Droege, P., Ed.; Earthscan: London, UK, 2009; p. 88. [Google Scholar]
  11. 6th National Population Census Committee. Beijing’s Sixth National Population Census Data Bulletin 2010; 2011. Available online: http://www.bjstats.gov.cn/rkpc_6/pcsj/201105/t20110506_201580.htm (accessed on 9 October 2011).
  12. Beijing Statistical Yearbook, 2011; China Statistics Press: Beijing, China, 2011. (in Chinese)
  13. Li, Z.; Tong, L.Z.; Sun, J. Analysis of energy consumption in Beijing. China’s Foreign Trade 2010, 1, 58–61. [Google Scholar]
  14. Beijing Statistical Yearbook, 2010; China Statistics Press: Beijing, China, 2010. (in Chinese)
  15. Yang, Y.F.; Li, X.L.; Zheng, H.X. Analysis on Beijing’ Low-Carbon City Evaluation Index System. In Education and Management; Zhou, M., Ed.; Springer: Heidelberg, Germany, 2011; Volume 210, pp. 163–169. [Google Scholar]
  16. SEI. User Guide, LEAP: Long Range Energy Alternative Planning System; Stockholm Environment Institute: Boston, MA, USA, 2008. [Google Scholar]
  17. Priece, L.; de la Rue, S.; Sinton, J. Sectoral trends in global energy use and greenhouse gas emissions. Energy Policy 2008, 36, 1386–1403. [Google Scholar] [CrossRef]
  18. Cai, W.J.; Wang, C.; Chen, J.N.; Wang, K.; Zhang, Y.; Lu, X.D. Comparison of CO2 emission scenarios and mitigation opportunities in China’s five sectors in 2020. Energy Policy 2008, 36, 1181–1194. [Google Scholar] [CrossRef]
  19. Kadian, R.; Dahiya, R.P.; Garg, H.P. Energy-related emissions and mitigation opportunities from the household sector in Delhi. Energy Policy 2007, 35, 6198–6211. [Google Scholar] [CrossRef]
  20. Dhakal, S. Implications of transportation policies on energy and environment in Kathmandu Valley, Nepal. Energy Policy 2006, 31, 1748–1760. [Google Scholar]
  21. Pradhan, S.; Ale, B.B.; Amatya, V.B. Mitigation potential of greenhouse gas emission and implications on fuel consumption due to clean energy vehicles as public passenger transport in Kathmandu Valley of Nepal: A case study of trolley buses in Ring Road. Energy 2006, 31, 1748–1760. [Google Scholar] [CrossRef]
  22. Zhang, Q.Y.; Tian, W.L.; Wei, Y.M.; Chen, Y.X. External costs from electricity generation of China up to 2030 in energy and abatement scenarios. Energy Policy 2007, 35, 4295–4304. [Google Scholar] [CrossRef]
  23. Shin, H.; Park, J.; Kim, H.; Shin, E. Environmental and economic assessment of landfill gas electricity generation in Korea using LEAP model. Energy Policy 2005, 33, 1261–1270. [Google Scholar] [CrossRef]
  24. Kumar, A.; Bhattacharya, S.C.; Pham, H.L. Greenhouse gas mitigation potential of biomass energy technologies in Vietnam using the long range energy alternative planning system model. Energy 2003, 28, 627–654. [Google Scholar] [CrossRef]
  25. Gielen, D.; Chen, C.H. The CO2 emission reduction benefits of Chinese energy policies and environmental policies: A case study for Shanghai, period 1995–2020. Ecol. Econ. 2001, 39, 257–270. [Google Scholar] [CrossRef]
  26. Lin, J.Y.; Cao, B.; Cui, S.H.; Wang, W.; Bai, X.M. Evaluating the effectiveness of urban energy conservation and GHG mitigation measures: The case of Xiamen city, China. Energy Policy 2010, 38, 5123–5132. [Google Scholar] [CrossRef]
  27. Zhou, D.D. China Sustainable Energy Scenario in 2020; China Environmental Science Press: Beijing, China, 2003. (in Chinese) [Google Scholar]
  28. Energy Research Institute, NDRC. China’s Low Carbon Development Pathways by 2050: Scenario Analysis of Energy Demand and Carbon Emissions; China Environmental Science Press: Beijing, China, 2009. (in Chinese) [Google Scholar]
  29. Lawrence Berkeley National Laboratory (LBNL). Energy for 500 Million Homes: Drivers and Outlook for Residential Energy Consumption in China; LBNL: Berkeley, CA, USA, 2009. [Google Scholar]
  30. Lawrence Berkeley National Laboratory (LBNL). China Energy and Emission Paths to 2030; LBNL: Berkeley, CA, USA, 2011. [Google Scholar]
  31. Li, Z.D. Quantitative analysis of sustainable energy strategies in China. Energy Policy 2010, 38, 2149–2160. [Google Scholar] [CrossRef]
  32. Wu, W.H.; Fan, H.; Li, L.C.; Yang, H.N. Analysis of energy efficiency, energy saving potential and countermeasures in transportation. Macroeconomics 2008, 6, 28–33. (in Chinese). [Google Scholar]
  33. Zhou, X.J. Present situation and trend of energy consumption in traffic and transportation industry. Sino Glob. Energy 2010, 15, 9–18. (in Chinese). [Google Scholar]
  34. Jiang, Y. Energy-Efficient Building Development in China; Research Report; Chinese Architecture Industry Press: Beijng, China, 2008. (in Chinese) [Google Scholar]
  35. European Commission Joint Research Center Institute for Environment and Sustainability. Long-Term Trend in Global CO2 Emissions: 2011 Report. Available online: http://edgar.jrc.ec.europa.eu/news_docs/C02%20Mondiaal_%20webdef_19sept.pdf (accessed on 5 November 2011).
  36. Qiu, J. China’s climate target: Is it achievable? Nature 2009, 462, 550–551. [Google Scholar] [CrossRef] [PubMed]
  37. Jiang, K.J.; Zhuang, X. Scenario Analysis on Low-Carbon Economy Development of Jilin City. Available online: http://www.lowcarbonzones.org/documents/ScenarioAnalysisonLow-%20carbonEconomyDevelopmentofJilinCity.pdf (accessed on 9 November 2011).
  38. Jiang, K.J.; Hu, X.L.; Zhuang, X.; Liu, Q. China’s low-carbon scenarios and roadmap for 2050. Sino Glob. Energy 2009, 6, 1–7. (in Chinese). [Google Scholar]
  39. Chen, B.; Chen, G.Q. Ecological footprint accounting and analysis of the Chinese Society 1981–2001 based on embodied exergy. Ecol. Econ. 2007, 61, 355–376. [Google Scholar] [CrossRef]
  40. Jiang, M.M.; Zhou, J.B.; Chen, B.; Chen, G.Q. Emergy account of the Chinese Economy 2004. Commun. Nonlinear Sci. Numer. Simul. 2008, 13, 2337–2356. [Google Scholar] [CrossRef]
  41. Chen, B.; Chen, Z.M.; Zhou, Y.; Chow, J.B.; Chen, G.Q. Emergy as embodied energy based assessment for local sustainability of a constructed wetland in Beijing. Commun. Nonlinear Sci. Numer. Simul. 2009, 14, 622–635. [Google Scholar] [CrossRef]
  42. Chen, B.; Chen, G.Q.; Hao, F.H.; Yang, Z.F. The water resources assessment based on resource exergy for the mainstream Yellow River. Commun. Nonlinear Sci. Numer. Simul. 2009, 14, 331–334. [Google Scholar] [CrossRef]
  43. Chen, B.; Chen, G.Q.; Hao, F.H.; Yang, Z.F. Emergy-based energy and material metabolism of the Yellow River Basin. Commun. Nonlinear Sci. Numer. Simul. 2009, 14, 923–934. [Google Scholar] [CrossRef]
  44. Yang, Q.; Chen, B.; Ji, X.; He, Y.F.; Chen, G.Q. Exergetic evaluation of corn-ethanol production in China. Commun. Nonlinear Sci. Numer. Simul. 2009, 14, 2450–2461. [Google Scholar] [CrossRef]
  45. Ji, X.; Chen, G.Q.; Chen, B.; Jiang, M.M. Exergy-based assessment for waste gas emissions from Chinese Transportation. Energy Policy 2009, 37, 2231–2240. [Google Scholar] [CrossRef]
  46. Chen, G.Q.; Chen, B. Extended exergy analysis of the Chinese society. Energy 2009, 34, 1127–1144. [Google Scholar] [CrossRef]
  47. Chen, Z.M.; Chen, G.Q.; Zhou, J.B.; Jiang, M.M.; Chen, B. Ecological input-output modeling for embodied resources and emissions in Chinese economy. Commun. Nonlinear Sci. Numer. Simul. 2010, 15, 1942–1965. [Google Scholar] [CrossRef]

