

Technical–Financial Feasibility Study of a Micro-Cogeneration System in the Buildings in Italy
by
 , ,
, ,
Gabriele Battista
1,* ,
,
Emanuele de Lieto Vollaro
2,
Andrea Vallati
3 and
Roberto de Lieto Vollaro
1
1
Department of Industrial, Electronic and Mechanical Engineering, Roma TRE University, Via Vito Volterra 62, 00146 Rome, Italy
2
Department of Architecture, Roma TRE University, Largo Giovanni Battista Marzi 10, 00154 Rome, Italy
3
Department of Ingegneria Astronautica, Elettrica ed Energetica, Sapienza University of Rome, Via Eudossiana 18, 00184 Rome, Italy
*
Author to whom correspondence should be addressed.
Energies 2023, 16(14), 5512; https://doi.org/10.3390/en16145512
Submission received: 18 June 2023
/
Revised: 17 July 2023
/
Accepted: 18 July 2023
/
Published: 20 July 2023
(This article belongs to the Special Issue Advanced Energy Systems in Zero/Positive Energy Buildings, Communities and Districts)
Abstract
:The current global context, marked by crises such as climate change, the pandemic, and the depletion of fossil fuel resources, underscores the urgent need to minimize waste. Cogeneration technology, which enables simultaneous production of electricity and thermal energy from electricity generation waste, offers a promising solution to enhance energy efficiency. Its widespread adoption, particularly in the European Union, where several cogeneration systems are in place, demonstrates its growing popularity. Italy alone has 1865 high-efficiency cogeneration units, contributing significantly to total cogeneration energy generation. Micro-cogeneration, specifically, has attracted attention for its potential to reduce energy waste and environmental impact. This study focuses on assessing the technical and financial feasibility of a micro-cogeneration plant using natural gas-fuelled internal combustion engines, considering different scenarios of plant operating strategies in order to optimize energy production, minimize waste, and mitigate environmental footprints associated with conventional methods. Additionally, it provides valuable guidance for policymakers, industry stakeholders, and decision-makers invested in sustainable energy solutions. By advancing micro-cogeneration technology, this study aims to promote a more sustainable and environmentally conscious approach to energy production. The methodology applied is based on the development of a numerical model via RETScreen Expert 8 and it was calibrated with one-year energy bills. The study was performed by focusing on the analysis of the annual energy savings, greenhouse gas emission savings, tonnes of oil equivalents savings, and financial parameters such as Net Present Value (NPV), Internal Rate of Return (IRR), Profitability Index (PI) and Payback time (PBT). The results show, using a micro-cogeneration system in a big complex of buildings, that the financial parameters can continually increase with the plant’s capacity with the electrical load following, but with a loss of the recovered heat from the cogenerator because it may reach values that are not necessary for the users. When the thermal load variation is much more significant than the electrical load variation, it will be useful to design the plant to follow the thermal load variation which allows the full utilization of the thermal and energy production from the plant without any waste energy and choosing a system capacity that can optimize the energy, emissions and financial aspects.
1. Introduction
The historical context we are living in, with an ongoing climate crisis caused by global warming, a pandemic, and the gradual depletion of traditional energy sources such as fossil fuels, along with tensions in the relationship between Europe and Russia, has brought the need to minimize waste back to the forefront of human attention.
One-third of total greenhouse gas emissions worldwide are produced by the sector involved in building and infrastructure development, making it a significant contributor to the phenomenon of global warming [1]. In order to contrast the climate change caused by greenhouse gas emissions, global initiatives have been undertaken to create innovative net-zero energy buildings (nZEBs) [2,3] and to improve the energy efficiency of existing buildings [4,5,6]. The expansion of urban areas has led to the emergence of the urban heat island phenomenon [7,8], which describes the unique microclimate of cities [9]. This phenomenon is characterized by an increase in temperatures in urban areas compared to rural areas. The effects of urban heat islands can negatively impact human well-being, leading to various adverse consequences [10]. Additionally, it can lead to a surge in the utilization of air conditioning plants in buildings to combat the heat [11,12]. This, in turn, results in higher electricity consumption [13,14] and increased levels of pollutants emitted in urban environments [15,16]. Recent attention has been given to studying strategies to reduce the impacts of urban heat islands, such as the use of green roofs [17,18], cool materials [19,20], vegetation [21,22], and water sources [23,24]. The adoption of these mitigation techniques is crucial not only for large urban areas but also for smaller, localized areas such as urban canyons [25,26,27].
Retrofitting existing buildings offers significant potential for energy efficiency improvements, in contrast to newly built nZEBs, given that existing buildings constitute the majority of structure stocks and have an absence of essential energy efficiency components [28]. A multitude of studies on recommendations and approaches for retrofitting energy performance for single buildings [29,30] and building stocks [31] can be sourced in the existing literature and are frequently driven by efforts undertaken by many nations to attain carbon neutrality in their economies. Nevertheless, energy-saving initiatives typically exclude historical buildings to safeguard their architectural heritage. Retrofitting historic buildings was previously perceived as a potential risk to their cultural value, but this perception is gradually evolving [32]. Moreover, multiple studies have indicated notable improvements in energy efficiency for rehabilitated historic buildings in Europe, with Italy leading the way, followed by the United Kingdom, Spain [33,34], and China [35,36]. Striking a balance between energy efficiency, thermal comfort, and the preservation of cultural heritage is vital when renovating historic buildings. For instance, external wall insulation, which can compromise the aesthetic character, may not be a suitable choice. However, updating internal energy systems such as lighting fixtures and appliances is fully compatible with heritage conservation. Additionally, the installation of building-integrated solar photovoltaic systems is often feasible and merits careful consideration [37]. Previous studies have proposed systemic methods [38] and evaluated various retrofit alternatives, encompassing energy efficiency strategies concerning building envelopes [39], heating, ventilation, and air conditioning (HVAC) systems [40], a combination of envelope and HVAC systems [41], as well as occupant behaviour [42]. For instance, Ascione et al. [43] conducted experimental and numerical assessments on an administrative building in Italy to develop a multi-criteria approach for energy retrofits of historic buildings. The study evaluated several energy efficiency measures, such as wall thermal insulation, air leakage, setpoint management, window glazing, and heating systems. The results indicated that energy retrofits could reduce the building’s primary energy consumption by 20%. In a protected residential complex in London, Ben and Steemers [42] examined the advantages of energy retrofits through both physical and behavioural interventions. The study presented three potential levels of retrofitting, considering capital costs and payback periods for enhancing energy efficiency in HVAC and envelope systems. The investigation revealed that behavioural changes presented significant opportunities for energy savings (ranging from 62% to 86%), sometimes surpassing the energy efficiency improvements achieved through physical enhancements.
Energy retrofitting has emerged as an essential strategy for enhancing the energy efficiency and environmental impact of existing buildings [44]. However, the implementation of retrofit measures in institutional buildings is often constrained by budget limitations and the need for profitability [45,46]. Therefore, it is crucial to assess the financial feasibility of retrofitting projects during the process of decision-making. According to Menassa [47], inaccurate financial assessment in 57% of renovation projects resulted in unexpectedly long payback periods. To address this issue, various evaluation tools have been developed over the years to identify the most economical measures. The two predominant methods for financial evaluation in energy retrofitting are life-cycle cost (LCC) analysis and cost–benefit analysis (CBA) [48,49]. Both approaches take into account the time value of money (TVM) and offer trustworthy ways to select economically optimal retrofitting measures [50]. LCC centres on the complete capital investment and forthcoming operating expenses, encompassing management and maintenance costs. It has been widely used in numerous studies to determine cost-optimal retrofitting measures for residential and non-residential buildings [51], including various building types such as residential, commercial, and educational buildings [52,53,54,55,56,57]. On the other hand, CBA is explicitly recommended by Sartori et al. [58] as a necessary procedure for financial decision-making. Some studies have applied CBA to assess optimal retrofitting measures for residential buildings [59,60], and a few have examined its economic assessment for non-residential buildings [61,62]. However, LCC has been more commonly employed in previous research. Nevertheless, Gabay et al. [63] investigated the advantage of CBA over the LCC approach in selecting optimal energy retrofitting measures. The study indicated that CBA favours the choice of higher-performance measures, even if they entail higher life-cycle costs, which remains preferable to stakeholders. The European Commission also recommends the application of CBA incorporating risk analysis into investment assessment [58]. However, it is generally considered that the potential of CBA in financial retrofitting measures evaluation is underestimated. Consequently, in this study, we utilized CBA as the primary financial evaluation approach to demonstrate its effectiveness in evaluating the actual profitability of retrofitting measures.
During the process of producing electricity, a significant amount of energy is dissipated, and therefore lost, in terms of heat. Therefore, one of the most promising ways to make energy production more efficient is to simultaneously produce electricity and thermal energy, using the remaining energy content in the waste products generated by the production of the former. Cogeneration is based on this principle and offers an effective and efficient way to use fossil fuels, ensuring sustainable management of natural and financial resources, and minimizing environmental impact [64].
Several companies have dedicated themselves to the development of this technology, and with a greater variety of solutions and greater availability on the market, there has been a significant increase in the global adoption of this technology, also due to the practicality it presents from a technical point of view.
In recent years, in the United Kingdom there has been a steady growth in installed cogeneration capacity from 3 to 6 GWe, where 68% of plants operate on natural gas [65]. The total capacity of cogeneration systems installed in European Union countries in 2010 exceeded 105 GW, with Germany ranking first with 22% of the total capacity, followed by Poland and Denmark with 9%. In Denmark, more than 50% of electricity production is provided by cogeneration systems, with 40% in Finland and 30% in Latvia and the Netherlands [66].
Finally, in Italy, according to the Ministry of Economic Development’s 2020 report [67], there are 1865 High-Efficiency Cogeneration units, with a total installed capacity of 13.4 GW, electricity production of 57.7 TWh (of which 28.6 TWh are in high-efficiency mode) and 35.6 TWh of useful heat. It is estimated that these data related to HEC represent about half of the total energy generation from cogeneration. The majority of these plants (about 90% of the total) are of the internal combustion type, with an average size of 1 MW: these are the typical installations in an industrial context [68].
Micro-cogeneration is an increasingly popular technology that enables the simultaneous production of electricity and heat. This technology has gained significant attention in recent years due to its potential to reduce energy waste and decrease the environmental impact of energy production. However, the COVID-19 pandemic and the Ukraine War has had a significant impact on the global and, in particular, European economy, and it is unclear how this will affect the feasibility and financial viability of energy retrofit strategies. Therefore, it is crucial to conduct a comprehensive analysis of the energy financial feasibility and this study aims to perform an analysis of a micro-cogeneration plant based on internal combustion engines fuelled by natural gas, considering different scenarios of plant operating strategies.
2. Materials and Methods
2.1. Methodology
The objective of this study is to focus on analysing the technical and financial feasibility of installing a new plant. In particular, in the present paper we analysed the use of a micro-cogeneration system.
The methodology is shown in Figure 1 and starts with the development of a numerical model to evaluate various types of energy used in the building. The RETScreen Expert 8 tool [69] was used to implement the numerical model. This tool allows for the comparison of various system setups from an energy, environmental, and financial perspective. It analyses investment, operation, and maintenance costs to determine the economic benefit of intervention. RETScreen Expert 8 is a proper tool for pre-feasibility and feasibility studies [70], and it is used for both electrical and thermal system design.
RETScreen Expert 8 can conduct a thorough feasibility analysis, encompassing technical, economic, risk, sensitivity, and environmental aspects of retrofit solutions for buildings. It enables the simulation, optimization, and evaluation of the performance of both traditional energy-saving measures and renewable energy systems. This comprehensive analysis aids in the decision-making process by providing insights into technical, economic, and environmental factors. RETScreen Expert 8 can immediately evaluate the effects of a retrofit solution separately or aggregated, significantly reducing the time-cost of energy retrofit decision-making.
The RETScreen Expert 8 tool was selected for its user-friendly interface compared to other commercially available software options. It offers comprehensive analysis of energy, financial, and environmental aspects, aiding in identifying the most suitable retrofit strategy. RETScreen Expert 8, the Clean Energy Project Analysis Software, enables the assessment of energy efficiency and feasibility of various energy models, including renewable energy systems and high-performance models.
The software facilitates the modelling of power plants for real estate, providing valuable output data for technical, economic, and environmental analysis related to investments in clean energy projects or cogeneration, as applicable in this case. The Canadian Government developed the calculation model with extensive support from industry, institutions, and academic experts.
The energy model is calibrated based on a one-year analysis of energy bills. Subsequently, multiple energy retrofit measures can be explored to reduce the building’s energy consumption.
This study starts with an analysis of the energy consumption of the building, both in terms of methane gas and electricity, correlating them with the expenses incurred in the various years. Therefore, the average cost of energy per year was calculated, which is necessary for calculating the annual savings.
Once average thermal and electrical loads have been identified, simulations are carried out to evaluate the coverage of the building’s thermal and electrical consumption by varying the power of the system to be installed. The simulations also consider energy savings, economic benefits, reduction in polluting emissions, and financial impact.
2.2. Case Study
The case study concerns a complex of buildings located in Rome, used for tertiary sector activities, served by several boilers for winter heating and by the national power grid for supplying various uses and summer cooling. The building complex covers over 100,000 square meters of useful space, divided into ten buildings. They mainly host offices and production spaces. The predominant working hours are 12 h a day, from Monday to Saturday, throughout the year for some spaces, while others are used 24 h a day, every day of the week. In addition, there are no prolonged periods of work suspension, as may occur, for example, during the summer in other typical types of work functions in Italy. The buildings present significant energy issues, such as the presence of low-efficiency plant technologies for the distribution of hot and cold fluids, and the production of hot and cold water.
The external building envelope is mainly composed of concrete and has walls with a thickness of 25 cm that correspond to an average calculated transmittance of 1.95 W/m2K, while the roof and the pavement has a calculated transmittance of 0.42 W/m2K and 0.55 W/m2K, respectively. The current windows in place are of the 4/9/4 type, featuring a 9 mm air gap sandwiched between two 4 mm glass layers. The calculated thermal transmittance for these windows is approximately 3.07 W/m2K, accompanied by a g-value of 0.6.
The climate of the case study zone, considering the average monthly data that were used in the numerical model, is shown in Figure 2. It is characterised with an air temperature from 7 °C in January to 24.8 °C in July, an air humidity from 66.8% in July to 83.8% in November.
2.3. Boundary Conditions
The annual average cost of energy, in terms of methane gas and electrical energy, for the 2022 year was, respectively, 0.40 €/kWh and 1.03 €/Nm3. For this study, the annual average costs of electrical energy and natural gas were extracted from the utility bills. In Table 1 are shown the conversion factors used to calculate the tonne of oil equivalent (TOE) and the tonne of CO2 emissions (tCO2), while in Table 2 are shown the main parameters used to simulate the building and plant characteristics.
The discount rate of 3.04% is the nominal discount rate and was considered the last value in the period of the analysis in the present study because the paper aims to perform an analysis in the situation where it is necessary to model the investment decision process of an investor in the proposed energy solution.
The investment and maintenance costs were calculated starting from the data obtained from a commercial investigation. Specifically, cost is a function of size or capacity raised to a scaling exponent or scale factor [74]. The applicable equation is as follows:
where is the cost to be estimated that has a capacity of which is the known cost of the facility that has a capacity of while is a scale factor that depends on the facility technology. The scaling exponent quantifies the non-linear relationship and economies of scale, indicating that the incremental cost decreases as the facility’s capacity increases.
In the present paper, after a commercial investigation, it was possible to set the investment and maintenance cost of a micro-cogenerator plant of 330 kWe at €330,000 and 62,750 €/year, respectively.
2.4. Energy Plant Retrofit
The cogenerators chosen to propose various solutions for this case study are “high power” cogenerators. These consists of internal combustion engines powered by natural gas with capacity varying from 240 to 1500 kWe (kW electricity power).
The tested configurations were chosen to cover any value of the thermal load, starting from the minimum value up to the maximum, first by using all the available cogenerators individually, then gradually coupling them in parallel until the desired load was met. The remaining thermal energy necessary for the building’s uses comes from the current thermal power station made up of condensing boilers. Instead, the electricity needed is taken from the national grid.
Finally, the results were extrapolated, and the financial part of the analysis was carried out. The annual energy savings were calculated, and together with the costs for purchasing and maintaining the system, the investment’s goodness was analysed through various economic factors such as Net Present Value (NPV), Internal Rate of Return (IRR), Profitability Index (PI), Payback time (PBT), and normalized Net Present Value (nNPV) with the plant capacity (NPV/kW).
3. Results
3.1. Model Calibration
The RETScreen Expert 8 tool was used for conducting the simulation analysis, which was then calibrated using readings obtained from the thermal and electricity energy consumption bills. The numerical model incorporated the building envelope’s characteristics, as well as the heating, cooling, lighting, and electrical equipment used within the building. Additionally, the occupancy profile information was taken into account to determine the power requirements of the systems and consider the thermal internal gains.
The calibration process involved comparing the simulated annual heating, cooling, and electrical demand from the numerical model with the actual data obtained from the utility bills. To reduce any discrepancies between the observed and simulated data, we adjusted the gains within the numerical model. Regarding the calibration of the electrical demand, since it is often challenging to accurately quantify the number of electrical devices, we introduced varying amounts of electrical equipment into the numerical model. As for the heating and cooling demand, the calibration pays attention to adjusting the thermal gains. It is important to note that introducing thermal gains can affect the cooling demand, which in turn impacts the electricity demand due to the use of chillers that rely on this energy source. Hence, the calibration method employed a step-by-step process to minimize differences in the numerical, thermal, and electrical demand compared to the readings from the bills.
In the case study, calibration was performed to address a discrepancy in the annual thermal and electricity consumption, resulting in respective deviations of +1.7% and +1.8%.
3.2. Analysis of the Actual Electrical and Thermal Consumption
In Figure 3 and Figure 4 are shown the thermal and electrical energy consumption taken from the bill of the building complex in the year 2022. From the graphs, there is a much more significant variation in power during the annual time frame for the thermal load (Figure 3), which has a minimum in August of 313 MWht and a maximum in January of 2433 MWht, compared to the electrical load, which has a minimum in February of 1889 mWhe and a maximum in August of 2654 mWhe. For this reason, with the introduction of a cogenerator it will be useful to design the plant to follow the thermal load variation because the electrical energy produced will be fully utilized. Otherwise, by following the electrical load, part of the thermal energy would have been lost unnecessarily.
Analysing the trend of the thermal and electrical loads, it is possible to notice that the thermal load has a positive value during the summer, denoting the use of the thermal energy for the domestic hot water or for the air handling units’ use. The electrical load has, indeed, a quite high base load during all the years, denoting a high electrical use in the building.
Finally, the total annual consumption of electricity was approximately 26,592 mWhe, with a billing cost of €10,691,117.58, and a natural gas consumption of 15,995 MWht with a billing cost of €1,560,840.85.
3.3. Analysis of the Cogenerator Performances
After identifying the average thermal and electrical loads of the buildings, the analysis focused on following the thermal load, so that all the heat and electricity produced would be fully utilized, with the electrical load increasing more than the thermal load. Based on this, energy production, consumption, and emissions were analysed using RETScreen software for each configuration.
Figure 5, Figure 6 and Figure 7 show the cogenerator performance in terms of electricity production, gas consumption for cogeneration, and the gas that needs to be drawn from the network to satisfy other thermal uses. The results are shown as a function of the cogenerator plant capacity obtained with the use of different types of systems or by coupling cogenerators of different sizes. This analysis was carried out by adopting both the thermal load following strategy and the electric load following strategy. In the first case, the cogenerator is used primarily to meet thermal demands and the resulting electricity is used for electrical applications. In the second case, the cogenerator is used primarily to meet electricity demands and the resulting thermal energy is recovered to meet thermal needs.
3.4. Analysis of the Cost, Energy, Toe and tCO2 Savings
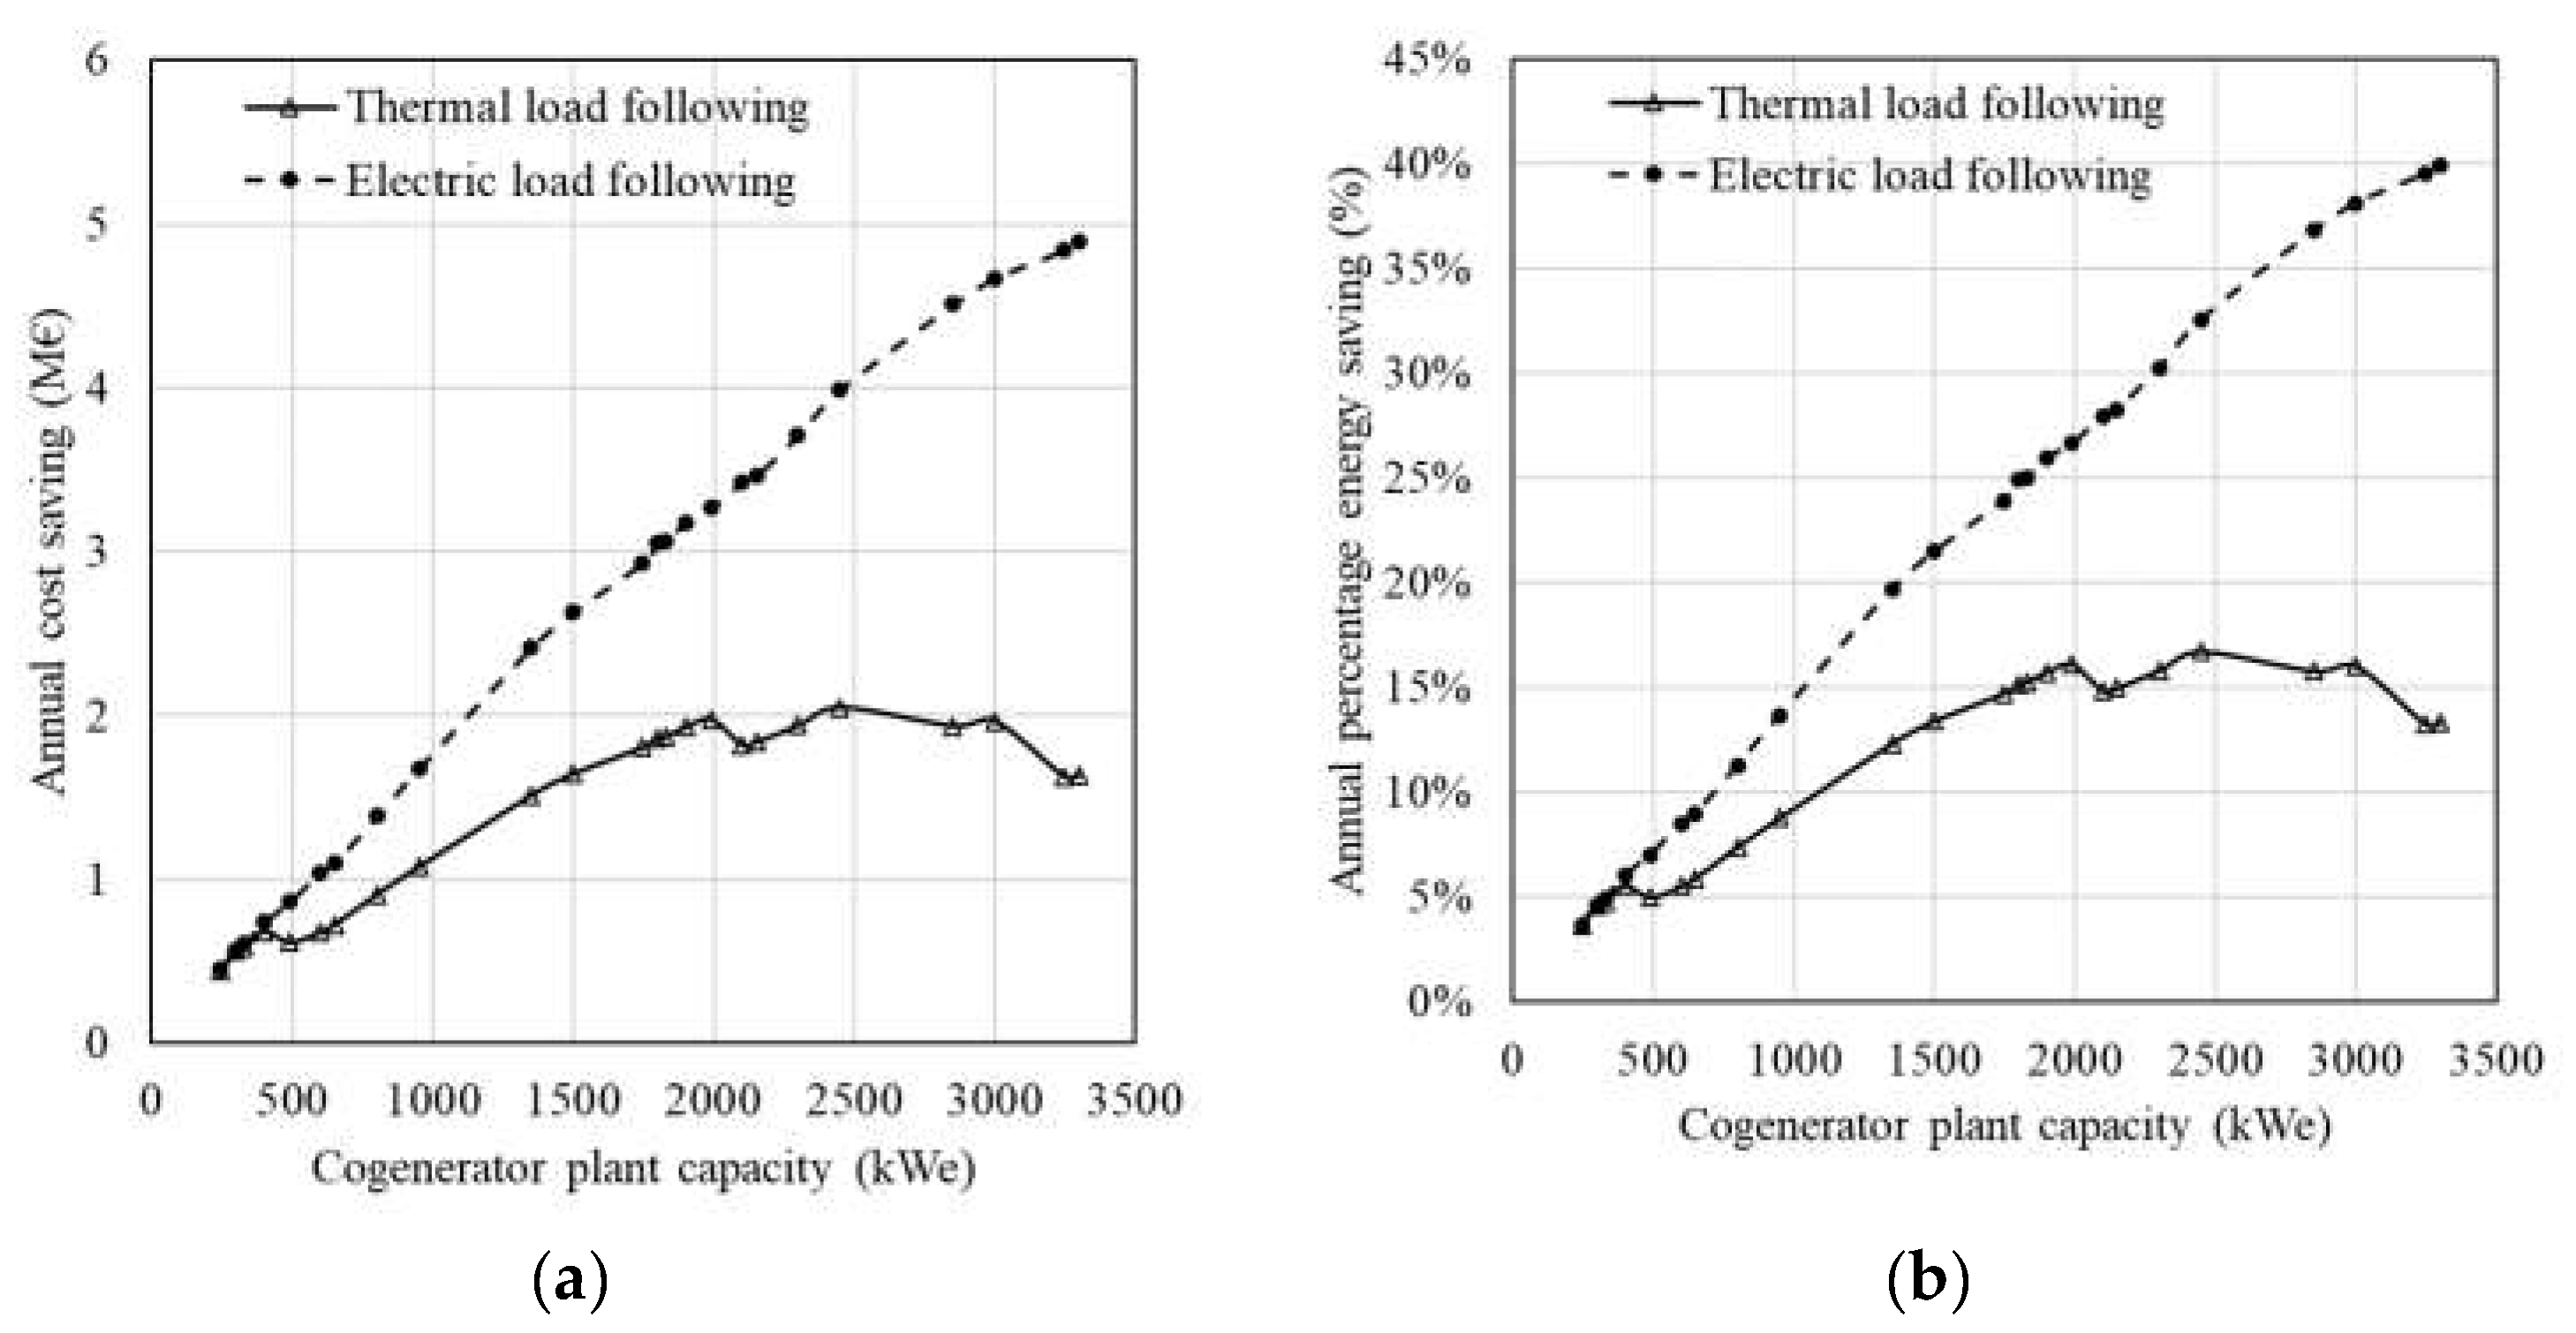
Figure 8 shows the annual savings in terms of cost, energy, tCO2 emissions, and TOE (tonnes of oil equivalent). The results are shown as the function of the cogenerator plant capacity obtained with the use of different types of systems or by coupling cogenerators of different sizes. This analysis was carried out by adopting both the thermal load following strategy and the electric load following strategy.
It is very evident that the annual cost and percentage energy saving has the same trend shown in Figure 5 and Figure 6, while different results are obtained for the savings in tCO2 and TOE.
Regarding the thermal load following, the annual cost varies from about 446 k€ to 2049 k€ and the annual percentage energy savings vary from 3.6% to 16.7%, considering the increase in the cogenerator plant capacity with a peak at 2450 kWe. The annual TOE saving varies from 90.98 toe to 616.72 toe with a peak at 3000 kWe and the annual tCO2 savings vary from 297.77 tCO2 to 1754.87 tCO2 with a peak at 2450 kWe.
Regarding the electric load following, the annual cost varies from about 450 k€ to 4891 k€ and the annual percentage energy savings vary from 3.7% to 39.9%, considering that the values increase with the increase in the cogenerator plant capacity. The annual TOE saving varies from 88.94 toe to 441.66 toe with a peak at 1800 kWe and the annual tCO2 savings vary from 294.53 tCO2 to 2024.22 tCO2 with a peak at 2850 kWe.
3.5. Analysis of the Finances
In Table 3 and Table 4, the results of financial parameters considered to evaluate the economic feasibility of the investment are indicated, in order to find the most advantageous configuration from an economic point of view. The financial parameters used as a reference are: Net Present Value (NPV), normalized NPV (nNPV) with the plant capacity (NPV/kW), Internal Rate of Return (IRR), Profitability Index (PI), and Payback time (PBT).
The analysis was performed by evaluating the financial parameters for both the thermal and electrical load following and comparing them.
Regarding the results for the thermal load following, it can be noted that the maximum NPV values are obtained for configurations of 1990 and 2450 kWe, while the maximum nNPV value is obtained for a low power configuration, specifically 300 kW. As for IRR and PI, the results are consistent, as the highest values, which are 182% and 25.96, respectively, correspond to the configuration composed of a single cogenerator of 1500 kWe. Regarding PBT, it is 1 year for most cases.
Regarding the results for the electrical load following, it can be noted that the maximum NPV values are obtained for the last configuration of 3300 kWe and it can be higher with higher plant capacity. The nNPV values had a low variation which depends on the plant capacity, while IRR and PI have the highest values of 302% and 43.84, respectively, with the configuration composed of a single cogenerator of 1500 kWe, as the thermal load following case. Regarding PBT, it is 1 year for all the cases.
4. Discussion
Analysing the case of thermal load following, it is possible to observe how the energy production curve flattens out after a certain power onwards since the total thermal energy demand of the system is reached, thus stabilizing the production of electricity. This consideration does not apply in the case of electric load following, which has a continuously increasing electricity production with the increase in cogenerator capacity. However, in this case, it is possible that the recovered heat from the cogenerator may reach values that are not necessary for the users and would be lost, making the system less efficient.
Analysing the strategies of following the thermal load and the electrical load, contrasting results are obtained. As a matter of fact, following the thermal load leads to lower savings in terms of costs and energy, and higher savings in terms of TOE, while following the electrical load leads to the opposite. Regarding the savings on tCO2 emissions, it is possible to notice more advantages in the following electricity load case than in the other case. However, in most of the cases of cogenerator plant capacity, the tCO2 emissions are quite similar. Finally, it is evident how much greater the savings are for the configuration that best satisfies the thermal load since, in these cases, the cogeneration system completely replaces traditional boilers, while simultaneously producing electrical energy.
Regarding the financial analysis, it can be observed that, for configurations with powers greater than 1500 kWe, there is a decrease in financial indices, from that point onwards, parallel configurations require the purchase of an additional machine, which significantly increases the initial expense, and has an impact on the performance indicators of the investment.
As previously mentioned, the eventual high electrical energy produced by electrical load following systems leads to configurations with much higher power, resulting in unnecessary thermal energy production, which would be lost, with a corresponding increase in tCO2 emissions. Therefore, from an energy perspective, the choice of a thermal load following configuration is preferable.
5. Conclusions
This study focused on analysing the technical and financial feasibility of installing a micro-cogeneration system for a building’s energy needs. The methodology involved developing a numerical model using the RETScreen Expert 8 tool to evaluate various plant setups from energy, environmental, and financial perspectives. The energy model was calibrated using one year of bills’ analysis to identify average thermal and electrical loads.
Simulations were carried out to evaluate the coverage of the building’s thermal and electrical consumption by varying the power of the micro-cogeneration system. The simulations considered energy savings, economic benefits, reduction in polluting emissions, and financial impact. The results showed that installing a micro-cogeneration system can lead to significant cost savings and reduction in polluting emissions, making it a viable option for meeting the building’s energy demands.
The results showed that the thermal load variation was much more significant than the electrical load variation, making it useful to design the plant to follow the thermal load variation. It was found that it would be useful to design the cogenerator plant to follow the thermal load variation, as the electrical energy produced would be fully utilized. The analysis of the cogenerator performance showed that following the thermal load would lead to stable electricity production, while following the electrical load would have continuously increasing electricity production, but the recovered heat may reach values that are not necessary for the users and would be lost, making the system less efficient. Following the thermal load led to lower savings in terms of costs and energy but higher savings in terms of TOE. On the other hand, following the electrical load led to the opposite. The analysis also showed that the cogeneration system could replace traditional boilers and produce electrical energy simultaneously, resulting in significant savings. The financial analysis indicated that the maximum NPV values were obtained for configurations of 1990 and 2450 kWe for thermal load following and for the last configuration of 3300 kWe for electrical load following. In both cases, the IRR and PI were highest for the configuration composed of a single cogenerator of higher capacity.
Overall, this study demonstrates the usefulness of using a numerical model such as RETScreen to evaluate the technical and financial feasibility of energy retrofit strategies. The findings suggest that micro-cogeneration can be an effective solution for reducing energy waste and decreasing the environmental impact of energy production, while also providing cost savings. However, further research is needed to optimize the micro-cogeneration system’s performance and to investigate the long-term economic and environmental benefits of energy retrofit strategies.
Author Contributions
Conceptualization, G.B. and E.d.L.V.; methodology, G.B. and E.d.L.V.; software, G.B.; validation, G.B.; investigation, G.B.; resources, G.B., E.d.L.V. and R.d.L.V.; writing—original draft preparation, G.B., E.d.L.V., A.V. and R.d.L.V.; writing—review and editing, G.B., E.d.L.V., A.V. and R.d.L.V.; supervision, A.V. and R.d.L.V. All authors have read and agreed to the published version of the manuscript.
Funding
This research received no external funding.
Data Availability Statement
Not applicable.
Conflicts of Interest
The authors declare no conflict of interest.
References
- Dehwah, A.H.A.; Asif, M.; Rahman, M.T. Prospects of PV application in unregulated building rooftops in developing countries: A perspective from Saudi Arabia. Energy Build. 2018, 171, 76–87. [Google Scholar] [CrossRef]
- Congedo, P.M.; Baglivo, C.; D’Agostino, D.; Zacà, I. Cost-optimal design for nearly zero energy office buildings located in warm climates. Energy 2015, 91, 967–982. [Google Scholar] [CrossRef]
- D’Agostino, D.; Parker, D. A Framework for the cost-optimal design of nearly zero energy buildings (NZEBs) in representative climates across Europe. Energy 2018, 149, 814–829. [Google Scholar] [CrossRef]
- Rabani, M.; Bayera Madessa, H.; Mohseni, O.; Nord, N. Minimizing delivered energy and life cycle cost using graphical script: An Office building retrofitting case. Appl. Energy 2020, 268, 114929. [Google Scholar] [CrossRef]
- Nematchoua, M.K.; Marie-Reine Nishimwe, A.; Reiter, S. Towards nearly zero-energy residential neighbourhoods in the European Union: A case study. Renew. Sustain. Energy Rev. 2021, 135, 110198. [Google Scholar] [CrossRef]
- Mauri, L.; Vallati, A.; Ocłoń, P. Low impact energy saving strategies for individual heating systems in a modern residential building: A case study in Rome. J. Clean. Prod. 2019, 214, 791–802. [Google Scholar] [CrossRef]
- Mohammad Harmay, N.S.; Kim, D.; Choi, M. Urban heat island associated with land use/land cover and climate variations in Melbourne, Australia. Sustain. Cities Soc. 2021, 69, 102861. [Google Scholar] [CrossRef]
- Vallati, A.; Mauri, L.; Colucci, C. Impact of shortwave multiple reflections in an urban street canyon on building thermal energy demands. Energy Build. 2018, 174, 77–84. [Google Scholar] [CrossRef]
- Memon, R.A.; Leung, D.Y.C.; Liu, C.H. An investigation of urban heat island intensity (UHII) as an indicator of urban heating. Atmos. Res. 2009, 94, 491–500. [Google Scholar] [CrossRef]
- Battista, G.; Evangelisti, L.; Guattari, C.; de Lieto Vollaro, E.; de Lieto Vollaro, R.; Asdrubali, F. Urban heat island mitigation strategies: Experimental and numerical analysis of a university campus in Rome (Italy). Sustainability 2020, 12, 7971. [Google Scholar] [CrossRef]
- Li, X.; Zhou, Y.; Yu, S.; Jia, G.; Li, H.; Li, W. Urban heat island impacts on building energy consumption: A review of approaches and findings. Energy 2019, 174, 407–419. [Google Scholar] [CrossRef]
- Yang, X.; Peng, L.L.H.; Jiang, Z.; Chen, Y.; Yao, L.; He, Y.; Xu, T. Impact of urban heat island on energy demand in buildings: Local climate zones in Nanjing. Appl. Energy 2020, 260, 114279. [Google Scholar] [CrossRef]
- Kaloustian, N.; Aouad, D.; Battista, G.; Zinzi, M. Leftover spaces for the mitigation of urban overheating in Municipal Beirut. Climate 2018, 6, 68. [Google Scholar] [CrossRef] [Green Version]
- Larsen, M.A.D.; Petrović, S.; Radoszynski, A.M.; McKenna, R.; Balyk, O. Climate change impacts on trends and extremes in future heating and cooling demands over Europe. Energy Build. 2020, 226, 110397. [Google Scholar] [CrossRef]
- Abbassi, Y.; Ahmadikia, H.; Baniasadi, E. Prediction of pollution dispersion under urban heat island circulation for different atmospheric stratification. Build. Environ. 2020, 168, 106374. [Google Scholar] [CrossRef]
- Battista, G. Analysis of the air pollution sources in the city of Rome (Italy). Energy Procedia 2017, 126, 392–397. [Google Scholar] [CrossRef]
- Iaria, J.; Susca, T. Analytic hierarchy processes (AHP) evaluation of green roof- and green wall- based UHI mitigation strategies via ENVI-Met simulations. Urban Clim. 2022, 46, 101293. [Google Scholar] [CrossRef]
- Battista, G.; Pastore, E.M.; Mauri, L.; Basilicata, C. Green roof effects in a case study of Rome (Italy). Energy Procedia 2016, 101, 1058–1063. [Google Scholar] [CrossRef]
- Battista, G.; de Lieto Vollaro, E.; de Lieto Vollaro, R. How cool pavements and green roof affect building energy performances. Heat Transf. Eng. 2021, 43, 326–336. [Google Scholar] [CrossRef]
- Battista, G.; Pastore, E.M. Using cool pavements to mitigate urban temperatures in a case study of Rome (Italy). Energy Procedia 2017, 113, 98–103. [Google Scholar] [CrossRef]
- Diz-Mellado, E.; López-Cabeza, V.P.; Rivera-Gómez, C.; Roa-Fernández, J.; Galán-Marín, C. Improving school transition spaces microclimate to make them liveable in warm climates. Appl. Sci. 2020, 10, 7648. [Google Scholar] [CrossRef]
- Aboelata, A. Vegetation in different street orientations of aspect ratio (H/W 1:1) to mitigate UHI and reduce buildings’ energy in arid climate. Build. Environ. 2020, 172, 106712. [Google Scholar] [CrossRef]
- Theeuwes, N.E.; Solcerová, A.; Steeneveld, G.J. Modeling the influence of open water surfaces on the summertime temperature and thermal comfort in the city. J. Geophys. Res. Atmos. 2013, 118, 8881–8896. [Google Scholar] [CrossRef] [Green Version]
- Fahed, J.; Kinab, E.; Ginestet, S.; Adolphe, L. Impact of Urban heat island mitigation measures on microclimate and pedestrian comfort in a dense urban district of Lebanon. Sustain. Cities Soc. 2020, 61, 102375. [Google Scholar] [CrossRef]
- Battista, G.; de Lieto Vollaro, E.; Grignaffini, S.; Ocłoń, P.; Vallati, A. Experimental investigation about the adoption of high reflectance materials on the envelope cladding on a scaled street canyon. Energy 2021, 230, 120801. [Google Scholar] [CrossRef]
- Vollaro, A.D.L.; Galli, G.; Vallati, A.; Romagnoli, R. Analysis of Thermal field within an urban canyon with variable thermophysical characteristics of the building’s walls. J. Phys. Conf. Ser. 2015, 655, 012056. [Google Scholar] [CrossRef]
- Battista, G.; Mauri, L. Numerical study of buoyant flows in street canyon caused by ground and building heating. Energy Procedia 2016, 101, 1018–1025. [Google Scholar] [CrossRef]
- Cornaro, C.; Puggioni, V.A.; Strollo, R.M. Dynamic simulation and on-site measurements for energy retrofit of complex historic buildings: Villa mondragone case study. J. Build. Eng. 2016, 6, 17–28. [Google Scholar] [CrossRef]
- Rabani, M.; Bayera Madessa, H.; Nord, N. Achieving zero-energy building performance with thermal and visual comfort enhancement through optimization of fenestration, envelope, shading device, and energy supply system. Sustain. Energy Technol. Assess. 2021, 44, 101020. [Google Scholar] [CrossRef]
- Vallati, A.; Grignaffini, S.; Romagna, M.; Mauri, L. Effects of different building automation systems on the energy consumption for three thermal insulation values of the building envelope. In Proceedings of the 2016 IEEE 16th International Conference on Environment and Electrical Engineering (EEEIC), Florence, Italy, 7–10 June 2016. [Google Scholar] [CrossRef]
- Ali, U.; Shamsi, M.H.; Bohacek, M.; Hoare, C.; Purcell, K.; Mangina, E.; O’Donnell, J. A data-driven approach to optimize urban scale energy retrofit decisions for residential buildings. Appl. Energy 2020, 267, 114861. [Google Scholar] [CrossRef]
- Battista, G.; de Lieto Vollaro, E.; Ocłoń, P.; de Lieto Vollaro, R. Retrofit analysis of a historical building in an architectural constrained area: A case study in Rome, Italy. Appl. Sci. 2022, 12, 12305. [Google Scholar] [CrossRef]
- Martínez-Molina, A.; Tort-Ausina, I.; Cho, S.; Vivancos, J.L. Energy efficiency and thermal comfort in historic buildings: A review. Renew. Sustain. Energy Rev. 2016, 61, 70–85. [Google Scholar] [CrossRef]
- Bottero, M.; D’Alpaos, C.; Oppio, A. Ranking of adaptive reuse strategies for abandoned industrial heritage in vulnerable contexts: A multiple criteria decision aiding approach. Sustainability 2019, 11, 785. [Google Scholar] [CrossRef] [Green Version]
- Wu, Z.; Xu, J. Predicting and optimization of energy consumption using system dynamics-fuzzy multiple objective programming in world heritage areas. Energy 2013, 49, 19–31. [Google Scholar] [CrossRef]
- Langston, C.; Wong, F.K.W.; Hui, E.C.M.; Shen, L.Y. Strategic assessment of building adaptive reuse opportunities in Hong Kong. Build Environ. 2008, 43, 1709–1718. [Google Scholar] [CrossRef]
- Polo López, C.S.; Frontini, F. Energy efficiency and renewable solar energy integration in heritage historic buildings. Energy Procedia 2014, 48, 1493–1502. [Google Scholar] [CrossRef] [Green Version]
- De Berardinis, P.; Rotilio, M.; Marchionni, C.; Friedman, A. Improving the energy-efficiency of historic masonry buildings. A case study: A minor centre in the Abruzzo Region, Italy. Energy Build. 2014, 80, 415–423. [Google Scholar] [CrossRef]
- Ascione, F.; Bianco, N.; De Masi, R.F.; De’Rossi, F.; Vanoli, G.P. Energy retrofit of an educational building in the ancient center of Benevento. Feasibility study of energy savings and respect of the historical value. Energy Build. 2015, 95, 172–183. [Google Scholar] [CrossRef]
- Alongi, A.; Scoccia, R.; Motta, M.; Mazzarella, L. Numerical investigation of the Castle of Zena energy needs and a feasibility study for the implementation of electric and gas driven heat pump. Energy Build. 2015, 95, 32–38. [Google Scholar] [CrossRef]
- Franco, G.; Magrini, A.; Cartesegna, M.; Guerrini, M. Towards a systematic approach for energy refurbishment of historical buildings. The case study of Albergo Dei Poveri in Genoa, Italy. Energy Build. 2015, 95, 153–159. [Google Scholar] [CrossRef]
- Ben, H.; Steemers, K. Energy retrofit and occupant behaviour in protected housing: A case study of the Brunswick Centre in London. Energy Build. 2014, 80, 120–130. [Google Scholar] [CrossRef]
- Ascione, F.; De Rossi, F.; Vanoli, G.P. Energy retrofit of historical buildings: Theoretical and experimental investigations for the modelling of reliable performance scenarios. Energy Build. 2011, 43, 1925–1936. [Google Scholar] [CrossRef]
- Kumbaroglu, G.; Madlener, R. Evaluation of economically optimal retrofit investment options for energy savings in buildings. Energy Build. 2012, 49, 327–334. [Google Scholar] [CrossRef]
- Amini Toosi, H.; Lavagna, M.; Leonforte, F.; Del Pero, C.; Aste, N. Life cycle sustainability assessment in building energy retrofitting; A review. Sustain. Cities Soc. 2020, 60, 102248. [Google Scholar] [CrossRef]
- Vogel, J.A.; Lundqvist, P.; Arias, J. Categorizing barriers to energy efficiency in buildings. Energy Procedia 2015, 75, 2839–2845. [Google Scholar] [CrossRef] [Green Version]
- Menassa, C.C. Evaluating sustainable retrofits in existing buildings under uncertainty. Energy Build. 2011, 43, 3576–3583. [Google Scholar] [CrossRef]
- Jenkins, G.P.; Kuo, C.-Y.; Harberger, A.C. Cost-Benefit Analysis for Investment Decisions, Chapter 8: The Economic Opportunity Cost of Capital. JDI Executive Programs. 2011. Available online: https://ideas.repec.org/p/qed/dpaper/201.html (accessed on 14 June 2023).
- Wyatt, P. Property Evaluation in an Economic Context; John Wiley & Sons: Hoboken, NJ, USA, 2007; p. 411. [Google Scholar]
- Remer, D.S.; Nieto, A.P. A compendium and comparison of 25 project evaluation techniques. Part 1: Net present value and rate of return methods. Int. J. Prod. Econ. 1995, 42, 79–96. [Google Scholar] [CrossRef]
- Gabrielli, L.; Ruggeri, A.G. Developing a model for energy retrofit in large building portfolios: Energy assessment, optimization and uncertainty. Energy Build. 2019, 202, 109356. [Google Scholar] [CrossRef]
- De Angelis, E.; Pansa, G.; Serra, E. Research of economic sustainability of different energy refurbishment strategies for an apartment block building. Energy Procedia 2014, 48, 1449–1458. [Google Scholar] [CrossRef] [Green Version]
- Copiello, S.; Gabrielli, L.; Bonifaci, P. Evaluation of energy retrofit in buildings under conditions of uncertainty: The prominence of the discount rate. Energy 2017, 137, 104–117. [Google Scholar] [CrossRef]
- Tadeu, S.; Rodrigues, C.; Tadeu, A.; Freire, F.; Simões, N. Energy retrofit of historic buildings: Environmental assessment of cost-optimal solutions. J. Build. Eng. 2015, 4, 167–176. [Google Scholar] [CrossRef]
- Kneifel, J. Life-cycle carbon and cost analysis of energy efficiency measures in new commercial buildings. Energy Build. 2010, 42, 333–340. [Google Scholar] [CrossRef]
- Fregonara, E.; Lo Verso, V.R.M.; Lisa, M.; Callegari, G. Retrofit scenarios and economic sustainability. A case-study in the Italian context. Energy Procedia 2017, 111, 245–255. [Google Scholar] [CrossRef] [Green Version]
- Sharif, S.A.; Hammad, A. Simulation-based multi-objective optimization of institutional building renovation considering energy consumption, life-cycle cost and life-cycle assessment. J. Build. Eng. 2019, 21, 429–445. [Google Scholar] [CrossRef]
- Sartori, D.; Gelsomina, C.; Genco, M.; Pancotti, C.; Sirtori, E.; Vignetti, S.; Del Bo, C. Guide to Cost-Benefit Analysis of Investment Projects; European Union: Luxembourg, 2014. [Google Scholar] [CrossRef]
- Liu, Y.; Liu, T.; Ye, S.; Liu, Y. Cost-benefit analysis for energy efficiency retrofit of existing buildings: A case study in China. J. Clean. Prod. 2018, 177, 493–506. [Google Scholar] [CrossRef]
- Zavadskas, E.K.; Kaklauskas, A.; Raslanas, S. Evaluation of investments into housing renovation. Int. J. Strateg. Prop. Manag. 2004, 8, 177–190. [Google Scholar] [CrossRef] [Green Version]
- Friedman, C.; Becker, N.; Erell, E. Energy retrofit of residential building envelopes in Israel: A cost-benefit analysis. Energy 2014, 77, 183–193. [Google Scholar] [CrossRef]
- Zhao, S.; Feng, W.; Zhang, S.; Hou, J.; Zhou, N.; Levine, M. Energy savings and cost-benefit analysis of the new commercial building standard in China. Procedia Eng. 2015, 121, 317–324. [Google Scholar] [CrossRef]
- Gabay, H.; Meir, I.A.; Schwartz, M.; Werzberger, E. Cost-benefit analysis of green buildings: An Israeli office buildings case study. Energy Build. 2014, 76, 558–564. [Google Scholar] [CrossRef]
- Memon, A.G.; Memon, R.A. Parametric based economic analysis of a trigeneration system proposed for residential buildings. Sustain. Cities Soc. 2017, 34, 144–158. [Google Scholar] [CrossRef]
- Jradi, M.; Riffat, S. Tri-generation systems: Energy policies, prime movers, cooling technologies, configurations and operation strategies. Renew. Sustain. Energy Rev. 2014, 32, 396–415. [Google Scholar] [CrossRef]
- Kerr, T. Combined Heat and Power: Evaluating the Benefits of Greater Global Investment; International Energy Agency: Washington, DC, USA, 2008. [Google Scholar]
- Relazione Annuale sulla Cogenerazione in Italia. Available online: https://www.mimit.gov.it/images/stories/documenti/IT_-_Relazione_annuale_CAR_2020.pdf (accessed on 14 June 2023).
- Il Presente e Il Futuro della Cogenerazione in Italia. Available online: https://industriale.viessmann.it/blog/presente-e-futuro-cogenerazione-italia (accessed on 4 December 2022).
- RETScreen. Available online: https://www.nrcan.gc.ca/maps-tools-and-publications/tools/modelling-tools/retscreen/7465 (accessed on 19 June 2022).
- Lee, K.H.; Lee, D.W.; Baek, N.C.; Kwon, H.M.; Lee, C.J. Preliminary determination of optimal size for renewable energy resources in buildings using RETScreen. Energy 2012, 47, 83–96. [Google Scholar] [CrossRef]
- ARERA—Aggiornamento del Fattore di Conversione dei KWh in Tonnellate Equivalenti di Petrolio Connesso al Meccanismo dei Titoli di Efficienza Energetica. Available online: https://www.arera.it/it/docs/08/003-08een.htm (accessed on 14 June 2023).
- Gazzetta Ufficiale. Available online: https://www.gazzettaufficiale.it/atto/serie_generale/caricaDettaglioAtto/originario?atto.dataPubblicazioneGazzetta=2014-04-07&atto.codiceRedazionale=14G00069&elenco30giorni=false (accessed on 14 June 2023).
- Indicatori Di Efficienza e Decarbonizzazione Del Sistema Energetico Nazionale e Del Settore Elettrico—Italiano. Available online: https://www.isprambiente.gov.it/it/pubblicazioni/rapporti/indicatori-di-efficienza-e-decarbonizzazione-del-sistema-energetico-nazionale-e-del-settore-elettrico (accessed on 14 June 2023).
- Kenneth, K.H. Jelen’s Cost and Optimization Engineering; McGraw-Hill: New York, NY, USA, 1991; Volume 386. [Google Scholar]
Figure 1.
Flowchart of the methodology.

Figure 2.
Monthly average air temperature and relative humidity of the case study zone.
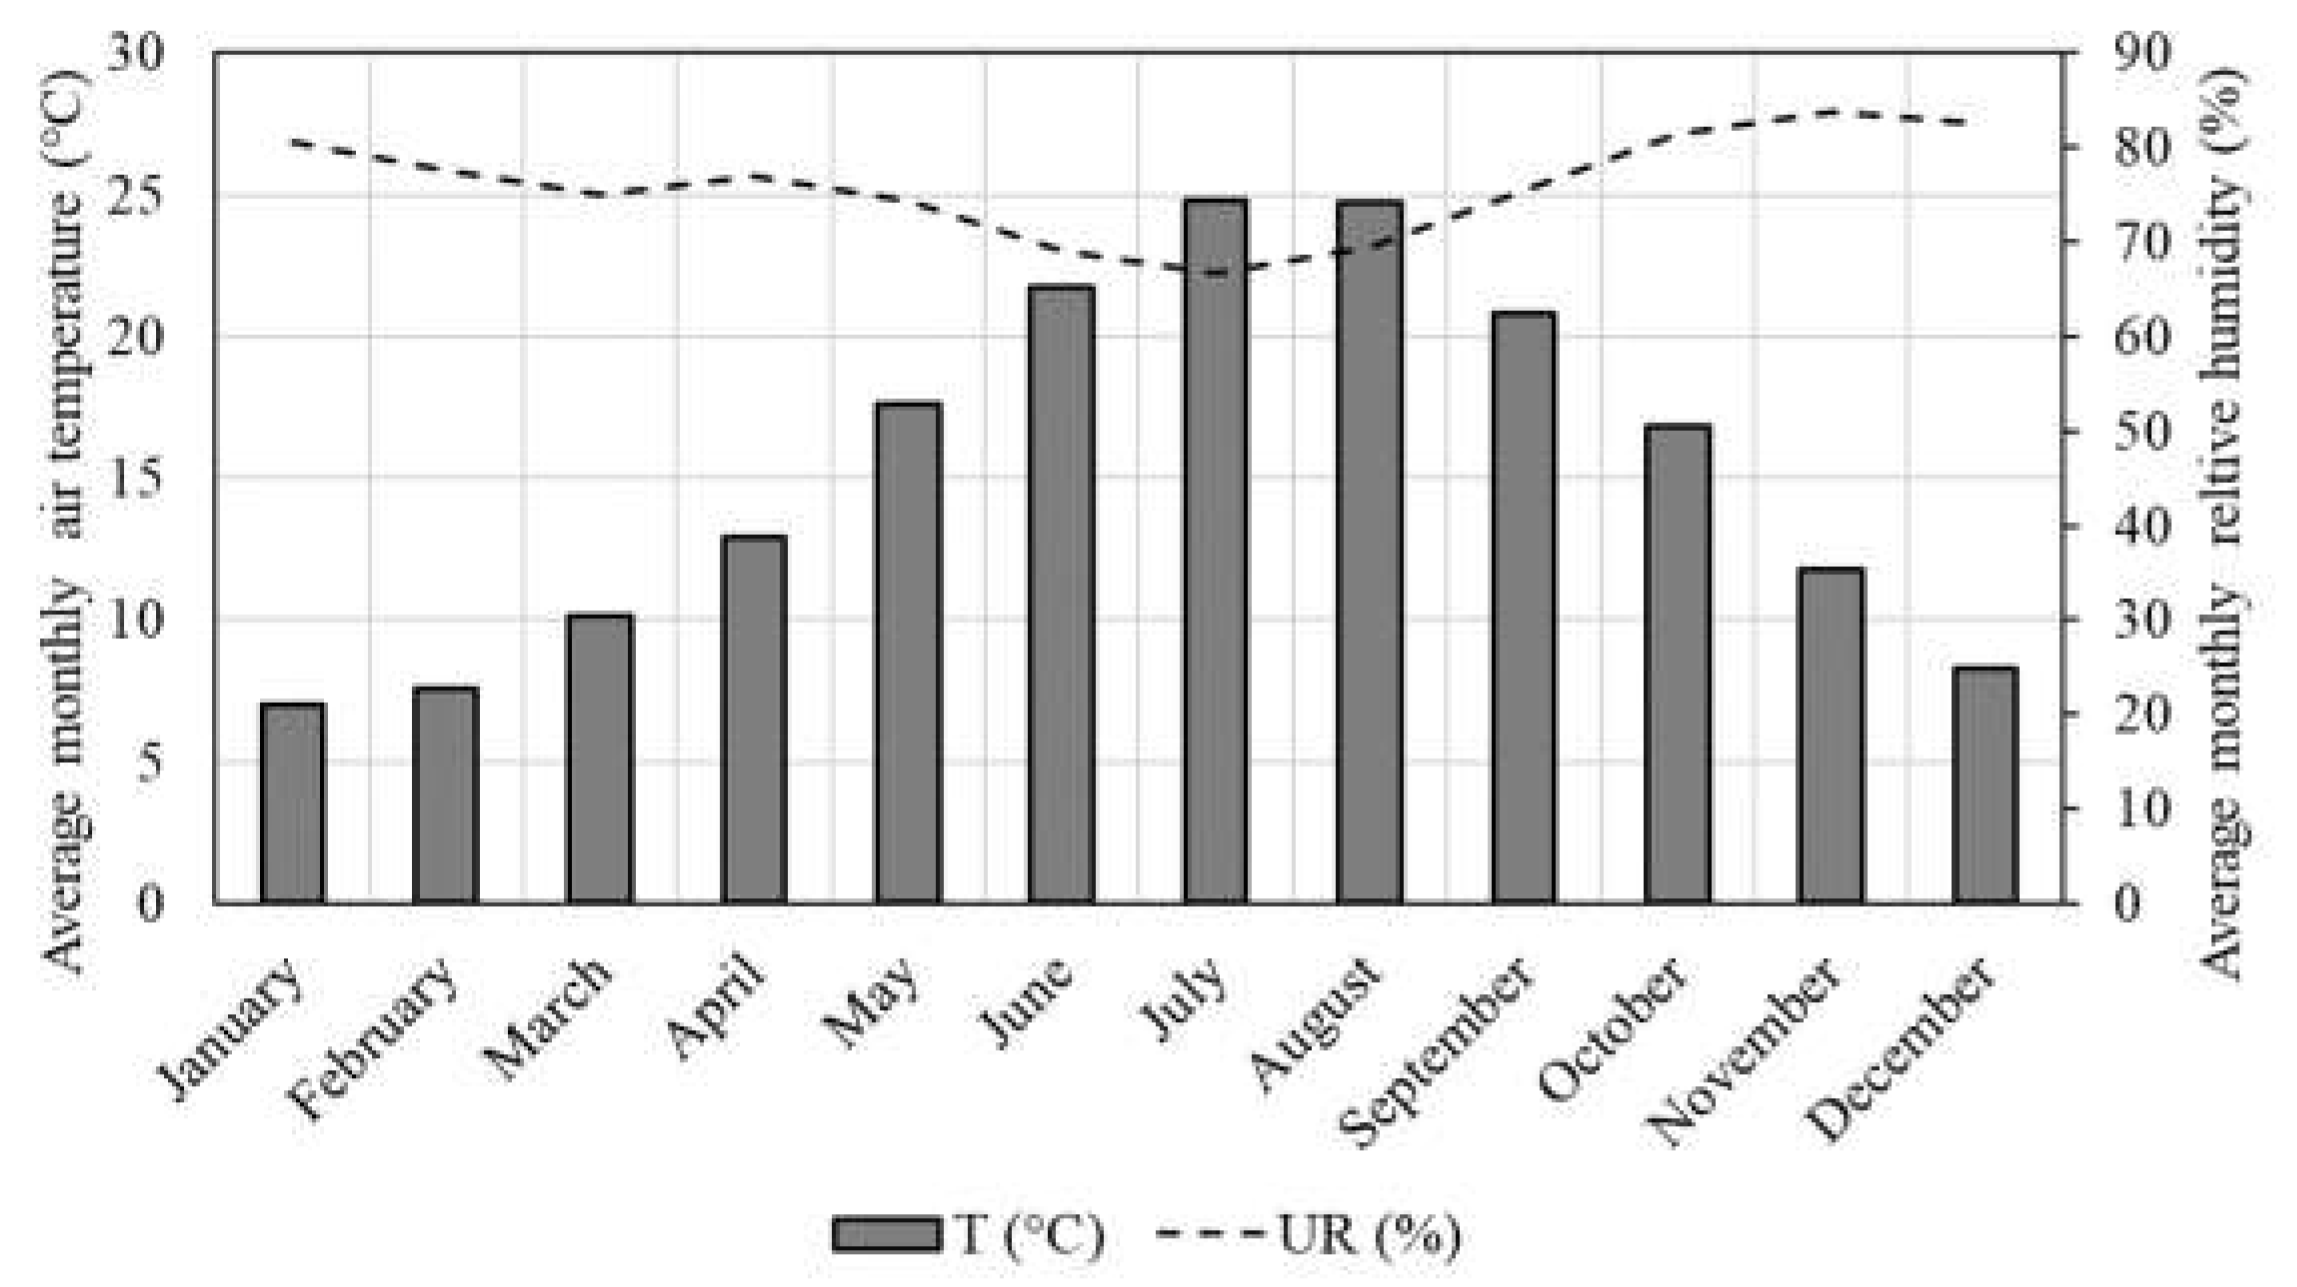
Figure 3.
Thermal energy consumption in 2022 taken from the bills.
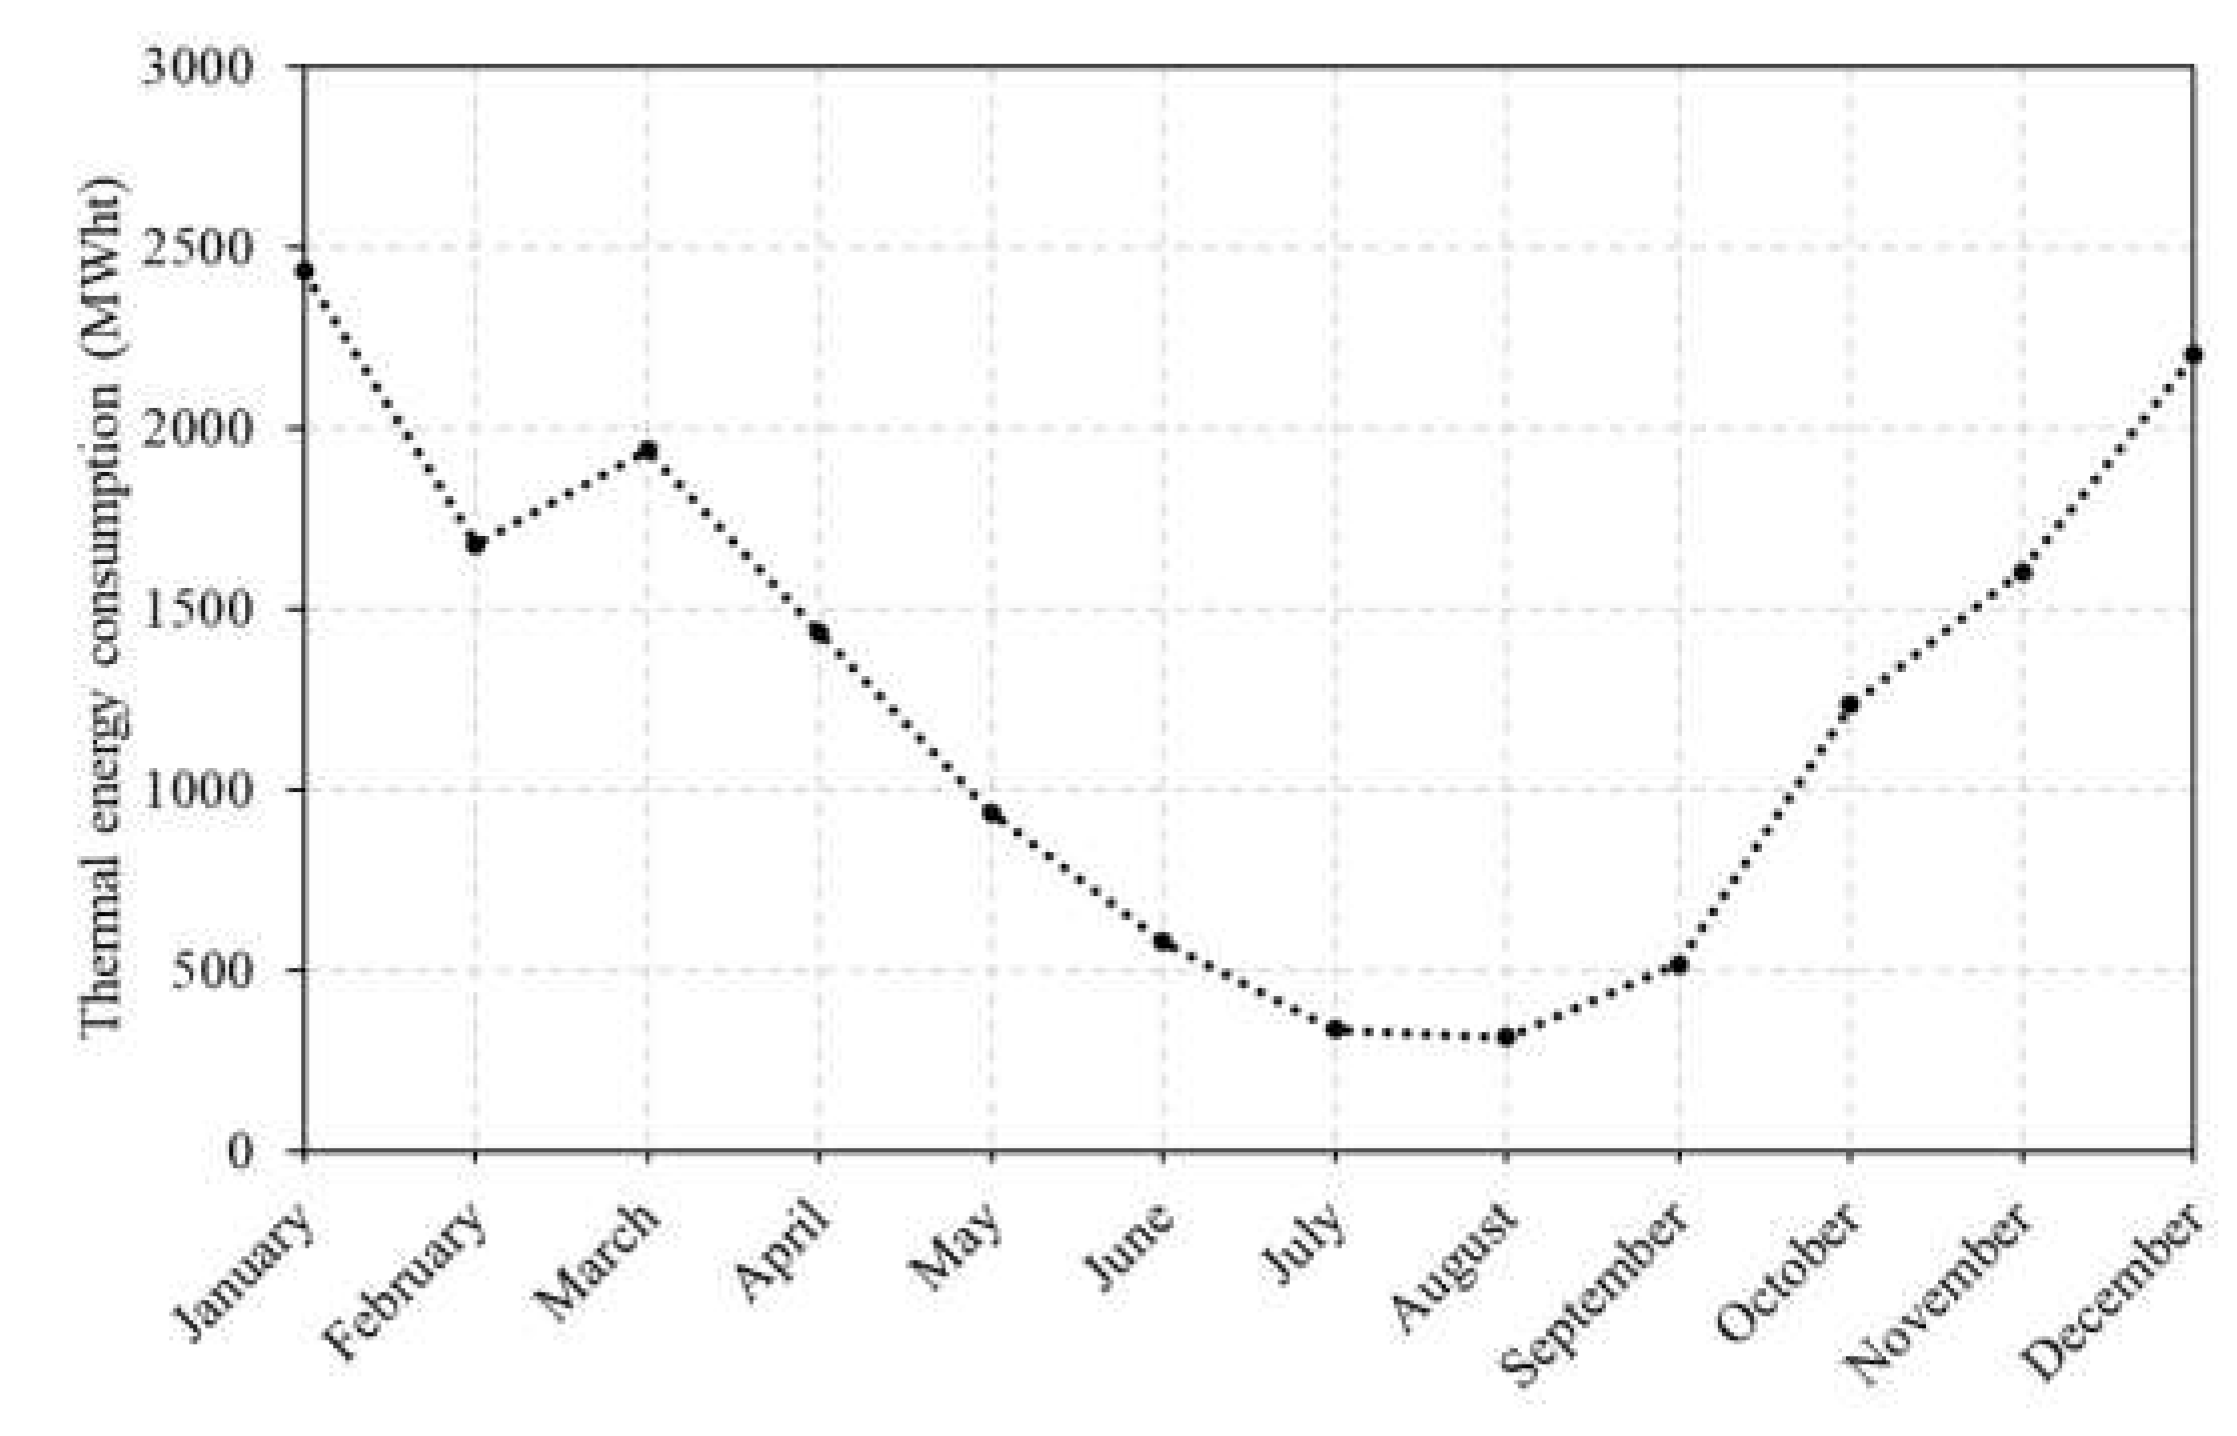
Figure 4.
Electrical energy consumption in 2022 taken from the bills.

Figure 5.
Cogenerator electricity production for different plant capacities and different types of operation: thermal or electric load following.
Figure 5.
Cogenerator electricity production for different plant capacities and different types of operation: thermal or electric load following.
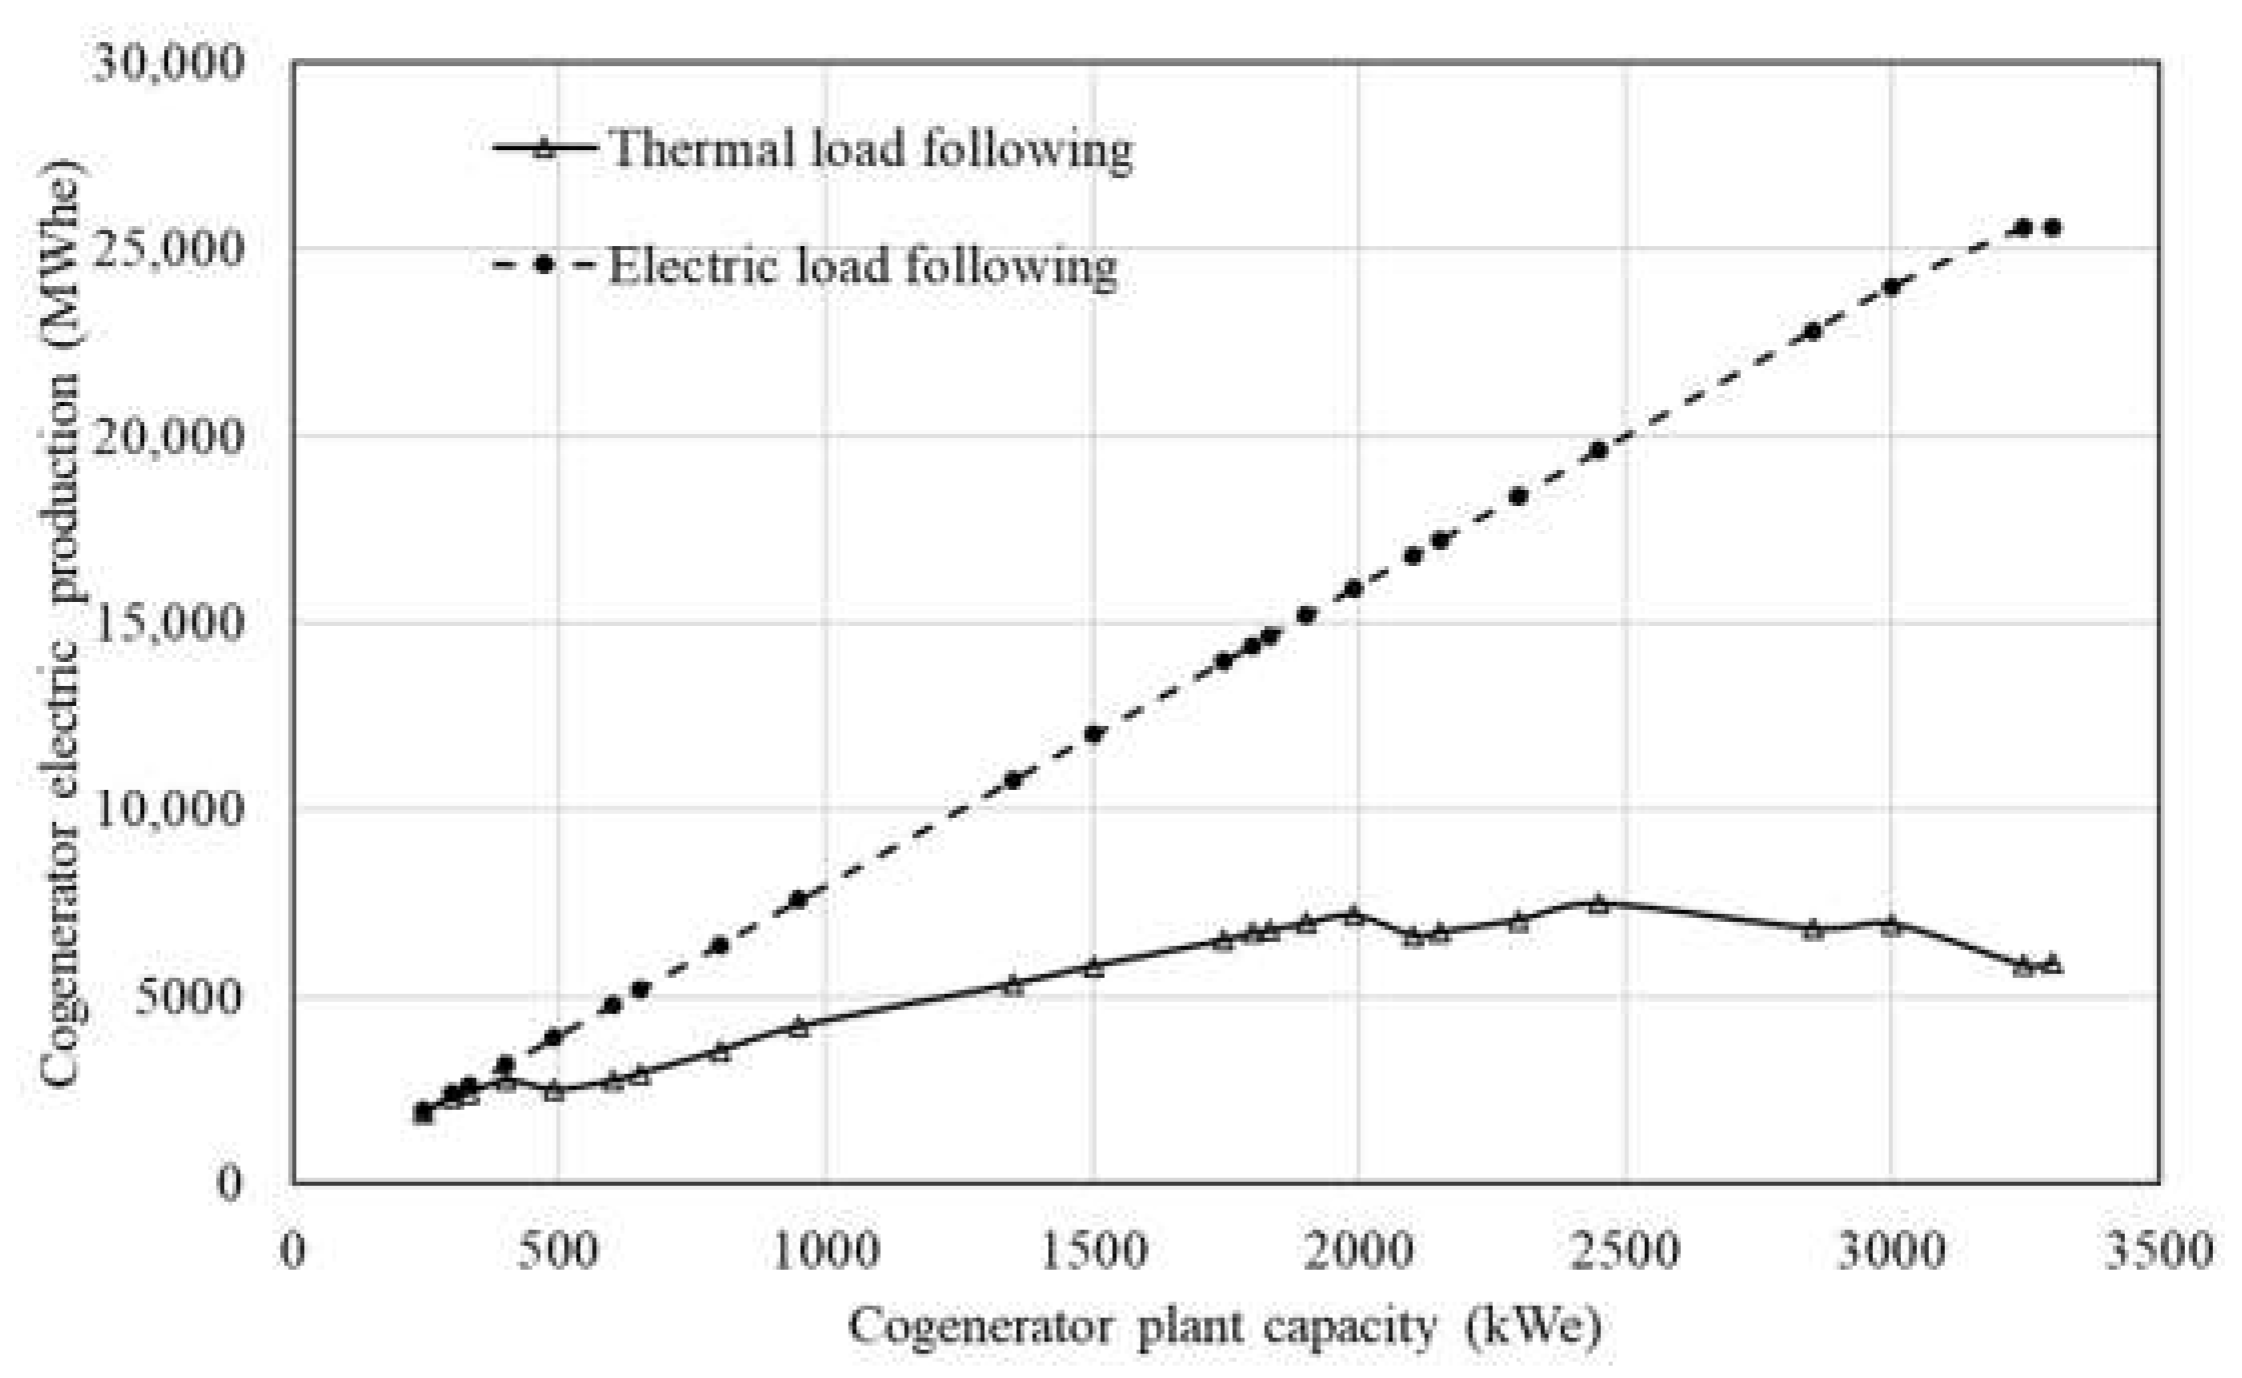
Figure 6.
Cogenerator gas consumption for different plant capacities and different types of operation: thermal or electric load following.
Figure 6.
Cogenerator gas consumption for different plant capacities and different types of operation: thermal or electric load following.
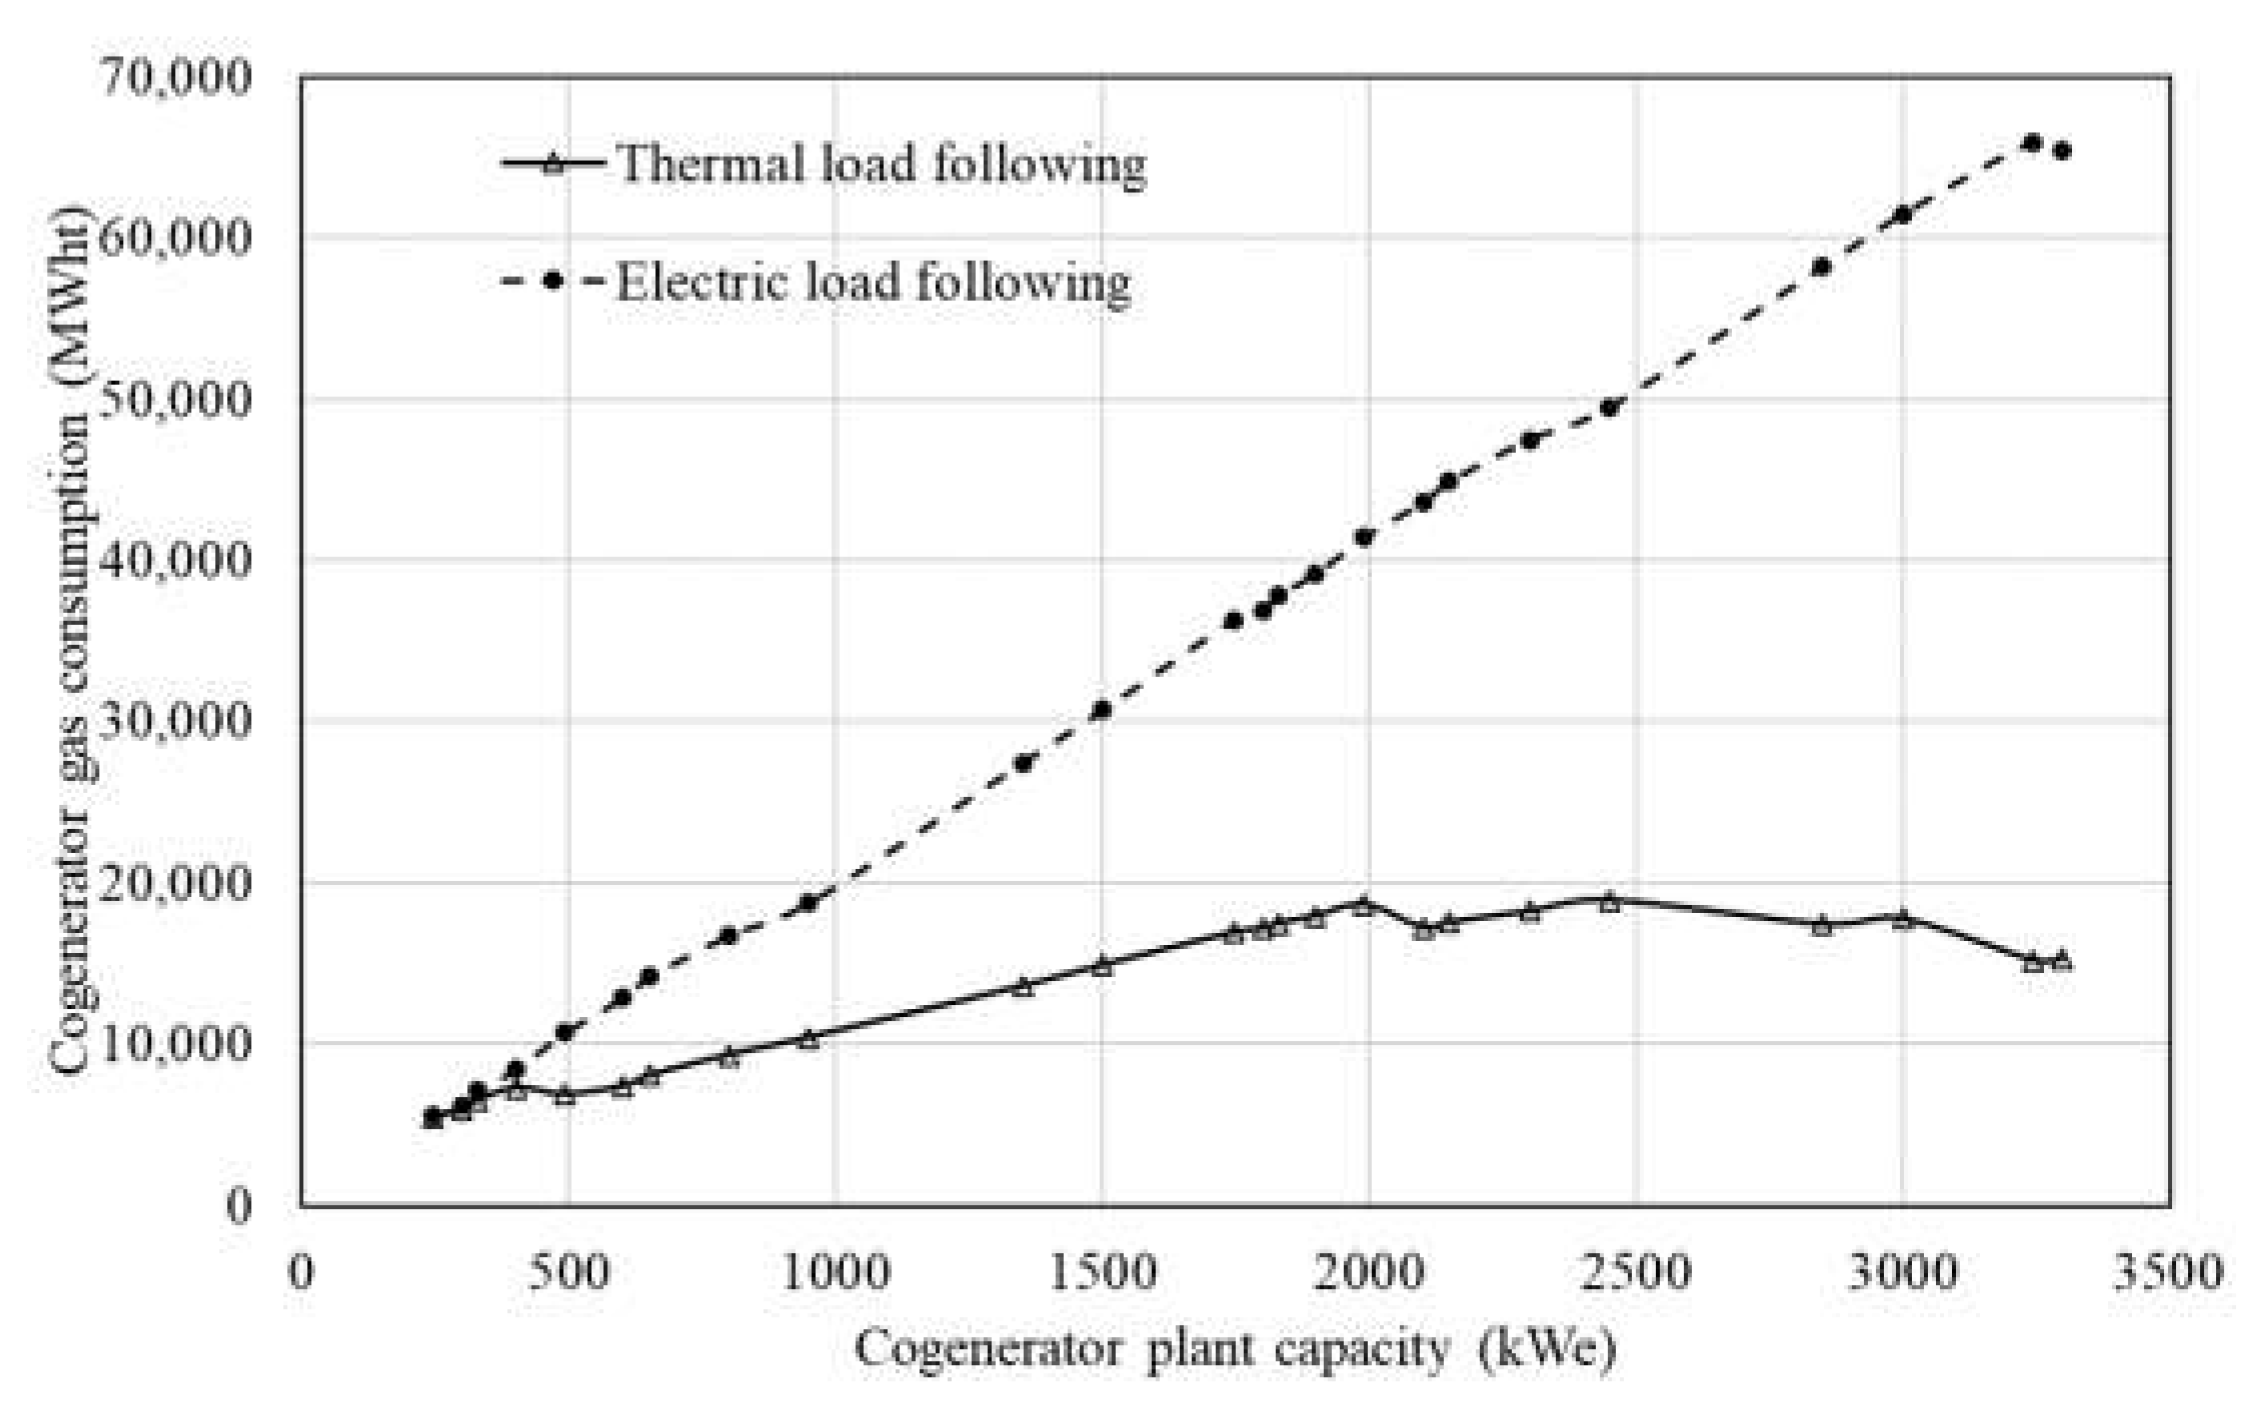
Figure 7.
Gas consumption of the other plants for the different types of cogenerator operation: thermal or electric load following.
Figure 7.
Gas consumption of the other plants for the different types of cogenerator operation: thermal or electric load following.

Figure 8.
Results for the different types of cogenerator operation (thermal or electric load following) and size in terms of annual cost savings (a), annual percentage energy saving (b), annual TOE saving (c) and annual tCO2 saving (d).
Figure 8.
Results for the different types of cogenerator operation (thermal or electric load following) and size in terms of annual cost savings (a), annual percentage energy saving (b), annual TOE saving (c) and annual tCO2 saving (d).


Table 1.
Conversion factor parameters used in the analysis.
| Parameter | Value |
|---|---|
| Conversion factor TOE-electricity (toe/MWh) [71] | 0.187 |
| Conversion factor TOE-natural gas (toe/MWh) [72] | 0.086 |
| Conversion factor tCO2-electricity (tCO2/MWh) [73] | 0.483 |
| Conversion factor tCO2-natural gas (tCO2/MWh) [73] | 0.202 |
Table 2.
Parameter used for the case study.
| Parameter | Value |
|---|---|
| Seasonal efficiency of existing boiler system (%) | 93.7 |
| Thermal load (W/m2) | 75.27 |
| Hot water demand (%) | 21.5 |
| Annual availability of the cogeneration system (h) | 8000 |
| Minimum operating power of the cogenerator (%) | 60 |
| Useful life of the cogenerator plant (years) | 20 |
| Discount rate referred to the 1 December 2022 (%) | 3.04 |
Table 3.
Net Present Value (NPV), normalized NPV with the plant capacity, Internal Rate of Return (IRR), Profitability Index (PI) and Payback time (PBT) for the different types of cogenerator plant capacities with the operating function of thermal load following.
Table 3.
Net Present Value (NPV), normalized NPV with the plant capacity, Internal Rate of Return (IRR), Profitability Index (PI) and Payback time (PBT) for the different types of cogenerator plant capacities with the operating function of thermal load following.
| Plant Capacity | NPV | nNPV | IRR | PI | PBT |
|---|---|---|---|---|---|
| 245 | €5,566,976.31 | €22,722.35 | 143% | 20.17 | 1 |
| 300 | €7,154,401.55 | €23,848.01 | 162% | 22.96 | 1 |
| 330 | €7,376,916.47 | €21,076.90 | 158% | 22.35 | 1 |
| 400 | €8,705,759.20 | €21,764.40 | 165% | 23.51 | 1 |
| 490 | €7,507,681.27 | €15,321.80 | 128% | 17.95 | 1 |
| 600 | €8,260,047.20 | €13,766.75 | 125% | 17.49 | 1 |
| 650 | €8,842,052.39 | €13,603.16 | 127% | 17.84 | 1 |
| 800 | €11,311,468.74 | €14,139.34 | 143% | 20.15 | 1 |
| 950 | €13,584,974.03 | €14,299.97 | 154% | 21.83 | 1 |
| 1350 | €19,493,752.00 | €14,439.82 | 178% | 25.37 | 1 |
| 1500 | €21,247,350.49 | €14,164.90 | 182% | 25.96 | 1 |
| 1745 | €22,569,546.41 | €12,933.84 | 146% | 20.62 | 1 |
| 1800 | €23,259,027.79 | €12,921.68 | 146% | 20.58 | 1 |
| 1830 | €23,371,687.32 | €12,771.41 | 144% | 20.35 | 1 |
| 1900 | €24,061,363.64 | €12,663.88 | 143% | 20.24 | 1 |
| 1990 | €24,542,433.23 | €12,332.88 | 141% | 19.84 | 1 |
| 2100 | €22,014,212.60 | €10,482.96 | 122% | 17.05 | 1 |
| 2150 | €22,215,128.59 | €10,332.62 | 121% | 16.90 | 1 |
| 2300 | €23,482,913.53 | €10,209.96 | 122% | 17.02 | 1 |
| 2450 | €24,874,818.16 | €10,152.99 | 123% | 17.26 | 1 |
| 2850 | €22,637,673.38 | €7943.04 | 103% | 14.26 | 2 |
| 3000 | €22,859,717.60 | €7619.91 | 101% | 13.96 | 2 |
| 3245 | €16,815,002.93 | €5181.82 | 66% | 8.79 | 2 |
| 3300 | €16,806,605.07 | €5047.03 | 65% | 8.62 | 2 |
Table 4.
Net Present Value (NPV), normalized NPV with the plant capacity, Internal Rate of Return (IRR), Profitability Index (PI) and Payback time (PBT) for the different types of cogenerator plant capacities with the operating function of electrical load following.
Table 4.
Net Present Value (NPV), normalized NPV with the plant capacity, Internal Rate of Return (IRR), Profitability Index (PI) and Payback time (PBT) for the different types of cogenerator plant capacities with the operating function of electrical load following.
| Plant Capacity | NPV | nNPV | IRR | PI | PBT |
|---|---|---|---|---|---|
| 245 | €5,622,120.40 | €22,947.43 | 144% | 20.37 | 1 |
| 300 | €7,271,290.50 | €24,237.64 | 164% | 23.33 | 1 |
| 330 | €7,755,099.59 | €22,157.43 | 165% | 23.50 | 1 |
| 400 | €9,521,708.27 | €23,804.27 | 180% | 25.71 | 1 |
| 490 | €11,190,561.73 | €22,837.88 | 187% | 26.75 | 1 |
| 600 | €13,638,818.32 | €22,731.36 | 202% | 28.87 | 1 |
| 650 | €14,436,134.03 | €22,209.44 | 203% | 29.13 | 1 |
| 800 | €18,379,397.78 | €22,974.25 | 228% | 32.74 | 1 |
| 950 | €22,469,412.78 | €23,652.01 | 250% | 36.10 | 1 |
| 1350 | €32,828,788.13 | €24,317.62 | 295% | 42.72 | 1 |
| 1500 | €35,883,170.92 | €23,922.11 | 302% | 43.84 | 1 |
| 1745 | €39,265,264.43 | €22,501.58 | 249% | 35.87 | 1 |
| 1800 | €40,886,064.65 | €22,714.48 | 251% | 36.17 | 1 |
| 1830 | €41,055,220.56 | €22,434.55 | 248% | 35.74 | 1 |
| 1900 | €42,539,676.68 | €22,389.30 | 248% | 35.78 | 1 |
| 1990 | €43,698,785.56 | €21,959.19 | 245% | 35.33 | 1 |
| 2100 | €45,764,754.19 | €21,792.74 | 246% | 35.45 | 1 |
| 2150 | €46,306,026.38 | €21,537.69 | 244% | 35.24 | 1 |
| 2300 | €49,722,535.89 | €21,618.49 | 250% | 36.03 | 1 |
| 2450 | €53,661,901.44 | €21,902.82 | 258% | 37.24 | 1 |
| 2850 | €60,761,329.20 | €21,319.76 | 265% | 38.29 | 1 |
| 3000 | €62,953,078.18 | €20,984.36 | 266% | 38.45 | 1 |
| 3245 | €64,438,082.38 | €19,857.65 | 234% | 33.68 | 1 |
| 3300 | €65,056,159.47 | €19,536.38 | 232% | 33.38 | 1 |
Disclaimer/Publisher’s Note: The statements, opinions and data contained in all publications are solely those of the individual author(s) and contributor(s) and not of MDPI and/or the editor(s). MDPI and/or the editor(s) disclaim responsibility for any injury to people or property resulting from any ideas, methods, instructions or products referred to in the content. |
© 2023 by the authors. Licensee MDPI, Basel, Switzerland. This article is an open access article distributed under the terms and conditions of the Creative Commons Attribution (CC BY) license (https://creativecommons.org/licenses/by/4.0/).
Share and Cite
MDPI and ACS Style
Battista, G.; Vollaro, E.d.L.; Vallati, A.; Vollaro, R.d.L. Technical–Financial Feasibility Study of a Micro-Cogeneration System in the Buildings in Italy. Energies 2023, 16, 5512. https://doi.org/10.3390/en16145512
AMA Style
Battista G, Vollaro EdL, Vallati A, Vollaro RdL. Technical–Financial Feasibility Study of a Micro-Cogeneration System in the Buildings in Italy. Energies. 2023; 16(14):5512. https://doi.org/10.3390/en16145512
Chicago/Turabian StyleBattista, Gabriele, Emanuele de Lieto Vollaro, Andrea Vallati, and Roberto de Lieto Vollaro. 2023. "Technical–Financial Feasibility Study of a Micro-Cogeneration System in the Buildings in Italy" Energies 16, no. 14: 5512. https://doi.org/10.3390/en16145512
Note that from the first issue of 2016, this journal uses article numbers instead of page numbers. See further details here.