Abstract
One of the main sectors that contribute to climate change is the buildings sector. While nearly zero-energy buildings are becoming a new norm in many countries in the world, research is advancing towards energy flexibility and resilience to reach energy efficiency and sustainability goals. Combining the energy flexibility and energy resilience concept is rare. In this article, we aim to investigate the effect of energy efficiency in a new single-family building on the energy flexibility potential and resilience characteristics and compare these with those for an old building in the cold climate of Finland. These two objectives are dependent on the buildings’ respective thermal mass. The heat demands of the two buildings are compared. Their technical and economic performance are calculated to compare their flexibility and resilience characteristics. Dynamic simulation software is used to model the buildings. The results show that the old building has better flexibility and higher energy cost savings when including the energy conservation activation strategy. In the old building, savings can be around EUR 400 and flexibility factor can be around 24–52% depending on the activation duration and strategy. The new building, due to higher efficiency, may not provide higher energy cost savings, and the energy conservation activation strategy is better. In the new building, savings can be around EUR 70 and the flexibility factor reaches around 7–14% depending on the activation duration and strategy. The shifting efficiency of the new house is better compared to that of the old house due to its higher storage capacity. For energy resilience, the new building is shown to be better during power outages. The new building can be habitable for 17 h, while the old building can provide the same conditions for 3 h only. Therefore, it is essential to consider both energy flexibility and resilience as this can impact performance during the energy crisis.
1. Introduction
Climate change is one of the biggest challenges that is being faced. The transition towards a sustainable society requires buildings to be flexible and resilient to reduce climate change, emissions and energy crises. Therefore, the European Union (EU) plans to include renewable energy sources in an amount of 40% until 2030 in the energy mix and increase it further until 2050 compared to 1990 levels towards carbon neutrality [1,2]. Building accounts for almost 40% of the total CO2 emissions and, therefore, buildings can play a major role in CO2 emission reduction [3]; the Directive on Energy Performance of Buildings (EPBD) has been introduced to decarbonize the building stock by 2050 [4]. The reduction in emissions, integration of renewables and reduction in peak loads can be carried out by including energy flexibility in a building. Another challenge faced now is the energy crisis, which is causing prolonged power outages to buildings. Due to an increase in ambient temperature and climate change, multiple climate-related extreme events such as forest fires, extreme temperatures, storms and heavy rain occur in different regions resulting in grid loss and blackouts [5]. These events are becoming more visible in recent times, and include floods in Germany and the United States of America and forest fires in Greece, Italy and Turkey. With rapid urbanization and the eminent threat of climate change, these events can have an impact on a building’s energy infrastructure and its occupants due to grid loss [6]. Other factors of the energy crisis include human-made factors such as political issues between Russia and Ukraine that are causing energy and power shortages globally due to supply chain issues. Therefore, buildings have to be energy-resilient to address periods of power outage and flexible to reduce energy consumption and save costs.
1.1. Energy Flexibility
Energy flexibility can assist in reducing CO2 as it addresses the effective implementation of renewable energy generation, reduces peak load, balances energy use in the grid and helps in reducing the price for the end user. The energy consumption of a building can be increased when the prices are low or it can be reduced when the prices are high [7], e.g., increasing the indoor temperature when the prices are low or decreasing the temperature when the prices are high while keeping thermal comfort [8]. This modulation or activation is also known as a demand response, i.e., shifting the energy use based on signals such as weather and price.
The importance of the demand response or energy flexibility is increasing with the increase in energy prices [9,10]. The financial aspect and benefits have to be identified. Various studies have been carried out to show the benefits of energy flexibility [11,12]. It has been found that the operation of a ground-source heat pump based on price signals can save up to 15% of the energy costs [13] in the cold climate. Another study showed that controlling the heating and cooling of a building can save up to 11% of the energy cost in warm climatic conditions [14]. Similarly, it has been found that 14% of the energy demand and cost can be reduced in commercial buildings by implementing energy flexibility for heating and cooling [15]. An experimental study shows that the energy flexibility action can reduce the energy cost by 4% depending on the flexibility options available [16]. Integrating solar energy and energy storage such as phase change materials [17], batteries or tanks [16] can also be used for better flexibility. All the studies show that further analysis is needed to identify the benefits of energy flexibility in terms of cost and flexibility. Moreover, the benefit of such a modulation in cold climatic regions has been further analyzed especially for different ages of buildings. Another important factor is the control strategies for the activation. Usually, set point temperatures of indoor air are used for energy flexibility; this may cause uncomfortable indoor conditions. Studies showed that energy saving can be up to 20% in Mediterranean climatic conditions through varying the indoor air’s set point temperature and heat pump operation [18]. However, there is a challenge of deteriorating thermal comfort depending on weather conditions. Another study showed that in Danish climatic conditions, there is a potential to use thermal mass to reduce the energy demand and cost; however, there is a possibility of overheating [8] in new buildings. In Finland, about 43% of the buildings were built before the 1980s and renovating them will take time. Therefore, the energy flexibility potential and control strategies both in the old and new buildings in terms of heating have to be identified and can help in reducing the energy costs and energy demand, and improve the flexibility factor in cold climatic conditions. The flexibility factor is defined as a factor that is used to show the ability of a building envelope to shift the heating demand from high- to low-price hours or to shift the peak hours’ heating demand to that of low peak hours (based on weather conditions). This shifting is mainly carried out based on the activation of the thermal mass of the building using price or weather signals to control the heating system [8].
1.2. Energy Resilience
It is also vital that the transition towards a sustainable solution involves an adequate consideration of climate change, especially the occurrence of extreme events, to ensure the reliable minimum performance of a building’s energy systems in the long run to support the building occupants’ comfort and habitability. Methods to assess the impacts of extreme events produced by climate change and uncertainties in the design and performance of a residential building’s envelope need to be thoroughly investigated under Finnish climatic conditions. On the international level, research has been ongoing at the urban scale [19] and few studies are carried out on the building level for mild climatic conditions [19,20,21,22]. No research has been carried out at the building level for Finnish conditions [20]. In Finland, winters are extremely cold and the design temperature of outdoor air for the buildings’ systems is −26 °C in southern Finland and −38 °C in northern Finland [23]; therefore, occupants’ thermal comfort and habitability can be a big challenge. Therefore, the building has to be energy-resilient to maintain thermal comfort and habitability conditions. Research has been focused on ‘habitability’ as part of energy-resilient buildings [24] either for mild climates [25] or for overheating conditions under grid loss [21,22]. The concept of ‘habitability’ focuses on the indoor thermal conditions and comfort and it refers to the length the building can remain in habitable thermal conditions after power loss through a reduction in heat transfer, natural ventilation and natural light [26].
Energy-resilient buildings is an emerging concept that is increasingly used to represent the performance of buildings during grid power loss caused in extreme climatic events such as fires, extreme temperature storms, heavy rain, etc. [27]. Energy resilience in buildings is defined as the ability of a building to provide and maintain the minimum level of thermal comfort and habitability, and also to provide essential services, such as domestic hot water, ventilation and basic electrical power within the building, during grid power loss which challenges the normal operation of a building [28,29]. Energy-resilient residential buildings are important to be studied because 87% of the time is spent indoors by occupants in many developed countries [30] and occupants’ thermal comfort is an essential service that a building must provide. However, the energy-resilient building concept has not yet been adequately explored in the cold climate of Finland, as its definition has not been clearly articulated and assessment is mostly carried out at the urban scale [31]. For this reason, habitability thresholds, boundary conditions and methods are needed to be defined, which requires extensive research on the extreme cold winters of Finland. Additionally, research where the aim is to evaluate both energy flexibility and resilience together is scarce. Therefore, a holistic study is needed that can not only address the energy flexibility issues but also consider and presents the energy resilience issues in cold climatic conditions.
This article contributes to analyzing the interaction between the energy flexibility and resilience of a building and addresses the research gap that exists in these connections. The novelty of the study is the close comparison between the energy performance of the old and new building (detached house) and highlighting the important link between the energy flexibility and resilience of the buildings. The technical and economic analyses of the buildings are carried out as case studies, that aim to achieve energy flexibility and resilience in Finland as an illustration of the Nordic climate. As no regulations or guidelines exist for the link between energy resilience and flexibility in cold climates, this article addresses this key interlink and gap. The objective of the article is to develop and combine the methods that can improve the energy flexibility of old and new buildings based on price signals and also to present the impact of thermal mass activation durations on building energy performance. Furthermore, a technical framework of energy-resilient buildings and their application in the Finnish environment is introduced. The focus of the study is on the heating energy and demand of the simulated buildings and neither renewable energy sources nor auxiliary energy storage (electrical or heat) is considered. This article is useful not only for cold climatic regions, such as the Nordics, Scandinavia, Canada, China, and the United States of America, but it is useful for the international perspective as well, as similar approaches and methods can be used in various climatic zones such as arid, tropical, Mediterranean, etc., to control and to estimate the performance of a building in terms of energy flexibility and energy resilience. The present study scope is limited to the modeling, computational and simulation activity and no experimental work is carried out. Moreover, no real or pilot building exists in the Finnish climatic conditions that integrate energy flexibility and resilience together. The buildings are modeled and simulated using the TRNSYS (Transient System Simulation Tool) [32] dynamic simulation software, which is widely used in research and technical projects. The TRNSYS 17 software is used and validated in various energy projects such as in Finland, [33] Carilsheim, Germany [34], and in Drake Landing Solar Community, Canada [35]. The modeled buildings in the article are typical archetype buildings based on the Finnish buildings’ regulations [23] and compared against the typical building parameters in Finland [33,36]. Simulations for energy flexibility and resilience are required in the context of residential buildings in the Nordic region that can be used to provide basic knowledge and a computational model for future experiments. These buildings can soften the impact of high energy costs and provide flexibility. Moreover, they can provide resilience against the energy crisis that is now evident.
This method can further be applied to other types of buildings in the Nordics and in the global level. The paper structure is as follows. Section 2 defines the method used in the article. The residential building design and parameters are mentioned in Section 3. The energy flexibility operation, control and component description are discussed in Section 4. The energy flexibility and cost calculation methods are mentioned in Section 5. The results and detailed discussion about energy flexibility are mentioned in Section 6. Section 7 analyzes and describes the energy resilience of the same old and new buildings in the cold climate. Finally, the conclusions are mentioned in Section 8.
2. Method
Dynamic simulation is used to design and analyze the energy flexibility and resilience performance of the old and new buildings. The simulation method, input specifications, control operations of the building system, and technical and economical calculation methods are defined in detail in the following sections.
3. Simulation Specification
The input parameters for the buildings are described in detail in Section 3.1.
3.1. Input Values for Building Simulation
Figure 1 shows the typical building model that was built and simulated in the TRNSYS simulation software. The building (living space) is considered a single zone and the attic is not considered for calculations. The building’s heating system is assumed to be an ideal heater connected to the grid.
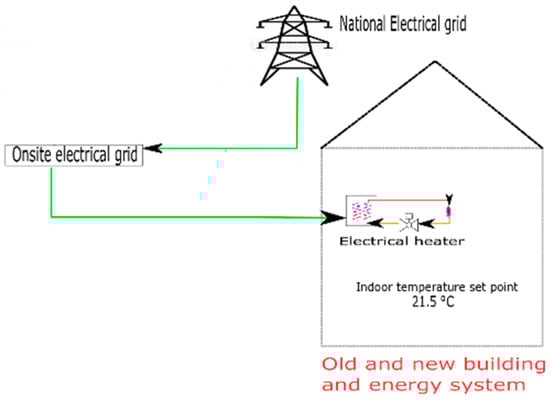
Figure 1.
Case studies; old and new building zone in Finland. Green line shows the electricity flow, red line shows the supply water (hot) flow and orange line shows the return water (warm) flow.
3.1.1. Old Building
The building follows the Finnish buildings’ regulation of the 1970s [23]. The parameters of the building are shown in Table 1.

Table 1.
The parameters of the old building under study [36,37].
3.1.2. New Building
The building follows the Finnish regulation [23]. The parameters of the building are shown in Table 2.
Table 2.
The parameters of the new building under study [36,37].
3.2. Simulation Software: TRNSYS
An energy simulation software known as TRNSYS 17 [32,34] was used to model and perform a dynamic simulation of the energy systems. This simulation software is widely used by the scientific community, for instance in [38,39], and validated by the Drake Landing Community, in Canada [35]. In TRNSYS, the modules used were as follows: building (TYPE 56), control of indoor air set point temperature (TYPE 2b, 14 h), temperature control (TYPE 1233), and weather data (TYPE 15). TRNSYS is used for modeling buildings and their control systems as it provides flexibility [40].
4. Building Thermal Energy System Operation
In this article, the energy conservation and storage potential of the building’s thermal mass is estimated. The reference indoor air set point temperature for the space heating of the zone is set at 21.5 ± 0.5 °C. This space heating temperature corresponds to the recommendation of the Finnish Society of Indoor Air Quality and Climate [41] and to the Finnish building regulations [23]. In this article, two activation methods are simulated for the typical heating period and also for the whole year. This is carried out to estimate the performance and behavior of the different types of buildings in detail under various situations of activation. Activation is carried out for different starting times and duration between 1 h–18 h. A duration of more than 18 h is not considered as occupants may not accept long changes in comfort [8] and uncertainties are higher in terms of energy cost and weather prediction. Activation is carried out by varying the indoor air set point temperature of the zone to evaluate the different performances of the two types of buildings in Finnish conditions. The two activation methods that are applied are discussed in Section 4.1. Space cooling and domestic hot water are not considered in the calculation.
4.1. Controls of the Thermal Energy System
The two activation methods that are applied for energy flexibility are heat energy conservation and heat energy storage. The heating system is assumed to be ideal and the building is heated using the heaters inside the zone.
In the method of heat energy conservation for energy flexibility, the indoor air set point temperature of the space heating is decreased by 1.5 °C depending on the price signal. This is selected as it is an acceptable range for the variation in the space heating temperature inside the building and for comfort [41].
In the method of heat energy storage for energy flexibility, instead of reducing the indoor air set point temperature of space heating, it is increased by 1.5 °C depending on the price signal. This is c to keep the change in the space heating temperature reasonable and for comfort [41].
5. Energy and Cost Calculations for Flexibility Assessment
5.1. Energy Flexibility Cases
Two types of energy flexibility cases are discussed in the article to analyze the performance of the old and new buildings. Weather-based and cost-based energy flexibility are considered. Weather-based analysis is performed to study the behavior while cost based flexibility is carried out to identify the cost saving potential and flexibility factor.
The building is heated during the heating period at the indoor air set point temperature to reach a steady period, and activation is carried out during the average heating period. The results of energy storage and energy conservation activations are evaluated separately, as they have different characteristics.
Some indicators are extracted from the simulations [8]:
Qheat = Qheat (activation) − Qheat (reference)
Equation (1) shows the difference between the heat demand in the reference and the activation cases. In some scenarios, during the activation of the thermal mass, the energy consumption increases compared to that of the reference case (the reference indoor air set point temperature scenario). In this scenario, the amount of energy used is called charge heat (Qheat charge) as shown in Equation (2). Similarly, energy consumption decreases compared to that of the reference case (the reference indoor air set point temperature scenario). In this scenario, the amount of energy used is called discharge heat (Qheat discharge) as shown in Equation (3). The ratio of these two factors is called shifting efficiency (as shown in Equation (4)). On the other hand, in the case of conservation, this ratio is greater than 1 as energy consumption decreases. Equation (5) shows the flexibility factor; in other words, it shows the energy flexibility performance of the building. It shows the ability of the building to shift the energy use from certain hours to other hours based on the control strategies (such as shifting from high-price to low-price hours or using weather signals). It considers the energy charged and discharged based on the hourly energy price signals that vary at each time step. The energy price signal used for calculation is explained in Section 5.3. The energy flexibility potential of the building is better if the flexibility factor is high. Compared to the reference case, when additional energy is charged in the building to increase the indoor temperature based on the price signal, the heating energy is higher than the reference heating power and it is called a low-price Qheat in Equation (5). Similarly, compared to the reference case, when the energy is discharged or removed from the building to decrease the indoor temperature based on the price signal, the heating energy is lower than the reference heating energy and it is called a high-price Qheat in Equation (5). These energy flows are included in Equation (5) to calculate the flexibility factor. According to Equation (5) if no heat is charged or discharged and the heating use is the same in low- and high-price periods, then the factor is 0. The limitation of this flexibility factor is that it can lead to different values when it is used for other signals such as grid and climatic conditions [8].
5.2. Weather
In this paper, the weather data used are from the Helsinki Vantaa airport for the year 2016 [42]. The hourly ambient temperature and the duration curve of the ambient temperature are shown in Figure 2.
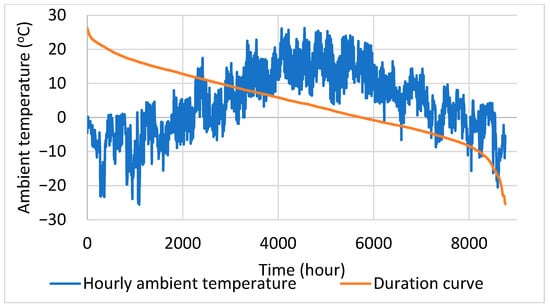
Figure 2.
Hourly weather profile and duration curve of Helsinki, Finland.
5.3. Energy Cost Calculation
The hourly electricity price for the year 2016 is used for the energy cost calculation. The cost data are used from Nordpool and provide the real-time electricity price for each hour; see Figure 3. The cost includes the distribution and taxes [9]. This study is about the operational cost of the energy in the building. Figure 3 shows the duration curve of the electricity price and the price range is between 15 cents/kWh and 10 cents/kWh during most of the hours.
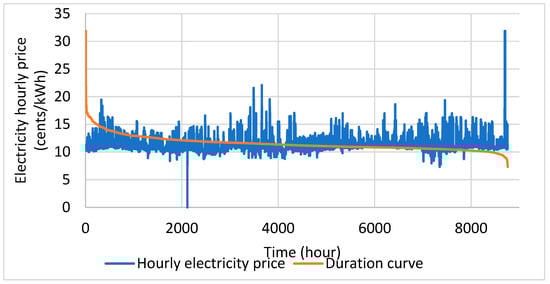
Figure 3.
The hourly electricity price and duration curve in Finland year 2016 [9].
6. Results and Discussion
The result is divided into two main sections. Section 6.1 analyzes and describes the energy flexibility and activation behavior of the old and new buildings under heat energy conservation and storage activation using ambient temperature as a control signal only, and energy cost is not considered. For this study, a short duration (i.e., winter week) is considered to analyze the activation, temperature and heating behavior in detail as heating energy is essential in cold regions. This is carried out to analyze the energy flexibility potential and behavior of the old and new building structure with respect to the ambient temperature in detail. These initial findings are afterward extended for the whole year in Section 6.2, to study the impact of activation based on the findings in Section 6.1. Finally, Section 6.2 analyses and describes the energy flexibility and activation of the old and new buildings considering the electricity price for the whole year. This is carried out to analyze the energy flexibility potential of the old and new building structure based on energy price signals.
6.1. Weather Based Activation of the Building Mass
Section 6.1.1 presents the old building’s heat energy storage and the conservation activation of the building mass. Section 6.1.2 presents the new building’s heat energy storage and the conservation activation of the building mass.
6.1.1. Old Building
Heat Energy Storage
It is assumed that during heat energy storage activation, the indoor air set point temperature of the zone is increased by 1.5 °C. This is carried out to heat the thermal mass of the building and store heat, so it can be released when the indoor air set point temperature is back to the reference point of 21.5 ± 0.5 °C. Different activation durations are considered such as 2 h, 6 h and 18 h and compared against the reference case (without activation). Different duration hours are simulated to analyze the behavior under the short and long durations of activation. The change in the indoor air set point temperature is shown in Figure 4. The hours selected for analysis are from 615 to 687 h and the activation hour is 638 h. This duration is selected when the ambient temperature is cold at around −10 °C–−15 °C, which is the typical average temperature in winters in Southern Finland. The same time window is selected in the following new building case. It can be observed that when 2 h is selected for the activation duration, the building’s indoor temperature cannot reach the indoor air set point temperature of 23 °C. However, when 6 and 18 h are selected for the activation, the building’s indoor temperature reaches the indoor air set point temperature of 23 °C.
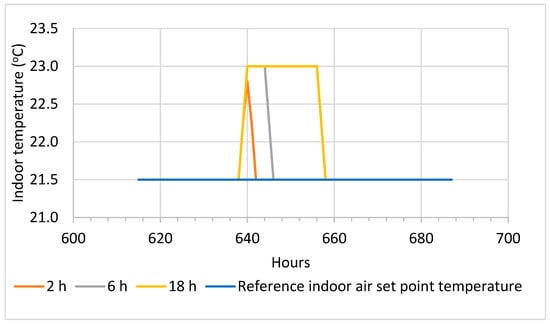
Figure 4.
Indoor air temperature during heat energy storage activation in the old building.
Figure 5 shows the heat power demand for the reference case and for the activation hours of 2 h, 6h and 18 h. In all the activation durations, when the indoor air set point temperature increases to 23 °C the heating power increases. As soon as the indoor air set point temperature is returned to the reference indoor air set point temperature of 21.5 °C, the heating power reduces and goes below the reference scenario’s heat power (blue line) for a few hours until it returns to the reference heating line.
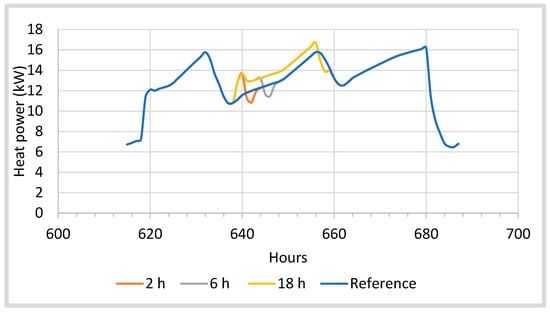
Figure 5.
Heating power activation during heat energy storage in the old building.
Figure 6 shows the energy charged (blue bar) and discharged (orange bar) to reach the indoor air set point temperature of 23 °C for the activation of energy storage compared to the reference scenario’s indoor air set point temperature of 21.5 °C. It can be observed that the amount of the energy charged and discharged varies depending on the activation duration. Generally, the energy charged and that discharged increase with the increase in the activation duration. The energy charge increases from 3.8 kWh (for 2 h) to 19 kWh (for 18 h). Similarly, the energy discharge increases from 1.9 kWh (2 h) to 2.41 kWh (for 18 h) as the energy stored in the structure is released back to the zone and this reduces the heating power to heat the zone compared to that of the reference scenario.
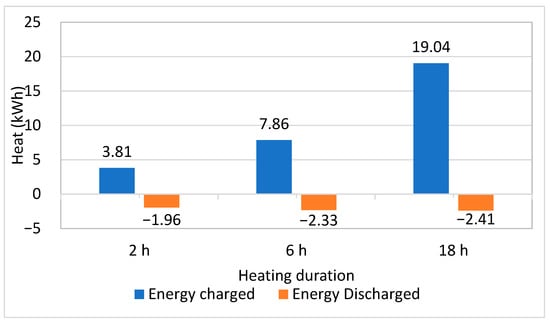
Figure 6.
Energy charged and discharged during heat energy storage in the old building in Finland.
Figure 7 shows that in the case of storage activation, the shifting efficiency is less than one. The shifting efficiency reduces when the activation duration increases. This is because the longer the charging hour, the higher the losses to the ambient surroundings, and the energy discharge to the zone is less. The energy is mainly lost in the ambient surroundings due to the cold ambient temperature, and the envelope of the old building is inefficient (low U-value) in storing heat, resulting in higher losses. Similar behavior is observed in [8].
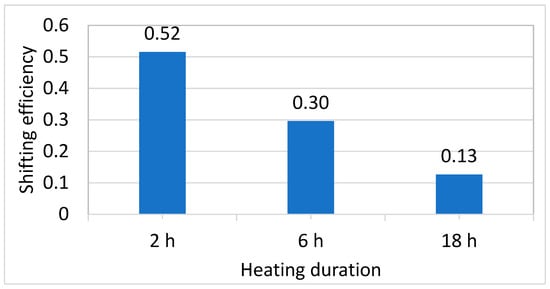
Figure 7.
Shifting efficiency during heat energy storage in the old building.
Figure 8 shows the energy flexibility factor of the old building under the three activation durations. Equation (5) [8] is used for the flexibility factor calculation. Compared to the reference case, when additional energy is charged in the building to increase the indoor temperature to 23 °C, the heating energy (2 h, 6 h, 18 h) is higher than the reference heating power and it is called Qheat charged. Similarly, compared to the reference case, when the energy is discharged from the building to decrease the indoor temperature to 21.5 °C, the heating energy is lower than the reference heating energy and it is called Qheat discharged.
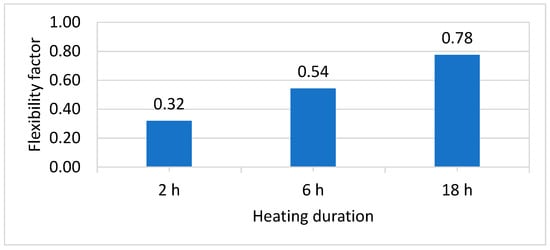
Figure 8.
Flexibility factor during heat energy storage in the old building.
It can be observed that the energy flexibility factor increases as the activation duration increases. This is due to an increase in the difference between the energy charged and discharged as the activation duration increases. With higher activation durations, the amount of energy storage (energy charged) is larger while the energy discharge is lower resulting in higher flexibility as shown in Figure 8.
Heat Energy Conservation
It is assumed that depending on the weather, the indoor air set point temperature of the zone is decreased by 1.5 °C to 20 °C. This is carried to save energy for a time and after this, the set point is returned to the reference point of 21.5 °C. In the heat energy conservation strategy for old and new buildings, energy discharge occurs when the temperature drops from 21.5 °C to 20 °C, due to a decrease in the set point temperature, and energy charge refers to when the temperature increases from 20 °C to 21.5 °C (the reference set point). The hours selected for analysis are from 615 to 687 h and the activation hour is 638 h. The change in the indoor air set point temperature is shown in Figure 9. It can be observed that when energy conservation is carried out, the temperature drops to 20 °C in all the activation hours (2 h, 6 h and 18 h). Compared to the energy storage (Figure 4), the temperature drop is fast in all activation cases. This shows that the losses from the envelope are high.
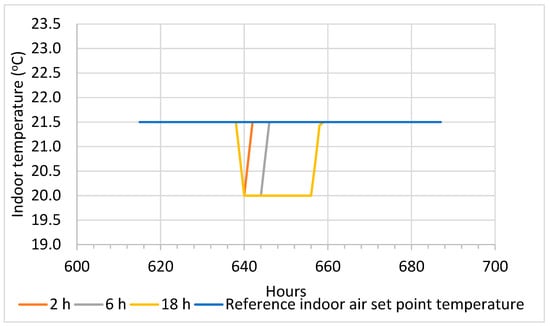
Figure 9.
Indoor air temperature activation during heat energy conservation in the old building.
Figure 10 shows the heat power demand for the reference case and the activation hours of 2 h, 6 h and 18 h. In all the activation durations, when the indoor air set point temperature decreases to 20 °C the heating power decreases. As soon as the indoor air set point temperature is returned to the reference indoor air set point temperature of 21.5 °C, the heating power increases (orange, grey and yellow line) and goes above the reference scenario heat power (blue line) for a few hours and then returns to the reference, and this is due to the rebound effect.
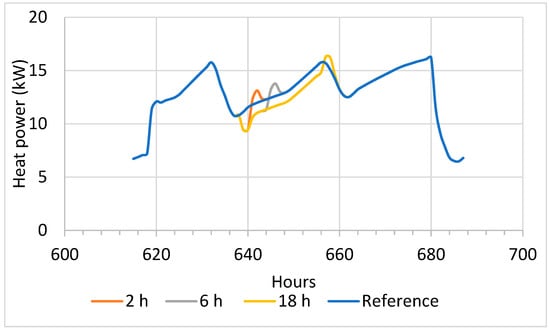
Figure 10.
Heating activation during heat energy conservation in the old building.
Figure 11 also shows the energy discharged (orange bar) when the indoor air set point temperature is modulated; the activation of energy conservation occurs and the indoor air set point temperature is reduced to 20 °C. Figure 11 shows the energy charged (blue bar) to reach the reference indoor air set point temperature of 21.5 °C after activation. It can be observed that the energy charge and energy discharged vary depending on the activation duration. Generally, the energy discharge and charge increase with the activation duration. The energy discharged increases from 2 h to 18 h. The energy charge increases from 2 h to 18 h as a greater amount of energy is needed to return back to the reference indoor air set point temperature.
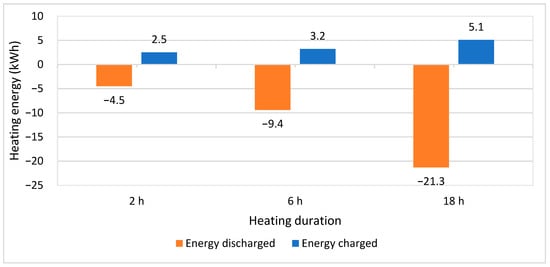
Figure 11.
Energy charged and discharged during heat energy conservation in the old building.
Figure 12 shows that in the case of conservation activation, the shifting efficiency is higher than one. The increase in efficiency is higher as the duration of activation increases. This is because the amount of energy needed to recharge increases as activation increases and also the losses are higher. Similar behavior is observed in [8].
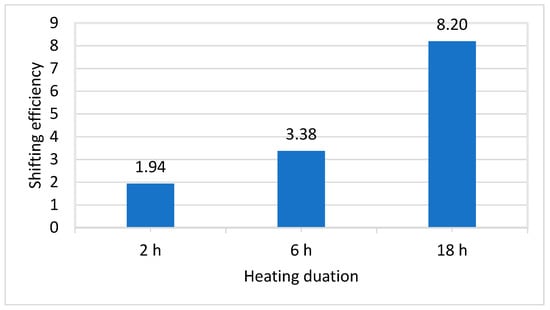
Figure 12.
Shifting efficiency during heat energy conservation in the old building.
Figure 13 shows the energy flexibility of the old building under various activation durations for energy conservation. Compared to the reference case, when energy is discharged from the building to lower the indoor temperature to 20 °C, the heating energy (2 h, 6 h, 18 h) is lower than the reference heating power and it is called Qheat discharged. Compared to the reference case, when the energy is charged in the building to increase the indoor temperature to 21.5 °C, the heating energy is higher than the reference heating energy and this energy flow is called Qheat charged. The same approach is used in Section 6.1.2.
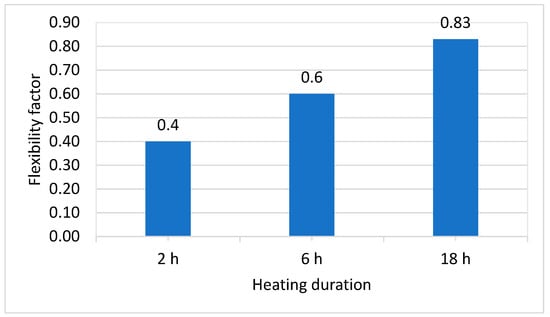
Figure 13.
Flexibility factor during heat energy conservation in the old building.
Similar behavior is observed as in the case of heat energy storage case. As the activation hour increases, the difference between the energy charged and discharged increases. With higher activation hours, the energy charged is larger while the energy discharge is lower compared to that charged, resulting in higher flexibility as shown in Figure 13.
6.1.2. New Building
Heat Energy Storage
A similar activation method is used for energy storage activation in the new building. The indoor air set point temperature of the zone is increased by 1.5 °C. The hours selected for analysis are from 615–687 h and the activation hour is 638 h as shown in Figure 14. Similar behavior can be observed in terms of energy storage activation of the old building (Figure 4). However, it can be observed that when 2 h is selected for activation in the new building, it can reach the indoor air set point temperature of 23 °C (Figure 14), whereas in the old building, the indoor temperature is not able to reach the indoor air set point temperature of 23 °C. This is due to poor insulation level in the old building’s envelope.
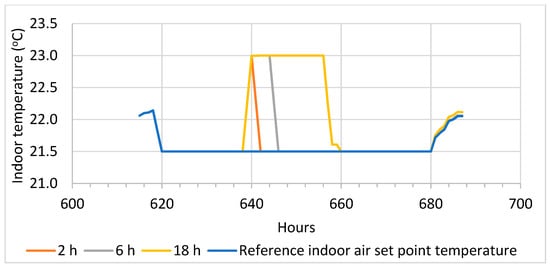
Figure 14.
Temperature activation during heat energy storage in the new building.
Figure 15 shows the heat power demand for the reference scenario and also for the activation hours of 2 h, 6 h and 18 h. It can be observed that compared to the energy storage scenario of the old building (Figure 5), the maximum peak heating power is lower for the new building (8 kW), as the new building envelope is efficient, whereas for the old building the maximum heat power is 15.7 kW. There are a few instances when the heating power reaches near zero in the new building case (Figure 15) at 658 h, whereas in the old building case, the heating power Figure 5 does not go close to zero. This is due to the energy-efficient envelope of the building and the thermal mass activation of the new building that releases the heat which is stored during activation.
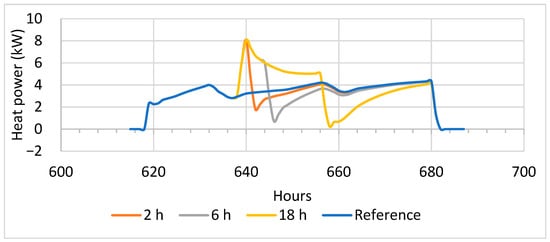
Figure 15.
Heating activation during heat energy storage in the new building.
Figure 16 shows the energy charged (blue bar) and discharged (orange bar) to reach the indoor air set point temperature of 23 °C for the activation of energy storage compared to the reference scenario’s indoor air set point temperature of 21.5 °C. It can be observed that the energy charge and energy discharge vary depending on the activation duration. In the energy storage case for the old building (Figure 6), the difference between the energy charged and discharged is large in each activation duration hour. In the new building, the difference between the energy charged and discharged is smaller in each activation duration hour. This again shows that new building is better at storing and using heat energy.
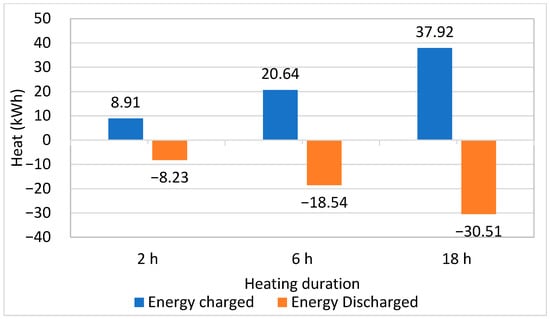
Figure 16.
Energy charged and discharged during heat energy storage in the new building.
Figure 17 shows that in the case of storage activation, the shifting efficiency is less than one. The shifting efficiency reduces when the activation hour increases and similar behavior can be observed in Figure 7 in the old building. However, the shifting efficiency of the new building in Figure 17 is better compared (92% maximum) to that of the old building in Figure 7 (a maximum of 52%). This is because the loss in the new building is smaller compared to that in the old building; therefore, the efficiency is better. Similar behavior is observed in [8].
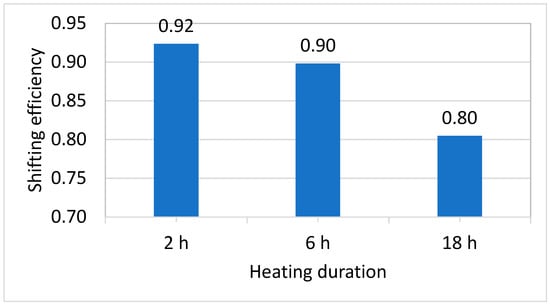
Figure 17.
Shifting efficiency during heat energy storage in the new building.
Figure 18 shows the energy flexibility of the new building under various activation hours. It can be observed that the energy flexibility increases as the activation hour increases. This is due to an increase in the difference between the energy charged and discharged as the activation hour increases. Compared to the energy flexibility in Figure 8 of the old building, the flexibility of the new building in Figure 18 is much lower (an 11% maximum). This is due to smaller amount of energy saving potential in terms of the absolute heating demand in the new building that results in lower energy flexibility in the old building.
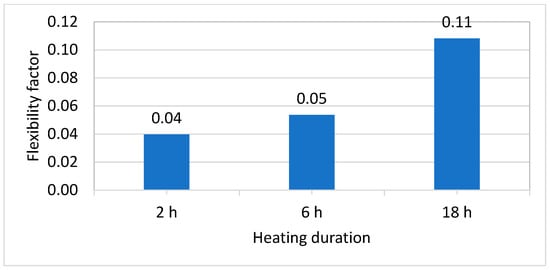
Figure 18.
Flexibility factor during heat energy storage in the new building.
Heat Energy Conservation
It is assumed that depending on the weather, the indoor air set point temperature of the zone is decreased by 1.5 °C. Different activation duration hours are considered. The change in the indoor air set point temperature is shown in Figure 19. However, in the new building (Figure 19), the zone temperature drops to 20.6 °C under activation for 2 h and also the temperature drop is slower compared to that of the old building (Figure 9). For the two other activation durations of 6 h and 18 h, the temperature drops to 20 °C. This shows that the losses from the envelope are lower in the new building compared to those in the old building. Hence, the former can maintain a high temperature and comfort for a longer duration compared to the old building.
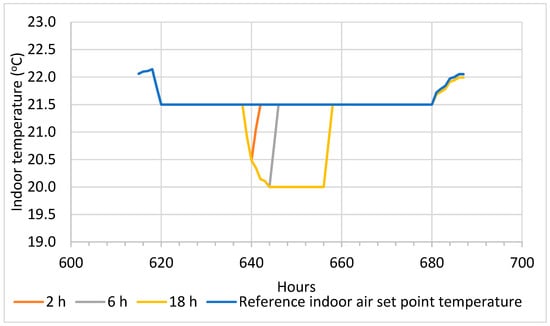
Figure 19.
Temperature activation during heat energy conservation in the new building.
Figure 20 shows the heat power demand for the reference scenario and also for the activation hours of 2 h, 6 h and 18 h for the new building. It can be observed that compared to the energy conservation scenario of the old building (Figure 10), the minimum heating power is lower for the new building, as the new building envelope is efficient. There are few instances when the heating power reaches zero for a total of 3 h (from 640 h to 643 h) in the new building case, see Figure 20, whereas in the old building case, the heating power, see Figure 10, does not reach zero. This is due to the energy-efficient envelope of the building and the thermal mass activation of the new building that releases the heat which is stored during activation.
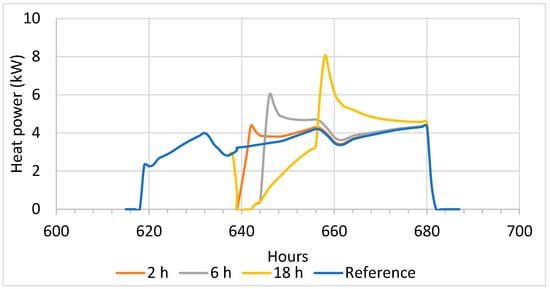
Figure 20.
Heating activation during heat energy conservation in the new building.
Figure 21 also shows the energy discharged (orange bar) and energy charged (blue bar) to reach the reference indoor air set point temperature of 21.5 °C. Similar behavior is observed in Figure 16; however, this occurs in the opposite direction of the energy flows.
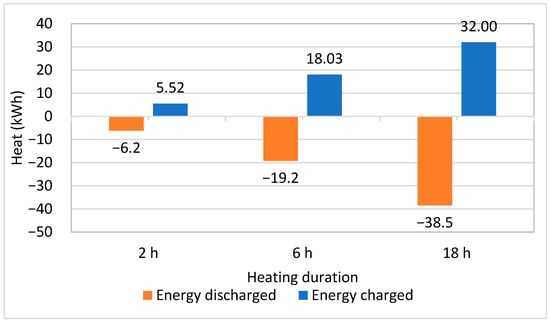
Figure 21.
Energy charged and discharged during heat energy conservation in the new building.
Figure 22 shows that in the case of conservation activation, the shifting efficiency is higher than one. The shifting efficiency of the new building in Figure 22 is better compared to that of the old building in Figure 12 as it is closer to one. This is because the losses in the new building are smaller. The losses increase as the activation hour increases. Similar behavior is observed in [8]. The amounts of heat energy discharged and charged are close to each other in the new building compared to those of the old building. In the old building, the energy discharged is higher compared to the charged energy. This shows that the new building can store energy efficiently compared to the old building as the losses are less. It is also observed that the shifting efficiency is close to one in the new building and it is higher than one in the old building. This again shows that the discharged energy, i.e., the energy loss to the ambient surroundings is higher in the old building compared to that in the new building. This is the reason why the new building takes a longer time to reach the set point of 20 °C and it allows it to maintain the indoor temperature effectively in the heat conservation case as it can better store the heat energy.
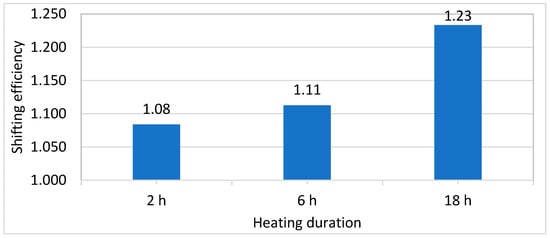
Figure 22.
Shifting efficiency during heat energy conservation in the new building.
Figure 23 shows the energy flexibility of the new building under various activation durations. Compared to the energy flexibility (Figure 13) of the old building, the flexibility of the new building (Figure 23) is much smaller. This is due to the large amount of savings in terms of absolute heating energy in the old building that results in higher energy flexibility in the old building. Therefore, the new building has a lower flexibility factor compared to the old building.
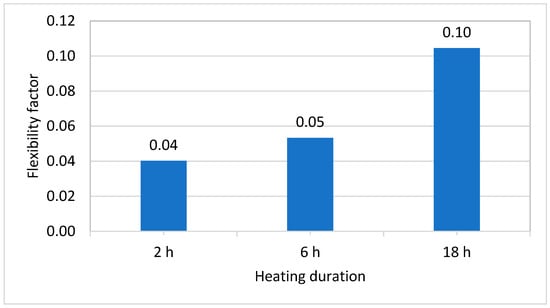
Figure 23.
Flexibility factor during heat energy conservation in the new building.
6.2. Flexibility Based on Electricity Price
This section aims to present the energy flexibility potential in the old and new buildings, using the price signals (as shown in Figure 3) [9]. The study is carried out to show the effect of energy conservation and storage activation on thermal mass activation, to save energy costs. For the electricity price signal, the Nordpool price is used (Figure 3). The price signals are divided based on the percentile. The price above the 80% percentile is assumed to be a high price and the price below 20% is assumed to be a low price. The window for the price signal that is analyzed to be marked as a high price or low price is 12 h (at each present time step of 1 h). This 12 h time window moves with the following time step. The rest of the price signals are normal prices. A similar approach is proposed by the authors of [16,43]. Using the price signals and percentiles, different activation cases are generated to identify the flexibility actions to be taken in the old and new buildings. Section 6.2.1 shows the results of the old building and Section 6.2.2 shows the results of the new building.
6.2.1. Old Building
Heat Energy Storage
In this situation, the indoor air set point temperature of the zone is increased by 1.5 °C to 23 °C. Four activation durations are considered, which are 1 h, 2 h, 4 h and 6 h, and compared against the reference case (without activation). A long activation duration is not considered as it is found in Section 6.1, that losses are high, the window for the activation duration is long as price varies and short activation durations are better in terms of shifting efficiency. The impact on the annual total energy cost and flexibility factor due to the activation duration can be observed in Figure 24.
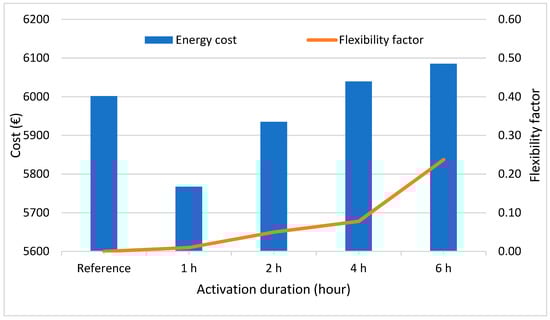
Figure 24.
Yearly energy cost and flexibility factor during heat energy storage in the old building.
It can be observed that when 1 to 2 h is selected for activation, the building’s energy cost reduces from EUR 6001 (reference case) to EUR 5767 (for 1 h activation) and EUR 5935 (for 2 h activation), and it can benefit from storage control activation. In all the other activation durations, it increases to EUR 6039 (4 h activation) and EUR 6085 (6 h activation). This shows that for short activation durations, the building can save energy costs by storing excess heat and releasing it. However, for the longer activation durations, the losses through the envelope and windows are high and the building is not able to benefit from the increased energy storage by reducing the energy cost. Another source of heat loss is the exhaust air leaving the building which is lost to the ambient surroundings at higher temperatures. Due to these losses at higher temperatures, the building needs to be heated even though the price may be higher.
On the other hand, the energy flexibility factor is higher with longer activation durations, which is due to the higher variation in the energy charged and discharged under long activation durations. Hence, the energy flexibility increases with longer activation durations; however, the energy cost also increases.
Heat Energy Conservation
In this case, the indoor air set point temperature of the zone is decreased by 1.5 °C to 20 °C. Different activation durations are considered. The impact on the cost and flexibility factor due to the activation duration can be observed in Figure 25.
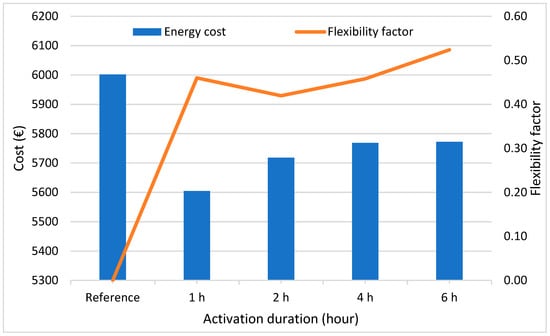
Figure 25.
Yearly energy cost and flexibility factor during heat energy conservation in the old building.
It can be observed that when 1 h, 2 h, 4 h and 6 h are selected for activation, the building’s energy cost reduces from EUR 6001 to EUR 5604 (for 1 h activation) and EUR 5772 (for 6 h activation). This shows that for short activation durations, the building is able to save significant amount of the energy cost (around EUR 400). However, the energy cost increases as the activation duration increases. This is because when the indoor air set point temperature is reduced for a longer duration to 20 °C, a larger amount of heat is needed to return to the reference indoor air set point temperature of 21.5 °C, resulting in an instantaneous increase in heat energy input as discussed in Section 6.1.1.
On the other hand, the energy flexibility factor is higher with longer activation durations, and this is due to higher variation in the energy charged and discharged under long activation durations. Hence, the energy flexibility may increase with longer activation durations, and the energy price may also increase.
6.2.2. New Building
Heat Energy Storage
In this situation, the indoor air set point temperature of the zone is increased by 1.5 °C to 23 °C. This is carried out to heat the thermal mass of the building and store heat, so it can be released when the indoor air set point temperature is back to the reference point of 21.5 °C. The impact on the cost and flexibility factor due to the activation duration can be observed in Figure 26.
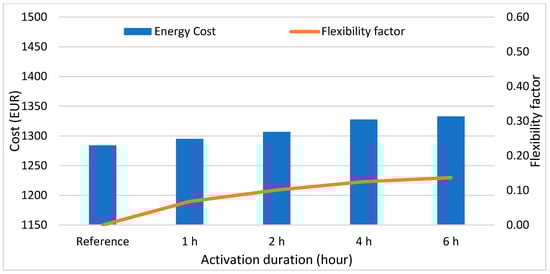
Figure 26.
Yearly energy cost and flexibility factor during heat energy storage in the new building.
It can be observed that the building’s energy price increases from EUR 1283 to EUR 1332 as the activation duration increases. This is because, due to the higher temperature, it results in higher losses in the new building. Similar behavior is observed; that is, higher energy costs in the old building (Figure 24). The losses through the envelope and windows are high and the building is not able to benefit from the increased energy storage. Another source of heat loss is the exhaust air leaving the building which is lost to the ambient surroundings at higher temperatures. Only for the short activation durations (1 h or 2 h), the old building (Figure 24) is able to reduce the energy cost as the heating demand is high in an old building and the use of energy storage is effective for short activation durations.
On the other hand, the energy flexibility factor is higher with longer activation durations, and this is due to the higher variation in the energy charged and discharged under long activation durations. Hence, the energy flexibility may increase with longer activation durations, and the energy price may also increase. However, compared to the energy flexibility (Figure 24) of the old building, it is around 50% for 6 h of activation, whereas the flexibility of the new building (Figure 26) is less at around 15% for 6 h of activation. This is due to a large amount of savings in terms of the absolute heating demand in the old building that results in higher energy flexibility in the old building.
Heat Energy Conservation
In this case, the indoor air set point temperature of the zone is decreased by 1.5 °C to 20 °C. The impact on the cost and flexibility factor due to the activation duration can be observed in Figure 27.
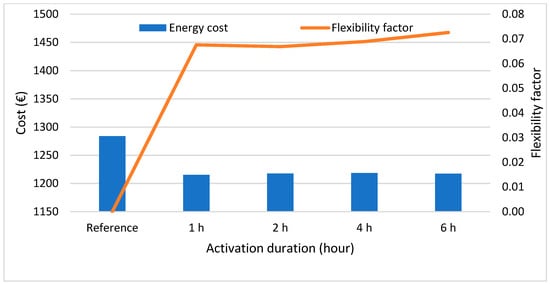
Figure 27.
Yearly energy cost and flexibility factor during heat energy conservation in the new building.
The building’s energy price reduces from EUR 1283 to EUR 1217 as the activation duration increases. This shows that for short activation hours, the building is able to save more in terms of costs compared to under large activation duration. However, the energy cost increases as the activation duration increases, although it remains lower than the reference energy cost. Compared to the energy storage scenario (Figure 26), the energy cost remains lower in the energy conservation scenario (Figure 27).
The energy flexibility factor is higher with longer activation durations, and this is due to the higher variation in the energy charged and discharged under long activation durations (Figure 27). Hence, energy flexibility may increase with longer activation durations, and the energy price may also increase. Compared to that in the new building’s energy storage scenario (Figure 26), the energy flexibility factor remains lower in the energy conservation scenario (Figure 27). Overall, the energy flexibility factor of the new building is smaller compared to that of the old building for both energy storage and conservation activation scenarios.
7. Energy Resilience of the New and Old Building
As discussed in the introduction, human-related activity is significantly driving climate crises according to the Intergovernmental Panel on Climate Change (IPCC) [44]. It is expected that in 20 years, human activities can cause global temperatures to rise above 1.5 °C from those in 1850–1900. As a result, disasters such as huge storms, fires and, heavy rains are very frequent and are becoming more visible in recent times. Therefore, the globe is expected to face increased extreme events of heat waves [45], longer warm seasons and extreme cold events, which can last for several days and be accompanied by power outages of electricity and heat. In addition to the climate-driven reasons, there are nowadays increased serious threats of power outages due to political conflicts, wars or accidents.
When a power outage takes place in times of very cold weather in winter, the challenge is whether or not buildings are still able to keep minimum habitable temperatures and provide minimum basic levels of services to its occupants. Although the probability of the occurrence of such events is low, it is increasing nowadays and is expected to be higher in the future. However, if the events take place, the impact will be very extensive on the health and life of people in buildings and on building systems and infrastructures [44].
Energy flexibility focuses on the energy saving and cost saving aspects of the building. However, during the activation of a thermal mass and indoor air set point temperature variation, there is a risk to the thermal comfort and habitable temperature inside the building. This risk becomes severe when a power outage occurs during cold weather conditions in Nordics. There is a risk of indoor room temperature decay especially when energy conservation activation continues and a power outage occurs. In this condition, the energy resilience of the building becomes important. This interaction and connection has not been studied under Nordic conditions and the regulations are not clear for this. Therefore, another novel aspect that this article discusses, and presents is a study on the performance of old and new residential buildings in the Finnish climate to find their thermal behavior in winter during a short-period power outage and their resilience characteristics. In a short-period outage (1–2 days), which can be either a controlled action, due to a shortage in power generation, or an uncontrolled one, due to unforeseen reasons, the question is about the occupant’s thermal comfort and the robustness duration that shows the energy resilience of the building. Controlled short-period outages of power to buildings in Finland can take place more often next winter due to challenges in supplying sufficient power.
The robustness period (RP) presents the duration for which the building’s indoor temperature can be maintained after a power outage [46]. The building is highly prepared for facing an outage if the the robustness period of the particular building is higher.
The reference indoor air set point temperature is 21.5 ± 0.5 °C which is required in any normal condition, whereas the robustness threshold is the point above which the performance (i.e., zone temperature) can be considered robust performance. If the zone temperature is below this point, the performance is not robust. The World Health Organization [47] recommends that for general health, well-being and safety, a minimum temperature of 18 °C is recommended in the cold seasons in cold climatic conditions. Therefore, 18 °C has been used as the minimum robustness threshold for old and new buildings. Moreover, 15 °C is chosen as the habitability threshold based on the study of old and new buildings. Below this point, it can be assumed that the building is not able to provide the minimum comfort conditions for its occupants and the building is not thermally resilient anymore.
The robustness period for the old and new buildings is presented in Section 7.1 and Section 7.2 respectively.
7.1. Old Building
The hours selected for the study are from hour 615 to hour 687 when the ambient temperature is around −10 °C–−15 °C (cold conditions; it is assumed that the power outage occurs at hour 637). The same time slot is assumed for further analysis. It can be observed that when the indoor air set temperature is 21 ± 0.5 °C, it drops to 18 °C (robustness threshold) in 3 h in an old building, when a power outage occurs and heating stops as shown in Figure 28 (orange line), and it drops to 15 °C in the next 5 h. On the other hand, when the indoor air set temperature is 18 °C, it drops to 14 °C in 3 h, when a power outage occurs at this point as shown in Figure 28 (blue line). When the minimum indoor temperature is 18 °C (as recommended by the WHO [47]), the building may not be able to provide thermal comfort as the robustness period is zero and the building may become inhabitable (less than 15 °C) as soon as a power outage occurs for a short duration. Therefore, depending on the indoor air set point temperature, ambient temperature, and the time when a power outage occurs, the robustness duration of the old building will also be affected which can impact the energy resilience of the building. It is essential to plan and manage the minimum indoor air set point temperature in the old building while keeping the energy crisis and resilience aspect in present times in mind. It is also found in Figure 28 (orange line) that when the electricity is restored in the building, it takes around 14 h to recover and reach the indoor air set temperature of 21.5 ± 0.5 °C.
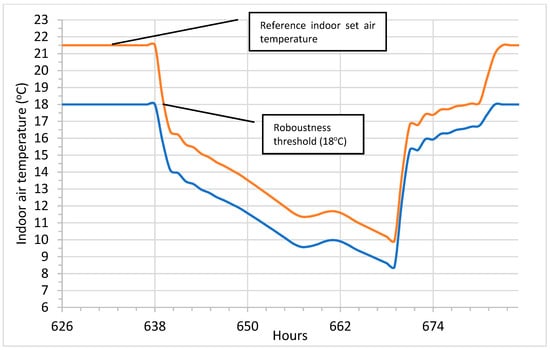
Figure 28.
Energy resilience of the old building and robustness period in cold climates under a power outage.
The Finnish building code [23] indicates 21.5 ± 0.5 °C as the design indoor air temperature during the heating season, and the decree of the Finnish Ministry of Social Affairs and Health [48] indicates 18 °C as the lowest room air temperature during the heating season. Therefore, for a short power outage in such old buildings, under the coldest weather, thermal comfort could be difficult to maintain for a longer duration. The effect of a loss of heating for several hours on people’s thermal comfort should be thoroughly studied, especially in context of old detached houses since the energy conservation measures in those houses are normally poor due to the low quality of the building envelope’s insulation, windows and air tightness.
7.2. New Building
It can be observed that when the indoor air set temperature is 21 ± 0.5 °C, it drops to 18 °C (robustness threshold) in 17 h in the new building when a power outage occurs and heating stops as shown in Figure 29 (orange line). On the other hand, when the indoor air set temperature is 18 °C, it drops to 15.5 °C in 17 h, when a power outage occurs at this point as shown in Figure 29 (blue line). When the operating temperature is 18 °C the new building will provide thermal comfort for a few hours as the robustness period is very short. However, the building may be habitable (above 15 °C) for 17–18 h after a power outage occurs for a short duration. Therefore, depending on the indoor air set point temperature of the indoor temperature, ambient temperature and time when a power outage occurs, the robustness duration of the old building will also be affected which can impact the energy resilience of the building.
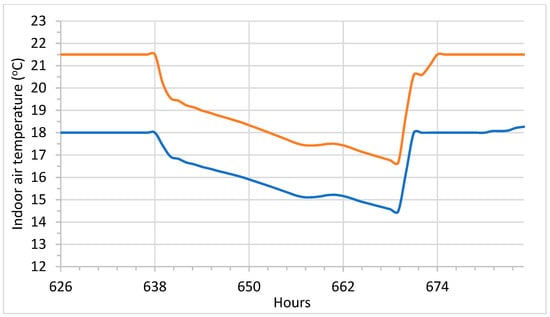
Figure 29.
Energy resilience of the new building and robustness period in cold climates under a power outage.
It is essential to plan and manage the minimum indoor air set point temperatures in new buildings while considering the energy crisis and the resilience aspects in the present situation.
It is also found in Figure 29 (orange line) that when the electricity is restored in the building, it takes around 4 h–5 h to recover and reach the indoor air set temperature of 21.5 ± 0.5 °C. Compared to the old building (Figure 28), the new building (Figure 29) can recover earlier and faster. Therefore, new buildings are better prepared to address the power shortage and energy crises and are resilient compared to the old buildings.
Overall, during a short power outage in cold weather conditions, such new buildings would maintain better thermal comfort for a longer duration (Figure 29) compared to old buildings (Figure 28). The effect of the loss of heating for several hours on people’s thermal comfort in new buildings is better. However, the thermal comfort in new buildings should be thoroughly studied for longer durations of power outages.
With the current and near-future political circumstances for energy supply and the global warming implications on weather conditions, there is an urgent need to conduct a comprehensive systematic study on different types and ages of residential buildings in the Finnish building stock. Their thermal characteristics in winter during short-period power outages and their resilience in terms of habitability and survivability during long-period power outages are required to be found. This will assist in classifying buildings’ readiness to withstand power outages. This article briefly introduces the challenge and performance of buildings in the cold climatic conditions of Finland. Future studies are needed for the technical power solutions to be applied in different types of buildings to avoid critical health and safety effects on the health and life of the residents, which should be economically feasible as well. New ways to improve the resilience of buildings have to be further studied such as by integrating renewable energy sources and energy storages. For instance, solar energy and the use of energy storage (such as phase change materials [17], batteries, tanks, etc.) can assist in improving the resilience as well as the flexibility of the building stock. Moreover, required changes in the codes and regulations should be identified with the aim of developing a robust energy resilience strategy for buildings in Finland.
8. Conclusions
Cities and districts are setting ambitious targets to make buildings carbon-neutral and flexible in an economical manner. Energy flexibility is important in managing and reducing energy costs via the activation of zone temperatures and activation of the thermal mass of buildings. On the other hand, energy resilience in buildings has a crucial impact on the health and life of a building’s occupants during total power outages. Therefore, the challenge is how to achieve the two objectives of flexibility and resilience. The article presents the quantitative analysis and management of the operation of the two old and new buildings to reach the two different objectives of energy flexibility and energy resilience together since both are competing for the same available sources i.e. thermal mass. This includes proposing control strategies for activating buildings’ thermal mass (through energy conservation and energy storage strategies). The focus of the analysis lies in the energy flexibility improvement potential, cost reduction potential, and energy resilience improvement potential of the two buildings. These concepts and the control of the heating system of the house are presented. The following are the key findings on the energy flexibility:
- The dynamic behavior of the old building during heat energy storage shows that when a short duration (2 h) is selected for activation, the building’s indoor areas are not able to reach the provided indoor air set point temperature of 23 °C. However, when 6 and 18 h are selected for activation, the building indoor temperature reaches the indoor air set point temperature of 23 °C. Generally, energy charge and discharge increase with the increase in the activation duration. The shifting efficiency reduces when the activation duration increases due to high losses as the duration increases. It is observed that the energy flexibility increases as the activation duration increases. Heat energy conservation shows that for all activation durations, the building indoor temperature drops quickly to 20 °C. In the case of conservation activation, the shifting efficiency is higher than one. It is observed that the energy flexibility increases as the activation duration increases, though it is slightly less than that in the energy storage case.
- The dynamic behavior of the new building during heat energy storage shows that compared to the old building’s energy storage scenario, the building’s indoor temperature is able to reach the provided indoor air set point temperature of 23 °C in 2 h of activation. The shifting efficiency of the new building is better compared to that of the old building. Moreover, the flexibility of the new building is lower compared to the energy flexibility of the old building. Heat energy conservation shows that the zone temperature drops to 20.6 °C under activation for 2 h and the temperature drop is slower compared to that of the old building for all activation durations. In addition, there are a few instances when the heating power reaches zero in the new building case whereas in the old building case, the heating power does not reach zero.
- This study analyzed the energy storage activation of the thermal mass based on the price signals for the old and new buildings. The overall energy cost is higher in the old building compared to that in the new building due to the higher heating demand. Generally, in the energy storage case, the energy cost increases due to an increase in the indoor air set point temperature and activation caused by the losses in the old and new buildings. Only for the short activation duration (1 h or 2 h), the old building is able to reduce the energy cost as the heating demand is high in an old building and the implementation of energy storage is effective for short activation durations. Moreover, the energy flexibility increases with higher activation durations. The energy flexibility of the old building is around 50% for a 6 h activation duration, whereas the flexibility of the new building is lower at around 15% for 6 h of activation. This shows that the flexibility factor and potential are higher in old buildings due to the higher heating demand and saving potential.
- For energy conservation activation based on the price signals, the overall energy cost is lower in the new building compared to that in the old building due to the lower heating demand in the new building. Generally, the energy cost reduces due to a reduction in the indoor air set point temperature and activation duration. This is carried out to save energy for some time and after this the indoor air set point temperature is returned to the reference point of 21.5 °C. It is found that for short activation durations, the old and new buildings can save a large amount of the energy cost. However, the energy cost increases as the activation duration increases, although it remains lower than the reference energy cost. For both buildings, the energy flexibility factor is higher with a higher activation duration, and this is due to the higher variation in the energy charged and discharged under a high activation duration. The energy flexibility may increase with a higher activation duration; on the contrary, the energy price may also increase.
The energy resilience of buildings is essential along with energy flexibility. It is assumed that when a power outage takes place during winter, the challenge is whether or not the old and new buildings can keep minimum habitable temperatures and thermal comfort while ensuring energy flexibility. The robustness period is estimated for both the new and old buildings that are at different indoor air set temperatures (due to energy flexibility activation). The result presents the duration for which a building’s indoor temperature can be maintained after a power outage [46]. A building is highly prepared for facing the outage if the robustness period of the particular building is higher. Some of the main findings are as follows:
- Overall, in cold weather conditions, new buildings would maintain better thermal comfort for a longer duration compared to old buildings. The reduction in thermal comfort is smaller in new buildings compared to that in old buildings during power outage.
- For an old building, when a power outage occurs (heating stops), the indoor air set temperature drops to 18 °C from 21.5 ± 0.5 °C and the robustness threshold is 3 h. On the other hand, when the indoor air set temperature is 18 °C, it drops to 14 °C in 3 h. This shows that when the operating temperature is 21.5 °C, the building may provide 3 h of thermal comfort (due to the robustness period) and when the operating temperature is 18 °C (due to flexibility) the building may not be able to provide thermal comfort as the robustness period is zero. Therefore, it is essential to plan and manage the minimum indoor air set point temperature in an old building while keeping the energy crisis and resilience aspect in mind.
- For a new building, when a power outage occurs (heating stops), the indoor air set temperature drops to 18 °C from 21.5 ± 0.5 °C and the robustness threshold is 17 h. On the other hand, when the indoor air set temperature is 18 °C, it drops to 15.5 °C in 17 h. A new building may provide thermal comfort when the operating temperature is 18 °C a few hours as the robustness period is very short. However, the new building may be habitable (above 15 °C) for 17–18 h when the power outage is short.
This research focuses on cold climatic conditions. With the increase in the energy prices and the expected forthcoming energy crises, this research provides solutions to address the challenges. These challenges are faced not only in cold climatic regions but also internationally. This research is beneficial not only for cold climatic regions such as the Nordics but it is useful for the international perspective. To address these challenges, buildings and their energy systems have to be smart and flexible. The energy flexibility and activation of building mass based on price and weather signals show the energy saving potential. These solutions will support in addressing energy pricing concerns. Moreover, they will support the energy efficiency and carbon neutrality policy of Europe in general as the energy storage and conservation activation control strategies help in reducing carbon emissions and energy consumption as well. These control strategies can also support the better integration of renewable energy sources within the energy network and provide flexibility to the grid from the building side. Further research is needed to estimate the energy flexibility factor for different types of construction, users and weather. It can be assumed that activation can occur during unoccupied hours along with the price signals and control strategies can be built for it. Another future evaluation that can be carried out is the use of onsite renewable energy generation and storage in the buildings. The use of innovative technology and energy storage such as phase change materials [17], batteries [26] and tanks can be integrated into the building’s mass which can improve both energy flexibility and the energy resilience of the building, for example. These methods and control strategies would also impact the energy grid and support smart grids. However, further analysis is needed to analyze the benefits of implementing renewable energy generation and energy storage at the building, grid and district levels.
Finally, energy-resilient buildings are key elements for the future sustainability of society in Europe and in other parts of the world. It is, therefore, essential to plan for resilient buildings. Improved policy and research are needed at the European and national levels that will provide guidelines to society, businesses and end users to build energy-resilient buildings. Therefore, another aspect that needs further analysis is the definition of energy resilience and a framework to estimate the performance of a building under a power outage. This is essential due to the eminent energy crises that are faced by many countries. This study can be extended for different types of buildings and end users especially in cold climatic conditions. This study will ultimately support the further improvement of building regulations and directives so they can integrate energy efficiency, energy resilience and flexibility. As energy flexibility and resilience are competing for the same resources in a building, further studies are needed to balance and optimize resource utilization. The present study is limited to the simulation activity so the scope of the work can be further extended into an experimental phase in future work. This can help in analyzing and comparing the energy flexibility and resilience performance of buildings in the real environment, validate the findings of the simulation and provide a platform on which various technologies such as solar energy and energy storage [17] can be tested.
Author Contributions
Conceptualization, H.u.R. and A.H.; methodology, H.u.R.; software, H.u.R.; validation, H.u.R. and A.H.; formal analysis, H.u.R.; investigation, H.u.R. and A.H.; resources, H.u.R. and A.H.; data curation, H.u.R.; writing—original draft preparation, H.u.R.; writing—review and editing, H.u.R. and A.H.; visualization, H.u.R.; supervision, H.u.R. and A.H.; project administration, H.u.R. and A.H.; funding acquisition, H.u.R. and A.H. All authors have read and agreed to the published version of the manuscript.
Funding
This research was funded by Academy of Finland, project “Energy Resilience in Buildings in Extreme Cold Weather Conditions in Finland 2022–2025 (FinERB), Grant number: 348060” and Academy of Finland project “Integration of Building Flexibility into Future Energy Systems 2020–2024 (FlexiB), Grant number: 333364”.
Data Availability Statement
The data presented in this study are available on request from the corresponding author.
Acknowledgments
The authors would like to acknowledge IEA EBC Annex 83 on Positive Energy Districts.
Conflicts of Interest
The authors declare no conflict of interest. The funders had no role in the design of the study; in the collection, analyses, or interpretation of data; in the writing of the manuscript; or in the decision to publish the results.
Nomenclature
| CO2 | Carbon dioxide |
| °C | Centigrade |
| EPBD | Energy performance of building directives |
| EPS | Expanded polystyrene insulation |
| EU | European Union |
| h | Hour |
| IPCC | Intergovernmental Panel on Climate Change |
| K | Kelvin |
| kg | Kilogram |
| m | Mass |
| PCM | Phase change material |
| Qheat | Heat transfer |
| q50 | Air infiltration |
| RP | Robustness period |
| TRNSYS | Transient System Simulation Tool |
| U value | Thermal transmittance |
| W | Watt |
| WHO | World Health Organization |
| EUR | Euro |
References
- European Commisssion. 2050 Long-Term Strategy Climate Action. Available online: https://ec.europa.eu/clima/policies/strategies/2050_en (accessed on 4 November 2019).
- European Commission. “Fit for 55”: Council Adopts Key Pieces of Legislation Delivering on 2030 Climate Targets—Consilium. Available online: https://www.consilium.europa.eu/en/press/press-releases/2023/04/25/fit-for-55-council-adopts-key-pieces-of-legislation-delivering-on-2030-climate-targets/ (accessed on 13 May 2023).
- European Commission. Clean Energy for All Europeans. Euroheat Power (Engl. Ed.) 2019, 14, 3. [Google Scholar] [CrossRef]
- The European Parliament and the Council of the European Union Directive (EU). Directive 2018/844 of the European Parliament and of the Council of 30 May 2018 Amending Directive 2010/31/EU on the Energy Performance of Buildings and Directive 2012/27/EU on Energy Efficiency. Off. J. Eur. Union 2018, L 156/75. Available online: http://data.europa.eu/eli/dir/2018/844/oj (accessed on 22 November 2020).
- Attia, S.; Levinson, R.; Ndongo, E.; Holzer, P.; Berk Kazanci, O.; Homaei, S.; Zhang, C.; Olesen, B.W.; Qi, D.; Hamdy, M.; et al. Resilient Cooling of Buildings to Protect against Heat Waves and Power Outages: Key Concepts and Definition. Energy Build. 2021, 239, 110869. [Google Scholar] [CrossRef]
- Flores-Larsen, S.; Filippín, C. Energy Efficiency, Thermal Resilience, and Health during Extreme Heat Events in Low-Income Housing in Argentina. Energy Build. 2021, 231, 110576. [Google Scholar] [CrossRef]
- Al Assaad, D.; Sengupta, A.; Breesch, H. Demand-Controlled Ventilation in Educational Buildings: Energy Efficient but Is It Resilient? Build. Environ. 2022, 226, 109778. [Google Scholar] [CrossRef]
- Le Dréau, J.; Heiselberg, P. Energy Flexibility of Residential Buildings Using Short Term Heat Storage in the Thermal Mass. Energy 2016, 111, 991–1002. [Google Scholar] [CrossRef]
- Nord Pool as Historical Market Data (Finland). Available online: https://www.nordpoolgroup.com/en/Market-data1/Dayahead/Area-Prices/FI/Hourly/?dd=FI&view=table (accessed on 22 November 2020).
- Li, H.; Hong, T. A Semantic Ontology for Representing and Quantifying Energy Flexibility of Buildings. Adv. Appl. Energy 2022, 8, 100113. [Google Scholar] [CrossRef]
- Ren, H.; Sun, Y.; Albdoor, A.K.; Tyagi, V.V.; Pandey, A.K.; Ma, Z. Improving Energy Flexibility of a Net-Zero Energy House Using a Solar-Assisted Air Conditioning System with Thermal Energy Storage and Demand-Side Management. Appl. Energy 2021, 285, 116433. [Google Scholar] [CrossRef]
- Arteconi, A.; Mugnini, A.; Polonara, F. Energy Flexible Buildings: A Methodology for Rating the Flexibility Performance of Buildings with Electric Heating and Cooling Systems. Appl. Energy 2019, 251, 113387. [Google Scholar] [CrossRef]
- Alimohammadisagvand, B.; Jokisalo, J.; Sirén, K. Comparison of Four Rule-Based Demand Response Control Algorithms in an Electrically and Heat Pump-Heated Residential Building. Appl. Energy 2018, 209, 167–179. [Google Scholar] [CrossRef]
- Yoon, J.H.; Bladick, R.; Novoselac, A. Demand Response for Residential Buildings Based on Dynamic Price of Electricity. Energy Build. 2014, 80, 531–541. [Google Scholar] [CrossRef]
- Christantoni, D.; Oxizidis, S.; Flynn, D.; Finn, D.P. Implementation of Demand Response Strategies in a Multi-Purpose Commercial Building Using a Whole-Building Simulation Model Approach. Energy Build. 2016, 131, 76–86. [Google Scholar] [CrossRef]
- Delgado, B.M.; Ruusu, R.; Hasan, A.; Kilpeläinen, S.; Cao, S.; Sirén, K. Energetic, Cost, and Comfort Performance of a Nearly-Zero Energy Building Including Rule-Based Control of Four Sources of Energy Flexibility. Buildings 2018, 8, 172. [Google Scholar] [CrossRef]
- Du, Z.; Liu, G.; Huang, X.; Xiao, T.; Yang, X.; He, Y.L. Numerical Studies on a Fin-Foam Composite Structure towards Improving Melting Phase Change. Int. J. Heat Mass Transf. 2023, 208, 124076. [Google Scholar] [CrossRef]
- Péan, T.Q.; Ortiz, J.; Salom, J. Impact of Demand-Side Management on Thermal Comfort and Energy Costs in a Residential NZEB. Buildings 2017, 7, 37. [Google Scholar] [CrossRef]
- Nik, V.M.; Perera, A.T.D.; Chen, D. Towards Climate Resilient Urban Energy Systems: A Review. Natl. Sci. Rev. 2021, 8, 2021. [Google Scholar] [CrossRef]
- Kopányi, A.; Poczobutt, K.; Pallagi, L.Á. Resilient Cooling-Case Study of a Residential Building in Ry (Denmark). Master’s Thesis, Aalborg University, Aalborg, Denmark, 2020. [Google Scholar]
- Breesch, H.; Janssens, A. Performance Evaluation of Passive Cooling in Office Buildings Based on Uncertainty and Sensitivity Analysis. Sol. Energy 2010, 84, 1453–1467. [Google Scholar] [CrossRef]
- Enright, P. Passive Cooling Measures for Multi-Unit Residential Buildings; Morrison Hershfield: Vancouver, BC, Canada, 2017. [Google Scholar]
- Ministry of the Environment. The National Building Code of Finland—Ympäristöministeriö. Available online: https://ym.fi/en/the-national-building-code-of-finland (accessed on 22 February 2021).
- Wilson, A. Passive Survivability. Available online: https://www.buildinggreen.com/op-ed/passive-survivability (accessed on 22 August 2021).
- Sengupta, A.; Al Assaad, D.; Bastero, J.B.; Steeman, M.; Breesch, H. Impact of Heatwaves and System Shocks on a Nearly Zero Energy Educational Building: Is It Resilient to Overheating? Build. Environ. 2023, 234, 110152. [Google Scholar] [CrossRef]
- Homaei, S.; Hamdy, M. Quantification of Energy Flexibility and Survivability of All-Electric Buildings with Cost-Effective Battery Size: Methodology and Indexes. Energies 2021, 14, 2787. [Google Scholar] [CrossRef]
- Oberg, B.K.; Urban, A.; Leffel, E.; Goebel, J.; Perry, M.; Vas, D.; Broderson, D.; Liesen, R.; Zhivov, A. Thermal Energy System Resilience: Temperature Decay in Cold/Arctic Climates—Part I. Available online: https://annex73.iea-ebc.org/Data/Sites/4/media/papers/vc-21a-002.pdf (accessed on 30 April 2023).
- Sovacool, B.K. Evaluating Energy Security in the Asia Pacific: Towards a More Comprehensive Approach. Energy Policy 2011, 39, 7472–7479. [Google Scholar] [CrossRef]
- Liu, J.; Jian, L.; Wang, W.; Qiu, Z.; Zhang, J.; Dastbaz, P. The Role of Energy Storage Systems in Resilience Enhancement of Health Care Centers with Critical Loads. J. Energy Storage 2021, 33, 102086. [Google Scholar] [CrossRef]
- Nguyen, A.T.; Reiter, S.; Rigo, P. A Review on Simulation-Based Optimization Methods Applied to Building Performance Analysis. Appl. Energy 2014, 113, 1043–1058. [Google Scholar] [CrossRef]
- Charani Shandiz, S.; Foliente, G.; Rismanchi, B.; Wachtel, A.; Jeffers, R.F. Resilience Framework and Metrics for Energy Master Planning of Communities. Energy 2020, 203, 117856. [Google Scholar] [CrossRef]
- University of Wisconsin. TRNSYS A TRaNsient SYstems Simulation Program. Available online: https://sel.me.wisc.edu/trnsys/ (accessed on 5 September 2020).
- ur Rehman, H.; Hasan, A.; Reda, F. Challenges in Reaching Positive Energy Building Level in Apartment Buildings in the Nordic Climate: A Techno-Economic Analysis. Energy Build. 2022, 262, 111991. [Google Scholar] [CrossRef]
- Bauer, D.; Marx, R.; Nußbicker-Lux, J.; Ochs, F.; Heidemann, W.; Müller-Steinhagen, H. German Central Solar Heating Plants with Seasonal Heat Storage. Sol. Energy 2010, 84, 612–623. [Google Scholar] [CrossRef]
- Sibbitt, B.; McClenahan, D.; Djebbar, R.; Thornton, J.; Wong, B.; Carriere, J.; Kokko, J. The Performance of a High Solar Fraction Seasonal Storage District Heating System—Five Years of Operation. Energy Procedia 2012, 30, 856–865. [Google Scholar] [CrossRef]
- Saari, A.; Airaksinen, M.; Sirén, K.; Jokisalo, J.; Hasan, A.; Nissinen, K.; Vainio, T.; Möttönen, V.-J.; Pulakka, S.; Heljo, J.; et al. Energiatehokkuutta Koskevien Vähimmäisvaatimusten Kustannusoptimaalisten Tasojen Laskenta: Suomi; Balint, G., Antala, B., Carty, C., Mabieme, J.-M.A., Amar, I.B., Kaplanova, A., Eds.; Uniwersytet Śląski. Wydział Matematyki, Fizyki i Chemii: Helsinki, Finland, 2013; Volume 7. [Google Scholar]
- European Union Commission. EXCESS—Horizon 2020. Available online: https://positive-energy-buildings.eu/ (accessed on 24 September 2020).
- ur Rehman, H.; Hirvonen, J.; Kosonen, R.; Sirén, K. Computational Comparison of a Novel Decentralized Photovoltaic District Heating System against Three Optimized Solar District Systems. Energy Convers. Manag. 2019, 191, 39–54. [Google Scholar] [CrossRef]
- Cao, S.; Hasan, A.; Sirén, K. On-Site Energy Matching Indices for Buildings with Energy Conversion, Storage and Hybrid Grid Connections. Energy Build. 2013, 64, 423–438. [Google Scholar] [CrossRef]
- ur Rehman, H. Techno-Economic Performance of Community Sized Solar Heating Systems in Nordic Conditions. Available online: https://aaltodoc.aalto.fi/handle/123456789/34808 (accessed on 4 November 2019).
- Ahola, M.; Säteri, J.; Sariola, L. Revised Finnish Classification of Indoor Climate 2018. E3S Web Conf. 2019, 111, 02017. [Google Scholar] [CrossRef]
- ur Rehman, H.; Hirvonen, J.; Jokisalo, J.; Kosonen, R.; Sirén, K. EU Emission Targets of 2050: Costs and CO2 Emissions Comparison of Three Different Solar and Heat Pump-Based Community-Level District Heating Systems in Nordic Conditions. Energies 2020, 13, 4167. [Google Scholar] [CrossRef]
- Johra, H.; Heiselberg, P.; Dréau, J. Le Influence of Envelope, Structural Thermal Mass and Indoor Content on the Building Heating Energy Flexibility. Energy Build. 2019, 183, 325–339. [Google Scholar] [CrossRef]
- Intergovernmental Panel on Climate Change (IPCC). Climate Change Widespread, Rapid, and Intensifying—IPCC. Available online: https://www.ipcc.ch/2021/08/09/ar6-wg1-20210809-pr/ (accessed on 16 August 2021).
- Machard, A.; Inard, C.; Alessandrini, J.M.; Pelé, C.; Ribéron, J. A Methodology for Assembling Future Weather Files Including Heatwaves for Building Thermal Simulations from the European Coordinated Regional Downscaling Experiment (EURO-CORDEX) Climate Data. Energies 2020, 13, 3424. [Google Scholar] [CrossRef]
- Homaei, S.; Hamdy, M. Thermal Resilient Buildings: How to Be Quantified? A Novel Benchmarking Framework and Labelling Metric. Build. Environ. 2021, 201, 108022. [Google Scholar] [CrossRef]
- World Health Organization (WHO). WHO Housing and Health Guidelines. Recommendations to Promote Healthy Housing for a Sustainable and Equitable Future. Available online: https://www.who.int/publications/i/item/9789241550376 (accessed on 6 November 2022).
- Ministry of Social Affairs and Health. Sosiaali—Ja Terveysministeriön Asetus Asunnon Ja Muun Oleskelutilan Terveydellisistä Olosuhteista Sekä Ulkopuolisten Asiantuntijoiden Pätevyysvaatimuksista. Available online: https://www.finlex.fi/fi/laki/alkup/2015/20150545#Pidm45237817260688 (accessed on 26 September 2022).
Disclaimer/Publisher’s Note: The statements, opinions and data contained in all publications are solely those of the individual author(s) and contributor(s) and not of MDPI and/or the editor(s). MDPI and/or the editor(s) disclaim responsibility for any injury to people or property resulting from any ideas, methods, instructions or products referred to in the content. |
© 2023 by the authors. Licensee MDPI, Basel, Switzerland. This article is an open access article distributed under the terms and conditions of the Creative Commons Attribution (CC BY) license (https://creativecommons.org/licenses/by/4.0/).