
Increasing Density of 3D-Printed Sandstone through Compaction
by
 ,
,
Kevin J. Hodder
*, 
Angel J. Sanchez-Barra
 ,
,
Sergey Ishutov
,
Gonzalo Zambrano-Narvaez
and
Rick J. Chalaturnyk
Department of Civil & Environmental Engineering, University of Alberta, Edmonton, AB T6G 1H9, Canada
*
Author to whom correspondence should be addressed.
Energies 2022, 15(5), 1813; https://doi.org/10.3390/en15051813
Submission received: 13 December 2021
/
Revised: 16 February 2022
/
Accepted: 25 February 2022
/
Published: 1 March 2022
(This article belongs to the Special Issue Artificial Geomaterials: Applications of 3D Printing and Other State-of-the-Art Technologies)
Abstract
:The geomechanical and transport properties of rocks are of great importance to geoscience and engineering, as these properties provide responses to external stresses and flow regimes in the subsurface. Typically, experiments conducted on cores from reservoir formations have a degree of uncertainty, due to the heterogeneous characteristics of rock samples. To combat this uncertainty, binder-jet additive manufacturing (3D printing) is an emerging technology to characterize natural porous media in a repeatable fashion. In this study, the 3D printing sandstone analogue involved sand powder and organic binder to mimic silica grains and cement in natural sandstone. The use of compaction rollers and the adjustment of printing parameters allowed one to test how the porosity and strength of 3D-printed samples can replicate the transport and geomechanical properties of natural sandstone. The densities of samples were increased by ~15% and compressive strength by ~65% with the use of the larger roller. This is a promising alternative to experimental testing to calibrate numerical models in geoscience and engineering. The significance of this approach is to allow for customizable porosity, permeability, and strength in rock samples, while preserving scarce natural rock samples.
1. Introduction
Experimental studies based on geomechanical and transport properties are essential to the success of any project in geoscience and engineering. Some of the most relevant areas are petroleum reservoir exploitation, subsurface radioactive waste disposal repositories, aquifer exploitation for freshwater supply, tunnels, and carbon dioxide storage [1]. Typically, the design and environmental settings of these experiments depend on the availability of natural rock samples from outcrops or wellbore cores. However, obtaining multiple identical samples for these analyses is sometimes impossible, due to the natural heterogeneity of the geological formations, limited access to deeper strata, or expensive drilling programs.
Due to the process of sediment deposition, sandstones have naturally heterogenous structures and properties [2]. Natural sandstones are composed of mineral grains and cement, which makes binder-jetting additive manufacturing (BJ-AM) ideal for the fabrication of sandstone samples. BJ-AM is a method of 3D printing that utilizes a print head to jet a finite amount of binding agent (cross-linked polymer “cement”) onto a loose powder bed [3]. The use of BJ-AM to fabricate rock models is becoming more popular as a tool to characterize natural porous media and grain texture, since BJ-AM allows for the creation of specimens in a repeatable fashion [4,5,6,7]. However, most studies are limited to BJ-AM with gypsum, which does not exhibit the same mechanical properties as silica sand [8]. For sandstone fabricated with the BJ-AM process, the binding agent acts as the cement holding the grains together, resulting in pore geometry and morphologies similar to natural sandstones. The ability to complete experimental programs using 3D-printed sandstones with similar physical and chemical properties to their natural counterpart is an unprecedented achievement that integrates controlled heterogeneity into geomechanical testing [4,9,10]. However, most of the studies conducted using 3D-printed sandstone analogues relied on specimens manufactured with standard printing parameters prescribed by the printer manufacturer [9,11,12,13,14,15,16,17]. A drawback of using standard parameters or default settings is that the initial properties of 3D-printed sandstones do not match the geomechanical and transport properties that are observed in reservoir sandstone. The initial porosity of 3D-printed sandstones (~45%) is higher than natural sandstones such as Berea (20–30%) [13]. Increased porosity results in higher permeability, lower bulk density, and lower strength, and the stiffness of the 3D-printed sandstone. The high porosity of 3D-printed samples also limits the ability to manufacture denser rocks, such as those from carbonate formations.
There are several methods that have been used to decrease the porosity in the 3D printing process, including external devices that apply a compressive or vibrational force to the powder bed [18,19]. By providing vibrational energy in the sand bed, the grains settle into an arrangement that has a higher packing ratio by rearranging and decreasing the space between neighboring grains [18]. However, there is no readily available 3D printing machine that combines sand printing and a densification process. In most cases, the vibrational forces must be implemented externally and are not part of the 3D printing equipment. It is common in the metal 3D printing industry to use a bimodal sand distribution to achieve a better packing among grains [20,21]. A unimodal grain size distribution is used in sand 3D printing due to the vibrational forces that allow the deposition of the sand for printing. If the size distribution is wide, the segregation of the grains may occur. Yet, the use of bimodal powder mixtures would allow for fine grains to fit in the spaces between the larger grains. According to previous studies, this methodology achieved higher packing density when the volume fraction of fine powders was between 20–40% volume [22].
In this study, we propose a densification approach for 3D printing compacted sandstone analogues. The methodology analyzes a bimodal distribution of sand grain sizes, introducing grades of sand mixtures composed of coarse and fine silica grains (D50 = 175 μm and D50 = 105 μm, respectively [16]). In addition, we incorporate two different compacting rollers into the 3D printing process stream. The objective was to add mechanical compaction to the sand layers after each sand deposition, while observing any relationships between sand size distribution and roller size, and how they affect changes in porosity in each grain mixture.
2. Materials and Methods
2.1. 3D Printing of Specimens
The 3D-printed sandstone used in this study was fabricated on an M-Flex 3D printer (ExOne, North Huntingdon, PA, USA). The machine consists of a printhead, the job box where the specimens are printed, a vibrating hopper (recoater), and a compacting roller (Figure 1). Two different compacting rollers were used in this study to prepare two sets of specimens: (1) with a 29 mm (1.13″) diameter; and (2) with a 48 mm (1.89″) diameter, which were defined as the small and large roller, respectively (Figure 2). The purpose of these rollers was to facilitate the smoothing and compaction of the sand layers after deposition of by the recoater. The small roller was purchased from ExOne, while the larger roller was machined on-site. Both rollers were made from aluminum and hard anodized. The rollers rotated counter-clockwise at a set rate of 100 rotations-per-minute (RPM).
2.2. Sand Mixtures
Silica sand was used as the printing media (Figure 3), with different blends of fine (D50 = 105 μm) and coarse grains (D50 = 175 μm). The D50 was determined via sieving for both grain sizes. The fine sand was purchased from Badger Mining, (Badger Mining, Berlin, WI, USA), while the coarse sand was purchased from ExOne, (ExOne, North Huntingdon, PA, USA), which is the standard sand used with the printer. Both sands were composed of ~99% quartz silica, according to vendor datasheets. The coarse sand was whole-grained, which ensured greater flowability compared to highly angular grains, and had a unimodal and narrow size distribution (Figure 3). The fine sand had the smallest diameter that was commercially available in whole grain form. To achieve smaller grain sizes, the sand grains need to be crushed, which results in angular grains. Angular grains have poor flowability and are not suitable for 3D printing. High flowability is required so that the sand can be fluidized by the recoater through vibration and deposited efficiently on the sand bed. In order to quantify the effect of different diameters of sand grains, several mixtures are selected (Table 1). The ratios of sand percentages are defined by weight fraction.
2.3. 3D Printing Process
The process of 3D printing the specimens was as follows: cylindrical specimens were modelled using Inventor (Autodesk, San Rafael, CA, USA) and uploaded to the 3D printer. Moreover, 3.5 kg of the respective sand blend was mixed with 5 mL of activator (p-toluene sulphonic acid), which coated the sand grains. The recoater deposited the sand to a layer height of 350 μm, followed by compaction via the rotating roller that trailed behind the recoater. The print head then jetted enough binder to print a 2D slice of the 3D model onto the sand bed. Afterwards, a heater attached to the recoater passed over the printed binder in a separate pass to facilitate curing. The process repeated until the specimen was completed within the job box, surrounded by unbound sand that has not been in contact with the binder. For this study the binder saturation was fixed at 20%, which was the volume of pore space filled by the binder. Post-processing involved placing the samples within an oven set to 80 °C to accelerate curing of the binder, remove moisture from the polymerization reaction and achieve full strength [4]. After the curing process, the samples were cleaned with a brush to remove the loose sand from the unbounded regions. Finally, the samples were measured with a caliper and weighed with a four-point balance to acquire dry density.
2.4. Unconfined Compressive Strength Testing
An Instron 400 kN loading system (Instron, Norwood, MA, USA) was used to perform unconfined compressive strength (UCS) testing on the 3D-printed specimens (Figure 4). The specimen size maintained an ASTM D7012 (2014) recommended height to diameter ratio of 2:1 (Table 2). After each subsequent printing layer, a microscopic interface occured between the sand layers. All samples were loaded axially perpendicular to the bedding plane (interface between 3D-printed layers) for maximum strength. The samples were pre-loaded to 0.5 kN to establish contact between the samples and the platens. Afterwards, samples were compressed axially with no radial stress until failure, which was defined to be the UCS. The strain was measured using an external linear variable differential transformer (LVDT) mounted on two parallel rigid metallic discs. The loading rate was fixed at 0.25 mm/min and reached an average time to failure of 8.2 min, which was in line with ASTM standards [5]. The 3D-printed rock failed in a brittle manner, where failure occurred quickly via cracking.
2.5. Porosity Measurements
Porosity was determined by measuring the solid volume of the specimens through helium pycnometry (Quantachrome Pentapyc 5200e, Anton-Parr, Ashland, VA, USA). A cylindrical cell of 10 cm3 (24 mm × 23 mm) was used for the specimens during measurements. The gas was ultra-high purity 99.9% helium (Praxair, Danbury, CT, USA). Since the samples have a known total volume that can be measured, the pore volume can be calculated by subtracting the solid volume from the helium volume. Porosity can then be acquired by dividing the total volume by the pore volume.
3. Results and Discussion
3.1. Unconfined Compressive Strength
In geomechanics, UCS testing is a popular method to analyze rock failure in compression, which occurs when the stresses acting on the rock exceed its compressive strength [23]. The failure of rock in compression is a complex process that involves microscopic failures manifesting into the creation of small tensile cracks [24]. These cracks then coalesce into a through-going shear plane, causing failure.
A bimodal distribution of sand grains resulted in a strength reduction of the 3D-printed sandstone that was proportional to the weight fraction of fine sand grains. Additionally, it was observed that the samples fabricated using the small roller experienced a decrease of 15% in strength for each 25% increment of finer grain weight fraction (Figure 5). The previous behavior was less pronounced when using the larger, 48 mm diameter roller. It is suggested that the larger radius and weight of the roller provides greater compaction, which combats the detrimental effect of fine grains in the sand mixture. Across almost all sand blends, the larger diameter roller achieved more compaction and increased the strength of the 3D-printed sandstones. It is unclear at this time why the 100% coarse sand blend specimens (control) are the only samples to see a decrease in strength from the larger roller. The decrease in UCS with an increase in the volume of fine sand was not expected, as the increased packing density (from small grains filling the larger pores) was expected to create a stronger specimen. Upon investigation it was found that for a grain mixture to benefit from a bimodal distribution, the fine-grained grains must have been at least seven times smaller than the coarser grains [18]. Since a grain size of ~25 µm would be needed, the optimum grain packing is not achievable for 3D printing, as the fine powder would be airborne and have poor flowability. Thus, compaction is limited to the type of roller used, where it is shown that the larger diameter roller produces higher compaction, leading to a greater strength.
3.2. Porosity and Density
Porosity is an important property of reservoir rocks because pore space in the subsurface provides storage for fluids, and it is often the main determinant for estimating permeability [25]. Hence, porosity and permeability are key parameters in evaluating transport properties. Helium pycnometry is a common method in geoscience for estimating porosity and the apparent density of the solid phase because measurements can be obtained regardless of the heterogeneity embedded in the specimen [26].
One of the benefits of 3D-printed samples is that they can be fabricated with a high degree of homogeneity and repeatability [9,15,27]. Therefore, a simple approach can be applied to estimate an accurate approximation of porosity. Using a relationship including the density of water, [25] dry density can be calculated using the following equation:
where is the dry density, is the density of water and, is the specific gravity of solid grains (2.65 for silica) and e is the void ratio, the volume of voids to the volume of solids. Considering that the 3D-printed samples need to pass through a heated curing process to achieve a full strength, the finished specimens are completely dry. This allows for the calculation of dry density by weighing and measuring the samples. Thus, Equation (1) can be arranged to estimate the void ratio (Equation (2)).
Finally, the ratio of the volume of voids to the total volume of the specimen (porosity, η) can be calculated using Equation (3):
In order to verify the validity of the previous approach, a comparison of the porosity calculated from helium pycnometry and Equation (3) is presented in Table 3. The results show a porosity difference ranging from 0.25% to 1.63% for the samples manufactured with the small roller, and 0.1% to 3.3% for the samples printed with the large roller. The approximation of results between the two methods validates the use of this simple approach to porosity determination.
To increase the packing density of the grains, the sand distribution needs to go beyond the mono-modal packing limit into a bi-modal distribution, allowing for fine grains to be placed into the pore space between larger grains [22]. The effect of a bi-modal distribution of sand and compaction on the porosity and density is observed graphically in Figure 6, where porosity and dry density calculations are carried out using the helium pycnometry measurements and Equation (3). The 3D-printed sandstones fabricated with a higher volume of fine grains show higher porosities and lower densities. Between the two compacting rollers, the larger roller is more effective for reducing porosity during printing (Figure 6). It is suggested that the larger mass and radius of curvature for the large roller produce greater compaction by applying more pressure towards the sand layers during 3D printing.
In terms of sand grade distributions, as fine grains are introduced, porosity begins to increase. It is suggested that the grain packing is not efficient, since the fine sand (D50 = 105 μm) has a mono-modal grain size distribution. On the contrary, the coarse sand itself has a broader distribution, meaning that the diameter ratio between the smallest and largest grain is increased, which provides denser packing. This suggestion is in line with random packing theory [28]; when the diameter ratio between the grains increases, the density increases. Therefore, a higher ratio between the smallest and the largest grains in the mixture should result in a more heterogeneous distribution of grains within the pore space. This phenomenon is similar to grain sorting in natural materials, where moderately or poorly sorted rocks contain a higher portion of fine-to-coarse grains, and can result in lower porosity [29,30].
3.3. Morphology and Microstructure
Scanning electron microscopy (SEM) was used to observe the grain arrangement of the 3D-printed sandstone. Figure 7 contains a collage of SEM images collected across the samples at 75X magnification using backscatter detection. There is a clear distinction between the microstructure of the specimens fabricated with the smaller roller versus the larger roller, where the number of large pores decreases. A better grain arrangement and packing are observed with the 100% coarse sand (D50 = 175 μm) and the larger roller. It is suggested that the extra compaction decreased the pore space of the 3D-printed sandstones, thus increasing density. Figure 8 is an image captured via optical microscopy and ultra-violet light, where the polished grains are translucent and the binder (dark) is opaque. Figure 8 allows for the identification of the binder necks between grains, which also contributes to reducing porosity. It was observed during SEM that the finer grains promoted the gathering of the binder in discrete areas, most likely due to the surface tension and capillary actions of a higher surface area (Figure 9). These areas of binder gathering were observed throughout the specimen, which may have resulted in the reduced performance of compressive strength, since the binder was not spread uniformly throughout the sample.
The various grain arrangements induced different mechanical behaviours. Pore space and density have a direct relationship with the strength of the specimen. Therefore, differences in the UCS were observed. There was an increase in UCS when transitioning from the small to the large roller, as well as an increase in Young’s modulus, respectively. The UCS of the large roller resulted in a similar deviation with regard to UCS of the smaller roller, but a much larger deviation with regard to Young’s modulus (Figure 10). The increase in UCS from the larger roller is suggested to be caused by the additional packing caused by the larger radius of the curvature. However, the distribution of Young’s modulus with a larger roller is much more variable. It is suggested that the larger surface area of the roller may cause additional perturbations during printing that are unaccounted for. The results also showed that the mechanical properties differed for samples printed in different locations of the powder bed. Figure 11 shows the measurements for 15 specimens evenly distributed in the powder bed. The value in each cell represents the mechanical properties of one specimen. This behaviour was observed with both rollers, which implies that compaction was not even across the printing area, regardless of the roller used. Ultimately, the large roller has shown better performance in the densification of 3D-printed sandstone (Figure 10). The large roller achieved better compaction in the powder bed and created a smaller difference between the physical properties of the printed samples.
The effect of a higher fraction of fine grains in the size distribution resulted in a decrease in strength, a decrease in density, and an increase in porosity. This is in contrast to what the previous literature suggests, where higher packing density and strength are achieved when the fraction volume of fine grains is increased [28]. However, it the sand mixture of coarse and fine grains is sub-optimum, as the grain size ratio between the largest and smallest grains is only 1.5. A recommended ratio of 7 was unobtainable with the current equipment, as it would require a fine grain sand size of approximately 25 µm, which would not be possible with the current parameters of the sand printer [18].
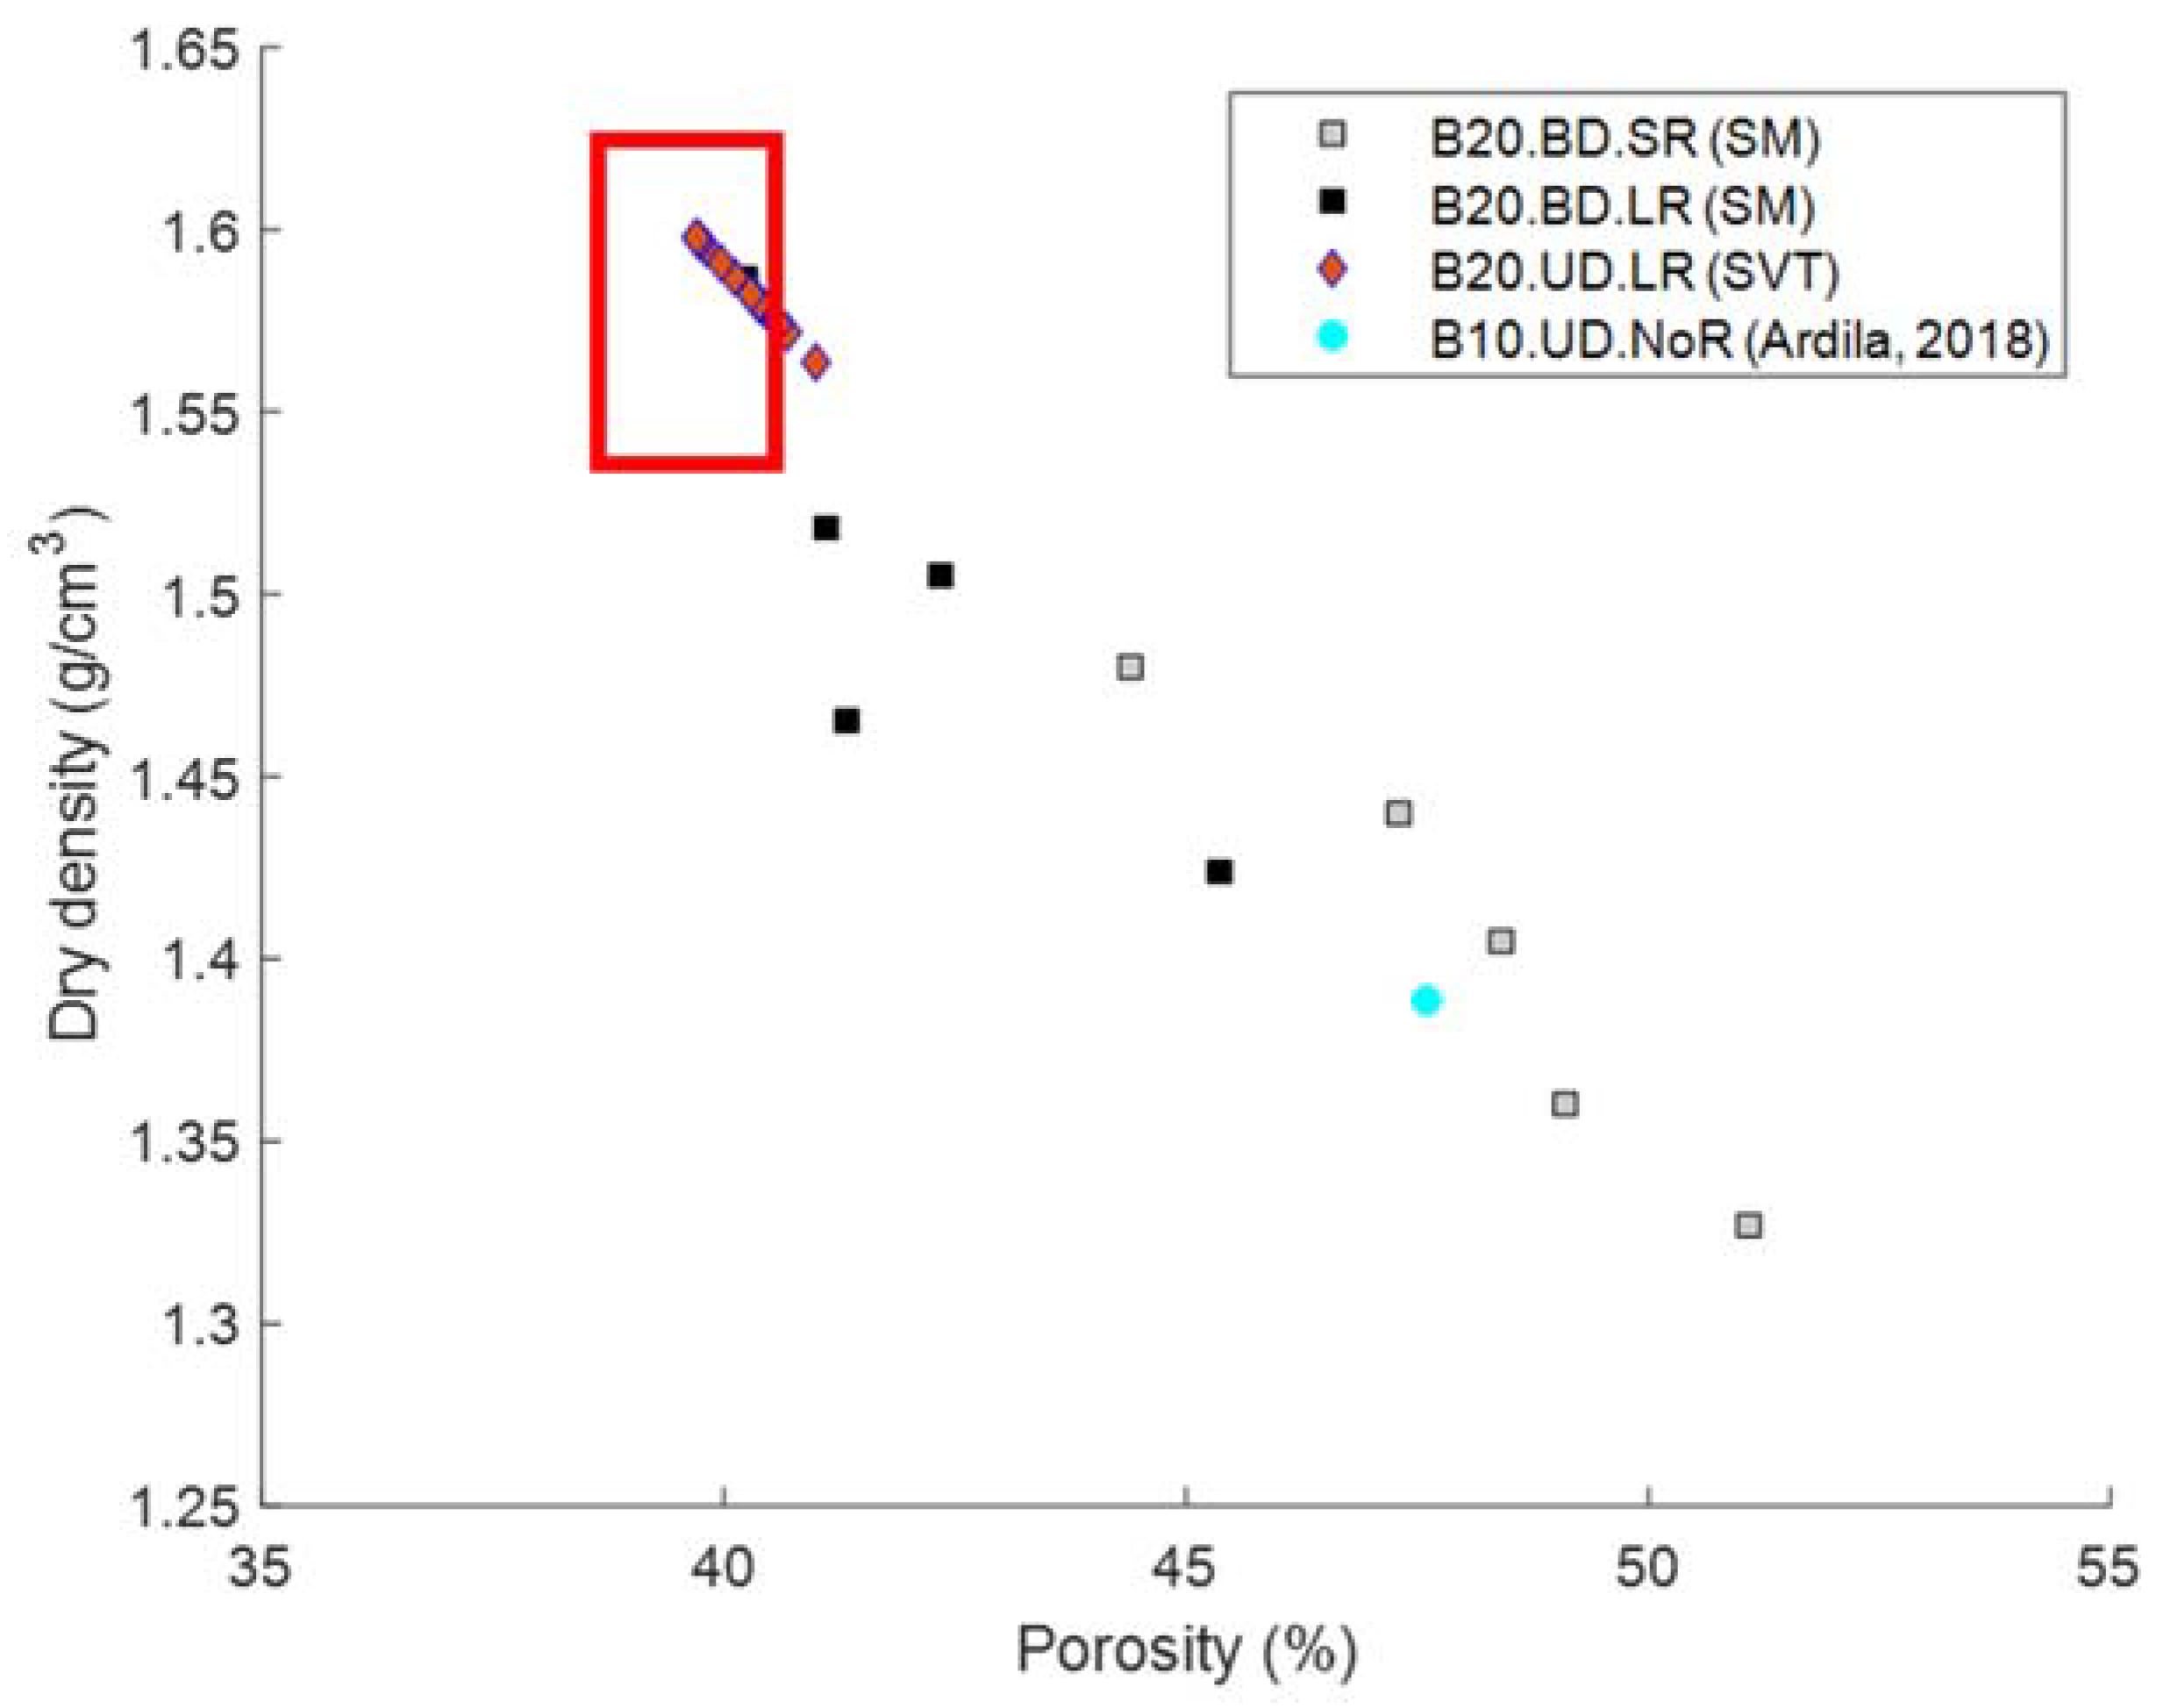
The analysis of compacting rollers revealed that the large roller resulted in a higher strength and increased densification, mostly in the middle of the powder bed, where compaction was at its maximum. For example, attempts to reproduce 3D-printed sandstone have reported values of ~20 MPa, which results in an increase of ~65% for this study [16]. Figure 12 and Figure 13 show the results from the effect of a bimodal distribution of sand and compacting rollers in the 3D printing process. In addition, the results of how properties varied depending on the location of the powder bed are presented. The geomechanical and transport properties tend to improve when the large roller and coarse sand are used during printing. The data points inside the red areas in Figure 12 and Figure 13 show the properties for samples with higher compaction. This group of printed sandstones achieved better results in terms of reservoir-like properties. Previous experimental tests from samples manufactured with 10% binder saturation and no roller were included [3,5]. The contrast between samples 3D-printed with standard parameters and samples printed with this workflow supports the densification approach.
4. Conclusions
A densification approach was included in the 3D printing rock process. The methodology analyzed the effect of varying sand grain size distributions and different compacting rollers, through UCS testing, helium pycnometry, and scanning electron microscopy. The effect of a bimodal distribution of sand is manifested in strength reduction of the printed sandstones with a higher fraction of fine grains. It was found that the samples manufactured using the small roller experienced a decrease of 15% in strength in each 25% increment of finer grains. Predominantly, the larger diameter roller achieved more compaction, increasing the density by ~15% and the strength of the 3D-printed sandstones by 65%. It is suggested that the larger mass and radius of curvature for the large roller produced greater compaction by applying more pressure towards sand layers during 3D printing. Porosity and density were also affected by the bimodal distribution. In addition to helium pycnometry, a simple method to calculate porosity was introduced. Moreover, 3D-printed sandstones manufactured with a higher volume of fine grains showed higher porosity and lower density. This is in contrast with what previous studies suggest, where lower porosity and higher density are achieved when the fraction volume of fine grains is increased. However, the sand mixtures had a grain diameter ratio of 1.5, when the previous literature recommended a ratio of 7. Besides, binder saturation was kept constant throughout fabrication. The finer sand introduces more surface area, thus resulting in the binder being spread over a larger area. The binder necks might be smaller and more feeble, which results in more porous and weaker sandstone analogues. Finally, an assessment of the impact of compacting rollers on the printing location was carried out. The investigation revealed that rollers create samples with strength and stiffness variations within the same batch. Between the two rollers, the large roller showed better performance. It produced better packing, but also generated 3D-printed sandstones with similar physical properties during the same run. The optimum printing area was determined in the middle of the powder bed, where the rollers generated higher densification.
Author Contributions
Conceptualization, K.J.H., S.I., G.Z.-N. and R.J.C.; Data curation, A.J.S.-B. and S.I.; Formal analysis, K.J.H., A.J.S.-B. and S.I.; Funding acquisition, G.Z.-N. and R.J.C.; Investigation, K.J.H. and A.J.S.-B.; Methodology, K.J.H., A.J.S.-B. and S.I.; Supervision, R.J.C.; Writing—original draft, K.J.H., A.J.S.-B. and S.I.; Writing—review and editing, G.Z.-N. and R.J.C. All authors have read and agreed to the published version of the manuscript.
Funding
This study was partially funded by the Consejo Nacional de Ciencia y Tecnología (Conacyt) in Mexico and the Natural Sciences and Engineering Reasearch Council (NSERC) of Canada.
Conflicts of Interest
The authors declare no conflict of interest.
References
- Yang, Y.; Liu, Z.; Sun, Z.; An, S.; Zhang, W.; Liu, P.; Yao, J.; Ma, J. Research on stress sensitivity of fractured carbonate reservoirs based on CT technology. Energies 2017, 10, 1833. [Google Scholar] [CrossRef] [Green Version]
- Bell, F.; Lindsay, P. The petrographic and geomechanical properties of some sandstones from the Newspaper Member of the Natal Group near Durban, South Africa. Eng. Geol. 1999, 53, 57–81. [Google Scholar] [CrossRef]
- ASTM Standard 52900; Standard Terminology for Additive Manufacturing—General Principles—Terminology. ISO: West Conshohocken, PA, USA, 2015.
- Song, R.; Wang, Y.; Ishutov, S.; Zambrano-Narvaez, G.; Hodder, K.; Chalaturnyk RSun, S.; Liu, J.; Gamage, R. A Comprehensive Experimental Study on Mechanical Behavior, Microstructure and Transport Properties of 3D-printed Rock Analogs. Rock Mech. Rock Eng. 2020, 53, 5745–5765. [Google Scholar] [CrossRef]
- Squelch, A. 3D printing rocks for geo-educational, technical, and hobbyist pursuits. Geosphere 2017, 14, 360–366. [Google Scholar] [CrossRef] [Green Version]
- Gao, Y.; Wu, T.; Zhou, Y. Application and prospective of 3D printing in rock mechanics: A review. Int. J. Miner. Metall. Mater. 2021, 28, 1–17. [Google Scholar] [CrossRef]
- Kong, L.; Ostadhassan, M.; Li, C.; Tamimi, N. Pore characterization of 3D-printed gypsum rocks: A comprehensive approach. J. Mater. Sci. 2018, 53, 5063–5078. [Google Scholar] [CrossRef]
- Jiang, C.; Zhao, G.; Zhu, J.; Zhao, Y.; Shen, L. Investigation of dynamic crack coalescence using a gypsum-like 3D printing material. Rock Mech. Rock Eng. 2016, 49, 3983–3998. [Google Scholar] [CrossRef]
- Hodder, K.; Nychka, J.; Chalaturnyk, R. Process limitations of 3D printing model rock. Prog. Addit. Manuf. 2018, 3, 173–182. [Google Scholar] [CrossRef]
- Hodder, K.; Nychka, J.; Chalaturnyk, R. Improvement of the unconfined compressive strength of 3D-printed model rock via silica sand functionalization using silane coupling agents. Int. J. Adhes. Adhes. 2018, 85, 274–280. [Google Scholar] [CrossRef]
- Ardila, N.; Zambrano-Narvaez, G.; Chalaturnyk, R. Wettability Measurements on 3D Printed Sandstone Analogues and Its Implications for Fluid Transport Phenomena. Transp. Porous Media 2019, 129, 521–539. [Google Scholar] [CrossRef]
- Deisman, N.; Flottmann, T.; Guo, Y.; Hodder, K.; Chalaturnyk, R.; Leonardi, C. Using 3D Printed Synthetic Rock for Systematic Evaluation of Mechanical Properties in Coal. In Proceedings of the Asian Pacific Unconventional Resources Technology Conference, Brisbane, QLD, Australia, 18–19 November 2019; p. 198255. [Google Scholar]
- Gomez, J.; Chalaturnyk, R.; Zambrano-Narvaez, G. Experimental Investigation of the Mechanical Behavior and Permeability of 3D Printed Sandstone Analogues Under Triaxial Conditions. Transp. Porous Media 2019, 129, 541–557. [Google Scholar] [CrossRef] [Green Version]
- Hodder, K.; Nychka, J. Silane Treatment of 3D-Printed Sandstone Models for Improved Spontaneous Imbibition of Water. Transp. Porous Media 2018, 129, 583–598. [Google Scholar] [CrossRef]
- Osinga, S.; Zambrano-Narvaez, G.; Chalaturnyk, R. Study of geomechanical properties of 3D printed sandstone analogue. In Proceedings of the American Rock Mechanics Association, San Francisco, CA, USA, 28 June–1 July 2015; ARMA: Overland Park, KS, USA, 2015; pp. 15–547. [Google Scholar]
- Primkulov, B.; Chalaturnyk, J.; Chalaturnyk, R.; Zambrano-Narvaez, G. 3D Printed Sandstone Strength: Curing of Furfuryl Alcohol Resin-Based Sandstone. 3D Print. Addit. Manuf. 2017, 4, 149–155. [Google Scholar] [CrossRef]
- Perras, M.; Vogler, D. Compressive and Tensile Behavior of 3D-Printed and Natural Sandstones. Transp. Porous Media 2018, 129, 559–582. [Google Scholar] [CrossRef]
- Gregorski, S. High Green Density Metal Parts by Vibrational Compaction of Dry Powder in the Three Dimensional Printing Process. Ph.D. Thesis, Massachusetts Institute of Technology MIT, Cambridge, MA, USA, 1996. [Google Scholar]
- Ayer, J.; Soppet, F. Vibratory Compaction: II, Compaction of Angular Shapes. J. Am. Ceram. Soc. 1996, 49, 207–210. [Google Scholar] [CrossRef]
- Bai, Y.; Wagner, G.; Williams, C. Effect of Particle Size Distribution on Powder Packing. J. Manuf. Sci. Eng. 2017, 139, 081019. [Google Scholar] [CrossRef] [Green Version]
- Mostafaei, A.; Rodriguez De Vecchis, P.; Nettleship, P.; Chmielus, M. Effect of Powder Size Distribution on Densification and Microstructural Evolution of Binder-Jet 3D Printed Alloy 625. Mater. Des. 2019, 162, 375–383. [Google Scholar] [CrossRef]
- Ziaee, M.; Crane, N. Binder jetting: A review of process, materials, and methods. Additive Manuf. 2019, 28, 781–891. [Google Scholar] [CrossRef]
- ASTM Standard D7012-14; Standard Test Methods for Compressive Strength and Elastic Moduli of Intact Rock Core Specimens under Varying States of Stress and Temperatures. ISO: West Conshohocken, PA, USA, 2014.
- Zoback, M. Reservoir Geomechanics; Cambridge University Press: Cambridge, UK, 2007. [Google Scholar]
- Das, B. Fundamentals of Geotechnical Engineering, 4th ed.; Brooks/Cole: Pacific Grove, CA, USA, 1999. [Google Scholar]
- Andreola, F.; Leonelli, C.; Romagnoli, M.; Miselli, P. Techniques used to determine porosity. Am. Ceram. Soc. Bull. 2000, 79, 49–52. [Google Scholar]
- Gomez, J.; Ardilla, N.; Chalaturnyk, R.; Zambrano-Narvaez, G. Reservoir Geomechanical Properties Characterization of 3D Printed Sandstone. In Proceedings of the VI Biot’s Conference in Poromechanics, Paris, France, 9–13 July 2017; ASCE: Reston, VA, USA, 2017; pp. 952–960. [Google Scholar]
- Bertei, A.; Nicolella, C. A comparative study and an extended theory of percolation for random packings of rigid spheres. Powder Technol. 2011, 213, 100–108. [Google Scholar] [CrossRef]
- Nelson, P. Permeability-porosity Relationships in Sedimentary Rocks. Log Anal. 1994, 35, 38–62. [Google Scholar]
- Friedman, G. On Sorting, Sorting Coefficients, and the Lognormality of the Grain-Size Distribution of Sandstones. J. Geol. 1962, 70, 737–753. [Google Scholar] [CrossRef]
Figure 1.
Schematic of the M-Flex 3D printer illustrating its main components and the two compacting rollers used in separate runs. The recoater starts on the right of the job box and travels to the left to deposit sand. As the recoater returns to the starting position, the roller is lowered to a finite depth and trails behind the recoater as it rotates.
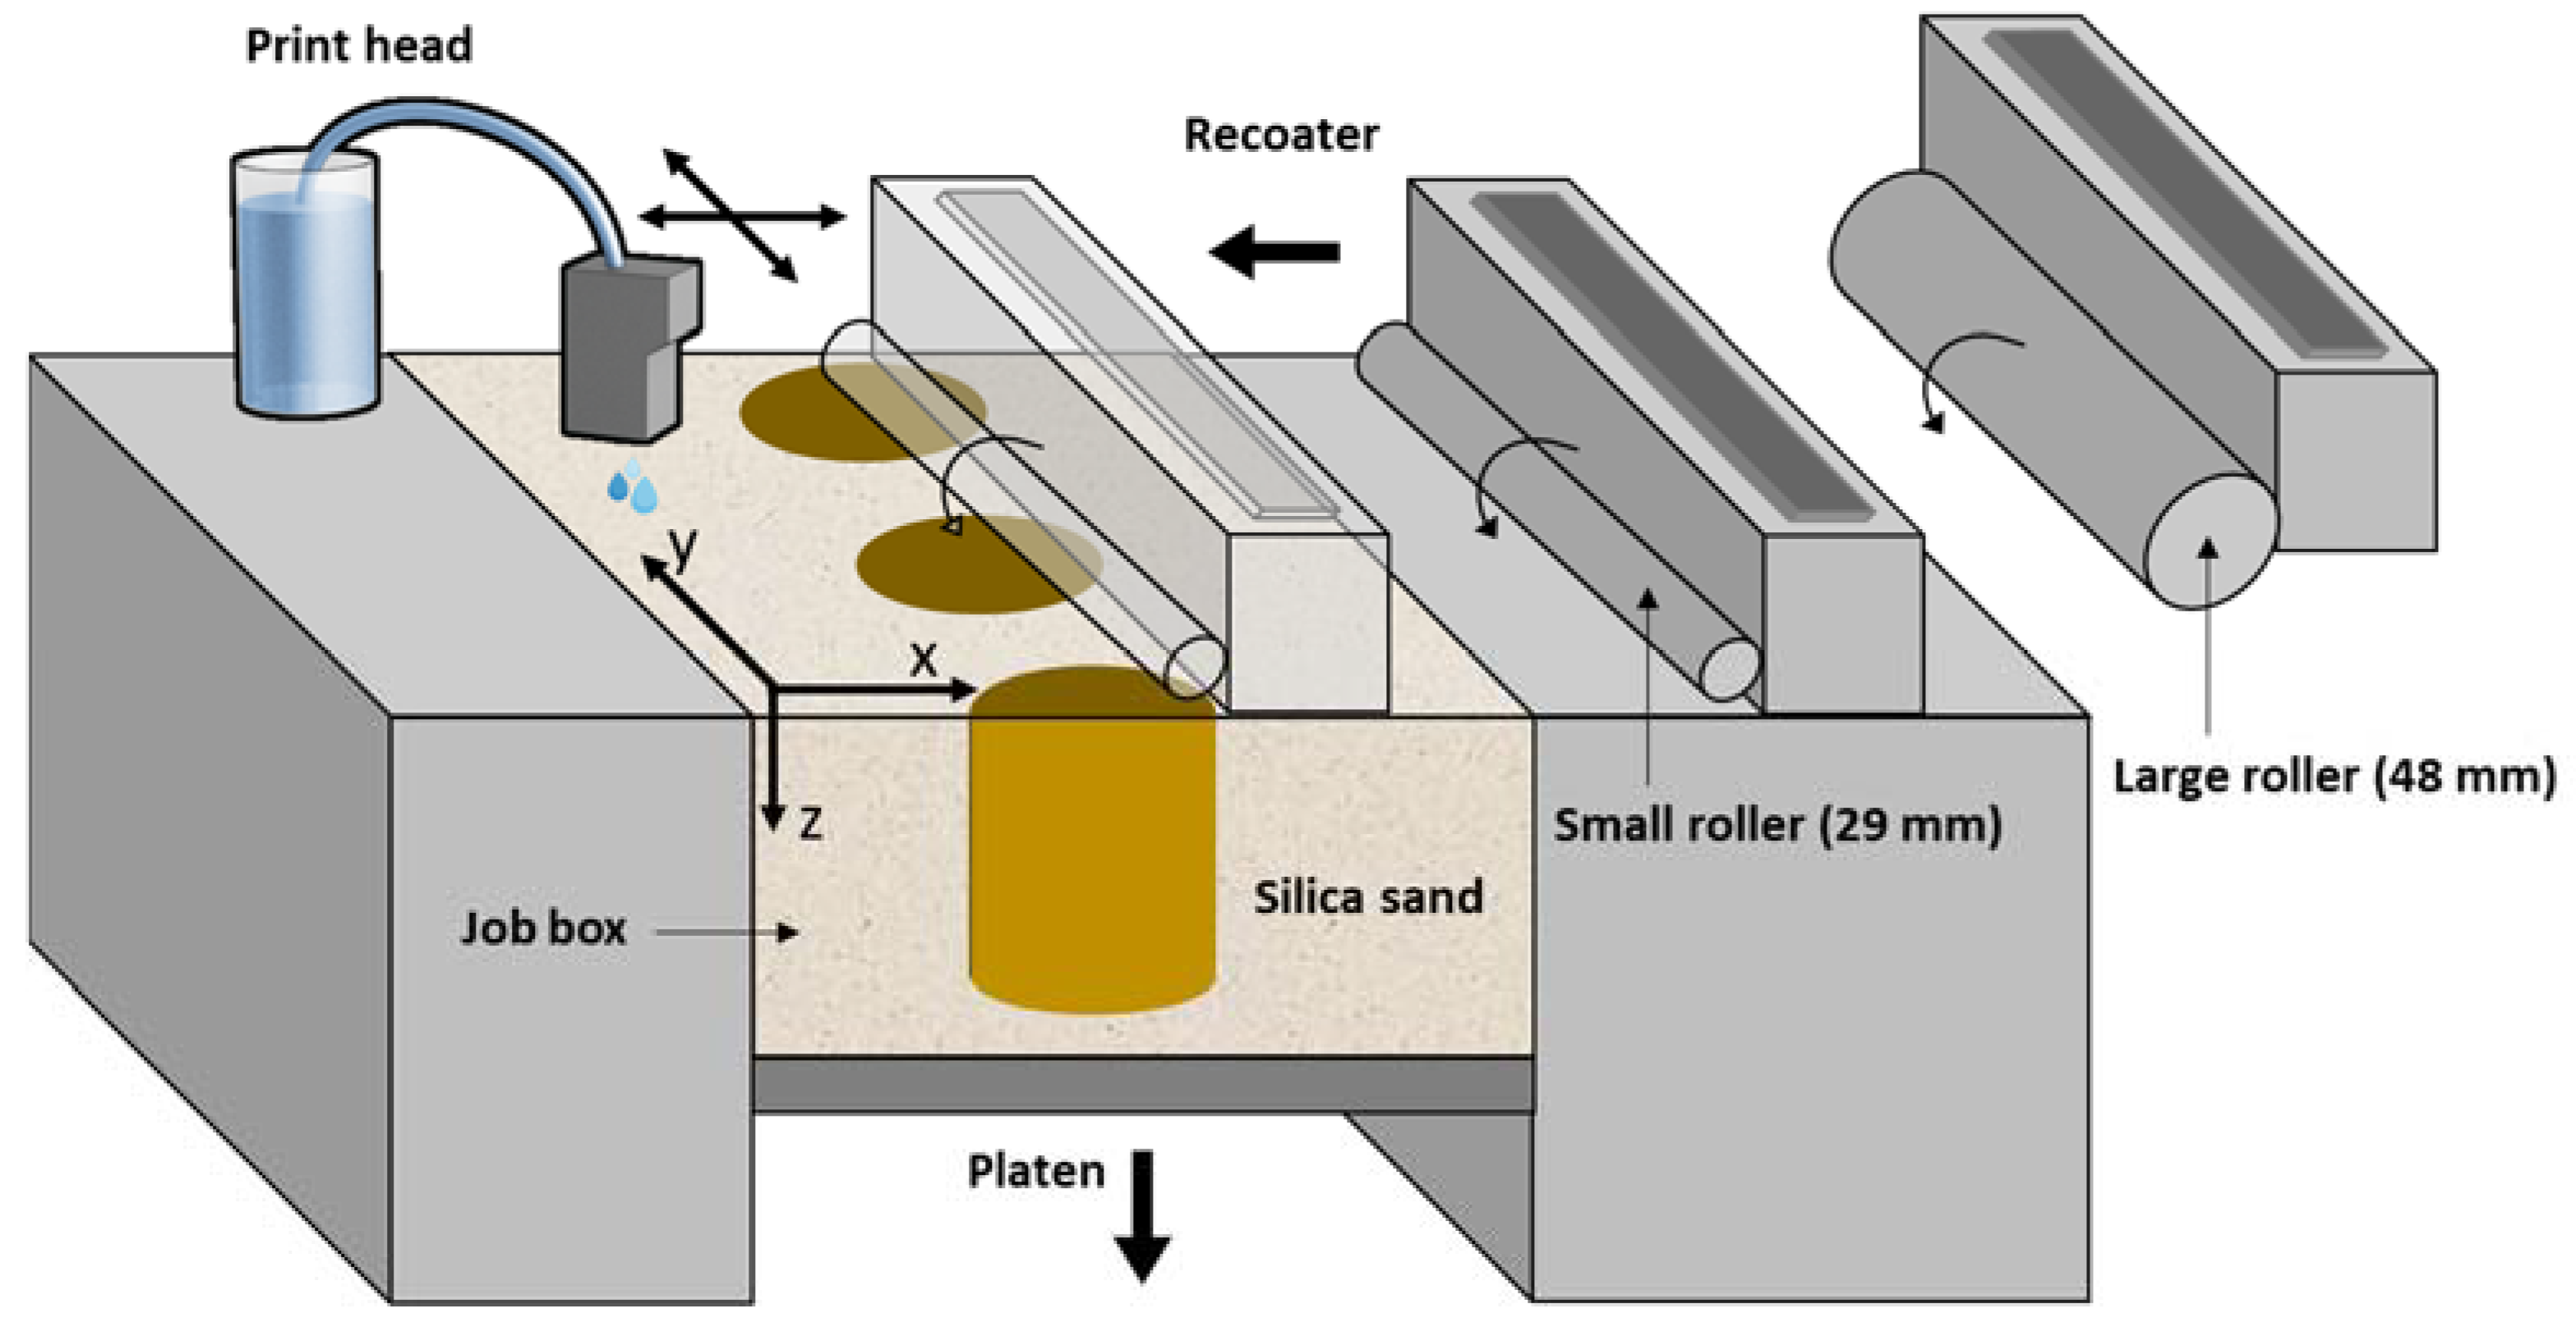
Figure 2.
Photograph of the M-Flex compacting roller: (a) original roller (ExOne), and (b) large roller fabricated for this study.
Figure 2.
Photograph of the M-Flex compacting roller: (a) original roller (ExOne), and (b) large roller fabricated for this study.
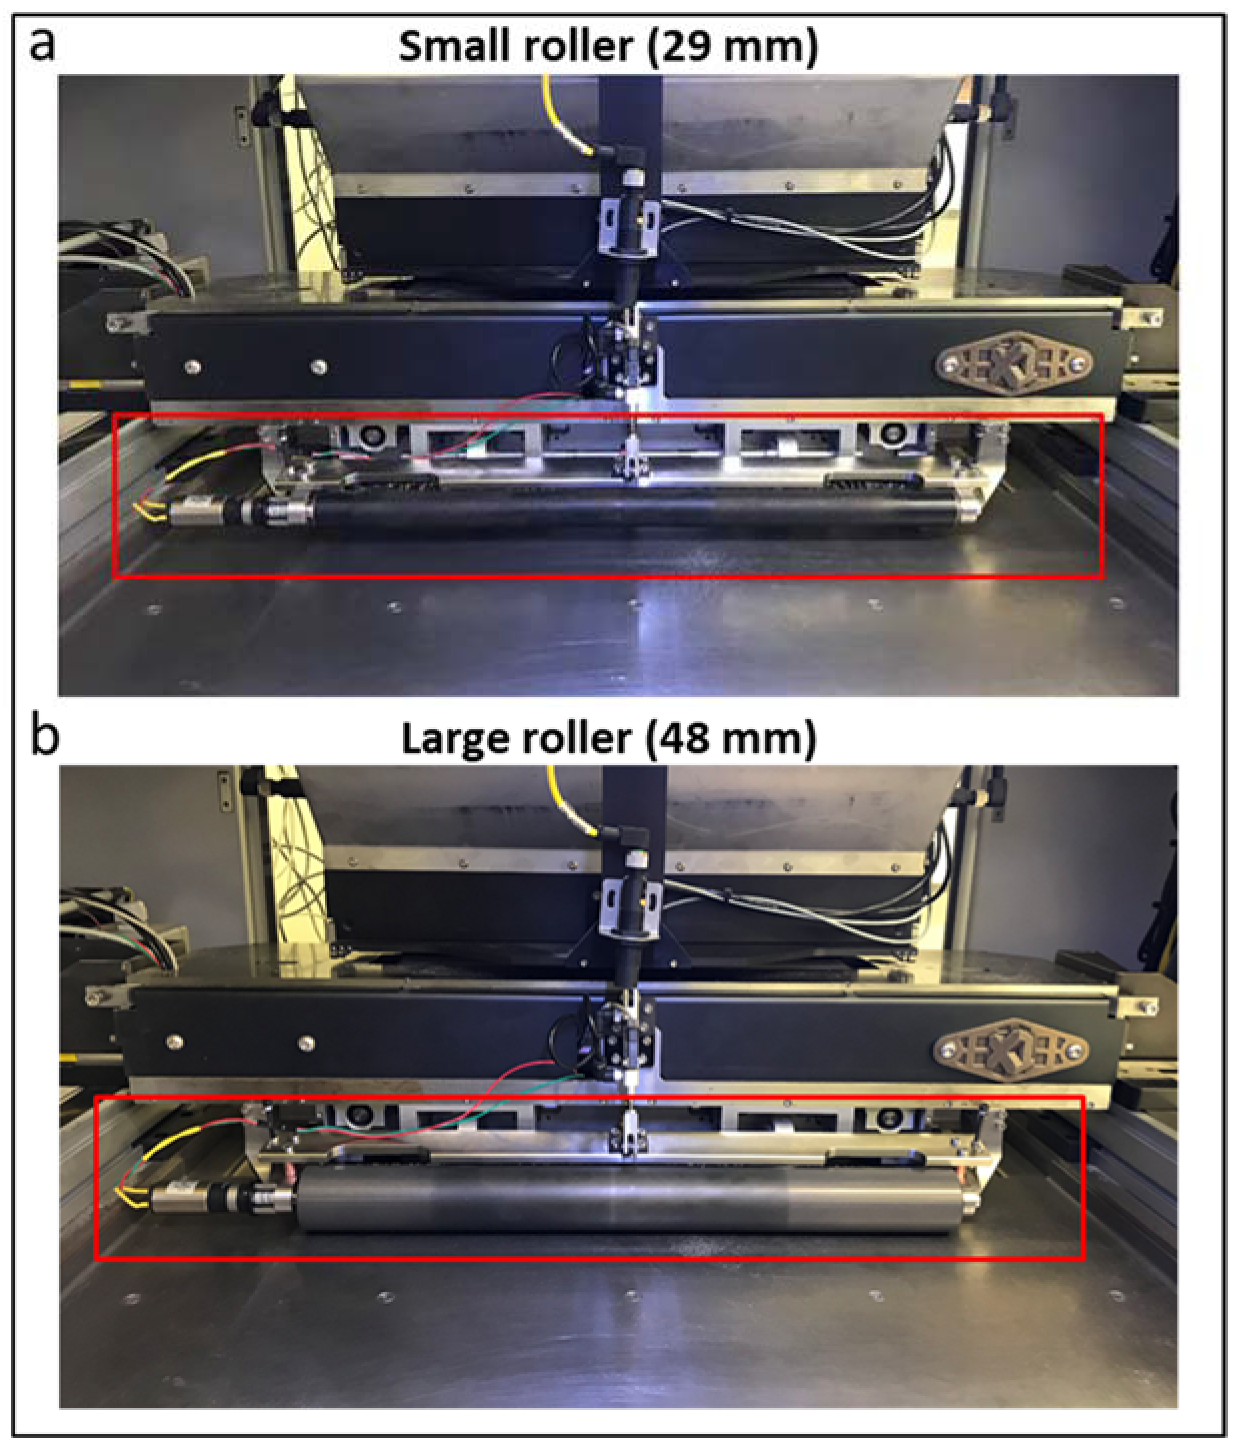
Figure 3.
Size distributions (retained mass) of the fine and coarse sands used to create the samples in this study.
Figure 3.
Size distributions (retained mass) of the fine and coarse sands used to create the samples in this study.
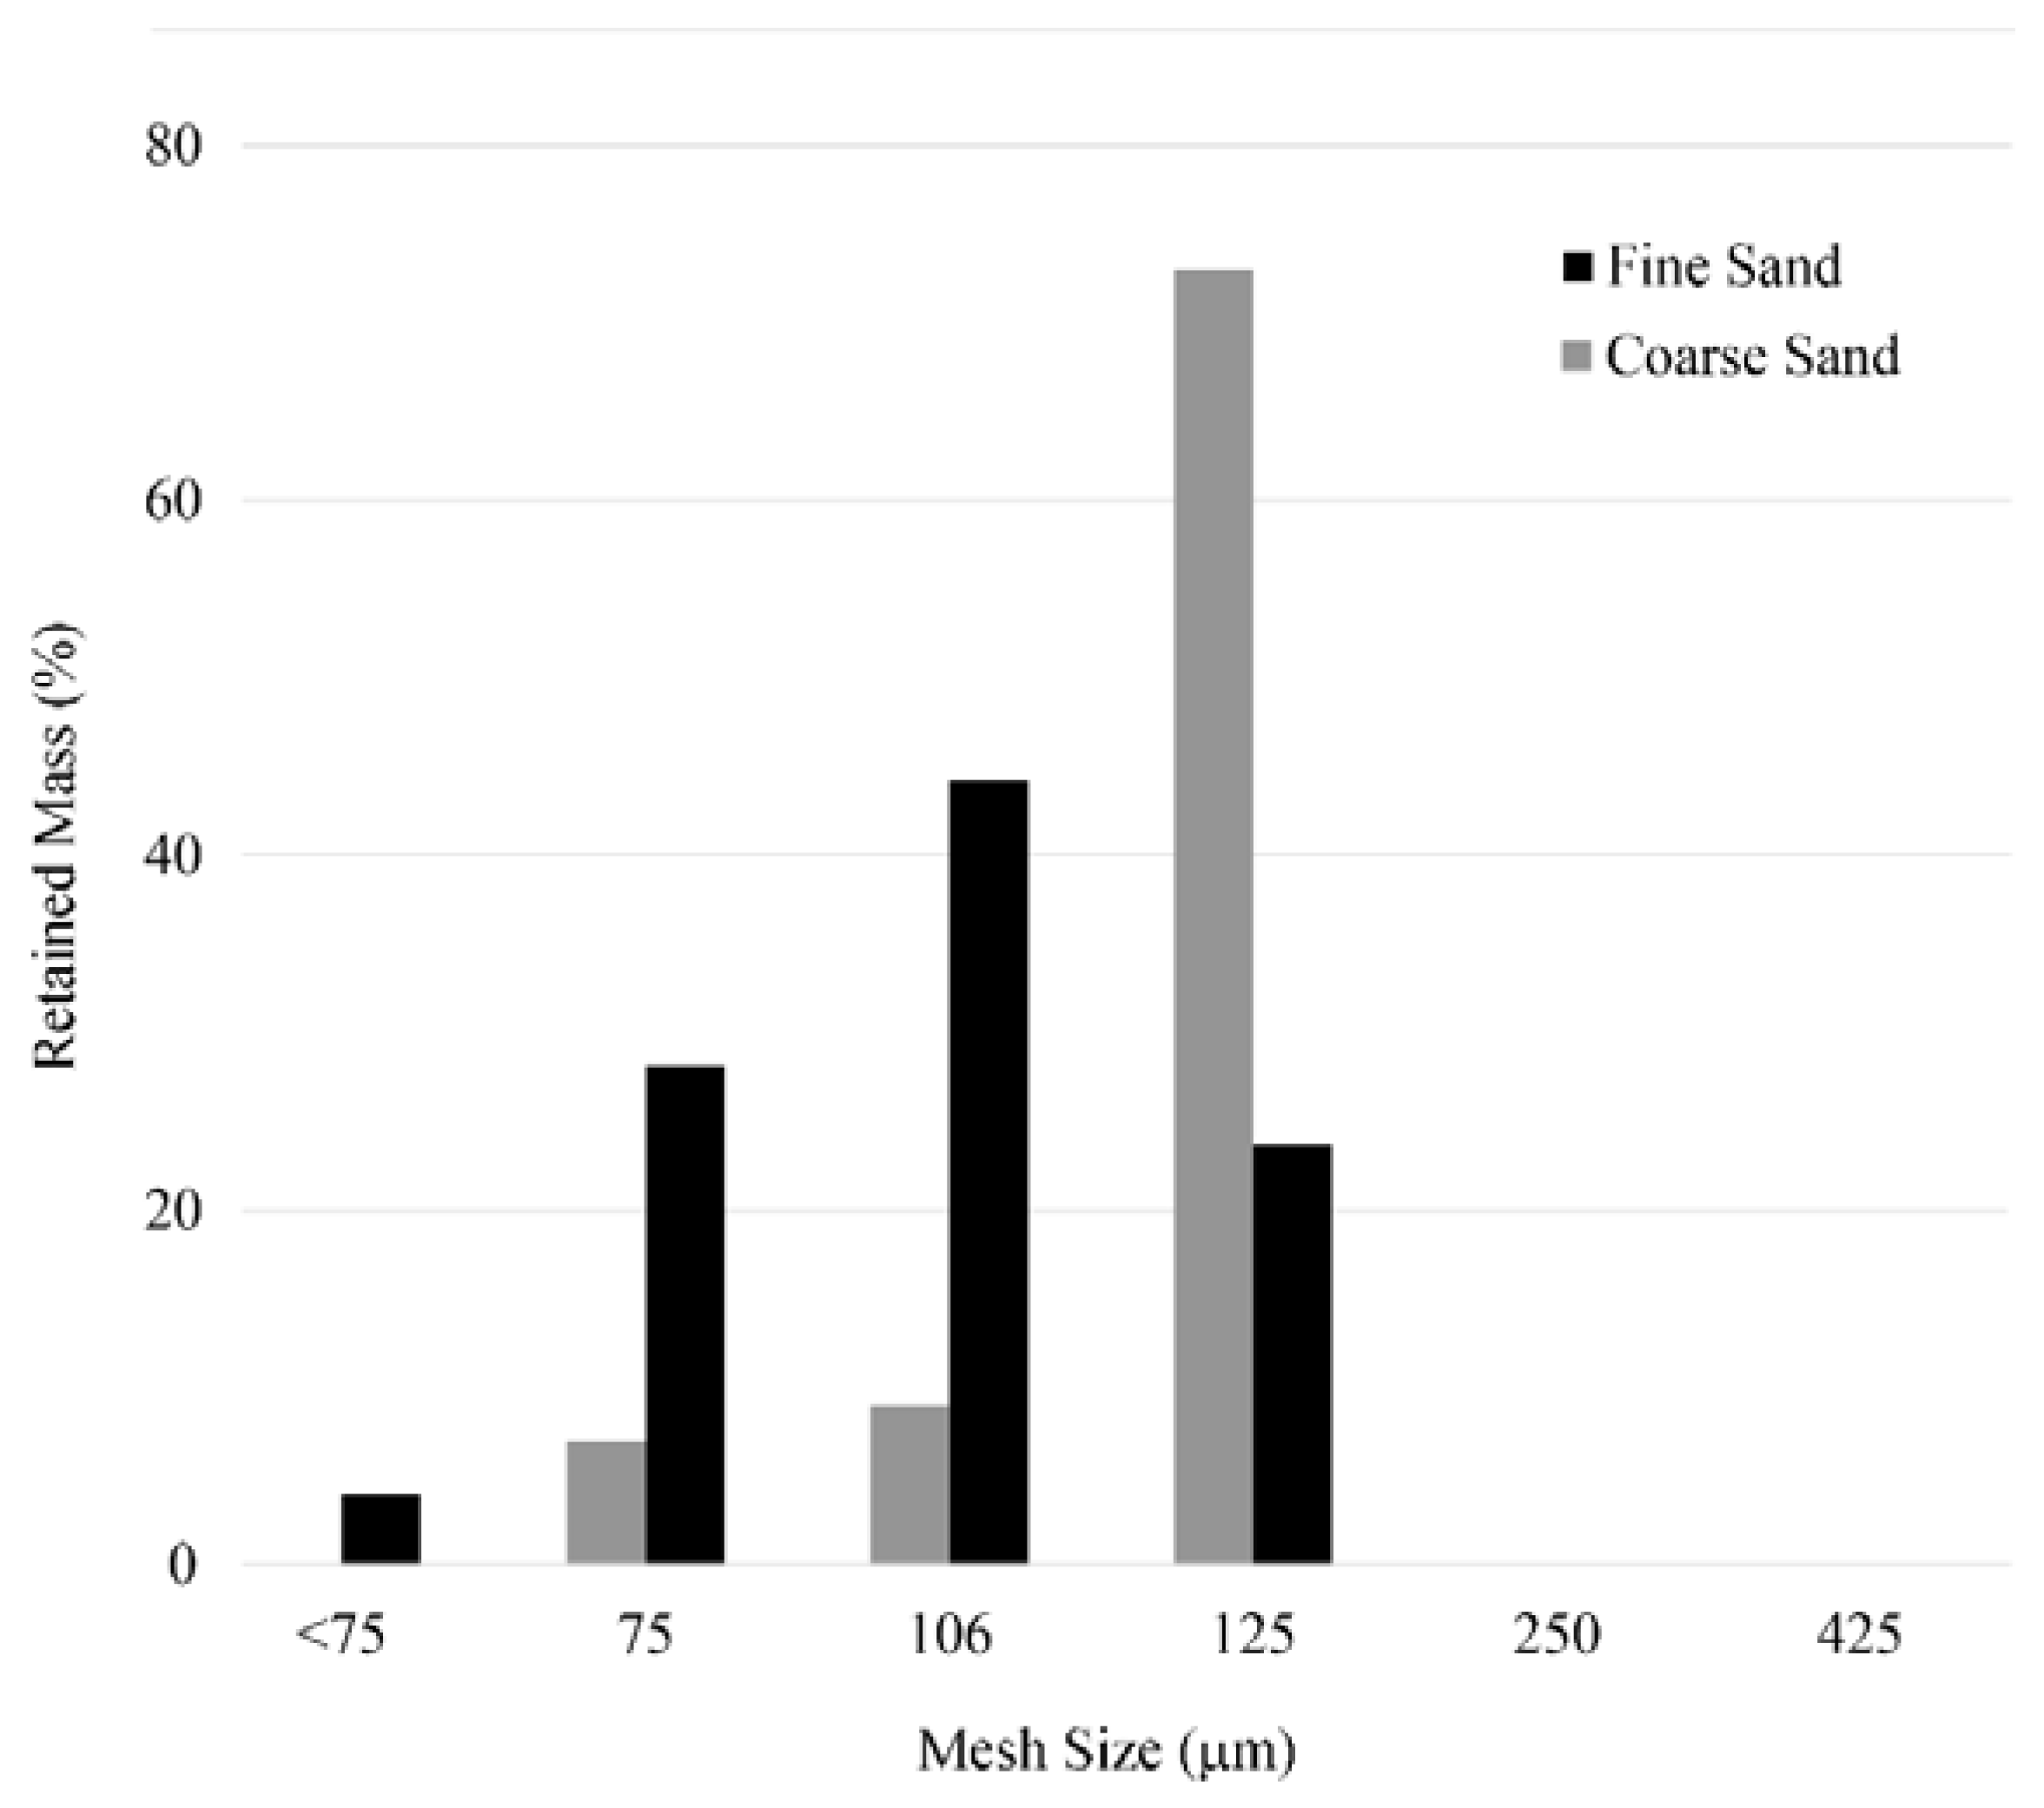
Figure 4.
Print direction with respect to axial loading. Dashed lines represent the printed layers.
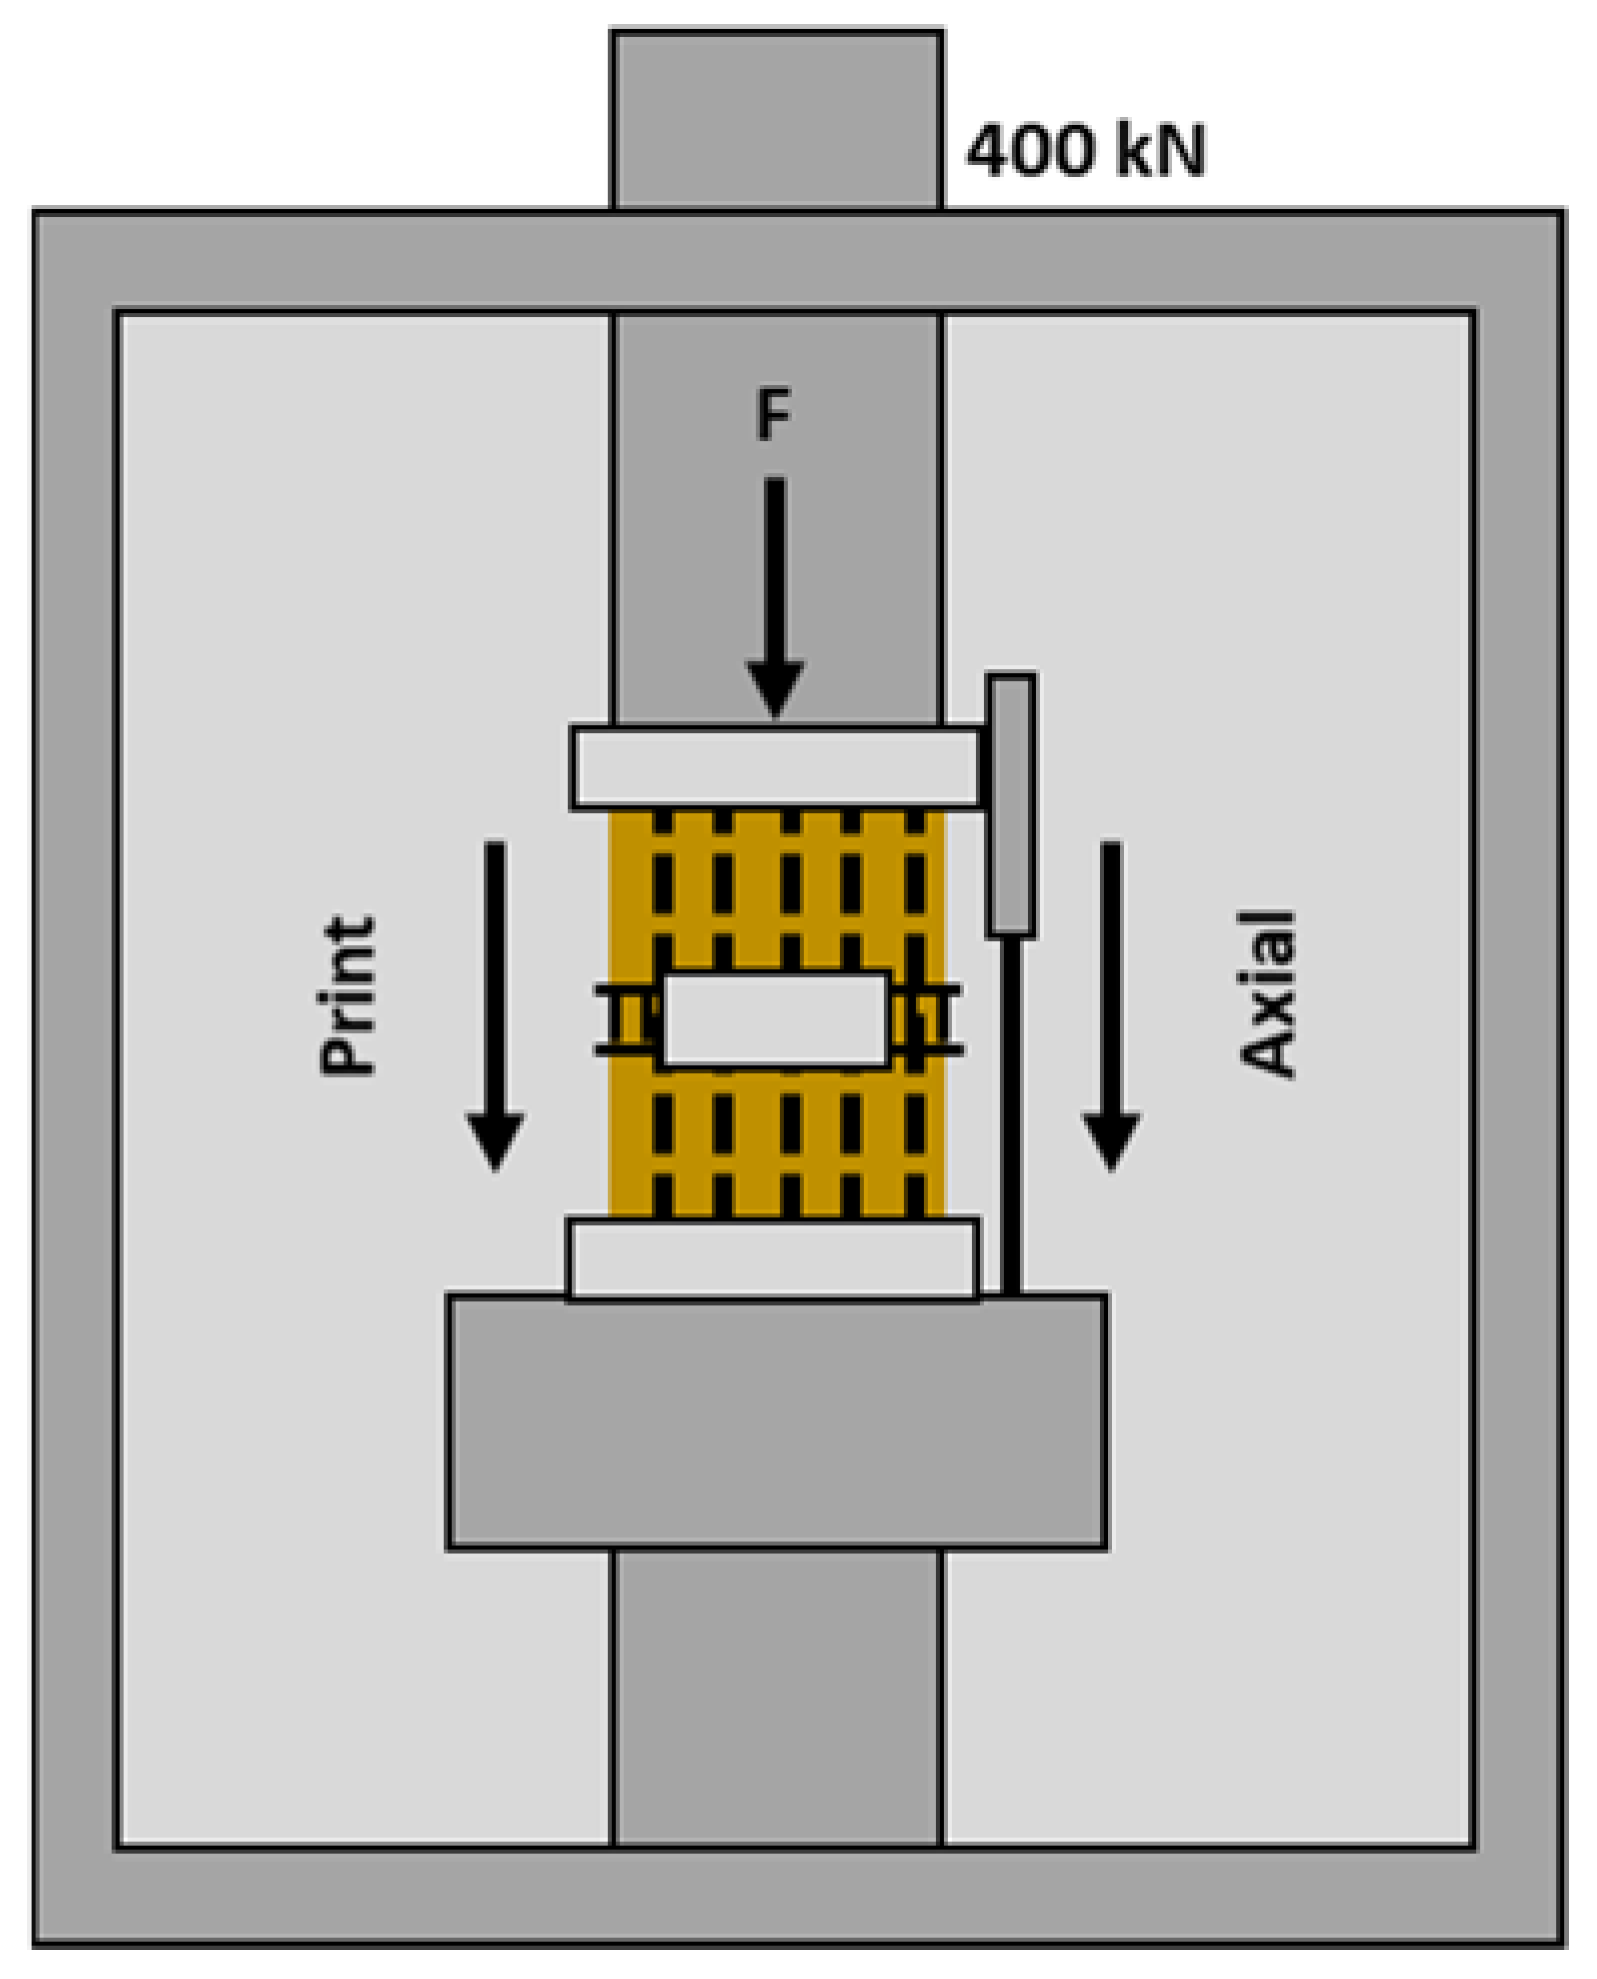
Figure 5.
Effect of the bimodal distribution of sand and compacting rollers in the strength of 3D-printed sandstones. Gray bars show the peak UCS of samples 3D-printed with the smaller (29 mm) roller, while black bars represent samples 3D-printed with the larger (48 mm) roller.
Figure 5.
Effect of the bimodal distribution of sand and compacting rollers in the strength of 3D-printed sandstones. Gray bars show the peak UCS of samples 3D-printed with the smaller (29 mm) roller, while black bars represent samples 3D-printed with the larger (48 mm) roller.
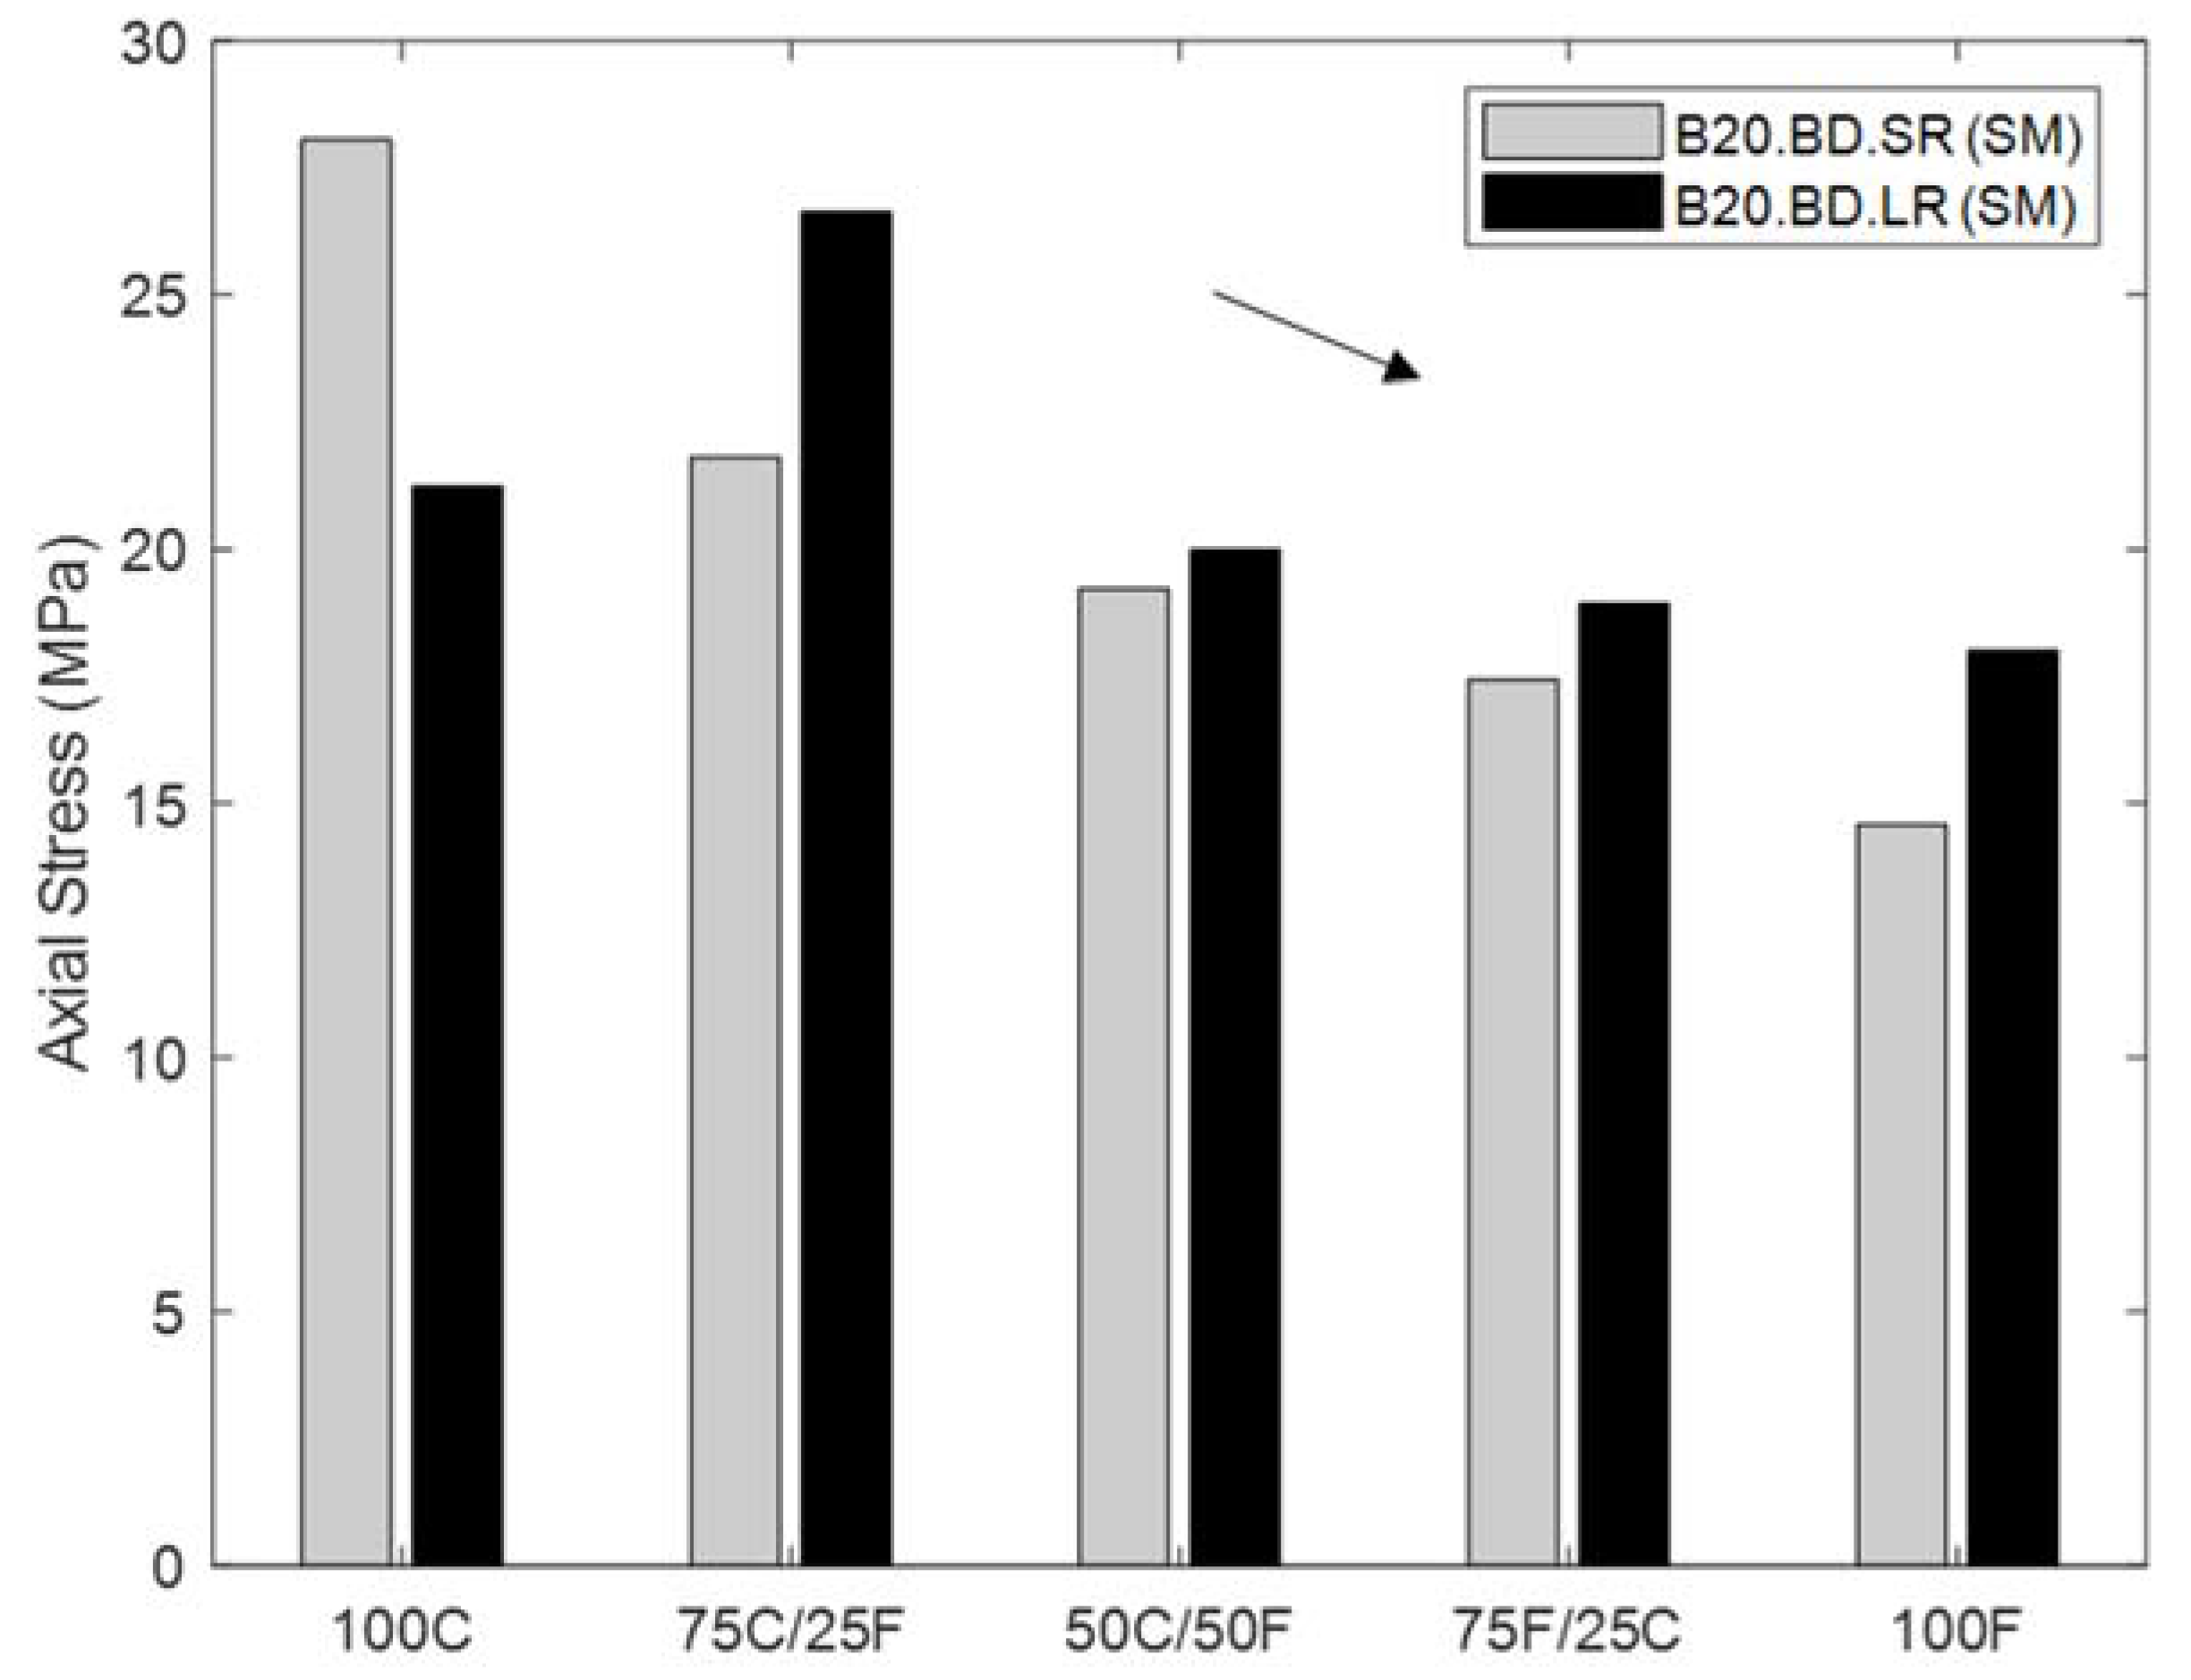
Figure 6.
Effect of the bimodal distribution of sand and compacting rollers in the porosity–density relationship of 3D-printed sandstones. Letters a, b, c, d, and e represent grade sand distributions 100%C, 75%C/25%F, 50%C/50%F, 25%C/75%F, and 100%F, respectively. The lowercase letters correspond to the helium measurements, while the capital letters represent the calculations by Equation (3). The correlation coefficient of the linear trend covering all data points shows an R2 value of 0.9.
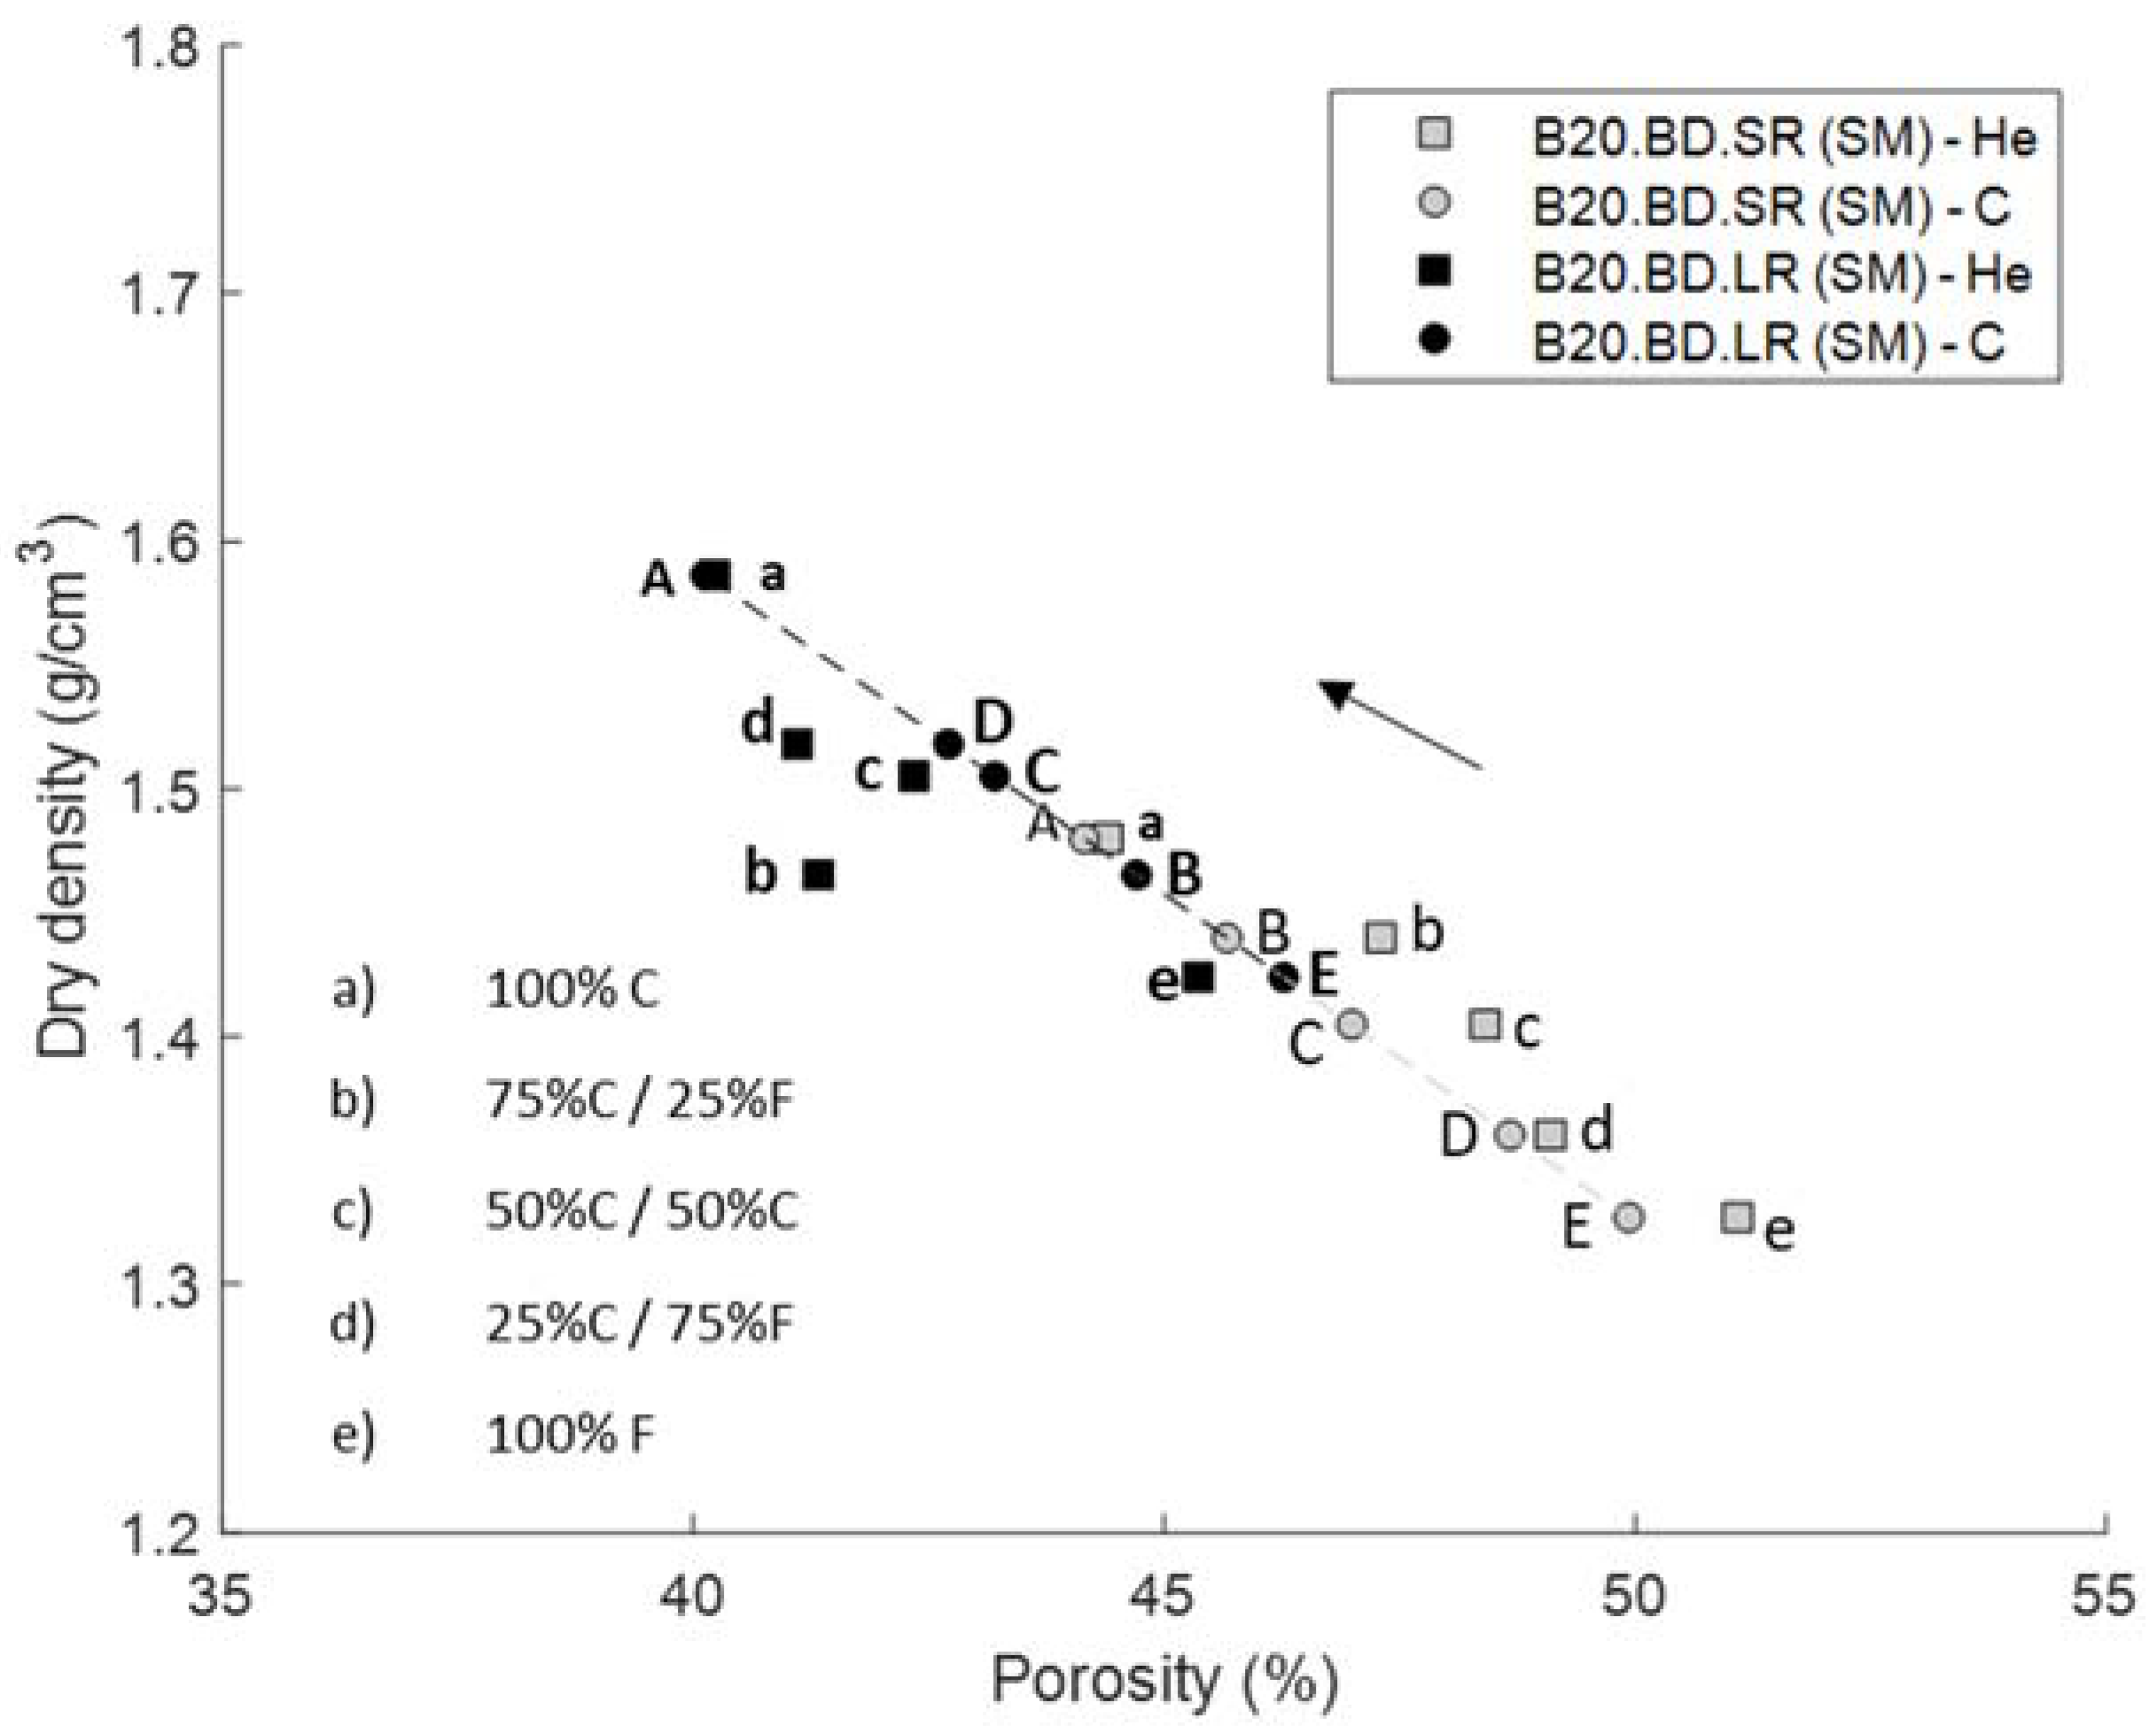
Figure 7.
Scanning electron microscopy images of 3D-printed sandstone using the small roller (left) and large roller (right). Better packing and higher density are achieved with the large roller and 100% coarse sand.
Figure 7.
Scanning electron microscopy images of 3D-printed sandstone using the small roller (left) and large roller (right). Better packing and higher density are achieved with the large roller and 100% coarse sand.

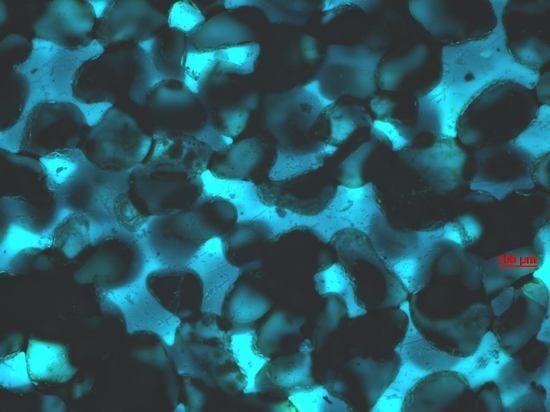
Figure 8.
Optical microscopy image captured with ultra-violet light to show the binder necks between sand grains, which will reduce the porosity and increase the strength of the 3D-printed specimens.
Figure 8.
Optical microscopy image captured with ultra-violet light to show the binder necks between sand grains, which will reduce the porosity and increase the strength of the 3D-printed specimens.

Figure 9.
SEM image showing how finer grains result in gathering of the binder in discreet locations (red arrows). Since the volume fraction of binder does not change during specimen production, gathering of binder may reduce the compressive strength of the samples.
Figure 9.
SEM image showing how finer grains result in gathering of the binder in discreet locations (red arrows). Since the volume fraction of binder does not change during specimen production, gathering of binder may reduce the compressive strength of the samples.
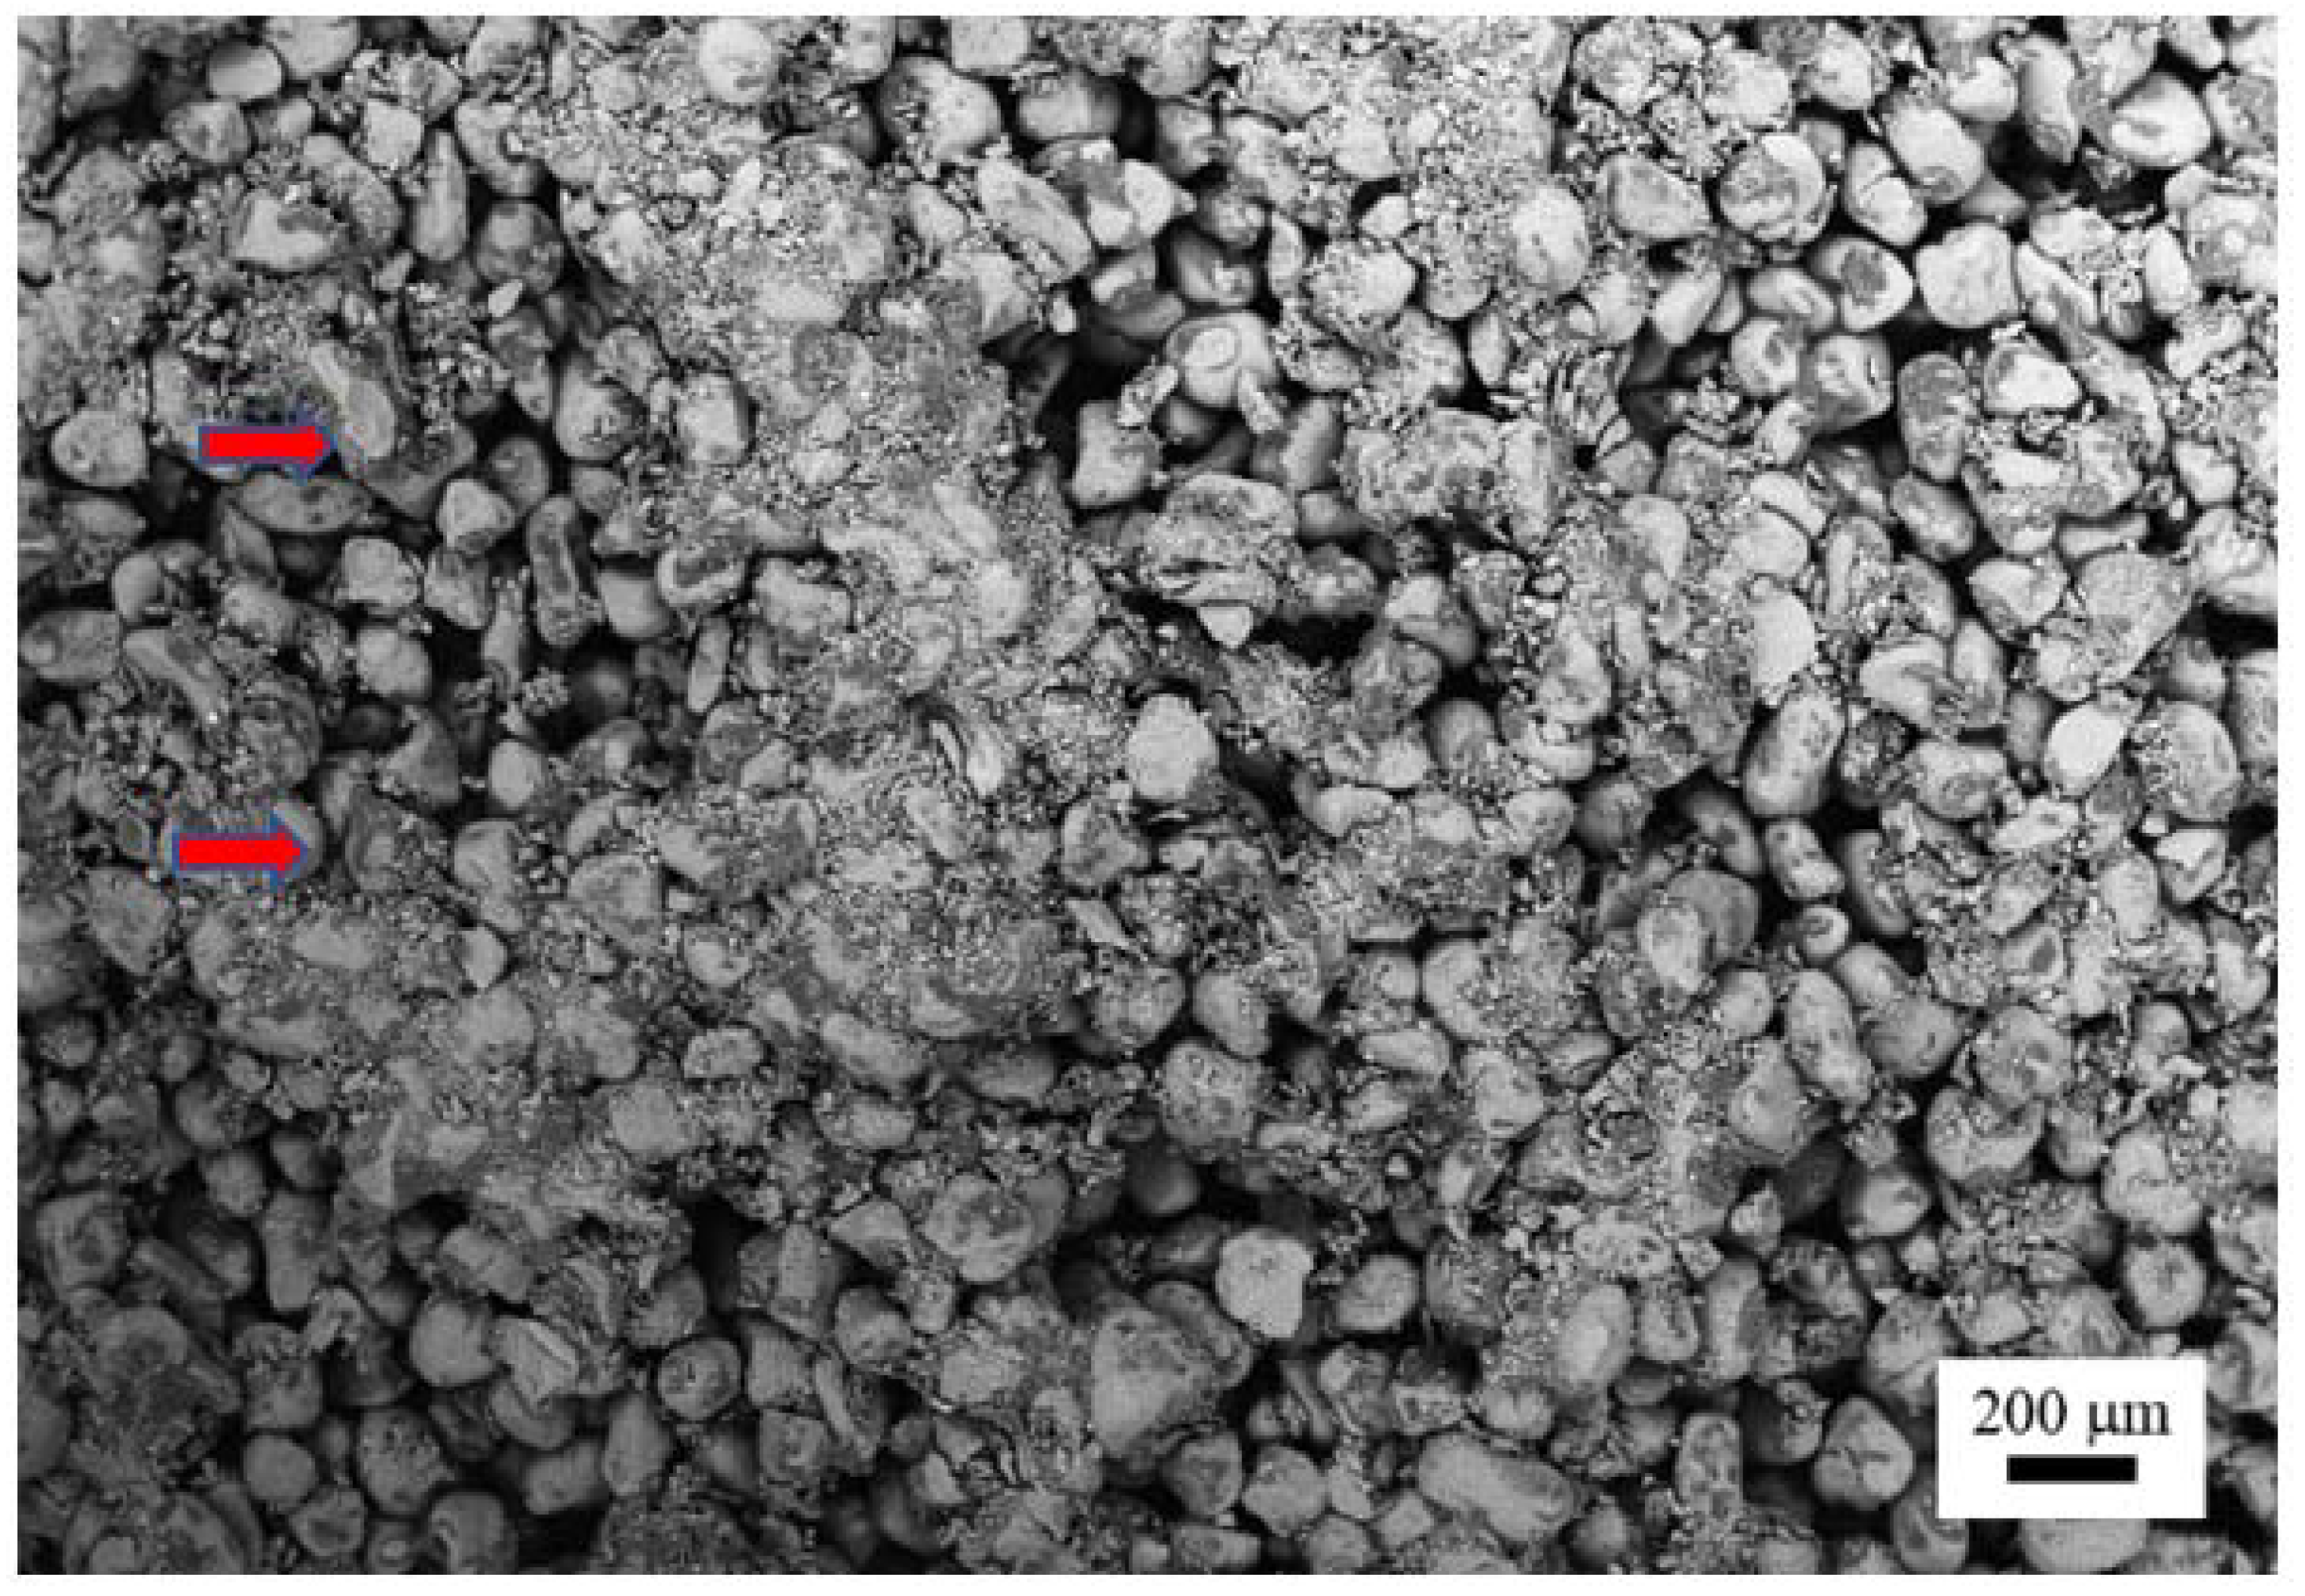
Figure 10.
(Left) Unconfined compressive strength (UCS) and (right) Young’s modulus values of the small and large roller, respectively.
Figure 10.
(Left) Unconfined compressive strength (UCS) and (right) Young’s modulus values of the small and large roller, respectively.
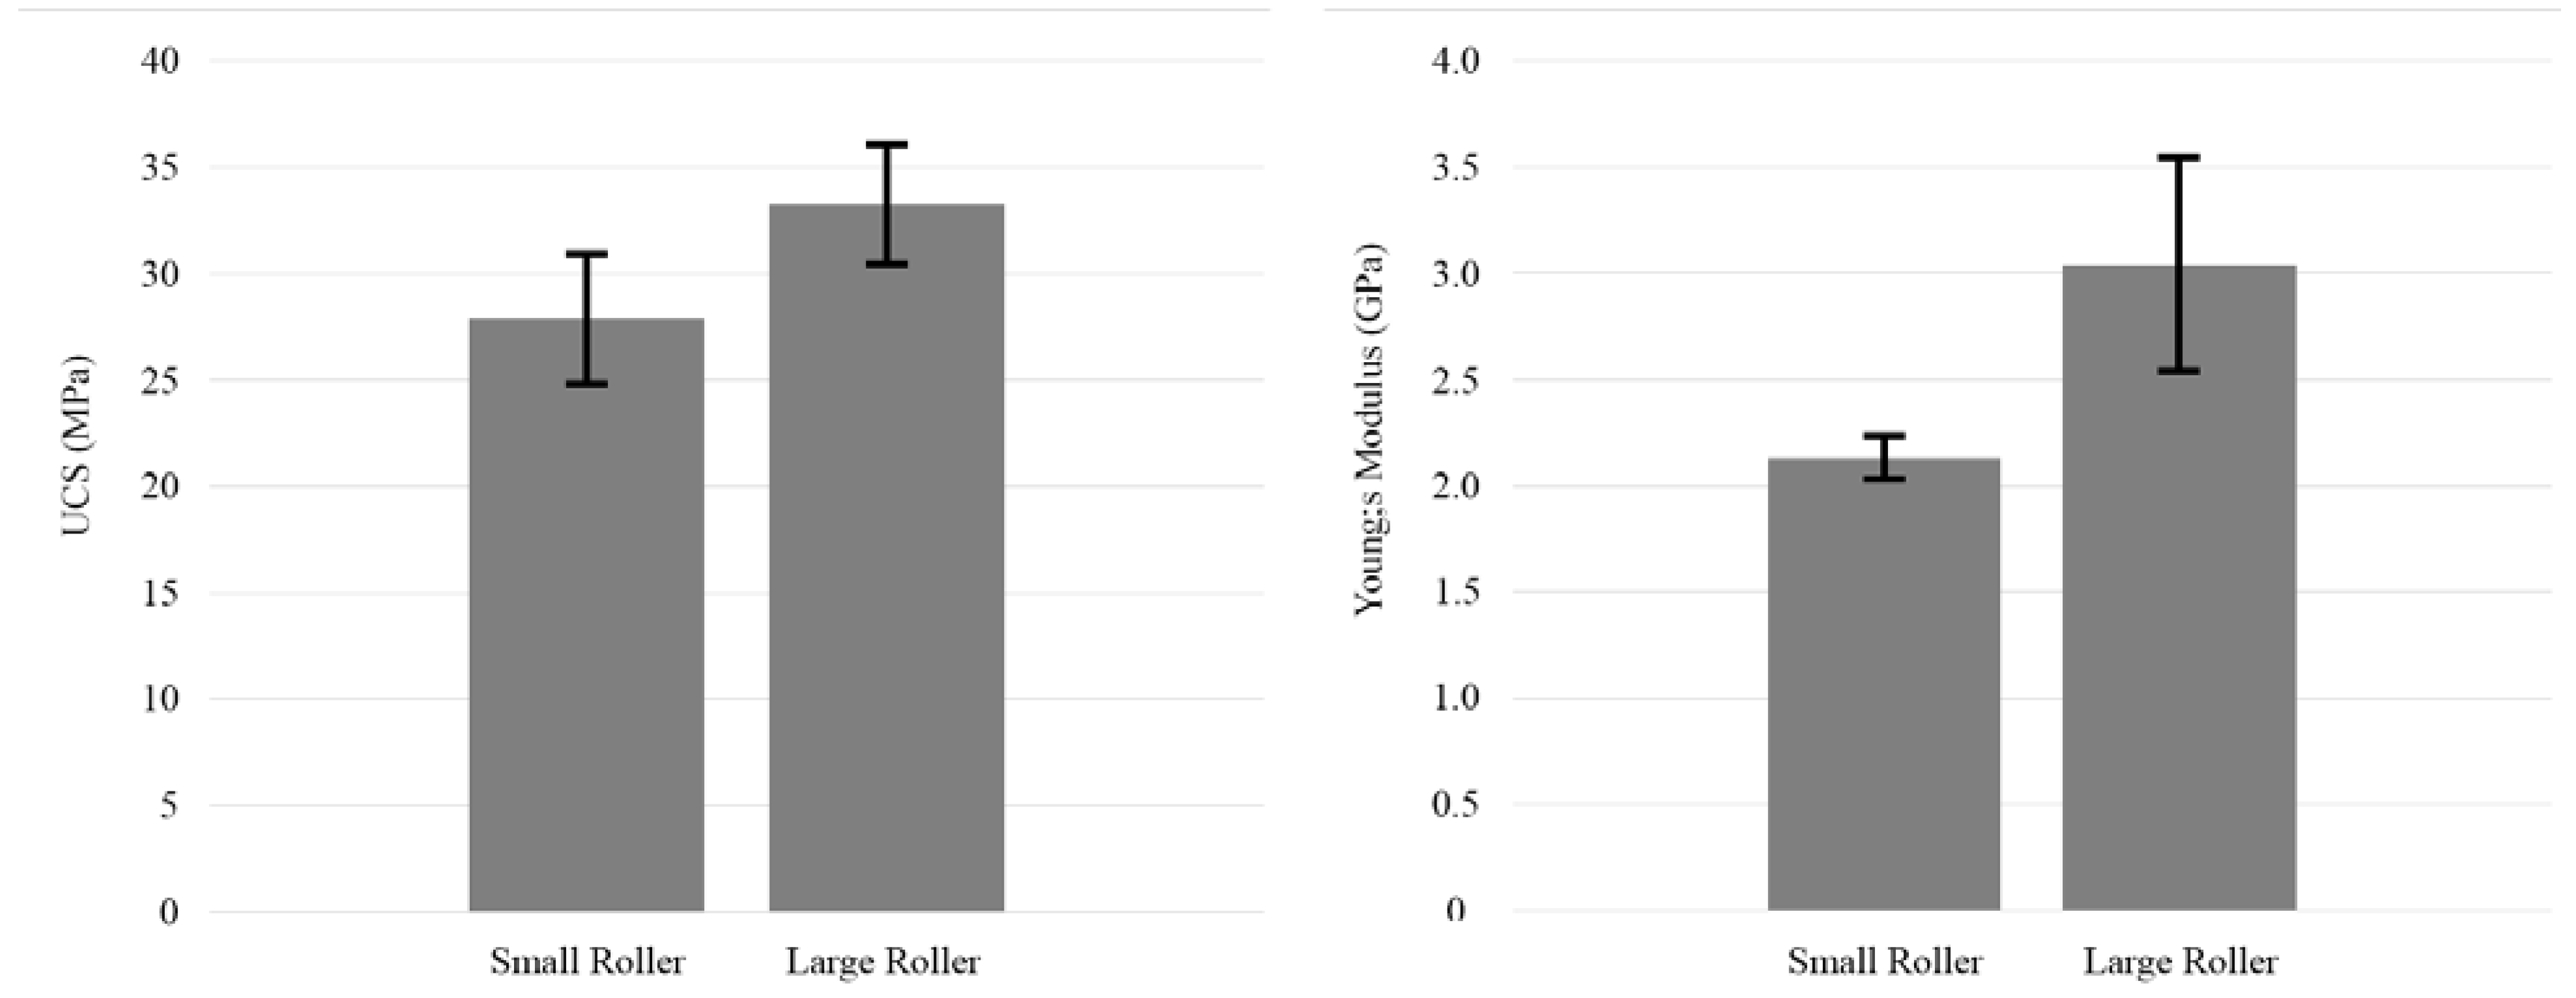
Figure 11.
(a) Effect of placement of 3D-printed samples on the compressive strength and Young’s modulus for the smaller roller and (b) large roller, respectively. The tables represent a normal view of the powder bed, where increased properties can be observed in the middle column of the powder bed.
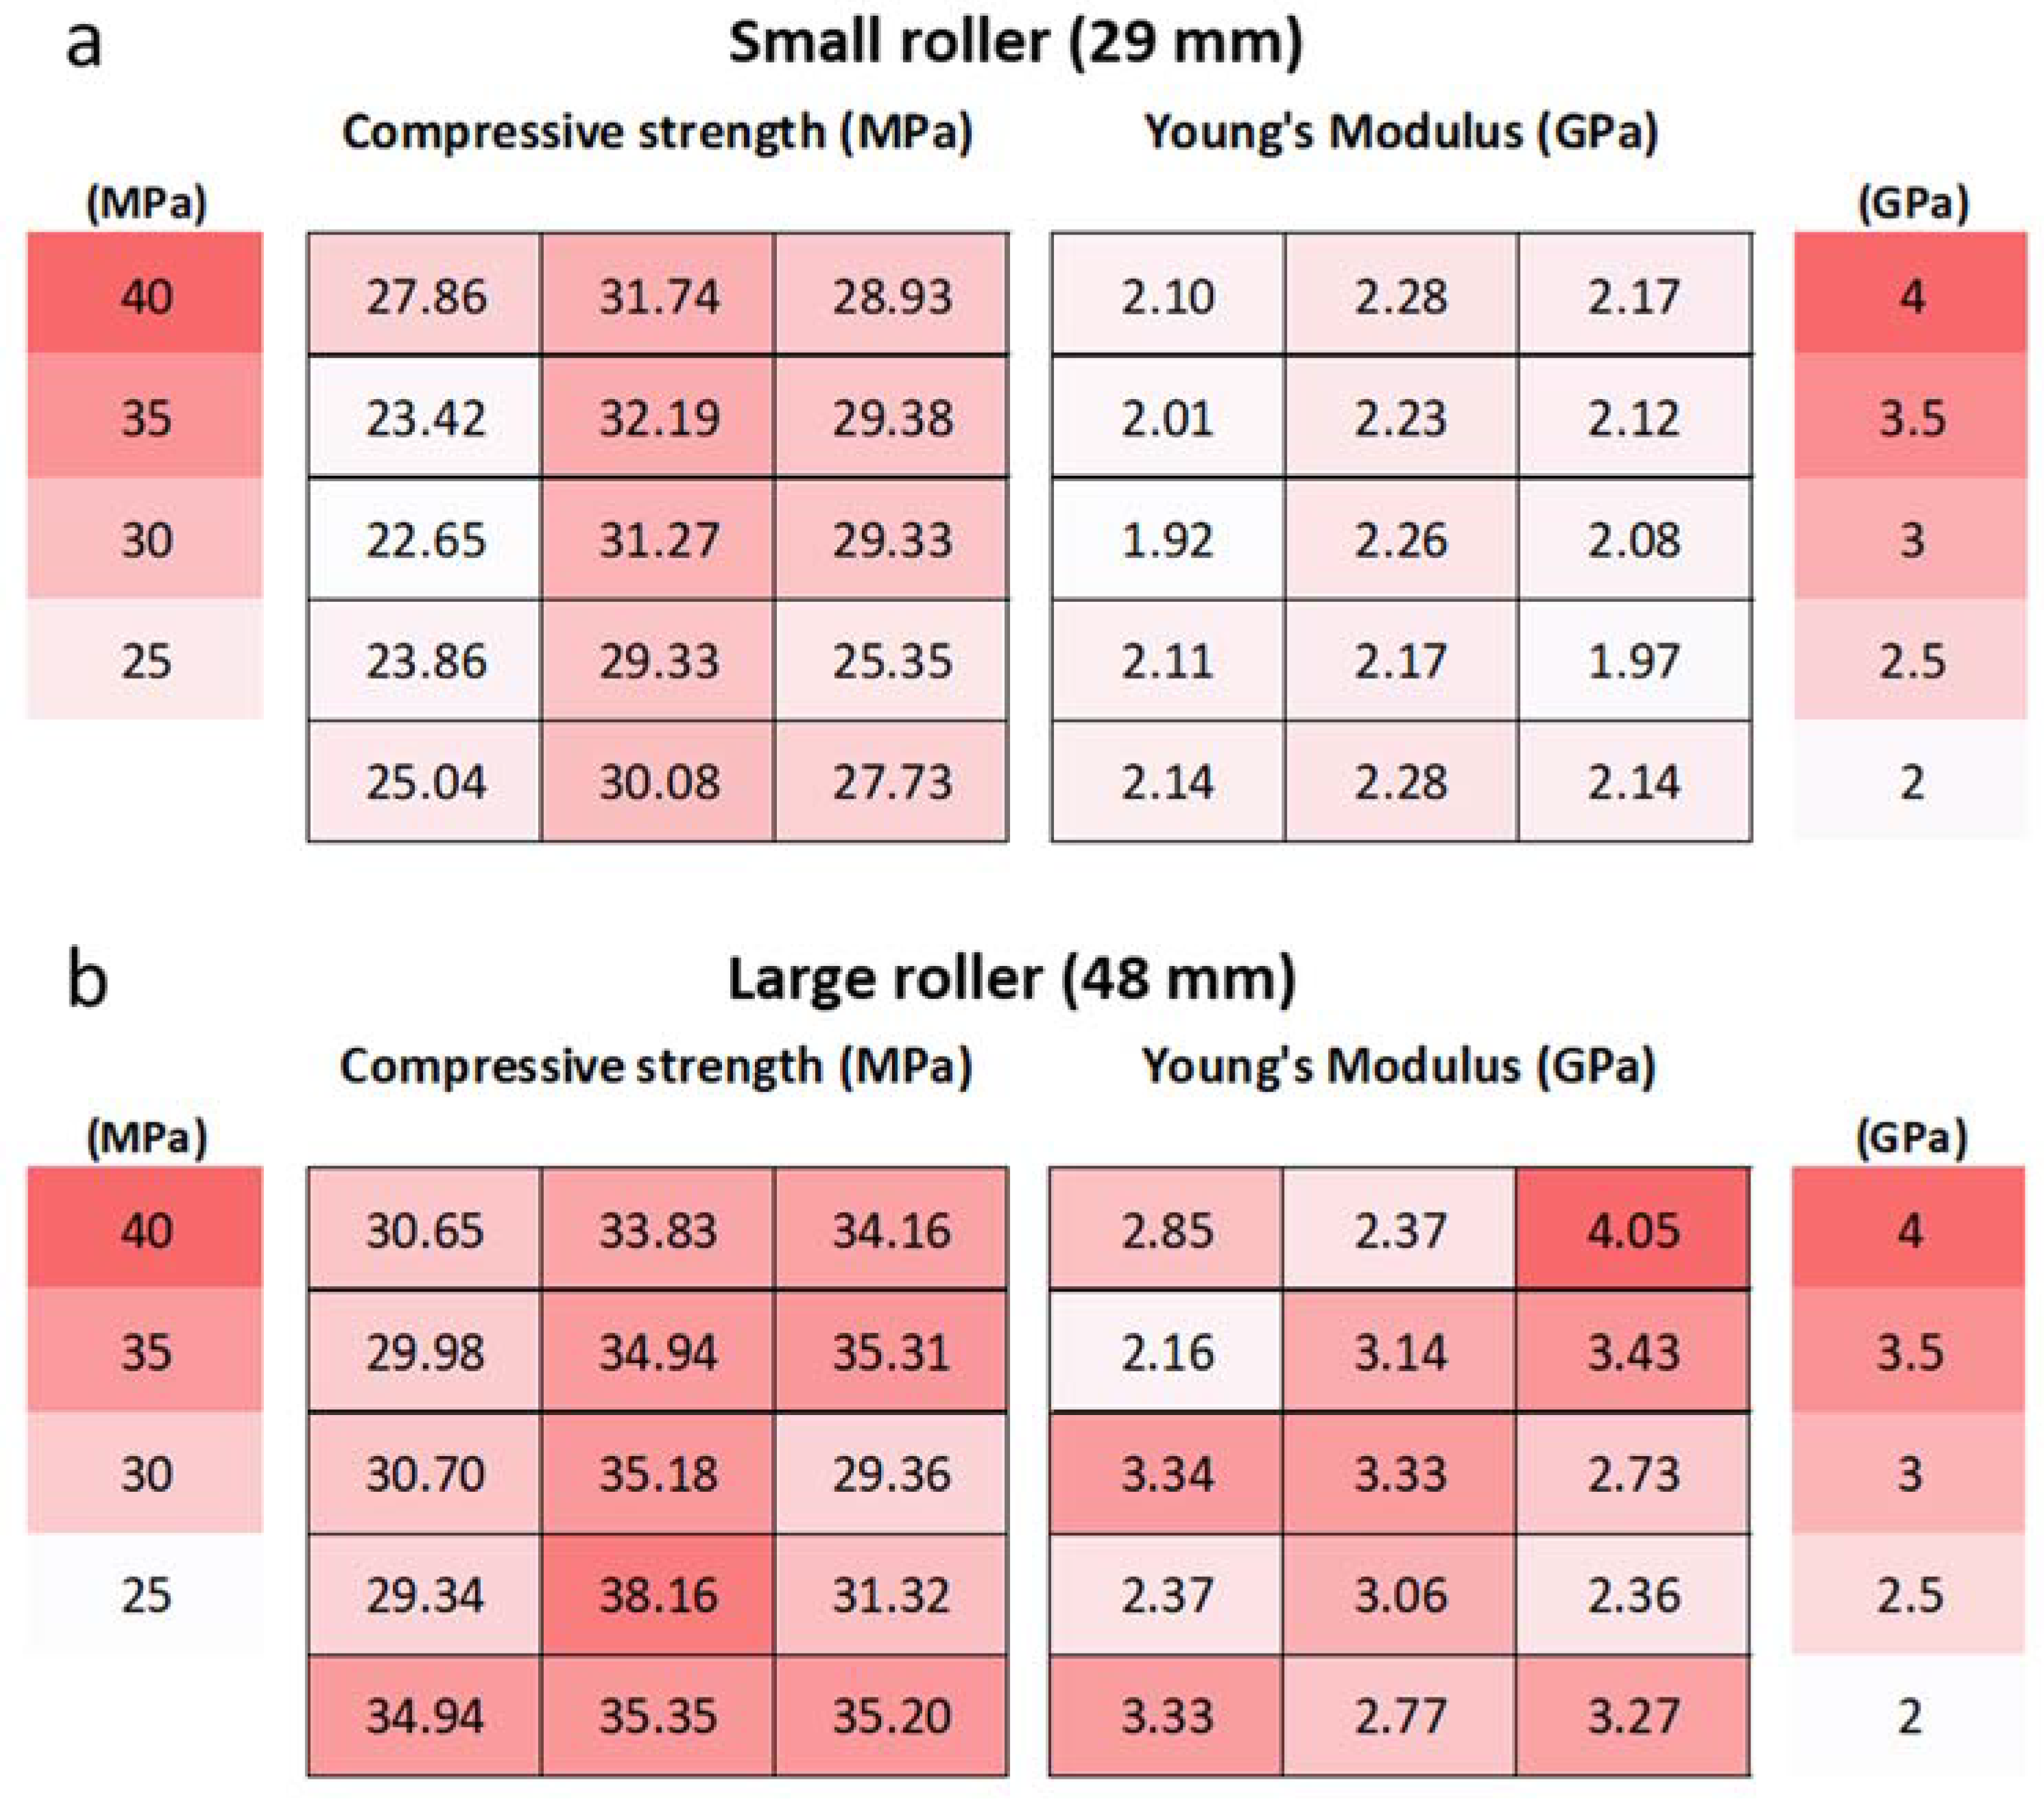
Figure 12.
Effect of a bimodal distribution of sand and compacting rollers on the geomechanical properties of the 3D-printed sandstones. The legend described the test code for each experiment. B represents the amount of binder used during 3D printing (10 or 20%). UD and BD denote the unimodal or bimodal grain size distribution used during the sand mixing (SM) process. SVT represents the strength variability tests. All tests were conducted using the small and large rollers, SR and LR, respectively.
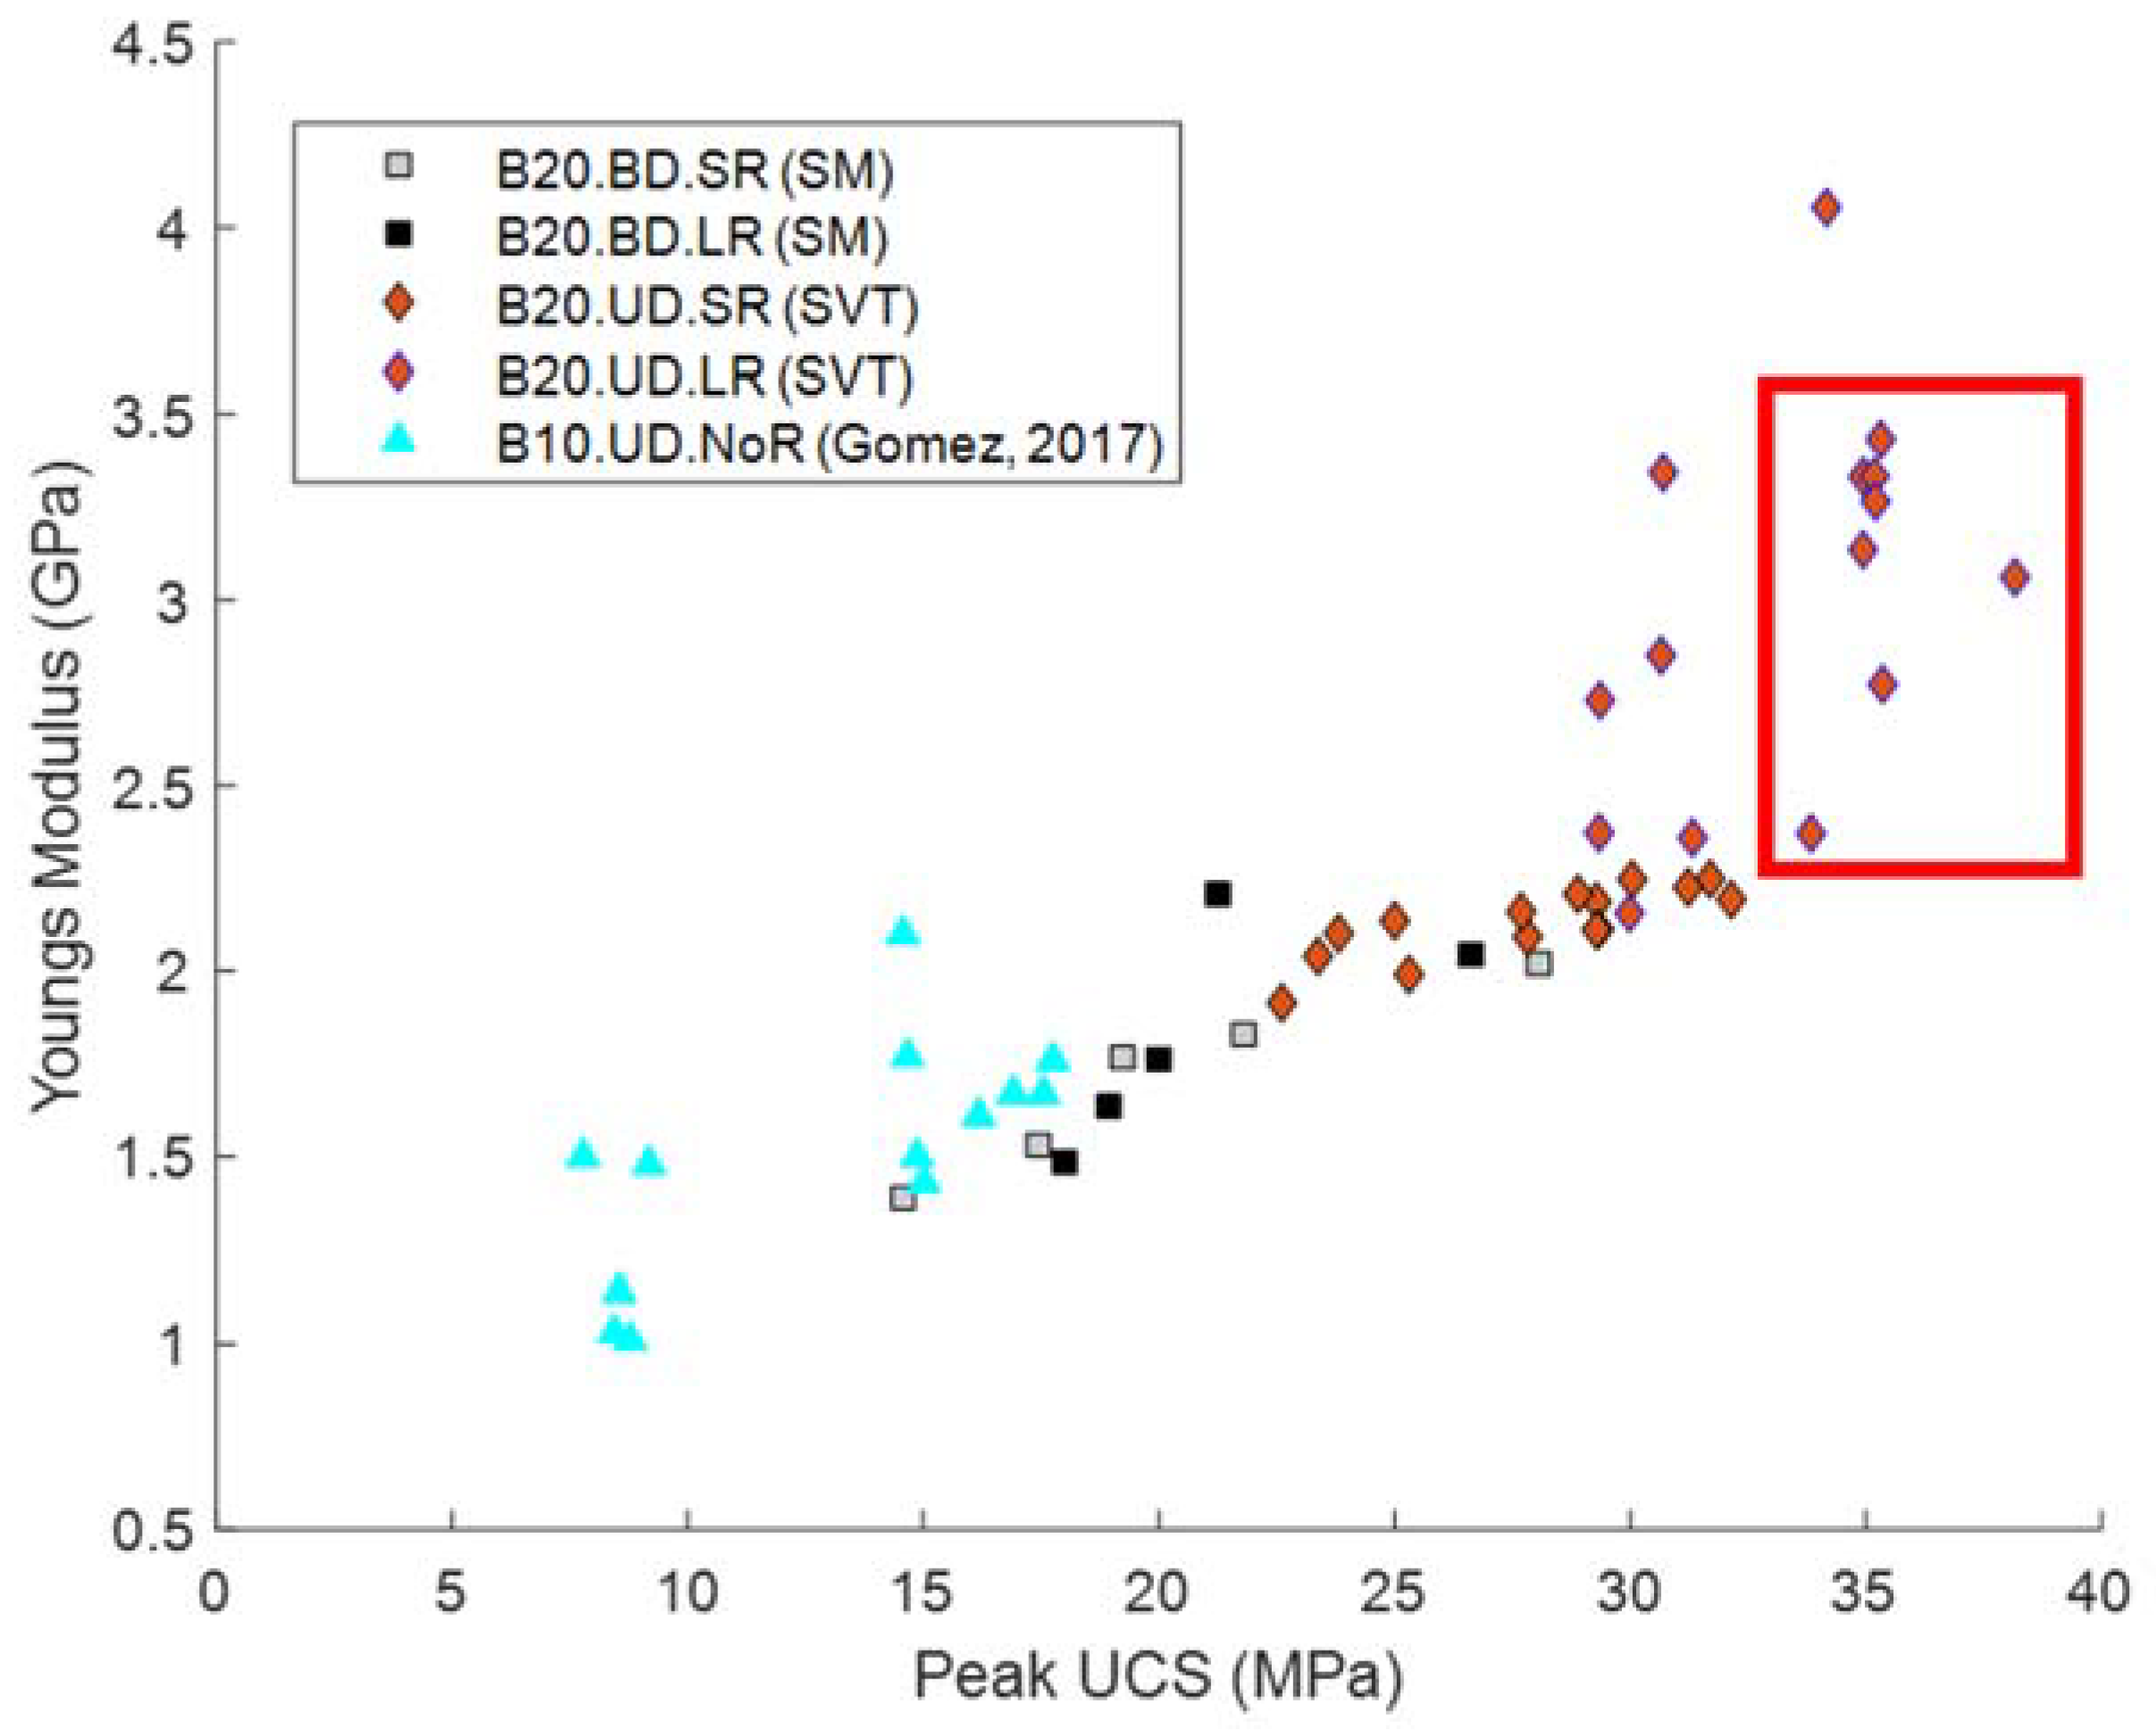
Figure 13.
Effect of a bimodal distribution of sand and compacting rollers on the transport properties of the 3D-printed sandstones.
Figure 13.
Effect of a bimodal distribution of sand and compacting rollers on the transport properties of the 3D-printed sandstones.

Table 1.
Grades of sand mixtures used to 3D-print specimens from sand. Percentage indicates total weight of fine (F) or coarse (C) sand within the blend.
Table 1.
Grades of sand mixtures used to 3D-print specimens from sand. Percentage indicates total weight of fine (F) or coarse (C) sand within the blend.
| Sand Mixture | Coarse Sand (wt.) (D50 = 175 μm) | Fine Sand (wt.) (D50 = 105 μm) |
|---|---|---|
| 100C | 100% | 0% |
| 75C/25F | 75% | 25% |
| 50C/50F | 50% | 50% |
| 25C/75F | 25% | 75% |
| 100F | 0% | 100% |
Table 2.
Dimensions of cylindrical samples fabricated in this study. Diameter and height are kept at a 1:2 ratio as per ASTM [5].
Table 2.
Dimensions of cylindrical samples fabricated in this study. Diameter and height are kept at a 1:2 ratio as per ASTM [5].
| Sample | Diameter (mm/inch) | Height (mm/inch) |
|---|---|---|
| 1 | 63/2.5 | 127/5 |
| 2 | 38.1/1.5 | 76.2/3 |
| 3 | 12.7/0.5 | 25.4/1 |
Table 3.
Porosity and dry density calculations for sandstones printed with a bimodal distribution of sand.
Table 3.
Porosity and dry density calculations for sandstones printed with a bimodal distribution of sand.
| Small Roller (29 mm) | |||
|---|---|---|---|
| Sand Mixture | Porosity (%)—He | Porosity (%)—C (Equation (3)) | Dry Density (g/cm3) |
| 100%C | 44.40 | 44.15 | 1.48 |
| 75%C/25%F | 47.30 | 45.67 | 1.44 |
| 50%C/50%F | 48.41 | 46.99 | 1.40 |
| 25%C/75%F | 49.10 | 48.67 | 1.36 |
| 100%F | 51.09 | 49.93 | 1.33 |
| Large roller (48 mm) | |||
| 100%C | 40.23 | 40.13 | 1.59 |
| 75%C/25%F | 41.33 | 44.71 | 1.47 |
| 50%C/50%F | 42.34 | 43.20 | 1.51 |
| 25%C/75%F | 41.11 | 42.71 | 1.52 |
| 100%F | 45.36 | 46.27 | 1.42 |
Publisher’s Note: MDPI stays neutral with regard to jurisdictional claims in published maps and institutional affiliations. |
© 2022 by the authors. Licensee MDPI, Basel, Switzerland. This article is an open access article distributed under the terms and conditions of the Creative Commons Attribution (CC BY) license (https://creativecommons.org/licenses/by/4.0/).
Share and Cite
MDPI and ACS Style
Hodder, K.J.; Sanchez-Barra, A.J.; Ishutov, S.; Zambrano-Narvaez, G.; Chalaturnyk, R.J. Increasing Density of 3D-Printed Sandstone through Compaction. Energies 2022, 15, 1813. https://doi.org/10.3390/en15051813
AMA Style
Hodder KJ, Sanchez-Barra AJ, Ishutov S, Zambrano-Narvaez G, Chalaturnyk RJ. Increasing Density of 3D-Printed Sandstone through Compaction. Energies. 2022; 15(5):1813. https://doi.org/10.3390/en15051813
Chicago/Turabian StyleHodder, Kevin J., Angel J. Sanchez-Barra, Sergey Ishutov, Gonzalo Zambrano-Narvaez, and Rick J. Chalaturnyk. 2022. "Increasing Density of 3D-Printed Sandstone through Compaction" Energies 15, no. 5: 1813. https://doi.org/10.3390/en15051813
Note that from the first issue of 2016, this journal uses article numbers instead of page numbers. See further details here.