
Using Deep Learning in Real-Time for Clothing Classification with Connected Thermostats

 ,
,  , , and
Abstract
:1. Introduction
- Extrinsic elements: Offers, coupons, bill discounts, challenges, levels, dashboard, statistics, degree of control, points, badges, leaderboard;
- Intrinsic elements: Notifications, messages, tips, energy community, collaboration, control over peers, social comparison, and competition.
Object Classification Algorithms
- One-stage: The object detectors produce bounding boxes that contain the detected objects without a region proposal;
- Two-stage: The object detectors carefully review the entire image, leading to a slower process than the one-stage approach but with better accuracy.
- The model recognizes at least three garments of the clothing ensemble, proving that it recognizes more than a single clothing garment;
- The model had at least 90% accuracy in the test dataset, ensuring that it can generalize and it is not overfitting.
2. Materials and Methods
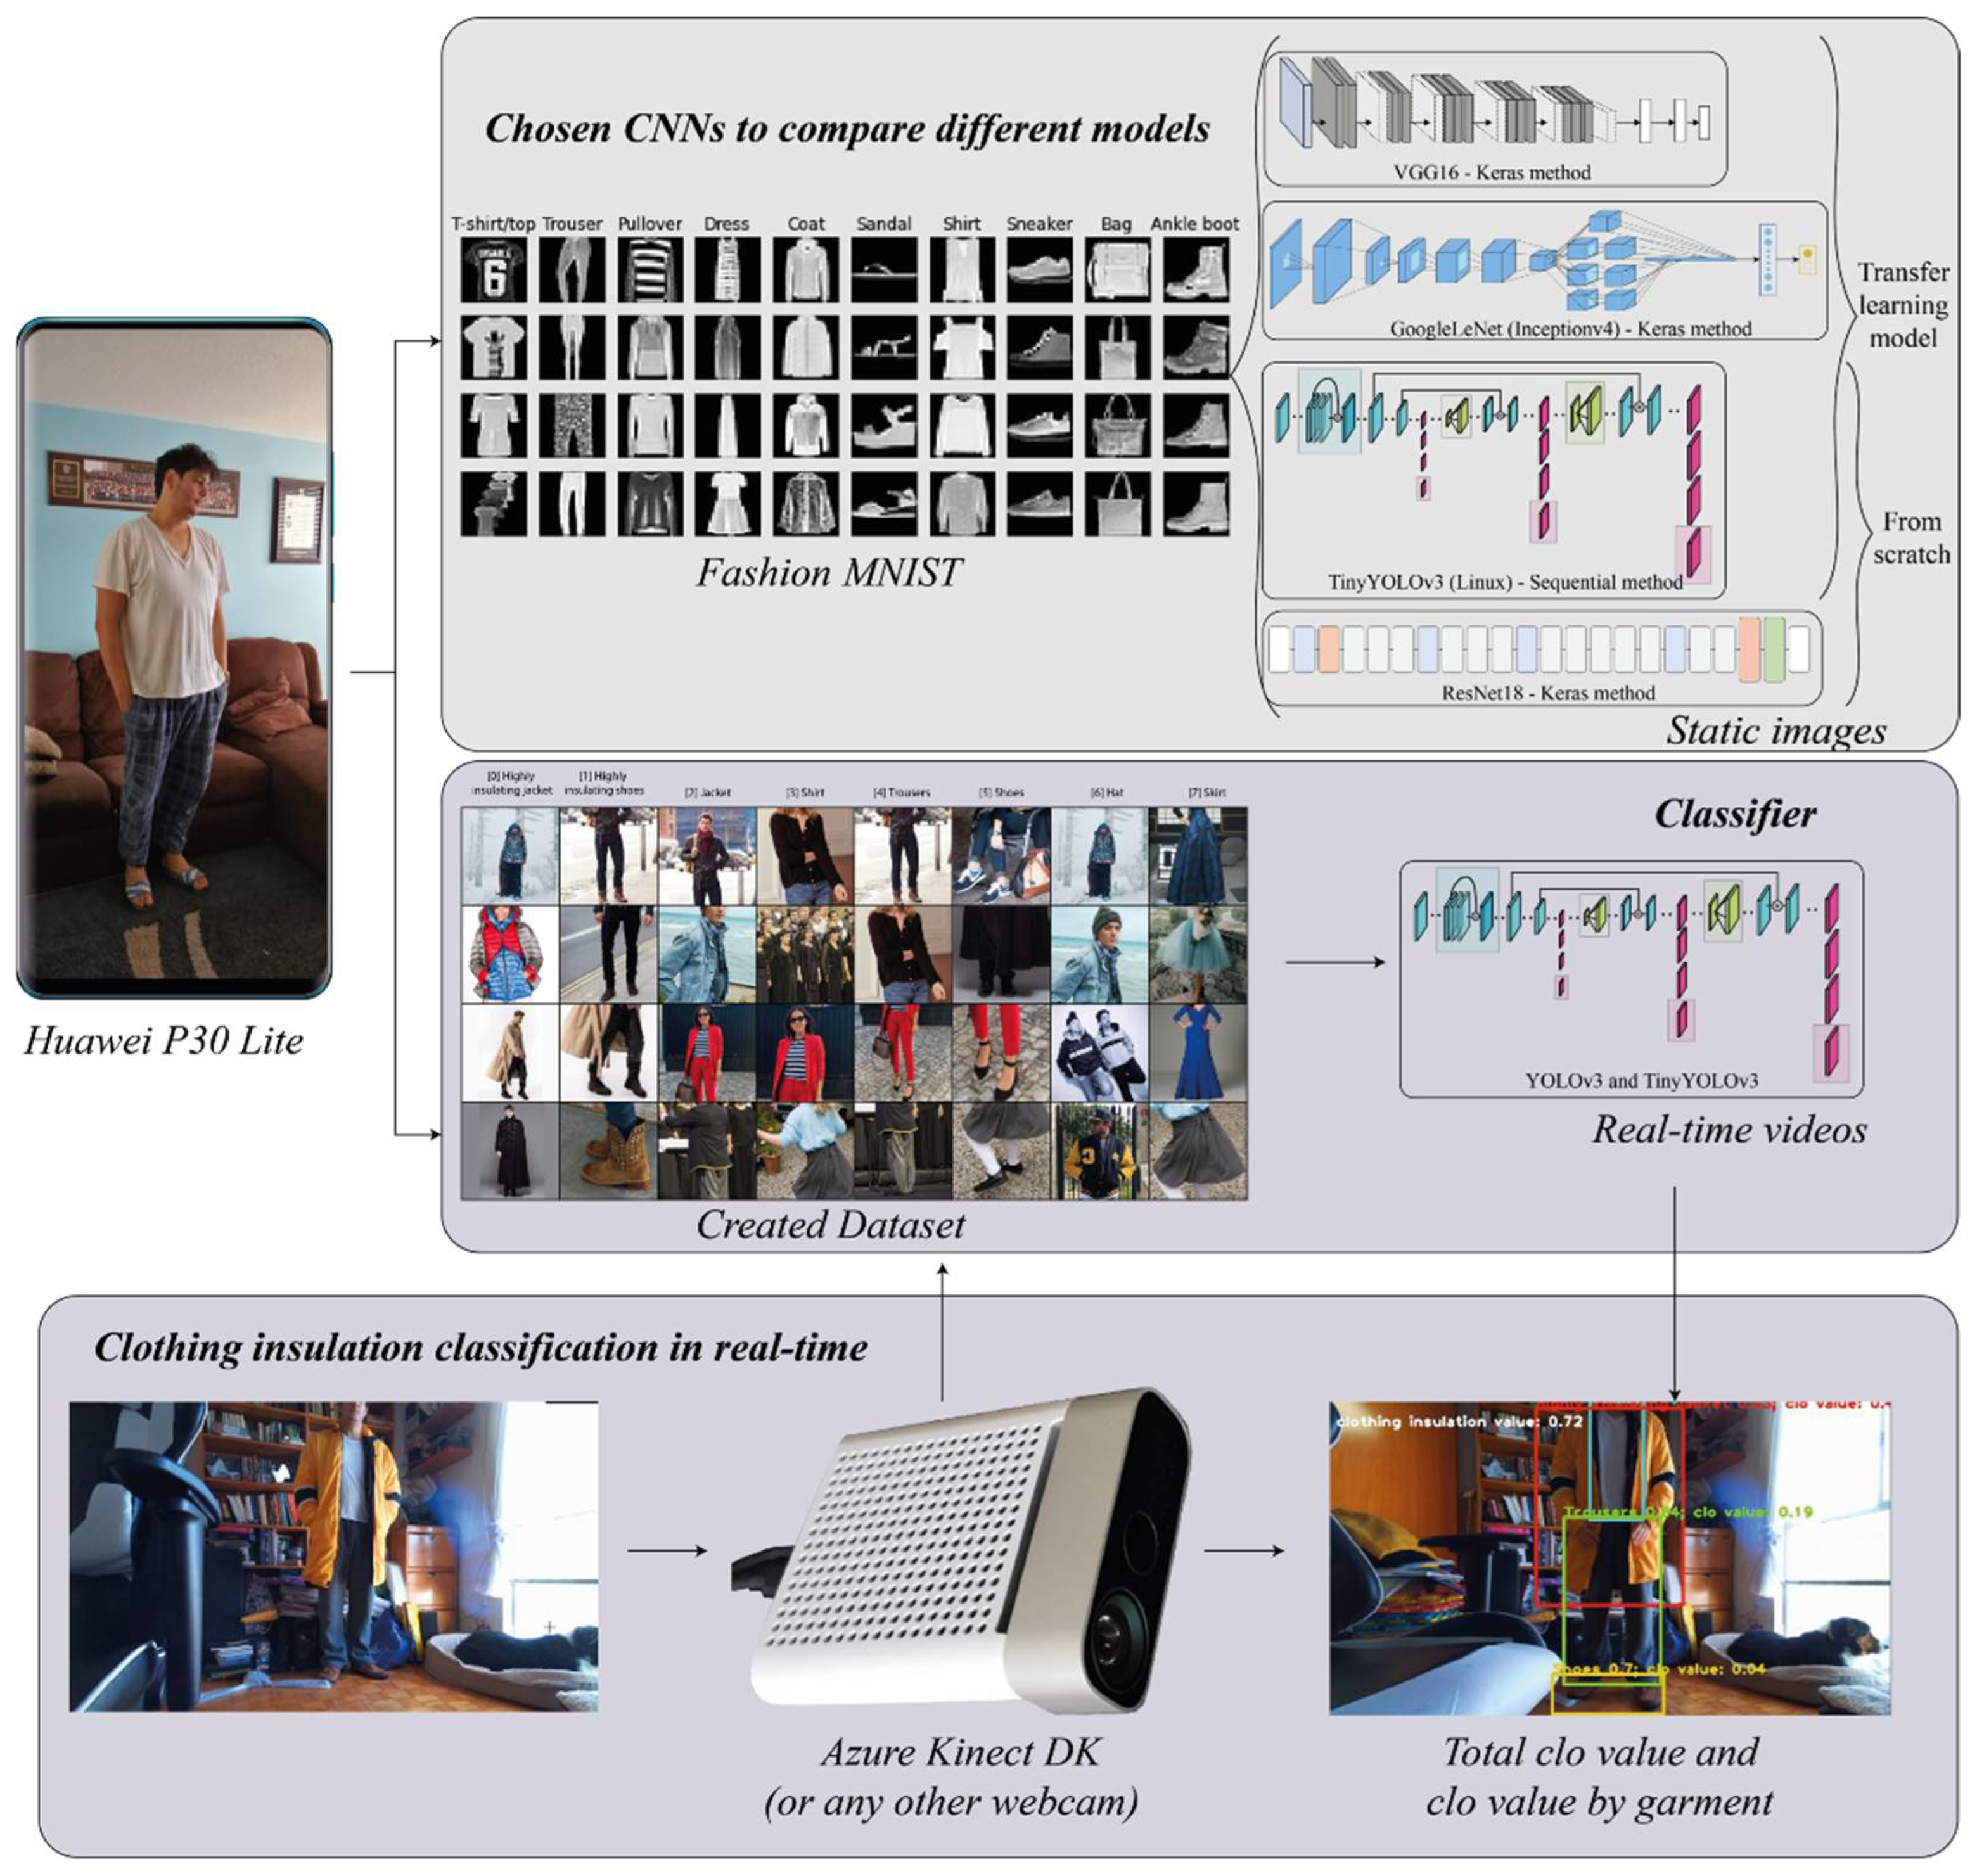
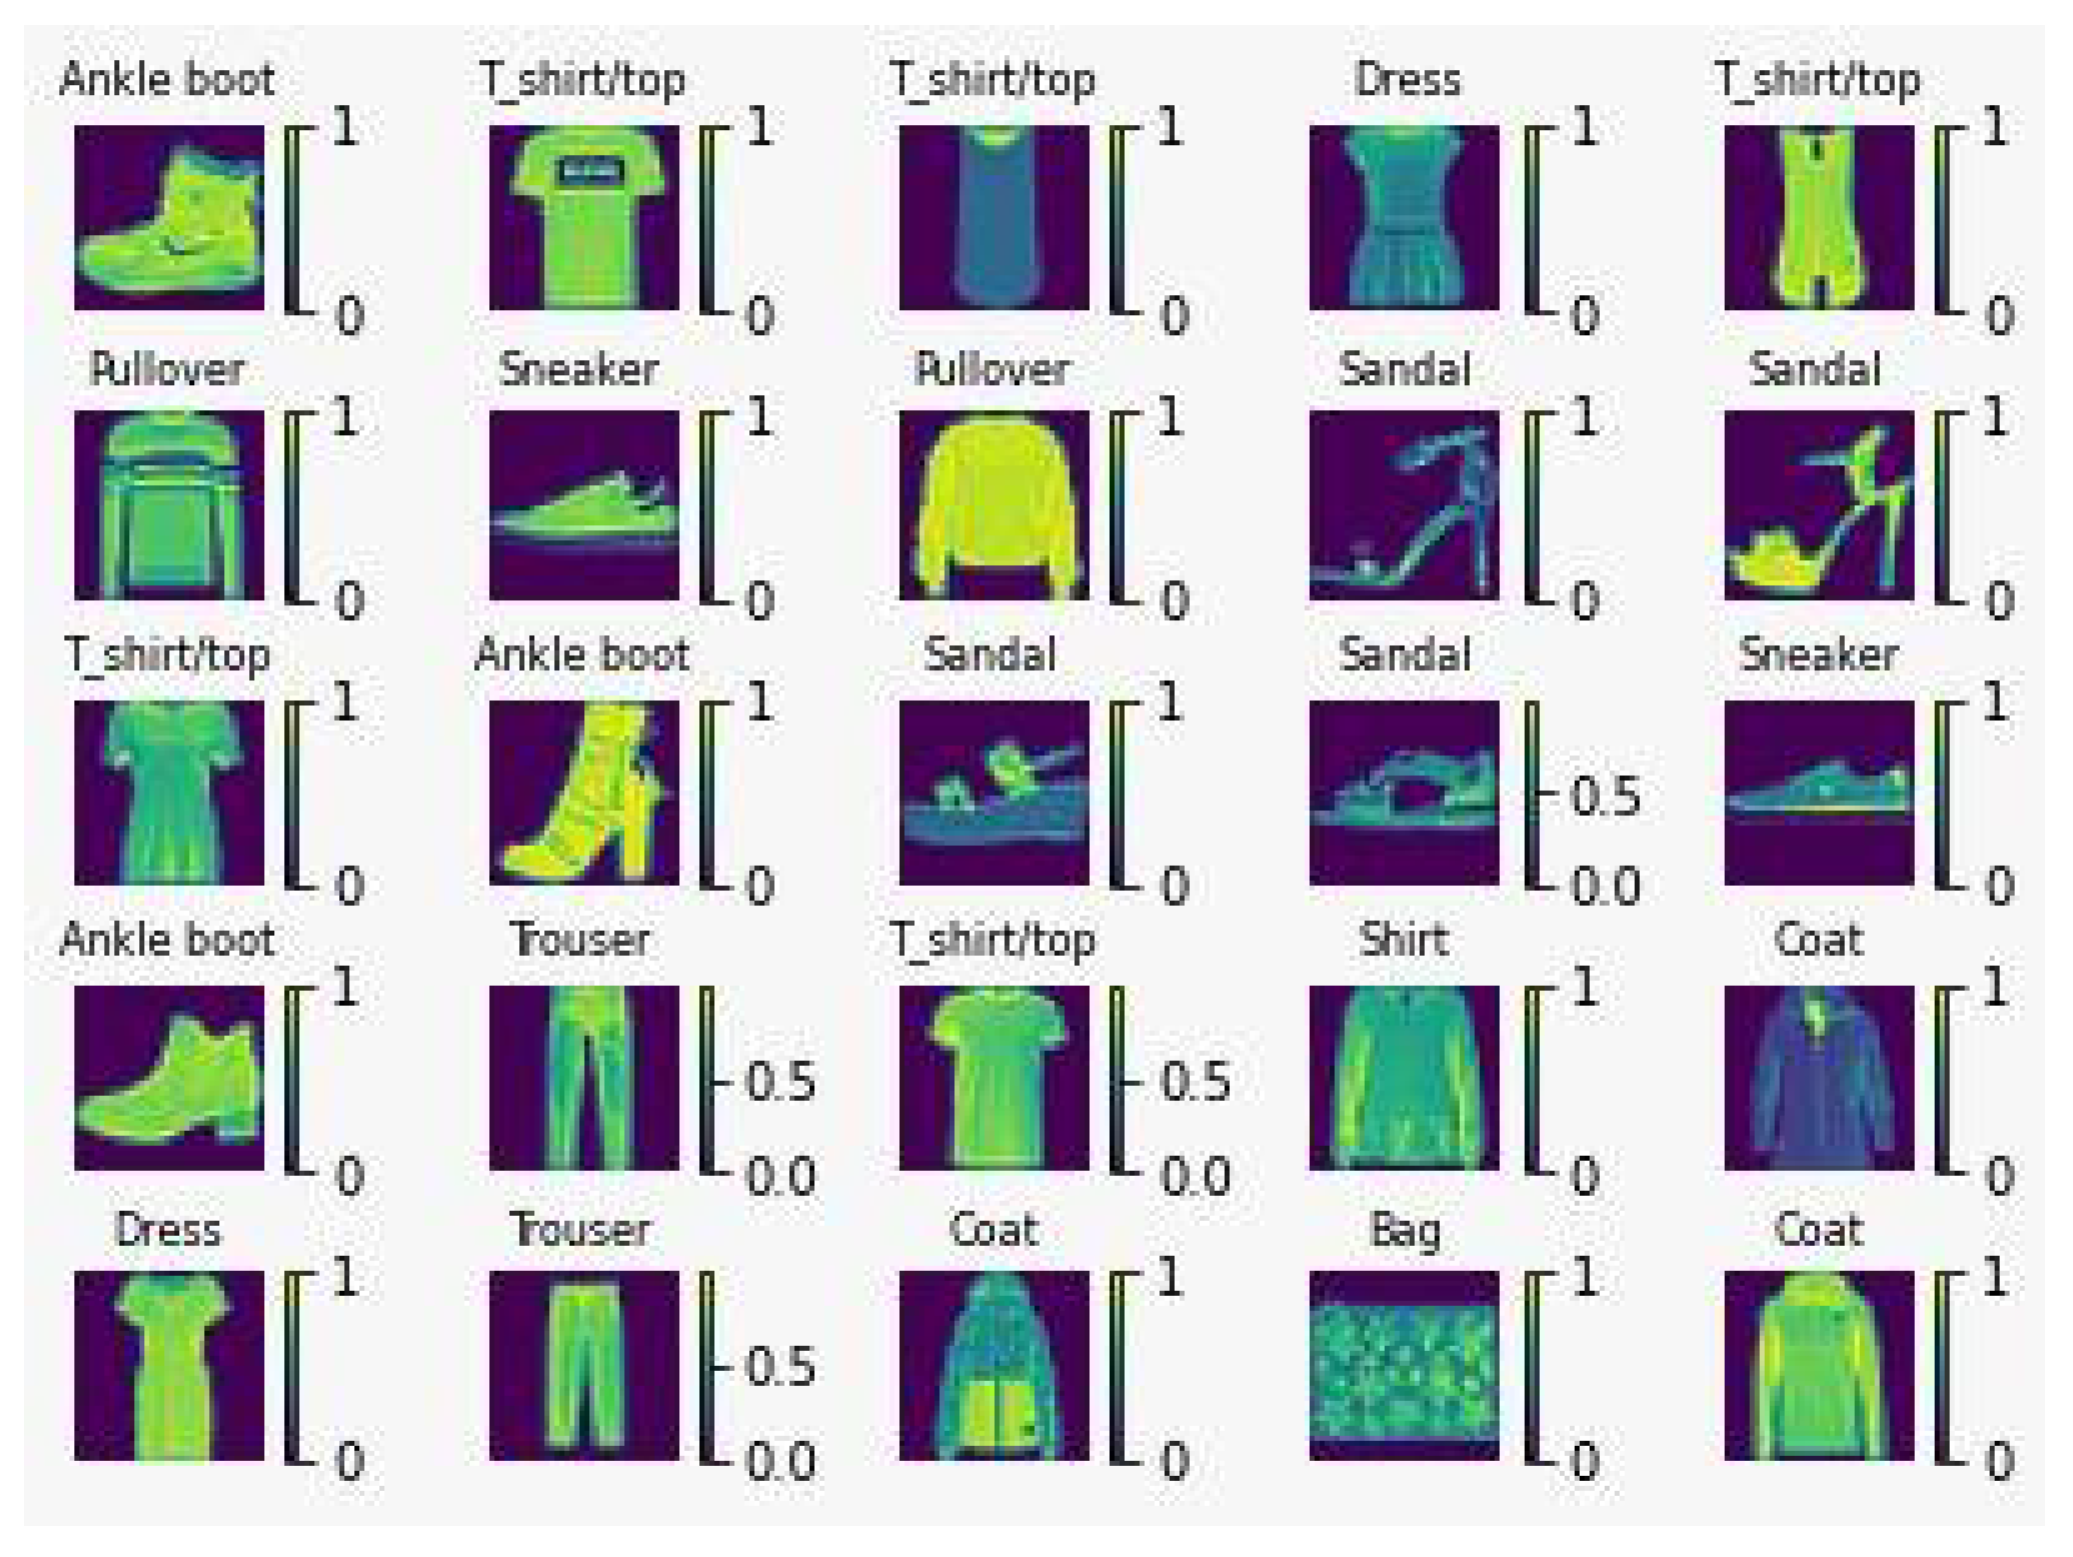
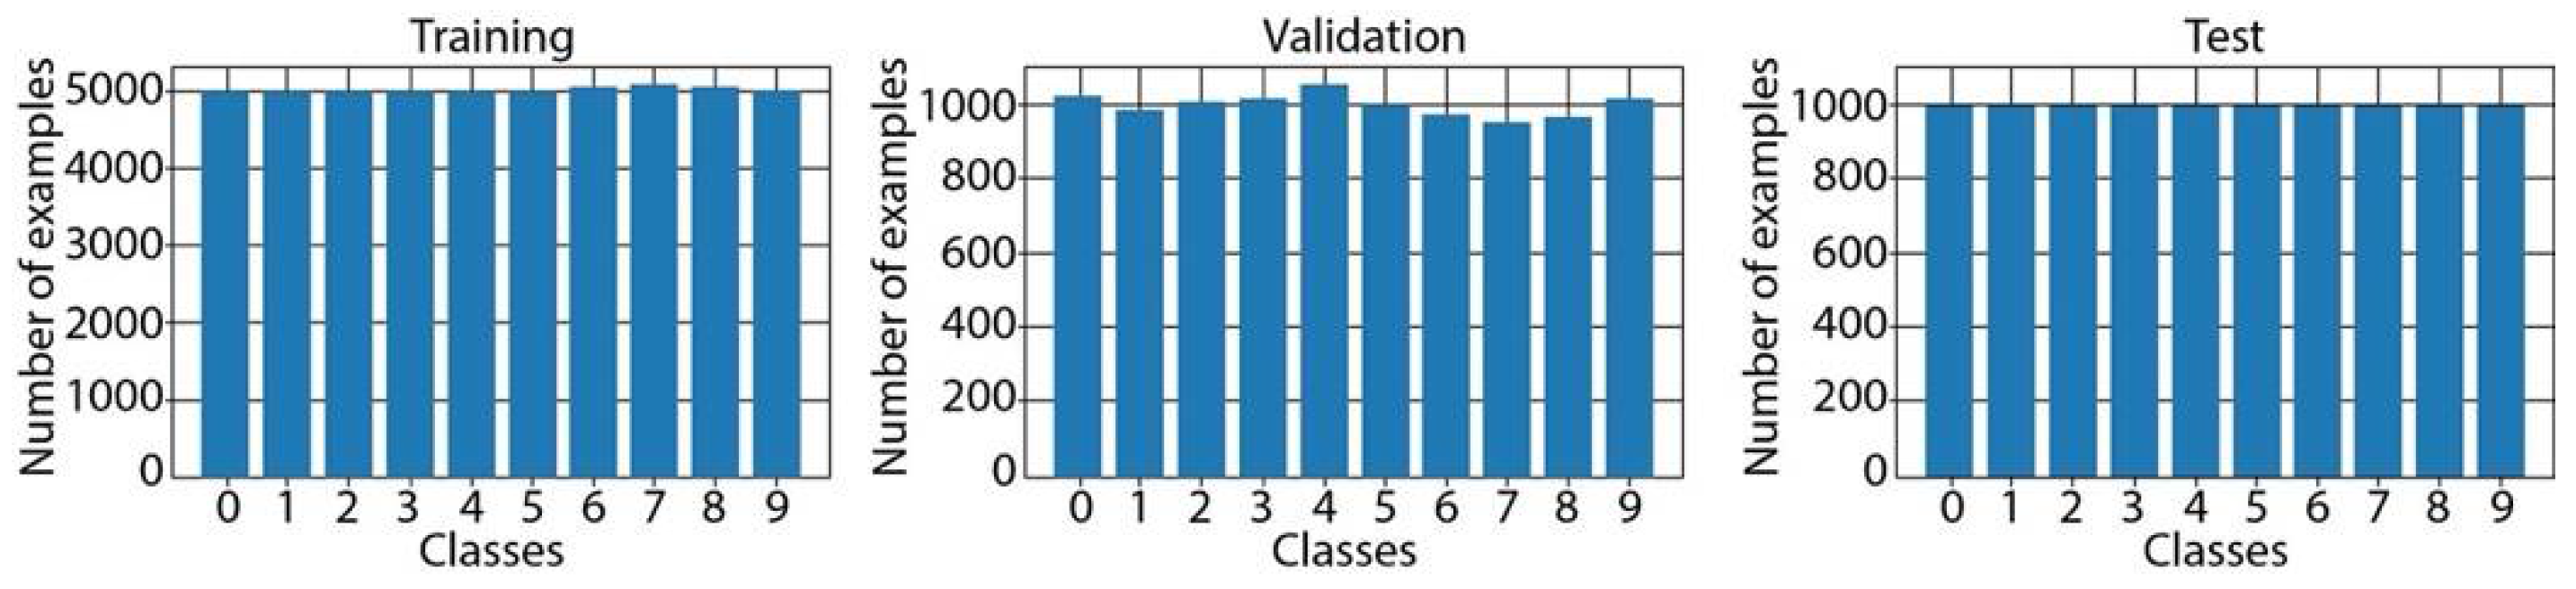
2.1. Datasets
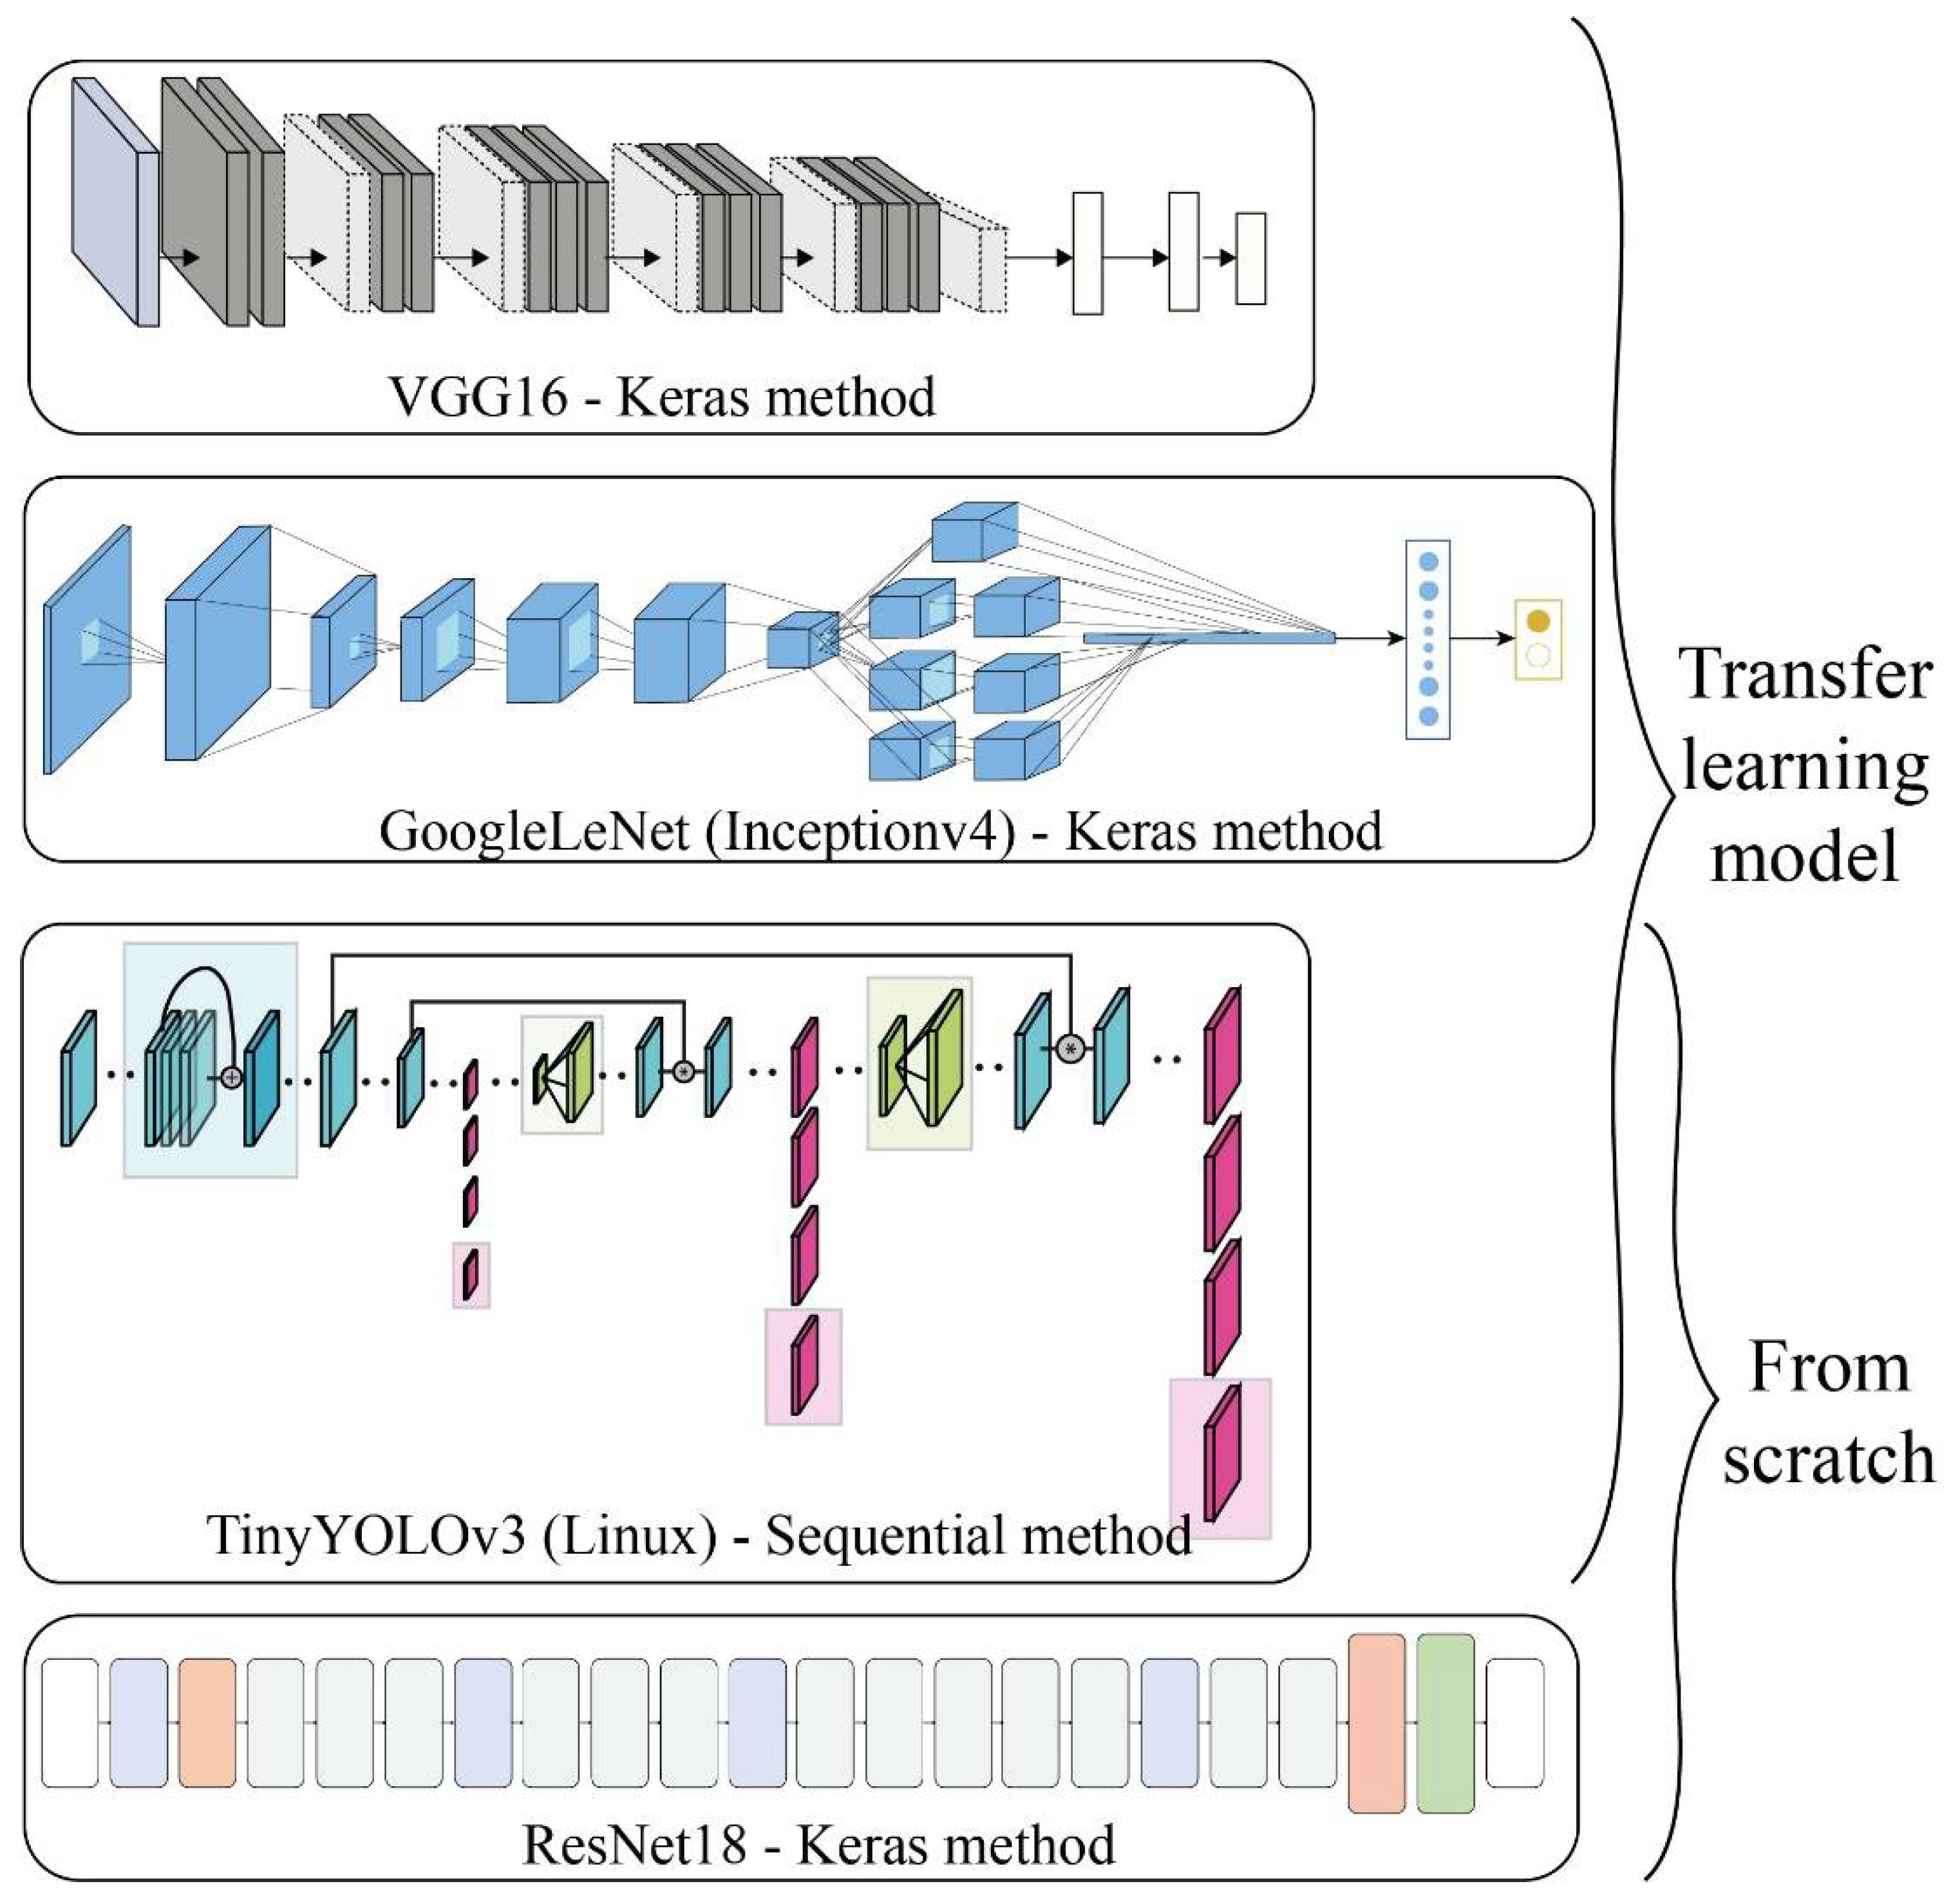
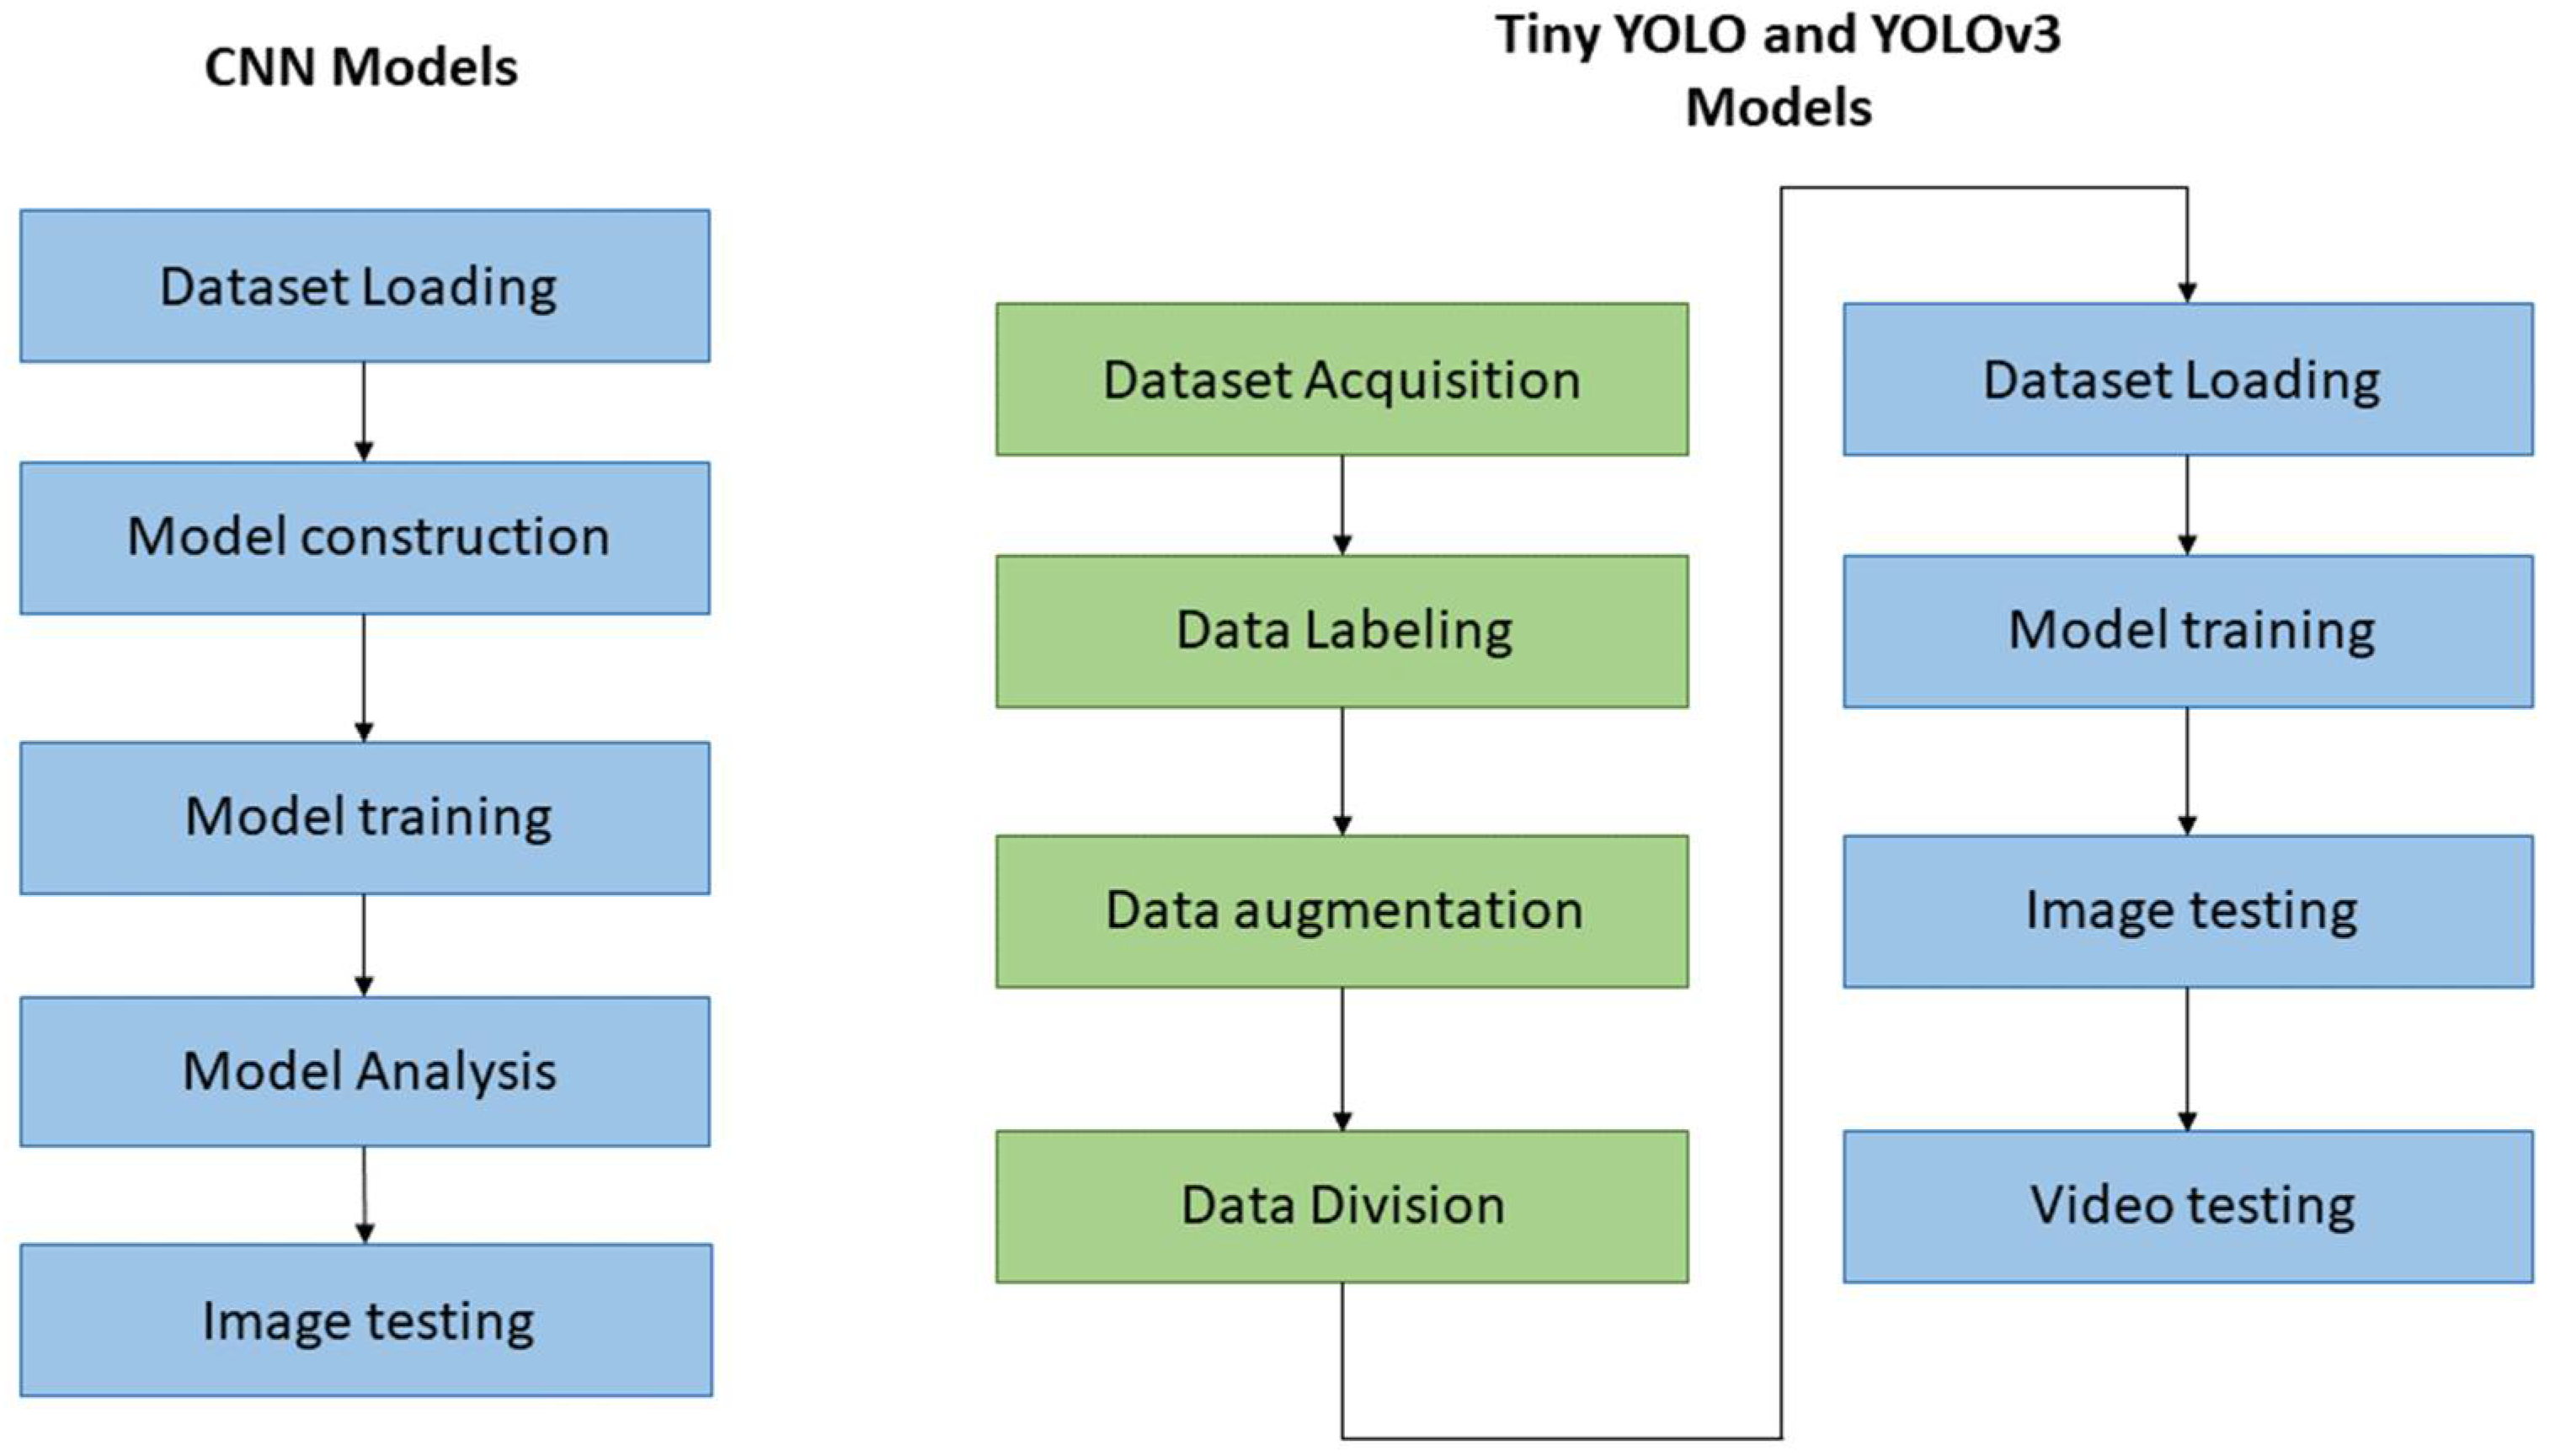
2.2. CNN Algorithms
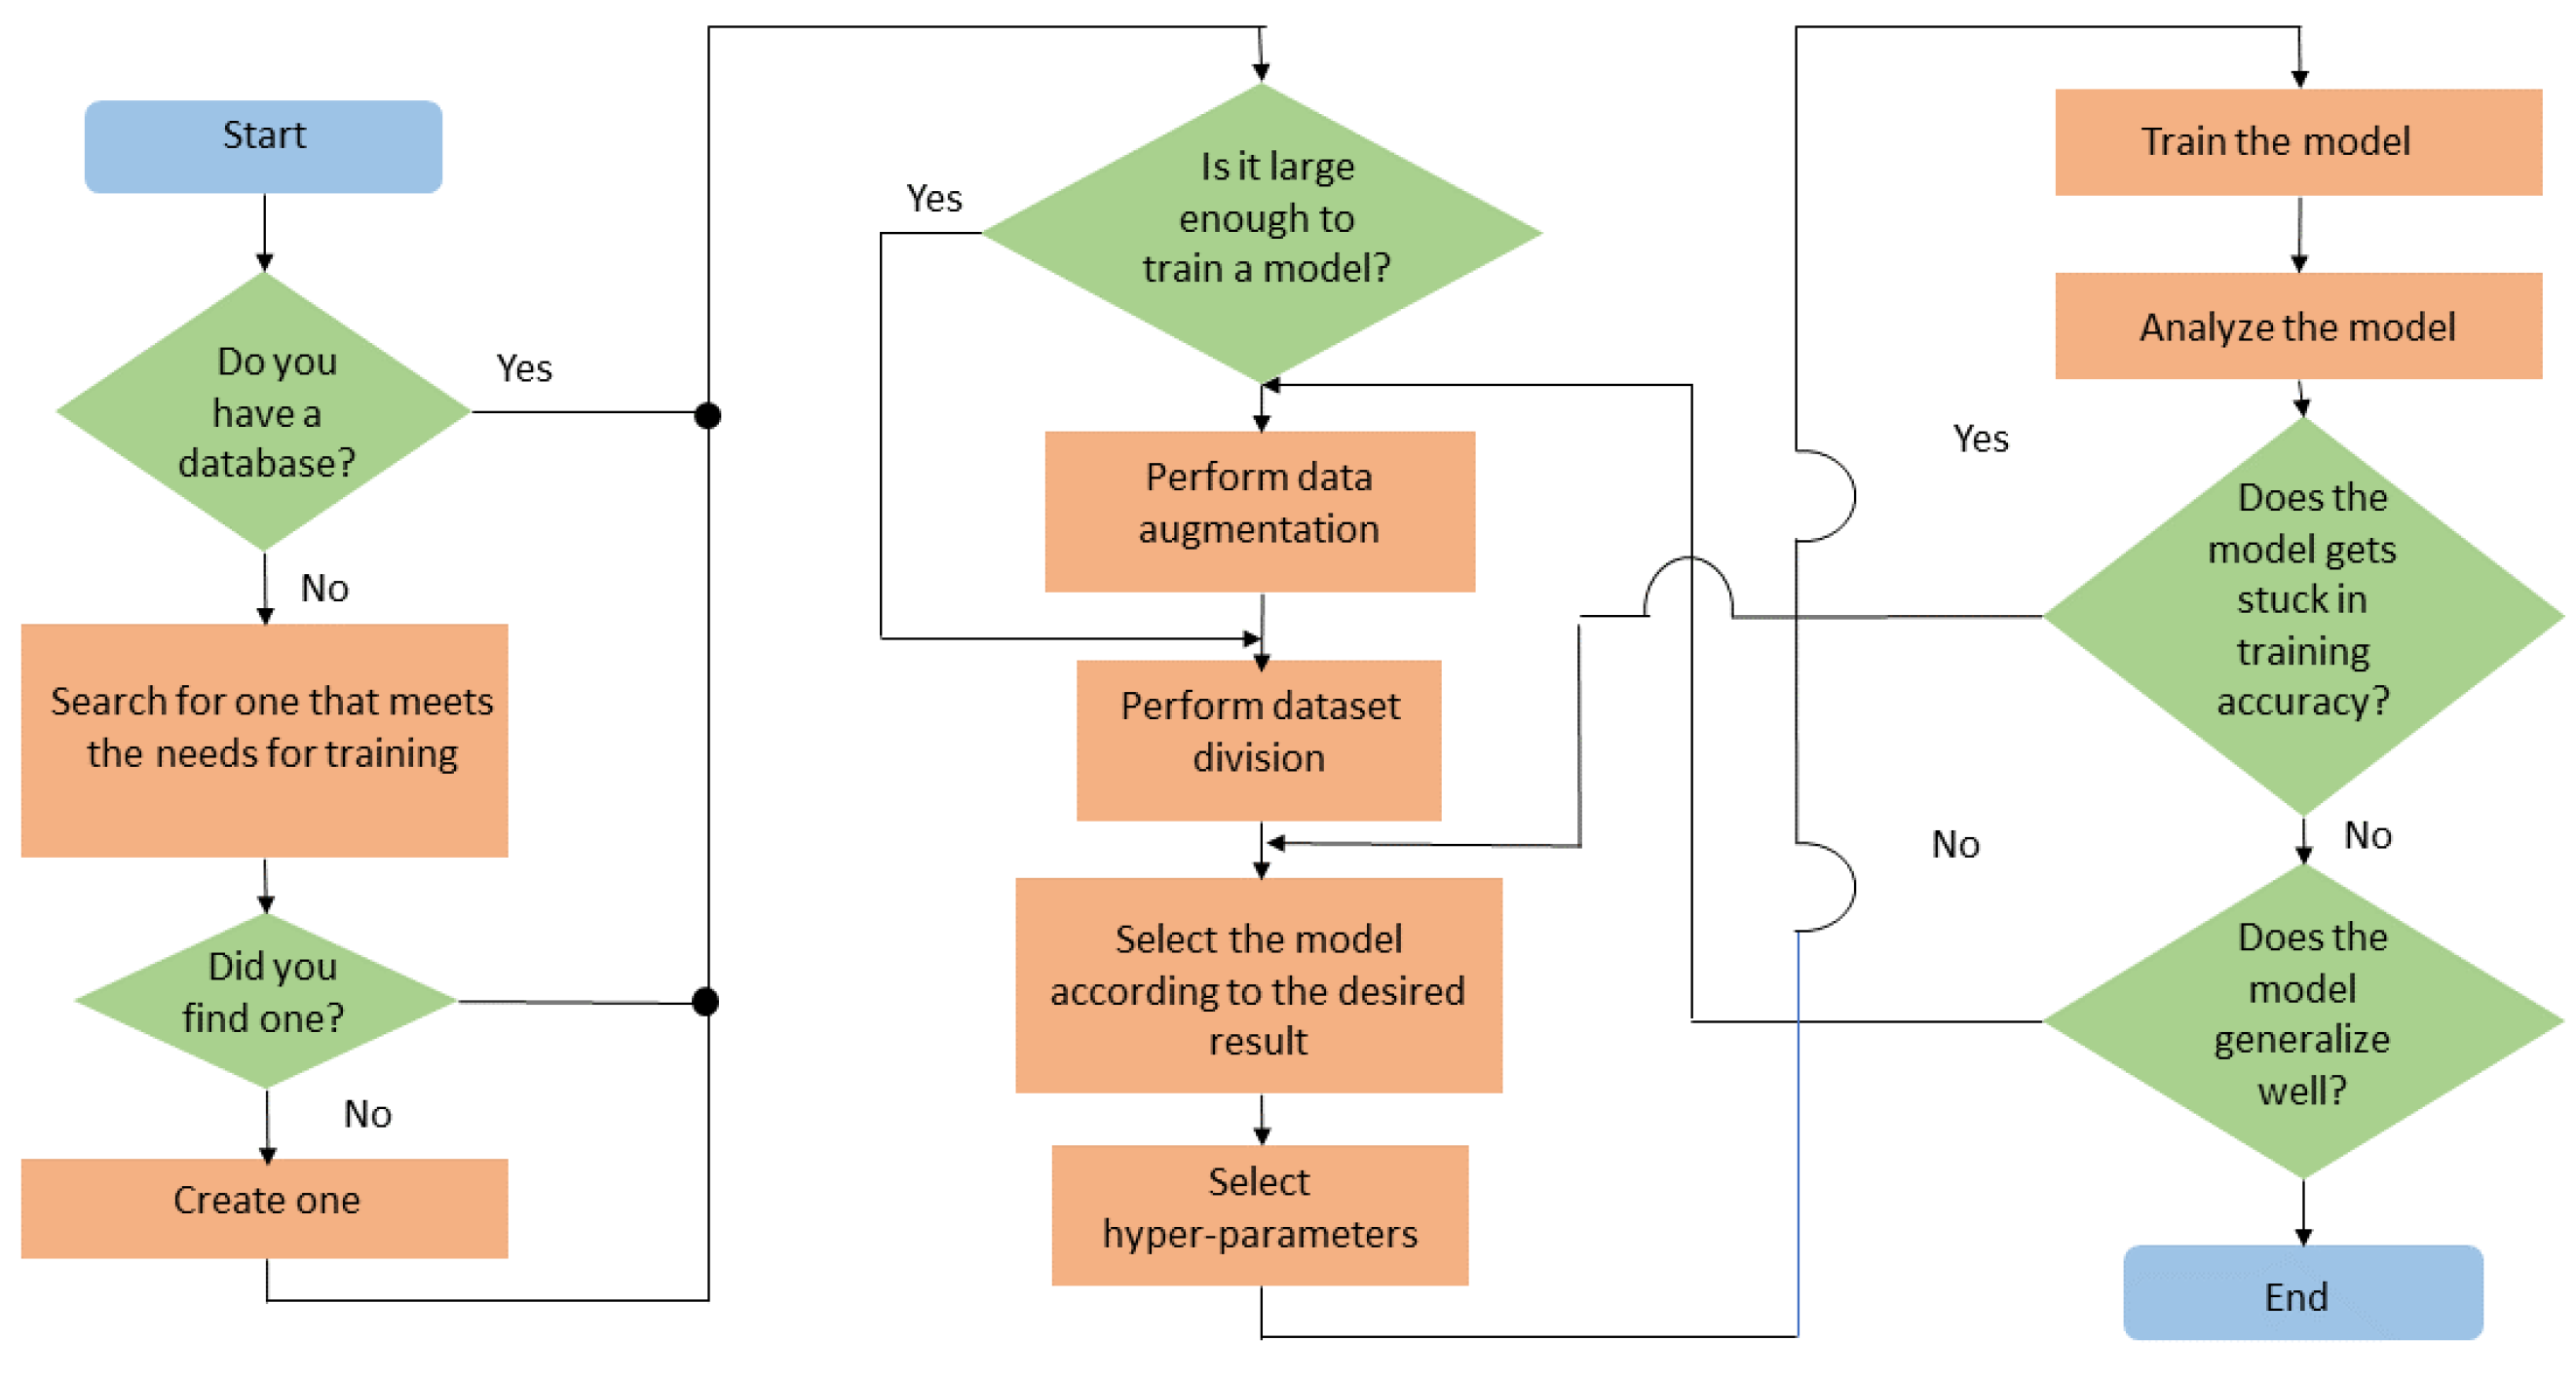
2.3. Training the Models
2.4. Comparing the Models
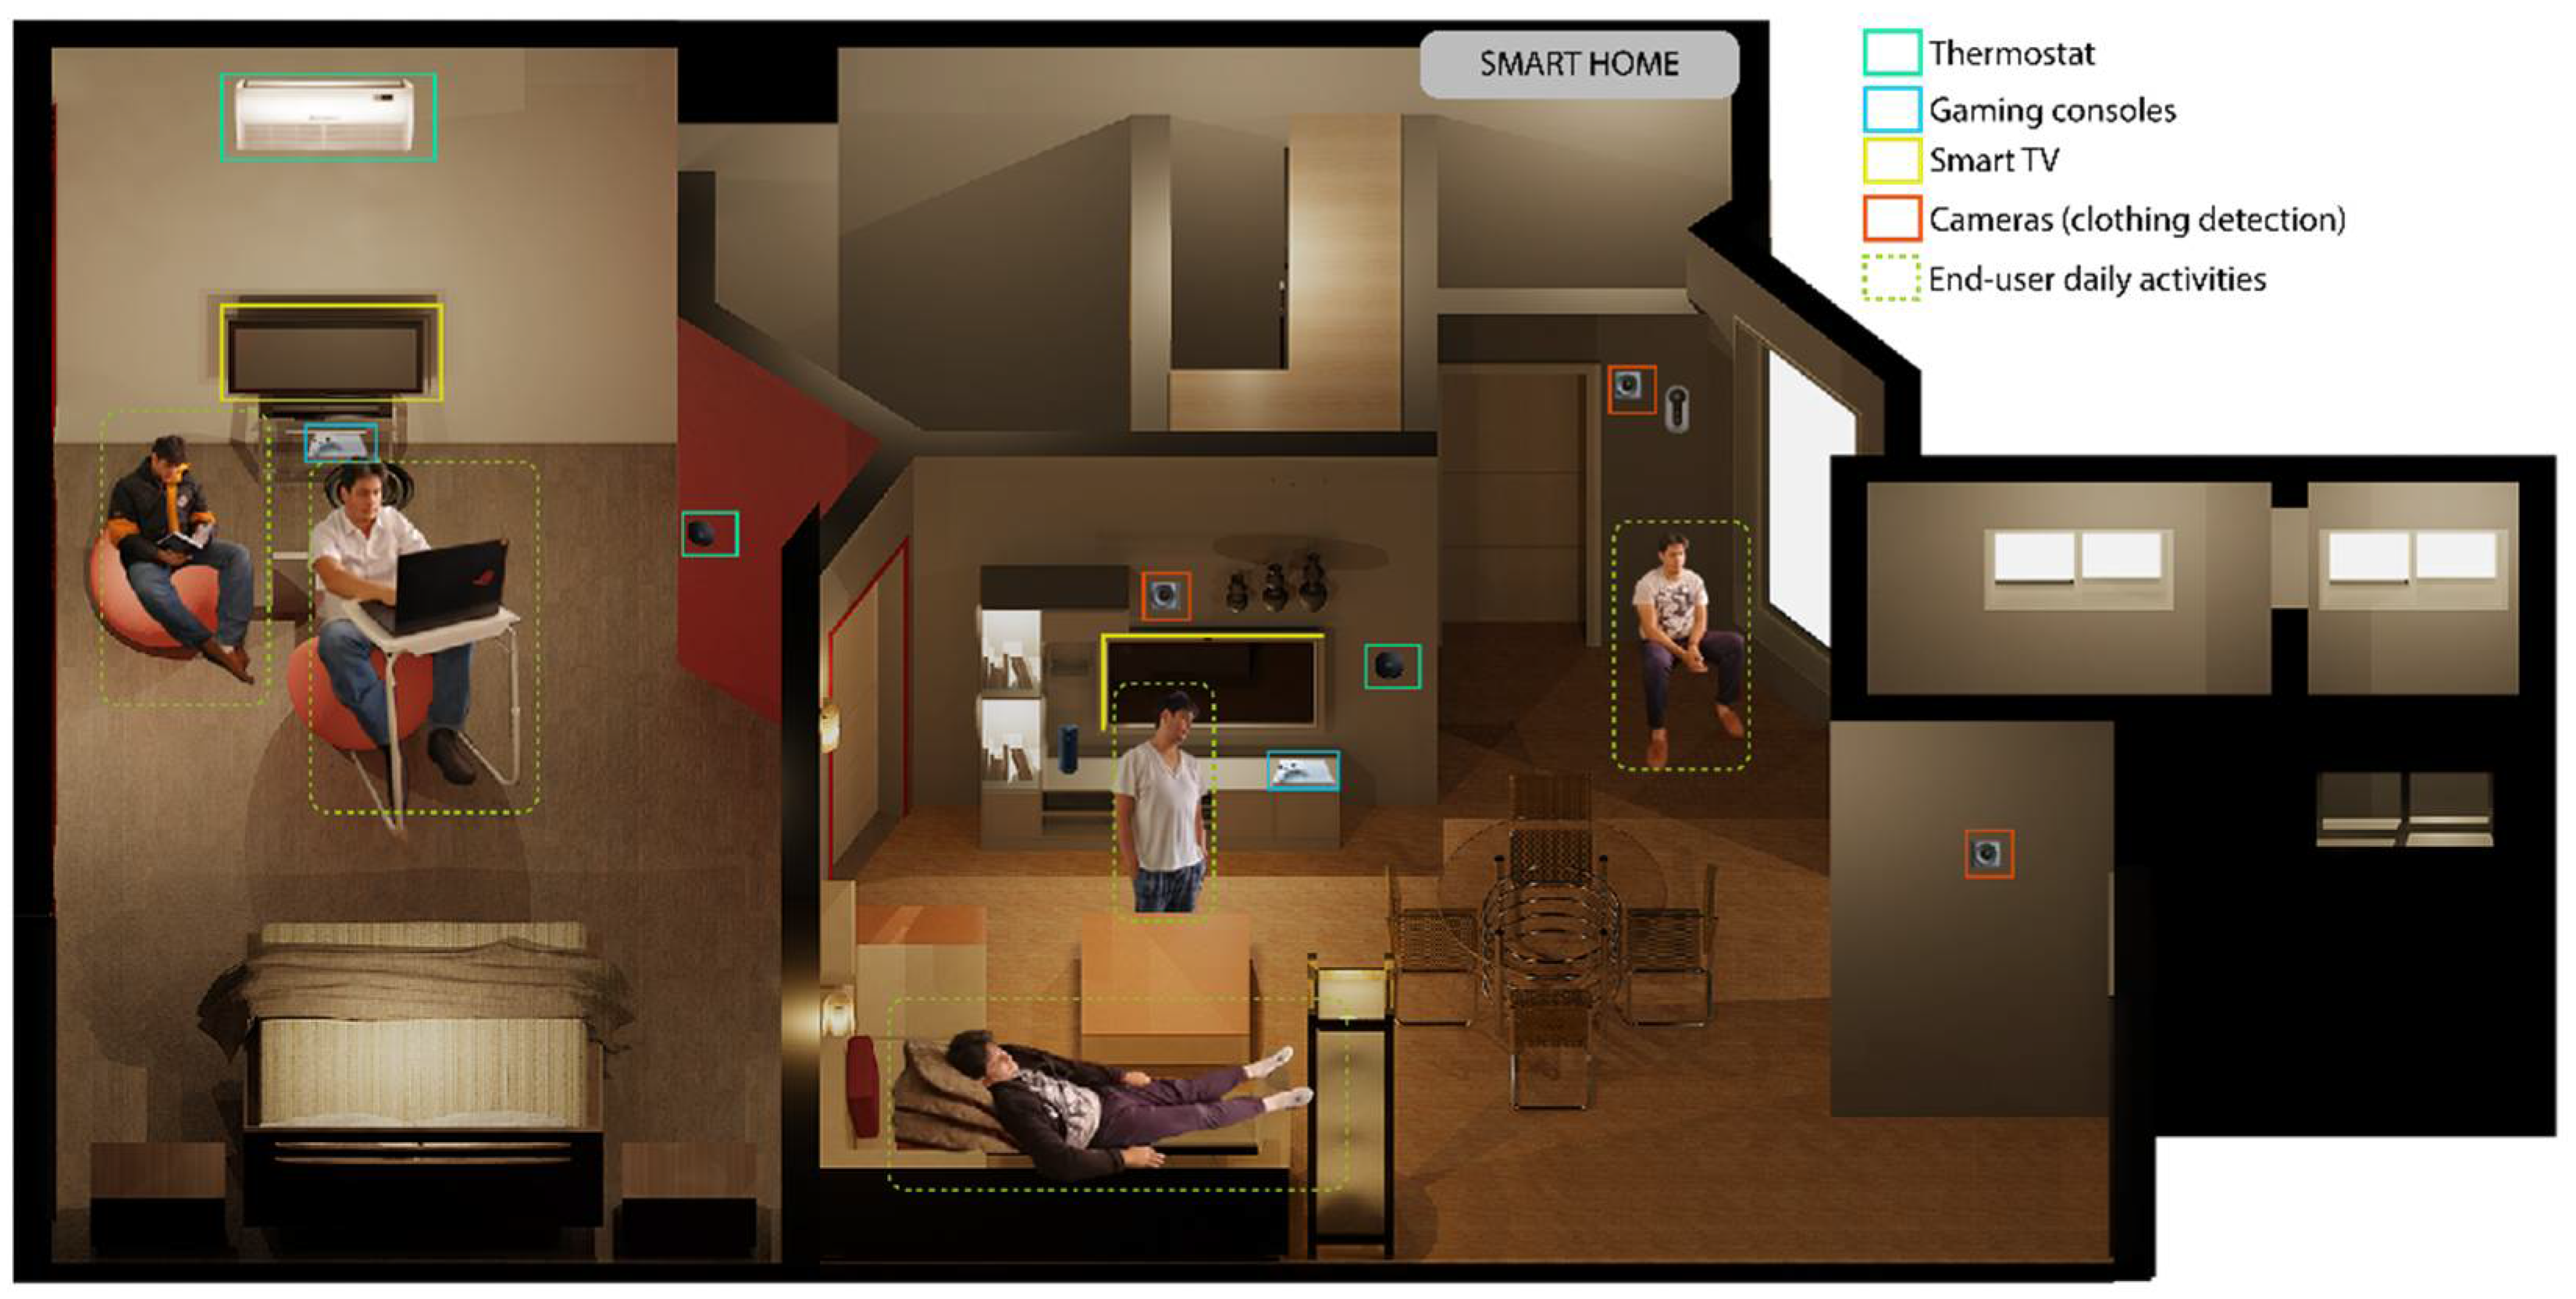
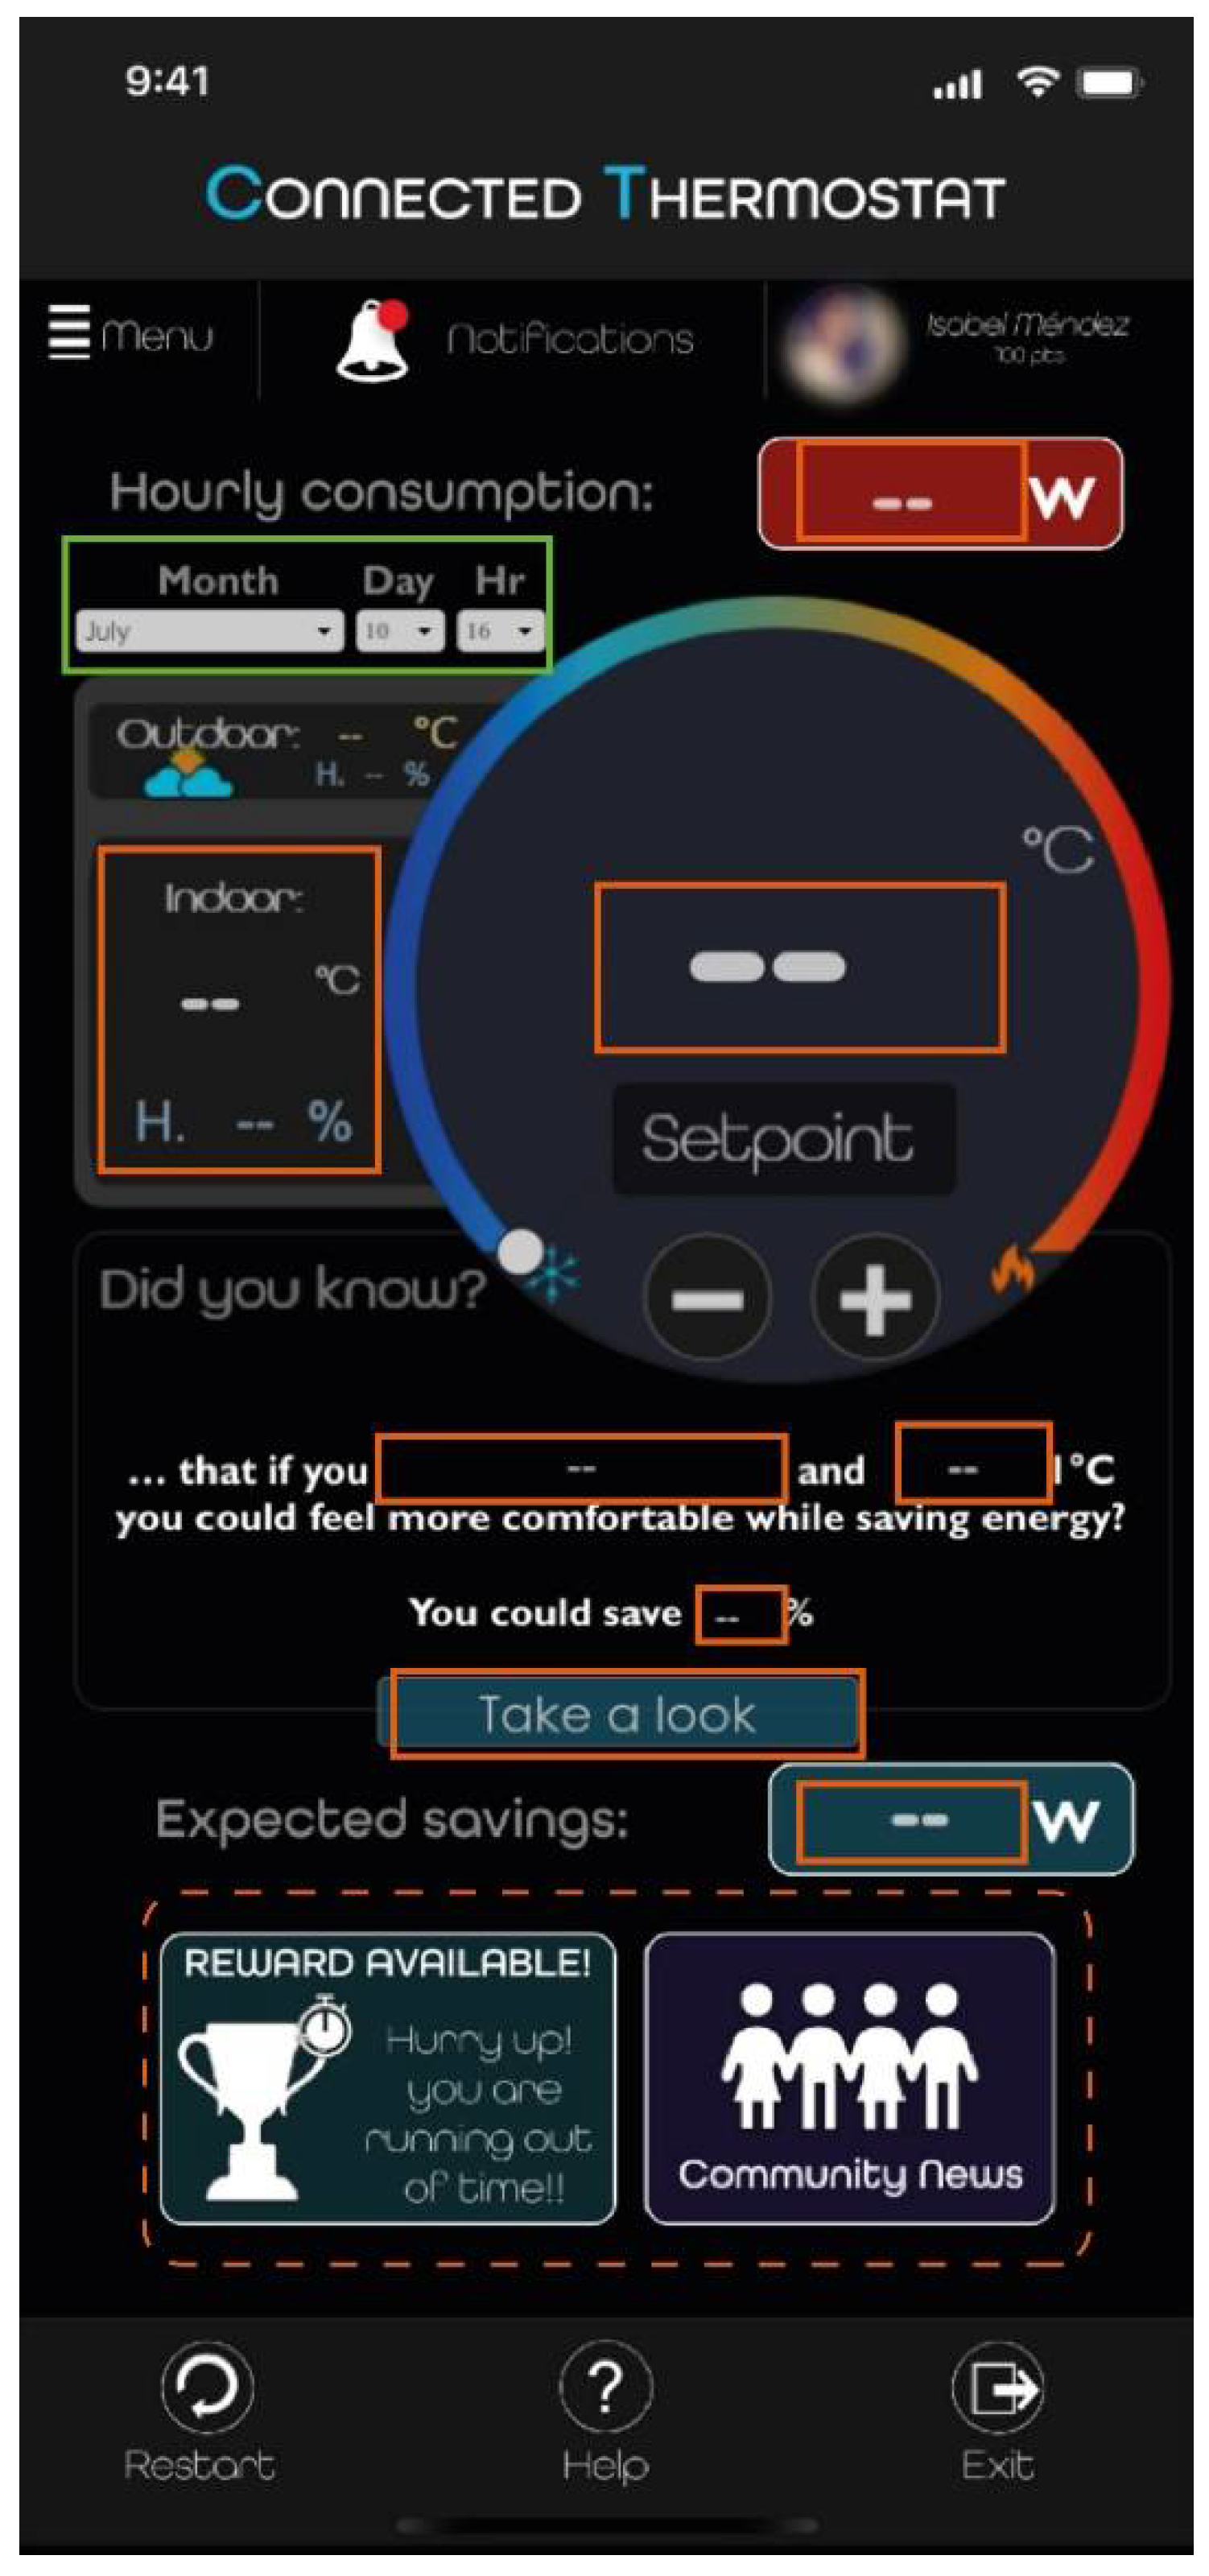
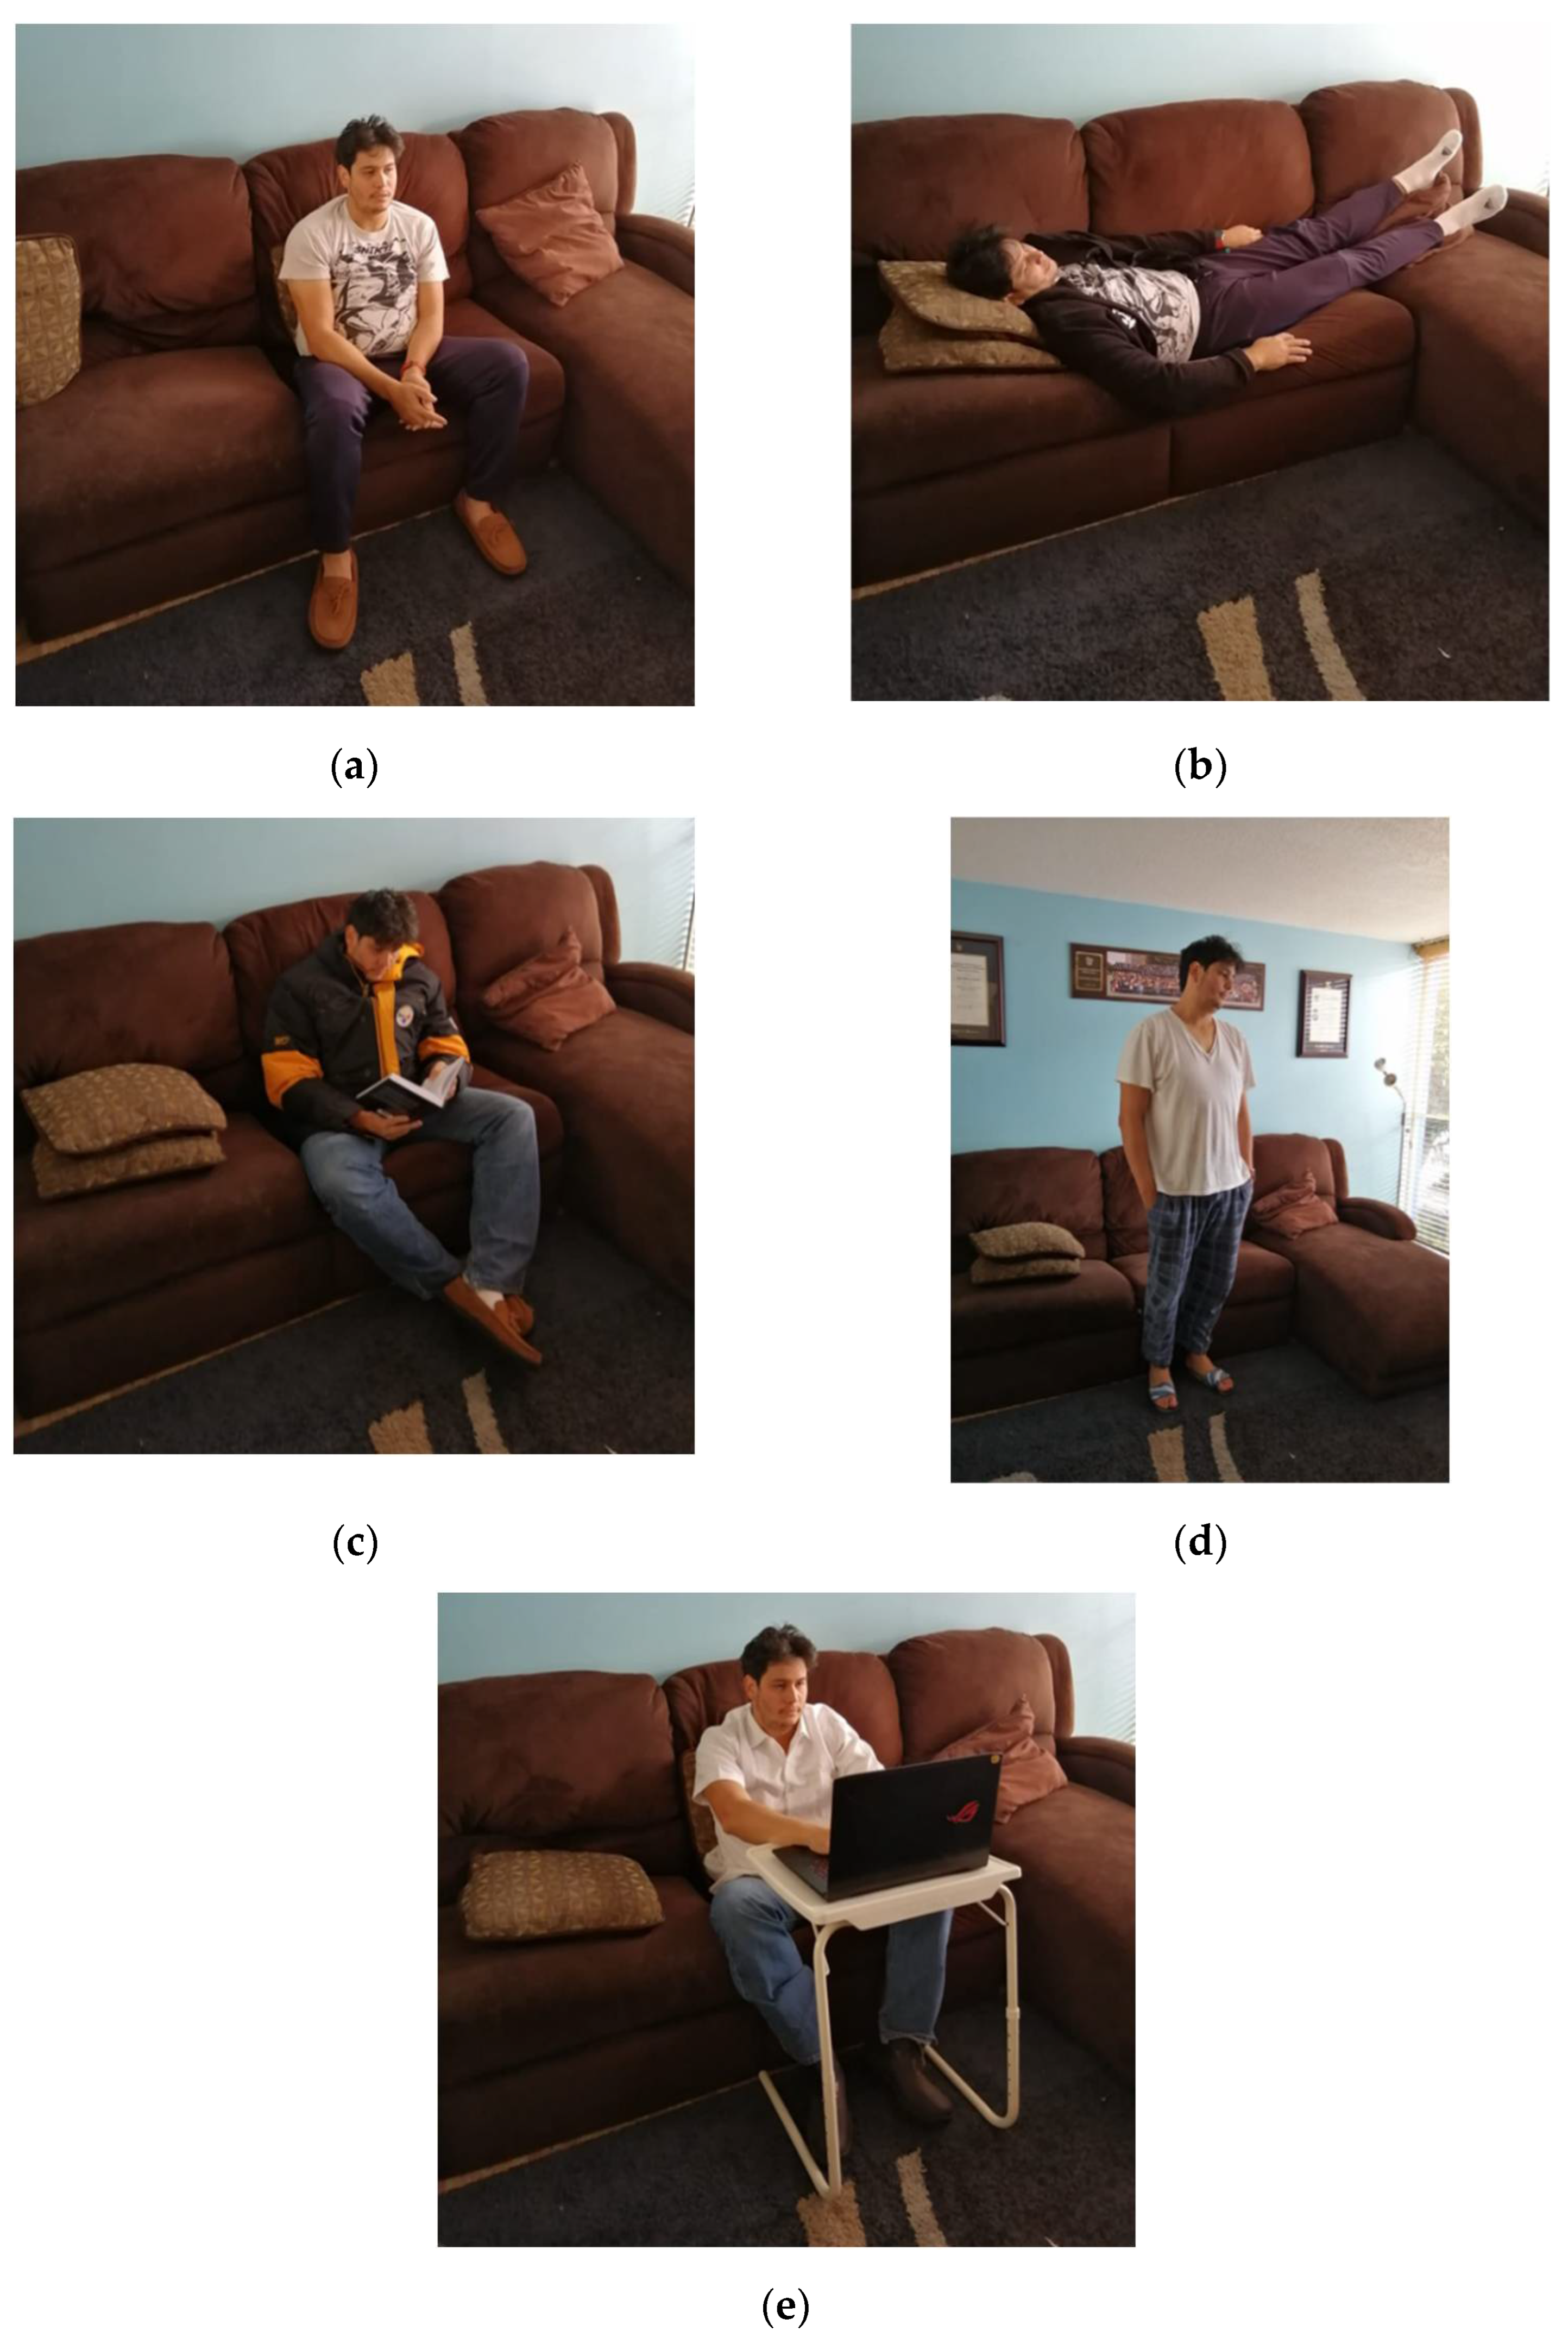
2.5. Study Case: Clothing Insulation Real-Time Analysis Applied on Thermostats
- Wear lightweight clothes;
- Wear the same clothes;
- Wear warmer clothes.
3. Results
3.1. Datasets Treatments
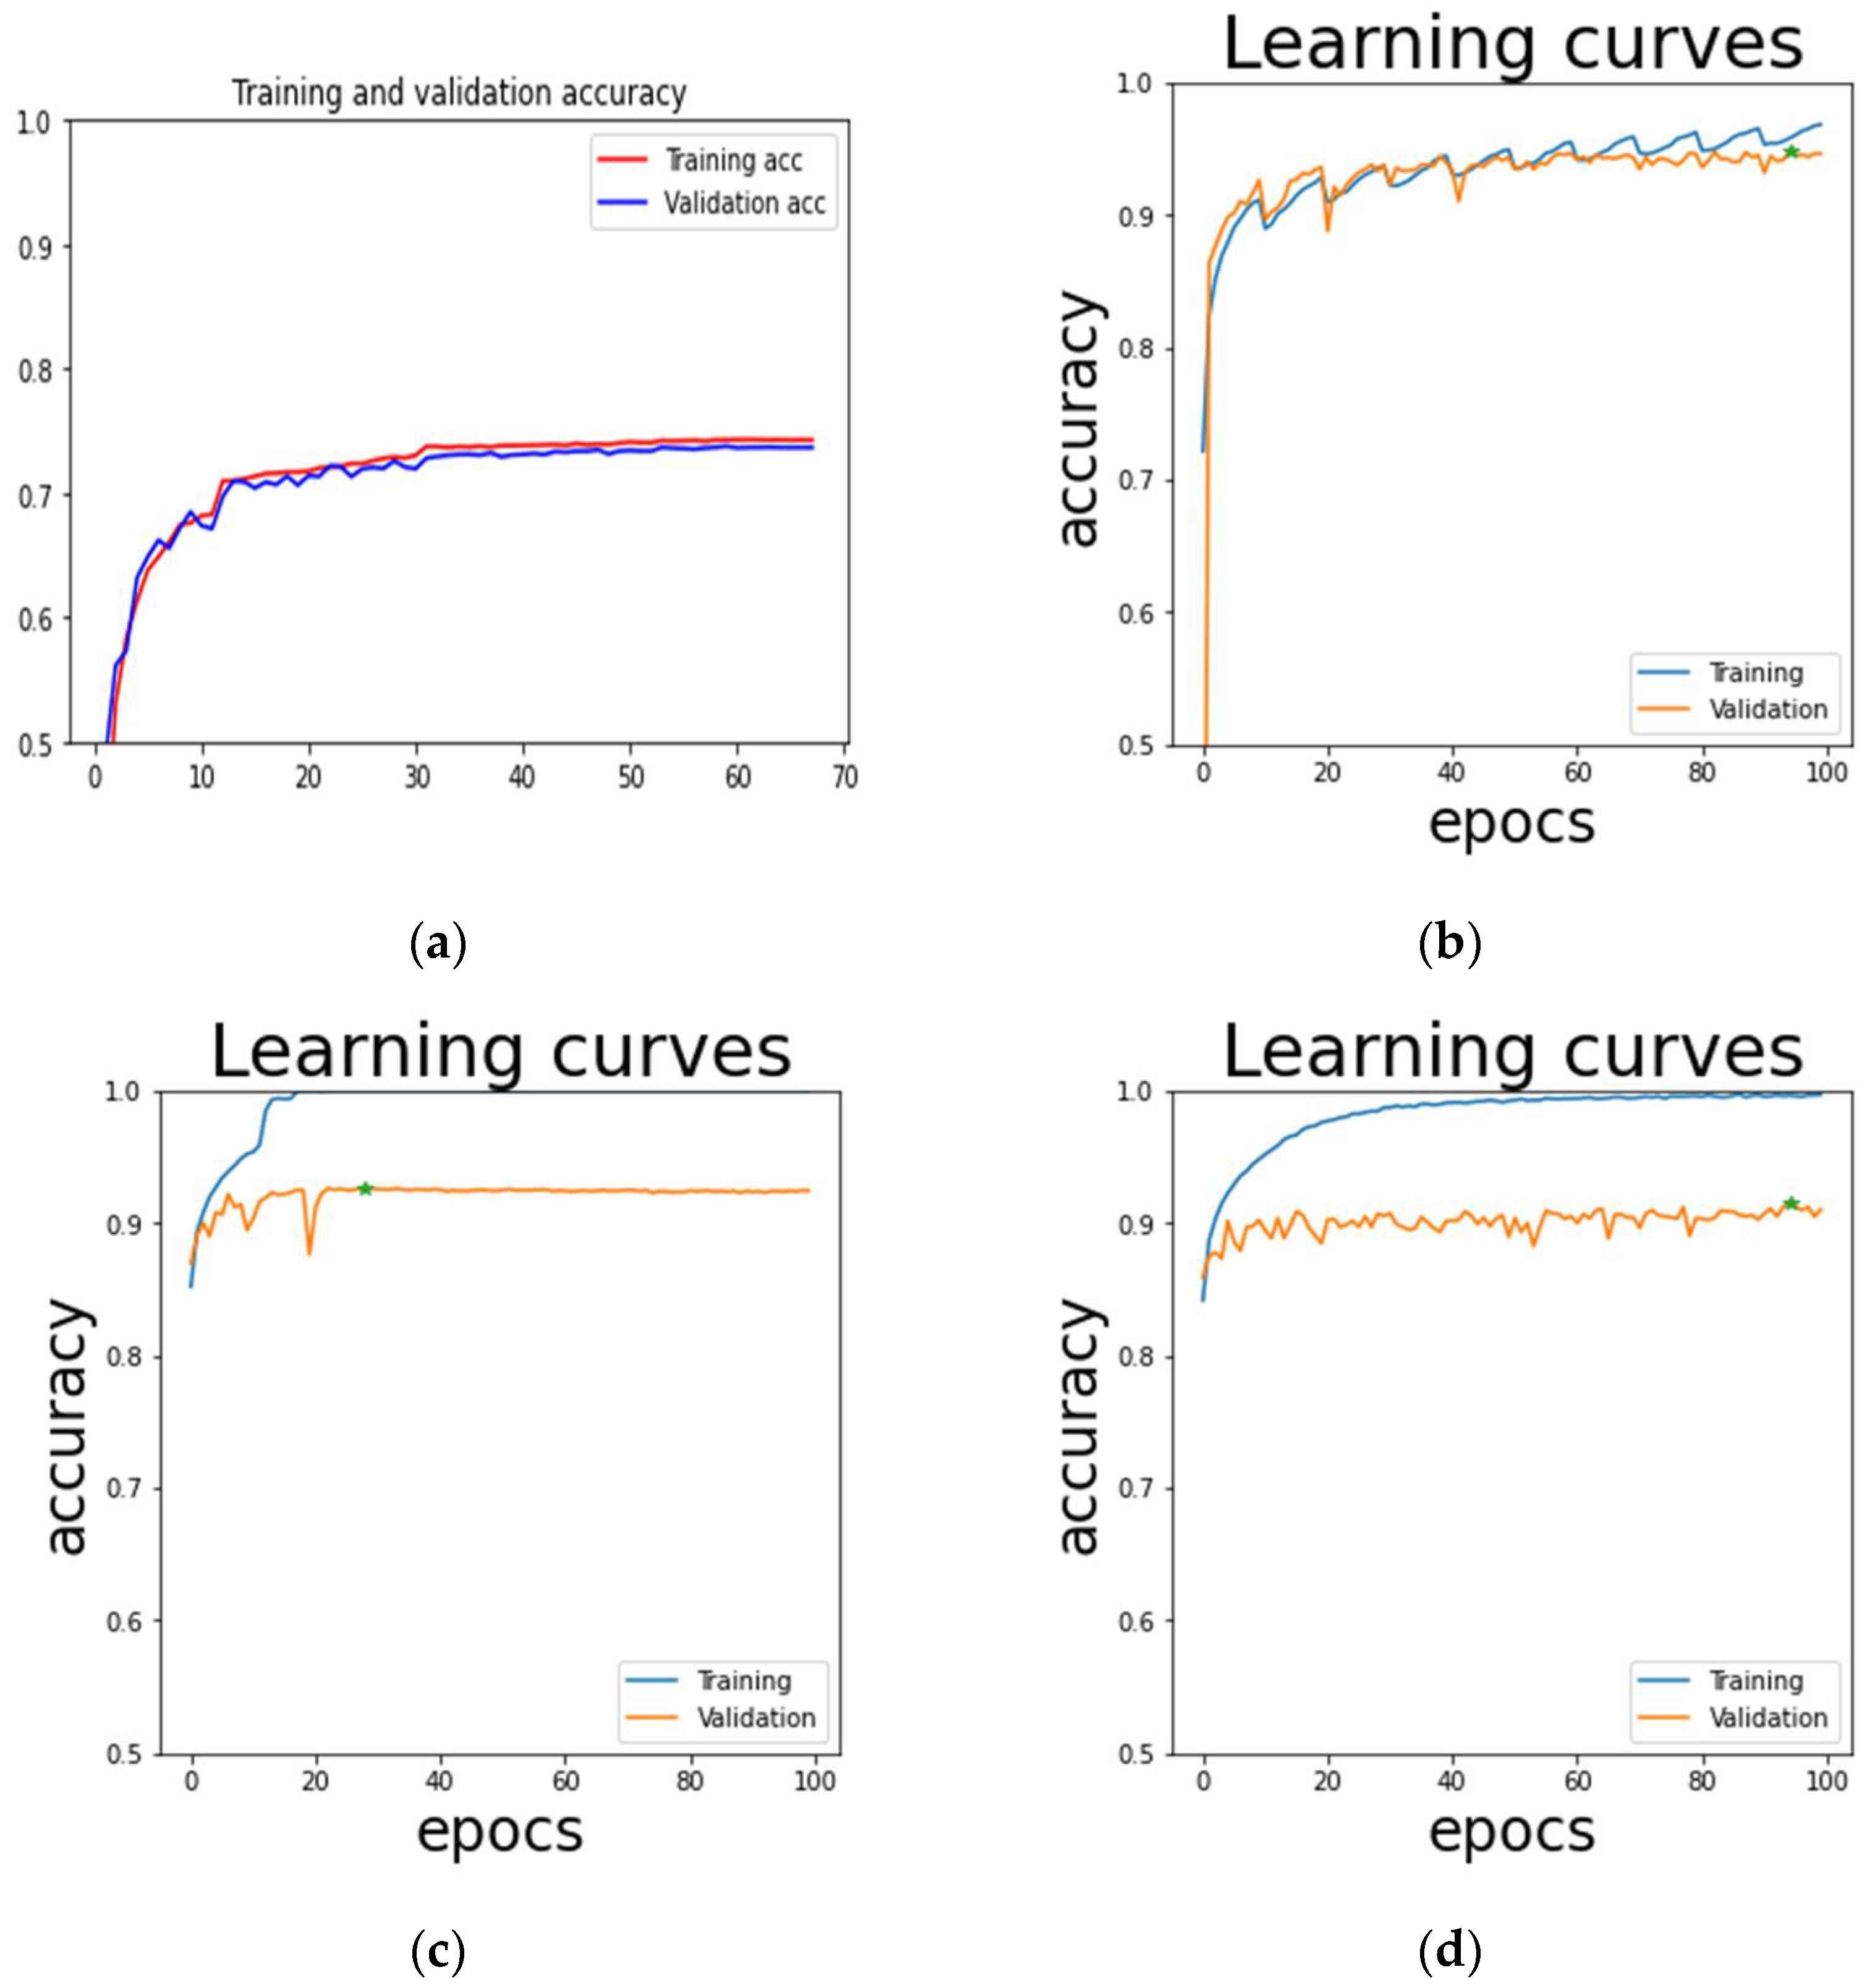
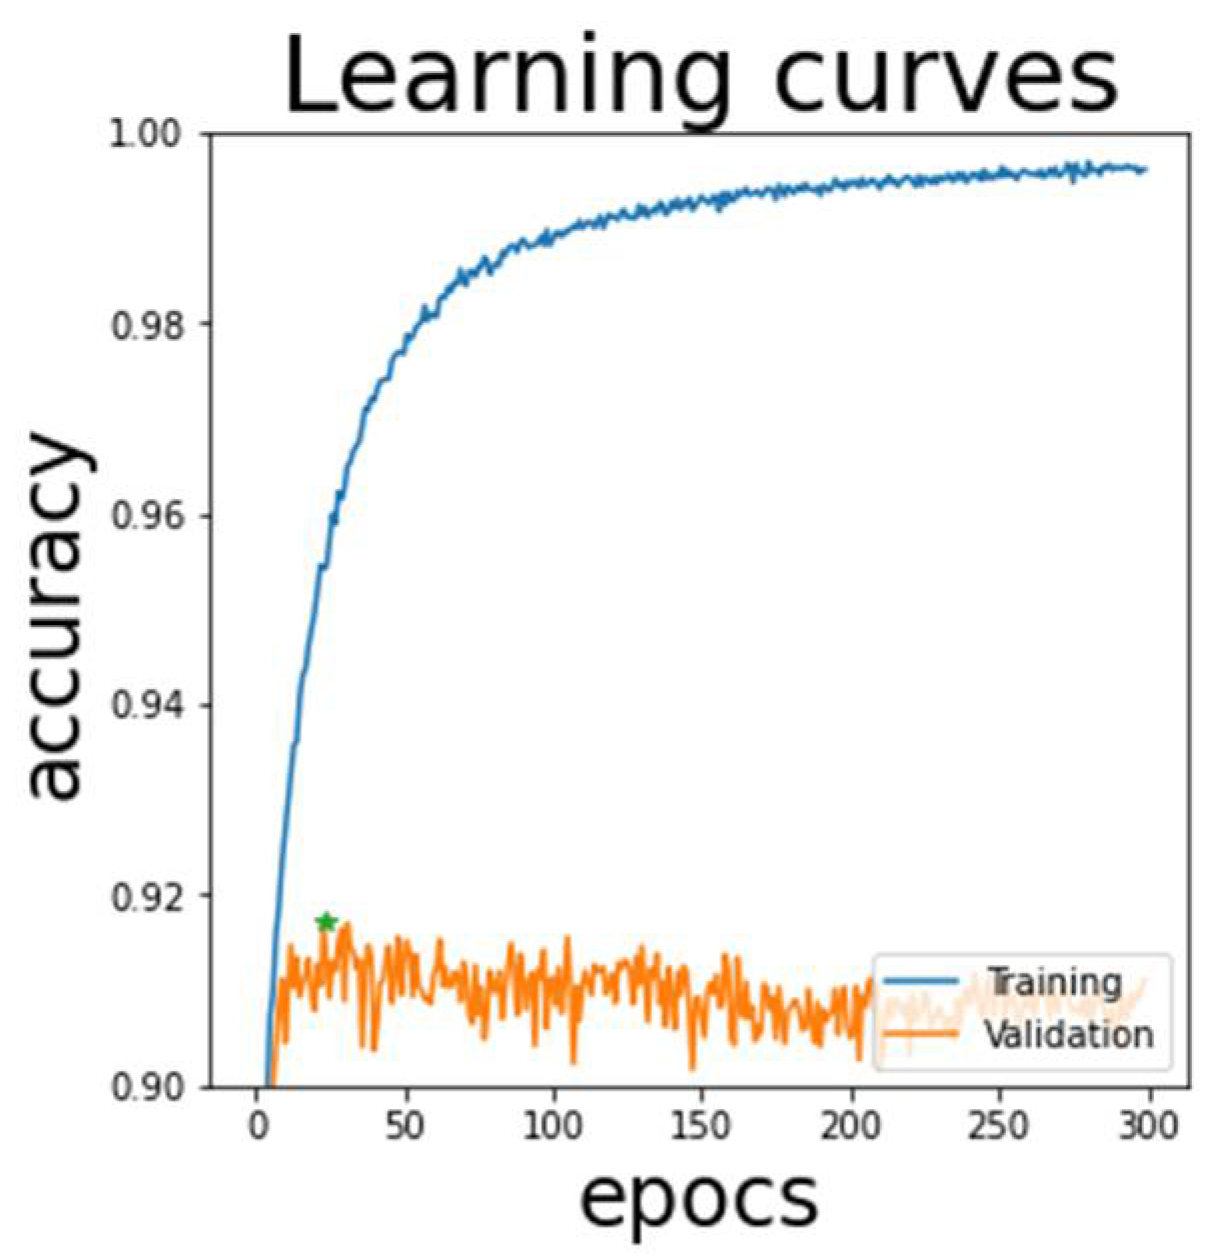
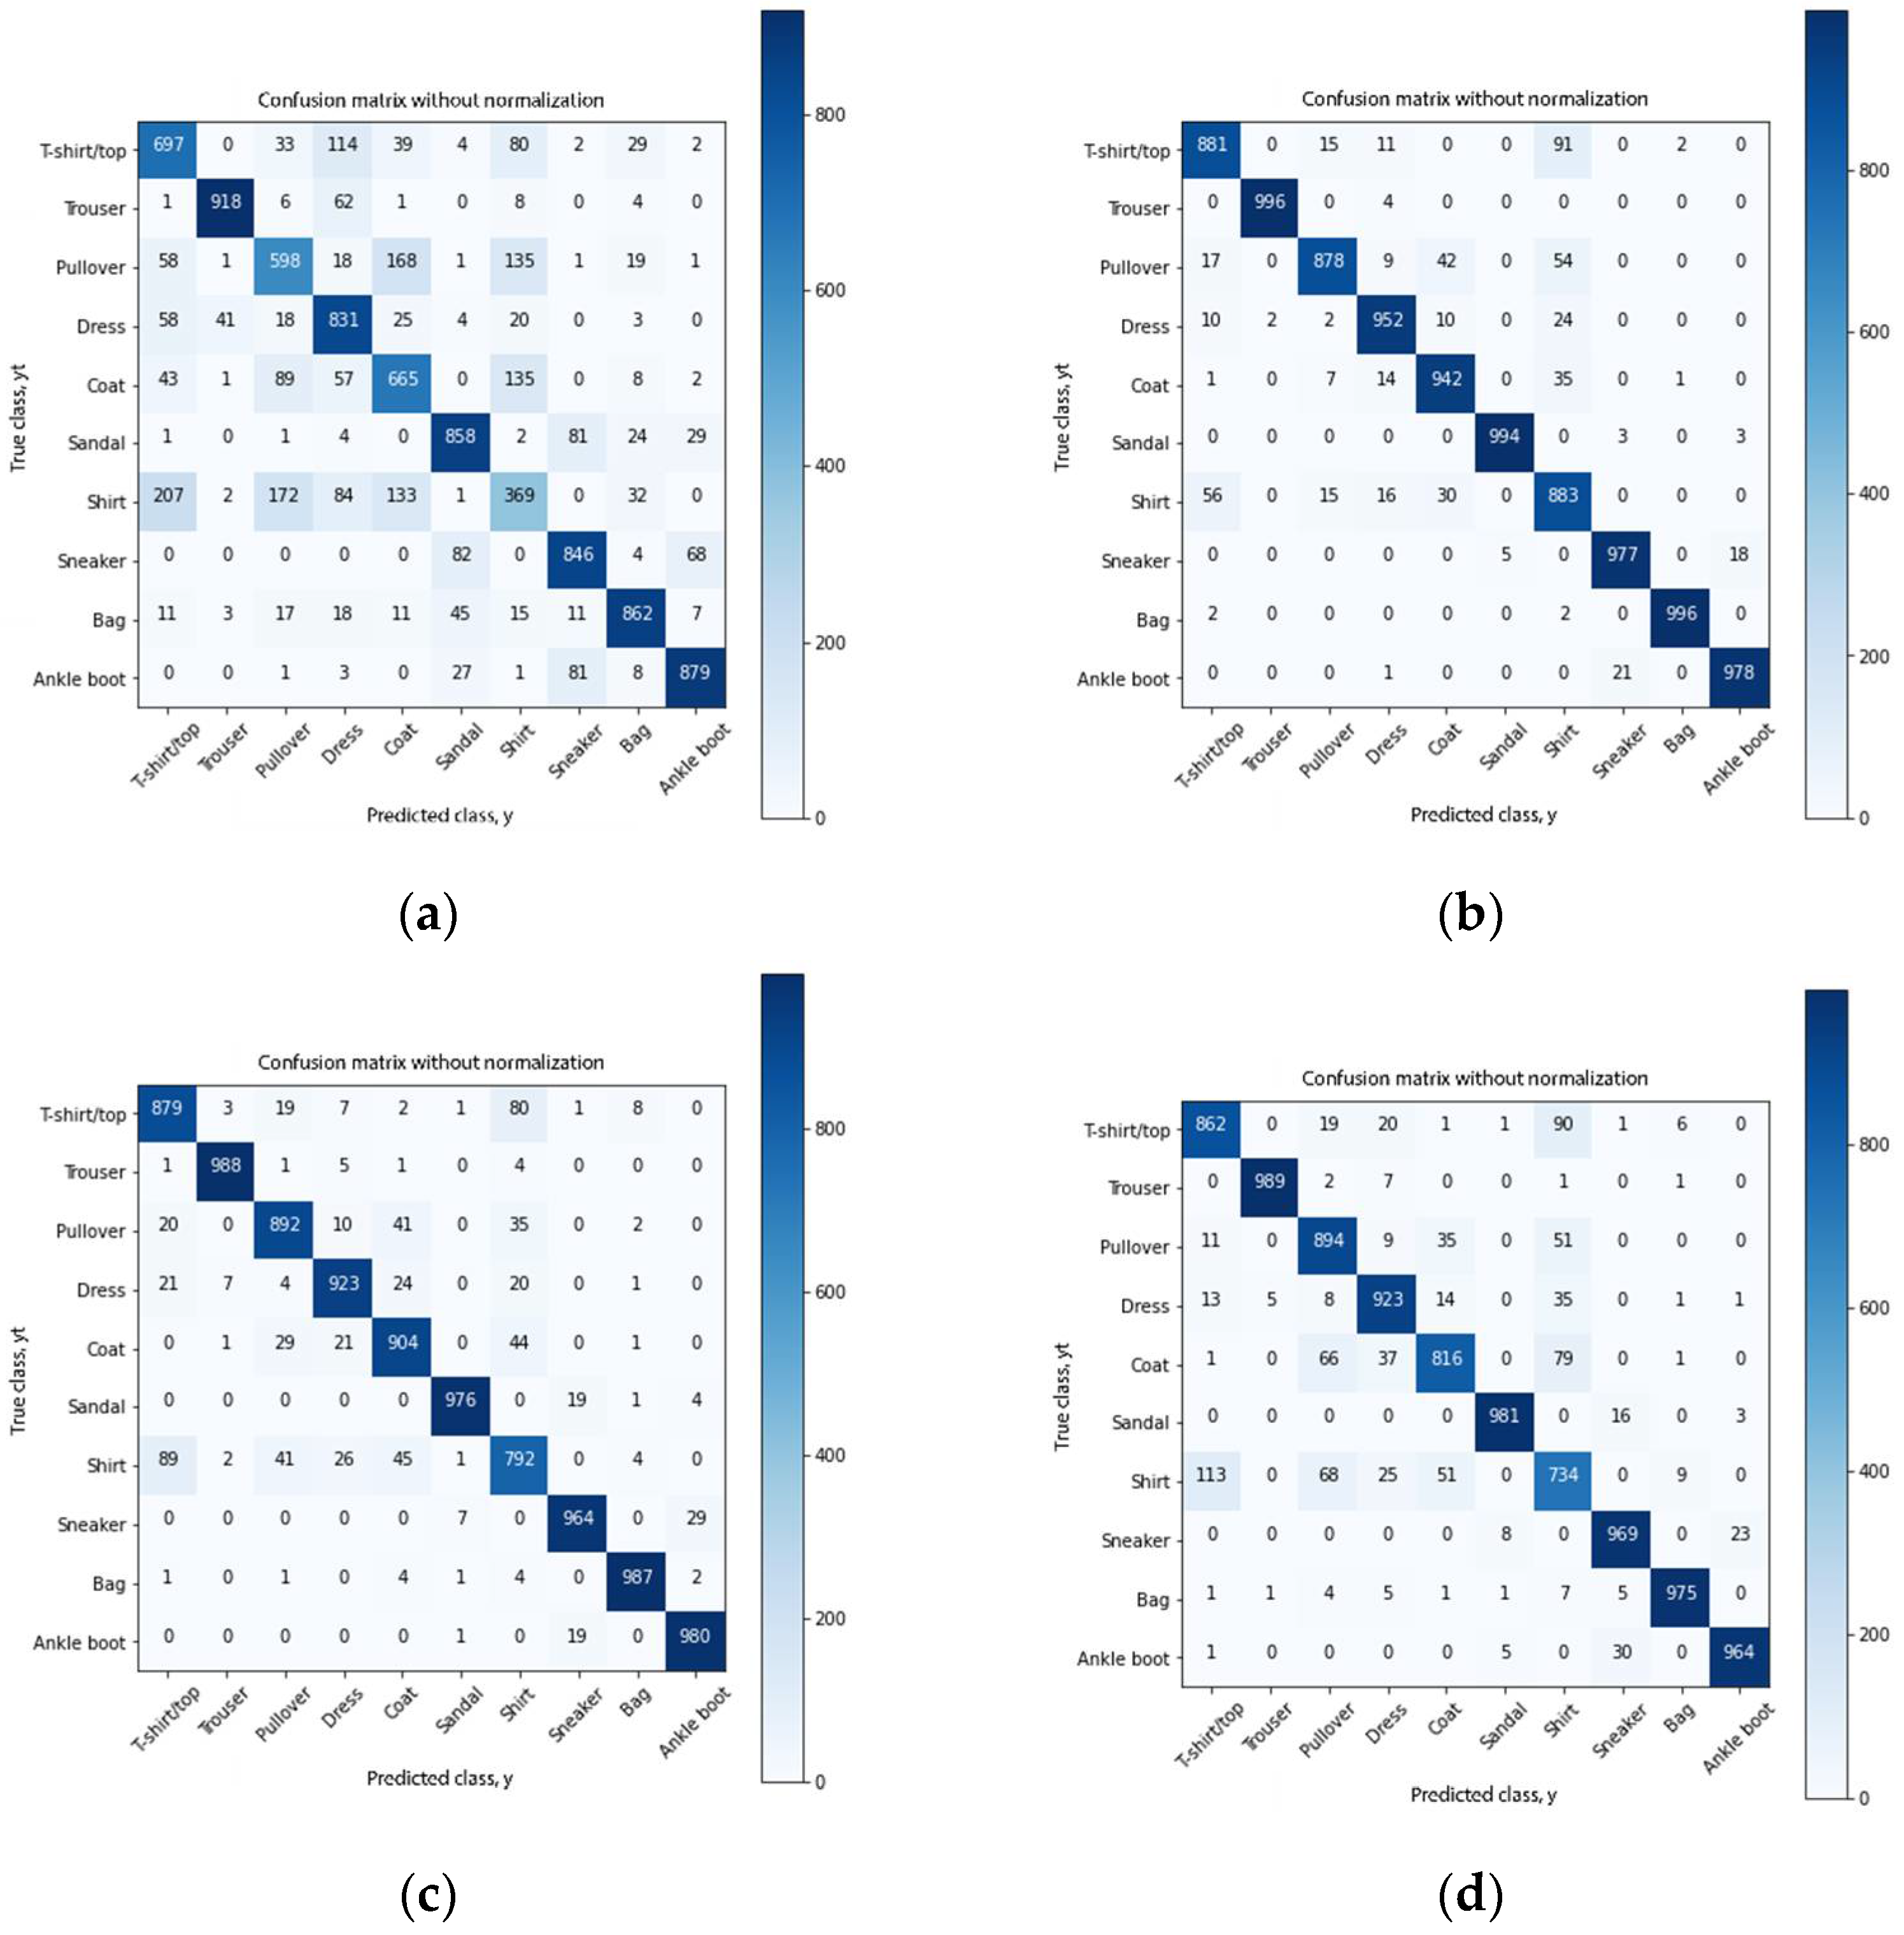
3.2. Object Classifiers Comparison
3.3. Tiny YOLO and YOLO Using Transfer Learning
3.4. Study Case: Clothing Insulation Real-Time Analysis Applied on Thermostats
- 0.4 threshold:
- ○
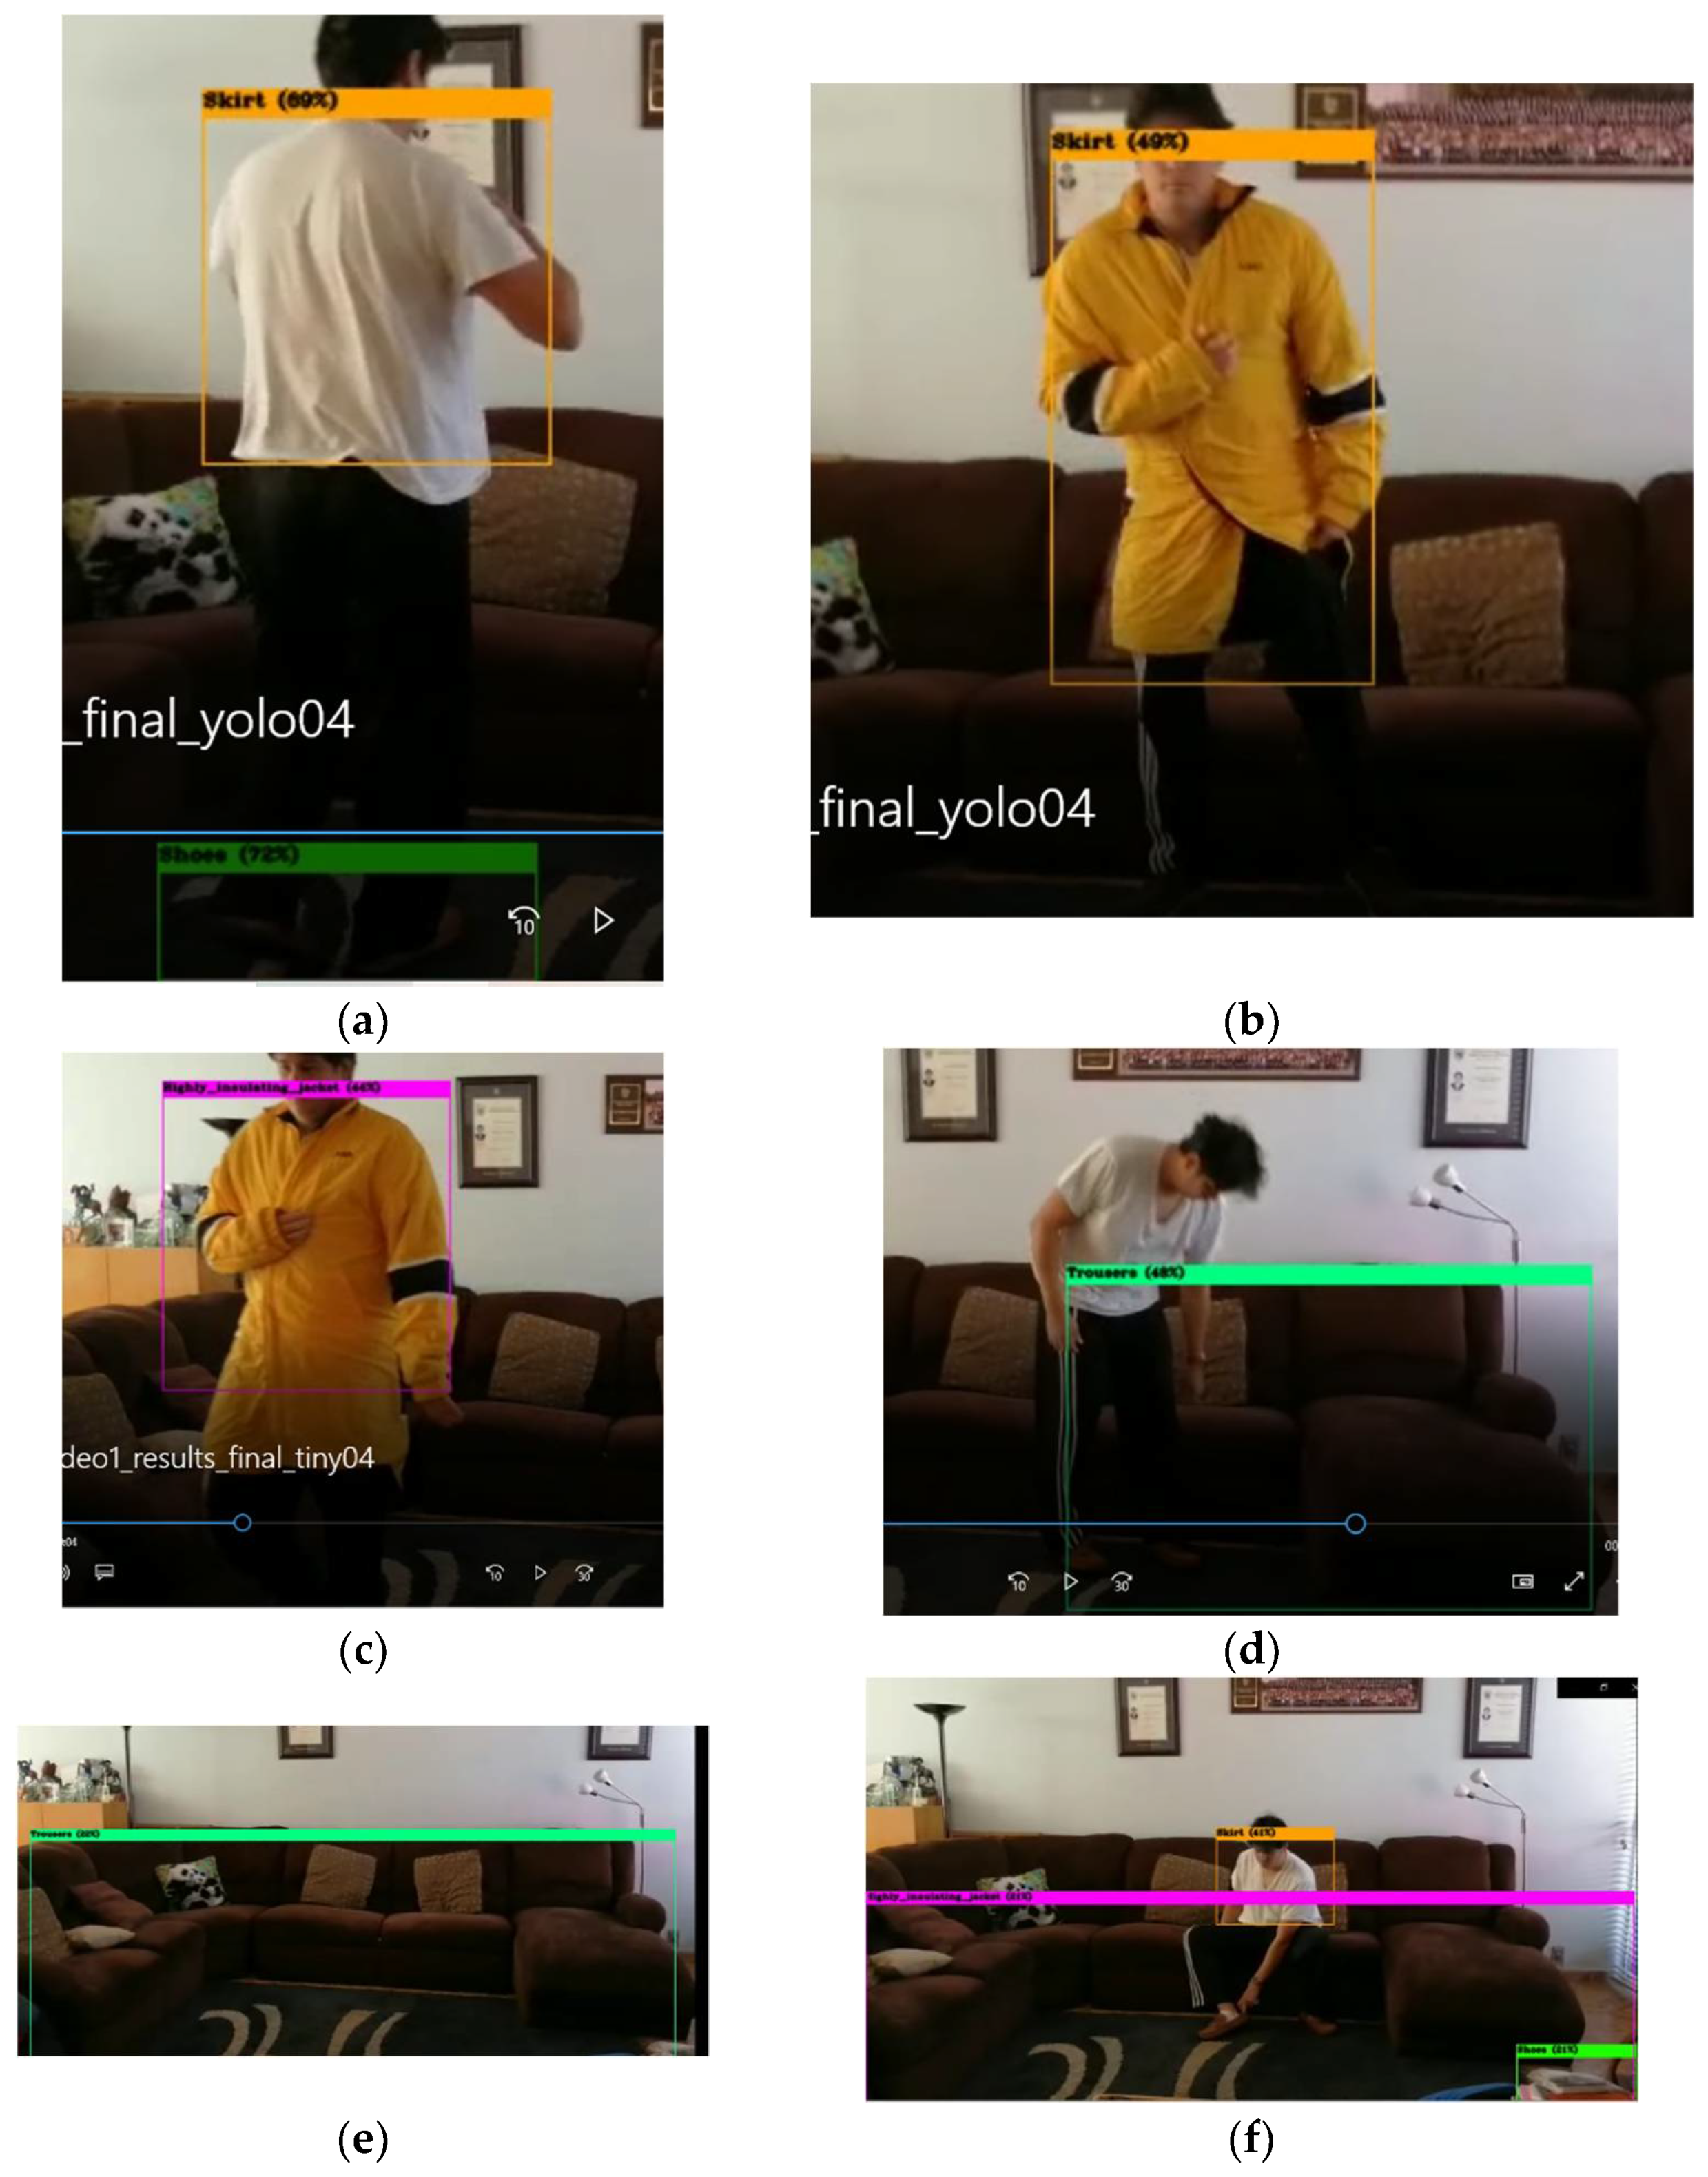
- The YOLO model had problems detecting the garments with darker objects, but with clearer objects, it produced a full clothing classification;
- ○
- The Tiny YOLO model did not detect multiple clothing garments and incorrectly classified hair as a hat, and it did not detect darker objects.
- 0.2 threshold:
- ○
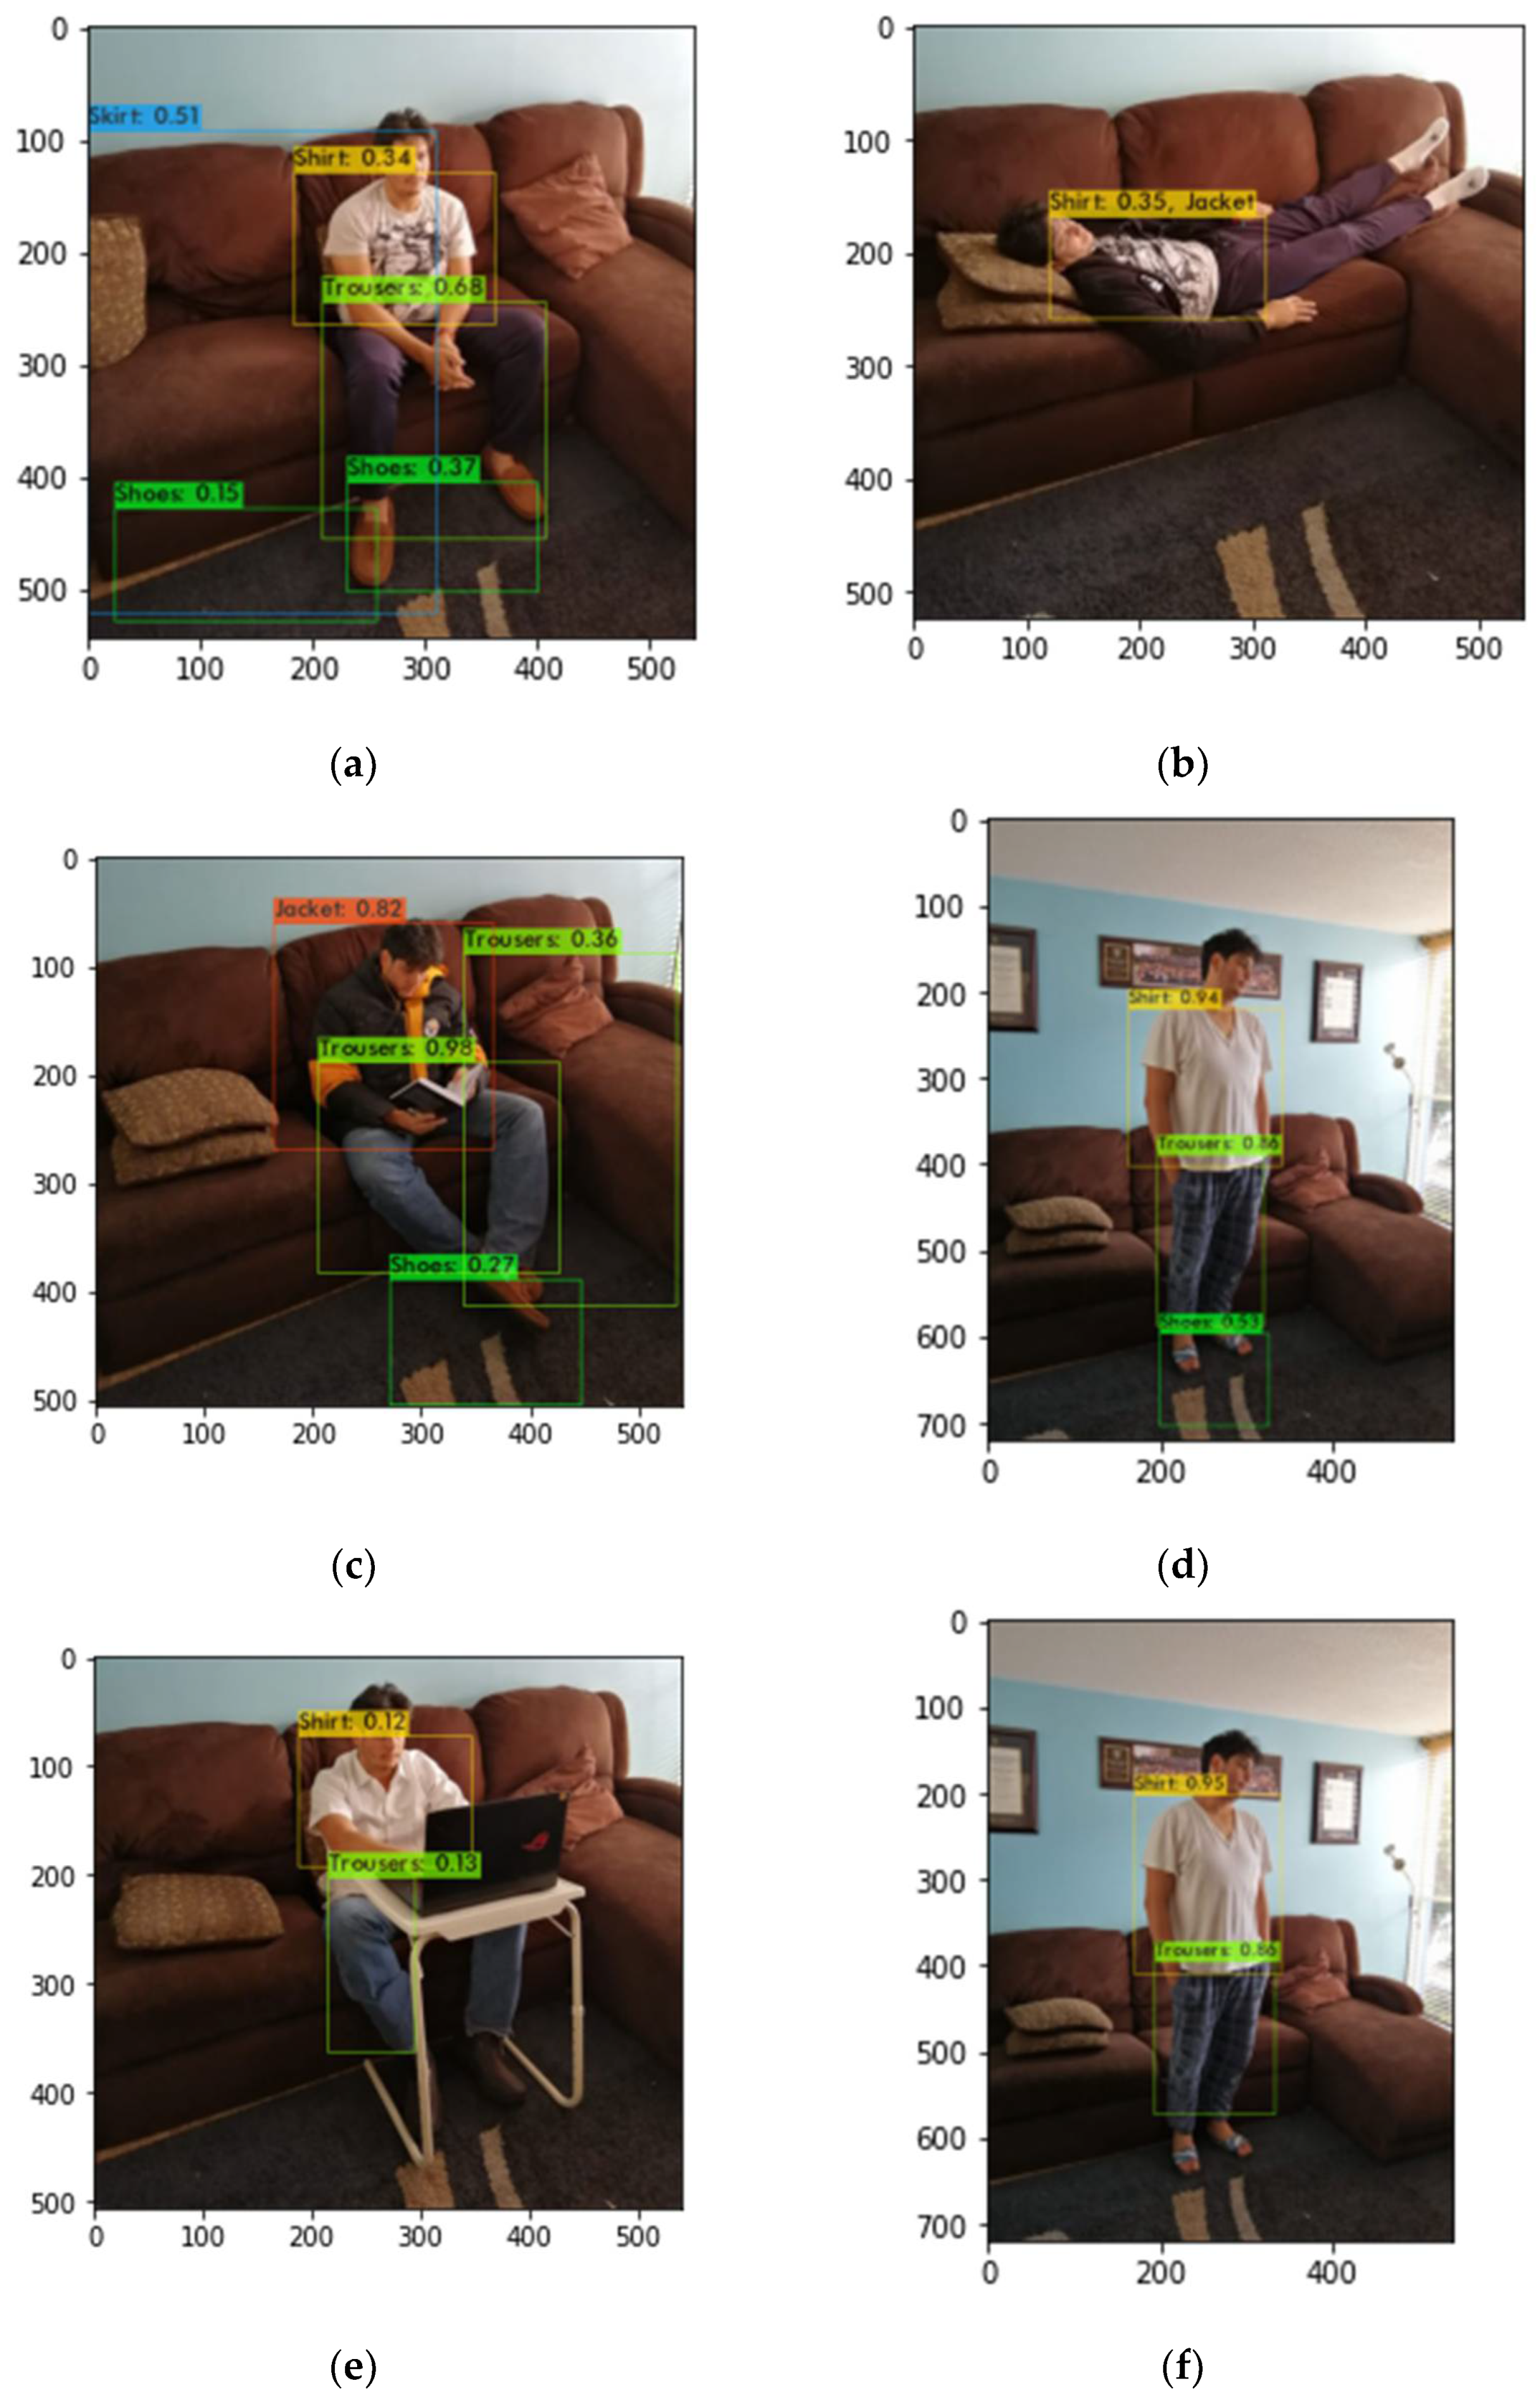
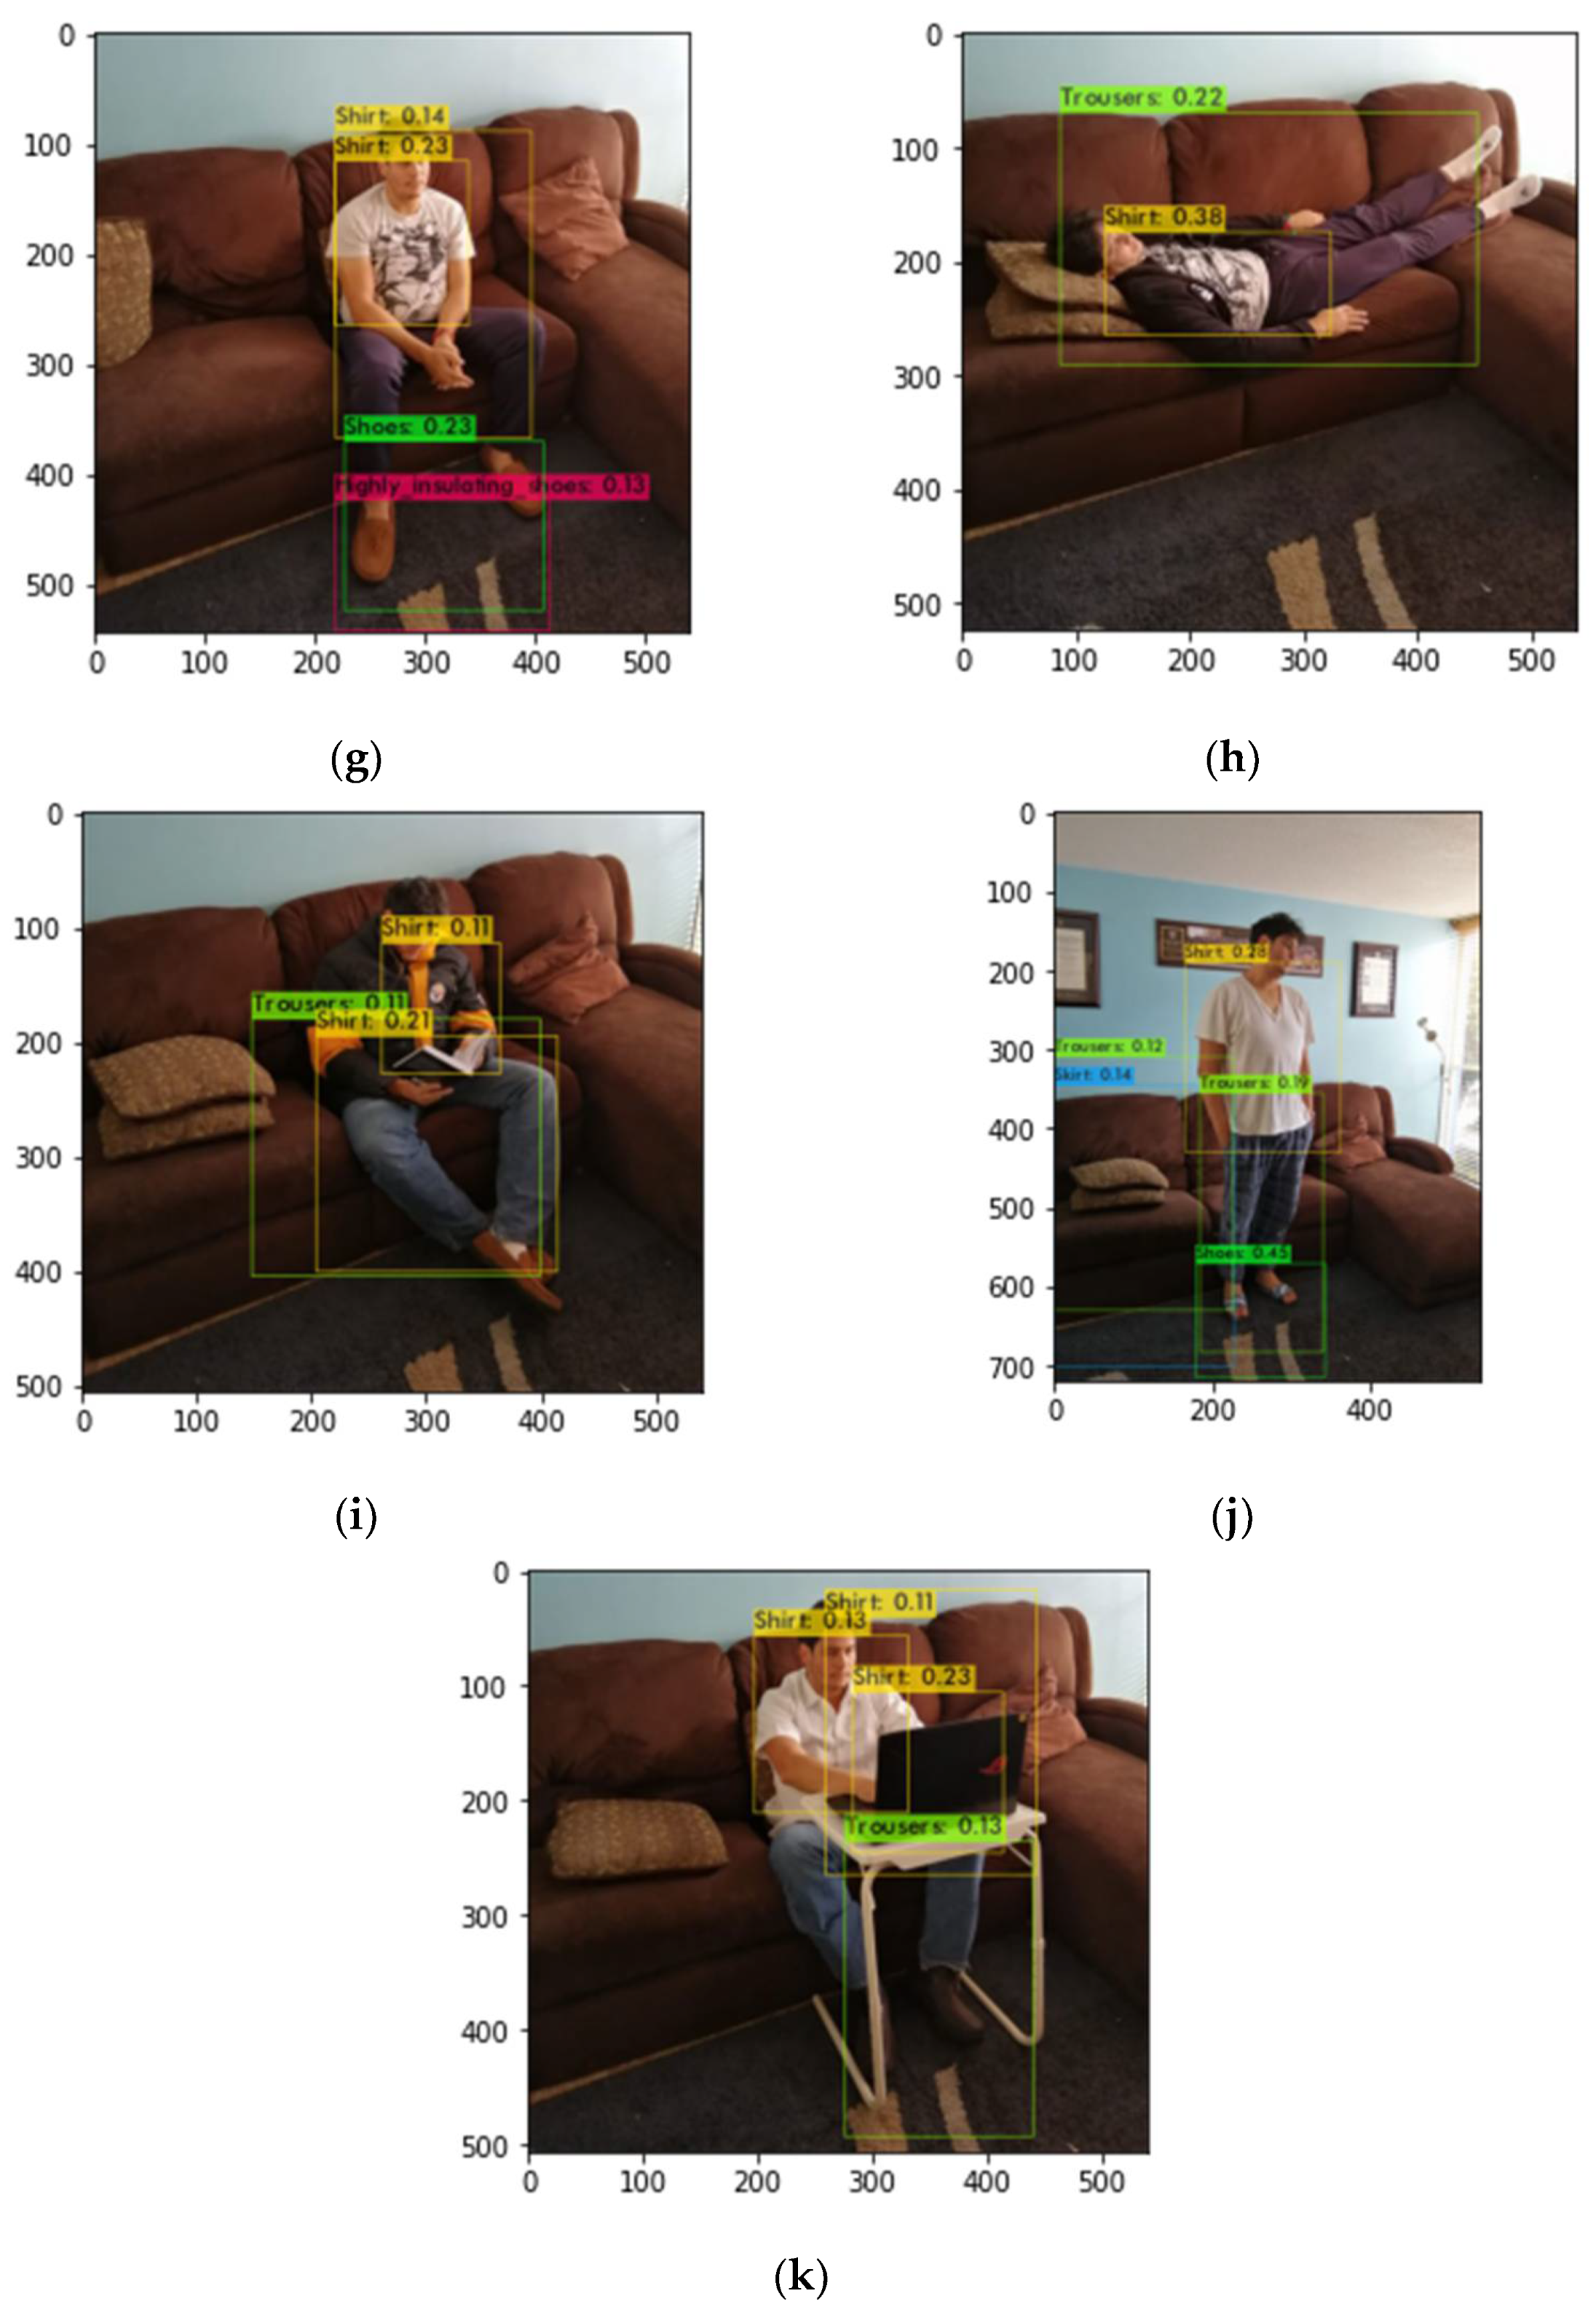
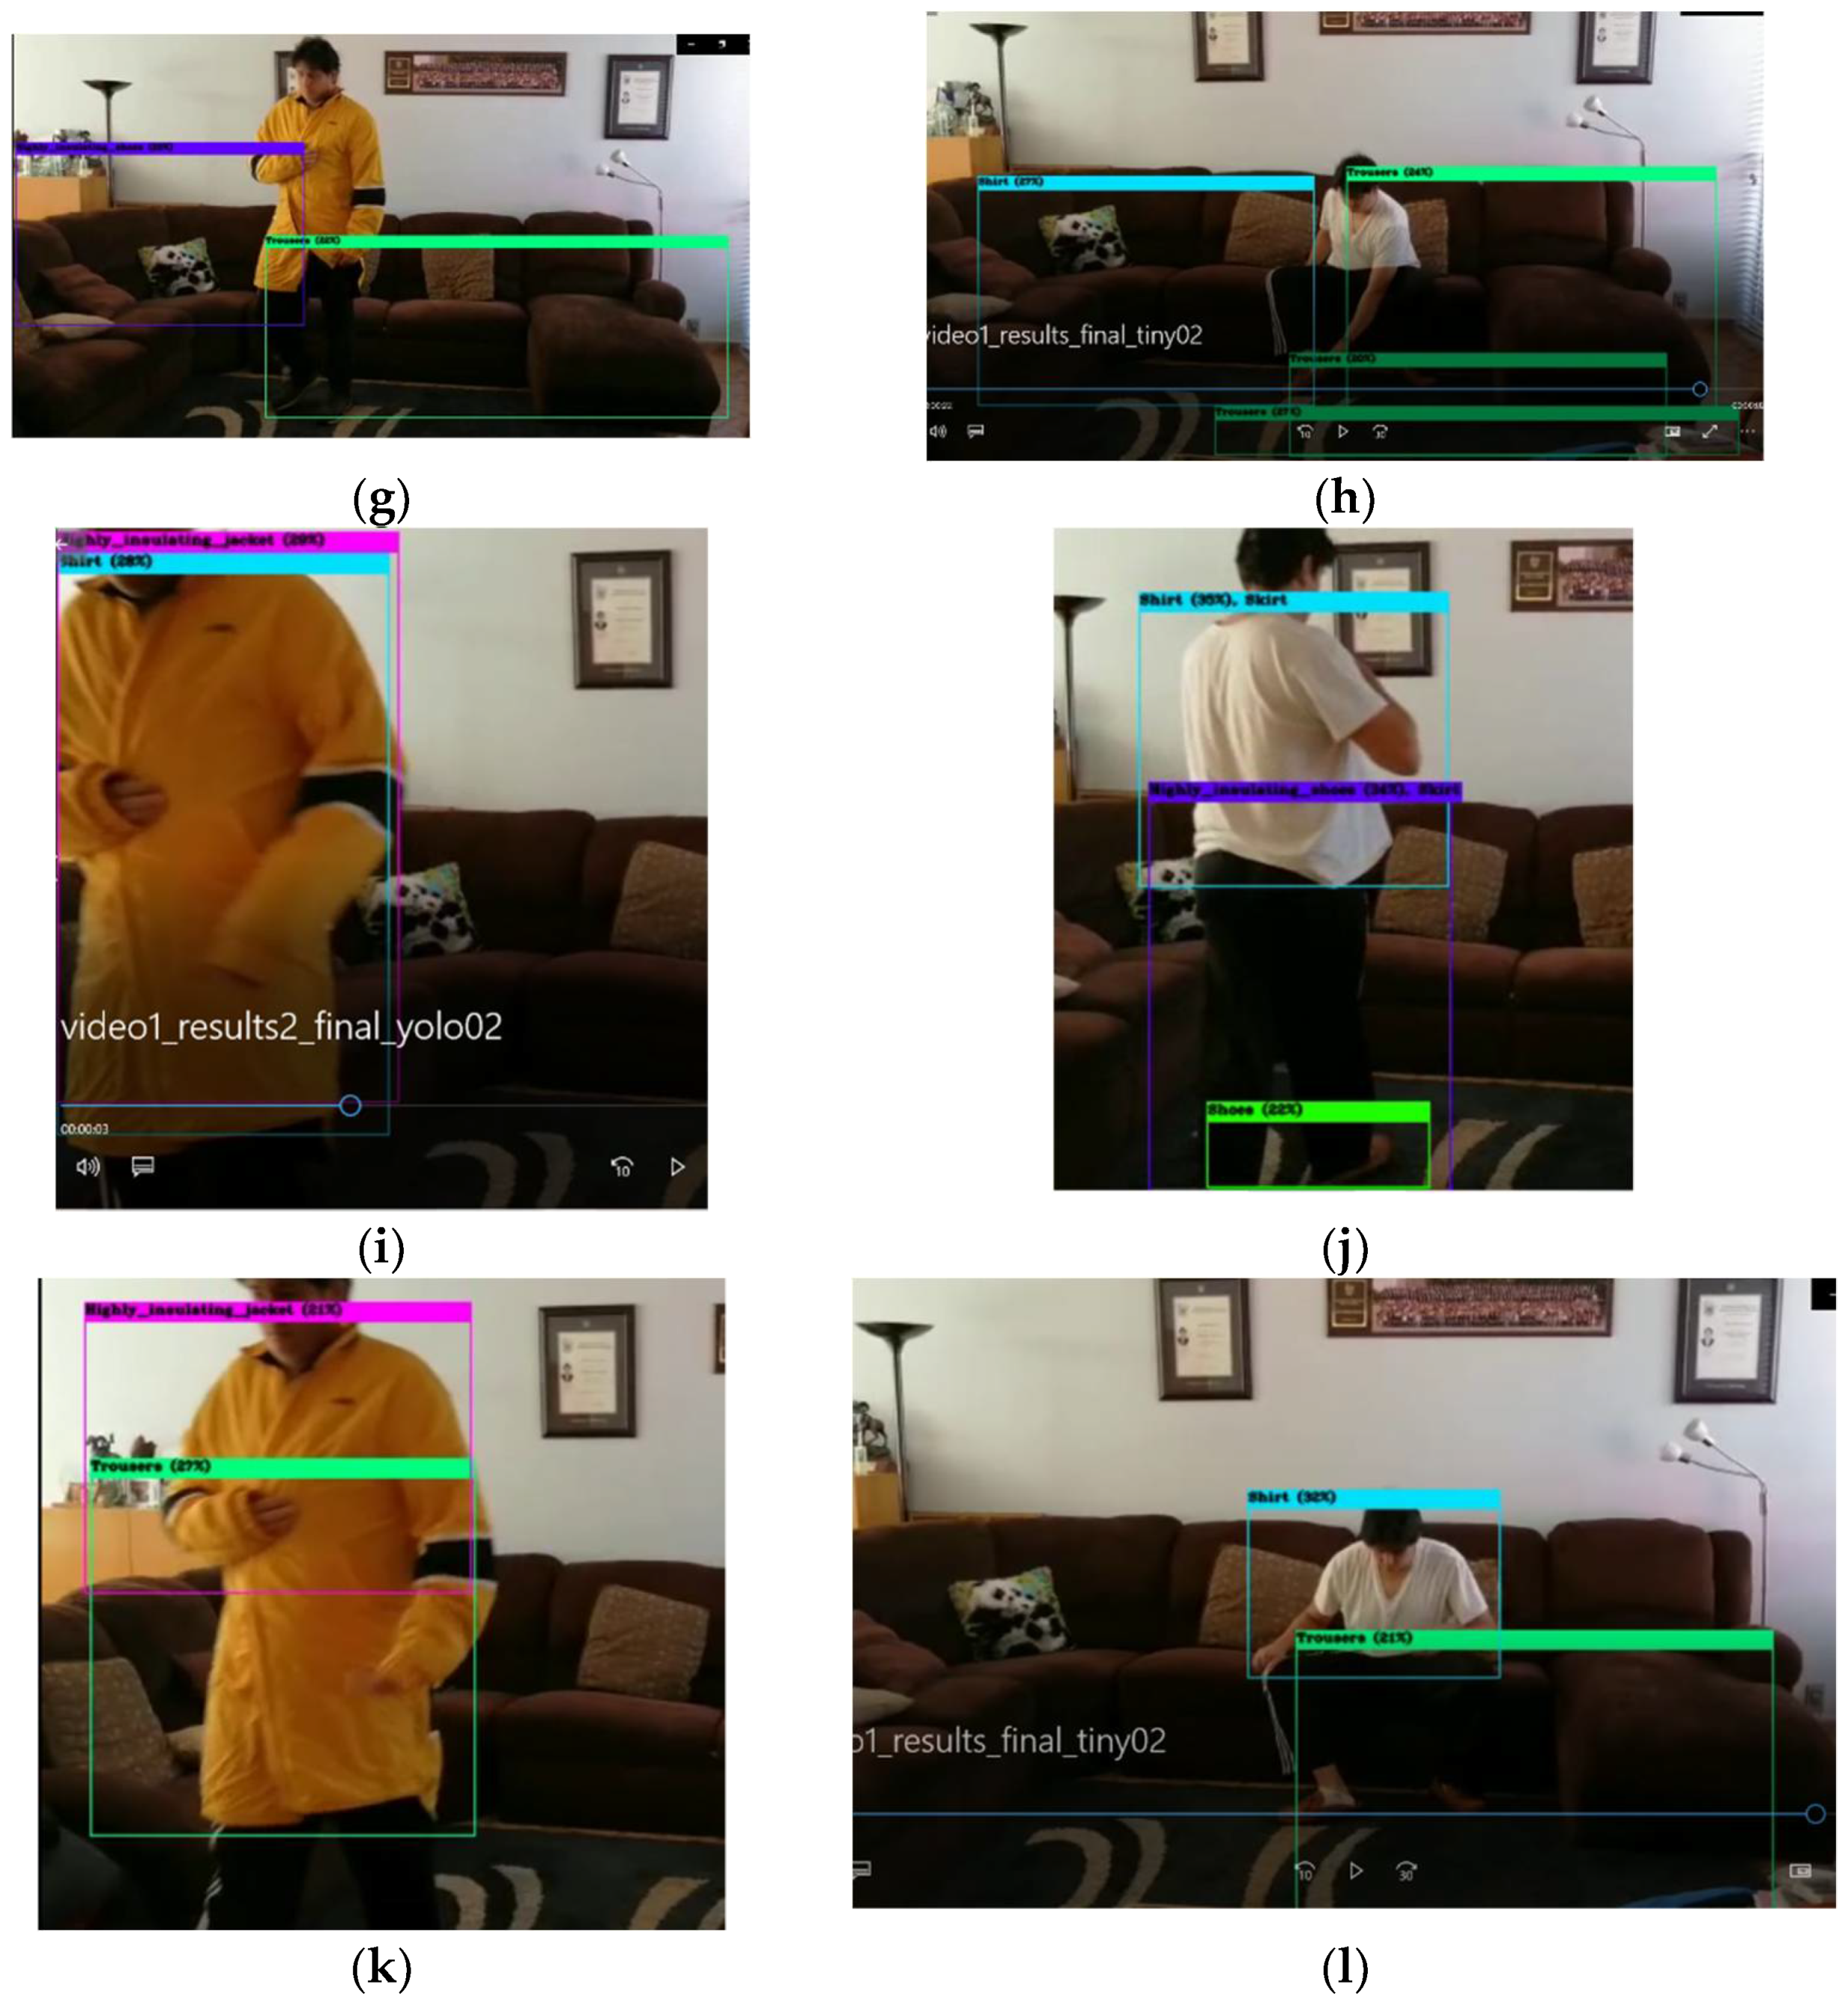
- The YOLO model showed incorrect classifications or multiple classifications for a single object. However, the YOLO model classified multiple clothing garments and produce more correct classifications than the Tiny YOLO model;
- ○
- The Tiny YOLO made multiple clothing garment classifications, but it misclassified darker objects.
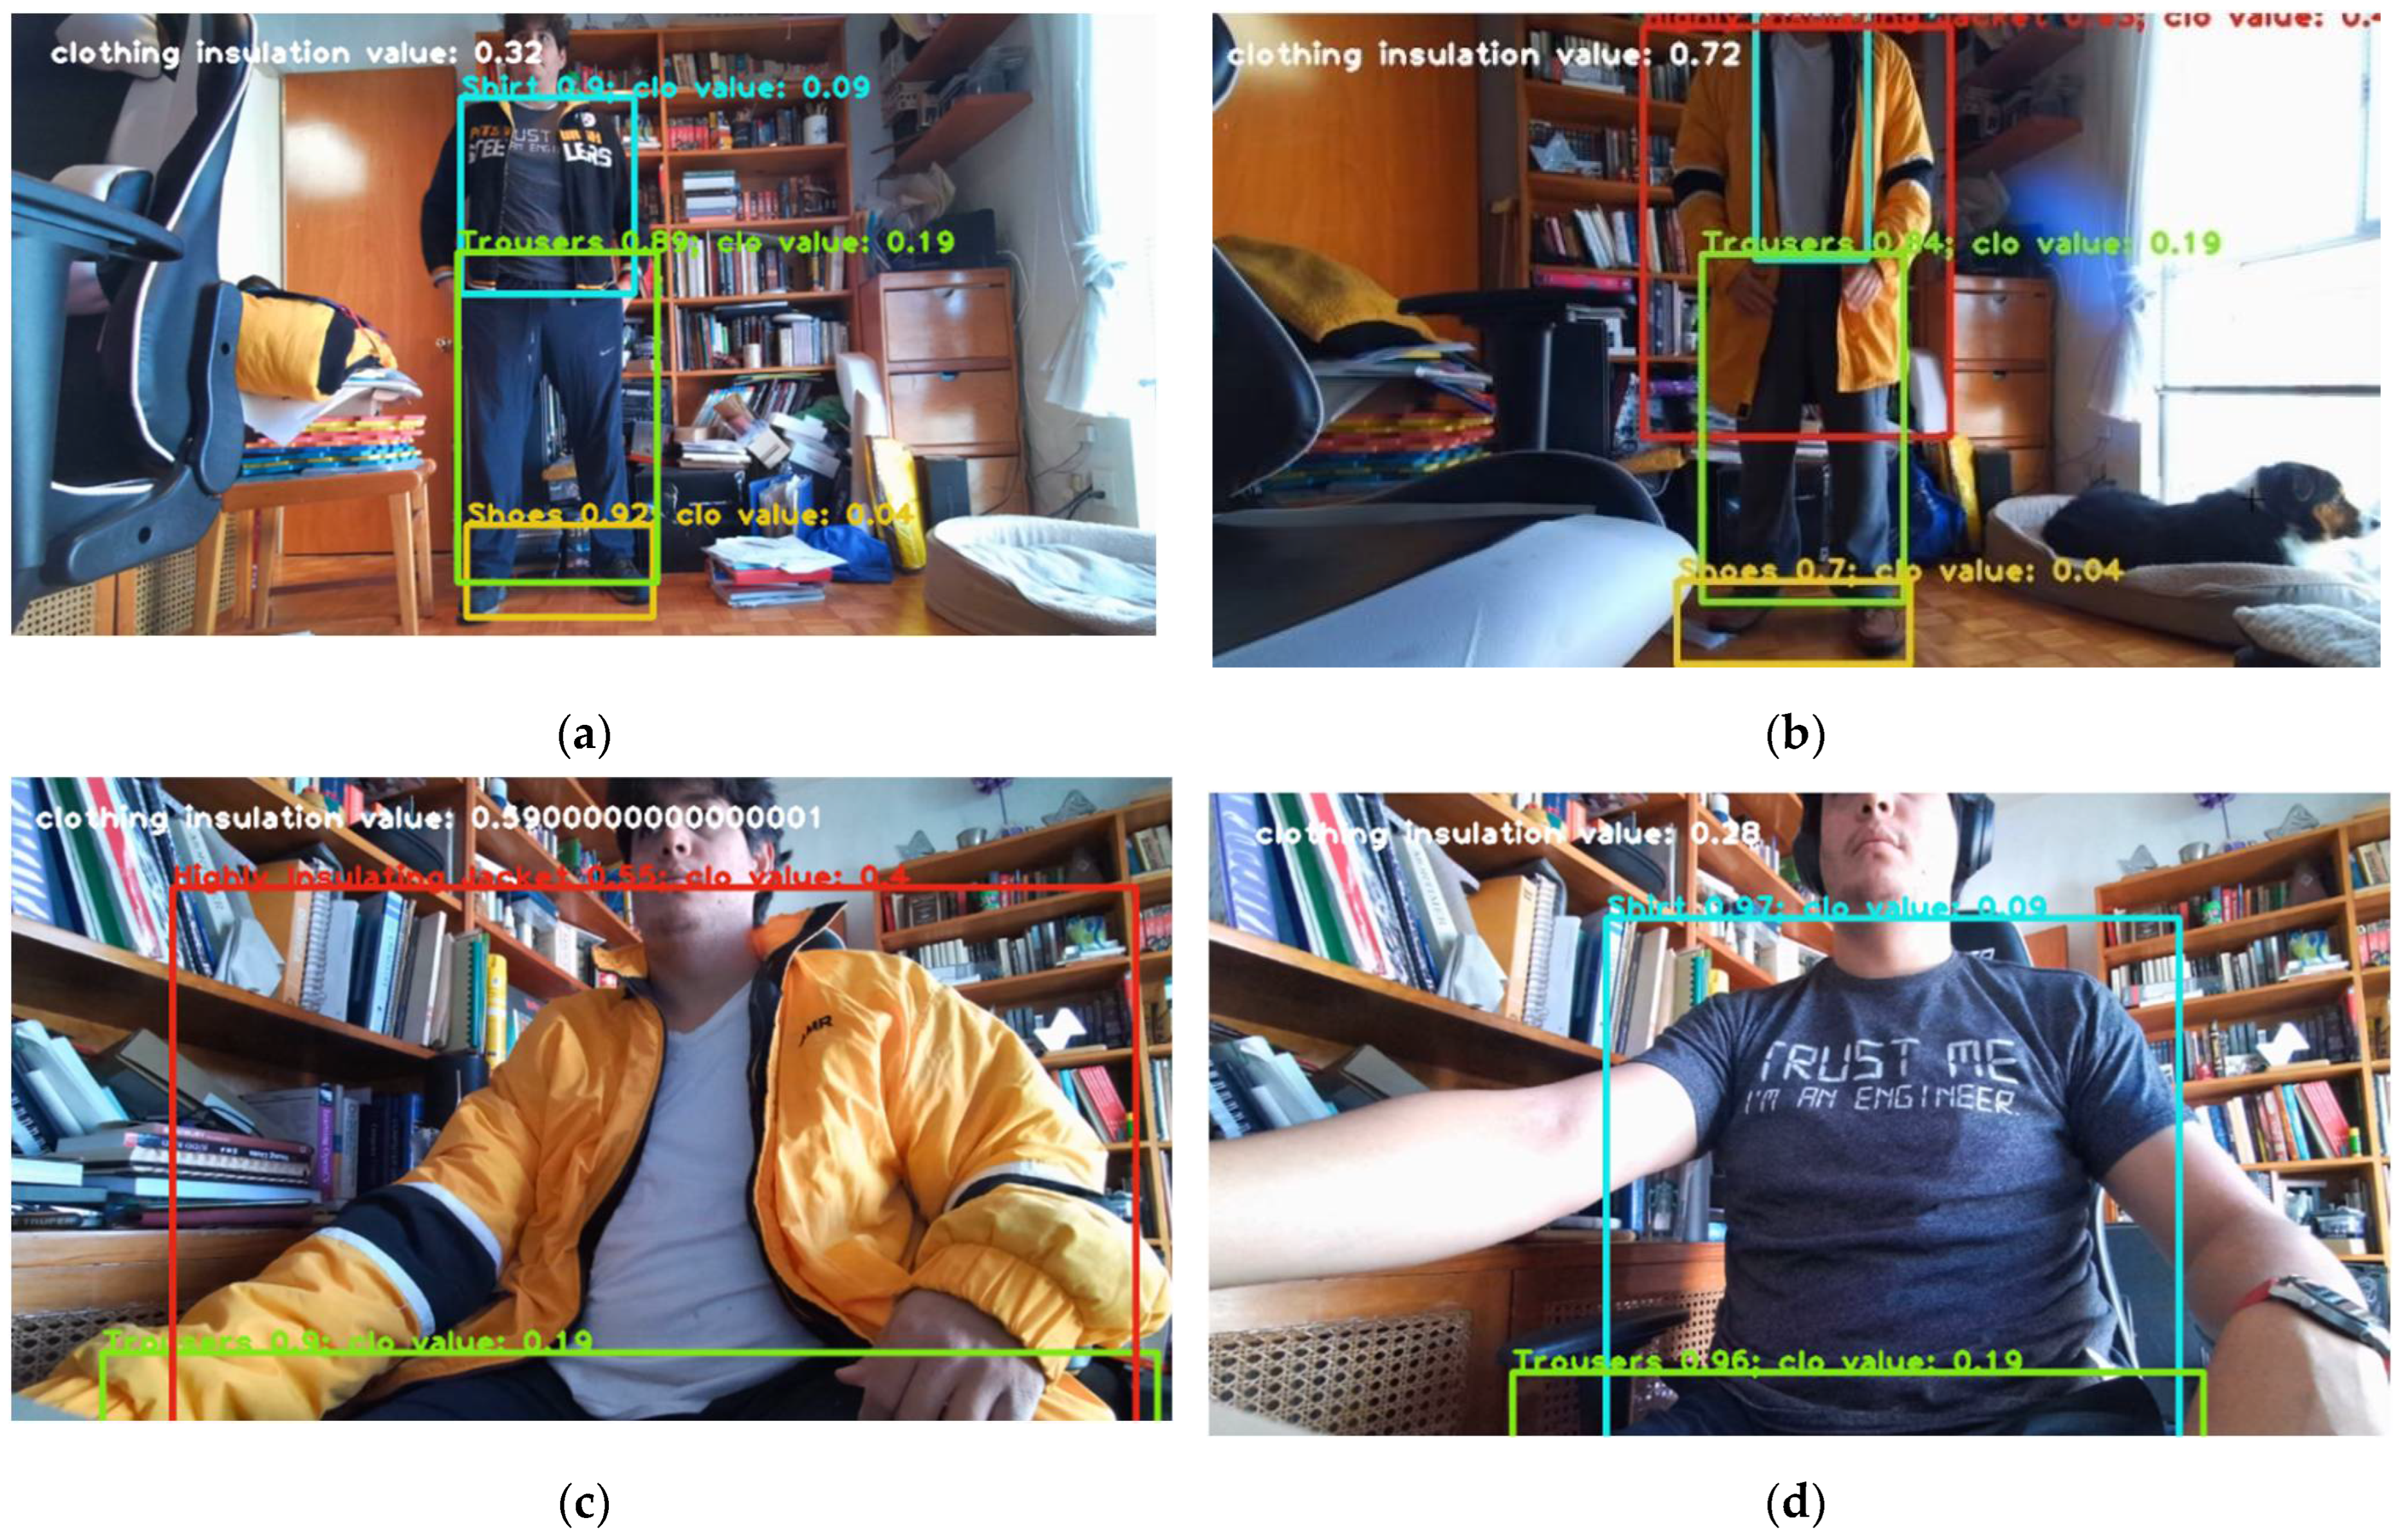
- Warmer clothing garments were closer to the red color of the bounding box; colder clothing garments were closer to the blue color.
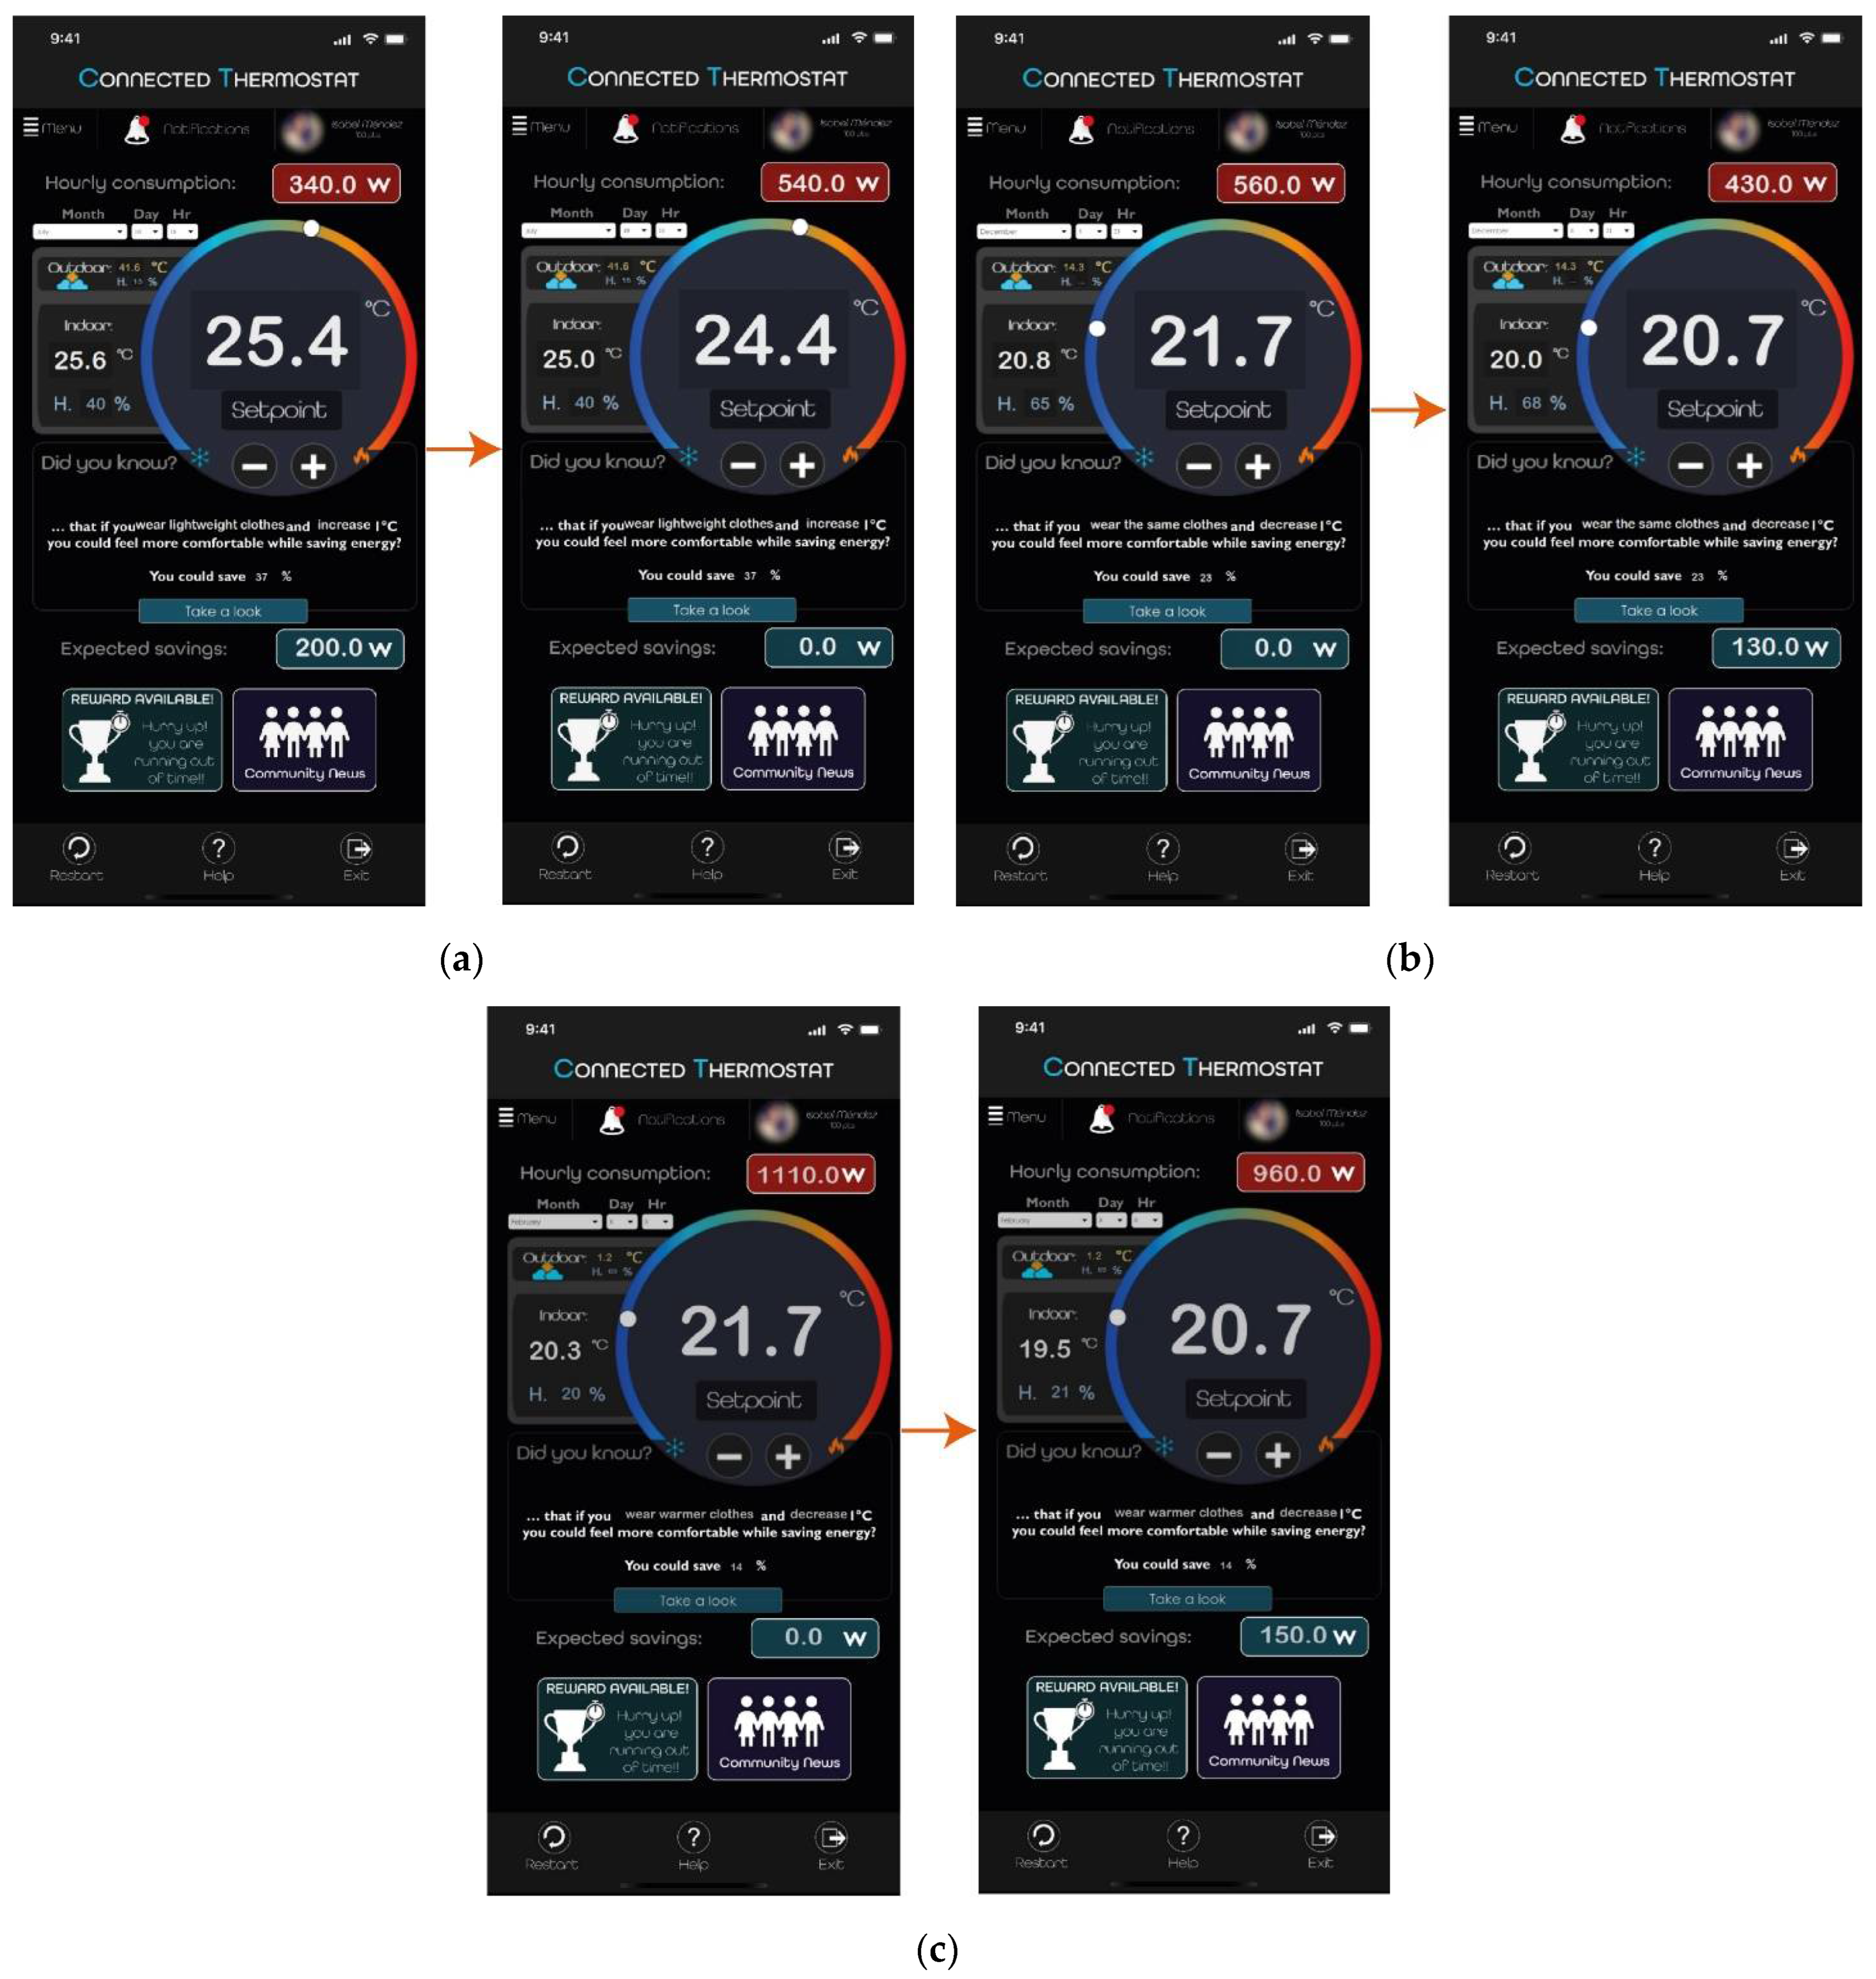
- 10 July at 4:00 p.m. (Figure 18a): increase the setpoint by 1 °C and wear lightweight clothes to reduce the HVAC consumption;
- 8 December at 9:00 p.m. (Figure 18b): decrease the setpoint by 1 °C and wear the same clothes;
- 8 February at 8:00 p.m. (Figure 18c): decrease the setpoint by 1 °C and wear warmer clothes.
4. Discussion
5. Conclusions
Author Contributions
Funding
Institutional Review Board Statement
Informed Consent Statement
Data Availability Statement
Acknowledgments
Conflicts of Interest
References
- Standard 55-2017; Thermal Environmental Conditions for Human Occupancy. American National Standards Institute, American Society of Heating, Refrigerating and Air-Conditioning Engineers: Atlanta, GA, USA, 2017.
- Liu, S.; Schiavon, S.; Das, H.P.; Jin, M.; Spanos, C.J. Personal Thermal Comfort Models with Wearable Sensors. Build. Environ. 2019, 162, 106281. [Google Scholar] [CrossRef] [Green Version]
- André, M.; De Vecchi, R.; Lamberts, R. User-Centered Environmental Control: A Review of Current Findings on Personal Conditioning Systems and Personal Comfort Models. Energy Build. 2020, 222, 110011. [Google Scholar] [CrossRef]
- Parsons, K.C. Human Thermal Comfort; CRC Press: Boca Raton, FL, USA, 2020; ISBN 978-0-429-29498-3. [Google Scholar]
- Rupp, R.F.; Kazanci, O.B.; Toftum, J. Investigating Current Trends in Clothing Insulation Using a Global Thermal Comfort Database. Energy Build. 2021, 252, 111431. [Google Scholar] [CrossRef]
- Földváry Ličina, V.; Cheung, T.; Zhang, H.; de Dear, R.; Parkinson, T.; Arens, E.; Chun, C.; Schiavon, S.; Luo, M.; Brager, G.; et al. ASHRAE Global Thermal Comfort Database II. Methods 2021, 2020, 06–24. [Google Scholar] [CrossRef] [Green Version]
- Wang, L.; Kim, J.; Xiong, J.; Yin, H. Optimal Clothing Insulation in Naturally Ventilated Buildings. Build. Environ. 2019, 154, 200–210. [Google Scholar] [CrossRef]
- Gao, G.; Li, J.; Wen, Y. Deep Comfort: Energy-Efficient Thermal Comfort Control in Buildings Via Reinforcement Learning. IEEE Internet Things J. 2020, 7, 8472–8484. [Google Scholar] [CrossRef]
- Krizhevsky, A.; Sutskever, I.; Hinton, G.E. Imagenet Classification with Deep Convolutional Neural Networks. Adv. Neural Inf. Process. Syst. 2012, 25, 1097–1105. [Google Scholar] [CrossRef]
- Liu, J.; Foged, I.W.; Moeslund, T.B. Automatic Estimation of Clothing Insulation Rate and Metabolic Rate for Dynamic Thermal Comfort Assessment. Pattern Anal. Appl. 2021, 1–16. [Google Scholar] [CrossRef]
- Kalantidis, Y.; Kennedy, L.; Li, L.-J. Getting the Look: Clothing Recognition and Segmentation for Automatic Product Suggestions in Everyday Photos. In Proceedings of the 3rd ACM Conference on International Conference on Multimedia Retrieval, Dallas, TX, USA, 16–20 April 2013; pp. 105–112. [Google Scholar]
- Yang, M.; Yu, K. Real-Time Clothing Recognition in Surveillance Videos. In Proceedings of the 2011 18th IEEE International Conference on Image Processing, Brussels, Belgium, 11–14 September 2011; pp. 2937–2940. [Google Scholar]
- Chao, X.; Huiskes, M.J.; Gritti, T.; Ciuhu, C. A Framework for Robust Feature Selection for Real-Time Fashion Style Recommendation. In Proceedings of the 1st International Workshop on Interactive Multimedia for Consumer Electronics, Beijing, China, 23 October 2009; pp. 35–42. [Google Scholar]
- Yamaguchi, K.; Okatani, T.; Sudo, K.; Murasaki, K.; Taniguchi, Y. Mix and Match: Joint Model for Clothing and Attribute Recognition. In Proceedings of the BMVC, Swansea, UK, 7–10 September 2015; Volume 1, p. 4. [Google Scholar]
- Simonyan, K.; Zisserman, A. Very Deep Convolutional Networks for Large-Scale Image Recognition. In Proceedings of the 3rd International Conference on Learning Representations, ICLR 2015, San Diego, CA, USA, 7–9 May 2015. [Google Scholar]
- Liu, Z.; Luo, P.; Qiu, S.; Wang, X.; Tang, X. Deepfashion: Powering Robust Clothes Recognition and Retrieval with Rich Annotations. In Proceedings of the IEEE Conference on Computer Vision and Pattern Recognition, Las Vegas, NV, USA, 27–30 June 2016; pp. 1096–1104. [Google Scholar]
- Wang, W.; Xu, Y.; Shen, J.; Zhu, S.-C. Attentive Fashion Grammar Network for Fashion Landmark Detection and Clothing Category Classification. In Proceedings of the IEEE Conference on Computer Vision and Pattern Recognition, Salt Lake City, UT, USA, 18–23 June 2018; pp. 4271–4280. [Google Scholar]
- Zhang, Y.; Zhang, P.; Yuan, C.; Wang, Z. Texture and Shape Biased Two-Stream Networks for Clothing Classification and Attribute Recognition. In Proceedings of the IEEE/CVF Conference on Computer Vision and Pattern Recognition, Seattle, WA, USA, 13–19 June 2020; pp. 13538–13547. [Google Scholar]
- Lee, K.M.; Matsushita, Y.; Rehg, J.M.; Hu, Z. (Eds.) Computer Vision—ACCV 2012; Lecture Notes in Computer Science; Springer: Berlin/Heidelberg, Germany, 2013; Volume 7727, ISBN 978-3-642-37446-3. [Google Scholar]
- Matsumoto, H.; Iwai, Y.; Ishiguro, H. Estimation of Thermal Comfort by Measuring Clo Value without Contact. In Proceedings of the MVA, Nara, Japan, 13–15 June 2011; pp. 491–494. [Google Scholar]
- Bouskill, L.M.; Havenith, G.; Kuklane, K.; Parsons, K.C.; Withey, W.R. Relationship Between Clothing Ventilation and Thermal Insulation. AIHA J. 2002, 63, 262–268. [Google Scholar] [CrossRef] [PubMed]
- Caine, K.E.; Zimmerman, C.Y.; Schall-Zimmerman, Z.; Hazlewood, W.R.; Jean Camp, L.; Connelly, K.H.; Huber, L.L.; Shankar, K. DigiSwitch: A Device to Allow Older Adults to Monitor and Direct the Collection and Transmission of Health Information Collected at Home. J. Med. Syst. 2011, 35, 1181–1195. [Google Scholar] [CrossRef] [PubMed]
- Solli, H.; Hvalvik, S.; Bjørk, I.T.; Hellesø, R. Characteristics of the Relationship That Develops from Nurse-Caregiver Communication during Telecare. J. Clin. Nurs. 2015, 24, 1995–2004. [Google Scholar] [CrossRef] [PubMed]
- Maharjan, R.; Bækgaard, P.; Bardram, J.E. “Hear Me out”: Smart Speaker Based Conversational Agent to Monitor Symptoms in Mental Health. In Adjunct Proceedings of the 2019 ACM International Joint Conference on Pervasive and Ubiquitous Computing and Proceedings of the 2019 ACM International Symposium on Wearable Computers; Association for Computing Machinery: New York, NY, USA, 2019; pp. 929–933. [Google Scholar]
- Méndez, J.I.; Mata, O.; Ponce, P.; Meier, A.; Peffer, T.; Molina, A. Multi-Sensor System, Gamification, and Artificial Intelligence for Benefit Elderly People. In Challenges and Trends in Multimodal Fall Detection for Healthcare; Ponce, H., Martínez-Villaseñor, L., Brieva, J., Moya-Albor, E., Eds.; Springer International Publishing: Cham, Switzerland, 2020; Volume 273, pp. 207–235. ISBN 978-3-030-38747-1. [Google Scholar]
- Méndez, J.I.; Meza-Sánchez, A.V.; Ponce, P.; McDaniel, T.; Peffer, T.; Meier, A.; Molina, A. Smart Homes as Enablers for Depression Pre-Diagnosis Using PHQ-9 on HMI through Fuzzy Logic Decision System. Sensors 2021, 21, 7864. [Google Scholar] [CrossRef] [PubMed]
- Méndez, J.I.; Ponce, P.; Medina, A.; Meier, A.; Peffer, T.; McDaniel, T.; Molina, A. Human-Machine Interfaces for Socially Connected Devices: From Smart Households to Smart Cities. In Multimedia for Accessible Human Computer Interfaces; McDaniel, T., Liu, X., Eds.; Springer International Publishing: Cham, Switzerland, 2021; pp. 253–289. ISBN 978-3-030-70715-6. [Google Scholar]
- Avila, M.; Méndez, J.I.; Ponce, P.; Peffer, T.; Meier, A.; Molina, A. Energy Management System Based on a Gamified Application for Households. Energies 2021, 14, 3445. [Google Scholar] [CrossRef]
- Méndez, J.I.; Ponce, P.; Pecina, M.; Schroeder, G.; Castellanos, S.; Peffer, T.; Meier, A.; Molina, A. A Rapid HMI Prototyping Based on Personality Traits and AI for Social Connected Thermostats. In Proceedings of the Advances in Soft Computing; Batyrshin, I., Gelbukh, A., Sidorov, G., Eds.; Springer International Publishing: Cham, Switzerland, 2021; pp. 216–227. [Google Scholar]
- Mendez, J.I.; Ponce, P.; Medina, A.; Peffer, T.; Meier, A.; Molina, A. A Smooth and Accepted Transition to the Future of Cities Based on the Standard ISO 37120, Artificial Intelligence, and Gamification Constructors. In Proceedings of the 2021 IEEE European Technology and Engineering Management Summit (E-TEMS), Dortmund, Germany, 18–20 March 2021; pp. 65–71. [Google Scholar]
- Mendez, J.I.; Ponce, P.; Meier, A.; Peffer, T.; Mata, O.; Molina, A. Framework for Promoting Social Interaction and Physical Activity in Elderly People Using Gamification and Fuzzy Logic Strategy. In Proceedings of the 2019 IEEE Global Conference on Signal and Information Processing (GlobalSIP), Ottawa, ON, Canada, 11–14 November 2019; pp. 1–5. [Google Scholar]
- Ponce, P.; Meier, A.; Méndez, J.I.; Peffer, T.; Molina, A.; Mata, O. Tailored Gamification and Serious Game Framework Based on Fuzzy Logic for Saving Energy in Connected Thermostats. J. Clean. Prod. 2020, 262, 121167. [Google Scholar] [CrossRef]
- Méndez, J.I.; Ponce, P.; Meier, A.; Peffer, T.; Mata, O.; Molina, A. S4 Product Design Framework: A Gamification Strategy Based on Type 1 and 2 Fuzzy Logic. In Smart Multimedia; McDaniel, T., Berretti, S., Curcio, I.D.D., Basu, A., Eds.; Lecture Notes in Computer Science; Springer International Publishing: Cham, Switzerland, 2020; Volume 12015, pp. 509–524. ISBN 978-3-030-54406-5. [Google Scholar]
- Mendez, J.I.; Ponce, P.; Mata, O.; Meier, A.; Peffer, T.; Molina, A.; Aguilar, M. Empower Saving Energy into Smart Homes Using a Gamification Structure by Social Products. In Proceedings of the 2020 IEEE International Conference on Consumer Electronics (ICCE), Las Vegas, NV, USA, 4–6 January 2020; pp. 1–7. [Google Scholar]
- Mata, O.; Ponce, P.; McDaniel, T.; Méndez, J.I.; Peffer, T.; Molina, A. Smart City Concept Based on Cyber-Physical Social Systems with Hierarchical Ethical Agents Approach. In Universal Access in Human-Computer Interaction. Access to Media, Learning and Assistive Environments; Antona, M., Stephanidis, C., Eds.; Lecture Notes in Computer Science; Springer International Publishing: Cham, Switzerland, 2021; Volume 12769, pp. 424–437. ISBN 978-3-030-78094-4. [Google Scholar]
- Ponce, P.; Mendez, J.I.; Medina, A.; Mata, O.; Meier, A.; Peffer, T.; Molina, A. Smart Cities Using Social Cyber-Physical Systems Driven by Education. In Proceedings of the 2021 IEEE European Technology and Engineering Management Summit (E-TEMS), Dortmund, Germany, 18–20 March 2021; pp. 155–160. [Google Scholar]
- Méndez, J.I.; Ponce, P.; Miranda, O.; Pérez, C.; Cruz, A.P.; Peffer, T.; Meier, A.; McDaniel, T.; Molina, A. Designing a Consumer Framework for Social Products Within a Gamified Smart Home Context. In Proceedings of the Universal Access in Human-Computer Interaction. Design Methods and User Experience; Antona, M., Stephanidis, C., Eds.; Springer International Publishing: Cham, Switzerland, 2021; pp. 429–443. [Google Scholar]
- Bureau of Energy Efficiency. Energy Conservation in Building Space Cooling through Recommended Optimum Temperature Setting. 2018. Available online: https://cgda.nic.in/adm/circular/AN-XII-Enery-310818.pdf (accessed on 25 January 2022).
- Chou, Y. Actionable Gamification beyond Points, Badges, and Leaderboards; Packt Publishing Ltd.: Fremont, CA, USA, 2019; ISBN 978-1-83921-077-8. [Google Scholar]
- Rawat, W.; Wang, Z. Deep Convolutional Neural Networks for Image Classification: A Comprehensive Review. Neural Comput. 2017, 29, 2352–2449. [Google Scholar] [CrossRef] [PubMed]
- Jiao, L.; Zhang, F.; Liu, F.; Yang, S.; Li, L.; Feng, Z.; Qu, R. A Survey of Deep Learning-Based Object Detection. IEEE Access 2019, 7, 128837–128868. [Google Scholar] [CrossRef]
- Szegedy, C.; Liu, W.; Jia, Y.; Sermanet, P.; Reed, S.; Anguelov, D.; Erhan, D.; Vanhoucke, V.; Rabinovich, A. Going Deeper with Convolutions. In Proceedings of the IEEE Conference on Computer Vision and Pattern Recognition, Boston, MA, USA, 7–12 June 2015; pp. 1–9. [Google Scholar]
- He, K.; Zhang, X.; Ren, S.; Sun, J. Deep Residual Learning for Image Recognition. In Proceedings of the IEEE Conference on Computer Vision and Pattern Recognition, Las Vegas, NV, USA, 27–30 June 2016; pp. 770–778. [Google Scholar]
- Redmon, J.; Divvala, S.; Girshick, R.; Farhadi, A. You Only Look Once: Unified, Real-Time Object Detection. In Proceedings of the IEEE Conference on Computer Vision and Pattern Recognition, Las Vegas, NV, USA, 27–30 June 2016; pp. 779–788. [Google Scholar]
- Redmon, J.; Farhadi, A. YOLO9000: Better, Faster, Stronger. In Proceedings of the IEEE Conference on Computer Vision and Pattern Recognition, Honolulu, HI, USA, 21–26 July 2017; pp. 7263–7271. [Google Scholar]
- Redmon, J.; Farhadi, A. YOLOv3: An Incremental Improvement. arXiv 2018, arXiv:1804.02767. [Google Scholar]
- TensorFlow. 2021. Available online: https://www.tensorflow.org/ (accessed on 7 December 2021).
- Huang, S.-C.; Le, T.-H. Principles and Labs for Deep Learning; Academic Press: Cambridge, MA, USA, 2021. [Google Scholar]
- Team, K. Keras Documentation: Keras Layers API. 2021. Available online: https://keras.io/api/layers/ (accessed on 7 December 2021).
- Team, K. COCO—Common Objects in Context. 2021. Available online: https://cocodataset.org/#home (accessed on 7 December 2021).
- Xiao, H.; Rasul, K.; Vollgraf, R. Fashion-MNIST: A Novel Image Dataset for Benchmarking Machine Learning Algorithms. arXiv 2017, arXiv:1708.07747. [Google Scholar]
- ISO. ISO 9920:2007 Ergonomics of the Thermal Environment—Estimation of Thermal Insulation and Water Vapour Resistance of a Clothing Ensemble. 2007. Available online: https://www.iso.org/cms/render/live/en/sites/isoorg/contents/data/standard/03/92/39257.html (accessed on 2 October 2021).


| CNN | Characteristics | Author |
|---|---|---|
| AlexNet [9] | This CNN has eight layers: five convolutional layers connected by max-pooling layers, followed by three fully connected layers. Then, the CNN is divided into two stages, with the feature extraction part done by the convolutional layers and the classification part performed by the fully connected layers. This became the basis for image classifiers. | Alex Krizhevsky |
| VGG16 [15] | VGG16 consists of convolutional layers stacked on each other. This architecture does not change the size of the kernels in the convolutional layers and keeps it constant in a 3 × 3 value. | Researchers from the Oxford University |
| GoogleLeNet [42] or Inception | The designers proposed a Convolutional Network with a kernel size of 1 × 1 to reduce the image. Therefore, the CNN significantly reduced the number of parameters needed for the training. This architecture produced better results than the existing algorithms at that moment. | |
| ResNet [43] | This algorithm introduced the residual blocks, which are layers connected in which some weights skipped those convolutional layers. Therefore, deeper networks are implemented to get rid of the degradation problem. | Windows |
| YOLO [44,45] | YOLO stands for You Only Look Once and is a one-stage algorithm proposed in 2016. This algorithm eliminated the region proposals method of two-stage detector algorithms and instead produced bounding boxes. Thus, the probabilities of the object inside that bounding box belonged to that class. Although this algorithm presents lower accuracy than two-stage object detectors, it can be considered an accurate model. | Joseph Redmon |
| Tini YOLO [46] | Tiny YOLO is a modified version of YOLOv3 that keeps the algorithm’s speed while making it computationally less expensive. Thus, the embedded systems can have the trained model to produce predictions without expensive GPUs. | Joseph Redmon |
| Label | Description |
|---|---|
| 0 | Highly insulating jacket |
| 1 | Highly insulating shoes |
| 2 | Jacket |
| 3 | Shirt |
| 4 | Trousers |
| 5 | Shoes |
| 6 | Hat |
| 7 | Skirt |
| Label | Garment | (clo) 1 | (m2 C/W) |
|---|---|---|---|
| 0 | Highly insulating jacket, multicomponent | 0.40 | 0.062 |
| 1 | Highly insulating shoes, boots | 0.10 | 0.016 |
| 2 | Jacket, no buttons | 0.26 | 0.040 |
| 3 | T-Shirt | 0.09 | 0.010 |
| 4 | Trousers (straight, fitted) | 0.19 | 0.029 |
| 5 | Shoes [1] | 0.04 | 0.006 |
| 6 | Warm winter cap | 0.03 | 0.00 |
| 7 | A-Line, knee-length | 0.15 | 0.023 |
| Model | Training Accuracy (%) | Validation Accuracy (%) | Test Precision (%) | Test Recall (%) | F1 Score |
|---|---|---|---|---|---|
| VGG16 | 76.16 | 75.17 | 75.85 | 75.85 | 75.85 |
| Inception | 96.0 | 94.76 | 95.18 | 95.07 | 95.12 |
| ResNet | 99.9 | 92.71 | 95.46 | 92.85 | 94.14 |
| TinyYOLOs | 99.48 | 91.11 | 91.07 | 91.10 | 91.08 |
| Model | Top Class Probability | Other Classes | Time |
|---|---|---|---|
| Test photo 1 | |||
| TinyYOLOs | Bag | Shirt, Pullover | 53 |
| VGG16 | T-shirt/top | 60 | |
| Inception | Shirt | Pullover, Trouser | 32 |
| ResNet | Shirt | 50 | |
| Test photo 2 | |||
| TinyYOLOs | Bag | T-shirt/top, Shirt | 57 |
| VGG16 | T-shirt/top | 68 | |
| Inception | Shirt | Pullover | 46 |
| ResNet | Shirt | 47 | |
| Test photo 3 | |||
| TinyYOLOs | Shirt | Bag, Pullover | 48 |
| VGG16 | Bag | 65 | |
| Inception | Shirt | Pullover | 57 |
| ResNet | Shirt | 48 | |
| TinyYOLOl | Coat | Pullover | |
| Test photo 4 | |||
| TinyYOLOs | Bag | Trouser, Shirt | 53 |
| VGG16 | Ankle Boot | 68 | |
| Inception | Shirt | Pullover | 48 |
| ResNet | Shirt | 47 | |
| TinyYOLOl | Pullover | ||
| Test photo 5 | |||
| TinyYOLOs | Bag | Shirt, Pullover | 52 |
| VGG16 | T-shirt/top | 72 | |
| Inception | Shirt | Pullover, Trouser | 50 |
| ResNet | Shirt | 40 | |
| TinyYOLOl | Coat | Pullover | |
Publisher’s Note: MDPI stays neutral with regard to jurisdictional claims in published maps and institutional affiliations. |
© 2022 by the authors. Licensee MDPI, Basel, Switzerland. This article is an open access article distributed under the terms and conditions of the Creative Commons Attribution (CC BY) license (https://creativecommons.org/licenses/by/4.0/).
Share and Cite
Medina, A.; Méndez, J.I.; Ponce, P.; Peffer, T.; Meier, A.; Molina, A. Using Deep Learning in Real-Time for Clothing Classification with Connected Thermostats. Energies 2022, 15, 1811. https://doi.org/10.3390/en15051811
Medina A, Méndez JI, Ponce P, Peffer T, Meier A, Molina A. Using Deep Learning in Real-Time for Clothing Classification with Connected Thermostats. Energies. 2022; 15(5):1811. https://doi.org/10.3390/en15051811
Chicago/Turabian StyleMedina, Adán, Juana Isabel Méndez, Pedro Ponce, Therese Peffer, Alan Meier, and Arturo Molina. 2022. "Using Deep Learning in Real-Time for Clothing Classification with Connected Thermostats" Energies 15, no. 5: 1811. https://doi.org/10.3390/en15051811
APA StyleMedina, A., Méndez, J. I., Ponce, P., Peffer, T., Meier, A., & Molina, A. (2022). Using Deep Learning in Real-Time for Clothing Classification with Connected Thermostats. Energies, 15(5), 1811. https://doi.org/10.3390/en15051811