
A Concept of Risk Prioritization in FMEA Analysis for Fluid Power Systems


1
Faculty of Mechanical Engineering, Cracow University of Technology, Al. Jana Pawla II 37, 31-864 Cracow, Poland
2
Department of Mechanical and Marine Engineering, Western Norway University of Applied Sciences, N5020 Bergen, Norway
*
Author to whom correspondence should be addressed.
Energies 2021, 14(20), 6482; https://doi.org/10.3390/en14206482
Submission received: 19 August 2021
/
Revised: 2 October 2021
/
Accepted: 2 October 2021
/
Published: 10 October 2021
(This article belongs to the Special Issue Advances in Fluid Power Systems)
Abstract
:FMEA analysis is a tool of quality improvement that has been widely used for decades. Its classical version prioritizes risk of failure by risk priority number (RPN). The RPN is a product of severity (S), occurrence (O), and detection (D), where all of the factors have equal levels of significance. This assumption is one of the most commonly criticized drawbacks, as it has given unreasonable results for real-world applications. The RPN can produce equal values for combinations of risk factors with different risk implications. Another issue is that of the uncertainties and subjectivities of information employed in FMEA analysis that may arise from lack of knowledge, experience, and employed linguistic terms. Many alternatives of risk assessment methods have been proposed to overcome the weaknesses of classical FMEA risk management in which we can distinguish methods of modification of RPN numbers of employing new tools. In this study, we propose a modification of the traditional RPN number. The main difference is that severity and occurrence are valued based on subfactors. The detection number remained unchanged. Additionally, the proposed method prioritizes risk in terms of implied risk to the systems by implementing functional failures (effects of potential failures). A typical fluid power system was used to illustrate the application of this method. The method showed the correct failure classification, which meets the industrial experience and other research results of failures of fluid power systems.
1. Introduction
Fluid power systems find wide industrial applications as drive or control systems. Due to their advantage, they can perform various functions, including those that may directly impact human safety or as a crucial component in applications that require high reliability. They have been used in aerospace applications as a vital component of aircraft, rockets, and spaceships to actuate critical flight components: actuating flaps, brakes, and landing gears, opening/closing doors, etc. The marine industry uses hydraulics for controlling ships and deck appliances such as winches, cranes, or hatch covers. They found applications in metal making machinery, in production lines, as presses, or other machine tools. They are broadly used in mobile machinery such as cranes, excavators, earth-moving equipment, and automobiles. The mining industry utilized hydraulics in drilling equipment for oil and gas extraction. The energy industry employs hydraulic systems in control systems of wind and water turbines and other processes. Depending on the applications, they can have different levels of complexity and use purely mechanical–hydraulic or electromechanical–hydraulic systems. High power density and almost unconstrained flexibility are the main advantages of these systems, making them peerless to mechanical or electrical power systems. Fluid power is not a new technology, but, complemented with the electronic control system [1], it offers new possibilities and can be one of the leaders among drive systems. Fluid power systems and their components must be highly reliable, their potential failures must be recognized early and investigated, and corrective plans must be prepared. Research on their failures and reliability is conducted using qualitative and quantitative tools and methods individually or together [2,3,4]. One of the widely used methods is the FMEA (failure modes and effects analysis). The origin of the FMEA analysis is dated to the 1950s when it was formalized in the military standard [5]. It found practical application during the NASA Apollo mission and in the automotive industry in the 1980s and finally became a part of international standards: ISO 9000 and SAE 1793 [6]. The FMEA method was an inspiration for other methods and tools such as RCM (reliability center management), concept FMEA and FMEDA [7].
One of the steps of FMEA analysis is a risk evaluation, which, in its conventional form, is calculated using three risk factors: severity (S), occurrence (O), and detection (D). Severity is defined as the ranking of the end effect of failure mode to the system. Occurrence is defined as the likelihood of failure occurrence. Detection is the possibility of failure detection. These risks factors are quantified by experts with integer numbers from 1 to 10 each. The risk of individual failure mode is evaluated using risk priority number (RPN), which is a product of the aforementioned risk factors. A higher RPN value defines a higher risk of related failure modes. However, this approach is widely questioned due to several limitations. The equally weighted risk factors may produce the same RPN number for various combinations of S, O, and D, which may have different risk implications. The utilization of only three factors and related failure modes is also criticized as ineffective. Another problem of conventional FMEA is data uncertainty and subjectivity. All information in FMEA analysis is delivered by a group of experts who have to assign linguistic terms to exact numbers and rely on their own knowledge and experience. All shortcomings of traditional FMEA analysis are widely summarized in previous work [8]. To overcome the FMEA drawbacks, alternatives methods are implemented. The systematic literature review of employed methods was presented by Liu et al. [9]. The main trends which are observed to overcoming drawbacks of traditional FMEA are:
Risk assessment is performed by different methods and with the utilization of various tools. The most common methods that concurrently resolves problems with information uncertainty are:
- 1.
- 2.
- 3.
- 4.
The FMEA is a hierarchical multicriteria decision-making (MCDM) process that can utilize decision-making tools. Literature review indicates that the following methods mainly find application in risk analysis:
- 1.
- Distance-based methods:
- 2.
- Piecewise comparison method (analytical hierarchy process: AHP and others).
- 3.
- Aggregation operator-based methods.
- 4.
- Relation analysis methods.
The drawbacks of FMEA analysis were not only recognized by scholars but also by industry, which led to employing ACP (action priority number) in FMEA analysis in the latest automotive standard [30].
Although many attempts have been made and new methods implemented to defeat the weaknesses of classical RPN, a risk assessment in FMEA is still a challenge. All information used in FMEA is delivered by experts who have to rely on their knowledge and/or experience what along with linguistic evaluation methods that can lead to a high level of uncertainty and subjectivity. It also implies that the results of FMEA analysis are unique for specific problems and can not be extended on similar cases. Methods proposed by scholars are too complex or computationally intensive to be employed in the practice. To overcome the aforementioned shortcomings, we proposed a method that combines known methods as a division of severity and occurrence into subfactors and risk prioritization based on associated risk to the system. The severity in the proposed method is calculated based on component importance, failure effect, and factor, which define a relationship to the other failures. The occurrence number was replaced by a failure predictor, which uses a base failure rate, and modification factors, which take into account the influence of size, load, working conditions, and operating time. The detection number is estimated in the traditional way. Risk is evaluated for classified functional failures that directly correspond with system risk. The proposed method is analogous to the conventional FMEA, easy to use, and can reduce uncertainties of severity and occurrence caused by expert subjectivities.
2. Methodology
2.1. Assumptions
The primary purpose of this study was a qualitative analysis of failure modes, failures, and their end effects for fluid power systems. Failures in fluid power components are complex, and primary failure may only trigger the final failure. In this method, only primary forms of failures were assumed. The analysis was carried out only for primary mechanical failures. The electrical components were omitted.
Investigated fluid power system utilizes typical components for mobile fluid power systems without any diagnostic systems. The primary form of failure detection is a visual inspection. Additionally, access to system components is relatively easy and can be compared to a hydraulic system for mobile machinery (e.g., excavator).
We assume that investigated system already exists and only a few essential data are available.
2.2. Method
In the presented method, we define criticality in a similar way to traditional risk priority number (RPN) as a product of severity S, a failure predictor P, and detection D:
where , . All three are valued with numbers from 1 to 20.
We can calculate severity S as a product of component importance , failure which can appear in the component and modification factor :
Component importance defines how an individual component is important to the system for a specified criterion. It can be safety or ability to perform the specific function. We assumed that components are valued in the way similar to that which was presented in our previous study [31]:
- Main components. They are essential for performing the intended function.
- Major components. They ensure the proper operation of the system. Their possible failures may cause the system to malfunction, but its main task is still maintained.
- Additional components. Their failure has little effect on the main task of the system.
The component importance reaches values 1–4, where 1 is the lowest importance.
Failure describes the final effect that failure brings in the component. Potential failures were classified and valued in the following way:
- Catastrophic: major damages with component destruction–4.
- Critical: component malfunction with severe damages–3.
- Marginal: component malfunction with minor damages–2.
- Minor: less than minor damages–1.
Modification factor is an influencing factor that tells which component may influence others in the system in case of failure. It reaches value 1–1.25, where value 1 means that potential failures in the component do not influence others. Failure predictor P is expressed as:
where is a base failure rate, is failure modification factor, is a time factor.
We utilize the failure rate value that is commonly used in reliability and maintainability to rank components in the system. We assumed that the failure rate for individual components is the estimator of its possible failure. The real value of base failure rates for the system components [32] were assigned to individual components and renormalized to scale 1–5. Value 1 indicates a component that unlikely fails, while 5 indicates a component with highly expected failure. The value of failure rate for fluid power components according to handbook [32] depends on the following:
- Size (s).
- Operating pressure (p).
- Leakage value ().
- Temperature.
- Fluid contamination.
Factors “Temperature” and “Fluid Contamination” were joined to one factor, “Environment” (), which considers working conditions as an equivalent of both. Besides primary and internal (in-operation) oil contamination, the ingressed (or external) contamination is also recognized as one of the main sources as states by industry [33,34,35].
To include the above factors, we implemented an equivalent scale defined in the following way:
- Very high.
- High.
- Moderate.
- Minor.
Due to components’ different structures and performed functions, we can not use one uniform evaluations scale. However, the scale mentioned above was adapted to the individual features of the components. Factor “Size” for hydraulic pumps depends on their volumetric displacement:
- Very high, volumetric displacement > 125 dm3.
- High, volumetric displacement 80–125 dm3.
- Moderate, volumetric displacement 21–79 dm3.
- Minor, volumetric displacement 1–20 dm3.
Factor “Size” for hydraulic actuators depends on their piston diameter:
- Very high, piston diameter > 200 mm.
- High, piston diameter 160–200 mm.
- Moderate, piston diameter 41–159 mm.
- Minor, piston diameter < 40 mm.
Factor “Size” for valves depends on their nominal size:
- Very high, nominal size > 16 mm.
- High, nominal size 12–16 mm.
- Moderate, nominal size 6–10 mm.
- Minor, nominal size < 6 mm.
Factor “Size” for accumulators depends on their nominal volume:
- Very high, nominal volume > 50 dm3.
- High, nominal volume 24–49 dm3.
- Moderate, nominal volume 6–23 dm3.
- Minor, nominal volume < 6 dm3.
Factor “Size” for pipes and hoses depends on their nominal or outside diameter:
- Very high, pipe outside diameter > 30 mm, hose nominal diameter > 38 mm.
- High, pipe outside diameter 22–30 mm, hose nominal diameter 20– 32 mm.
- Moderate, pipe outside diameter 12–20 mm, hose nominal diameter 10–16 mm.
- Minor, pipe outside diameter <12 mm, hose nominal diameter <10 mm.
Factor “Operating pressure” was defined in the following way:
- Very high, operating pressure > 50 MPa.
- High, operating pressure 21–49 MPa.
- Moderate, operating pressure 6–20 MPa.
- Minor, operating pressure < 6 MPa.
Factors “Leakage” is directly connected with manufacturing aspects (tolerances, surface quality, manufacturing methods, materials) and is described as:
- Very high, very high tolerances and surface finishing for providing internal tightness: piston pump, slide-type valves.
- High, high tolerances and surface finishing: gear and vane pumps, poppet-type valves, hydraulic actuators.
- Moderate, higher than typical manufacturing requirements: pipes, hoses, accumulators.
- Minor, typical manufacturing requirements: tanks, filters.
The factor “Environment” is defined in the following way:
- Very high, extreme dusty or chemically aggressive environmental conditions with large temperature variations.
- High, dusty environment, temperature variations.
- Moderate, moderate environmental conditions.
- Minor, small influence of environmental conditions.
In general, we can calculate the failure rate for the system based on the failure rate of system components [36]. For a serial system, the total reliability is a sum of the failure rate for individual components:
For a parallel system, it is a product:
For the majority of fluid power components, base failure rate is available [32]. The failure rate for the accumulator can be calculated as a sum of individual components (as a serial system):
where is a failure rate for static sealing, is a failure rate for spring, is a failure rate for piston–cylinder interface, is a failure rate for valve, and is a failure rate for cylinder wall.
For a diaphragm-type accumulator, the failure rate can be simplified to the following formula:
For hydraulic actuator, the flow rate can be calculated from the following formula [32]:
where
and is a failure rate for a dynamic seals. N is a number of wear cycles.
The number of cycles was estimated assuming that the equipment pressure should withstand the number of infinite fatigue strength, which is 2 × according to [37]. Research shows that fatigue failures may occur much sooner [38,39]. Another reported failure is leaking due to the sealing failure [40]. The values of base failure rates (in failures/million cycles) for other hydraulic components is presented below [32]:
- 1.
- Valves:
- spool type: ;
- poppet type: .
The values mentioned above are addressed to direct-operated valves. For pilot-operated, we can calculate failure rate as a sum of the pilot valve and main valve. In the simplest case (pilot and main valve are the same types), we can assume that the pilot-operated valve failure rate is twice more than a direct-operated value. - 2.
- Seals:
- static: ;
- dynamic: .
- 3.
- Pumps:
- piston: ;
- gear: ;
- vane: .
- 4.
- Pipe: .
- 5.
- Hose: .
- 6.
- Accumulator (diaphragm type): .
- 7.
- Hydraulic oil: as a common practice, hydraulic oil has to be replaced much sooner than any failure in components may occur. Therefore, the value of the failure rate was set as maximal from other components in the system.
All of the above-mentioned factors were evaluated using the below scale:
- Very high: 9–10.
- High: 6–8.
- Moderate: 3–5.
- Minor: 1–2.
and then were renormalized to new scales according to Formula [41]:
The “Size” (s) factor value is 1–1.25, the “Operating pressure” (p) factor value is 1–1.25, the “Leakage” factor () value is 1–1.12, and the “Environmental” factor () is 1.14. The range of factors range is not equal because operating pressure and size plays more important role than leakage and environmental conditions. The time factor () allows for distinguishing components with different operating time regimes. The range is 1–2. To make all data easier to identify and recognize, we prepared a practical chart presented in Figure 1.
The chart above includes the pairwise comparison matrix, which is used to evaluate component modification factor . The weights factors were calculated in the following way:
were next renormalized to range 1–1.25.
We evaluated the detection D in a similar way to classic FMEA analysis with values 1–20:
- detection of failure is almost certain: 1–2
- detection is very high: 3–5
- detection is high: 6–8
- detection is moderate high: 9–11
- detection is moderate: 12–13
- detection is very low: 14–15
- detection is remote: 16–17
- very remote: 18–19
- detection is nearly not possible: 20.
3. Case Study
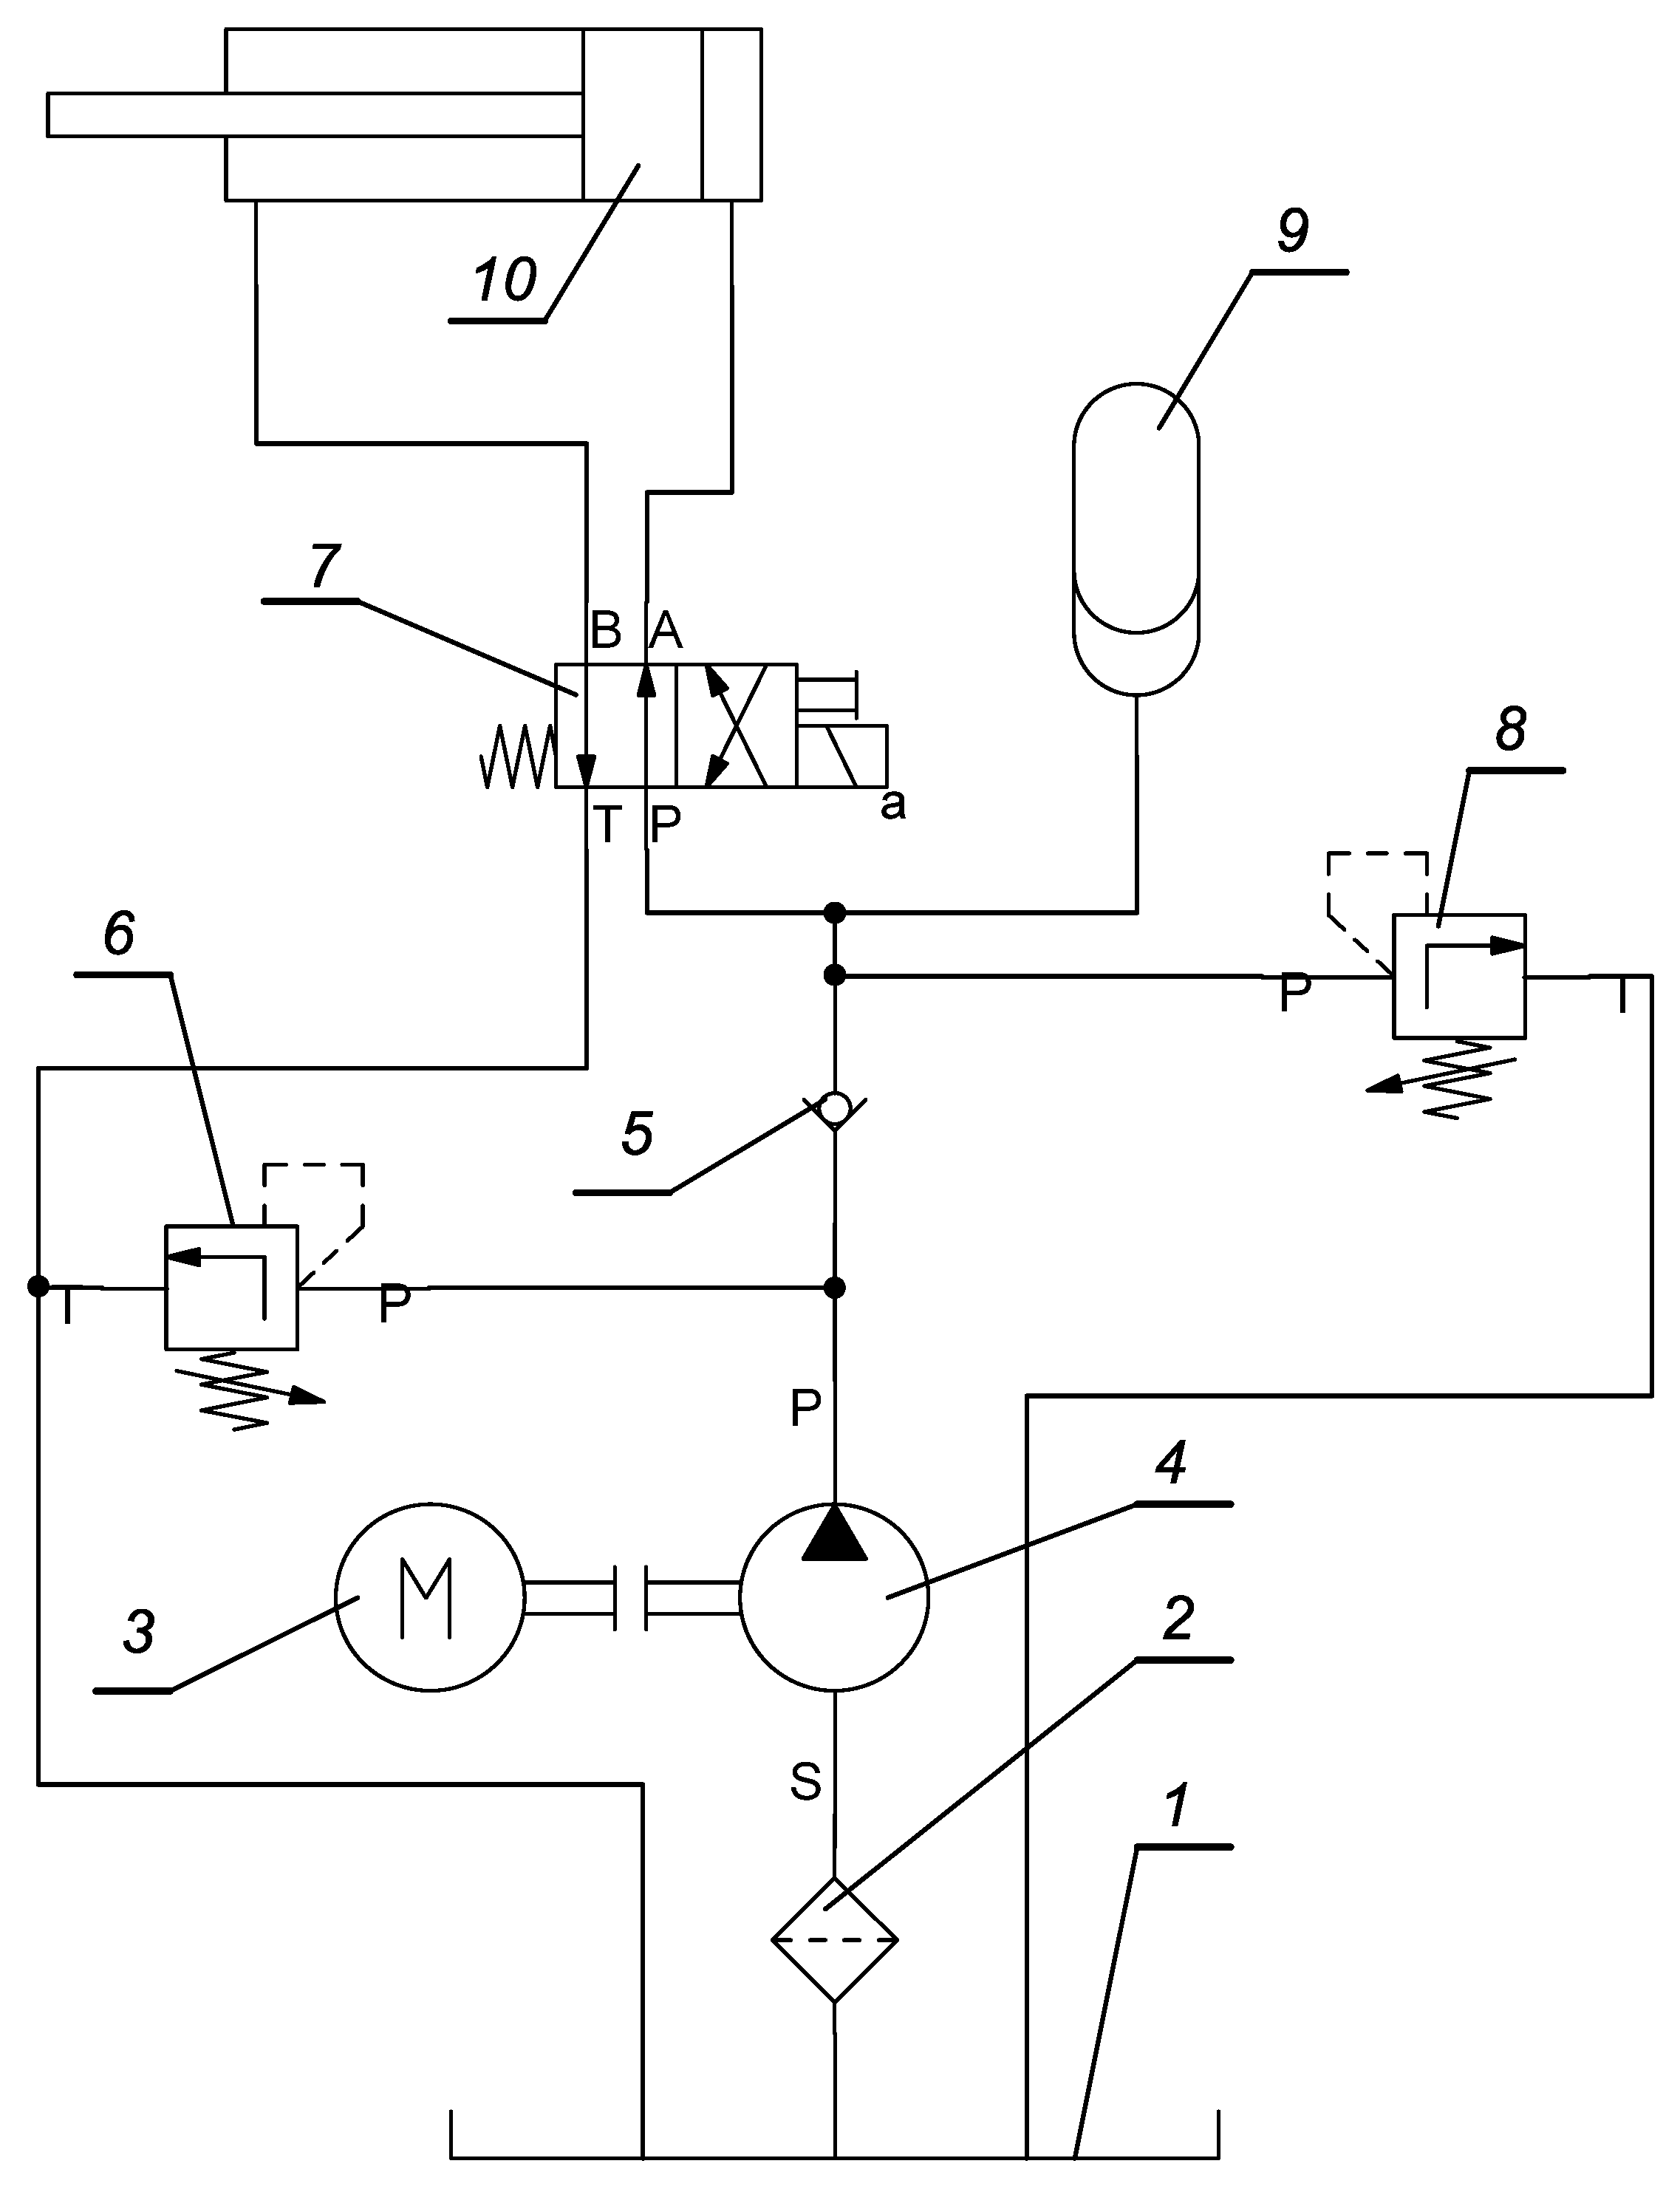
An example of typical hydraulic system, presented in Figure 2, that includes typical fluid power components was used in this study. It is a hydraulic system that utilizes an accumulator as an auxiliary power source.
The presented system’s main task is to convert pressure energy into linear displacement of the hydraulic cylinder and actuate the component of a mechanical system (e.g., boom or arm of an excavator). The motor (3) drives a pump (4) and sucks hydraulic oil from the reservoir (1). Before passing the pump, the fluid is cleaned in the filter (2). The pump displaces the liquid to the hydraulic cylinder (10) through the check valve (5) and the directional control valve (7). The check valve (5) secures the system against the back flow. The hydraulic cylinder is a double-action actuator in which fluid acts on both sides of the piston. One side is connected with the supply line (with the pump) while the other is the drain (reservoir). Both ports can be alternatively connected to the supply line by switching a spool position of the control valve (7). In that way, the direction of piston rod movement is determined. The relief valve (6) plays a role of a safety valve in the system and secures the pump against excessive pressure. The other relief valve (8) sets the working pressure. The accumulator (9) is connected parallel to the supply line and is an auxiliary power source. During each operating cycle, the accumulator is charged and release fluid on power demand. Fluid is delivered to all components via rigid pipes or hoses, or both. The directional control valve (7) and relief valve (8) are components of the control system. Reservoir (1), filter (2), and pump (4) are components that generate pressure energy. Pipes or/and hoses transmit energy to the hydraulic cylinder (10), where fluid energy is converted into mechanical energy.
The following components were used in further analysis:
- 1.
- tank (reservoir) (item 1);
- 2.
- filter (item 2);
- 3.
- pump (item 4);
- 4.
- check valve (item 5);
- 5.
- relief valve (direct-operated) (item 6);
- 6.
- relief valve (pilot-operated) (item 8);
- 7.
- directional control valve (spool type) (item 7);
- 8.
- pipe ;
- 9.
- hose ;
- 10.
- accumulator (item 9);
- 11.
- actuator (hydraulic cylinder) (item 10);
- 12.
- oil (as a component of energy transfer) .
Failures that can occur for the above-mentioned components are as follows [42]:
- 1.
- fracture ;
- 2.
- deformation ;
- 3.
- loosening ;
- 4.
- extreme contamination ;
- 5.
- properties ;
- 6.
- wear ;
- 7.
- corrosion ;
- 8.
- ageing/hardening ;
- 9.
- aeration ;
- 10.
- contamination ;
- 11.
- properties changes ;
- 12.
- cavitation .
At the next step, we defined the system functional failures . The functional failure is understood as a system state (failure) that is categorized in the following way:
- 1.
- System is not able to perform intended function .
- 2.
- System is partially able to perform intended function. Major failure occurs .
- 3.
- System is able to perform intended function. Minor failure occurs .
4. Results
Data from Table A1 along with failure values were allowed for calculating the criticality number . The ranking lists were created for each functional failure and are presented on Table 4, Table 5 and Table 6. Oil contamination or aeration appears six times among first five ranks for all functional failures. Pump and actuator failures were also recognized as components, which can lead to presented system failures.
5. Discussion
Criticallity number for pair contamination–oil reached the highest value among all failure–component pairs. Almost all failures and related components for functional failure () that are critical to the system are valued lower than for others functional failures (). There are two reasons responsible for this situation. The first one is the detection number. The “fracture” failure for almost all components can be easily detected—for some, even without any instruments. The second reason is the components prioritization method that is realized by performed function, failure rate, and working regime. The tank, which is recognized as a highly reliable component, can be a source of critical failure for the system. Another aspect is that the components which play auxiliary functions and being in use occasionally (e.g., valve ) when failing make the system unable to operate. Failures that cause fluid losses are critical to the whole system and even if they occur in the component graded as secondary or minor. Treating such components with the highest importance can lead to overestimating other failures for these components. The nature of almost all failures for critical system failure is random and unpredictable caused by sudden and extreme overload or hidden material/manufacturing and design flaws.
The first two criticality numbers for , which is less risky for the system than others, reached higher values than fourth rank in . Other pairs of failures and the corresponding components are higher for than . This is caused by the intensity and exposure which determine the final effect, which can be marginal (at initial stages of wear, cavitation, and corrosion) or major after long exposure.
Presented results show that risk prioritization assigned to the system risk allows avoiding underestimating or overestimating potential failures for related components.
In all three functional failures, oil contamination plays the main role and should be recognized as a main problem of fluid power systems. It agrees with practical experience and also with the results of research presented in study [2] where failure analysis was conducted for a hydraulic system of a heavy-duty machine. The failure analysis in this work was conducted with more sophisticated methods and tools than the presented method: fault tree analysis, Dempster–Shafer theory, and rough set theory to fill were implemented to eliminate the incompleteness and the uncertainty delivered by experts.
The comparison of the presented method and conventional RPN approach was conducted for the severity factor, which in the proposed method is calculated according to Equation (2). To the comparison, we used failure: fracture that can occur in all of the system’ components. The end effect of this failure for all of the components leads to critical system failure, which is unable to perform the intended function. As such, it should be ranked with maximal value according to the traditional RPN approach. The comparison of RPN value is presented in the Table 7.
The occurrence number may mainly depend on a subjective opinion of an expert (or experts), their knowledge and/or experience, and/or availability of relevant data. It means that the occurrence number may be scattered inside a wide range. The proposed method adopts quantitative data, including the essential information about components, which produce the occurrence number with less sensitivity to expert knowledge and/or experience.
The detection number in both methods are estimated in the same way.
Limitations of the method.
Although the structural design of fluid power components has remained unchanged for decades, the trend to implementing electronic control and diagnostic system can be observed recently. It brings new possibilities for system diagnostic and its management and makes the components are no longer purely mechanical/fluid but are more sophisticated. Additionally, new manufacturing methods and materials are implemented; thus, base failure rates from this study may not fit the latest components design. Furthermore, the values of base failure rates do not recognize differences in component structures or material and cannot evaluate the same component with various solutions separately. Another limitation of the presented method is its applicability only to components for which base failure rate is available. Those for which is unavailable would have to be estimated what can increase the level of uncertainty.
The proposed method can calculate the same criticality numbers for a few different components and corresponding failures. It can be overcome by detailed failures definition, which is sometimes problematic. Fluid power components encounter mechanical and fluid flow failures, which are too complex for easy identification.
6. Conclusions
FMEA analysis and its modification play an essential role in increasing reliability and safety despite the drawbacks, which, in classical FMEA analysis, is undoubtedly risk evaluation and uncertainties. In this study, a proposal of risk assessment for fluid power systems has been presented; its main aim was implementing a prioritization method of failures based on quantitative data. A classical risk priority number has been extended with modification factors for severity, while occurrence was replaced by a failure predictor, which uses failure rate value and corrective factors. The detection remained unchanged with classical risk prioritization. The severity number in the proposed method is calculated as a product of component importance, their influence on other components, and failure effects. It allows for prioritizing components that can be nondistinguishable in the classical RPN method. The proposed method’s main application is a design stage or situation where details of the system components are unavailable. Therefore, the occurrence number is replaced by a failure predictor, which defines the likelihood of failure based on failure rate value and modification factors. These were determined based on specifications of typical components systems for mobile fluid power systems. If relevant data about components are available, the failure rate can be more precisely described. The proposed method was employed in a typical fluid power system which consists of common components and can be extended to any fluid power system. Modification factors presented in this study are universal and applicable for other systems of fluid power. Failure modes of individual components were classified into system functional failure (effects of component failure modes) to avoid underestimating failures whose consequences are catastrophic to the system. Obtained results allowed identify the most common failure for a considered hydraulic circuit, which agreed with research conducted by more sophisticated tools and methods and proved the usefulness presented method.
Author Contributions
Conceptualization, J.F.-D. and M.D.; methodology, J.F.-D.; software, H.M.; validation, M.D., J.F.-D. and H.M.; formal analysis, J.F.-D.; investigation, J.F.-D.; resources, J.F.-D.; data curation, M.D.; writing—original draft preparation, M.D.; writing—review and editing, H.M.; visualization, H.M.; supervision, M.D.; project administration, J.F.-D.; funding acquisition, H.M. All authors have read and agreed to the published version of the manuscript.
Funding
This research received no external funding.
Institutional Review Board Statement
Not applicable.
Conflicts of Interest
The authors declare no conflict of interest.
Abbreviations
The following abbreviations are used in this manuscript:
| MDPI | hlMultidisciplinary Digital Publishing Institute |
| DOAJ | Directory of open access journals |
| MIL-STD | US Defense Standard |
| FMEA | Failure Modes and Effects Analysis |
| FMEDA | Failure Modes, Effects, and Diagnostic Analysis |
| FMCA | Failure Modes, Effects, and Criticality Analysis |
| NASA | National Aeronautics and Space Administration |
| RPN | Risk Priority Number |
| ISO | International Organization for Standardization |
| MCDM | Multicriteria Decision-Making |
Appendix A

Table A1.
Data chart.
| 4.0 | 4.0 | 4.0 | 4.0 | 3.0 | 3.0 | 4.0 | 4.0 | 4.0 | 2.0 | 4.0 | 4.0 | ||||||||
|---|---|---|---|---|---|---|---|---|---|---|---|---|---|---|---|---|---|---|---|
| p | s | ||||||||||||||||||
| 2 | 1.00 | 1.00 | 1.00 | 1.00 | 1.00 | 1.0 | 0.5 | 0.0 | 0.0 | 0.0 | 0.0 | 0.0 | 0.0 | 0.0 | 0.0 | 0.0 | 0.7 | 1.06 | |
| 2 | 1.36 | 1.02 | 1.00 | 1.00 | 1.00 | 0.0 | 1.0 | 0.0 | 0.0 | 0.0 | 0.0 | 0.0 | 0.0 | 0.0 | 0.0 | 0.0 | 0.3 | 1.01 | |
| 2 | 1.15 | 1.12 | 1.02 | 1.25 | 1.25 | 0.0 | 0.0 | 1.0 | 0.7 | 0.7 | 0.7 | 0.7 | 0.3 | 0.1 | 0.5 | 0.7 | 0.9 | 1.25 | |
| 2 | 1.56 | 1.08 | 1.02 | 1.25 | 1.13 | 0.0 | 0.0 | 0.0 | 1.0 | 0.0 | 0.3 | 0.3 | 0.0 | 0.0 | 0.0 | 0.0 | 0.5 | 1.05 | |
| 1 | 1.56 | 1.09 | 1.02 | 1.25 | 1.13 | 0.0 | 0.0 | 0.0 | 0.0 | 1.0 | 0.0 | 0.0 | 0.0 | 0.0 | 0.0 | 0.0 | 0.3 | 1.01 | |
| 2 | 2.12 | 1.11 | 1.02 | 1.25 | 1.13 | 0.0 | 0.0 | 0.0 | 0.0 | 0.0 | 1.0 | 0.0 | 0.0 | 0.0 | 0.0 | 0.3 | 0.5 | 1.04 | |
| 2 | 1.54 | 1.12 | 1.02 | 1.25 | 1.13 | 0.0 | 0.0 | 0.0 | 0.0 | 0.0 | 0.0 | 1.0 | 0.0 | 0.0 | 0.0 | 0.5 | 0.5 | 1.05 | |
| 2 | 1.08 | 1.03 | 1.05 | 1.25 | 1.25 | 0.0 | 0.0 | 0.0 | 0.0 | 0.0 | 0.0 | 0.0 | 1.0 | 0.0 | 0.0 | 0.0 | 0.0 | 1.00 | |
| 2 | 1.28 | 1.03 | 1.06 | 1.25 | 1.25 | 0.0 | 0.0 | 0.0 | 0.0 | 0.0 | 0.0 | 0.0 | 0.0 | 1.0 | 0.0 | 0.0 | 0.1 | 1.00 | |
| 2 | 1.55 | 1.03 | 1.06 | 1.25 | 1.25 | 0.0 | 0.0 | 0.0 | 0.0 | 0.0 | 0.0 | 0.0 | 0.0 | 0.0 | 1.0 | 0.3 | 0.0 | 1.01 | |
| 2 | 5.00 | 1.12 | 1.14 | 1.25 | 1.25 | 0.0 | 0.0 | 0.0 | 0.0 | 0.0 | 0.0 | 0.0 | 0.0 | 0.0 | 0.0 | 1.0 | 0.5 | 1.02 | |
| 2 | 5.00 | 1.00 | 1.11 | 1.00 | 1.00 | 0.0 | 0.3 | 0.9 | 0.7 | 0.1 | 0.7 | 0.7 | 0.5 | 0.5 | 0.3 | 0.7 | 1.0 | 1.25 |
References
- Kushwaha, P.; Dasgupta, K.; Ghoshal, S.K. A comparative analysis of the pump controlled, valve controlled and prime mover controlled hydromotor drive to attain constant speed for varying load. ISA Trans. 2021, 14. in press. [Google Scholar]
- Li, S.; Yang, Z.; Tian, H.; Chen, C.; Zhu, Y.; Lu, S. Failure Analysis for Hydraulic System of Heavy-Duty Machine Tool with Incomplete Failure Data. Appl. Sci. 2021, 14, 1249. [Google Scholar] [CrossRef]
- Lee, Y.; Lee, G.; Yang, J.; Park, J.; Baek, D. Failure analysis of a hydraulic power system in the wind turbine. Eng. Fail. Anal. 2020, 107, 104218. [Google Scholar] [CrossRef]
- Guo, Y.; Xiong, G.; Zeng, L.; Li, Q. Modeling and Predictive Analysis of Small Internal Leakage of Hydraulic Cylinder Based on Neural Network. Energies 2021, 14, 2456. [Google Scholar] [CrossRef]
- MIL-P 1629. USA Military Standard, Procedure for Performing a Failure Mode, Effects and Criticality Analysis (MIL-P 1629, USA); Military Specifications and Standards: Washington, DC, USA, 1949. [Google Scholar]
- J1739 200901. Potential Failure Mode and Effects Analysis in Design (Design FMEA), Potential Failure Mode and Effects Analysis in Manufacturing and Assembly Processes (Process FMEA); SAE International: Warrendale, PA, USA, 2009. [Google Scholar]
- Carlson, C.S. Effective FMEAs: Achieving Safe, Reliable, and Economical Products and Processes Using Failure Mode and Effects Analysis; John Wiley & Sons, Inc.: Hoboken, NJ, USA, 2012. [Google Scholar]
- Liu, H.C.; Liu, L.; Liu, N. Risk evaluation approaches in failure mode and effects analysis: A literature review. Expert. Syst. Appl. 2013, 40, 828–838. [Google Scholar] [CrossRef]
- Liu, H.C.; Chen, X.; Dua, C.; Wang, Y. Failure mode and effect analysis using multi-criteria decision making methods: A systematic literature review. Comput. Ind. Eng. 2019, 135, 881–897. [Google Scholar] [CrossRef]
- Koomsap, P.; Charoenchokdilok, T. Improving risk assessment for customer-oriented FMEA. Total Qual. Manag. Bus. Excell. 2018, 29, 1563–1579. [Google Scholar] [CrossRef]
- Anes, V.; Henriques, E.; Freitas, M.; Reis, L. A new risk prioritization model for failure mode and effects analysis. Qual. Reliab. Eng. Int. 2018, 34, 516–528. [Google Scholar] [CrossRef]
- Lo, H.W.; Liou, J.J.H. A novel multiple-criteria decision-making-based FMEA model for risk assessment. Appl. Soft Comput. 2016, 73, 684–696. [Google Scholar] [CrossRef]
- Chen, J.K. Prioritization of Corrective Actions from Utility Viewpoint in FMEA Application. Qual. Reliab. Eng. Int. 2018, 33, 883–894. [Google Scholar] [CrossRef]
- Pancholi, N.; Bhatt, M. FMECA-based maintenance planning through COPRAS-G and PSI. J. Qual. Maint. Eng. 2018, 24, 224–243. [Google Scholar] [CrossRef]
- Wang, Z.; Gao, J.; Wang, R.; Chen, K.; Gao, Z.; Zheng, W. Failure Mode and Effects Analysis by Using the House of Reliability-Based Rough VIKOR Approach. IEEE Trans. Reliab. 2018, 67, 230–248. [Google Scholar] [CrossRef]
- Tang, Y.; Zhou, D.; Chan, F.T.S. AMWRPN: Ambiguity Measure Weighted Risk Priority Number Model for Failure Mode and Effects Analysis. IEEE Access 2018, 6, 27103–27110. [Google Scholar] [CrossRef]
- Zheng, H.; Tang, Y. Deng Entropy Weighted Risk Priority Number Model for Failure Mode and Effects Analysis. Entropy 2020, 22, 280. [Google Scholar] [CrossRef] [Green Version]
- Park, J.; Park, C.; Ahn, S. Assessment of structural risks using the fuzzy weighted Euclidean FMEA and block diagram analysis. Int. J. Adv. Manuf. Technol. 2018, 99, 2071–2080. [Google Scholar] [CrossRef]
- Godina, R.; Silva, B.G.R.; Espadinha-Cruz, P. A DMAIC Integrated Fuzzy FMEA Model: A Case Study in the Automotive Industry. Appl. Sci. 2021, 11, 3726. [Google Scholar] [CrossRef]
- Filo, G.; Fabis-Domagala, J.; Domagala, M.; Lisowski, E.; Momeni, H. The idea of fuzzy logic usage in a sheet-based FMEA analysis of mechanical systems. MATEC Web Conf. 2018, 183, 03009. [Google Scholar] [CrossRef] [Green Version]
- Yener, Y.; Can, G.F. A FMEA based novel intuitionistic fuzzy approach proposal: Intuitionistic fuzzy advance MCDM and mathematical modeling integration. Expert Syst. Appl. 2021, 183, 115413. [Google Scholar] [CrossRef]
- Qin, J.; Xi, Y.; Pedrycz, W. Failure mode and effects analysis (FMEA) for risk assessment based on interval type-2 fuzzy evidential reasoning method. Appl. Soft Comput. 2020, 89, 106134. [Google Scholar] [CrossRef]
- Chang, C.; Kontovas, C.; Yu, Q.; Yang, Z. Risk assessment of the operations of maritime autonomous surface ships. Reliab. Eng. Syst. Saf. 2021, 207, 107324. [Google Scholar] [CrossRef]
- Shi, S.; Fei, H.; Xu, X. Application of a FMEA method combining interval 2-tuple linguistic variables and grey relational analysis in preoperative medical service process. IFAC-PapersOnLine 2019, 52, 1242–12473. [Google Scholar] [CrossRef]
- Ouyang, L.; Zhu, Y.; Zheng, W.; Yan, L. An information fusion FMEA method to assess the risk of healthcare waste. J. Manag. Sci. Eng. 2021, 6, 111–124. [Google Scholar] [CrossRef]
- Li, Z.; Chen, L. A novel evidential FMEA method by integrating fuzzy belief structure and grey relational projection method. Eng. Appl. Artif. Intell. 2019, 77, 136–147. [Google Scholar] [CrossRef]
- Bashan, V.; Demirel, H.; Gul, M. An FMEA-based TOPSIS approach under single valued neutrosophic sets for maritime risk evaluation: The case of ship navigation safety. Soft Comput. 2020, 24, 18749–18764. [Google Scholar] [CrossRef]
- Biswas, S.; Bandyopadhyay, G.; Guha, B.; Bhattacharjee, M. An ensemble approach for portfolio selection in a mutli-criteria descision making framework. Decis. Making Appl. Manag. Eng. 2019, 2, 138–158. [Google Scholar]
- Ebrahimi, H.; Milos, T. Optimization of dangerous goods transport in urban zone. Decis. Making Appl. Manag. Eng. 2018, 1, 131–152. [Google Scholar] [CrossRef]
- AIAG & VDA FMEA Handbook; AIAG & VDA: Southfield, MI, USA, 2019.
- Fabis-Domagala, J.; Domagala, M.; Momeni, H. A Matrix FMEA Analysis of Variable Delivery Vane Pumps. Energies 2021, 14, 1741. [Google Scholar] [CrossRef]
- Handbook of Reliability Prediction for Mechanical Equipment; Naval Surface Warfare Center: West Bethesda, MD, USA, 2011.
- Hydraulic Filtration Technical Reference; Donaldson Filtration Solution: Bloomington, MN, USA, 2012.
- The Systematic Approach to Contamination Control; Eaton Corporation: Andover, MA, USA, 2002.
- Hydraulic Filtration Pocket Guide; Cummins Filtration: Nashville, TN, USA, 2020.
- Aggarwal, K.K. Reliability Engineering; Springer Science+Business Media: Dordrecht, The Netherlands, 1993. [Google Scholar]
- ISO EN 13445–1. Unfired Pressure Vessels. Part 3: Design; PKN: Warszawa, Poland, 2017. [Google Scholar]
- Gianni, N.; Tito, M. Failure of a heavy-duty hydraulic cylinder and its fatigue re-design. Eng. Fail. Anal. 2011, 18, 1030–1036. [Google Scholar]
- Roquet, P.; Gamez-Montero, P.J.; Castilla, R.; Raush, G.; Codina, E. A Simplified Methodology to Evaluate the Design Specifications of Hydraulic Components. Appl. Sci. 2018, 8, 1612. [Google Scholar] [CrossRef] [Green Version]
- Mahankar, P.S.; Dhoble, A.S. Review of hydraulic seal failures due to effect of medium to high temperature. Eng. Fail. Anal. 2021, 127, 105552. [Google Scholar] [CrossRef]
- Han, J. Data Mining, 3rd ed.; Morgan Kaufmann: Burlington, MA, USA, 2012. [Google Scholar]
- Watton, J. Modelling, Monitoring and Diagnostic Techniques for Fluid Power Systems; Springer: London, UK, 2007. [Google Scholar]
Figure 1.
Data chart.

Figure 2.
Hydraulic circuit: 1—reservoir; 2—filter; 3—motor; 4—pump; 5—check valve; 6 and 8—relief valve; 7—four way, two position directional control valve; 9—accumulator; 10—hydraulic cylinder.
Figure 2.
Hydraulic circuit: 1—reservoir; 2—filter; 3—motor; 4—pump; 5—check valve; 6 and 8—relief valve; 7—four way, two position directional control valve; 9—accumulator; 10—hydraulic cylinder.

Table 1.
Functional failure (): System is unable to perform intended function.
| Symptom | Failure Mode | Failure | Components |
|---|---|---|---|
| Actuator: | Loss of oil | Fracture | Tank |
| no motion | Pipe | ||
| Hose | |||
| Pump | |||
| Valves | |||
| Actuator | |||
| Accumulator | |||
| No output at pump | Fracture | Pump | |
| Relief valve | |||
| Deformation | Pump | ||
| Loosening | Pump | ||
| Extreme level | |||
| of contamination | Oil | ||
| Properties | Oil | ||
| Fluid not delivered | Fracture | Pipe | |
| to actuator | Hose | ||
| Accumulator | |||
| Valves | |||
| Deformation | Valve | ||
| Blocked actuator | Fracture | Actuator | |
| Deformation | Actuator |
Table 2.
Functional failures : System is partially able to perform the intended function.
| Symptom | Failure mode | Failure | Components |
|---|---|---|---|
| Actuator: | Component | Wear | Valves |
| insufficient speed | malfunction | Pump | |
| or force | Actuator | ||
| Corrosion | Valves | ||
| Pump | |||
| Actuator | |||
| Deformation | Actuator | ||
| Valve | |||
| Ageing/Hardening | Accumulator | ||
| Aeration | Oil | ||
| Contamination | |||
| Properties changes |
Table 3.
Functional failures . System is able to perform intended function with minor malfunction.
| Symptom | Failure Mode | Failure | Components |
|---|---|---|---|
| Noisy operation | Component | Wear | Valves |
| malfunction | Pump | ||
| Actuator | |||
| Deformation | Pump | ||
| Corrosion | Pump | ||
| Aeration | Oil | ||
| Cavitation | Pump | ||
| Valves | |||
| Overheating | Component | Wear | Pump |
| malfunction | Cavitation | Pump | |
| Valves | |||
| Ageing/Hardening | Accumulator | ||
| Leaks | Component | Wear | Component seals |
| malfunction | Ageing/Hardening | Component seals |
Table 4.
Functional failures . Criticality.
| Rank | Failure | Component | |
|---|---|---|---|
| 1 | 1368 | extreme oil cont. | oil |
| 2 | 1310.1 | deformation | pump |
| 3 | 928.2 | deformation | actuator |
| 4 | 912.0 | properties | oil |
| 5 | 409.4 | loosening | pump |
| 6 | 309.4 | fracture | actuator |
| 7 | 83.7 | fracture | relief valve |
| 8 | 82.8 | fracture | directional control valve |
| 9 | 81.9 | fracture | pump |
| 10 | 81.0 | fracture | check valve |
| 15 | 71.6 | fracture | hose |
| 11 | 59.1 | fracture | pipe |
| 16 | 43.6 | fracture | accumulator |
| 14 | 33.8 | fracture | tank |
| 13 | 29.7 | fracture | relief valve |
Table 5.
Functional failures . Criticality.
| Rank | Failure | Component | |
|---|---|---|---|
| 1 | 2907.0 | contamination | oil |
| 2 | 2784.6 | corrosion | actuator |
| 3 | 2736.0 | aeration | oil |
| 4 | 2052.0 | properties changes | oil |
| 5 | 2784.6 | wear | actuator |
| 6 | 982.2 | deformation | actuator |
| 7 | 859.8 | corrosion | pump |
| 8 | 753.6 | corrosion | relief valve |
| 9 | 745.3 | corrosion | directional control valve |
| 10 | 728.7 | corrosion | check valve |
| 11 | 654.3 | ageing/hardening | accumulator |
| 12 | 628.0 | wear | relief valve |
| 13 | 621.1 | wear | flow control valve |
| 14 | 607.2 | wear | check valve |
| 15 | 267.3 | corrosion | relief valve |
| 16 | 248.5 | deformation | flow control valve |
| 17 | 297.0 | wear | relief valve |
Table 6.
Functional failures . Criticality.
| Rank | Failure | Component | |
|---|---|---|---|
| 1 | 2784.6 | wear | actuator |
| 2 | 2736.0 | aeration | oil |
| 3 | 1146.4 | deformation | pump |
| 4 | 1044.0 | cavitation | pump |
| 5 | 942.0 | cavitation | relief valve |
| 6 | 931.7 | cavitation | directional control valve |
| 7 | 910.8 | cavitation | check valve |
| 8 | 859.8 | wear | pump |
| 9 | 859.8 | corrosion | pump |
| 10 | 828.7 | aeging/hardening | accumulator |
| 11 | 628.0 | wear | relief valve |
| 12 | 621.1 | wear | directional control valve |
| 13 | 607.2 | wear | check valve |
| 14 | 334.2 | cavitation | relief valve |
| 15 | 222.7 | wear | relief valve |
Table 7.
Severity number.
| Component | Classical RPN (max 10) | Proposed Method (max 20) |
|---|---|---|
| Pump | 10 | 19.9 |
| Tank | 10 | 16.9 |
| Check valve | 10 | 16.8 |
| Directional control valve | 10 | 16.7 |
| Actuator | 10 | 16.4 |
| Filter | 10 | 16.2 |
| Hose | 10 | 16.1 |
| Pipe | 10 | 16.0 |
| Relief valve () | 10 | 12.4 |
| Relief valve () | 10 | 12.2 |
| Accumulator | 10 | 8.1 |
Publisher’s Note: MDPI stays neutral with regard to jurisdictional claims in published maps and institutional affiliations. |
© 2021 by the authors. Licensee MDPI, Basel, Switzerland. This article is an open access article distributed under the terms and conditions of the Creative Commons Attribution (CC BY) license (https://creativecommons.org/licenses/by/4.0/).
Share and Cite
MDPI and ACS Style
Fabis-Domagala, J.; Domagala, M.; Momeni, H. A Concept of Risk Prioritization in FMEA Analysis for Fluid Power Systems. Energies 2021, 14, 6482. https://doi.org/10.3390/en14206482
AMA Style
Fabis-Domagala J, Domagala M, Momeni H. A Concept of Risk Prioritization in FMEA Analysis for Fluid Power Systems. Energies. 2021; 14(20):6482. https://doi.org/10.3390/en14206482
Chicago/Turabian StyleFabis-Domagala, Joanna, Mariusz Domagala, and Hassan Momeni. 2021. "A Concept of Risk Prioritization in FMEA Analysis for Fluid Power Systems" Energies 14, no. 20: 6482. https://doi.org/10.3390/en14206482
Note that from the first issue of 2016, this journal uses article numbers instead of page numbers. See further details here.