
Enhancing Global Maximum Power Point of Solar Photovoltaic Strings under Partial Shading Conditions Using Chimp Optimization Algorithm


 and
and 
Abstract
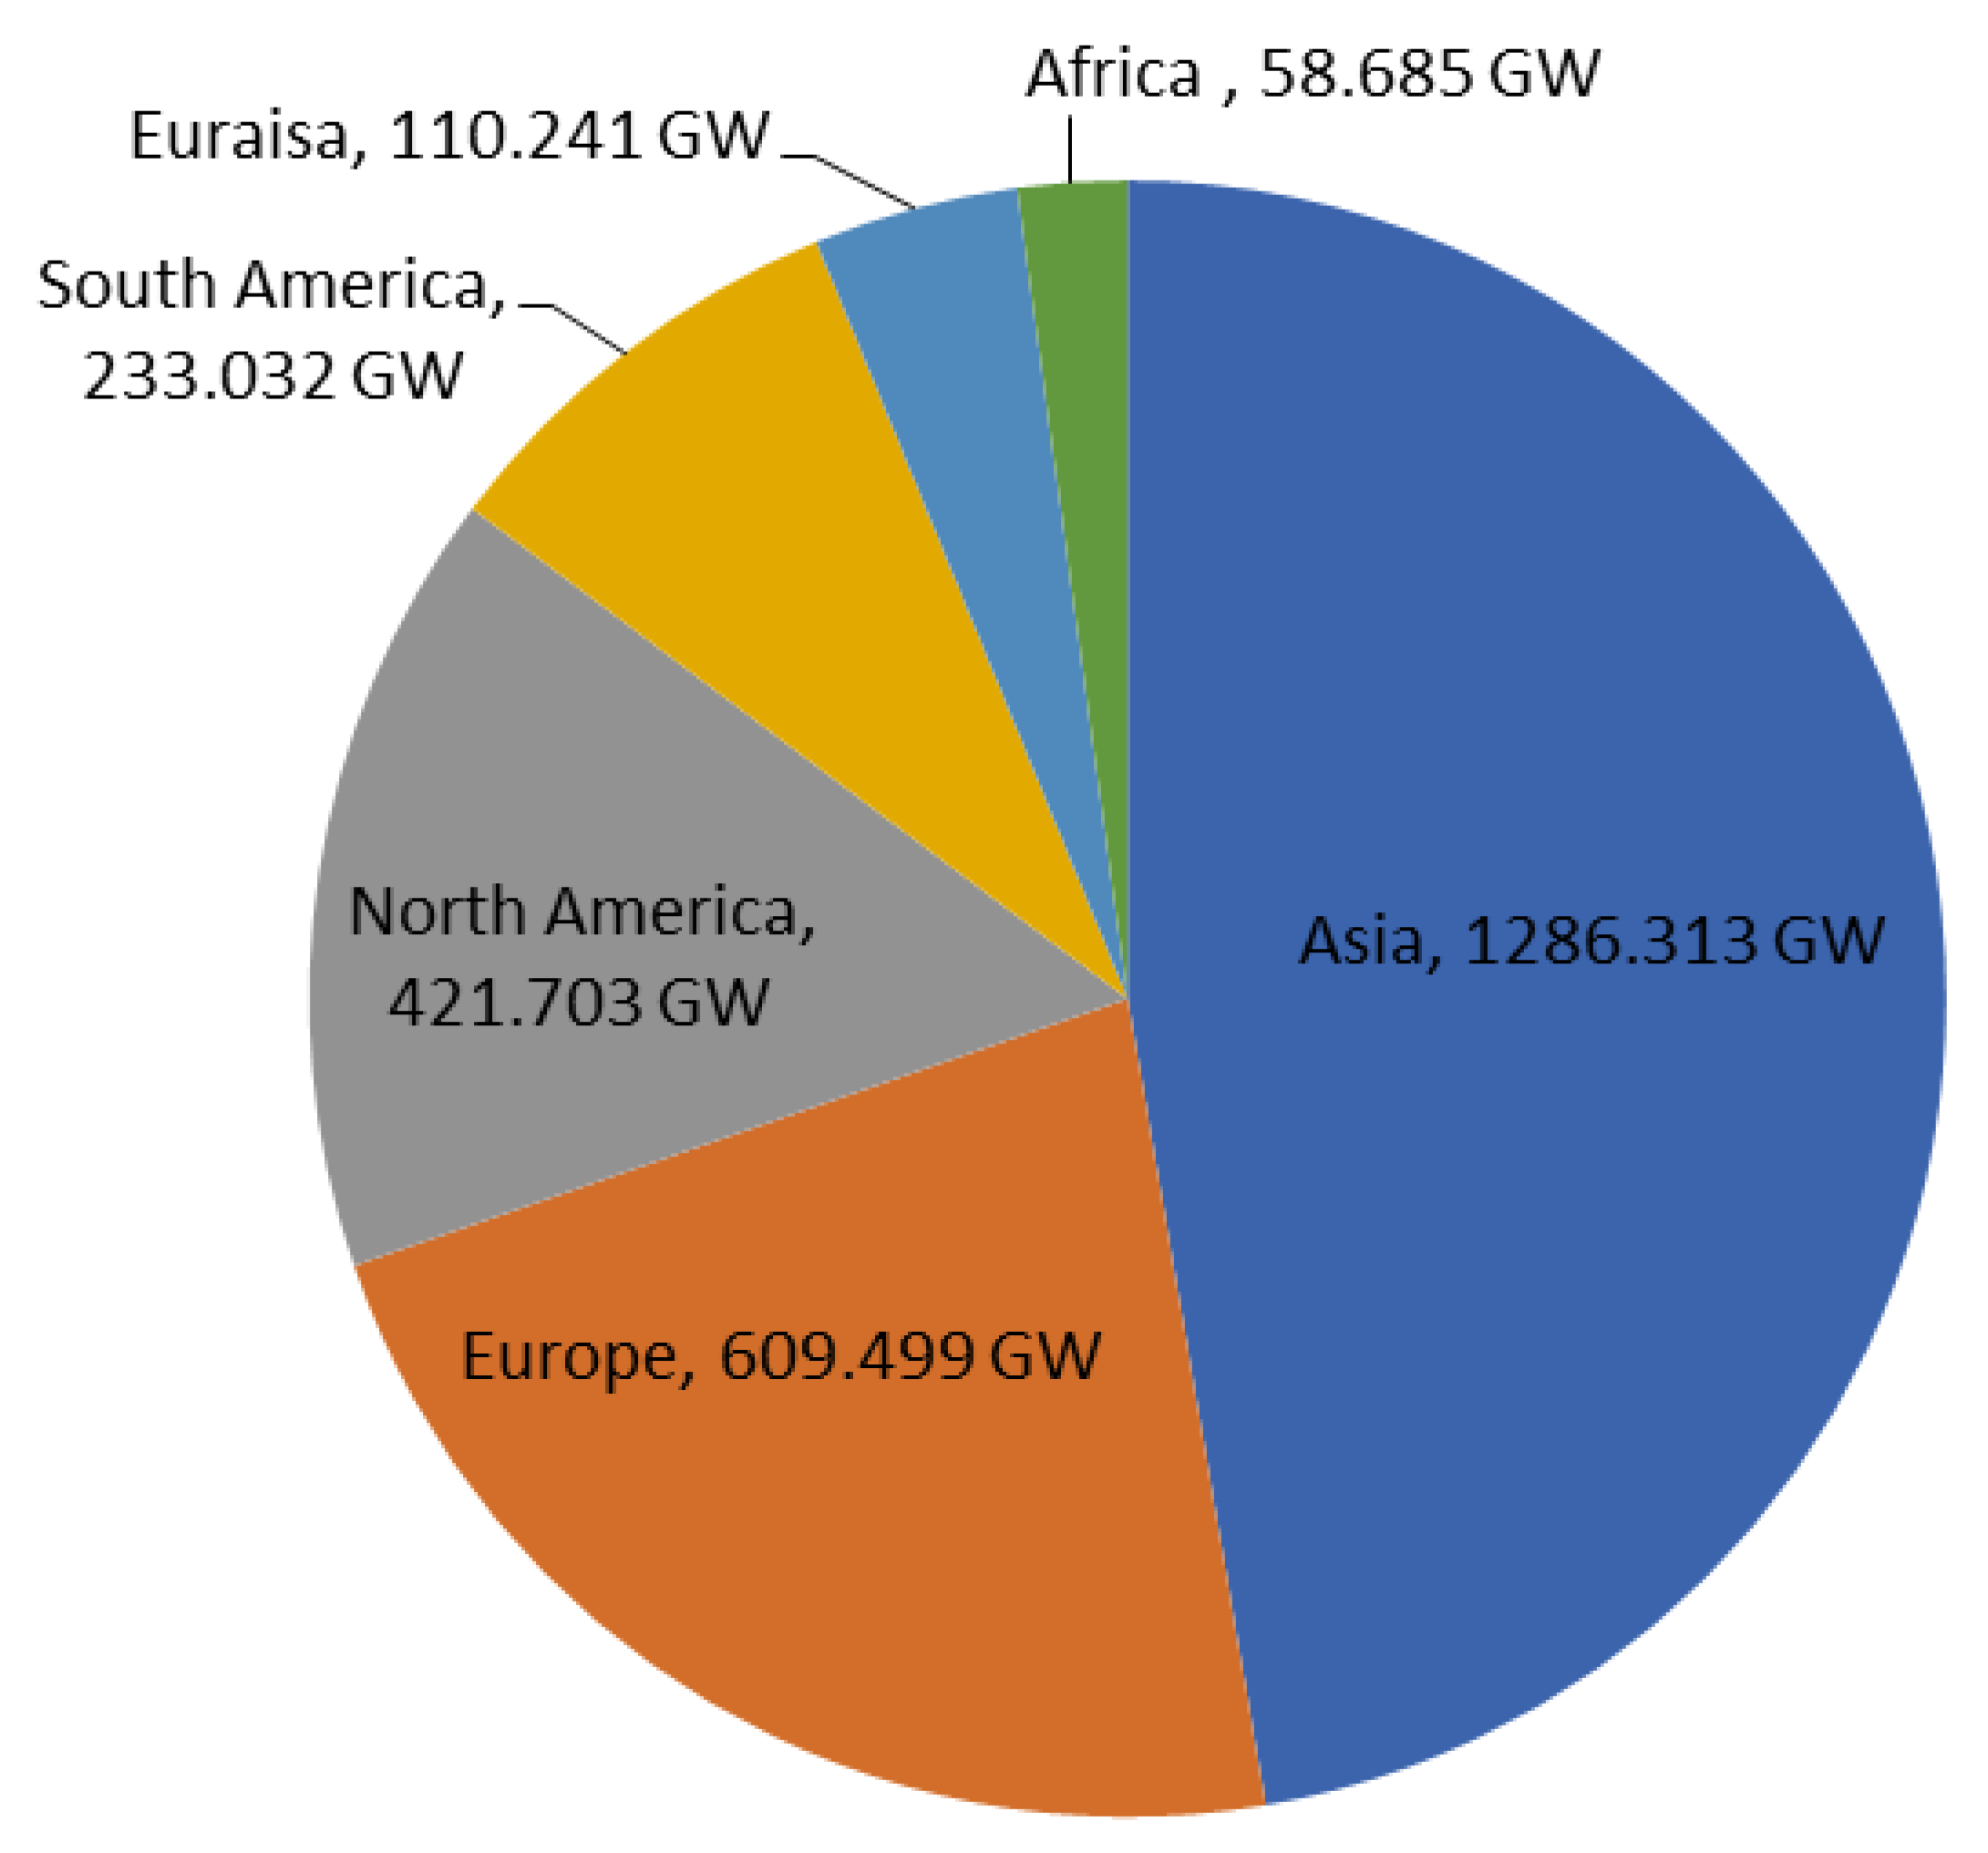
:1. Introduction
2. Metaheuristic Optimization Algorithms (MOAs) for Tracking MPP
2.1. Chimp Optimization Algorithm (ChOA): Background and Social Hierarchy
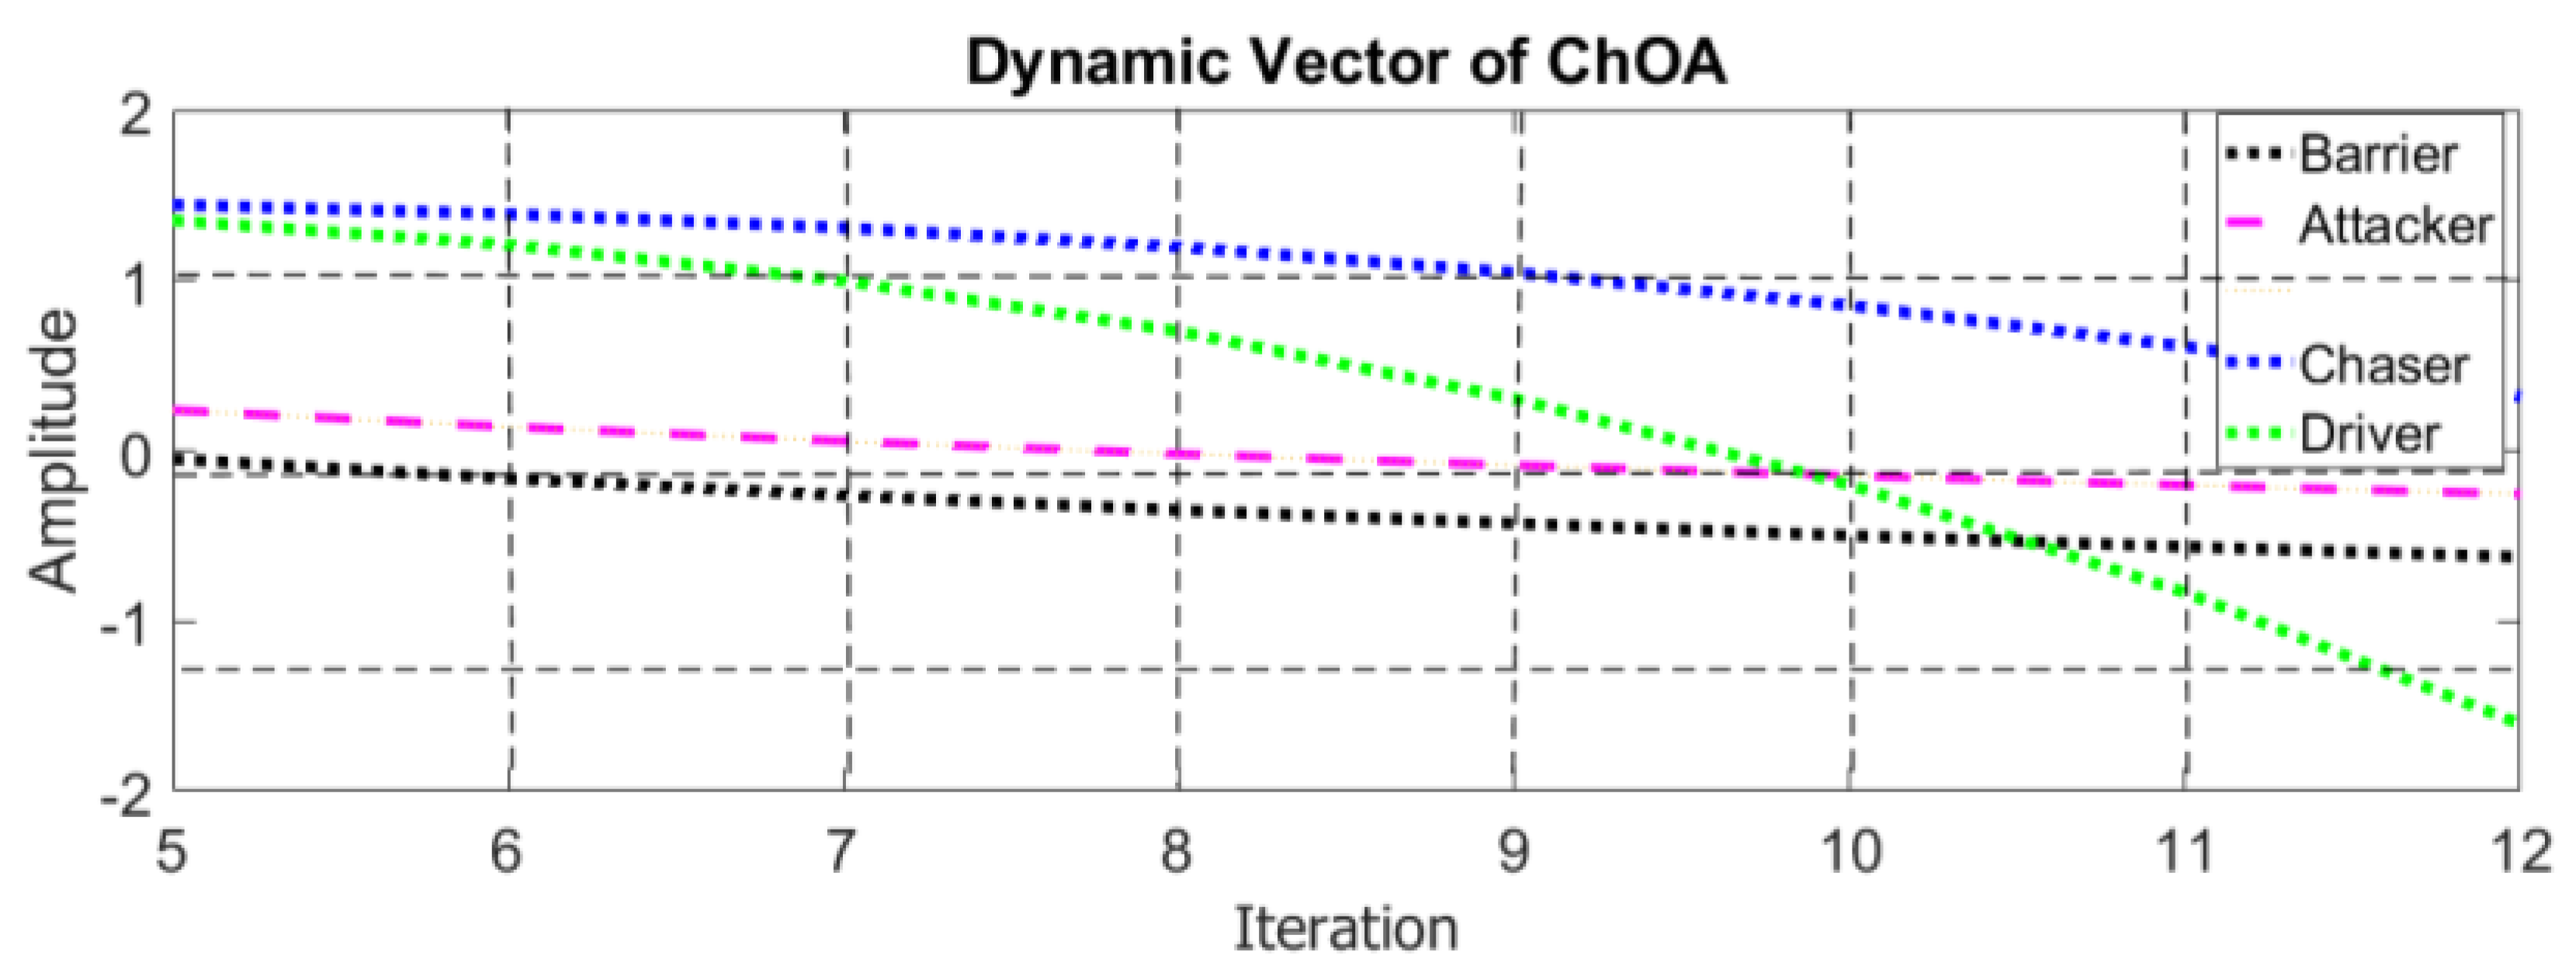
2.2. Mathematical Model of Chimp Optimization Algorithm
- t: Current iteration
- a, m and c: Coefficient vectors
- : Prey position vector
- : Chimp position vector
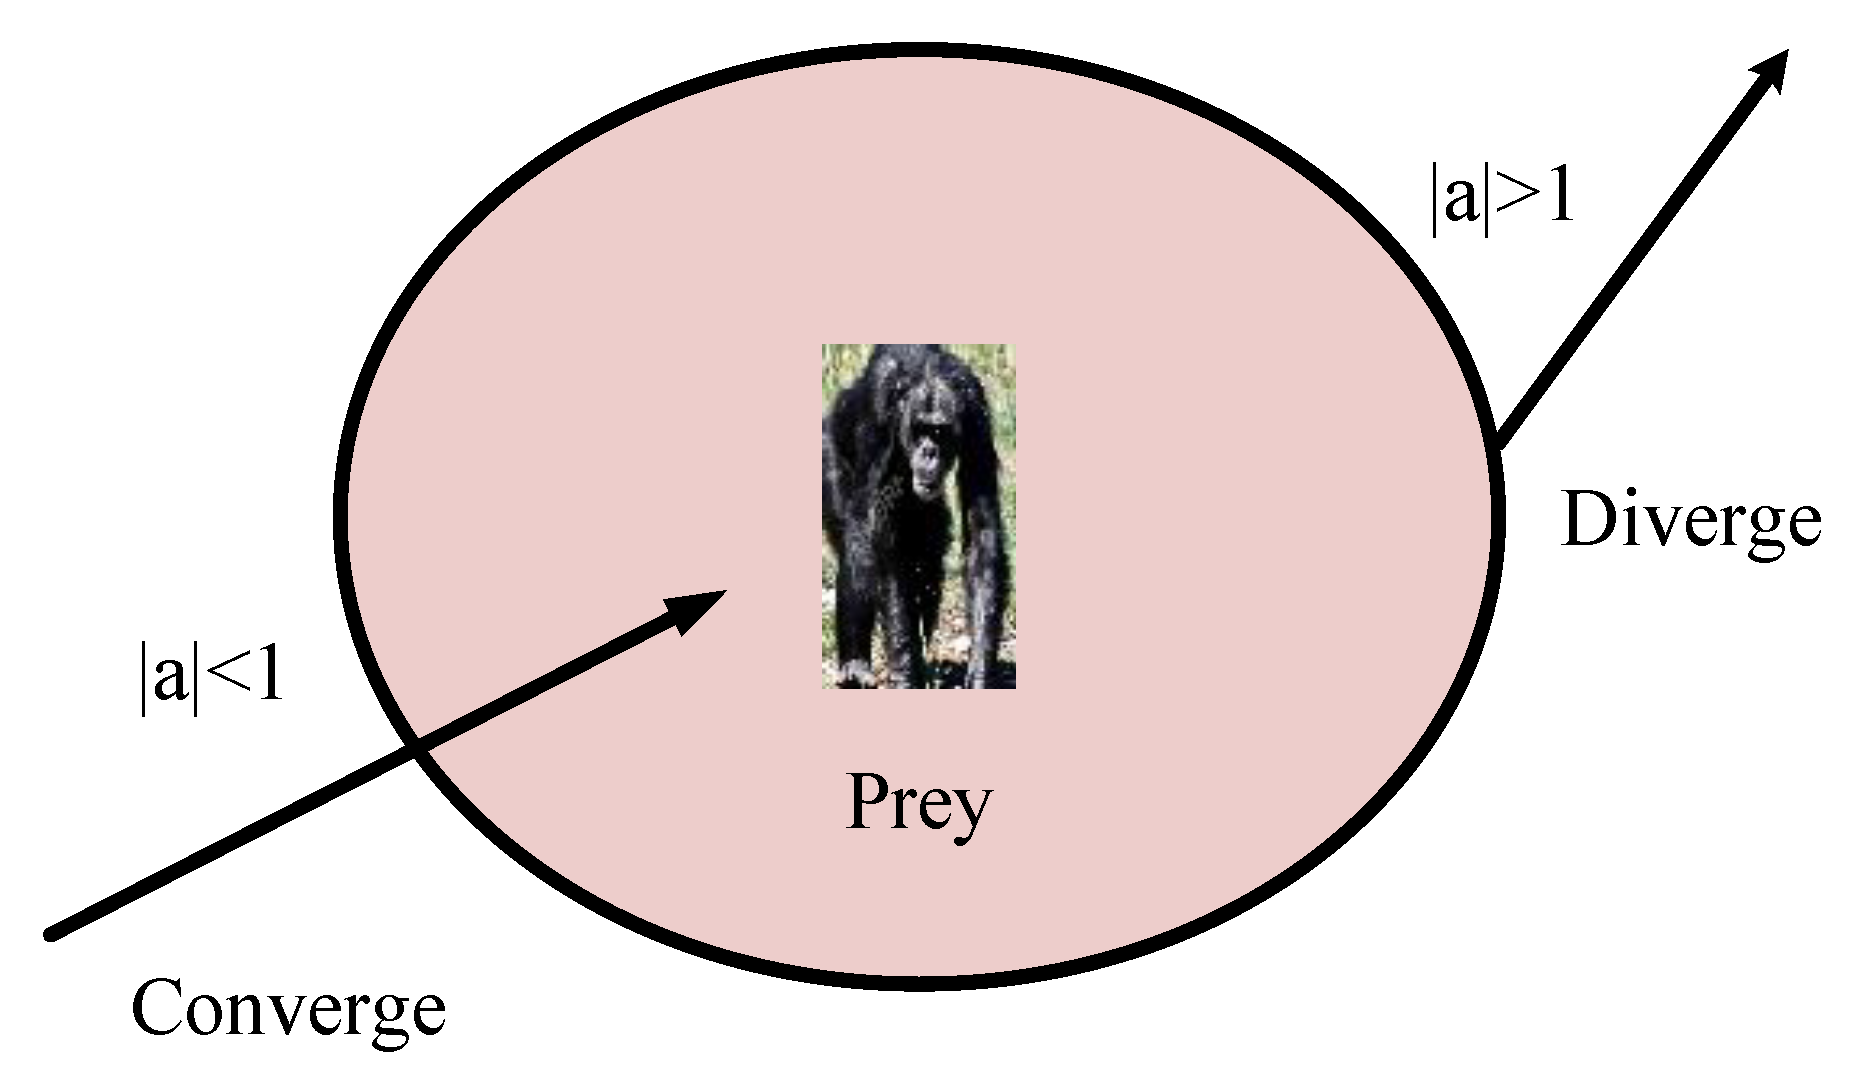
2.3. Exploration Phase
2.4. Attacking Mode (Exploitation Stage)
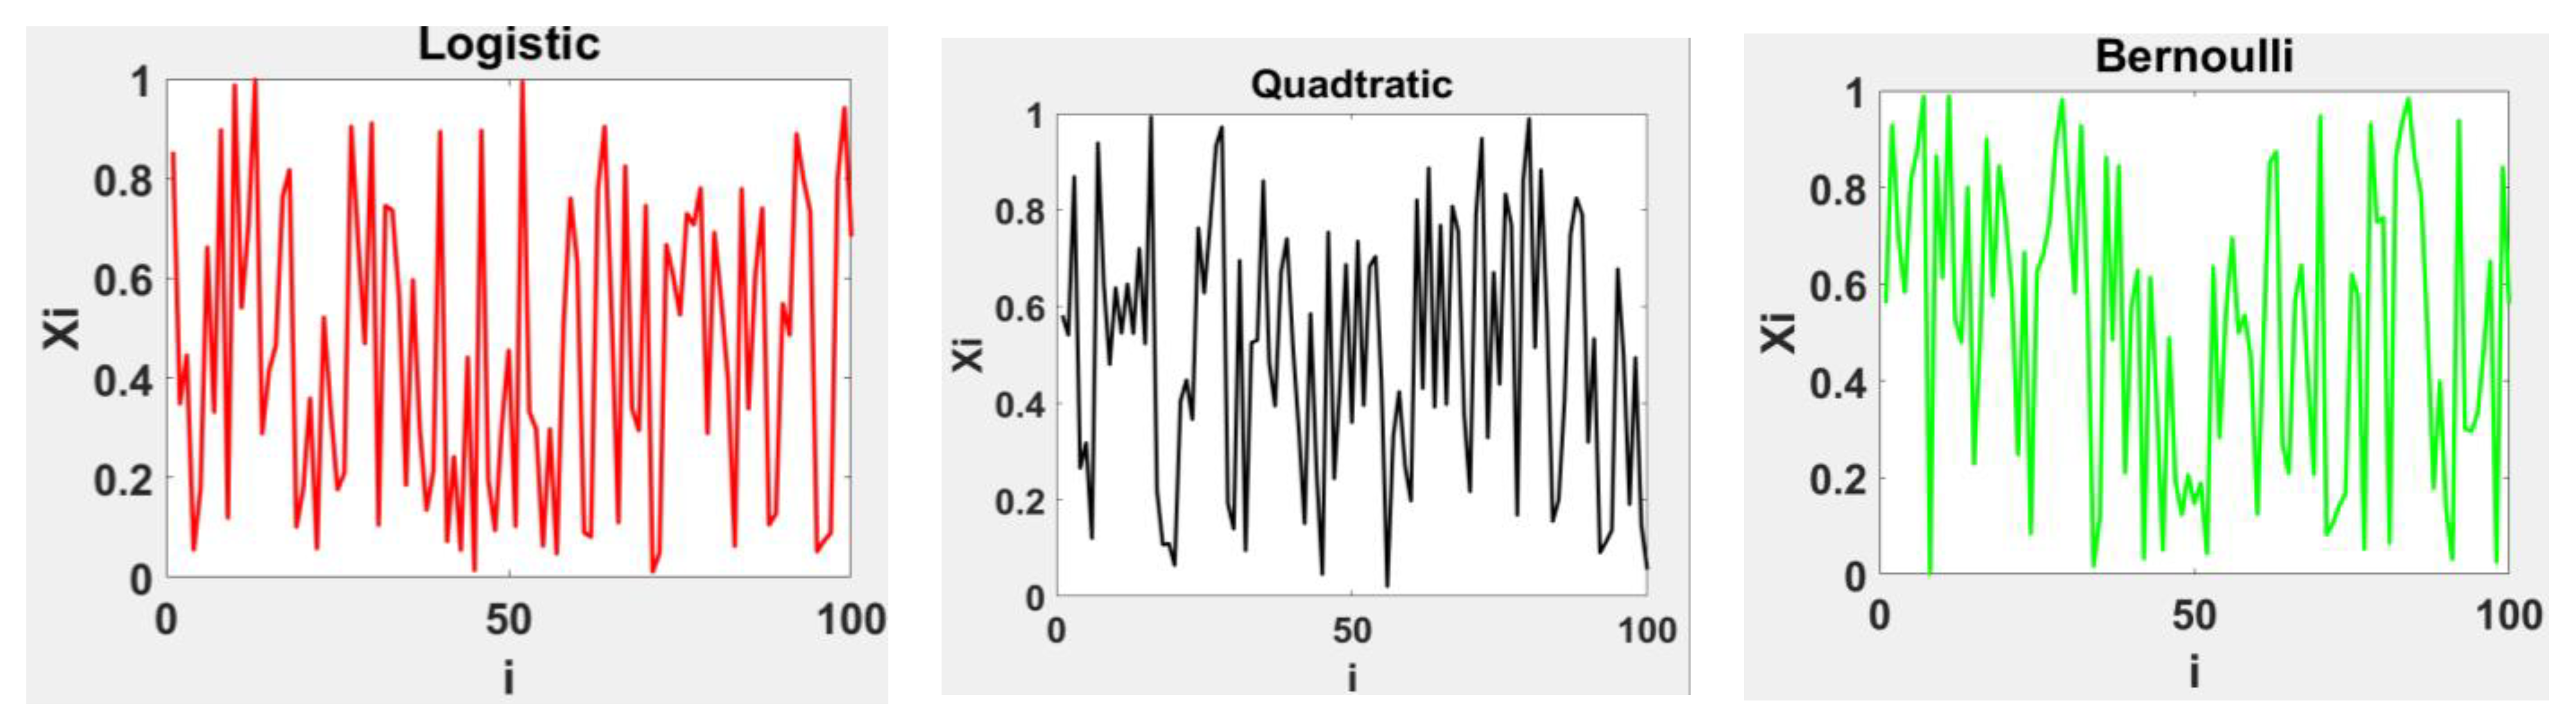
Chaotic Maps (Sexual Motivation)
| No | Name | Chaotic Map | Range |
| 1 | Quadratic | (0, 1) | |
| 2 | Logistic | (0, 1) | |
| 3 | Bernoulli | (0, 1) |
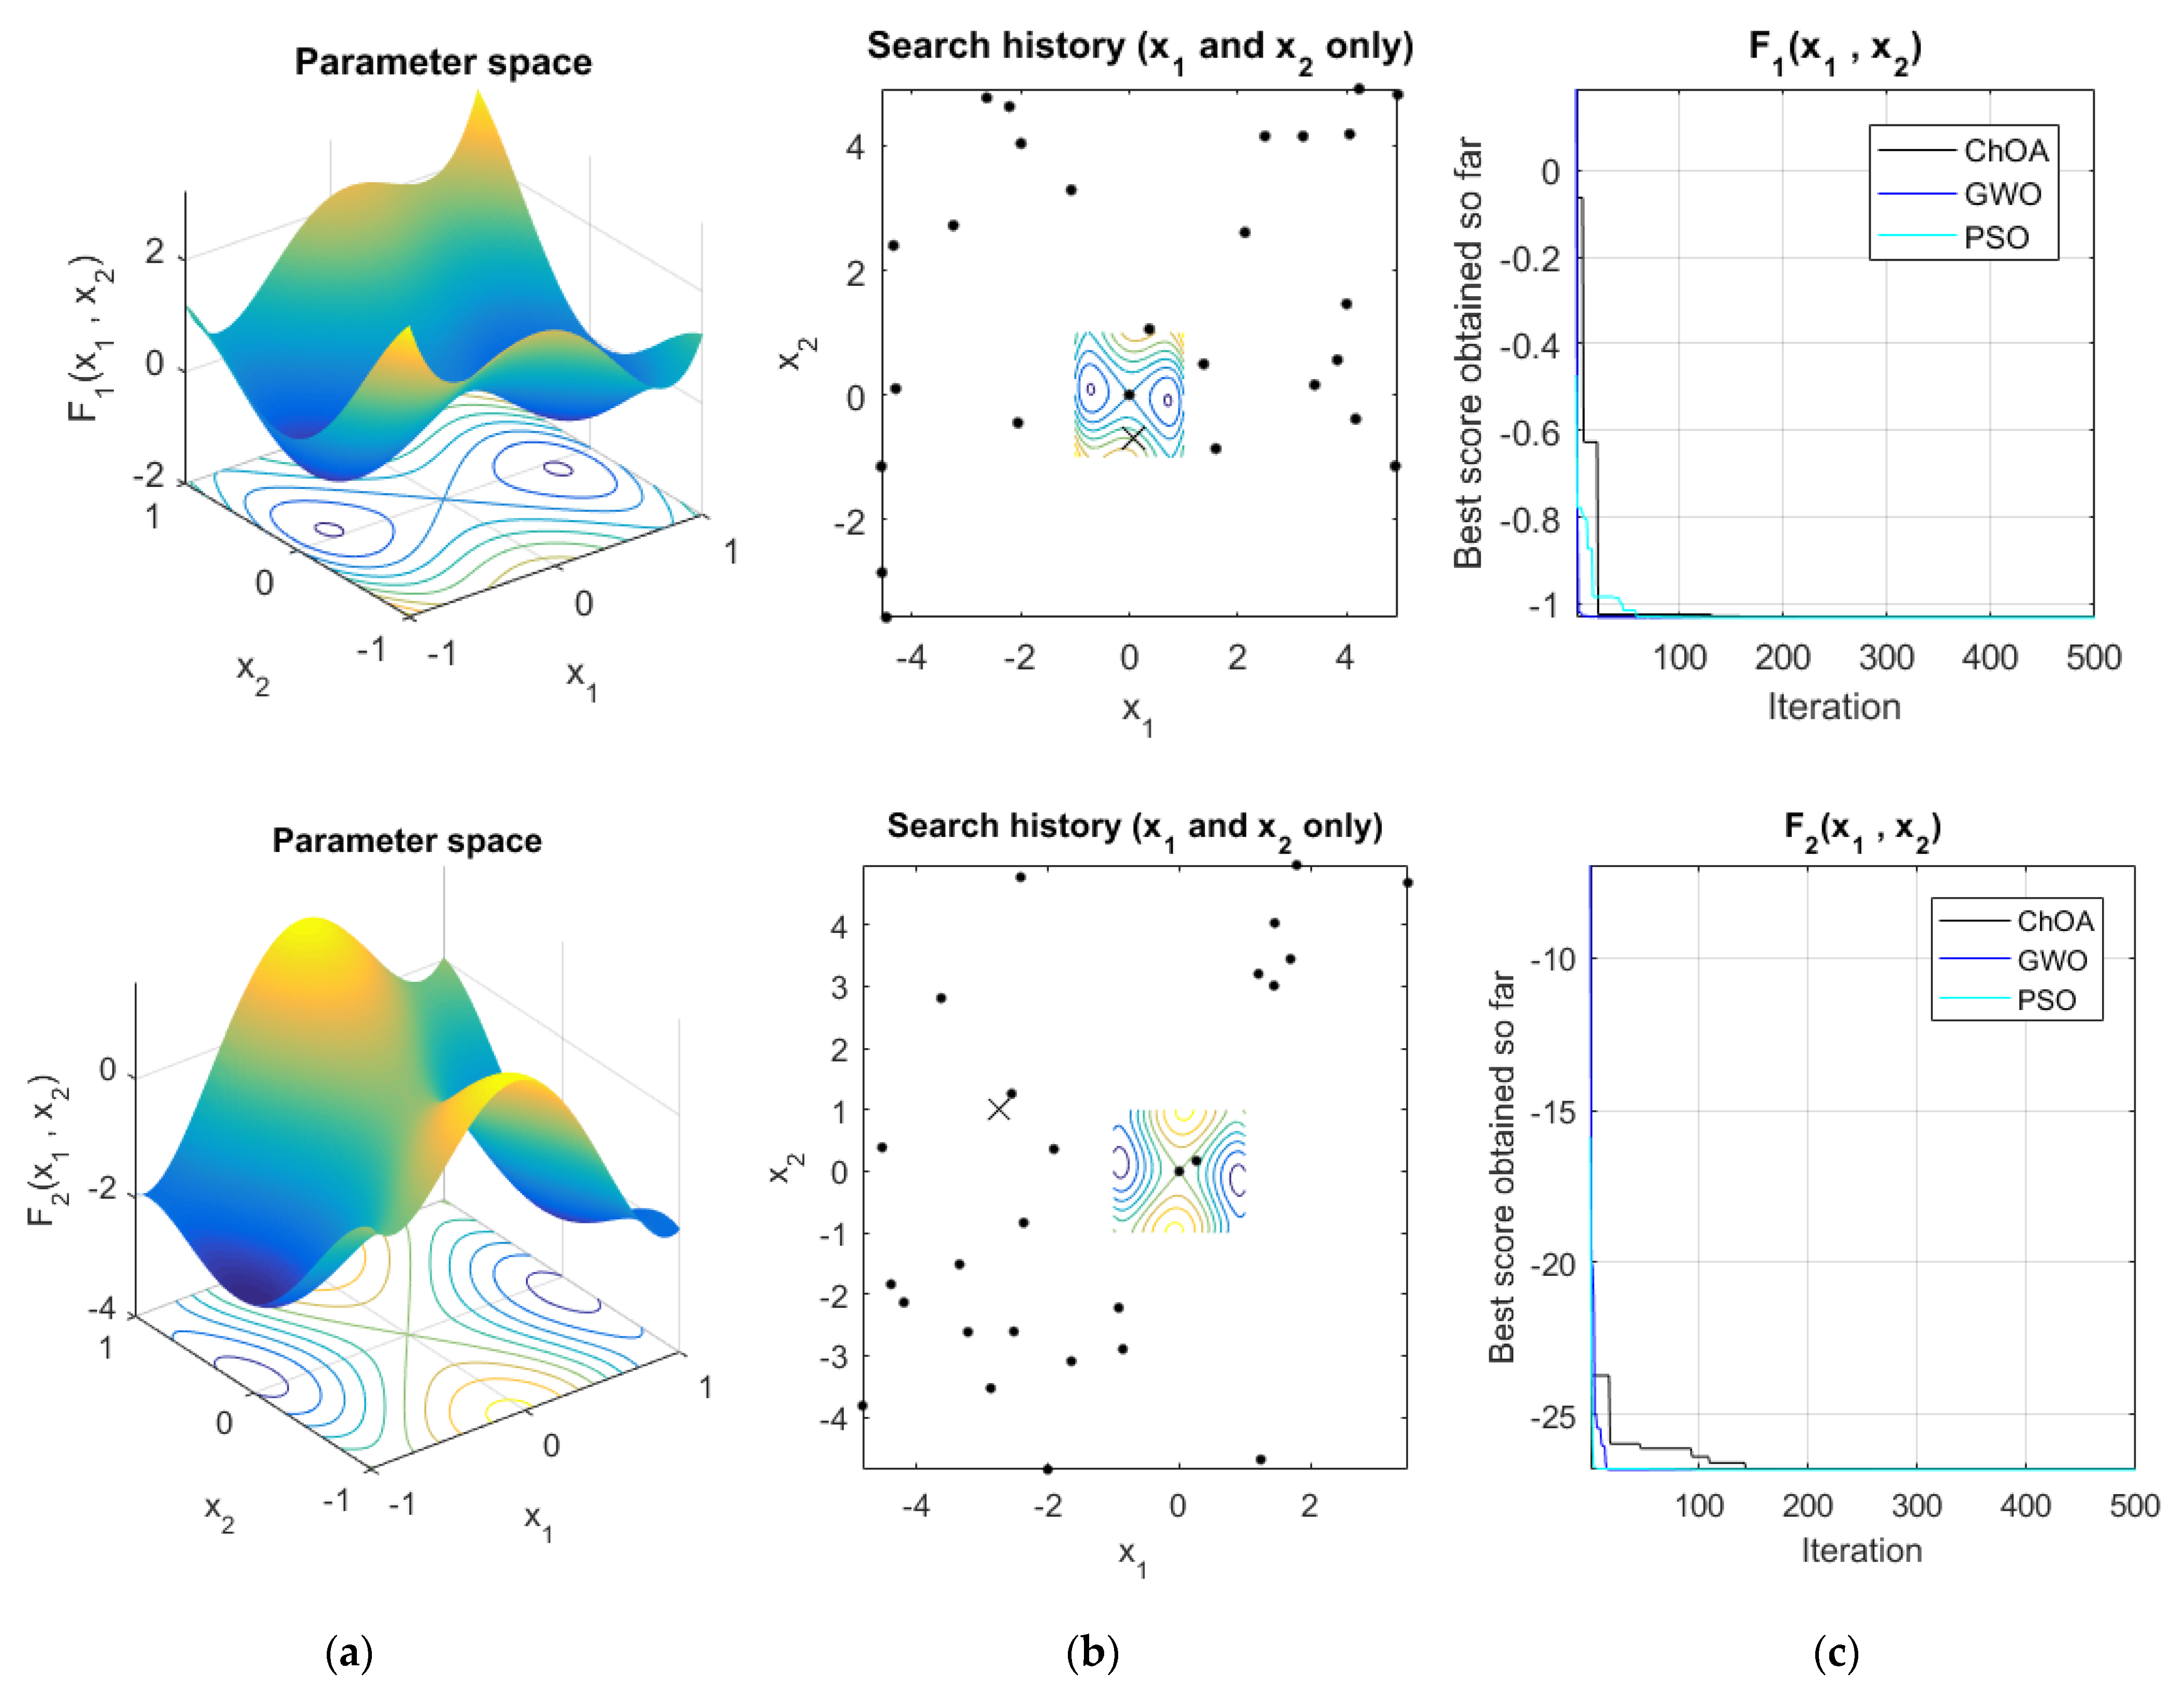
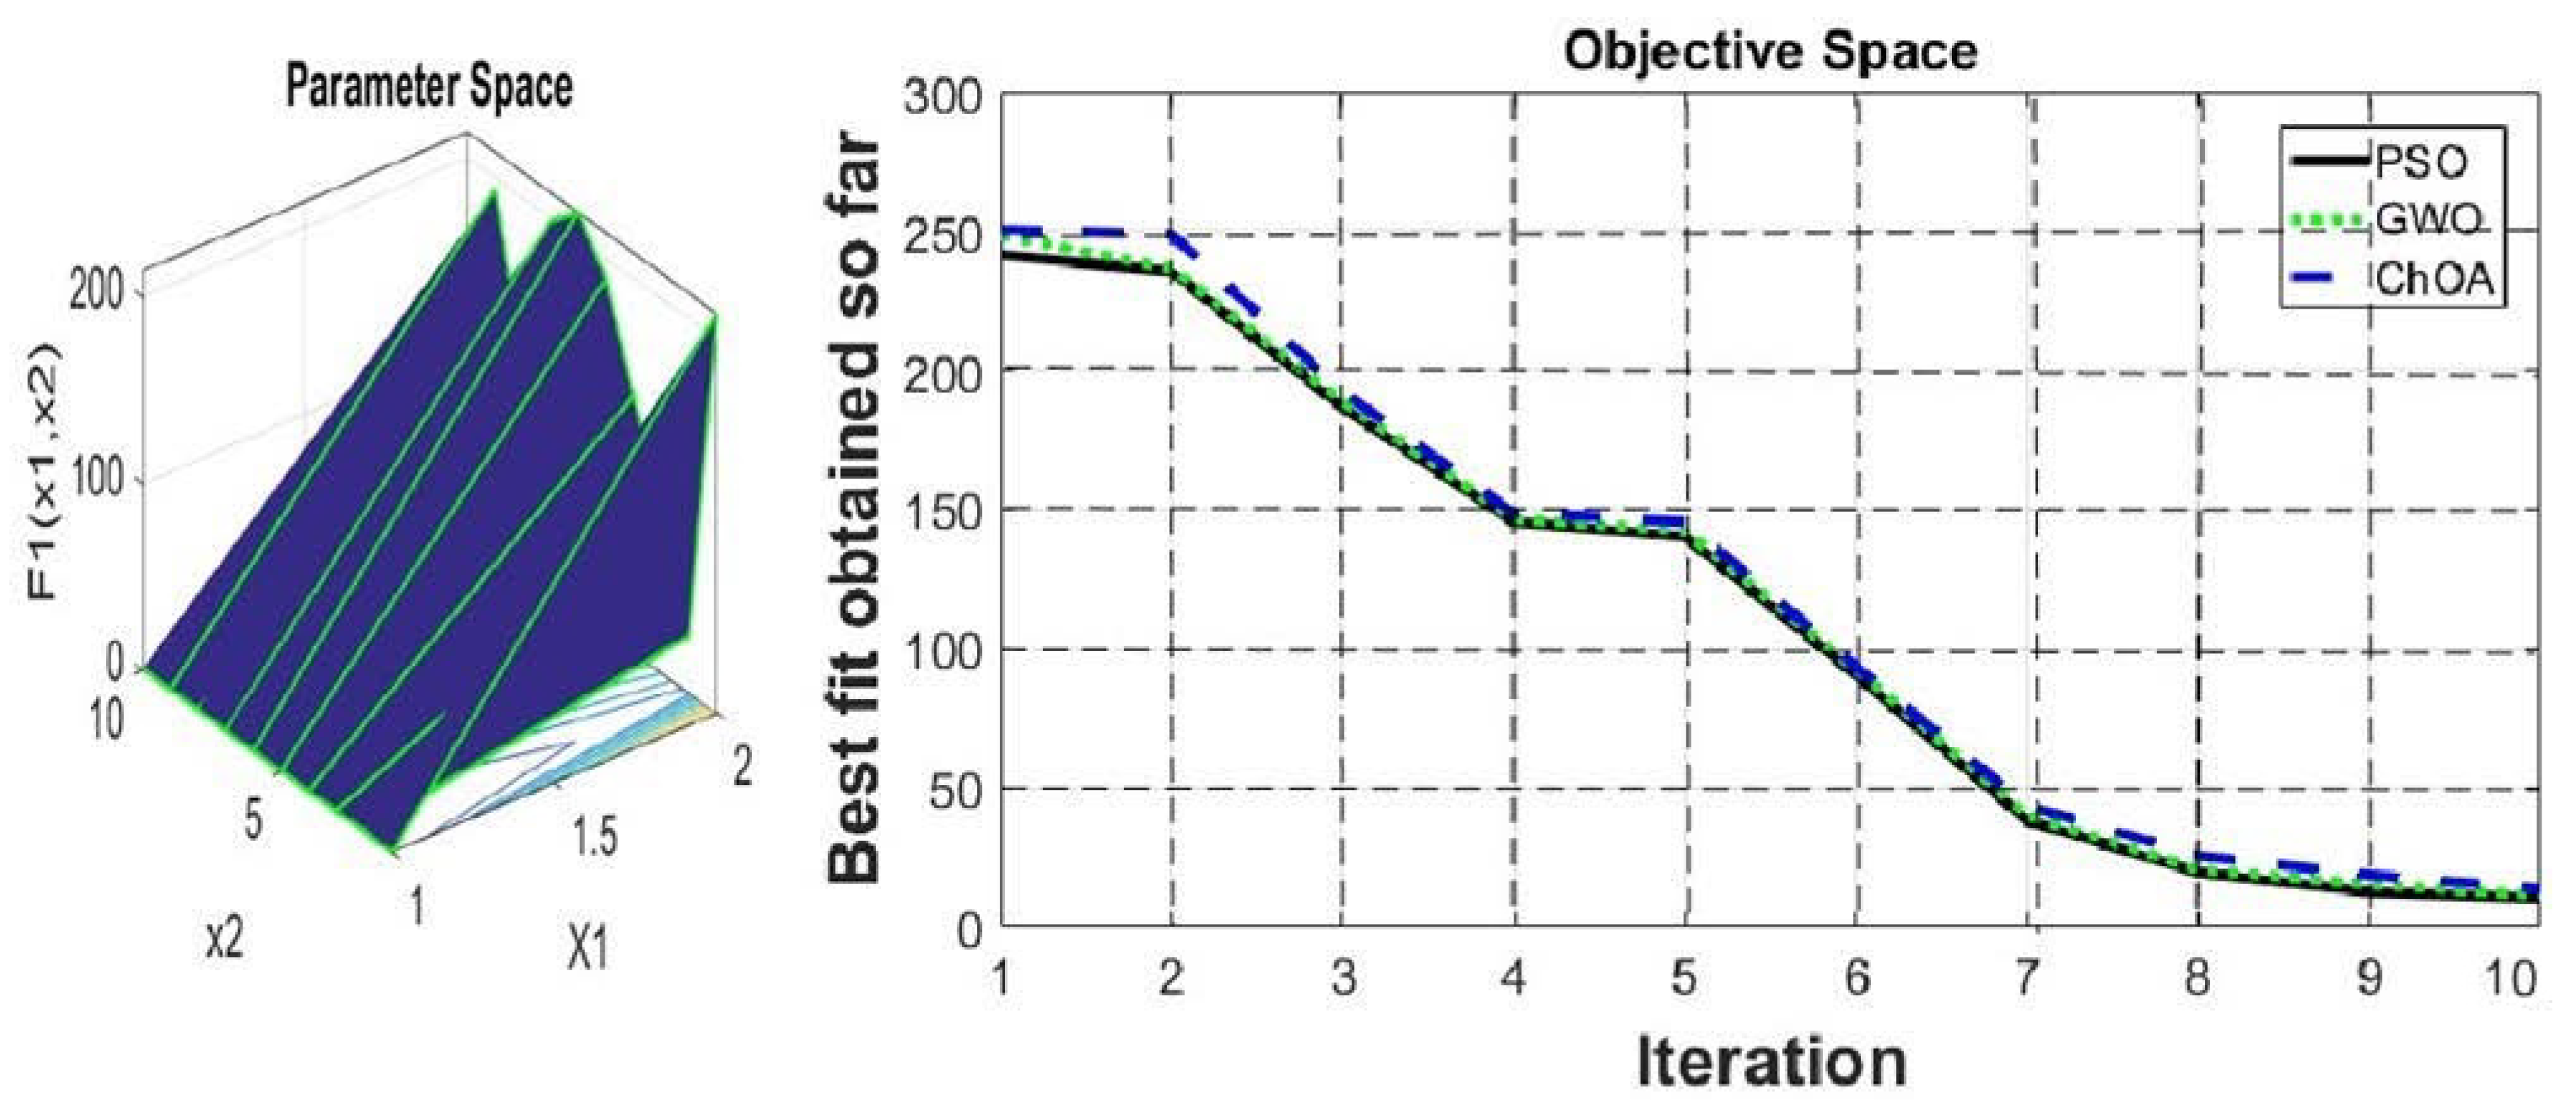
3. Testing of the ChOA on Some Fixed Dimension Benchmark Functions
4. Extraction of Maximum Power Point from Solar PV System with the Proposed ChOA
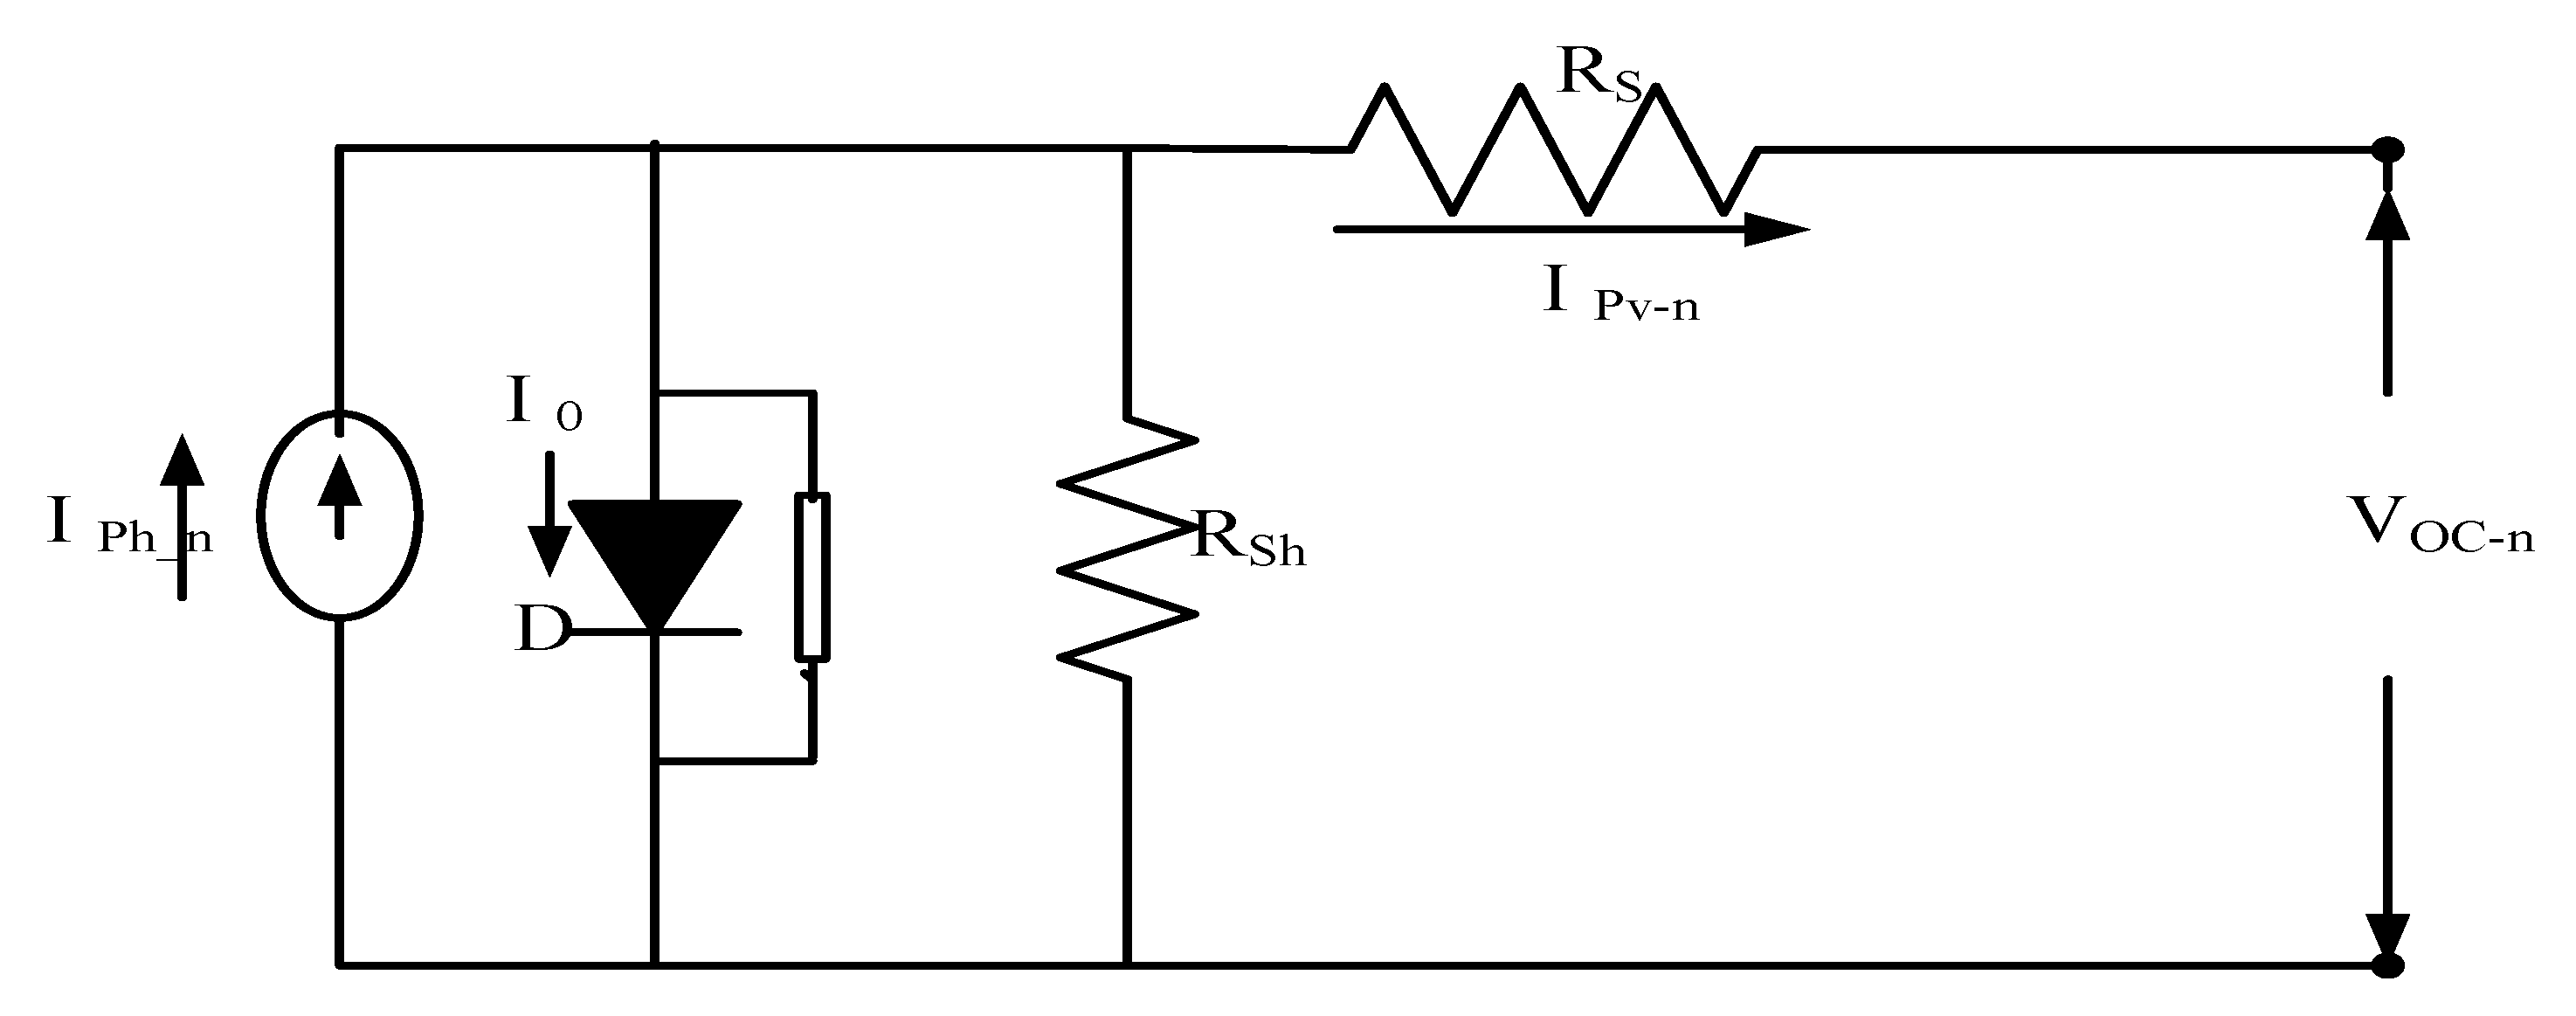
4.1. Modelling of PV Cell
| Ns | Total number of cells connected in series. |
| NP | Total number of cells connected in parallel. |
| I0 | Saturation current of the diode in A. |
| I PV | Photo current generated by the cell under standard test conditions in A. |
| RS | Series resistance in Ω. |
| RP | Shunt resistance in Ω. |
| a | Fill factor. |
4.2. Maximum Power Extracting Controllers in PV Module during Partial Shading Condition
4.3. Formulation Objective Function
| PV power in watts. | |
| PV voltage in volts. | |
| PV current in Amps. |
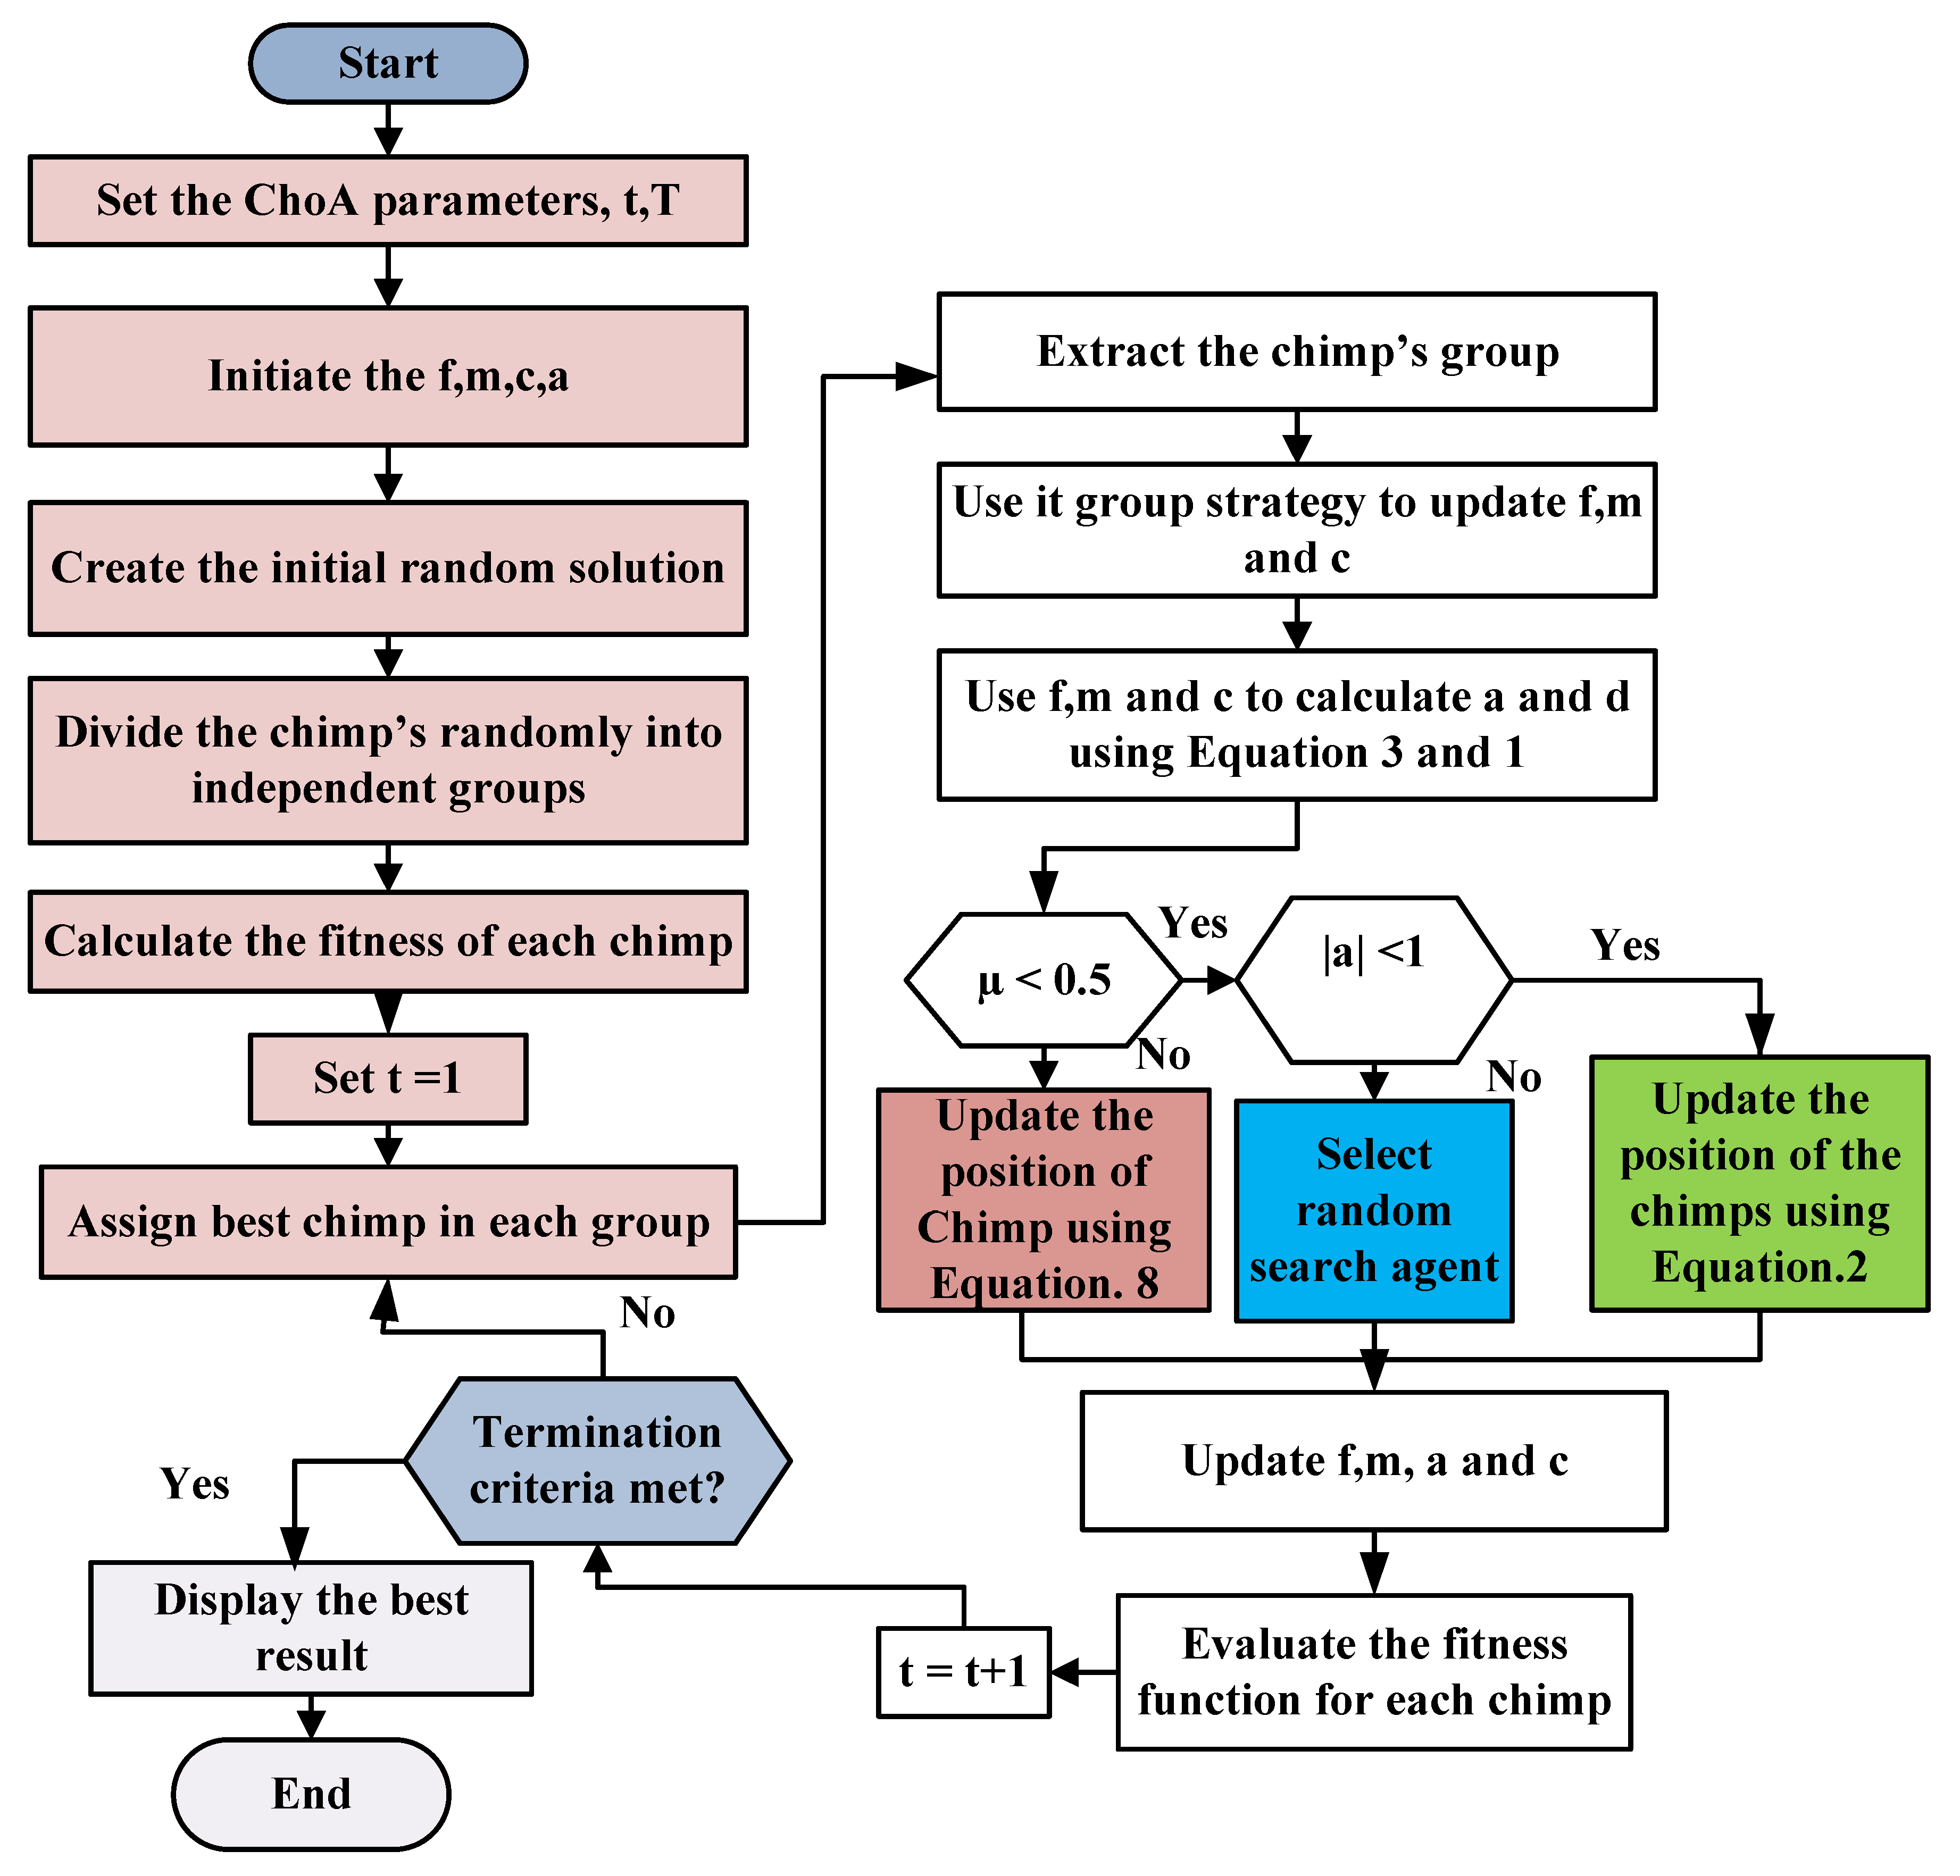
4.4. ChOA Algorithm Implementation for MPPT fo Solar PV Systems
| Algoritm 1 Pseudocode of ChOA |
| Load the chimp population (duty cycle of the DC-DC converter) Initialize the algorithm-specific parameters like f, m, a and c Compute the position of individual chimp Separate chimps aimlessly into different groups Until the stopping criterion is satisfied Determine the fitness function of each chimp Fitness function for Maximum power extraction from solar PV strings is dAttacker = Best search agent in the chimp population dChaser = Second best search agent dbarrier = Third best serach agent ddriver = Fourth best search agent While (t < maximum number of iteration) for each chimp; Extract the chimps group Update the parameters f, m and c using group strategy Use parameters f, m and c to determine a and then d end for for each search chimp if (α < 0.5) if (|a| < 1) update location of each chimp agent else if (|a| > 1) Select random search agent end if else if (α > 0.5) update the position of the chimp end if end for Update f, m, a and c Update dAttacker, dChaser, dbarrier and ddriver t = t + 1 end while return dAttacker |
5. Results and Discussions
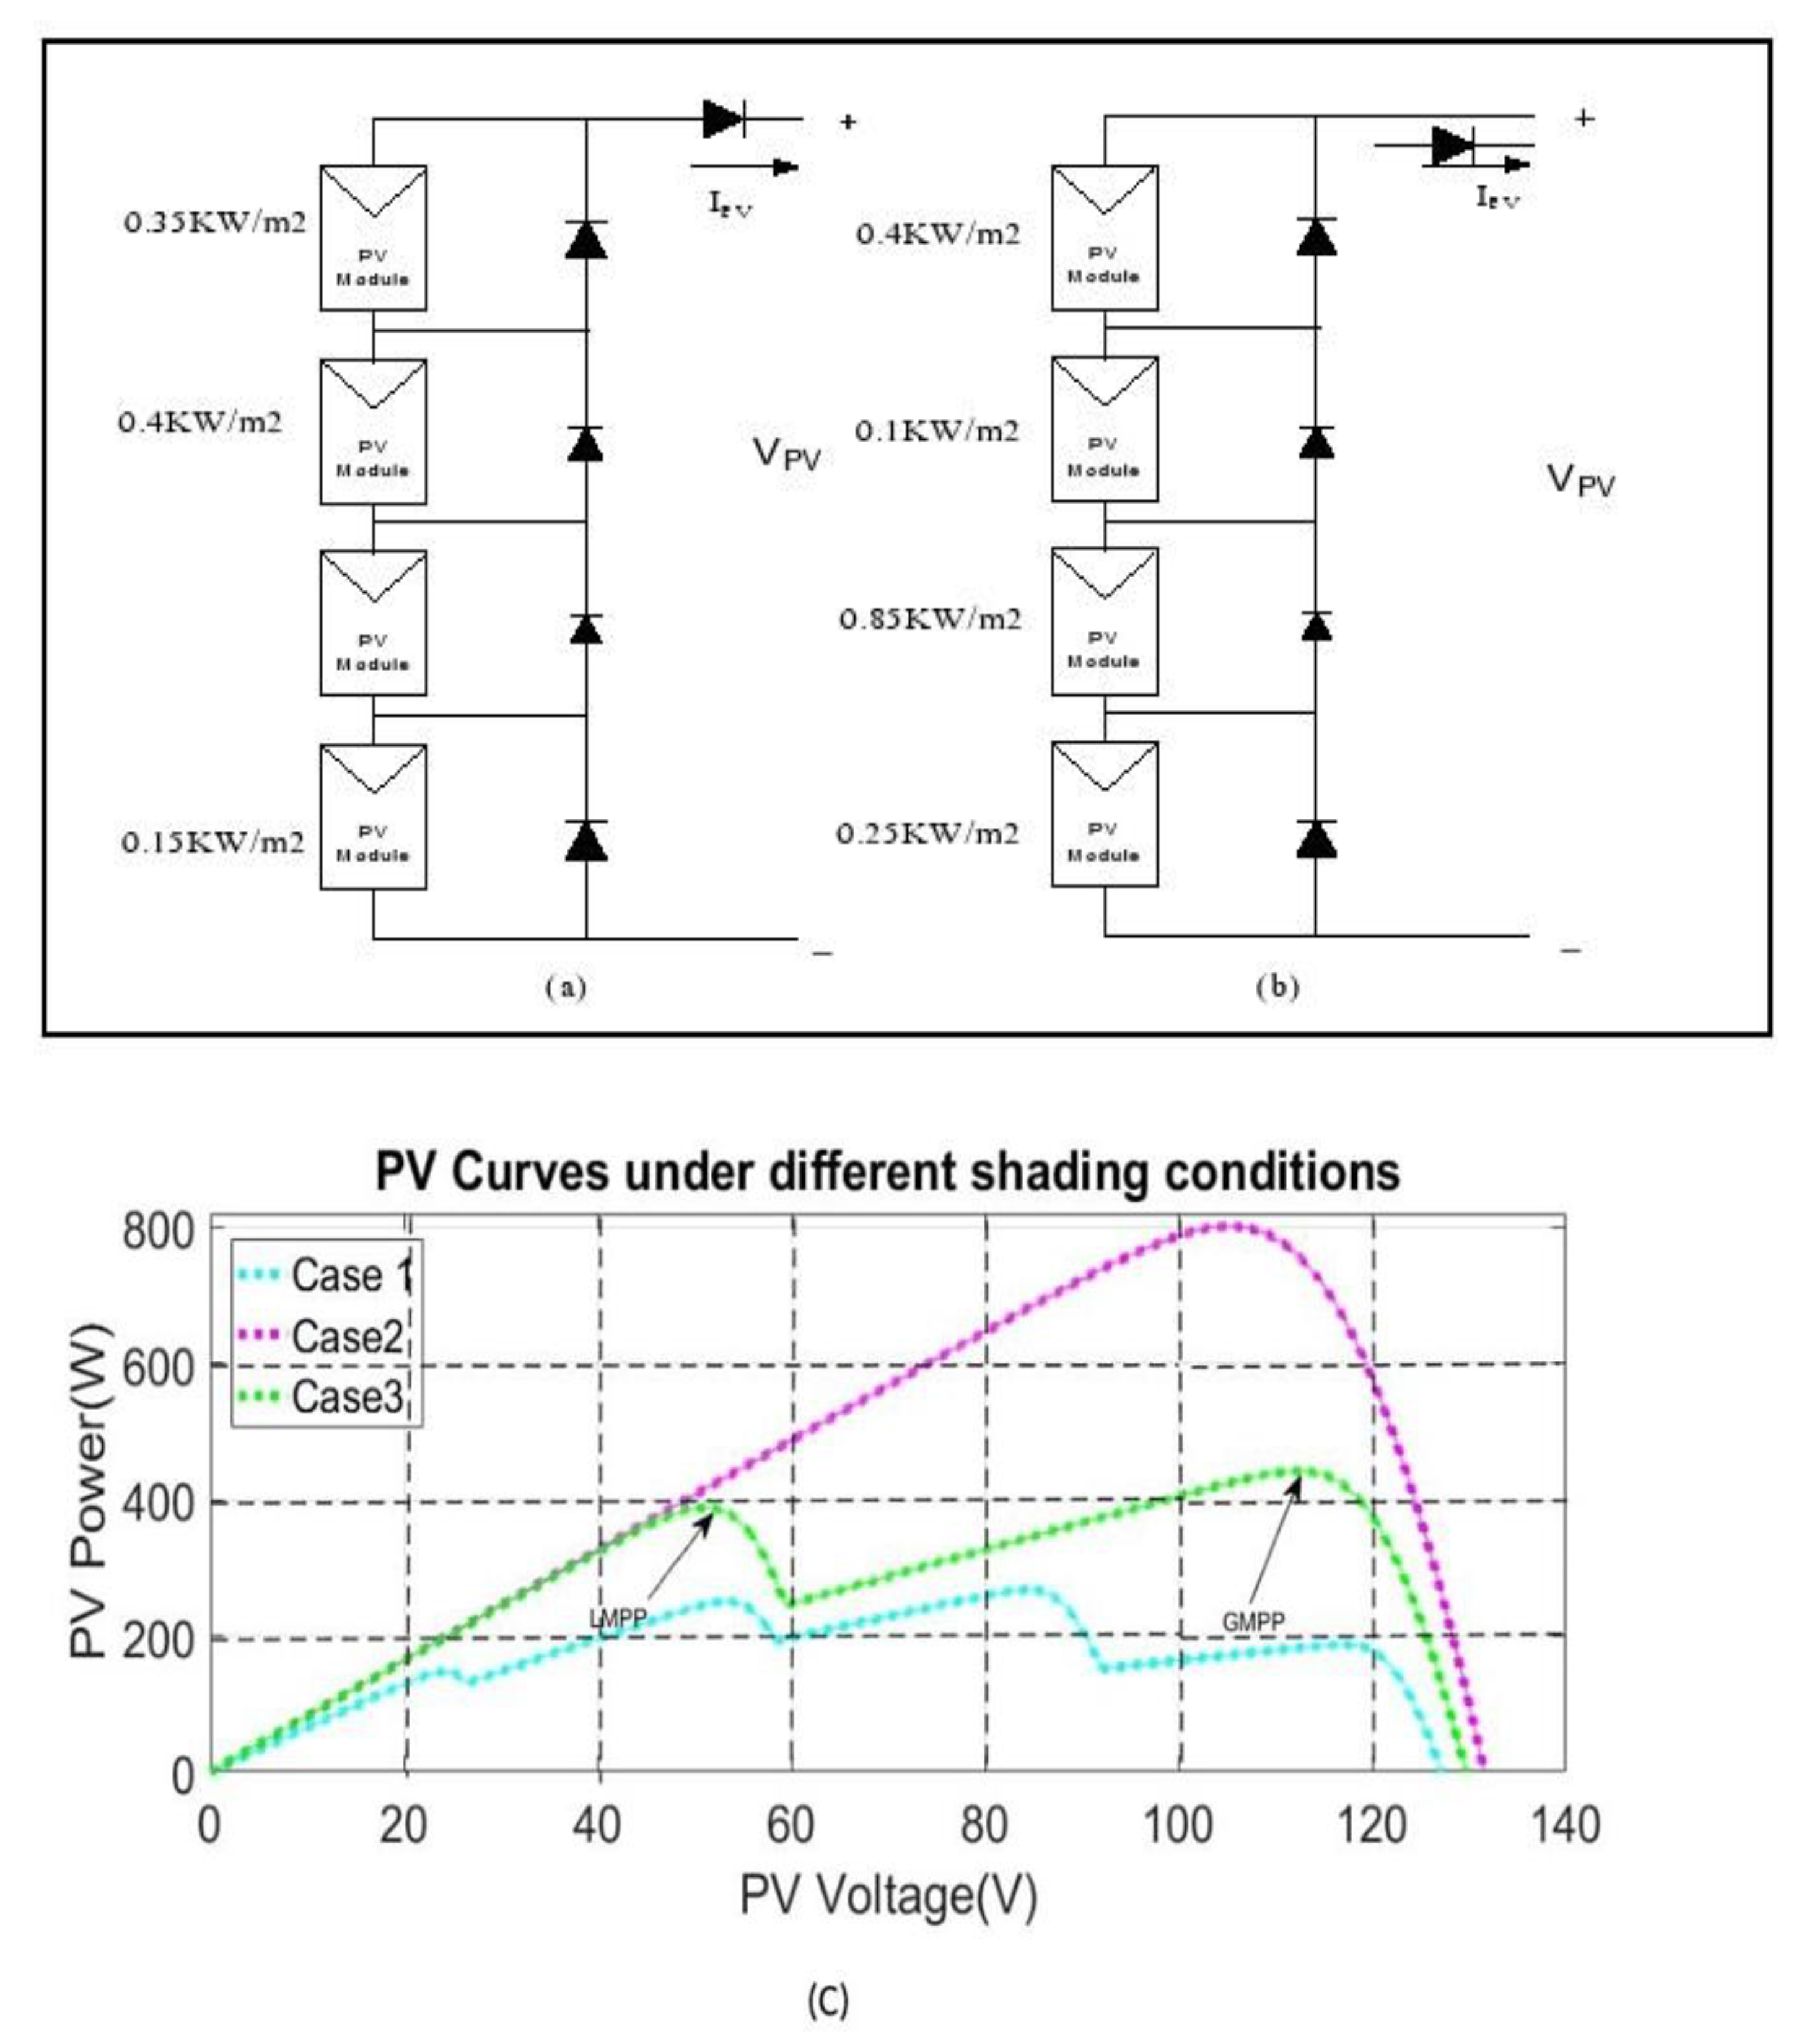
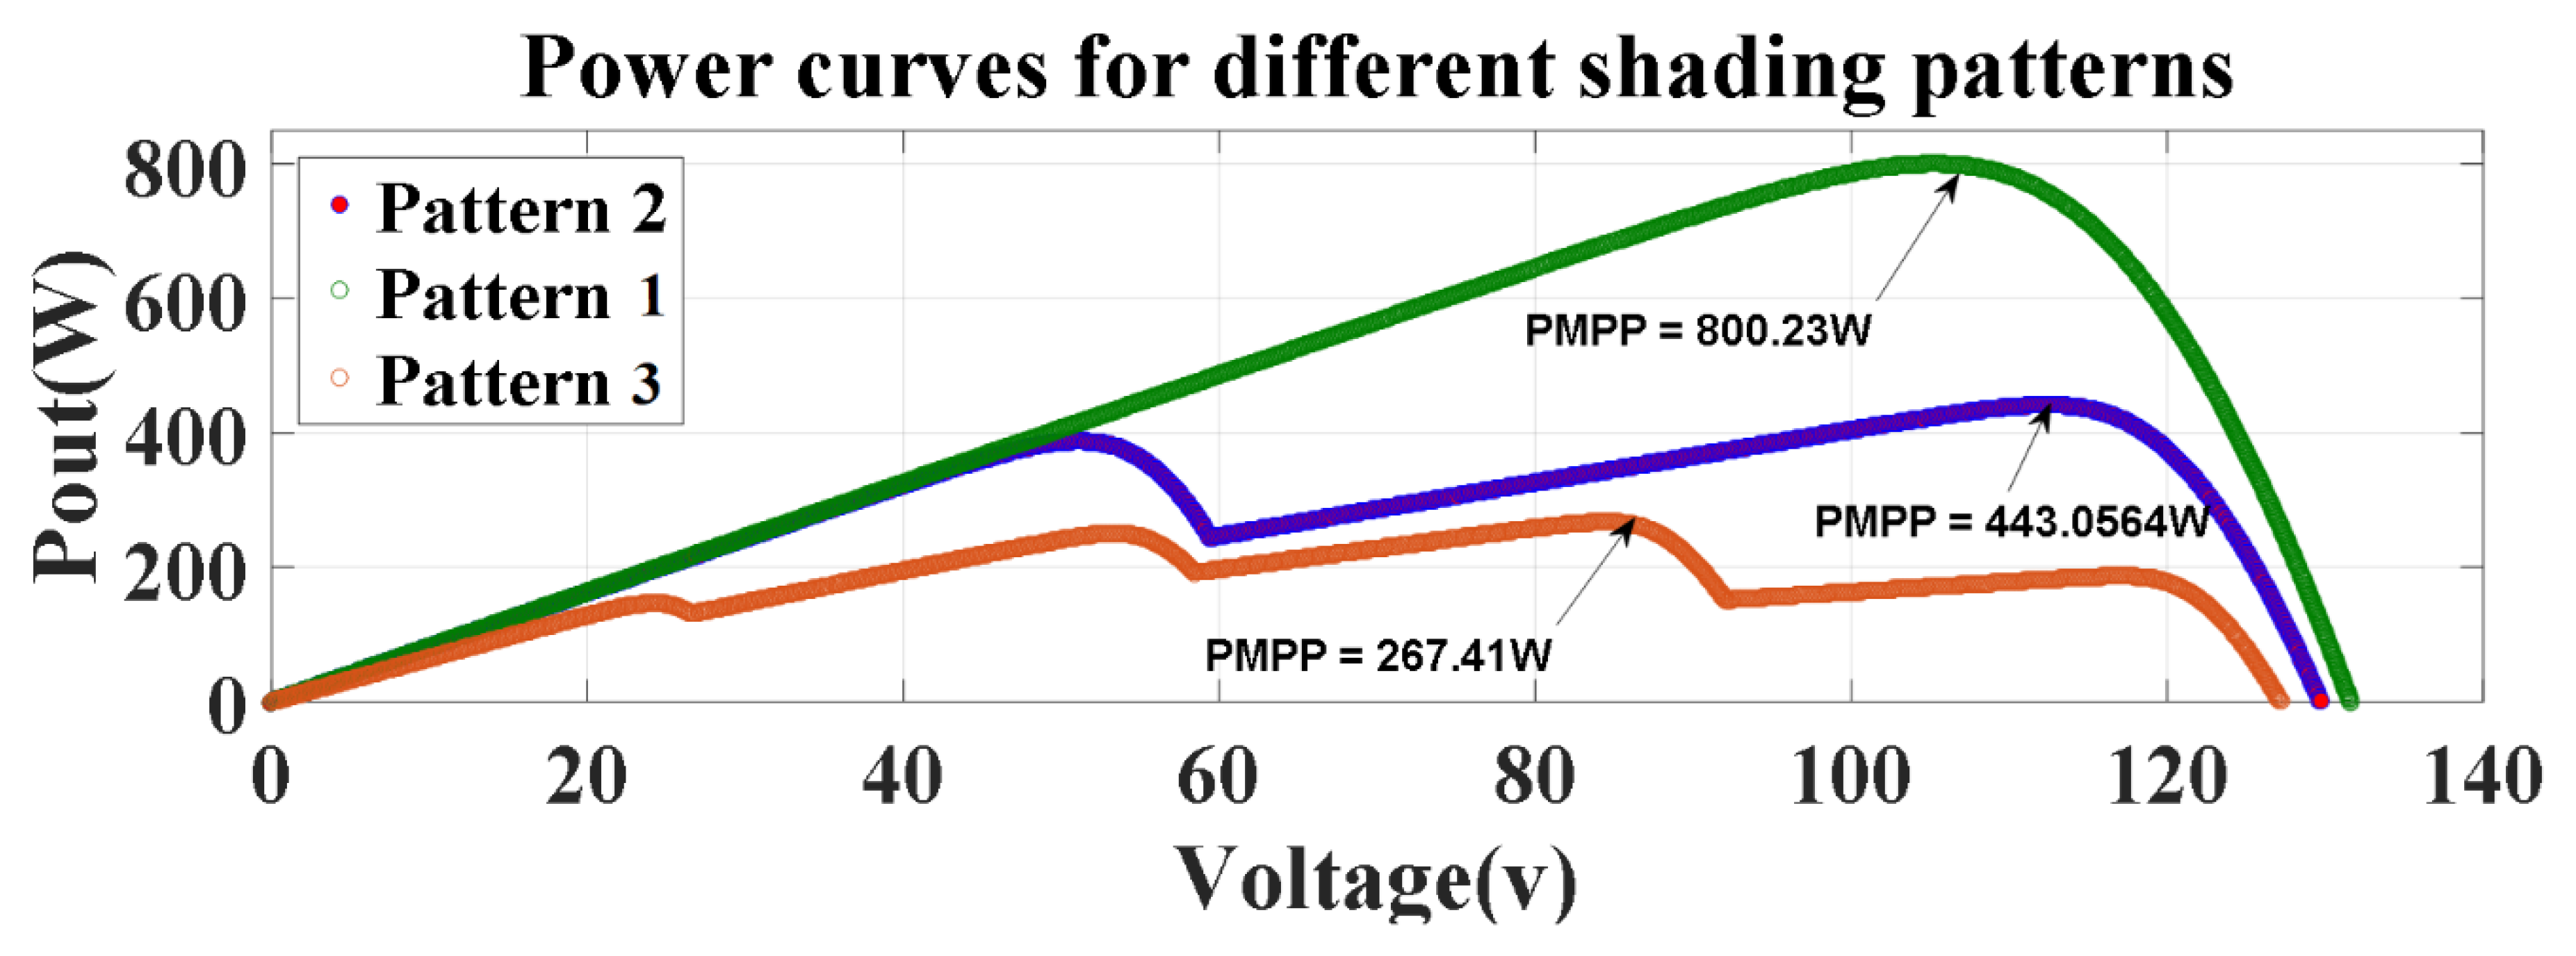
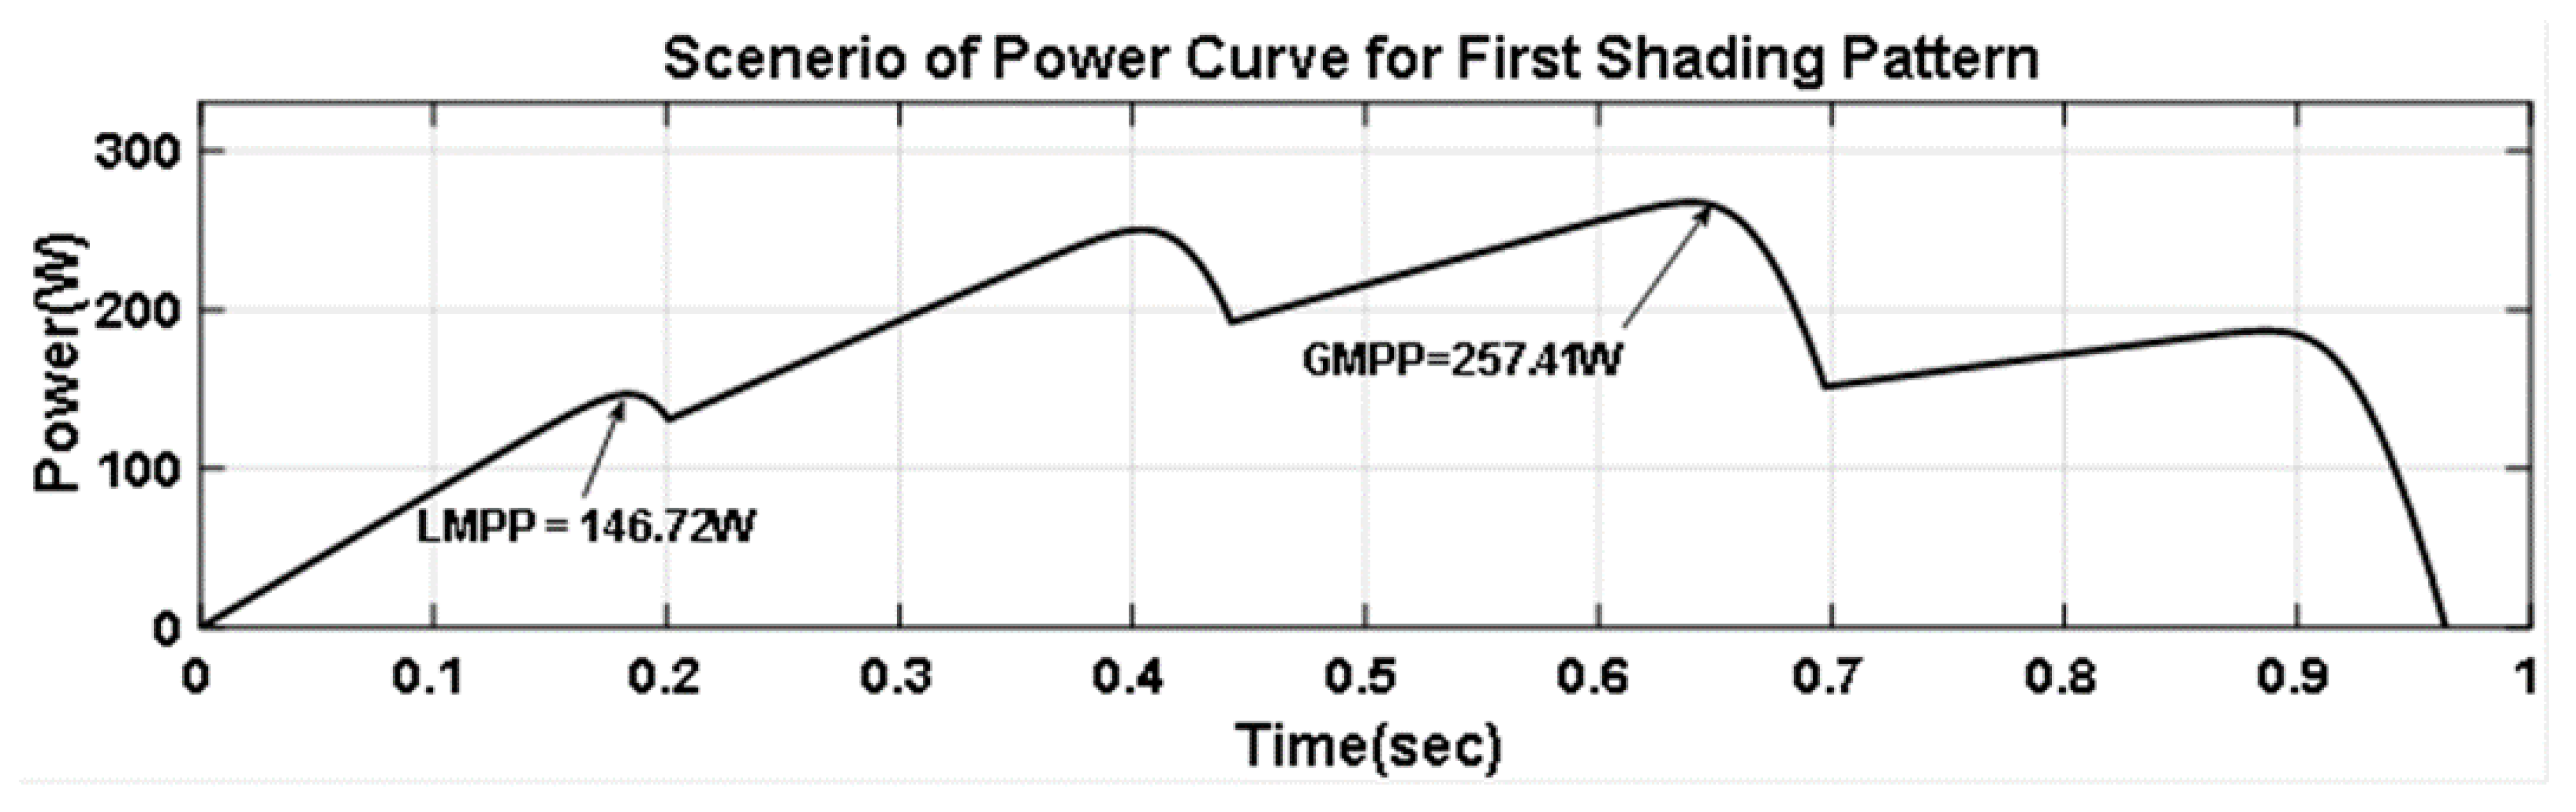
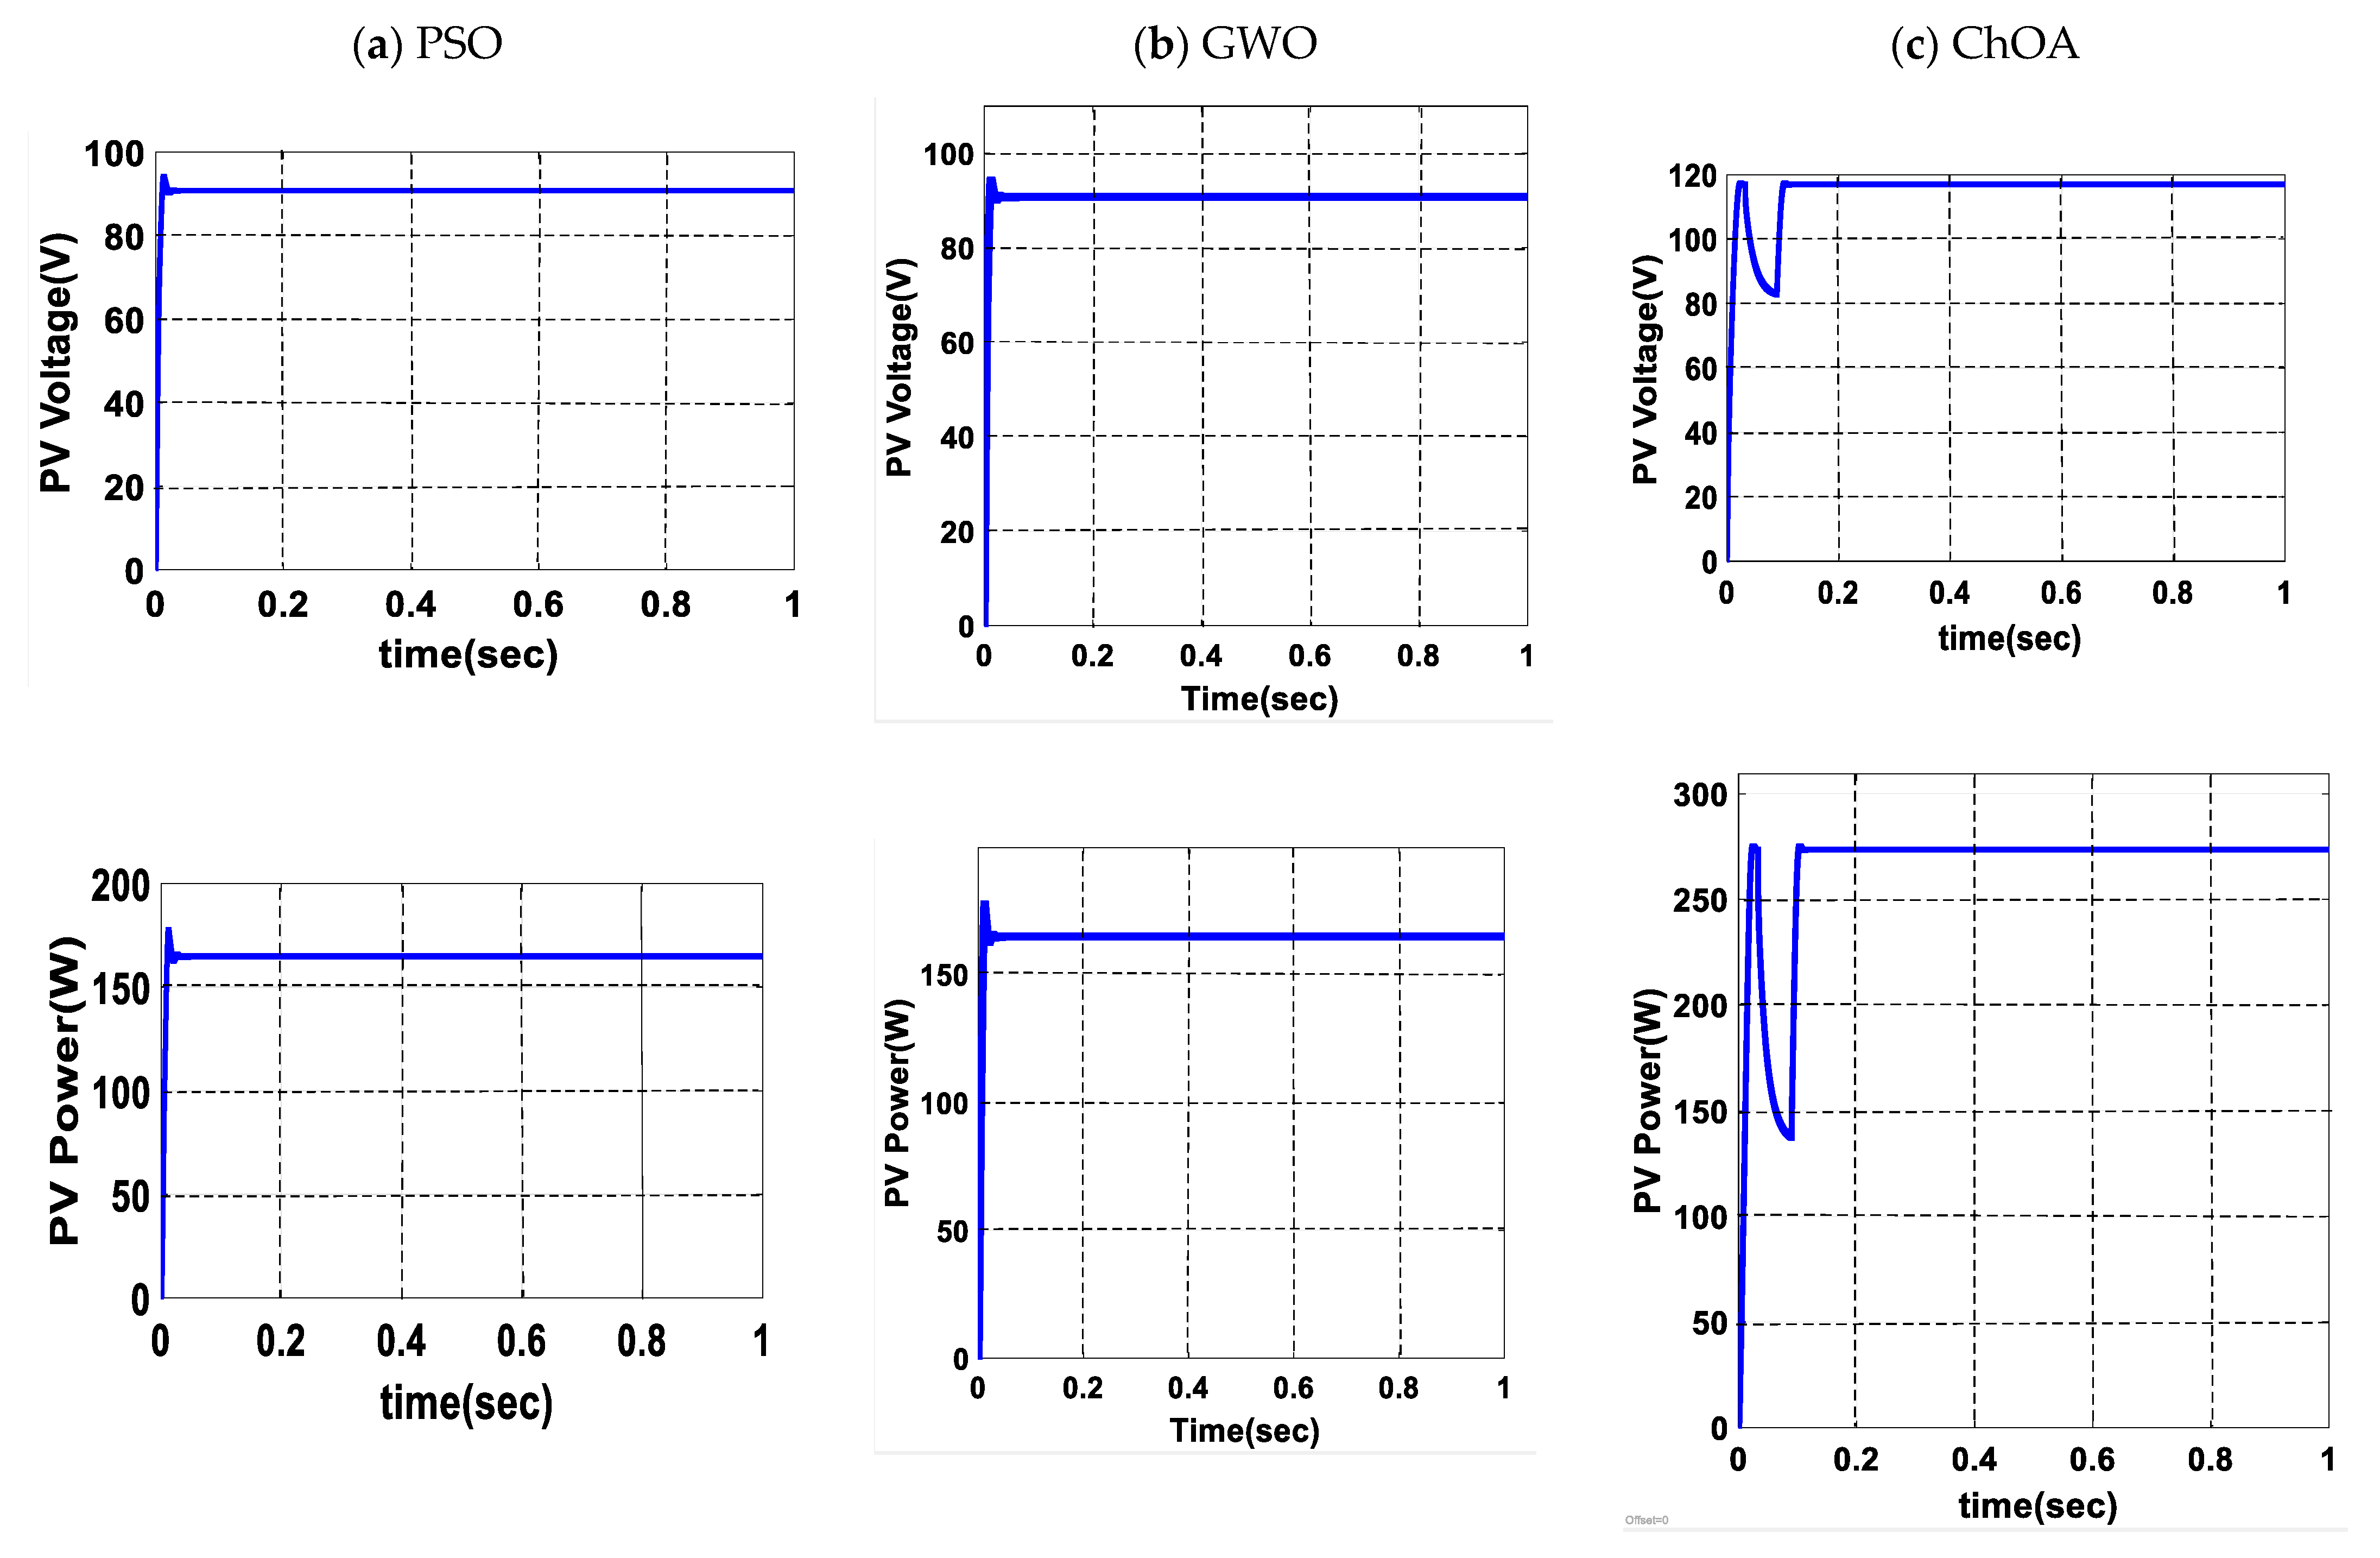
5.1. Shading Pattern1
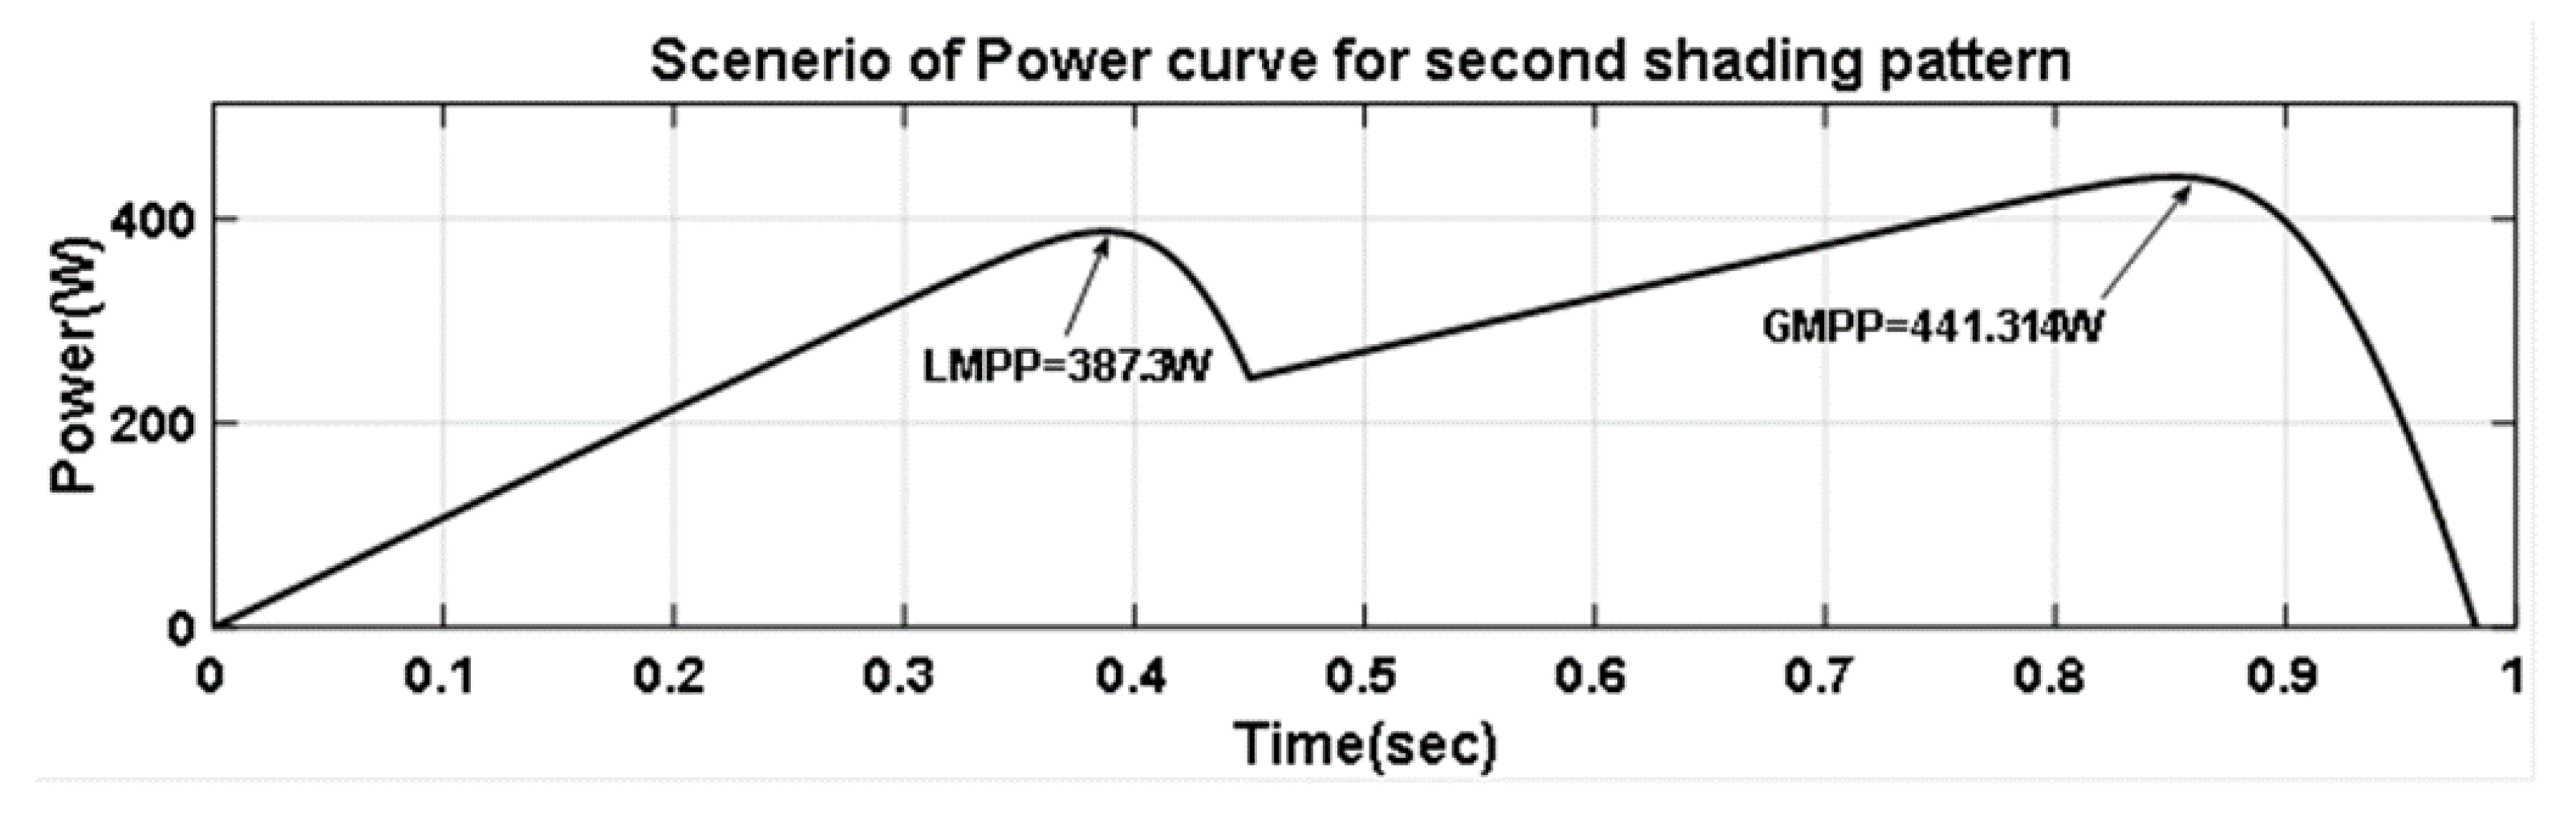
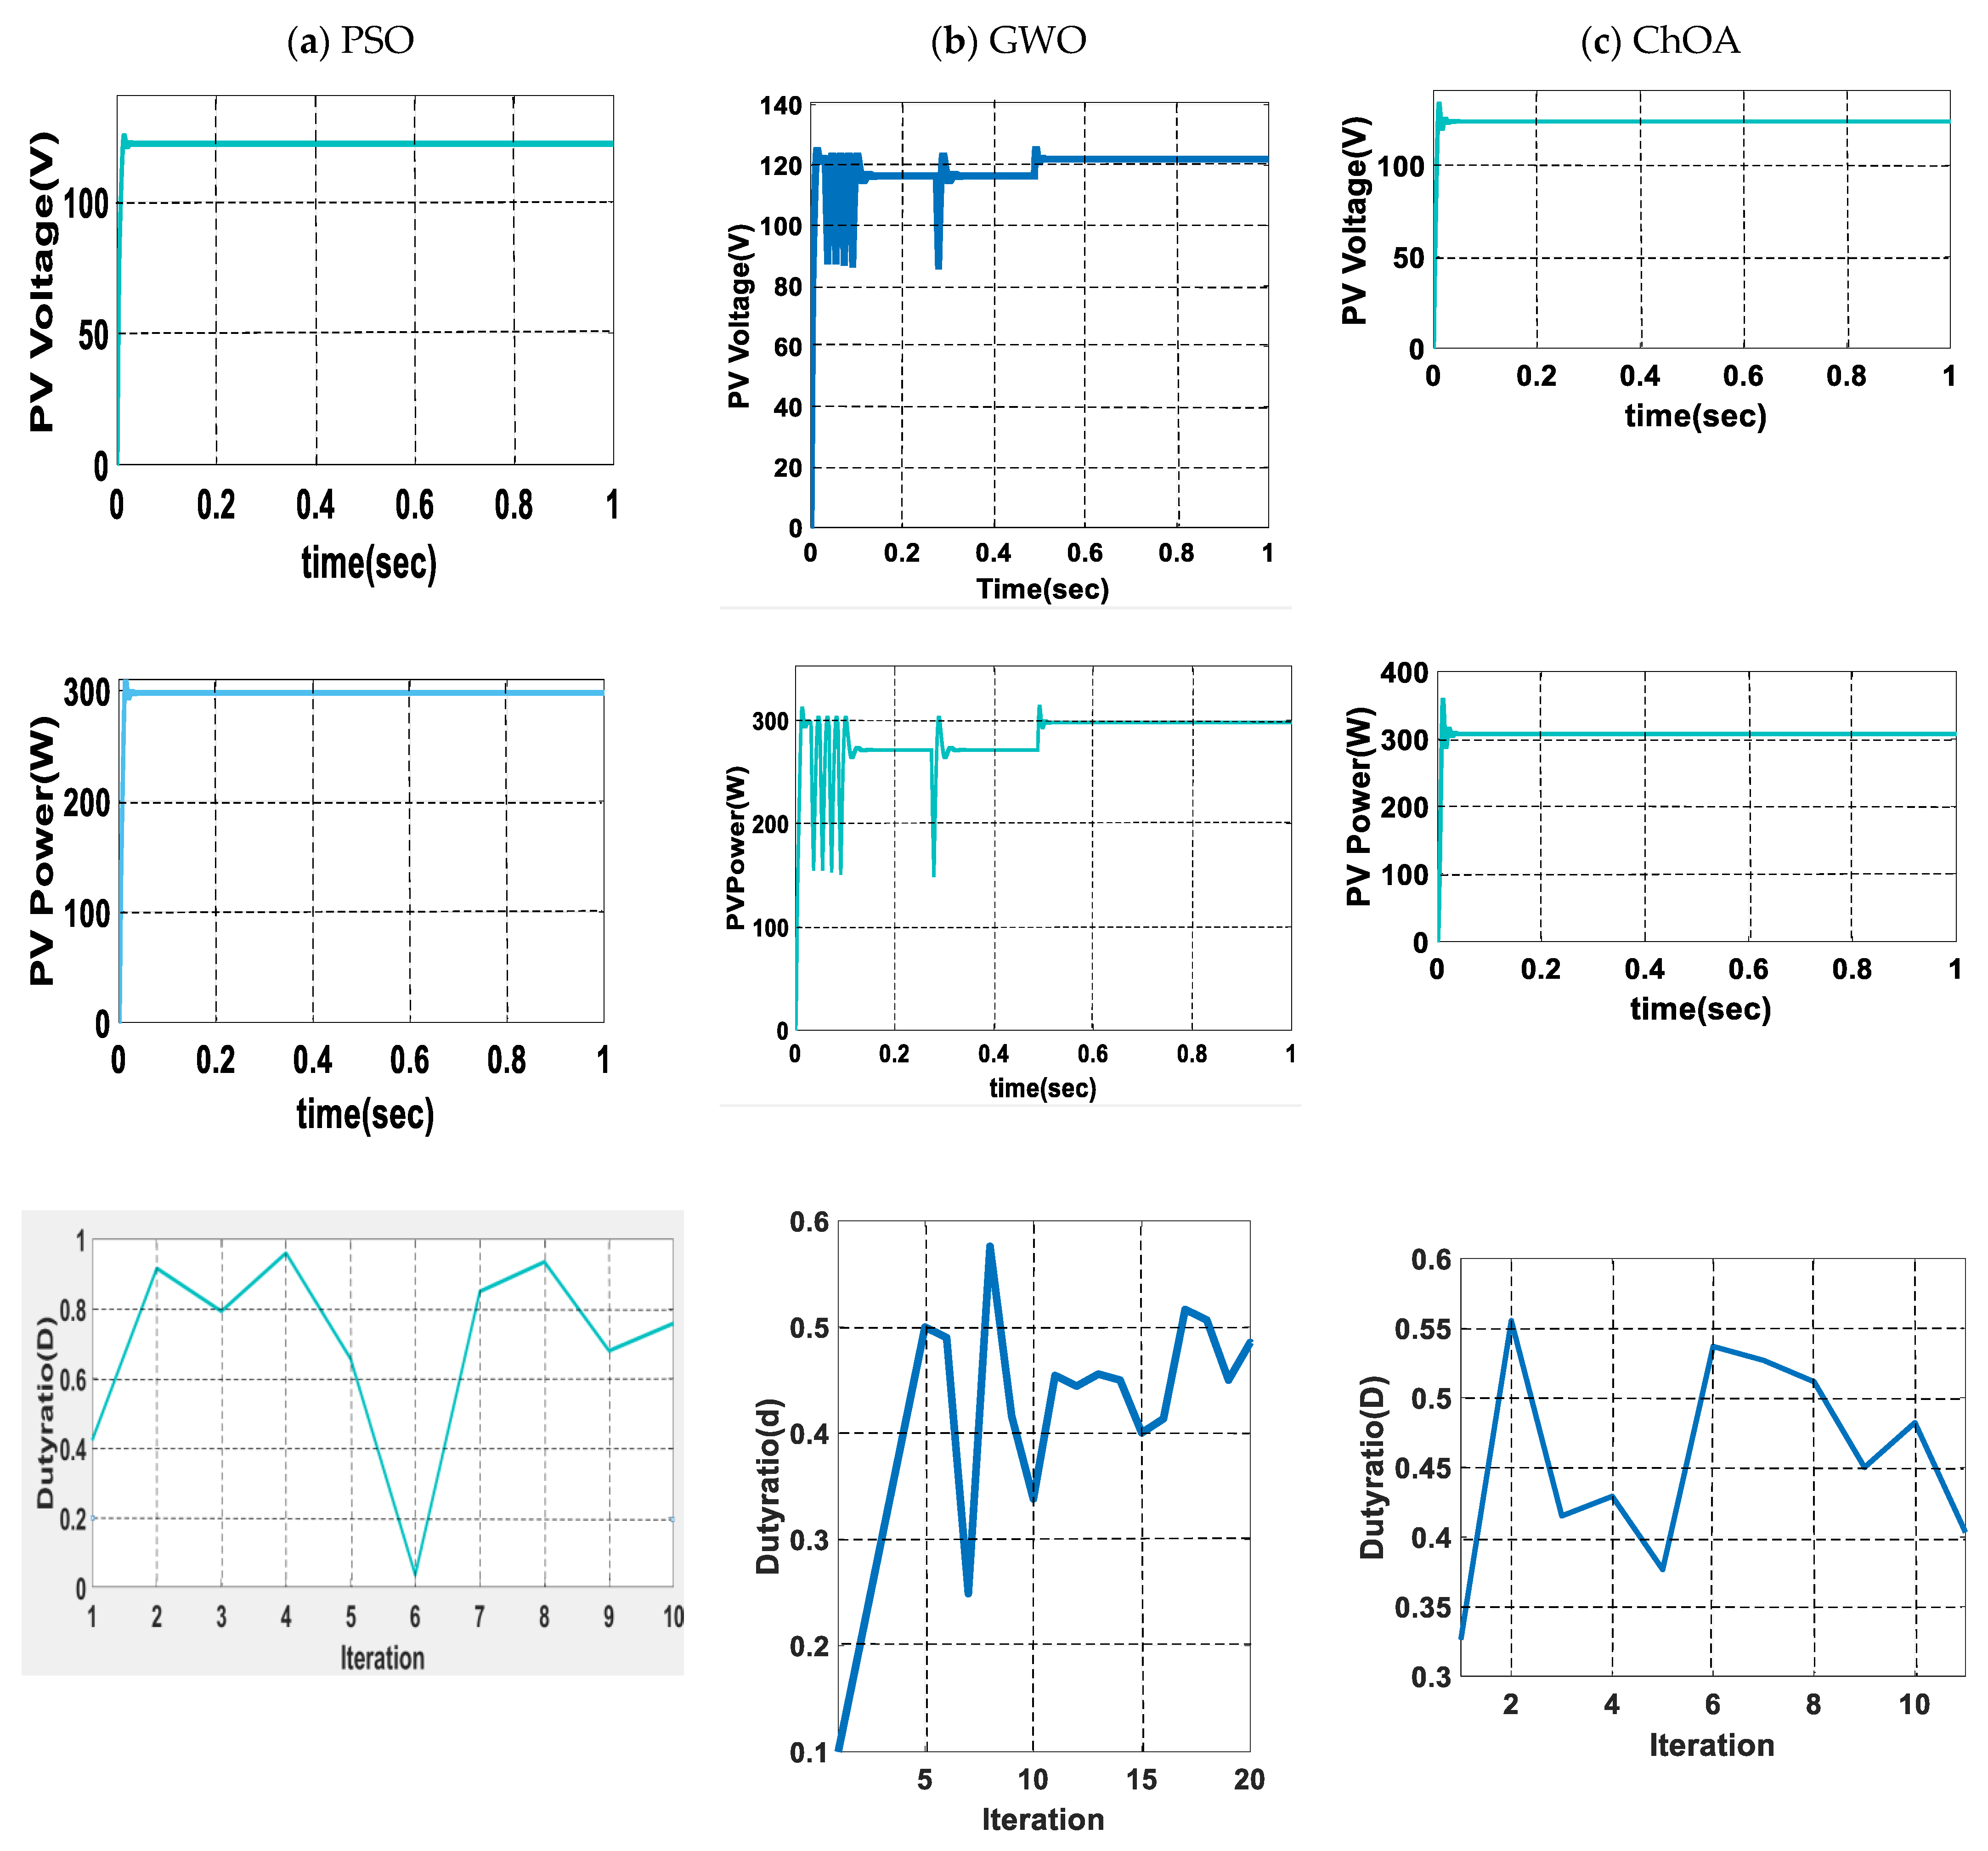
5.2. Shading Pattern 2
6. Conclusions
- ❖
- For the problem of MPPT tracking under partial shading conditions dividing the chimps into four individual groups ensures exploration and exploitation of the search space.
- ❖
- The utilization of chaotic maps guides the ChOA strategy to clear up nearby optima stagnation.
- ❖
- ChOA algorithm exploits four types of population-based search agents; prevention of local optima is very high.
- ❖
- Chimps stores explore space info above the sequence of iteration. Chimps relatively use memory to preserve the conquer resolution captured until now.
Author Contributions
Funding
Conflicts of Interest
Nomenclature
| PV | Photovoltaic |
| Ns | Total number of cells arranged in series |
| NP | Total number of cells arranged in parallel |
| I0 | Saturation current of the diode in amps |
| I PV | Photo current generated by the cell under standard test conditions |
| RS | Series resistance in Ω |
| RP | Shunt resistance in Ω |
| a | Fill factor |
| E | Irradiation in W/m2 |
| Vc | Open circuit voltage in V |
| ISC | Current under short-circuit in A |
| I o | Diode reverse saturation current in A |
| I N | Photocurrent developed at standard test condition in A |
| VPP | Voltage at MPP in V |
| IMP | Current near MPP in A |
| PMP | Power at MPP in Watts |
| D | duty cycle of the power converter |
| T | Simulation time in sec |
| PPV | PV panel power in Watts |
| VPV | Panel output Voltage in V |
| I PV | Panel output current in A |
| W | Inertia weight |
| C1 | Cognitive learning coefficient |
| C2 | Social learning coefficient |
| K | Iteration coefficient |
| I | iteration count number of PSO |
| Velocity of the nth particle at tth iteration | |
| Position of the nth particle at tth iteration | |
| Local best position achieved by nth particle at tth iteration | |
| Global best position achieved by nth particle at tth iteration | |
| Random values in the rage 0 to 1 | |
| t | Number of current iteration |
| a, m and c | Coefficient vectors |
| Prey position vector | |
| Chimp position vector | |
| m | |
| D | Distance between the chimp and prey |
References
- Márquez, F.P.G.; Karyotakis, A.; Papaelias, M. Renewable Energies: Business Outlook 2050; Springer: Berlin, Germany, 2018. [Google Scholar]
- Gonzalo, A.P.; Marugán, A.P.; Márquez, F.P.G. Survey of maintenance management for photovoltaic power systems. Renew. Sustain. Energy Rev. 2020, 134, 110347. [Google Scholar] [CrossRef]
- Charles Rajesh Kumar, J.; Majid, M.A. Renewable energy for sustainable development in India: Current status, future prospects, challenges, employment, and investment opportunities. Energy Sustain. Soc. 2020, 10, 1–36. [Google Scholar] [CrossRef]
- Regional Trends. Available online: https://www.irena.org/Statistics/View-Data-by-Topic/Capacity-and-Generation/Regional-Trends (accessed on 4 June 2021).
- Yang, B.; Zhong, L.; Zhang, X.; Shu, H.; Yu, T.; Li, H.; Jiang, L.; Sun, L. Novel bio-inspired memetic salp swarm algorithm and application to MPPT for PV systems considering partial shading condition. J. Clean. Prod. 2019, 215, 1203–1222. [Google Scholar] [CrossRef]
- Subudhi, B.; Pradhan, R. A Comparative Study on Maximum Power Point Tracking Techniques for Photovoltaic Power Systems. IEEE Trans. Sustain. Energy 2013, 4, 89–98. [Google Scholar] [CrossRef]
- Elgendy, M.; Zahawi, B.; Atkinson, D.J. Assessment of Perturb and Observe MPPT Algorithm Implementation Techniques for PV Pumping Applications. IEEE Trans. Sustain. Energy 2012, 3, 21–33. [Google Scholar] [CrossRef]
- Li, X.; Wen, H.; Chu, G.; Hu, Y.; Jiang, L. A novel power-increment based GMPPT algorithm for PV arrays under partial shading conditions. Sol. Energy 2018, 169, 353–361. [Google Scholar] [CrossRef]
- Elgendy, M.; Zahawi, B.; Atkinson, D.J. Assessment of the Incremental Conductance Maximum Power Point Tracking Algorithm. IEEE Trans. Sustain. Energy 2013, 4, 108–117. [Google Scholar] [CrossRef]
- Seyedmahmoudian, M.; Rahmani, R.; Mekhilef, S.; Oo, A.M.T.; Stojcevski, A.; Soon, T.K.; Ghandhari, A.S. Simulation and Hardware Implementation of New Maximum Power Point Tracking Technique for Partially Shaded PV System Using Hybrid DEPSO Method. IEEE Trans. Sustain. Energy 2015, 6, 850–862. [Google Scholar] [CrossRef]
- Shi, Y.; Li, R.; Xue, Y.; Li, H. High-Frequency-Link-Based Grid-Tied PV System With Small DC-Link Capacitor and Low-Frequency Ripple-Free Maximum Power Point Tracking. IEEE Trans. Power Electron. 2015, 31, 328–339. [Google Scholar] [CrossRef]
- Eltamaly, A.M.; Farh, H.M. Dynamic global maximum power point tracking of the PV systems under variant partial shading using hybrid GWO-FLC. Sol. Energy 2019, 177, 306–316. [Google Scholar] [CrossRef]
- Alajmi, B.N.F.M.T.; Ahmed, K.H.; Finney, S.J.; Williams, B.W. A Maximum Power Point Tracking Technique for Partially Shaded Photovoltaic Systems in Microgrids. IEEE Trans. Ind. Electron. 2011, 60, 1596–1606. [Google Scholar] [CrossRef]
- Martin, A.D.; Vazquez, J.R.; Cano, J. MPPT in PV systems under partial shading conditions using artificial vision. Electr. Power Syst. Res. 2018, 162, 89–98. [Google Scholar] [CrossRef]
- Kollimalla, S.K.; Mishra, M.K. Variable Perturbation Size Adaptive P&O MPPT Algorithm for Sudden Changes in Irradiance. IEEE Trans. Sustain. Energy 2014, 5, 718–728. [Google Scholar] [CrossRef]
- Reddy, N.N.; Chandrashekar, O.; Srujana, A. Power quality enhancement by MPC based multi-level control employed with improved particle Swarm optimized selective harmonic elimination. Energy Sources Part A Recover. Util. Environ. Eff. 2019, 41, 2396–2414. [Google Scholar] [CrossRef]
- Chowdhury, S.R.; Saha, H. Maximum power point tracking of partially shaded solar photovoltaic arrays. Sol. Energy Mater. Sol. Cells 2010, 94, 1441–1447. [Google Scholar] [CrossRef]
- Rehman, S.; Habib, H.U.R.; Wang, S.; Buker, M.S.; Alhems, L.M.; Al Garni, H.Z. Optimal Design and Model Predictive Control of Standalone HRES: A Real Case Study for Residential Demand Side Management. IEEE Access 2020, 8, 29767–29814. [Google Scholar] [CrossRef]
- Farzaneh, J.; Keypour, R.; Khanesar, M.A. A New Maximum Power Point Tracking Based on Modified Firefly Algorithm for PV System Under Partial Shading Conditions. Technol. Econ. Smart Grids Sustain. Energy 2018, 3, 9. [Google Scholar] [CrossRef] [Green Version]
- Durga, T.N.; Narasimham, P.V.R.L.; Vakula, V.S. Harness of maximum solar energy from solar PV strings using particle swarm optimisation technique. Int. J. Ambient. Energy 2019, 1–10. [Google Scholar] [CrossRef]
- Mao, M.; Zhang, L.; Duan, Q.; Oghorada, O.; Duan, P.; Hu, B. A Two-Stage Particle Swarm Optimization Algorithm for MPPT of Partially Shaded PV Arrays. Int. J. Green Energy 2017, 14, 694–702. [Google Scholar] [CrossRef]
- Ramli, M.A.; Twaha, S.; Ishaque, K.; Al-Turki, Y.A. A review on maximum power point tracking for photovoltaic systems with and without shading conditions. Renew. Sustain. Energy Rev. 2017, 67, 144–159. [Google Scholar] [CrossRef]
- Kumar, B.; Chauhan, Y.K.; Shrivastava, V. A comparative study of maximum power point tracking methods for a photovoltaic-based water pumping system. Int. J. Sustain. Energy 2013, 33, 797–810. [Google Scholar] [CrossRef]
- Sundareswaran, K.; Sankar, P.; Nayak, P.S.R.; Simon, S.P.; Palani, S. Enhanced Energy Output From a PV System Under Partial Shaded Conditions Through Artificial Bee Colony. IEEE Trans. Sustain. Energy 2015, 6, 198–209. [Google Scholar] [CrossRef]
- Nagadurga, T.; Narasimham, P.V.R.L.; Vakula, V.S. Global maximum power point tracking of solar PV strings using the teaching learning based optimisation technique. Int. J. Ambient. Energy 2020, 1–12. [Google Scholar] [CrossRef]
- Helwa, A.B.G.B.N.H. Maximum Collectable Solar Energy by Different Solar Tracking Systems. Energy Sources 2000, 22, 23–34. [Google Scholar] [CrossRef]
- Jeba, P.; Selvakumar, A.I. FOPID based MPPT for photovoltaic system. Energy Sources Part A Recover. Util. Environ. Eff. 2018, 40, 1591–1603. [Google Scholar] [CrossRef]
- Gangwar, P.; Singh, R.; Tripathi, R.P.; Singh, A.K. Effective solar power harnessing using a few novel solar tree designs and their performance assessment. Energy Sources Part A Recover. Util. Environ. Eff. 2018, 41, 1828–1837. [Google Scholar] [CrossRef]
- Gil-Velasco, A.; Aguilar-Castillo, C. A Modification of the Perturb and Observe Method to Improve the Energy Harvesting of PV Systems under Partial Shading Conditions. Energies 2021, 14, 2521. [Google Scholar] [CrossRef]
- Angadi, S.; Yaragatti, U.; Suresh, Y.; Raju, A. System Parameter Based Performance Optimization of Solar PV Systems with Perturbation Based MPPT Algorithms. Energies 2021, 14, 2007. [Google Scholar] [CrossRef]
- Khishe, M.; Mosavi, M. Chimp optimization algorithm. Expert Syst. Appl. 2020, 149, 113338. [Google Scholar] [CrossRef]
- Eltamaly, A. An Improved Cuckoo Search Algorithm for Maximum Power Point Tracking of Photovoltaic Systems under Partial Shading Conditions. Energies 2021, 14, 953. [Google Scholar] [CrossRef]
- Cheng, Z.; Zhou, H.; Yang, H. Research on MPPT control of PV system based on PSO algorithm. In Proceedings of the 2010 Chinese Control and Decision Conference, Xuzhou, China, 26–28 May 2010; Institute of Electrical and Electronics Engineers (IEEE): Piscataway, NJ, USA, 2010; pp. 887–892. [Google Scholar]
- Mohanty, S.; Subudhi, B.; Ray, P.K. A New MPPT Design Using Grey Wolf Optimization Technique for Photovoltaic System under Partial Shading Conditions. IEEE Trans. Sustain. Energy 2016, 7, 181–188. [Google Scholar] [CrossRef]
- Da Rocha, M.V.; Sampaio, L.P.; Da Silva, S.A.O. Comparative analysis of MPPT algorithms based on Bat algorithm for PV systems under partial shading condition. Sustain. Energy Technol. Assess. 2020, 40, 100761. [Google Scholar] [CrossRef]


| Group | Barrier | Attacker | Driver | Chaser |
|---|---|---|---|---|
| f |
| Function | Range | Dim |
|---|---|---|
| [−5, 5] | 2 | |
| [−5, 5] | 2 |
| Function | ChOA | GWO | PSO | |
|---|---|---|---|---|
| Mean | −1.03163 | −1.03163 | −1.03158 | |
| SD | 6.25 × 10⁻¹⁶ | 2.63 × 10⁻⁸ | 2.95 × 10⁻⁵ | |
| Best | −1.03163 | −1.03163 | −1.03163 | |
| Worst | −1.03163 | −1.03163 | −1.03152 | |
| Mean | −26.8026 | −26.8026 | −26.7927 | |
| SD | 1.00 × 10⁻¹⁴ | 5.26 × 10⁻⁶ | 0.010597 | |
| Best | −26.8026 | −26.8026 | −26.8026 | |
| Worst | −26.8026 | −26.8026 | −26.7547 |
| Parameter | Value |
|---|---|
| Number of cells | 54 |
| Voc—open-circuit voltage in (V) | 32.9 V |
| Isc—short Circuit Current in (A) | 8.21 A |
| VMpp—Maximum voltage at MPP (V) | 26.3 V |
| IMpp—Maximum current at MPP (A) | 7.61 A |
| PMpp (W) | 200.143 W |
| Number of series-connected strings | 1 |
| Number of parallel-connected strings | 1 |
| Algorithm | Specification | Value |
|---|---|---|
| PSO | Inertia coefficient(W) | 0.8–1.2 |
| Design variables | 1 | |
| Number of runs | 10 | |
| Cognitive and social learning coefficient (C1&C2) | 2 | |
| Probability of search ratio | 0.02 | |
| GWO | No. of agents (wolf) | 10 |
| Positive Limit | 5 | |
| Negative limit | −5 | |
| Number of iterations | 10 | |
| ChOA | f | Details given in Table 1 |
| r1, r2 | Random values | |
| m | chaotic | |
| No of search agents | 10 | |
| iterations | 10 |
| Different Shading Patterns | Parameter | MPPT Methods | |||
|---|---|---|---|---|---|
| ChOA | PSO | GWO (Mohanthy et al. [34]) | Bat (Roacha et al. [35]) | ||
| M1 = [1000, 900, 800, 700] | Maximum power | 625.5319 W | 625.4645 W | 622.4625 W | 624.321 W |
| Duty @MPP | 0.3196 | 0.4026 | 0.302 | 0.321 | |
| Voltage | 115.23 V | 112.8706 V | 110.023 V | 111.212 V | |
| Current | 5.5656 A | 5.5687 A | 3.975 A | 3.865 A | |
| M2 = [800, 650, 100, 500] | Maximum power | 335.6 W | 331.2 W | 329.7 W | 329.75 W |
| Duty @GMPP | 0.3296 | 0.3021 | 0.297 | 0.257 | |
| Voltage | 84.57 V | 83.4 V | 80.7 V | 81.2 V | |
| Current | 3.9489 A | 3.85 A | 2.95 A | 3.12 A | |
| M3 = [650, 850, 400, 900] | Maximum power | 350.0825 W | 349.5 W | 325.5 W | 329.56 W |
| Duty @GMPP | 0.6127 | 0.6027 | 0.507 | 0.527 | |
| Voltage | 53.6725 V | 53.21 V | 51.5 V | 52.5 V | |
| Current | 6.5915 A | 6.312 A | 6.123 A | 6.223 A | |
| M4 = [500, 600, 1000, 400] | Maximum power | 260.2923 W | 258.2 W | 256.2 W | 257.2 W |
| Duty @GMPP | 0.5163 | 0.5026 | 0.4062 | 0.496 | |
| Voltage | 56.4194 V | 55.41 V | 53.55 V | 54.12 V | |
| Current | 4.3234 A | 4.123 A | 4.091 A | 4.112 A | |
| M5 = [400, 100, 850, 250] | Maximum power | 171.8035 W | 170.5W | 165.5 W | 168.5 W |
| Duty @GMPP | 0.4630 | 0.4630 | 0.4203 | 0.445 | |
| Voltage | 86.3148 V | 85.31 V | 84.4 V | 84.6 V | |
| Current | 2.8733 A | 2.853 A | 2.583 A | 2.612 A | |
| M6 = [350, 400, 700, 150] | Maximum power | 232.75 W | 230.133 W | 214.5 W | 216.5 W |
| Duty @GMPP | 0.2704 | 0.2541 | 0.2543 | 0.252 | |
| Voltage | 87.543 V | 86.4692 V | 85.54 V | 86.12 V | |
| Current | 2.9210 A | 2.8177 A | 2.718 A | 2.725 A | |
| Authors | Optimization Technique for MPPT Tracking | Variable Specification | Charge Controller | Dynamic Response | Tracking Speed | Contribution of the Work |
|---|---|---|---|---|---|---|
| Eltamaly et al. [12] | Hybrid GWO-FLC | Duty cycle | Boost Converter | High | Fast | Developed the flow chart for hybrid GWA along with fuzzy logic controller |
| Nagadurga et al. [20] | PSO | Duty Cycle | Boost Converter | Good | Slow | Proposed increment in PV power using PSO technique |
| Nagadurga et al. [25] | TLBO technique | Duty Cycle | Boost Converter | Medium | Moderate | Examined the TLBO algorithm for different weather conditions |
| Javad et al. [19] | FA | Voltage | Boost Converter | Medium | Fast | Proposed FA for extracting global peak power during shading conditions |
| Present study | Chimp Optimization technique | Duty Cycle | Boost Converter | Fast | Moderate | Proposed chimp optimization technique for MPPT under partial shading conditions |
| Optimization Technique | Parameter | Shading Pattern M1 | Shading Pattern M2 | Shading Pattern M3 |
|---|---|---|---|---|
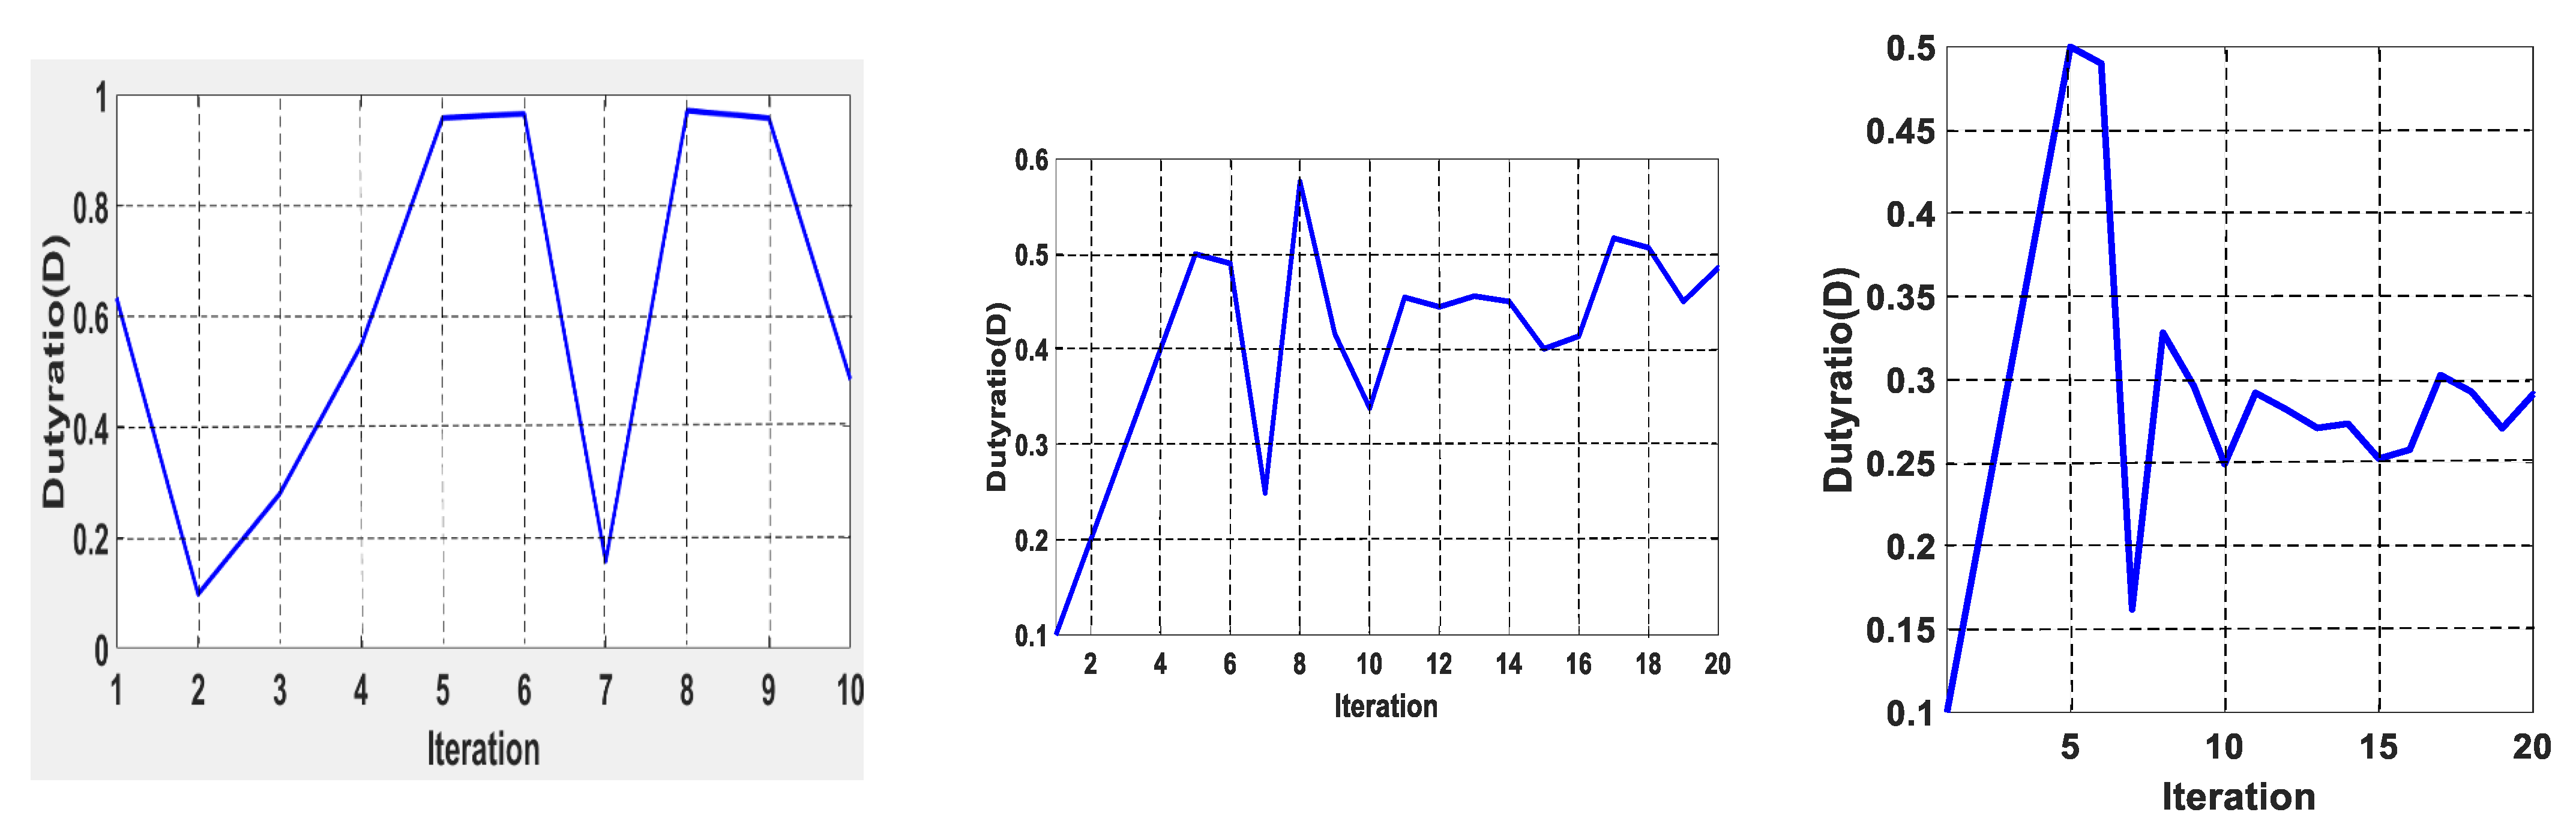
| ChOA | Minimum iterations | 2 | 3 | 2 |
| Maximum iteration | 4 | 5 | 6 | |
| Convergence time to trace GMPP(s) | 0.10 | 0.12 | 0.10 | |
| Efficiency | 100 | 99.99 | 99.85 | |
| PSO | Minimum iterations | 2 | 4 | 3 |
| Maximum iteration | 6 | 8 | 9 | |
| Convergence time to trace GMPP(s) | 0.14 | 0.16 | 0.23 | |
| Efficiency | 98.56 | 98.99 | 98.66 |
Publisher’s Note: MDPI stays neutral with regard to jurisdictional claims in published maps and institutional affiliations. |
© 2021 by the authors. Licensee MDPI, Basel, Switzerland. This article is an open access article distributed under the terms and conditions of the Creative Commons Attribution (CC BY) license (https://creativecommons.org/licenses/by/4.0/).
Share and Cite
Nagadurga, T.; Narasimham, P.V.R.L.; Vakula, V.S.; Devarapalli, R.; Márquez, F.P.G. Enhancing Global Maximum Power Point of Solar Photovoltaic Strings under Partial Shading Conditions Using Chimp Optimization Algorithm. Energies 2021, 14, 4086. https://doi.org/10.3390/en14144086
Nagadurga T, Narasimham PVRL, Vakula VS, Devarapalli R, Márquez FPG. Enhancing Global Maximum Power Point of Solar Photovoltaic Strings under Partial Shading Conditions Using Chimp Optimization Algorithm. Energies. 2021; 14(14):4086. https://doi.org/10.3390/en14144086
Chicago/Turabian StyleNagadurga, Timmidi, Pasumarthi Venkata Ramana Lakshmi Narasimham, V. S. Vakula, Ramesh Devarapalli, and Fausto Pedro García Márquez. 2021. "Enhancing Global Maximum Power Point of Solar Photovoltaic Strings under Partial Shading Conditions Using Chimp Optimization Algorithm" Energies 14, no. 14: 4086. https://doi.org/10.3390/en14144086