Article

Rescheduling of Generators with Pumped Hydro Storage Units to Relieve Congestion Incorporating Flower Pollination Optimization

by
Padmini Sankaramurthy
1,
Bharatiraja Chokkalingam
1,2,*,
Sanjeevikumar Padmanaban
3,*,
Zbigniew Leonowicz
4 and
Yusuff Adedayo
2
1
Department of Electrical and Electronics Engineering, SRM Institute of Science and Technology, Chennai 603 203, India
2
Department of Electrical Engineering, University of South Africa, Florida Park, Roodepoort 1709, South Africa
3
Department of Energy Technology, Aalborg University, 6700 Esbjerg, Denmark
4
Faculty of Electrical Engineering, Wroclaw University of Science and Technology, Wyb. Wyspianskiego 27, 50370 Wroclaw, Poland
*
Authors to whom correspondence should be addressed.
Energies 2019, 12(8), 1477; https://doi.org/10.3390/en12081477
Submission received: 3 March 2019 / Revised: 31 March 2019 / Accepted: 4 April 2019 / Published: 18 April 2019

Abstract

:
In this paper, a Flower Pollination Algorithm (FPA) has been proposed for relieving congestion in the deregulated power electricity industry. Congestion in the power market is one the contemplative challenges to be overcome in the era of deregulation. The primary cause of congestion is due to the loss of the transmission line, an increase in load, or loss of generator(s). Hence, managing congestion is one of the issues which have to be tackled in the present scenario. There are several techniques to relieve congestion. It is quite well-known that the thermal limits of transmission lines in a power system are fixed. One of the methods to abate congestion is to reschedule the real power of the generators. The purpose of the present work is to benefit the Independent System Operator (ISO) in reliving congestion. (1) In order to meet this objective effectively, a FPA algorithm has been proposed for relieving congestion and is simulated on a modified IEEE 30-bus system initially. (2) Congestion cost, compared with and without the application of FPA, is computed. (3) To validate its effectiveness, the obtained results are compared with recent power system optimization algorithms present in the literature. (4) Further, the work has been extended with the incorporation of a Pumped Hydro Storage Unit (PHSU). Here an economic analysis of congestion cost reduction employing FPA before and after the incorporation of PHSU is investigated applying FPA. In comparison with other evolutionary algorithms, the uniqueness of generating a new population is attained in FPA by the levy flight procedure. It is one of the latest evolved algorithms and is suited for different power system problem due to fewer clear-cut tuning parameters in contrast with other algorithms. (5) Furthermore, the effects of other network parameters, including system losses and voltage, has been computed. The result obtained is tested in terms of congestion mitigation with and without the incorporation of PHSU, in terms of novel objective improvement, and with and without applying recently evolving FPA for the above application. Thus the objective-wise and algorithmic-wise innovative concept has been presented. This proves effectiveness of the algorithm in terms of minimized cost convergence and other parameter including system losses and voltage before and after the incorporation of PHSU as compared with other recent trendsetting reported optimization techniques.

1. Introduction

The integration of utilities being vertical, the task of separating the cost incurred in generation, transmission and distribution is quite difficult. Thus, the utilities put an average tariff on to their customer which relies on the aggregated fixed price for a specific period. Some of the external agencies fix the price which focuses more on consideration rather than economics. Occurrence of Congestion at a location in power transmission system will not be able to suit all the proposed bi/multilateral exchanges. It is due to the inability to incorporate the Existing Transmission Commitments (ETC), due to the infringement of operating constraints. A glimpse of a detailed survey related to managing the congestion issues occurring worldwide has been schemed in [1]. The authors have explained the techniques for consolidating deregulated market arrangements for the better utilizations of the power resources thereby providing solution to the issues [2]. A model with the inclusion of system stability criterion has been accounted for so as to relieve congestion [3]. A methodology for the embodiment of the reactive power services and real power loss while overseeing congestion has been considered [4]. The authors have examined the effects of FACTS arrangement for pacifying this problem [5]. The impact of congestion on the power system, and the financial signs of dispensing the associated cost venture have been discussed in [6]. The authors have proposed congestion management based zones/cluster; wherein the zones are being decided by the congestion distribution factors [7,8]. A combination of pool and bilateral trading has been considered for managing the congestion in a market based environment [9]. The author has assessed a detailed review on managing the congestion in different scenario of the market under privatization structure [10,11]. This paper ranks the management of congestion activities and its trappings on socio-economic impacts has been addressed in a divergent private mob. An analytical model based optimal technology comprising elements such as transformer taps and optimal switching has been incorporated for eliminating congestion [12]. A secure path of managing congestion with the due consideration of stability has been urged in [13,14]. Here the optimization problem has been effectively handled incorporated with penalty constraints [15,16].
Managing the congestion can be eased with different algorithm such as Simulated Annealing (SA), Random Search Method (RSM) and Particle Swarm Optimization (PSO) and tested on modified IEEE 30 bus system and IEEE 57 bus system. Further this issue has been dealt with the embodiment of nonconventional wind energy system [17]. This paper addresses the combined operation of energy utilization from hydro and wind is utilized for devising the mathematical model for bidding in a day-ahead energy market [18]. Adjusting the real power output of generators in order to meet the power demand is a real time challenge in the present scenario in the power grid. PHSU has commercially proven to meet the changes in power demand owing to its capability to start/stop quickly in accordance to change in load. The authors have presented the erection and devising of PHSU to serve peak demand. Further an insight analysis has been carried out on electricity pricing and its associated guidelines adopted [19]. This paper renders a wide vision into the recent development of PHSU in relation to its participation in deregulated energy market [20]. Further it addresses the flexibility of PHSU aiding in shift of generation thereby avoiding congestion and manages reliable supply of power in the grid. A formative structure has been incorporated with combined operation of hydro and PHSU for apprehending the volatility in pricing for in order to improvise the payoff from the generators [21]. Implementation of PSHU along with thermal plants enabled a steady decrease in emission [22,23]. This paper interprets the saving in cost yielded by optimal use of PHSU when operated during peak demand and thermal usage during off-peak demand [24]. The superiority of PHSU elevated the efficiency in energy transaction [25,26,27]. FPA and its variants have been developed in recent years which are found to yield better efficient outputs in applications for optimization designing due to its single probability switching parameter [28]. It associates the non-linearity Levy flight mechanism which proves to be effectively suited for multi-objective for enhancing the algorithmic performance of exploring the distant pollinator thereby globally exploring and locally exploiting by the consistency of flowers chosen [29,30]. FPA has been tested on IEEE 30 bus system with three different objective functions incorporating economic load dispatch and result obtained is compared with other optimization techniques proving for its robustness over other existing algorithms [31]. Symbiotic Organisms Search algorithm [32], Ant lion algorithm [33], Gravitational Search Algorithm [34], Teaching Learning Based Optimization (TLBO) [35] are few of the latest algorithms have been found proposed for extenuating congestion. Switching the transmission lines in optimal sequence is one of the novel technologies to subdue congestion [36]. A novel distribution Algorithm has been proposed using nash equilibrium for effective cost reduction due to wheeling [37]. The technological advancements employing Power Electronic circuitry for Hydro Energy Electric Systems contributes widely in terms of economical payment and space reduction [38]. The reliability of the PHSU is effectively eased with the incorporation of Doubly-Fed Induction Motor [39]. The future prospects of adventing compressed air storage embedded with PHSU has been discussed. This could increase the performance utilization of energy. This proves to be a viable solution for the power industry in the future [40].
The major contributions of the paper are as follows. The main idea is to propose a methodology for managing the problem of congestion with cost reduction by rescheduling the generators active power. To achieve this task, FPA Algorithm is presented here. The stimulus of the present effort is to benefit the ISO in reliving the congestion. Here, modified IEEE 30 bus system is used as the test case. Initially an outage is created to cause the Congestion which results in power flow violation in certain transmission lines and the Congestion cost has been computed. Then the novel FPA is schemed as an efficient optimizing tool for rescheduling cost minimization as well as reduces the system losses. Further the rescheduling Congestion cost is compared with and without the application of FPA is computed. The effectiveness of the proposed Algorithm is proven in terms of minimized Congestion cost. To validate its effectiveness, the obtained results are compared with other optimization algorithms already reported in literature. Thereafter to replenish the varying load demand nature, a PHSU unit has been incorporated in it. The efficacy of FPA algorithm incorporating with PHSU is then investigated in terms of congestion cost minimization.
The paper is methodized as follows: 
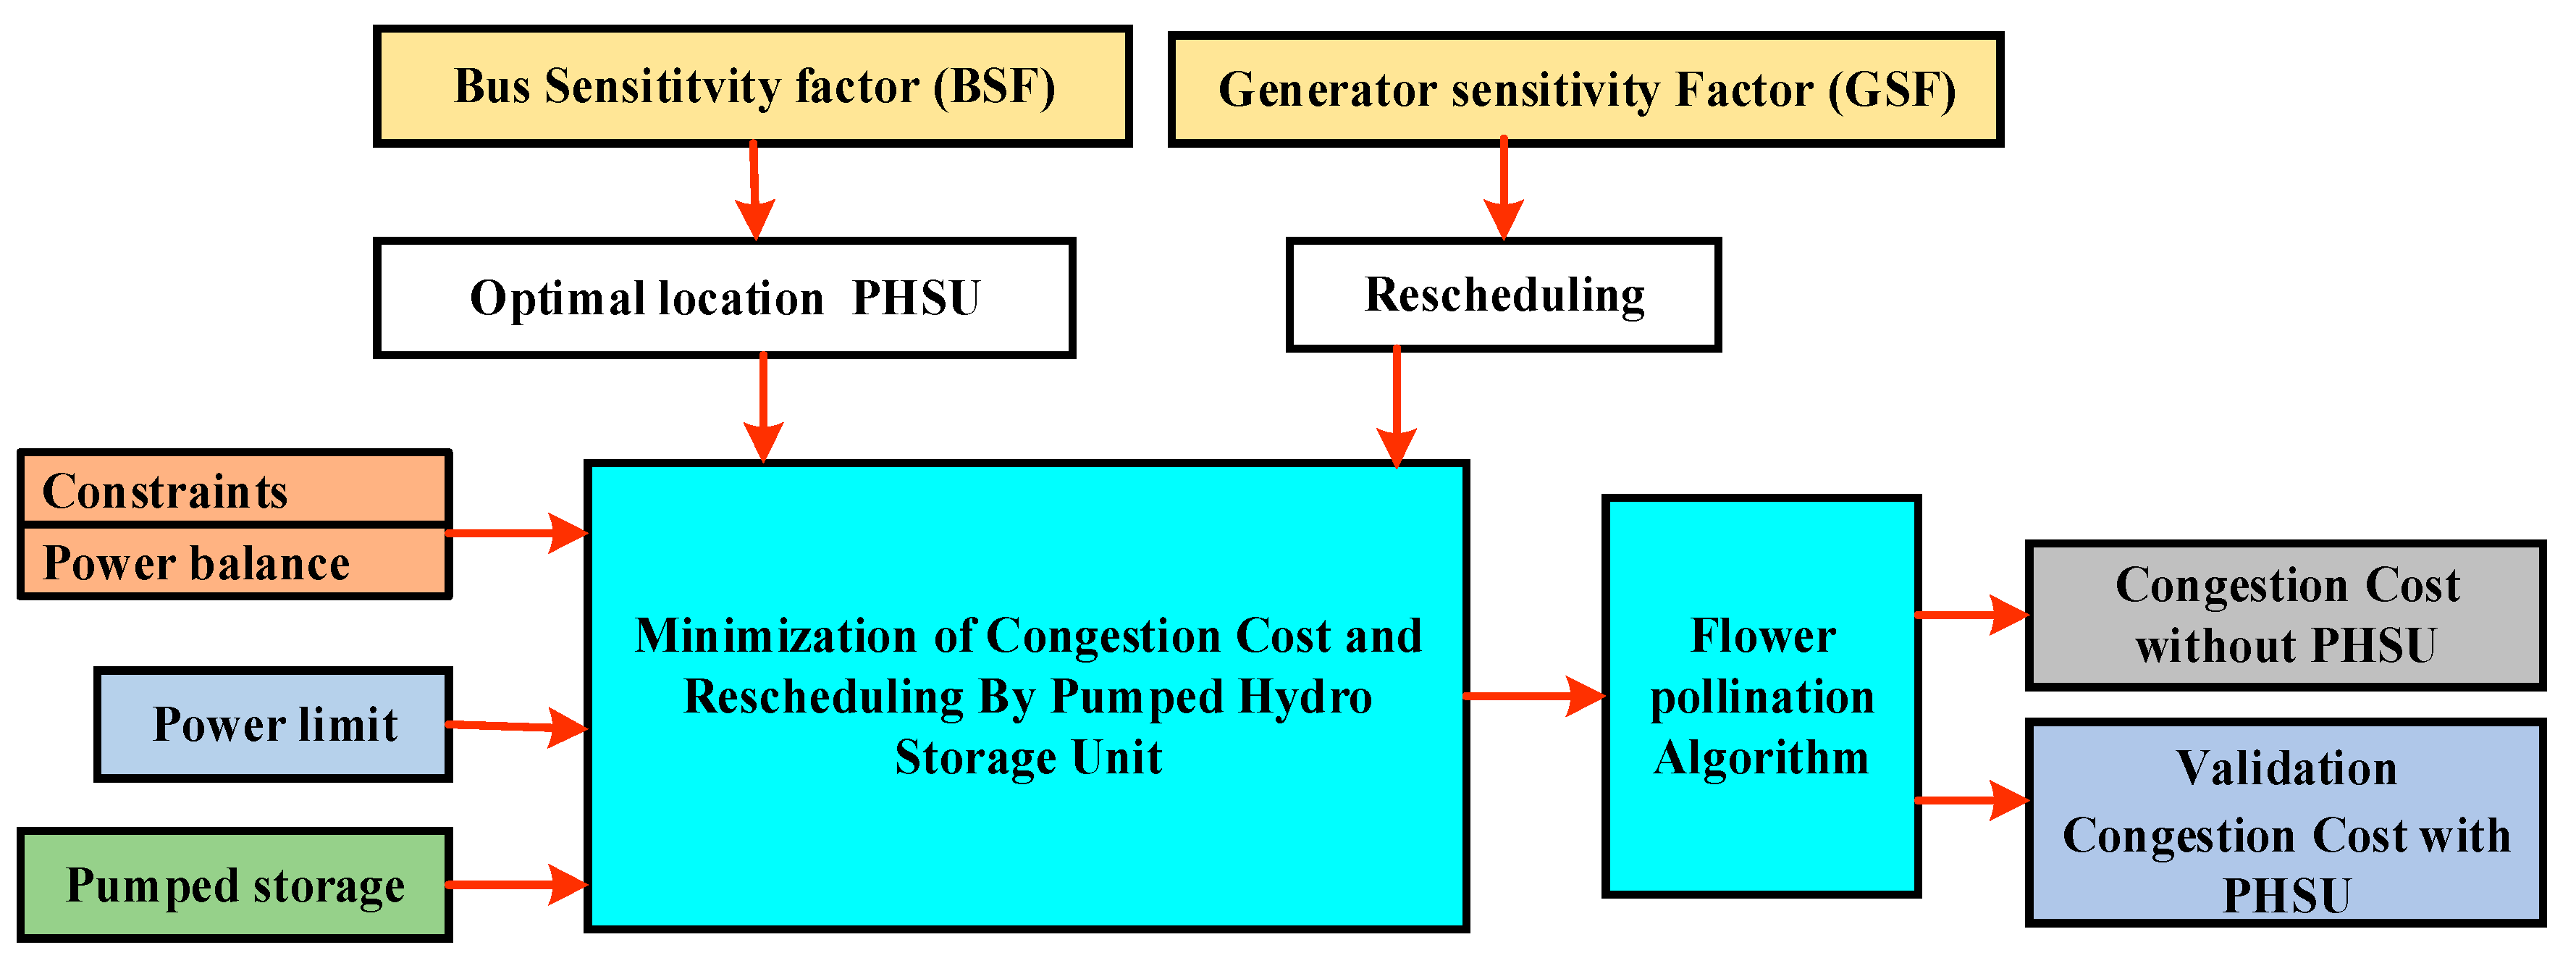
Section 2 deals with the frame work criterion of managing congestion by rescheduling of generator’s active power with the inclusion of PHSU in terms of congestion cost and loss minimization. Section 3 accomplishesFPA as an efficient optimizing tool for congestion cost minimization as well as reduces the system losses. Section 4 discusses the power flow violation due to congestion and the application of suitable methodology namely FPA. The efficacy of FPA in benefitting the Independent System Operator (ISO) in reliving the congestion is presented here. Here, modified IEEE 30 bus system is used as the test case. There after it is validated with other optimization techniques. Section 5 presents the significance of PHSU incorporated in the test system in aiding further reduction in congestion cost, losses and voltage profile improvement embodying BSF and GSF. Furthermore an economic analysis of congestion cost reduction using FPA before and after the incorporation of PHSU is investigated.

2. Problem Formulation

The main objective that is been focused is to reduce the congestion cost of the system taken into consideration.
Minimize   k = 1 N k C k n ( Δ P k n ) Δ P k n  
where,
  • C k n   : Rescheduling cost of power by generators as per increase and decrease price bids at interval n.
  • Δ P k n : Incremental change in active power adjustment of the generator at interval n.
  • P k m i n   &   P k m a x : Minimum and maximum limits of generation.
Subject to constraints mentioned below.
  P g j P d j = k = 1 n | V j   | | V k | | Y j k | cos ( δ i δ k θ j k )
  Q g j Q d j = k = 1 n | V j   | | V k | | Y j k | cos ( δ j δ k θ j k )   j = 1 ,   2 ,   ,   n
  P g k m i n P g k P g k m a x  
Q g k m i n Q g k Q g k m a x   k = 1 ,   2 ,   ,   N g
As the pumped storage units are connected on to the bus to reduce the congestion cost of the system, the additional constraints considered are as follows
en = einitial n = 0, en = efinal n = 24
e n + 1   =   e n   +   t   ( η P s   P n p s   P H s n η H s )
  P P s m i n P P s n P P s m a x
  P H s m i n P H s n P H s m a x
e l     e n     e u

2.1. Bus Sensitivity Factor

The bus sensitivity factor (BSF) is expressed as the ratio of incremental real power change flowing in bus ‘i’ connected between buses ‘j’ and ‘k’ to the incremental change in mth power of the bus as given below. BSF provides the optimal location for the placement of PHSU based on highest negative sensitive indexes.
  B S F m i   =   Δ P j k Δ P m
where, B S F m i   indicates the quantum of real power change in real power flows in a transmission line in accordance to real power injection at bus m.
BSF can be derived from Equation (2) as illustrated below.
Δ P j k = P j k δ j Δ δ j + P j k δ k Δ δ k + P j k V j Δ V j + P j k V k Δ V K
Δ P j k = a j k Δ δ j + b j k Δ δ k + c j k Δ V j + d j k Δ V k
Δ P j k   =   a j k   Δ δ j   +   b j k Δ δ k +   c j k   Δ V j   + d j k   Δ V k
where,
  a j k = V j V k Y j k sin ( θ j k + δ k δ j )
b j k = V j V k Y j k sin ( θ j k + δ k δ j )
  c j k = V k Y j k cos ( θ j k + δ k δ j ) 2 V k Y j k cos θ j k
  d j k = V j Y j k cos ( θ j k + δ k δ j )
The Jacobian Matrix using Newton–Raphson (NR) method is given in Equation (19).
( Δ P Δ Q ) = [ J ] ( Δ δ Δ V ) = ( J 11   J 12   J 21   J 22   ) ( Δ δ Δ V )
where,
Δ δ   =   [ J 11 ] 1   [ Δ P ]   =   [ M ] [ Δ P ]  
Δ δ j = l = 1 n m j l Δ P l j   =   1 ,   2 ,   . ,   n ,   j     s
Thus
  B S F m i = a j k m j l +   b j k m j l

2.2. Generator Sensitivity Factor

The generator sensitivity factor (GSF) is expressed as the ratio of incremental change in real power flowing in bus ‘i’ connected between buses ‘j’ and ‘k’ to the incremental change in the active power supply of the generator as shown below. Generators are rescheduled based on highest negative indexes.
  G S F g n   =   Δ P j k Δ P g n
Congestion management is formulated using the Newton–Raphson power flow method. Congestion results in the power flow violation in certain transmission lines and the congestion cost have been computed. Then the novel FPA is schemed as an efficient optimizing tool for rescheduling cost minimization as well as reducing the system losses. Further the rescheduling congestion cost is compared with and without the application of FPA is computed. The effectiveness of the proposed Algorithm is proven in terms of minimized congestion cost and its validation is presented in Figure 1. The efficacy of FPA algorithm incorporating with PHSU is then investigated in terms of congestion cost minimization, as shown in Figure 2. The impetus to carry out this work relies on a novel methodology for figuring out complexity that arises in managing the congestion. Despite the fact the problem of managing congestion has been endorsed in the literature for decades, at most gets committed on meta-heuristic and artificial intelligence approaches. Iteration number and population size are the typical monitoring criterion shared among these different methodologies. Distinct from these general monitoring criterions, some techniques incorporates algorithmic based specific tuning criterion like mutation rate and cross-over rate in the Genetic Algorithm (GA). Lack of proper tuning of algorithmic parameters can lead to local minima and increases time of computation for convergence. Particle Swarm Optimization (PSO) handles inertial weight adjustments. Although Simulated Annealing (SA) can solve optimization problems of complicated nature, the drawback is the inability to obtain the best solution without integrating another technique in it. Further, Harmony Search Algorithm (HSA) embodies the heed on memory rate and adjustments in pitch weight. Thus the fulfillment of the final solution is attained by the legitimate control of this algorithmic based specific tuning criterion. Commemorating these concepts, the proposed paper employs the implementation of FPA Algorithm. This relies on the mechanism of levy flight using a common probability switching parameter thus eliminating the need of algorithmic based specific tuning criterion and makes it effective for optimization problems.

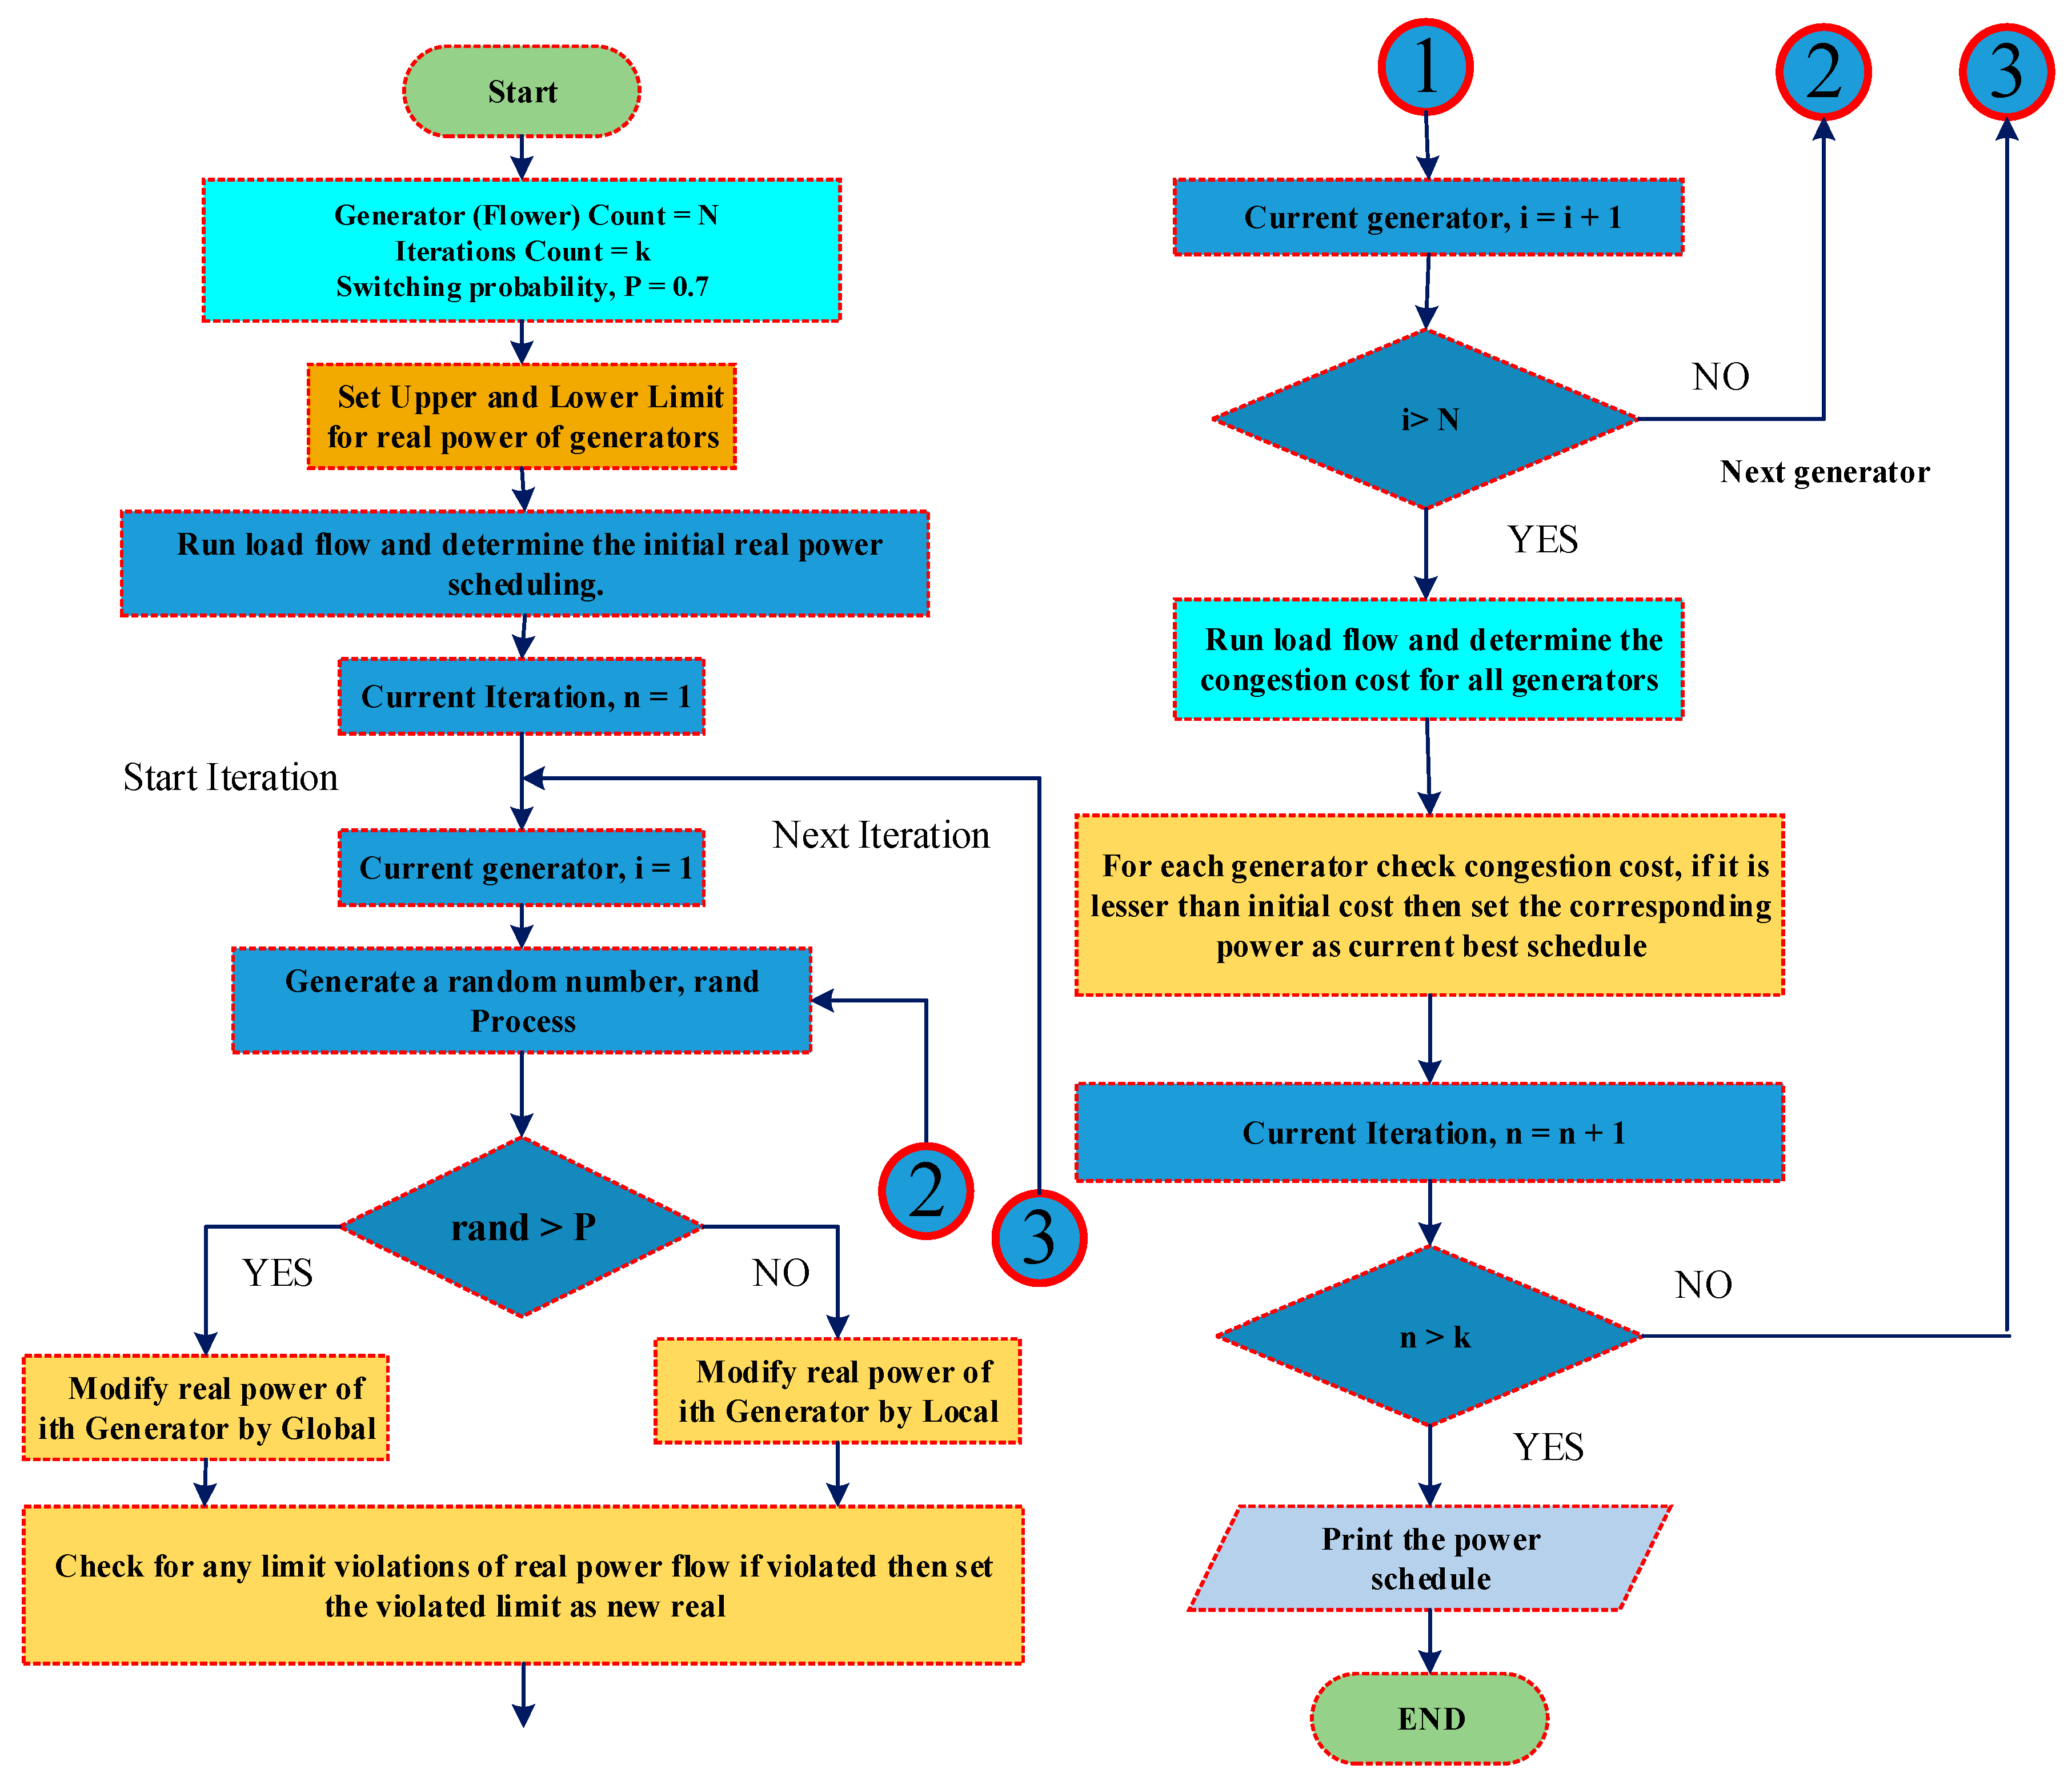
3. Flower Pollination Technique

Flower pollination is a process adopted by flowers and plants to reproduce. It is classified into biotic and abiotic. Biotic pollination is done by living organisms whereas nonliving accounts for abiotic pollination. The other way of classifying pollination is self and cross. Self-pollination means fertilization of the same plant and cross-fertilization happens for different plants. The long distance process is called global pollination, and implantation, happening over short distance, is called local pollination. Flower constancy also provides an assurance of nectar for the pollinators with minimum effort of learning, exploration and exploitation. The global pollination is carried out by the equation
  a i m + 1 = a i m +   L ( a i m c * )
where,
L λ Γ ( λ ) sin ( π λ 2 ) π 1 s 1 + λ
  • a i m ith pollen at mth iteration
  • L —Levy weight-based size of each step (s; s > 0).
  • c * —Best current solution at current iteration.
  • Γ ( λ ) Gamma distribution function
The pollination occurring locally is carried out by the following equation
  a i m + 1 = a i m +   ( a o m a q m )
  • a i m ith pollen at mth iterations
  • —takes a value of [0,1]
  • a o m and a q m —pollen from different flowers from same plant.
Biotic, also called cross-pollinators, follows movement of step flight, which aids in attaining. A set of N flower population is generated with random solutions. Global pollination follows the rule of biotic and cross-pollination; the reproduction probability depends on flower constancy.
The two indispensable concepts of FPA are local and global pollination steps. Pollinators carry the pollens of the flower to far reaching places due to its custom manner. This helps in the exploration of the larger search space. Here the general tuning parameter of levy flight mechanism, which essentially incorporates the various distant step sizes carried out by the pollinator. Usually the nearby flower is pollinated by the pollens of the local adjacent flowers rather than the far-off flowers. Thus, the general probability tuning parameter using levy fight mechanism switches effectively between global pollination and local pollination ensures the effective exploration and exploitation of the learning with minimum learning effect.
A simple numerical example is illustrated here for the implementation of FPA, as given below.
Consider a simple objective function f ( z ) = z 1 2 + z 2 2 subject to z g , i   = (0.3,0.3). The fitness value obtained is f ( z g , i   ) = 0.18 . Equation (26) is then applied and z g + 1 , i   = ( 0.3 , 0.3 ) and then updated to (0.1,1) for illustration. Then the newly updated. z g + 1 , i   = ( 0.1 , 0.3 ) . As a result, the new fitness value solution f ( z g + 1 , i   ) = 0.04 . Here f ( z g + 1 , i   ) < f ( z g , i   ) . This infers that the old fitness value solution can be replaced by the currently obtained fitness value. For example, if the newly updated. z g + 1 , i   = ( 0.9 , 0.3 ) , this results in the new fitness solution f ( z g + 1 , i   ) = 0.9 . Here f ( z g + 1 , i   ) > f ( z g , i   ) . This clearly indicates there is no progress to advance   z g , i   . Thus, this value should be discarded and proceeded for the updating the next fitness value as indicated in pseudocode.

4. Algorithmic Steps in FPA

The sequential steps carried out in pseudocode of the flower pollination algorithm are presented as follows. The minimization objective function:
minf(x), x = (x1, x2, ….., xl)
  • Initially generate t population of flowers randomly
  • Fitness solution c* is then obtained from t population generated.
  • While (m < maxgen)
        for i = 1:t
        if r and < p,
         ■
    A step vector has been drawn with levy’s distribution
         ■
    And carry out Global population given by Equation (24)
  • else
      Uniform distribution in between the range 0 to 1 is then drawn for .
  • Pollination is then carried out with local population with the random r and s variables by
  • Equation (26).
        end if
         ■
    New solutions are then calculated
  • If current solution obtained is better, replace the old solution by the current solution.
        end for
  • Best current solution c * is then updated
  • end while
Managing the congestion is coded using the Flower Pollination Algorithm. The process of carrying the pollens of the flower to far reaching places assures the fittest population for survival in the search space. The efficacy of FPA is implemented in terms of congestion cost minimization as shown in Figure 3. The parameters of FPA are λ, s, and size of population and iteration number. The criteria for optimal tuning obtained using FPA are λ = 1.6, s = 1, and size of population is 6 has been carried out for 25 iterations. Here the expedition between the global and local search using levy flight mechanism ensures the optimal output. Further FPA relieves congestion by suitable rescheduling of the real power of the generators. To validate its effectiveness, the obtained results are compared with other optimization algorithms already reported in literature.

5. Results and Discussions

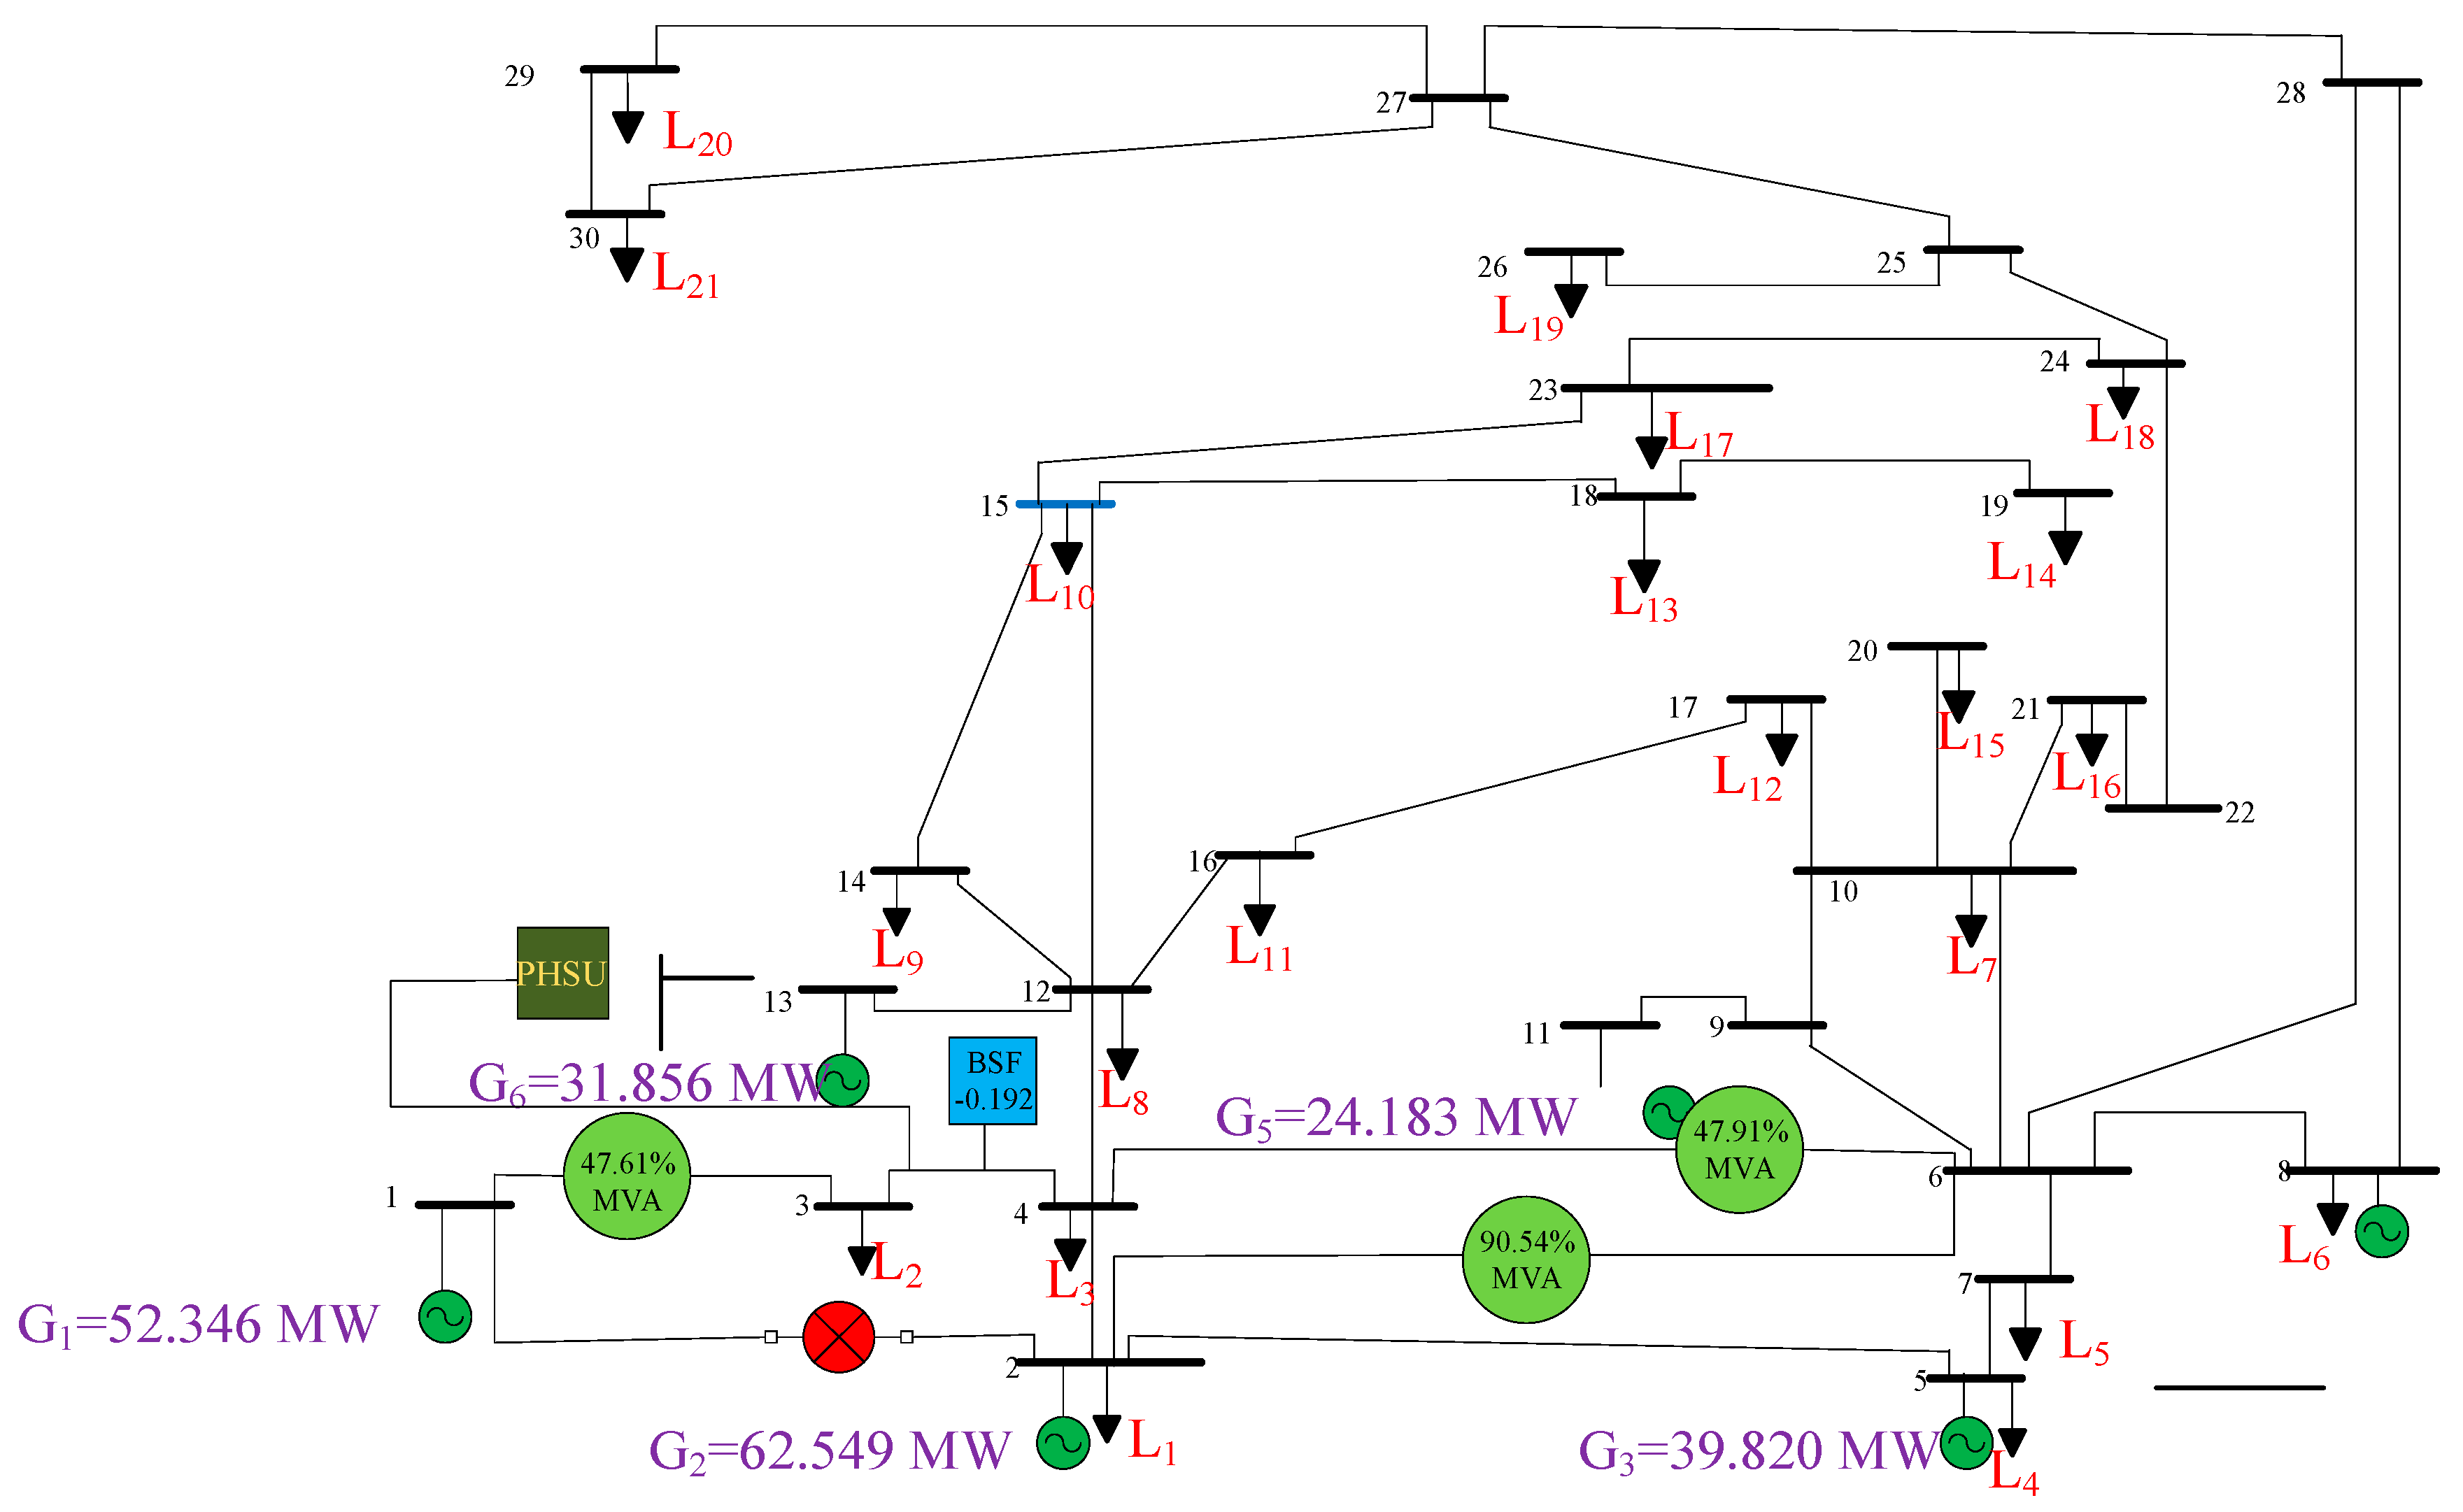
The proposed method is schemed considering IEEE modified 30-bus system, which consists of six generator buses and 24 load buses. The slack node has been assigned as bus number 1. The numbering of buses has been done in a way that the generator buses are numbered first followed by load bus. Figure 4 depicts the single line diagram of the modified IEEE 30-bus system considered here.
Contingency analysis was conducted under the base load condition to identify the harmful contingencies. Here the outage of line 1–2 with normal loading is considered and has been illustrated out in Figure 5. It is ascertained from Figure 5. The actual power flow violation rises to 1.14%, 2.13%, and 1% in the lines connected between 1 and 3, 2 and 6, and 4 and 6, respectively. The system has been simulated with a line outage so as to create the contingency and results of line flow and its violations are reported in Table 1. Here, from Table 1 we can observe that there are three lines those are violating their limit that is line number 1, 5, and 6 which have 130 MW, 65 MW, and 90 MW of line flow limit, respectively. The power flows on the three violated lines are nearly 148 MW, 138 MW, and 90 MW. Even though the line 6 is violating by a small amount that is nearly equal to 0.59 MW, it has also been taken into consideration in the calculation. Congestion due to outage of line 1–2 and its effect on network framework parameters has been tabulated in Table 2. Here, due to congestion the percentage of overload on the congested line is reflected. The most overloaded line among the three lines that has to get congestion due to the line outage of lines 1–2 is the line connecting between buses 2 and 6.
The amount of power violated by each of the congested line is also shown in Figure 6. The line 2–6 has violated the limits the most that is nearly 73 MVA of power. The total amount of power violated due to the outage is 92.292 MVA. This power violation has to be now rescheduled through other lines so as to get rid of the congestion that has appeared. It is highlighted from Figure 7 the increase in overload amounts to 13.89%, 113.29%, and 0.65% in the lines connected between 1–3, 2–6, and 4–6, respectively. This violation is one of the issues critically faced by ISO. To achieve this task, the novel FPA is schemed as an efficient optimizing tool for congestion cost minimization as well as reduces the system losses. The stimulus of the present effort is to benefit the ISO in reliving the congestion. The rescheduling line flow is compared with and without the application of FPA is computed. The Flower Pollination Algorithm is used here as an optimization tool and it can be seen that the result obtained in Table 3 reflects its validity. The line which were violating the their line flow limits are now under the limits of their flow after the rescheduling of the generators is done by utilizing the FPA as shown in Figure 8.
Table 4 indicates the economic cost analysis of cost before rescheduling is 941.208 $/hr, while after rescheduling it reduces to 460.616 $/hr. Here the expedition between the global and local search using levy flight mechanism ensures the optimal output. This validates the effectiveness of the algorithm. Further the changes in active power rescheduling have been graphically depicted in Figure 9.
The results gained from the implementation of FPA for alleviation of congestion are tabulated in Table 5. With the results obtained in [16], the effectiveness of the proposed algorithm is illustrated with the reduction in congestion cost of 1.60%, 1.55%, 1.17%, and 1.07% as compared with other optimization algorithms like Simulated Annealing (SA), Random Search Method (RSM), Particle Swarm Optimization (PSO), and Teaching Learning-Based Optimization (TLBO). The best effective final solution is attained due to the legitimate control of the algorithmic based specific tuning criterion. Figure 10 infers that Flower Pollination Algorithm (FPA) yields the minimum congestion of 460.616 $/hr as compared with the results obtained with other optimization techniques. 
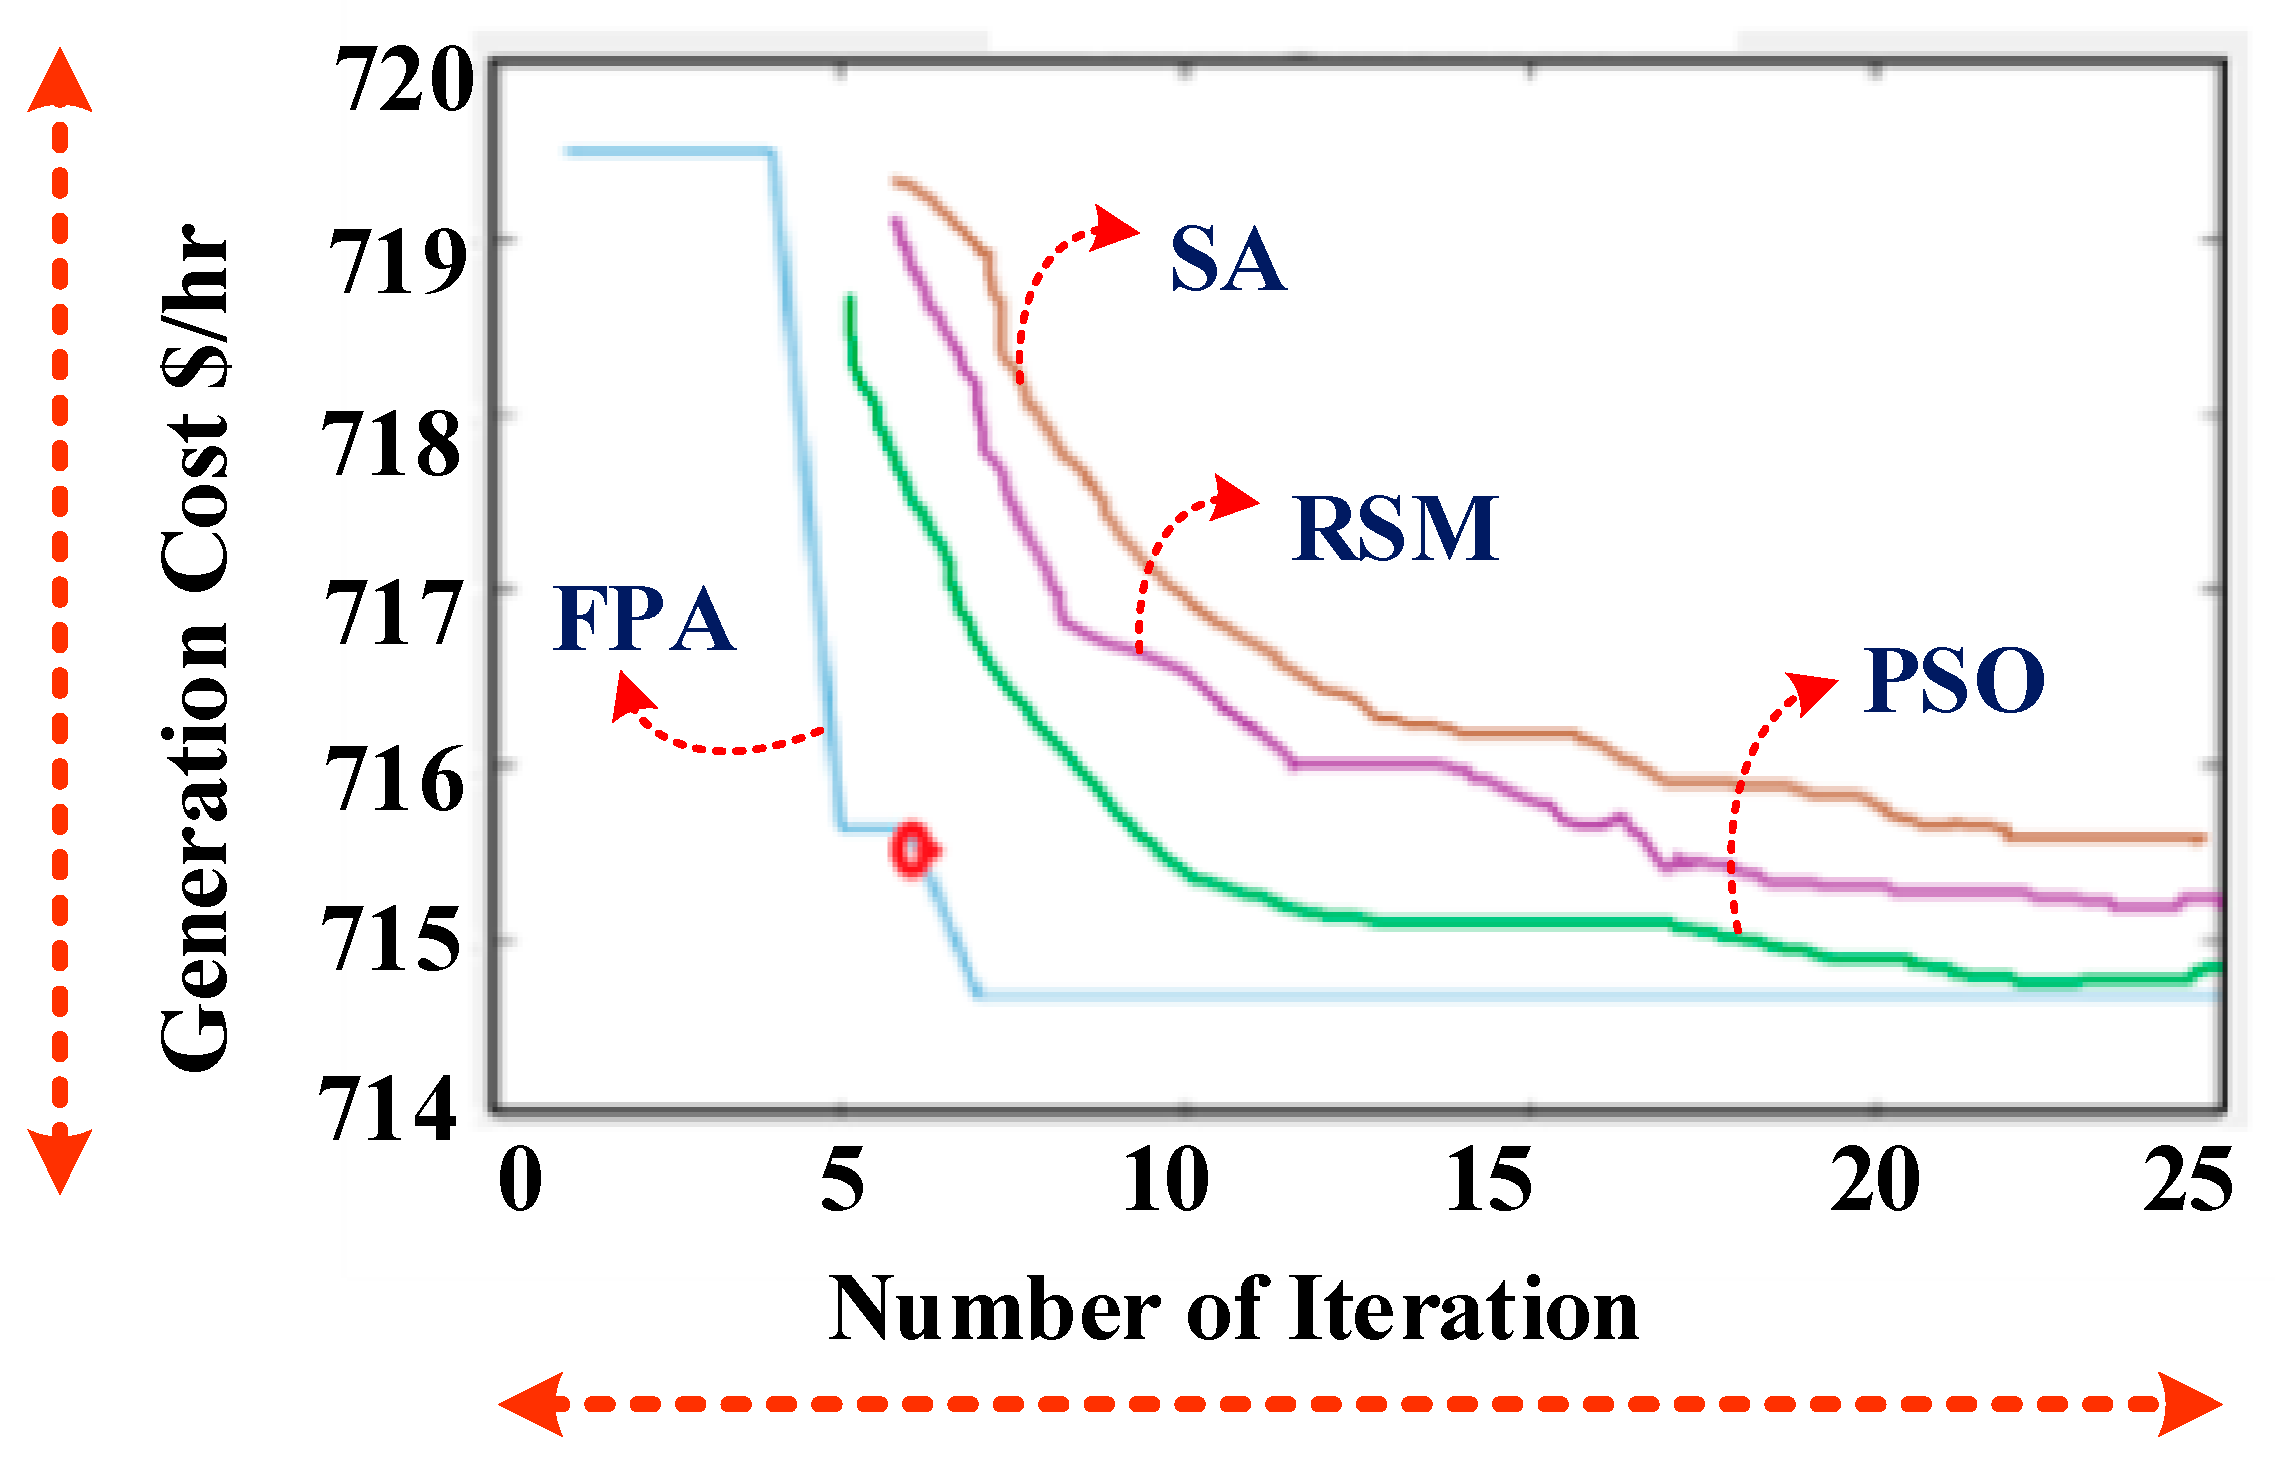
Figure 11 validates the effectiveness of the algorithm in terms of its convergence in seven iterations as compared with 25 iterations in SA and RM, while 50 iterations are required in PSO to obtain solution consistency. Table 6 provides the parametric settings of the proposed FPA with other optimization techniques.

6. Congestion Management with PHSU

In this proposed work, to replenish the varying load demand nature, a PHSU unit has been incorporated with the test system. PHSU is operated in generator mode when there is power inadequacy while operated in pumping mode where there is power sufficiency. Thus PHSU helps in minimize the cost of congestion while maintaining the voltage figuration, The test case considering the modified IEEE 30 bus system has been simulated with a line outage 1–2 so as to create the contingency and results in violations of power flow between lines 1–3, 2–6, and 4–6, respectively. Considering this outage, BSF are then computed for different load buses. The bus with the highest negative index is chosen to be the optimal location for PHSU placement. Here, it is evident from Table 7 that the ideal location for PHSU placement is obtained at bus 4. This is pictorially depicted in Figure 12 The feasible location of PSHU placement is attained assuming sufficient availability of water resource and reservoir area. GSF is then calculated for rescheduling active power of generators. Thus the placement of PHSU at bus 4 yields the minimized congestion cost of 361.450 $/hr as compared to bus 16 with 756.03 $/hr higher cost of congestion. This infers the efficiency of FPA in terms of congestion cost reduction. Active powers of the generators are then rescheduled through the computed GSF as inferred from Table 8 Generators with the highest negative sensitivities are opted for participation in rescheduling Table 9.
Figure 12 interprets the incremental changes in value of rescheduling of real powers of the generators with the incorporation of PSHU. This facilitates meeting the objective of yielding minimum cost of congestion. The results gained from the implementation of FPA for alleviation of congestion influencing other network criterion is tabulated in Table 10. This investigates the effective minimization of power losses and security enhancement after employing EPA. The total loss in the system was 8.177 MW, which was also reduced to 5.217 MW after conducting congestion management, and further reduced to 4.208 MW after the incorporation of PHSU. Further the considerable improvement in voltage portrait is also tabulated.
The PHSU is placed at load bus number 4 which is selected based on the most sensitive bus sensitivity factor. The PHSU is connected to the bus 16 and the results are tabulated. The generation cost is 736.426 $/hr and the congestion cost incurred to the consumer is 361.450 $/hr after the implementation of the pumped storage hydro unit at bus 4, as pictorially depicted in Figure 13. Table 11 infers the alleviation of congestion after the incorporation of PHSU employing FPA.
From Table 12, it is inferred that the rescheduling cost using FPA is considerable reduced by 1.27% with the PHSU placement. Furthermore, the superiority of the FPA is shown in terms of congestion cost reduction of 2.04% after the application of FPA algorithm employing PHSU placement as depicted pictorially in Figure 14. Thus the effectiveness of the FPA algorithm is proven in terms of minimized congestion cost and other parameters that influence the network framework criterion.

7. Conclusions

To relieve the congestion and recognize the congestion management’s importance in the power system, an attempt using FPA has been carried out in this paper. Generator rescheduling is used in this work for congestion management with that to reduce the transmission congestion cost. Here a study has been carried out to solve the congestion problem by generator rescheduling with the help of flower pollination algorithm aimed at reducing transmission congestion cost. Then the algorithm is compared with the other optimization techniques taking the same constraints and outage. The efficacy of FPA in benefitting the ISO in reliving the congestion in terms of minimized congestion cost. It is marked that there is a considerable amount of decrease in congestion cost by the incorporation of pumped storage unit and is validated effectively by Flower Pollination Optimization. Furthermore, the effects of other network parameters like system losses and voltage has been computed. The result obtained proves effectiveness of the algorithm in terms of minimized cost convergence as compared with other recent trendsetting reported optimization techniques.

Author Contributions

All authors were involved in developing the concept, simulation, and validation and making the article an error-free technical outcome for the set investigation work.

Acknowledgments

The would authors like to acknowledge the Department of Energy Technology, Aalborg University, Esbjerg, Denmark for supporting this research activity for the insight technical guidance and providing technical information for this project.

Conflicts of Interest

The authors declare no conflicts of interest.

List of Symbols and Abbreviations

enReservoir pumped storage energy level at interval n
efinalReservoir final limit
η P s Pumping operation efficiency
η H s Generation operation efficiency
PnPsPumped storage power generation at interval n
P H s n Pumped storage power consumption at interval n
P P s m i n Minimum limit of power consumption
P P s m a x Maximum limit of power consumption
P H s m i n Minimum limit of power generation
P H s m a x Maximum limit of power generation
elReservoir lower limit
euReservoir upper limit
FPAFlower Pollination Algorithm
GAGenetic Algorithm
SASimulated Annealing
RSMRandom Search Method
HASHarmony Search Algorithm
PSOParticle Swarm Optimization
TLBOTeaching Learning-based Optimization
UCUnit Commitment
EDRPEmergency Demand Response Program

References

  1. Kumar, S.; Srivastava, C.; Singh, S.N. Congestion management in Competitive Power Market A Bibliographical Survey. Electr. Power Syst. Res. 2005, 76, 153–164. [Google Scholar] [CrossRef]
  2. Christie, R.D.; Wollenberg, B.; Wangensteen, I. Transmission management in the Deregulated Environment. Proc. IEEE Trans. Power Syst. 2000, 88, 170–195. [Google Scholar] [CrossRef]
  3. Ma, J.; Song, Y.H.; Lu, Q.; Mei, S. Market-Based Dynamic Congestion Management. IEEE Power Eng. Rev. 2002, 22, 54–56. [Google Scholar]
  4. Jian, F.; Lamont, J.W. A Combined Framework for Service Identification and Congestion Management. IEEE Trans. Power Syst. 2001, 16, 56–61. [Google Scholar] [CrossRef]
  5. Huang, G.M.; Yan, P. TCSC and SVC as Re-Dispatch Tools for Congestion Management and TTC Improvement. Proc. IEEE Power Eng. Soc. Winter Meet. 2002, 1, 660–665. [Google Scholar]
  6. Rau, N.S. Transmission Loss and Congestion Cost Allocation—An Approach Based on Responsibility. IEEE Trans. Power Syst. 2003, 18, 346–352. [Google Scholar] [CrossRef]
  7. Yu, N.; Ilic, M. Congestion clusters based markets for transmission management. In Proceedings of the IEEE Power Engineering Society, 1999 Winter Meeting, New York, NY, USA, 31 January–4 February 1999. [Google Scholar]
  8. Fang, R.S.; David, A.K. Transmission Congestion Management in an Electricity Market. IEEE Trans. Power Syst. 1999, 14, 877–883. [Google Scholar] [CrossRef]
  9. Doll, M.; Verstege, J.F. Congestion Management in a Deregulated Environment using Corrective Measures. Proc. IEEE Power Eng. Soc. Winter Meet. 2001, 2, 393–398. [Google Scholar]
  10. Masoud, E.; Ali, S.H.; Nima, A. Congestion management enhancing transient stability of power systems. Int. J. Appl. Energy 2010, 87, 971–981. [Google Scholar]
  11. Yesuratnam, G.; Thukaram, D. Congestion management in open access based on relative electrical distances using voltage stability criteria. Electr. Power Syst. Res. 2007, 77, 1608–1618. [Google Scholar] [CrossRef]
  12. Attaviriyanupap, P.; Kita, H.; Hasegawa, J. A hybrid LR-EP forsolving new profit based UC problem under competitive environment. IEEE Trans. Power Syst. 2003, 18, 229–237. [Google Scholar] [CrossRef]
  13. Padmini, S.; Jegatheesan, R. A new model for Short-term Hydrothermal Scheduling of a GENCO in the competitive electricity market. Indian J. Sci. Technol. 2016, 46, 1–6. [Google Scholar] [CrossRef]
  14. Padmini, S.; Srikanth, K. Optimal bidding strategy for Hydrothermal scheduling in a Deregulated Energy Markets. Int. J. Control Theory Appl. 2016, 16, 7783–7788. [Google Scholar]
  15. Jacob Raglend, I.; Raghuveer, C.; Rakesh Avinash, G.; Padhy, N.P.; Kothari, D.P. Solution to profit based unit commitment problem using Particle Swarm Optimization. Appl. Soft Comput. 2011, 10, 1247–1256. [Google Scholar] [CrossRef]
  16. Balaraman, S.; Kamaraj, N. Transmission congestion management using particle swarm optimization. J. Electr. Syst. 2011, 7, 54–70. [Google Scholar]
  17. Zeng, M.; Feng, J.; Xue, S.; Wang, Z.; Zhu, X.; Wang, Y. Development of China’s pumped storage plant and related policy analysis. Energy Policy 2013, 61, 104–113. [Google Scholar]
  18. Deb, R. Operating hydroelectric plants and pumped storage units in a competitive environment. Electr. J. 2000, 13, 24–32. [Google Scholar] [CrossRef]
  19. Crampes, C.; Moreaux, M. Pumped Storage and Cost saving. Energy Econ. 2010, 32, 325–333. [Google Scholar] [CrossRef]
  20. Yang, X.S. Flower pollination algorithm for global optimization: Unconventional Computation and Natural Computation. Lect. Notes Comput. Sci. 2013, 7445, 240–249. [Google Scholar]
  21. Yang, X.S.; Karamanoglu, M.; He, X.S. Multi-objective flower algorithm for optimization. Procedia Comput. Sci. 2013, 18, 861–868. [Google Scholar] [CrossRef]
  22. Yang, X.S.; Karamanaglu, X.S.; He, X.S. Flower Pollination algorithm—A Novel approach for Multiobjective Optimization. Eng. Optim. 2014, 46, 1222–1237. [Google Scholar] [CrossRef]
  23. Verma, S.; Saha, S.; Mukherjee, V. A novel symbiotic organisms search algorithm for congestion management in deregulated environment. J. Exp. Theor. Artif. Intell. 2015, 29, 59–79. [Google Scholar] [CrossRef]
  24. Verma, S.; Mukherjee, V. Optimal real power scheduling of generators for congestion management using a novel ant-lion algorithm. IET Gener. Transm. Distrib. 2016, 10, 2548–2561. [Google Scholar] [CrossRef]
  25. Paul, K.; Kumar, N.; Agrawal, S. Optimal rescheduling of real power to mitigate congestion with incorporation of wind farm using gravitational search algorithm in deregulated environment. Int. J. Renew. Energy Res. 2017, 7, 1731–1740. [Google Scholar]
  26. Verma, S.; Mukherjee, V. Optimal rescheduling of generators for congestion management using a novel teaching learning based optimization Algorithm. J. Electr. Syst. Inf. Technol. 2017, 889–907. [Google Scholar] [CrossRef]
  27. Salkuti, S.R. Congestion management using optimal transmission switching. IEEE Syst. J. 2018, 12, 3555–3564. [Google Scholar] [CrossRef]
  28. Gao, B.; Ma, T.T.; Tang, Y. Power transmission scheduling for generators in a deregulated environment based on a game-theoretic approach. Energies 2015, 8, 13879–13893. [Google Scholar] [CrossRef]
  29. Singh, R.R.; Chelliah, T.R.; Agarwal, P. Power Electronics in Hydro Electric Energy Systems—A Review. Renew. Sustain. Energy Rev. 2014, 32, 944–959. [Google Scholar] [CrossRef]
  30. Joseph, A.; Chelliah, T.R.; Lee, S.S.; Lee, K.B. Reliability of Variable Speed Pumped Storage Plant. Electronics 2018, 7, 265. [Google Scholar] [CrossRef]
  31. Andebili, M.R.; Shen, H. Energy management of end users modeling their reaction from a GENCO’s point of view. In Proceedings of the International Conference on Computing, Networking and Communications, Santa Clara, CA, USA, 26–29 January 2017; pp. 571–581. [Google Scholar]
  32. Zhao, Z.; Zu, L. Impacts of high penetration wind generation and demand response on LMP’s in a day-ahead market. IEEE Trans. Smart Grid 2014, 5, 220–229. [Google Scholar] [CrossRef]
  33. Albadi, M.H.; El-Saadany, E.F. Demand response in electricity markets: An overview. In Proceedings of the Power Engineering Society General Meeting, Tampa, FL, USA, 24–28 June 2007; pp. 1–5. [Google Scholar]
  34. Strbac, G. Demand side management: Benefits and challenges. Energy Policy 2008, 36, 4419–4426. [Google Scholar] [CrossRef]
  35. Yousefia, A.; Nguyena, T.T.; Zareipourb, H.; Malikb, O.P. Congestion management using demand response and FACTS devices. Int. J. Electr. Power Energy Syst. 2012, 37, 78–85. [Google Scholar] [CrossRef]
  36. Rahmani-Andebili, M.; Abdollahi, A.; Moghaddam, M.P. An investigation of implementing emergency demand response programs in unit commitment problem. In Proceedings of the IEEE PES’GM, San Diego, CA, USA, 24–29 July 2011. [Google Scholar]
  37. Rahmani-Andebili, M. Investigating effects of responsive loads models on unit commitment collaborated with demand side resources. IET Gener. Transm. Distrib. 2013, 7, 420–430. [Google Scholar] [CrossRef]
  38. Rahmani-andebili, M. Risk—Cost based generation scheduling smartly mixed with reliability driven and market driven demand response measures. Int. Trans. Electr. Energy Syst. 2015, 25, 994–1007. [Google Scholar] [CrossRef]
  39. Rahmani-andebili, M. Nonlinear demand response programs for residential customers with non-linear behavioral models. Energy Build. 2016, 119, 352–362. [Google Scholar] [CrossRef]
  40. Yao, E.; Wang, H.; Liu, L.; Xi, G.A. Novel Constant Pressure Pumped Hydro combined with Compressed Air Energy storage systems. Energies 2015, 8, 154–171. [Google Scholar] [CrossRef]
Figure 1. Congestion cost minimization using Flower Pollination Algorithm (FPA) and its validation with other optimization techniques (Part I).
Energies 12 01477 g001
Figure 2. Congestion cost minimization using FPA incorporating Pumped Hydro Storage Unit (PHSU) and its validation (Part II).
Energies 12 01477 g002
Figure 3. Implementation of FPA for congestion management.
Energies 12 01477 g003
Figure 4. Single line diagram of modified IEEE 30-bus system.
Energies 12 01477 g004
Figure 5. Effect of MVA violations due to an outage.
Energies 12 01477 g005
Figure 6. Power violation between lines due to line outage between lines 1–2.
Energies 12 01477 g006
Figure 7. Effect of overload due to an outage.
Energies 12 01477 g007
Figure 8. Mitigation of congestion employing Flower Pollination Algorithm.
Energies 12 01477 g008
Figure 9. Comparison of power rescheduling in the modified IEEE 30-bus system employing FPA.
Energies 12 01477 g009
Figure 10. Effectiveness of proposed FPA with other optimization techniques.
Energies 12 01477 g010
Figure 11. Convergence curve for managing congestion using FPA’.
Energies 12 01477 g011
Figure 12. FPA-based suitable choice of PHSU for managing congestion.
Energies 12 01477 g012
Figure 13. FPA-based cost comparison in placement of PHSU for managing congestion.
Energies 12 01477 g013
Figure 14. FPA-based cost comparison with and without placement of PHSU for managing congestion.
Energies 12 01477 g014
Table 1. Line flows in test case.
Line No.MVAFlow Rating (MVA)Violation (MVA)Line No.MVAFlow Rating (MVA)Violation (MVA)
1148130−18.06362117.36547.718
2196546.0397228.34167.66181
345.913084.10252319.93212.0516
45.51130124.486248.843223.1584
513965−73.6385251.853230.1469
690.690−0.590291266.773225.2275
737.77032.2841276.123225.8765
834.113095.9333285.183226.8177
951.36513.7257293.491612.5059
1024.56540.5254307.06168.9363
1113.86551.1833312.851613.1489
12126553.0422326.053225.9523
1316.56548.482332.861613.1409
144.456560.5462341.351614.6473
1517.96547.0647354.276560.7337
1630.8354.1557365.261610.7365
179.523222.4836376.42169.58086
187.513224.4883387.29168.70574
1918.33213.682939193228.2448
208.663223.3388403.763212.9574
Table 2. Impact on network framework parameters due to outage of lines 1–2.
Type of ContingenciesCongested LinesLine Limits MVAActual Power Flow (MVA)Amount Power Violation (MVA)Total Power Violation (MVA)Overload %
Outage of line 1–21–3130148.0618.0692.2913.89
2–665138.6373.63113.29
4–69090.5900.590.65
Table 3. Comparison of congested line flow.
Congested LineLimit (MVA)Before Applying FPA (MVA)After Applying FPA (MVA)
1–3130148.063663.5146
2–665138.638560.6178
4–69090.590343.2578
Table 4. Rescheduling of generators in the modified IEEE 30-bus system.
Generator No.Before Rescheduling (MW)After Rescheduling (MW)Increment in Generation ( Δ P g i )
1138.59065.694−72.896
257.56075.64018.080
324.56047.45722.897
435.00033.183−1.817
517.91028.54710.637
616.93037.96521.035
Total cost ($/hr)941.208460.616
Table 5. Validation of proposed FPA with other optimization techniques.
ParametersSA [16]RSM [16]PSO [16]TLBO [26]Proposed FPA
Total congestion cost ($/hr)719.86716.25538.95494.66460.62
Table 6. Parametric settings proposed FPA with other optimization techniques.
SA [16]RSM [16]PSO [16]TLBO [26]FPA
Start Set Temperature = 900 °C; End Set Temperature = 900 °C; No. of swarms = 20No. of learners = 6No. of flowers = 6
No. of iter. = 1000No. of iter. = 1000No. of iter. = 300No. of iter. = 30No. of iter. = 25
C1 = 2; C2 = 2;
ωmin = 0.4; ωmax =0.9
Λ = 1.6; Υ = 0.12;
p = 0.80
Table 7. Sensitivity factor without PHSU.
Load Bus No.234578162023
BSF−0.01790.0315−0.1920.01070.03150.15320.00160.08040.0413
Table 8. Sensitivity factor without PHSU.
GeneratorsG1G2G3G4G5G6
GSF−0.5563−0.4217−0.5326−0.4862−0.4326−0.511
Table 9. Rescheduling with PHSU.
Generator No.Before Rescheduling (MW)After Rescheduling (MW)Increment in Generation ( Δ P g i )
1138.59052.346−86.244
257.56062.5494.989
324.56039.82015.260
435.00027.729−7.271
517.91024.1836.273
616.93031.85614.926
Table 10. Influence of FPA on other network criterion in the test case.
Other Network CriteriaRescheduling without Applying FPARescheduling Applying FPARescheduling Applying FPA Incorporating PHSU
Power loss (MW)8.1775.2174.208
Voltage (p.u)0.9300.9390.947
Table 11. FPA-based MVA line flow with and without PHSU.
Congested LineLimit (MVA)Before Applying FPA (MVA)After Applying FPA (MVA)After Applying FPA Incorporating PHSU (MVA)
1–3130148.063663.514661.9052
2–665138.638560.617858.8522
4–69090.590343.257843.1241
Table 12. Cost comparison with and without PHSU employing with and without FPA.
ParameterRescheduling Applying FPA without Incorporating PHSURescheduling Applying FPA Incorporating PHSU
Congestion cost($/hr)460.616361.450

