Article

Influencing Mechanisms of a Crosswind on the Thermo-Hydraulic Characteristics of a Large-Scale Air-Cooled Heat Exchanger

1
School of Energy Power and Mechanical Engineering, North China Electric Power University, Beijing 102206, China
2
Institute of Engineering Thermophysics, Chinese Academy of Sciences, Beijing 100190, China
*
Author to whom correspondence should be addressed.
Energies 2019, 12(6), 1128; https://doi.org/10.3390/en12061128
Submission received: 3 January 2019 / Revised: 17 March 2019 / Accepted: 18 March 2019 / Published: 22 March 2019

Abstract

:
For the large scale air-cooled heat exchanger of a natural draft dry cooling system (NDDCS) in power plants, its thermo-flow characteristics are basically dominated by crosswinds. Unfortunately however, the detailed mechanisms of the crosswind effects have yet to be fully uncovered. Therefore, in this research, the local flow and heat transfer performances of the cooling deltas, which are also termed as the fundamental cells of the large-scale air-cooled heat exchanger, are specifically investigated with full consideration for the cell structure and the water-side temperature distribution at various wind speeds. A 3D CFD method with a realizable k-ε turbulence model, heat exchanger model, and porous media model is developed, and the accuracy and credibility of the numerical model are experimentally validated. With the numerical simulation, the overall 3D outlet air temperature of the large-scale air-cooled heat exchanger, and the corresponding local air velocity and temperature fields of the cooling deltas are qualitatively analyzed. Furthermore, the air-mass flow rate and heat rejection are also quantitatively studied at both the global and local views. The results depict that with an increase in the wind speed, the air mass flow rate and heat rejection will increase greatly for the frontal deltas; however, they will drop dramatically for the middle-front deltas. As for the middle- as well as the middle-rear deltas, the thermo-flow performances vary markedly at various wind speeds, which behave in the most deteriorated manner at a wind speed of 12 m/s. The rear deltas show the best thermo-flow performances at a wind speed of 12 m/s, but the worst at 16 m/s. A detailed analysis of the variable fields for each cooling delta may contribute to the performance improvement of the large-scale air-cooled heat exchanger of NDDCS.

1. Introduction

In thermal and nuclear power plants, the natural draft-dry cooling system (NDDCS) has been adopted throughout the world, which shows significant water conservation, compared with the wet-cooling system, with a closed circulating water circulation [1,2]. For the NDDCS, the fundamental function is to take away the heat rejection of circulating water by cooling air flowing through the heat exchanger finned tube bundles, but the crosswinds could intensively cripple the thermo-flow performances of NDDCS. Thus, in the past, an investigation of the wind effects and the relevant approaches for improving the thermo-flow performances, has been carried out with the computational fluid dynamics (CFD) method.
As for ambient wind effects, Yang et al. [3] numerically investigated the air flows, concluding that the fluid flows through NDDCS are dominated by the wind-induced and buoyancy-driven air flows, as a result of the balance between the inertial force and the viscous, buoyancy forces. Besides, Yang et al. [4] studied the flow and heat transfer performances of the condenser/NDDCS with the CFD method, obtaining a critical wind speed with the lowest air flow rate and the maximum outlet water temperature, which indicates the most deteriorated performances of the entire system. With the vertically arranged heat exchanger bundles of the dry-cooling system, Zhao et al. [5,6] numerically presented detailed aerodynamic fields around the cooling deltas in the absence of winds, and at wind speeds of 4 m/s and 12 m/s. Ma et al. [7] proposed a new theoretical model for the CFD process, to predict dry-cooling system performance, by using the power function of the initial temperature difference for the evaluation of ambient temperature effects and the outlet air velocity for the calculation of heat rejection.
In order to weaken the adverse wind effects on NDDCS, many researchers have proposed various innovative measures with the numerical computation. Liao et al. [8] numerically studied the influence of the tower height-to-diameter ratio on the thermo-flow characteristics of the dry-cooling system, and proposed a lower value for the better thermo-flow performances at high wind speeds. As for the geometrical layouts of the multi-towers, Liao et al. [9] developed the numerical models, and concluded the tower spacing effects depended on the wind speed and tower arrangement. With Munters as the pre-cooling media, He et al. [10] numerically investigated the trade-off between the air pressure drop and the evaporative pre-cooling of the inlet air, and obtained the critical ambient temperature of the pre-cooling application to the natural draft dry cooling system. As with the traditional windbreaker first recommended by Preez and Kröger [11], Chen et al. [12] subsequently presented the interior and exterior windbreaker configurations with a numerical simulation, showing that the exterior windbreakers were superior to the interior ones, especially at high wind speeds. Furthermore, Zavaragh et al. [13] numerically proposed the internal flat and the combination of internal flat-external rounded windbreakers, which can move axially around the cooling tower, leading to the air mass flow rate increase from the wind momentum effect. Moreover, Gu et al. [14] investigated the optimization of different wind-break structures, as the cross walls, wind-break walls, cross line-screen, and the louvers, concluding the most optimal structure is the wind-break wall, and the optimal louver opening as the second option, owing to its flexible adjustment. Considering the circumferential non-uniform ventilation and the vortices inside the cooling tower, Wang et al. [15] proposed an enclosure with an opening at the windward side with the CFD method, which can enhance the cooling performance at all investigated wind speeds. Combined with the solar energy, Yuan et al. [16] numerically studied the strengthened cooling efficiency of the dry-cooling system by revealing the effects from the collector diameter, the ambient temperature, and also the heat exchanger layout. Additionally, Zou and Gong [17] investigated the optimal structural arrangement of the solar enhanced natural draft dry cooling system by a numerical simulation, finding out the design with the partial blockage at the collector entrance, horizontal sunroof, and parabolic tower would be the optimal selection, considering the thermal performance and structural robustness.
Conclusively, although the wind effects on the thermo-flow characteristics of natural draft dry cooling system and corresponding approaches have been thoroughly investigated, the aforementioned studies only focused on the overall analysis of the large scale air-cooled heat exchanger, and they have not yet determined the detailed velocity or temperature fields of the cooling deltas for various air-cooled sectors been fully disclosed at various wind speeds. So, in this research, the macro heat exchanger model for the finned tube bundles are adopted, so as to specifically investigate the thermo-flow characteristics of the air-cooled sectors and cooling deltas with the numerical method, which differs from the CFD method with the previous radiator model.
It is worth noting that the natural draft dry cooling system (NDDCS) possesses a complicated large-scale structure, like the closed wet cooling tower (CWCT), and for the large-scale CWCT, Zhu et al. [18] proposed a CFD model and compared the numerical and experimental results, which shows good agreement. For the large-scale air-cooled heat exchanger model of the NDDCS in this research, the simulation results with the two numerical models were also compared with the experimental results, which showed a better prediction of the thermo-flow performances of NDDCS using the proposed macro heat exchanger model, since the thermo-hydraulic characteristics of the heat exchanger bundle for airside was coupled with waterside. Additionally, by adopting the macro heat exchanger model, the numerical results can provide not only the 3D overall outlet air temperature fields of the large scale air-cooled heat exchanger, but also very detailed variable fields for each cooling delta of the NDDCS. In summary, this research provides quite a comprehensive investigation of the large-scale air-cooled heat exchanger, which may contribute to more targeted approaches towards the performance improvement of the natural draft dry cooling system.

2. Models

2.1. Natural Draft Dry Cooling System

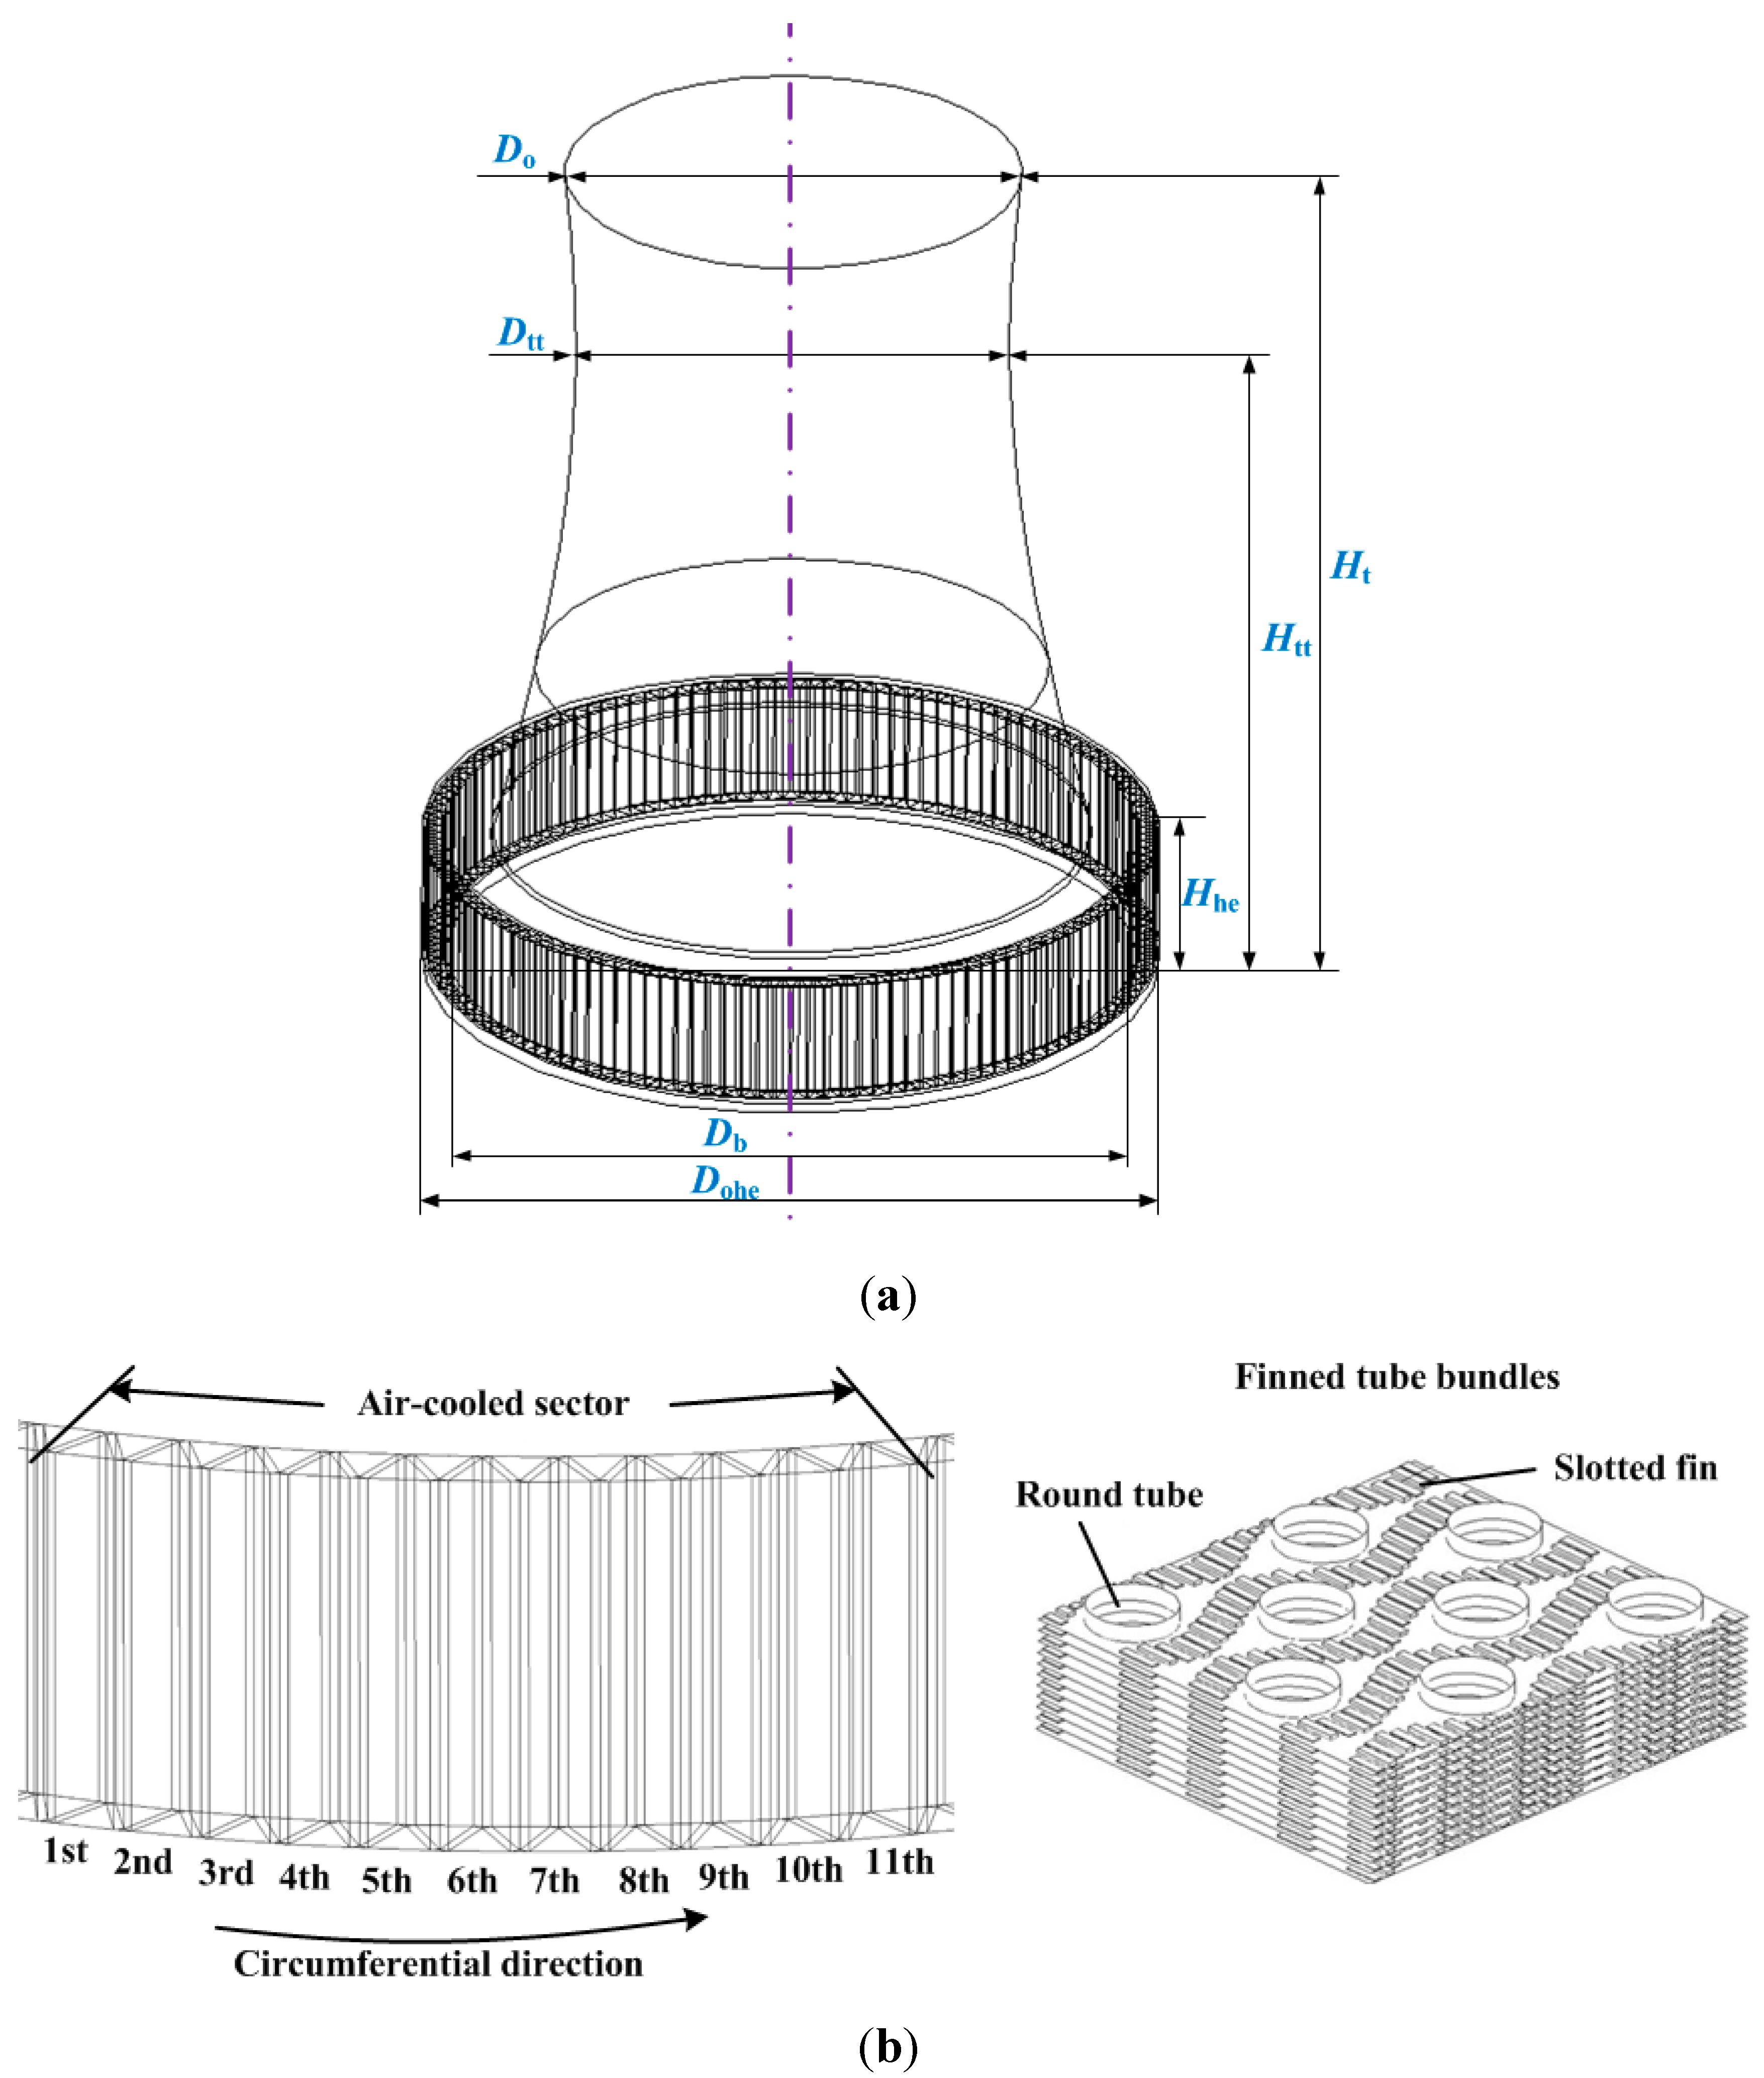
In power plants, the NDDCS incorporates a concrete hyperbolic dry-cooling tower and a large-scale air-cooled heat exchanger around the circumference of the tower base, as shown in Figure 1a. As for the large-scale air-cooled heat exchanger model in this research, it consists of 110 vertically arranged delta-type cooling units, which are divided into 10 air-cooled sectors, so as to distribute the circulating water feasibly, so that each sector comprises 11 cooling deltas as shown in Figure 1b. In practical engineering, the slotted finned tube bundles, which constitute the cooling deltas, are commonly adopted, due to the enhanced convective heat transfer, compared with the plain ones [19]. Furthermore, Table 1 lists the geometric parameters of the dry-cooling tower and slotted finned tube bundles.
As must be pointed out, due to the symmetric layout of the large scale air-cooled heat exchanger, only the first five air-cooled sectors ranging at 0°–180° are investigated for their thermo-flow performances. Besides, sectors No.1–No.5 were respectively named as the frontal, middle-front, middle, middle-rear, and leeward sectors, as shown in Figure 2.

2.2. Governing Equations

The air density can be calculated based on ideal gas behaviors, because the variation of the airflow static pressure within the flow field is reported to be just 1–2% of the atmospheric pressure. Furthermore, the effect of the buoyancy force is also considered in the vertical momentum equation, based on the Boussinesq approximation. The realizable k-ε turbulence model is adopted for closing the conservation equations, due to its good prediction of the turbulence flow of viscous fluids.
In the present research, the continuity, momentum, energy, and turbulence modeling equations for a steady incompressible buoyant flow field are introduced in a united form [5,6].
ρ u i φ = ( Γ φ φ ) + S φ + S φ
where ρ is the air density, ui is the velocity in the xi direction, Γφ is the diffusion coefficient for φ, Sφ is the internal source of the air conservation equation, Sφ′ represents the energy or momentum source term for the zone of the heat exchanger, describing the flow and heat-mass transfer conditions of crossflow air when it flows through the heat exchanger [20,21].
According to the actual configurations of the large-scale air-cooled heat exchanger of the NDDCS, it is impractical to model the individual fins and tubes of the heat exchanger bundles. In this research, the macro heat exchanger model was used to characterize the finned tube bundles, by introducing a pressure drop to the cooling air, and the heat transfer from the circulating water to the cooling air.
The pressure drop Δp of the airside is expressed as follows:
Δ p = 1 2 f ρ u w 2
where ρ is the mean air density, and uw is the air velocity normal to the finned tube bundles. f is the pressure-loss coefficient, which can be specified from the experimental data described below.
In the practical condition of the heat exchanger bundles, the water temperature distribution is not constant along the entire finned tube, and the macro heat exchanger model can simulate the water temperature variation along the flow direction.
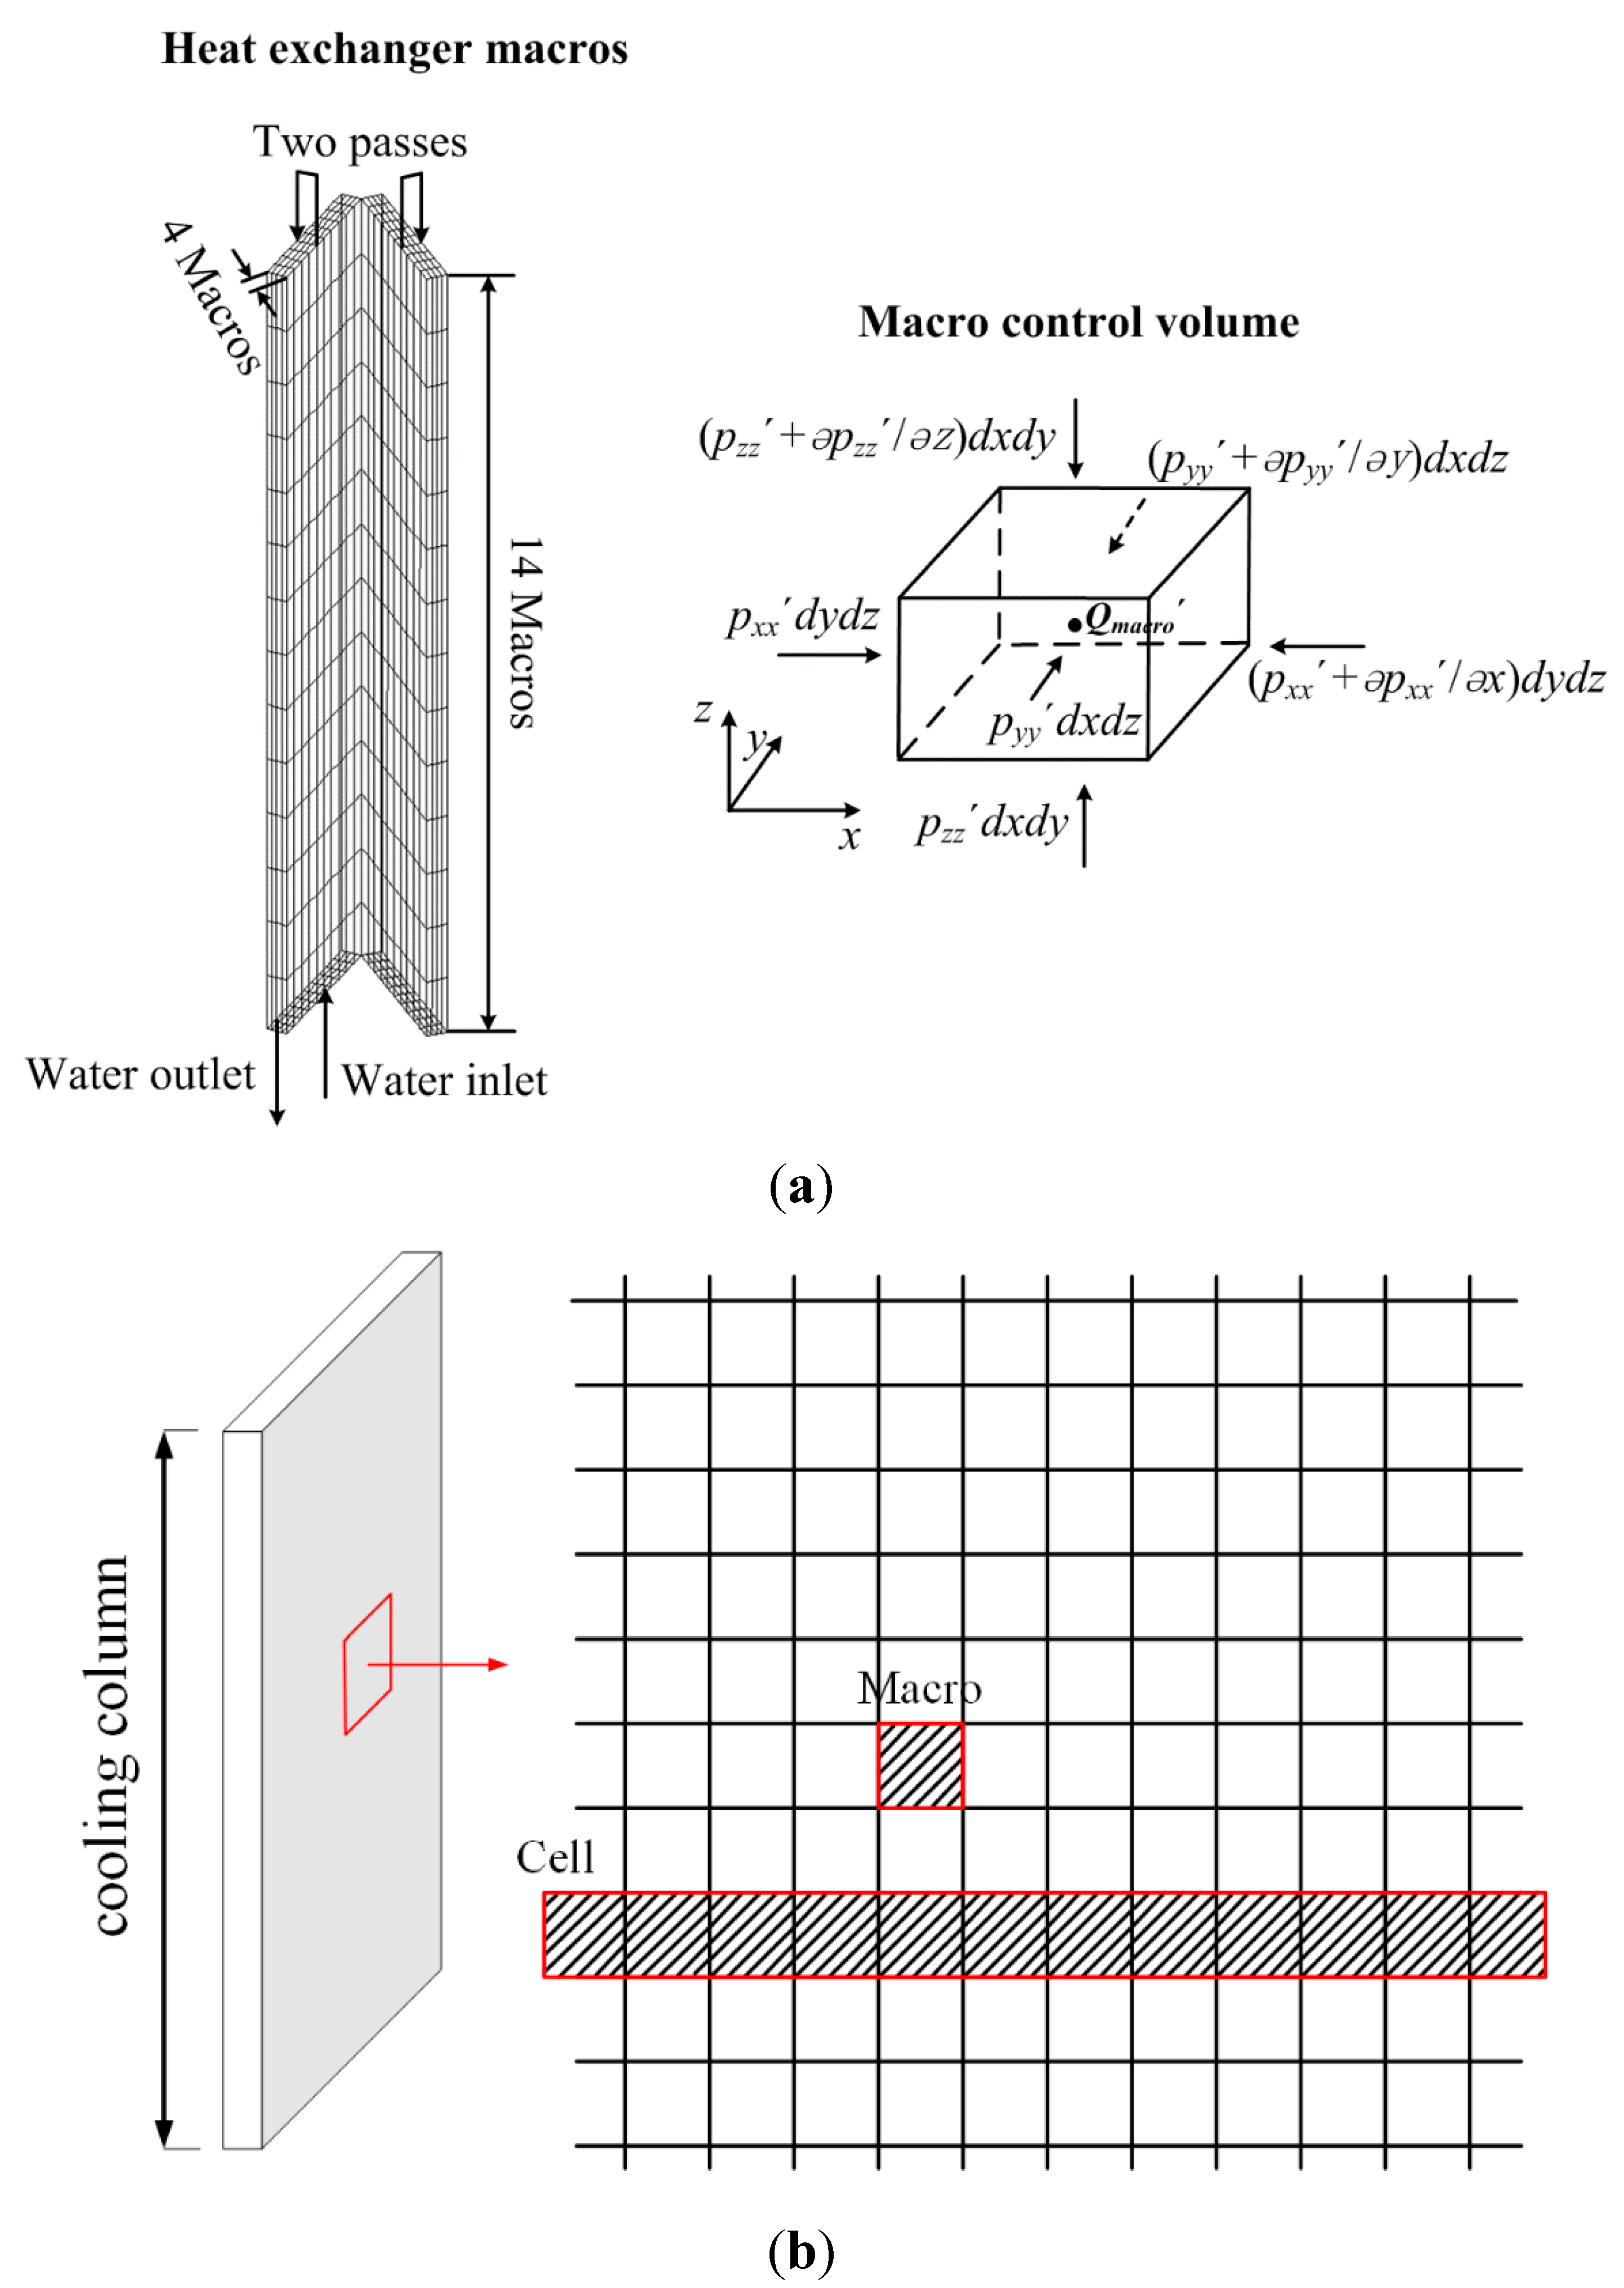
The heat rejection from the control volume of the heat exchanger model is as shown in Figure 3. The heat transfer rate Qmacro is computed with the following form:
Q macro = ε macro m a c p a ( t w a t a )
where macpa is the heat capacity rate of the cooling air. twa represents the heat transfer unit temperature for the circulating water, and ta is the cooling air temperature inside heat exchanger unit. εmacro is the heat exchanger effectiveness, defined as:
ε macro = 1 exp { 1 C r N T U 0.22 [ 1 exp ( C r N T U 0.78 ) ] }
where Cr is the ratio of the heat capacity rate of air to that of water, NTU is the number of transfer units with the following form:
N T U = K A m a c p a
where K and A are the heat transfer coefficient and areas, respectively.
The heat rejection from a cell unit is calculated by summing the heat transfer of all the macros:
Q cell = Q macro
The total heat dissipated from heat exchanger is computed as the sum of the heat rejection from all cooling cell units:
Q total = Q cell
The air-cooled heat exchanger bundles are constructed by a cuboid shape, applying a porous media model to make the air flows perpendicular to the inlet surface of the heat exchanger bundles. More detailed descriptions of the CFD model can be referred to our previous study [22].

2.3. Computational Domain and Boundaries

The cooling heat exchanger and the tower shell were modeled and computed in this work, as shown in Figure 4a. Table 2 shows the boundary settings used in this model. For the far-field boundaries, including the windward, top and leeward surfaces, the turbulence level of airflow field was quite low, and the turbulence intensity and viscosity ratios could be roughly set as 0.1% and 0.1, respectively [23,24]. During windy conditions, the crosswind velocity profile at the windward surface obeys the power law below, and imports a computational model by the UDF (user-defined function) [3,4,5,6,8,9]:
u h = u wd ( H h H ref ) e
where Hh denotes the vertical height above the ground, and uwd represents the crosswind speed at a reference height Href of 10 m. The exponent e is related to the ground roughness and the atmosphere stability, set as 0.2 in this paper.
In order to eliminate the boundary domain impacts on the air flow, independent verification has was conducted for various computational domain dimensions, and a size of 1500 m × 1500 m × 900 m was finally adopted. Both the central block and the extended regions were employed with hexahedral grids, due to the cylindrical configuration of NDDCS. For an accurate simulation of the flow and heat transfer details, the boundary layer mesh near the tower wall region, and the very small sizes meshed in the air-cooled condenser section were employed, while the mesh size increased proportionately for the other regions to meet both the computational accuracy and the cost demands. The detailed meshes for the dry-cooling tower and the heat exchanger are shown in Figure 4b. For the cooling system, the grid interval size for the heat exchanger was set to 0.4 m; however, for the cooling tower zone, the grid interval size was set to 4 m with a 1.03 growth ratio along the tower height. For the farmost field from the dry-cooling tower, an initial interval size of 10 m and a successive ratio of 1.1 was adopted. As a result, 2,805,587 grid cells were created. Moreover, when the grid interval sizes of the heat exchanger cell and cooling tower were set to be equal to 0.3 m and 3 m, 0.2 m and 2.5 m, and 0.1 m and 2 m, 3,775,980, 4,951,524, and 6,141,276 grid cells were successively generated. To check the mesh independence of the computed results, the exit air mass flow rate of cooling tower, and the heat transfer rate between the airflow and heat exchanger bundles were selected to test the grid number, since it represents the cooling performance of the NDDCS. The mass flow rate of the cooling air through the tower outlet, and the heat rejection of the heat exchanger bundles at a wind speed of 4 m/s varied by merely ~0.26% and ~0.32% for the latter two dense grids, so that the cell number of 4,951,524 for the cooling system was finally adopted, with acceptable computation results.
The CFD package ANSYS fluent 14.0, based on the finite volume method, was used to govern the equations with prescribed boundary conditions. The second-order upwind differencing scheme was adopted to discretize the momentum, energy, and turbulent kinetic energy equations. The SIMPLE algorithm was applied for pairing the velocity and pressure fields. The numerical iterations continued until all of the residuals of the dependent variables reached reasonable levels. Additionally, the air mass flow rate through the cooling tower was also monitored, and the relative errors between the two iterates should be continuously less than 10−4, to guarantee that the computational results are converged to a rational level.

2.4. Heat Exchanger Experiments

To obtain f and εmacro, an experimental analysis of flow and heat transfer performance for a four-row staggered slotted finned tube heat exchanger was carried out, using the thermal state experimental tunnel system presented here. A schematic diagram of the experimental system and the photos of the experimental facilities are shown in Figure 5. The wind tunnel has a test section that is covered by an asbestos layer, to minimize heat losses, which closely matched the experimental sample, to eliminate contraction and expansion losses. The staggered configuration is characterized by transverse and longitudinal pitches of 35 mm, a diameter of 35 mm, a fin spacing of 3.2 mm, and a fin thickness of 0.3 mm, with the tubes and fins of the heat exchanger are made from aluminum. The test section size is 400 mm in width, 700 mm in height, and 1000 mm long. In the air loop, the flow rate was controlled by a digital blower speed controller that was able to provide a windward air velocity of between 0.5 and 5 m/s, which was adjusted based on a hotwire anemometer with a precision of ±0.05 m/s. Two strings of L-type Pitot tubes were implanted upstream and downstream of the exchanger, to measure the pressure drop along the test section, using an inclined single tube microdifferential pressure gauge with a precision of ±0.15 Pa. Two fine metal grids were placed in the inlet (12 T-type thermocouples) and outlet (16 T-type thermocouples) of the test section.
The water loop was supplied by a water temperature control system that was able to provide a constant hot water inlet temperature of 60 °C. The output of the water flow rate was equipped with a turbine flowmeter with a precision of ±0.5%, and kept at approximately 0.694 kg/s during the experiments. Both the inlet and outlet tube wall temperatures were measured by setting six T-type thermocouples at the inlet and outlet parts of the tubes, respectively. In order to achieve accurate measurements, the thermocouples were pre-calibrated by using the ice point calibration method, with an error range of ±0.1 °C. The energy imbalance between the air and water sides was within 7.57%.
As the temperature maintains stabilized, all of the experimental data signals were collected and converted by the data acquisition system and the host computer. The experimental results of the core friction coefficient, and the heat exchanger effectiveness with the windward air velocity have been plotted in Figure 5c.

2.5. Numerical Model Validation

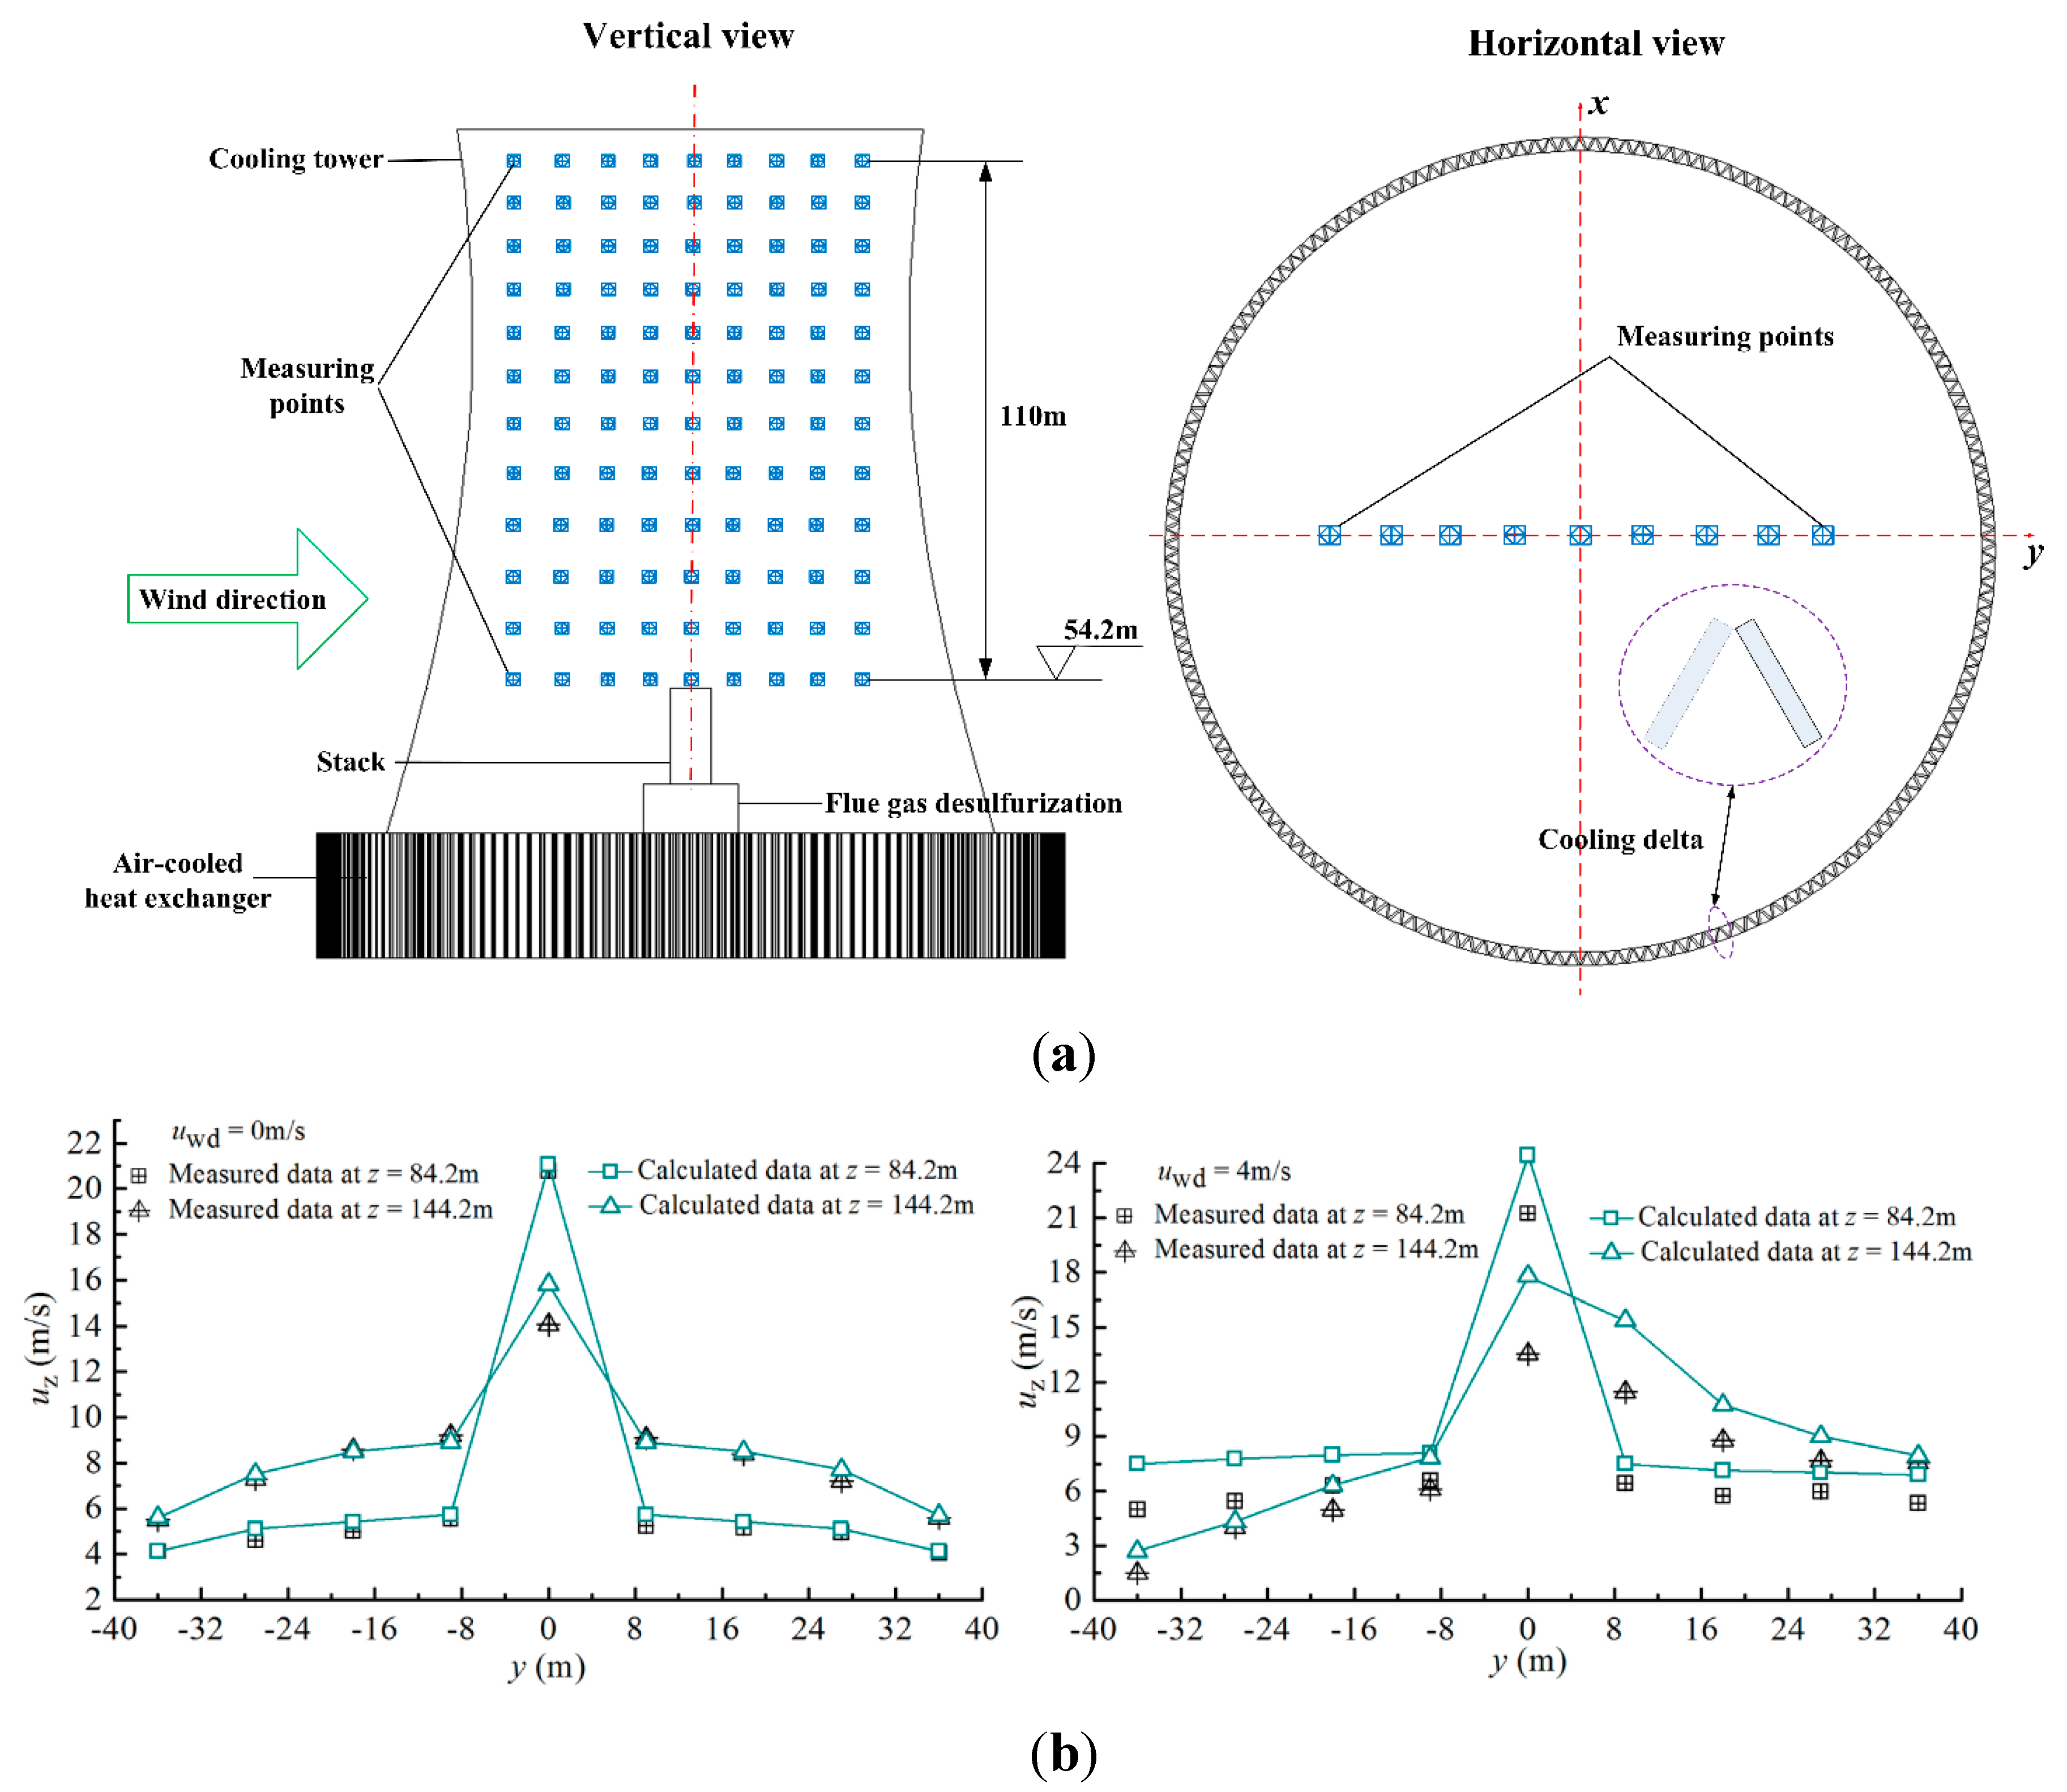
To evaluate the modeling and numerical methods, flow performance experiment of the scale model for an NDDCS was carried out, and the measurement point schematic design is shown in Figure 6a. Wind speeds are measured by a hot-wire anemometer, IFA-300, with an accuracy of ±0.1%, and 108 measuring points were placed inside the cooling tower far from the main structures, with 12 layers in the z direction and nine columns in the y direction. Moreover, the vertical and horizontal intervals between measuring points were 10 m and 9 m for the model tower, respectively. Both the results were processed and output by the data acquisition unit and computer, and the experimental uncertainties of the measured rising velocity were about 0.6% [25].
Two horizontal cross-sections with heights of 84.2 m and 144.2 m were used to compare the numerical and experimental results, which are shown in Figure 6b. It can be concluded that the calculated results by using the heat exchanger model agreed well with the measured data. This verifies that the heat exchanger model is reliable enough for the performance prediction of the NDDCS.

3. Results and Discussion

3.1. Variables of Sectors

With the macro heat exchanger model, the 3D overall outlet air temperatures of the large scale air-cooled exchanger of NDDCS can be presented, which are shown in Figure 7a,b at a typical small wind speed of 4 m/s and a high wind speed of 12 m/s. As can be seen, the global visions varied quite significantly from each other. Meanwhile, Figure 7c,d quantitatively shows the air mass flow rate and heat rejection of the five air-cooled sectors at various wind speeds. As observed, the air mass flow rate and heat rejection both increased for the frontal sector No.1, as the wind speed increases. While for the middle front sector No.2, it shows the small thermo-flow differences at various wind speeds. However, for the middle sector No.3, as well as the middle rear sector No.4, the air mass flow rate and heat rejection both changed greatly with the wind speed, and the most deteriorated thermo-flow performances appeared at a wind speed of 12 m/s for the two sectors. As for the leeward sector No.5, the maximum air mass flow rate and heat rejection could be seen at a wind speed of 12 m/s; additionally, although the air mass flow rate was almost the smallest at a wind speed of 16 m/s, the heat rejection was still maintained at an intermediate level.

3.2. Variables of Cooling Deltas

As the most superiors of the heat exchanger model, the local thermo-flow characteristics of each cooling delta can be specifically compared and analyzed at various wind speeds, which are shown in Figure 8, Figure 9, Figure 10, Figure 11, Figure 12, Figure 13, Figure 14, Figure 15, Figure 16 and Figure 17. Besides, it must be pointed out that for the frontal and middle-front sectors, the flow and temperature fields at the small and high wind speeds of 4 m/s and 12 m/s are presented as being typical cases. In contrast, for the middle, middle-rear, and leeward sectors, the variable fields at a high wind speed of 16 m/s were additionally analyzed, due to the thermo-flow complexities.
For the frontal cooling deltas, Figure 8 presents a much higher pressure difference and air temperature differences at high wind speeds, so that the air mass flow rate and heat rejection appear to be larger at a high wind speed, as shown in Figure 9. However, due to the aggravated air flow deviation at the high wind speed, the air mass flow rate reduces more conspicuously along the circumferential angle at the strong crosswind, which then results in a sharper heat rejection drop, as observed in Figure 9b.
For the middle-front cooling deltas, an intensified air flow deviation can be seen in Figure 10a,b, besides, the vortices even appear at a high wind speed, which gradually becomes larger along the circumferential angle. Therefore, the outlet air temperature becomes more chaotic along the cooling deltas under the strong crosswind, as compared to Figure 10c,d. As a consequence, the mass flow rate and heat rejection both plummet obviously along the circumferential angle at various wind speeds as shown in Figure 11. Additionally, both the air mass flow and heat rejection drop more dramatically at the high wind speed resulting from the air flow vortices, so that the smaller values even appear for several of the backward cooling deltas.
For the middle cooling deltas, the cooling air flows almost tangentially at a low wind speed of 4 m/s, while hot flow recirculation is produced, even at the high wind speeds of 12 m/s and 16 m/s; besides, big inner vortices are observed at 16 m/s, as shown in Figure 12a–c. As a result, from Figure 12d–f, it can be seen that the outlet air temperature is extremely high and disordered at the high wind speeds of 12 m/s and 16 m/s. In such a case, the air mass flow rate and the present heat rejections are obviously lower at the higher wind speeds, as shown in Figure 13. It was also noted that the fifth to 11th cooling deltas had negative air mass flow rates at a wind speed of 12 m/s, due to hot flow recirculation.
For the middle-rear deltas, it can be seen from Figure 14a that the air changed from a perpendicular direction to flow through the finned tube bundles at a small wind speed of 4 m/s, due to the recovered pressure differences. In contrast, at a high wind speed of 12 m/s, air flow penetration appeared for the first to the seventh deltas, resulting from the reversed pressure difference between the inlets and outlets of the finned tube bundles, as shown in Figure 14b. However, for the eighth to 11th deltas, the improved flow field could be observed, due to the positive pressure differences. At a high wind speed of 16 m/s (Figure 14c), the outside vortices can be seen near the downward sixth to 11th cooling deltas. In Figure 14d, the disordered high outlet air temperature region contracts gradually for the 11 cooling deltas at the small wind speed of 4 m/s. While at a high wind speed of 12 m/s, the extremely high outlet temperature is largely distributed for the first to seventh cooling deltas, which do not recover until the last four deltas, as shown in Figure 14e. At a high wind speed of 16 m/s (Figure 14f), the last six cooling deltas have a smaller high outlet air temperature area than those of the first five deltas. On the whole, most of the cooling deltas have the highest air mass flow rates at a wind speed of 4 m/s, whereas the lowest values occur at 12 m/s, as shown in Figure 15. Correspondingly, for the first cooling delta, the highest degree of heat rejection appears at a small wind speed of 4 m/s, however, for the last sixth to 11th cooling deltas, the maximum values are presented at a high wind speed of 16 m/s, due to the intensified heat transfer effects from the outside vortices.
For the leeward deltas, the air flow fields gradually recover along the cooling deltas at various wind speeds, and a higher pressure difference is presented at 12 m/s, as shown in Figure 16a–c. Besides, Figure 16d–e shows the contractive high-outlet air temperature regions for the backward cooling deltas. Conclusively, the highest air mass flow rates and heat rejections appear at a high wind speed of 12 m/s, as shown in Figure 17. In addition, although most of the cooling deltas have the smallest air mass flow rates at the high wind speed of 16 m/s, they have slightly higher heat rejections than at the small wind speed of 4 m/s, due to the more expanded lower outlet air temperature regions along the upper parts of the cooling deltas.

4. Conclusions

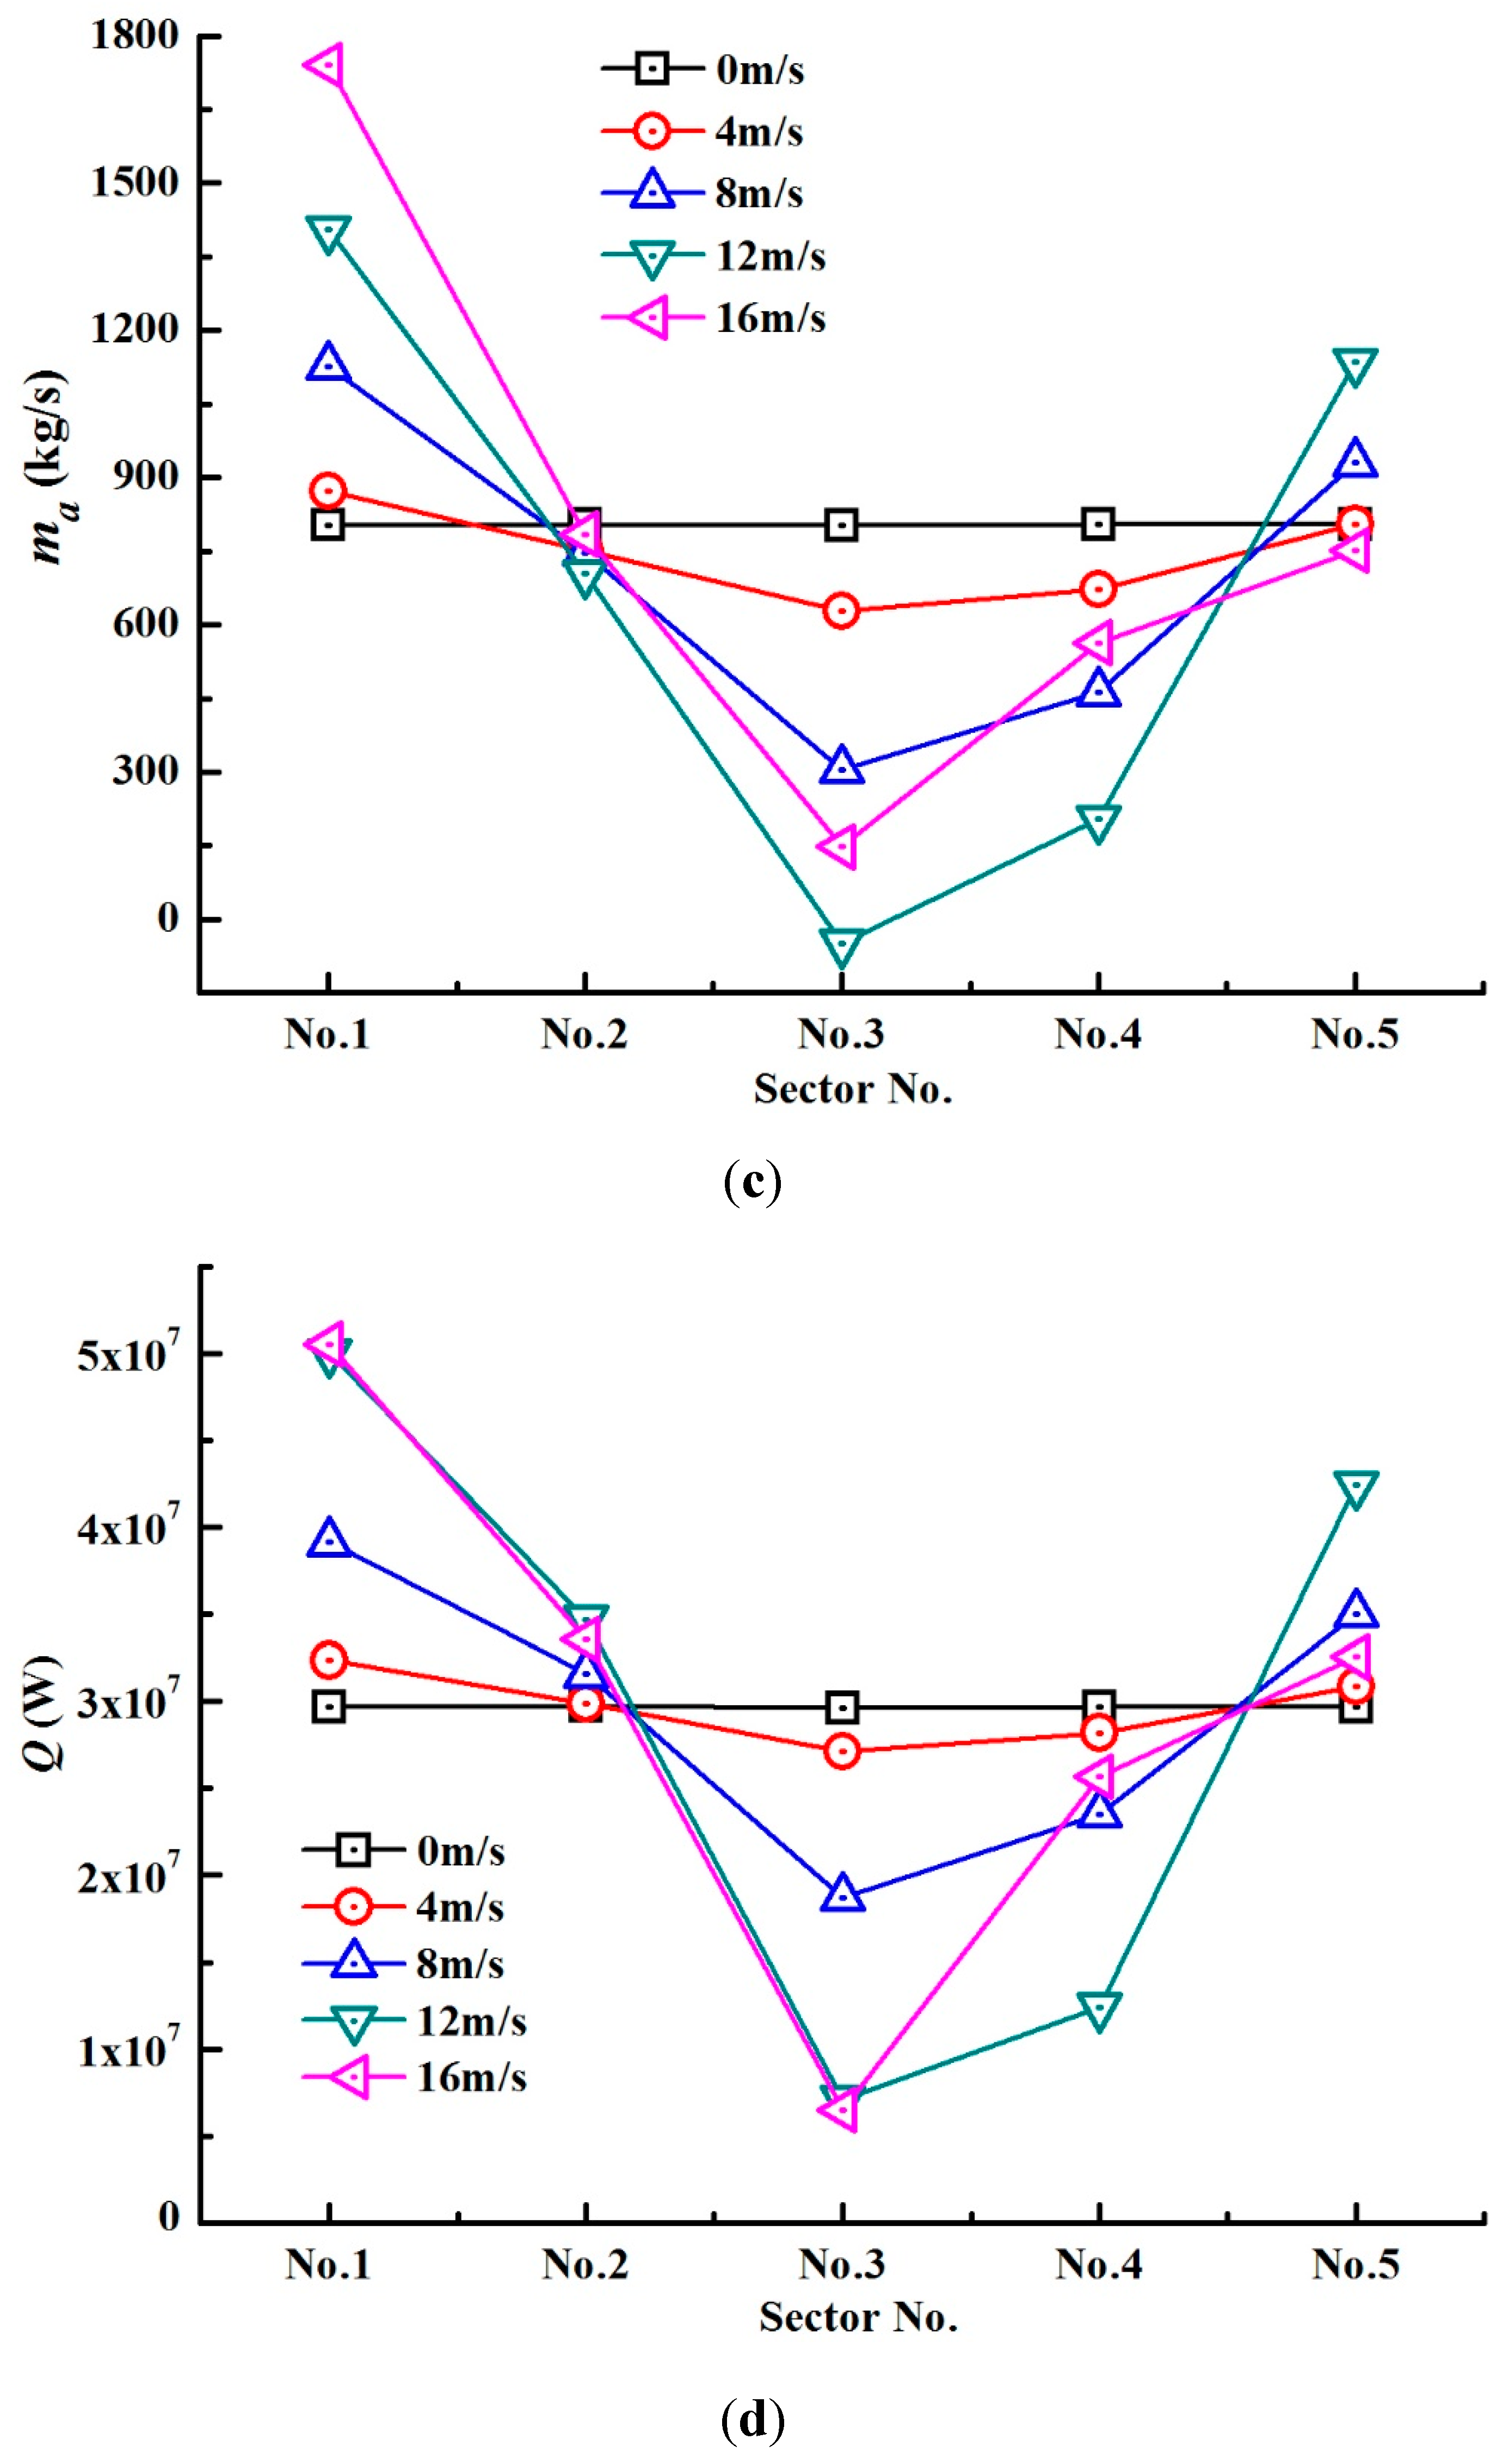
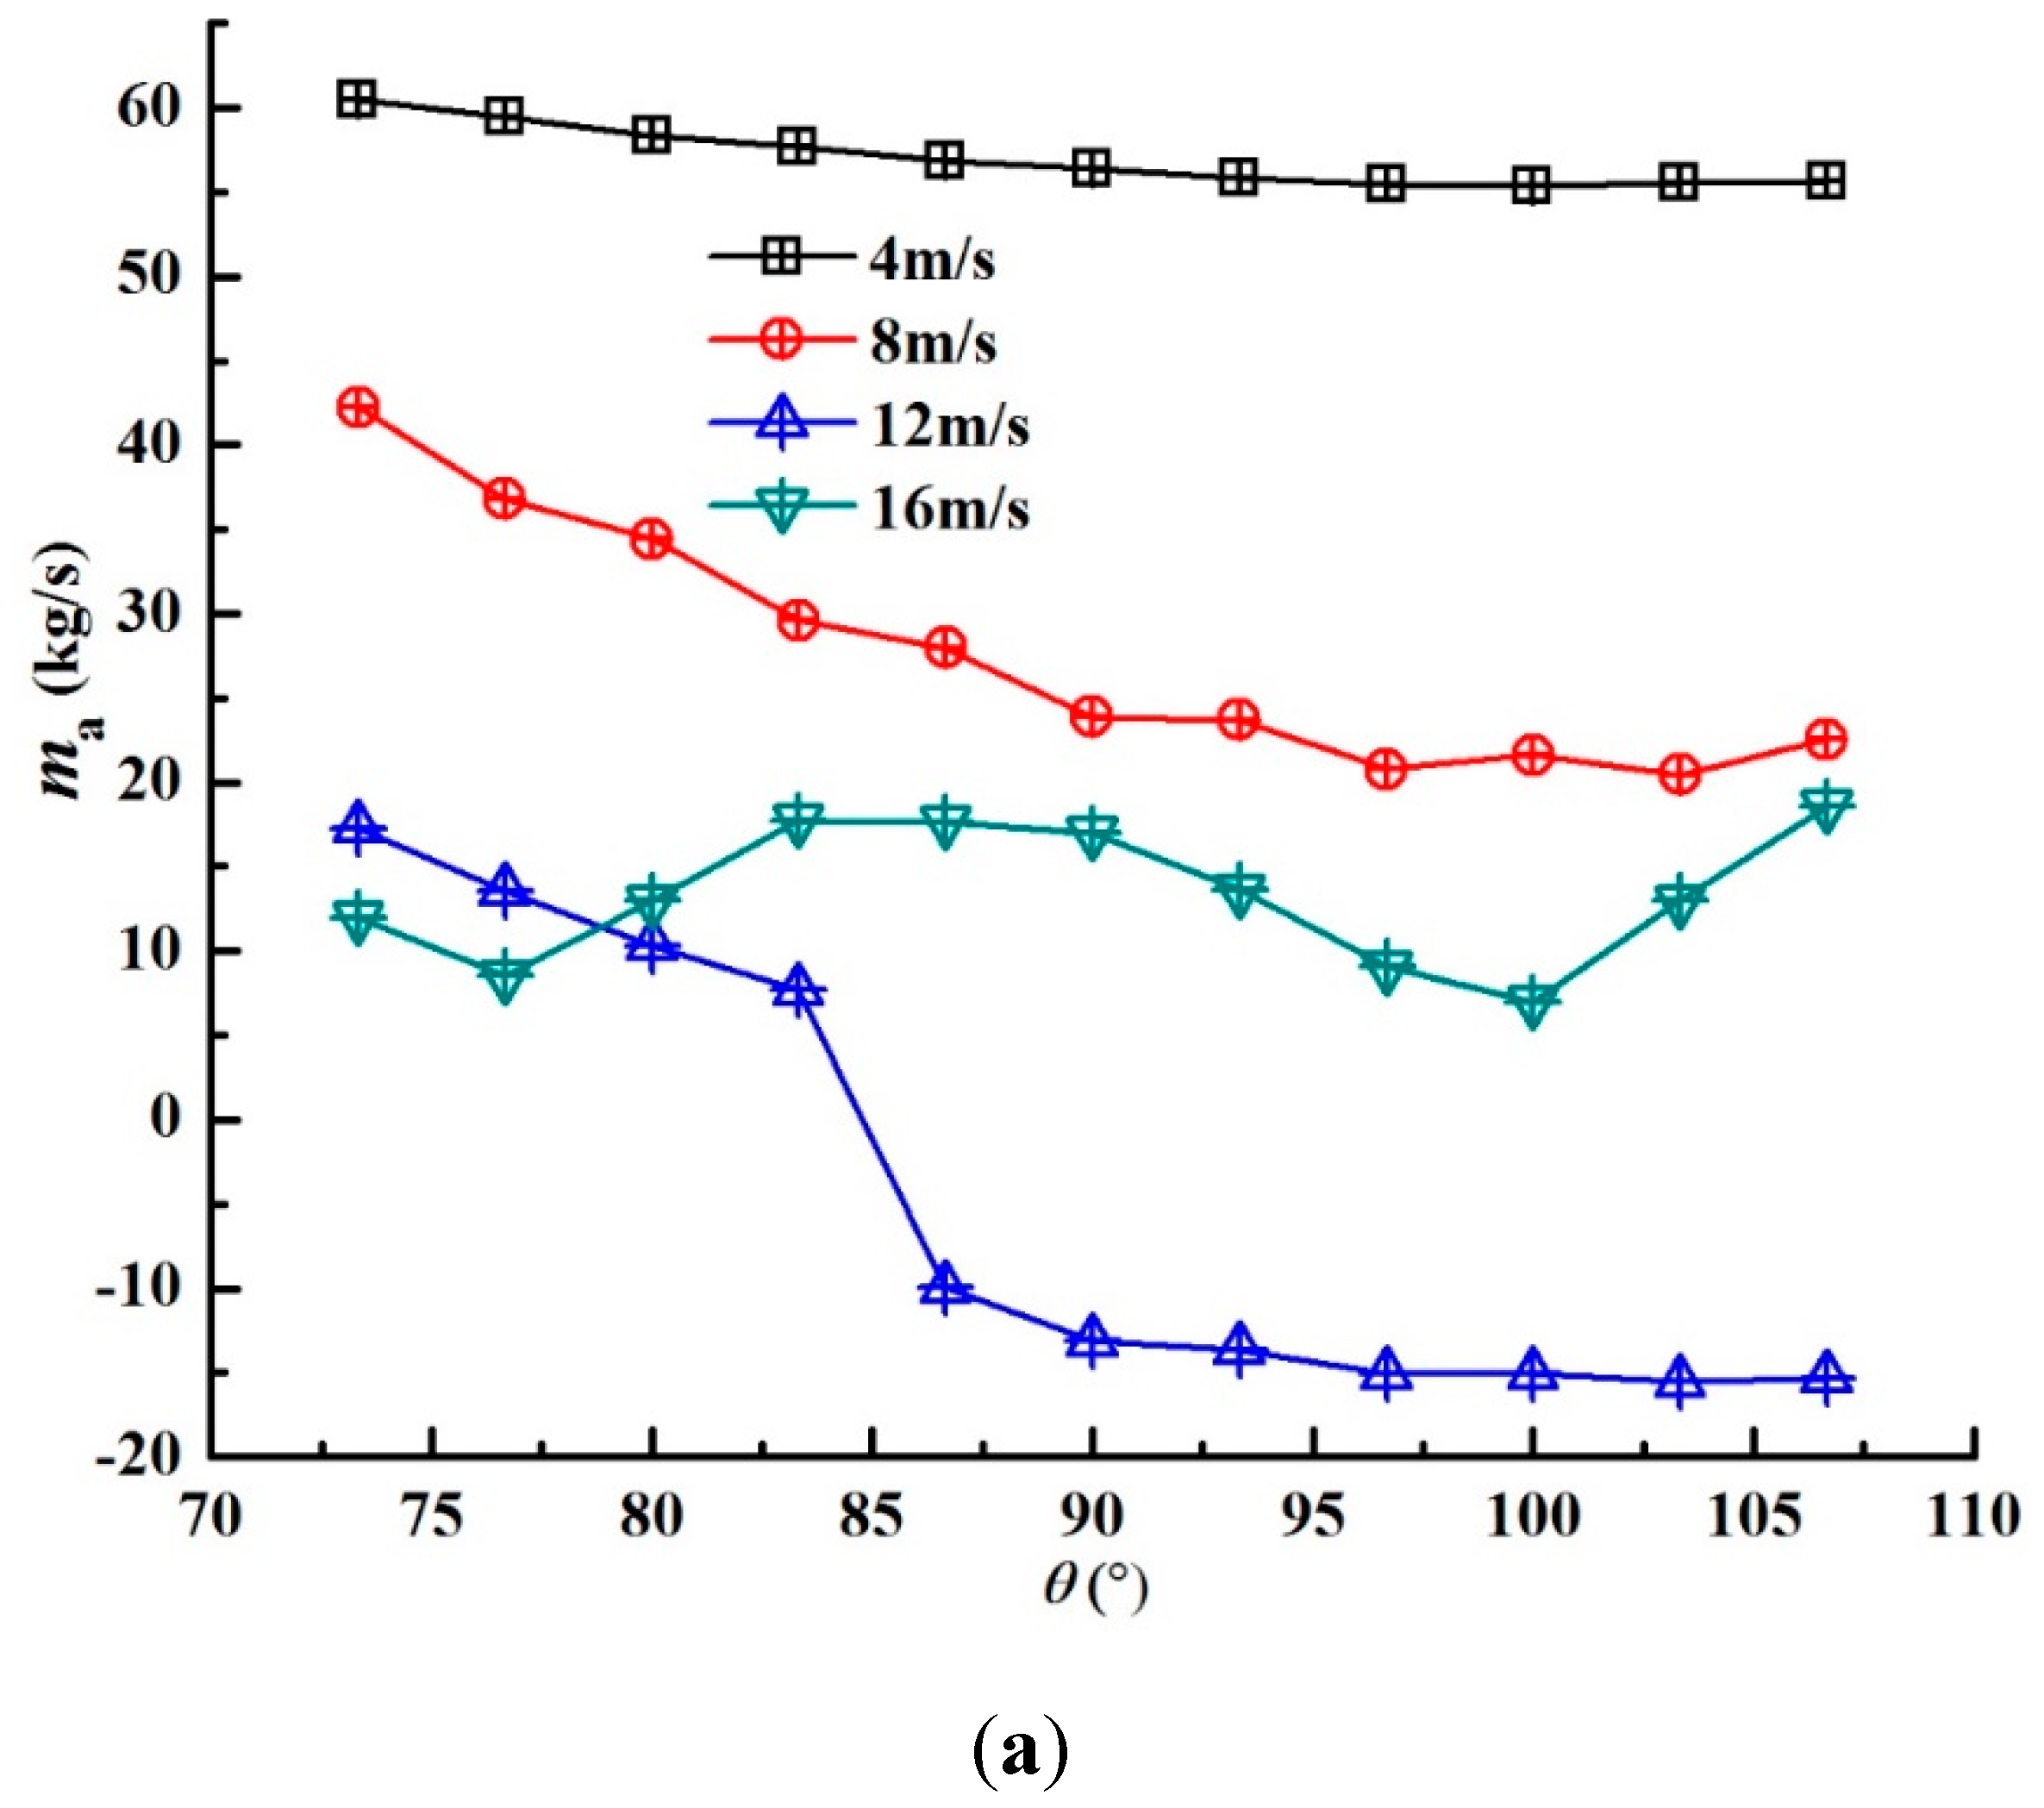
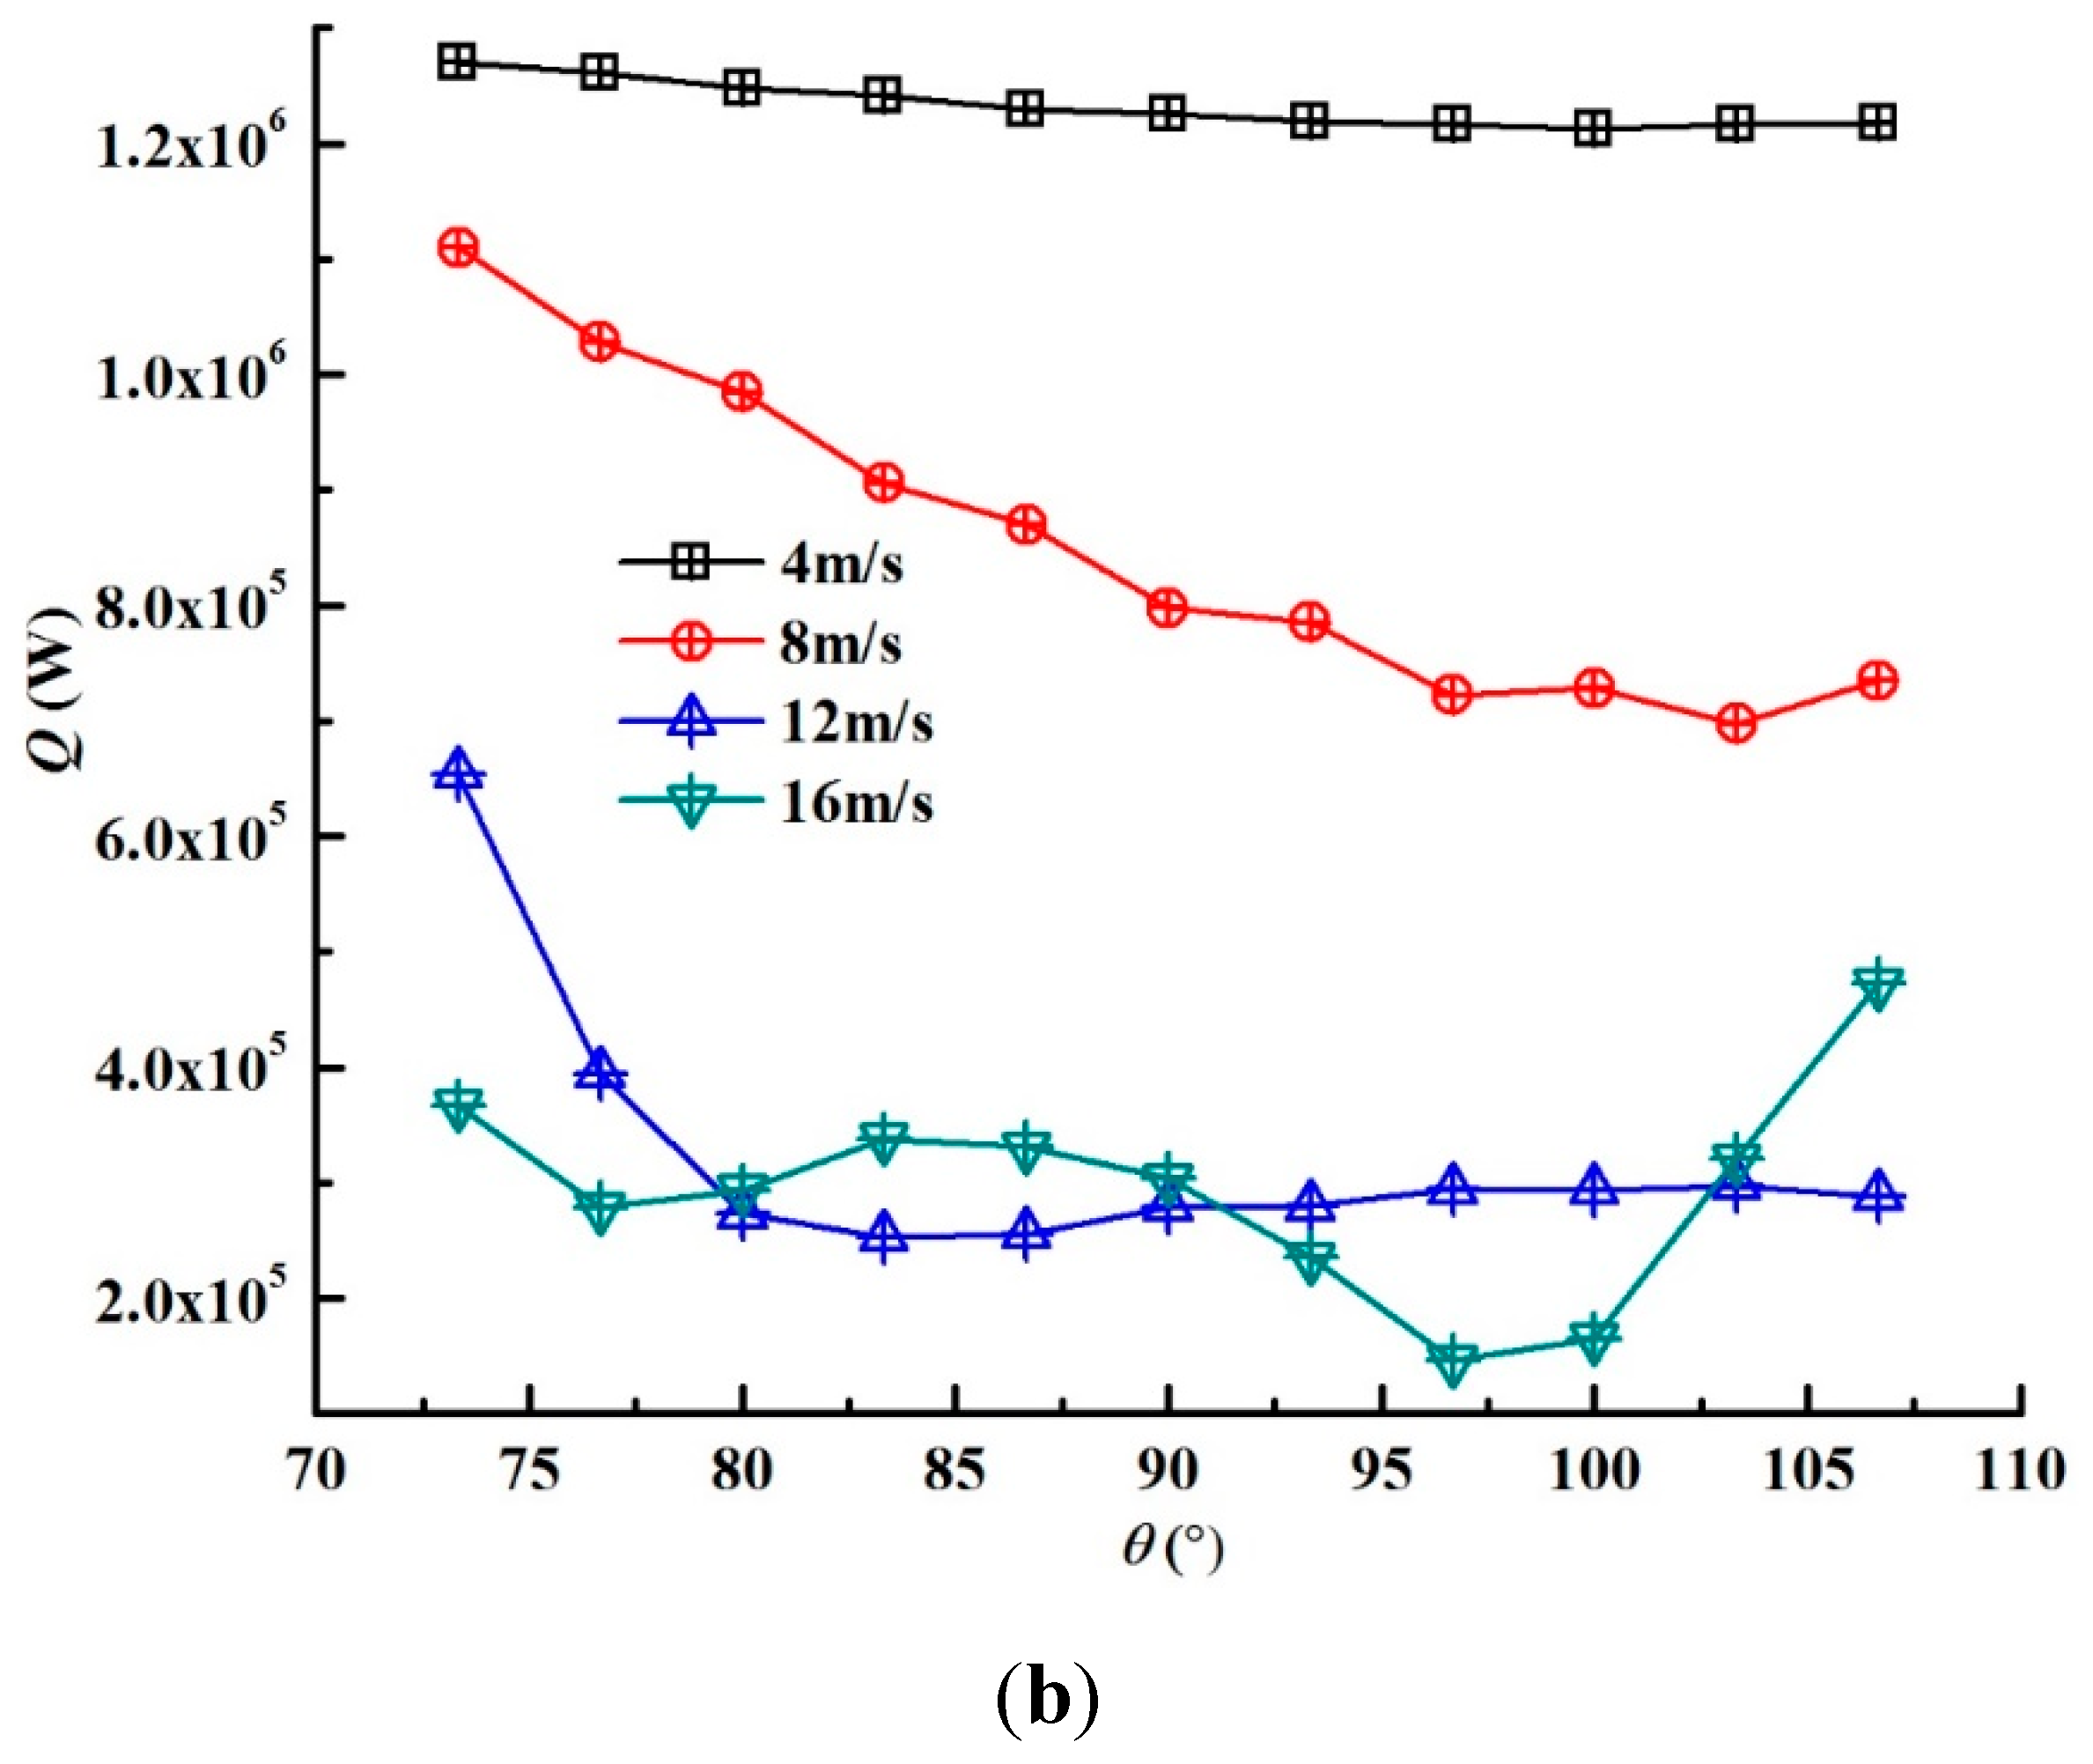
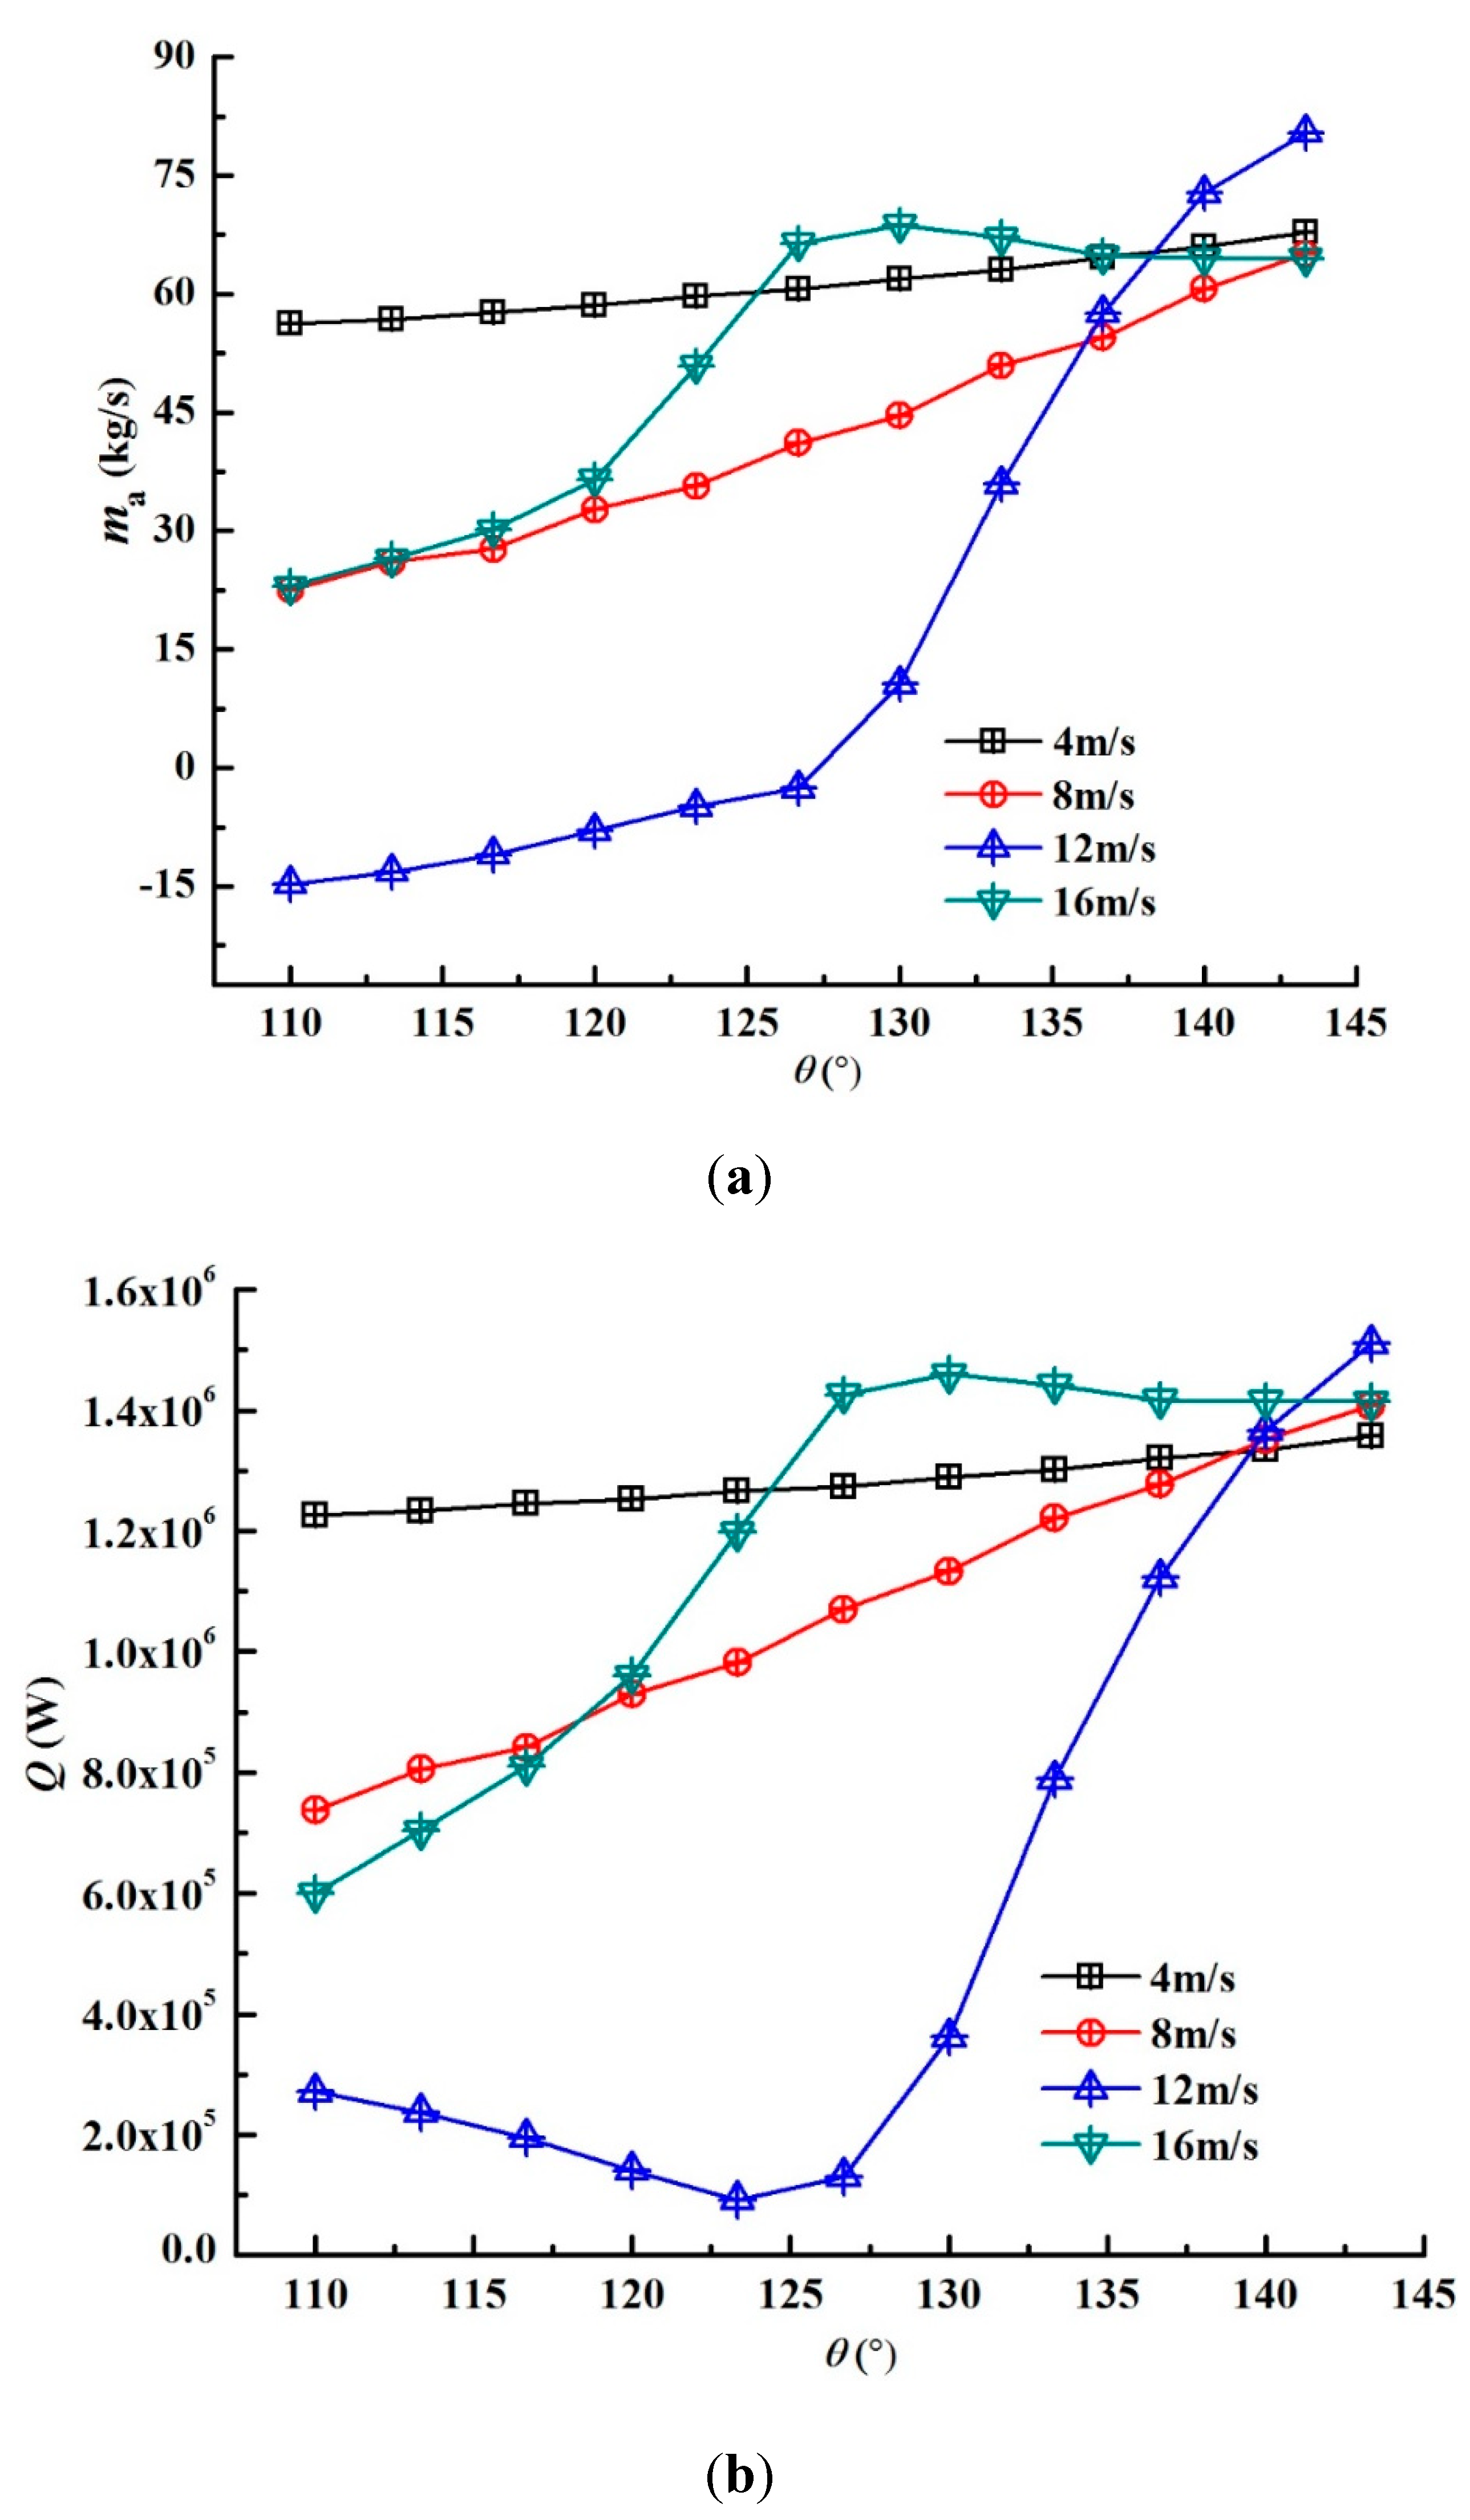
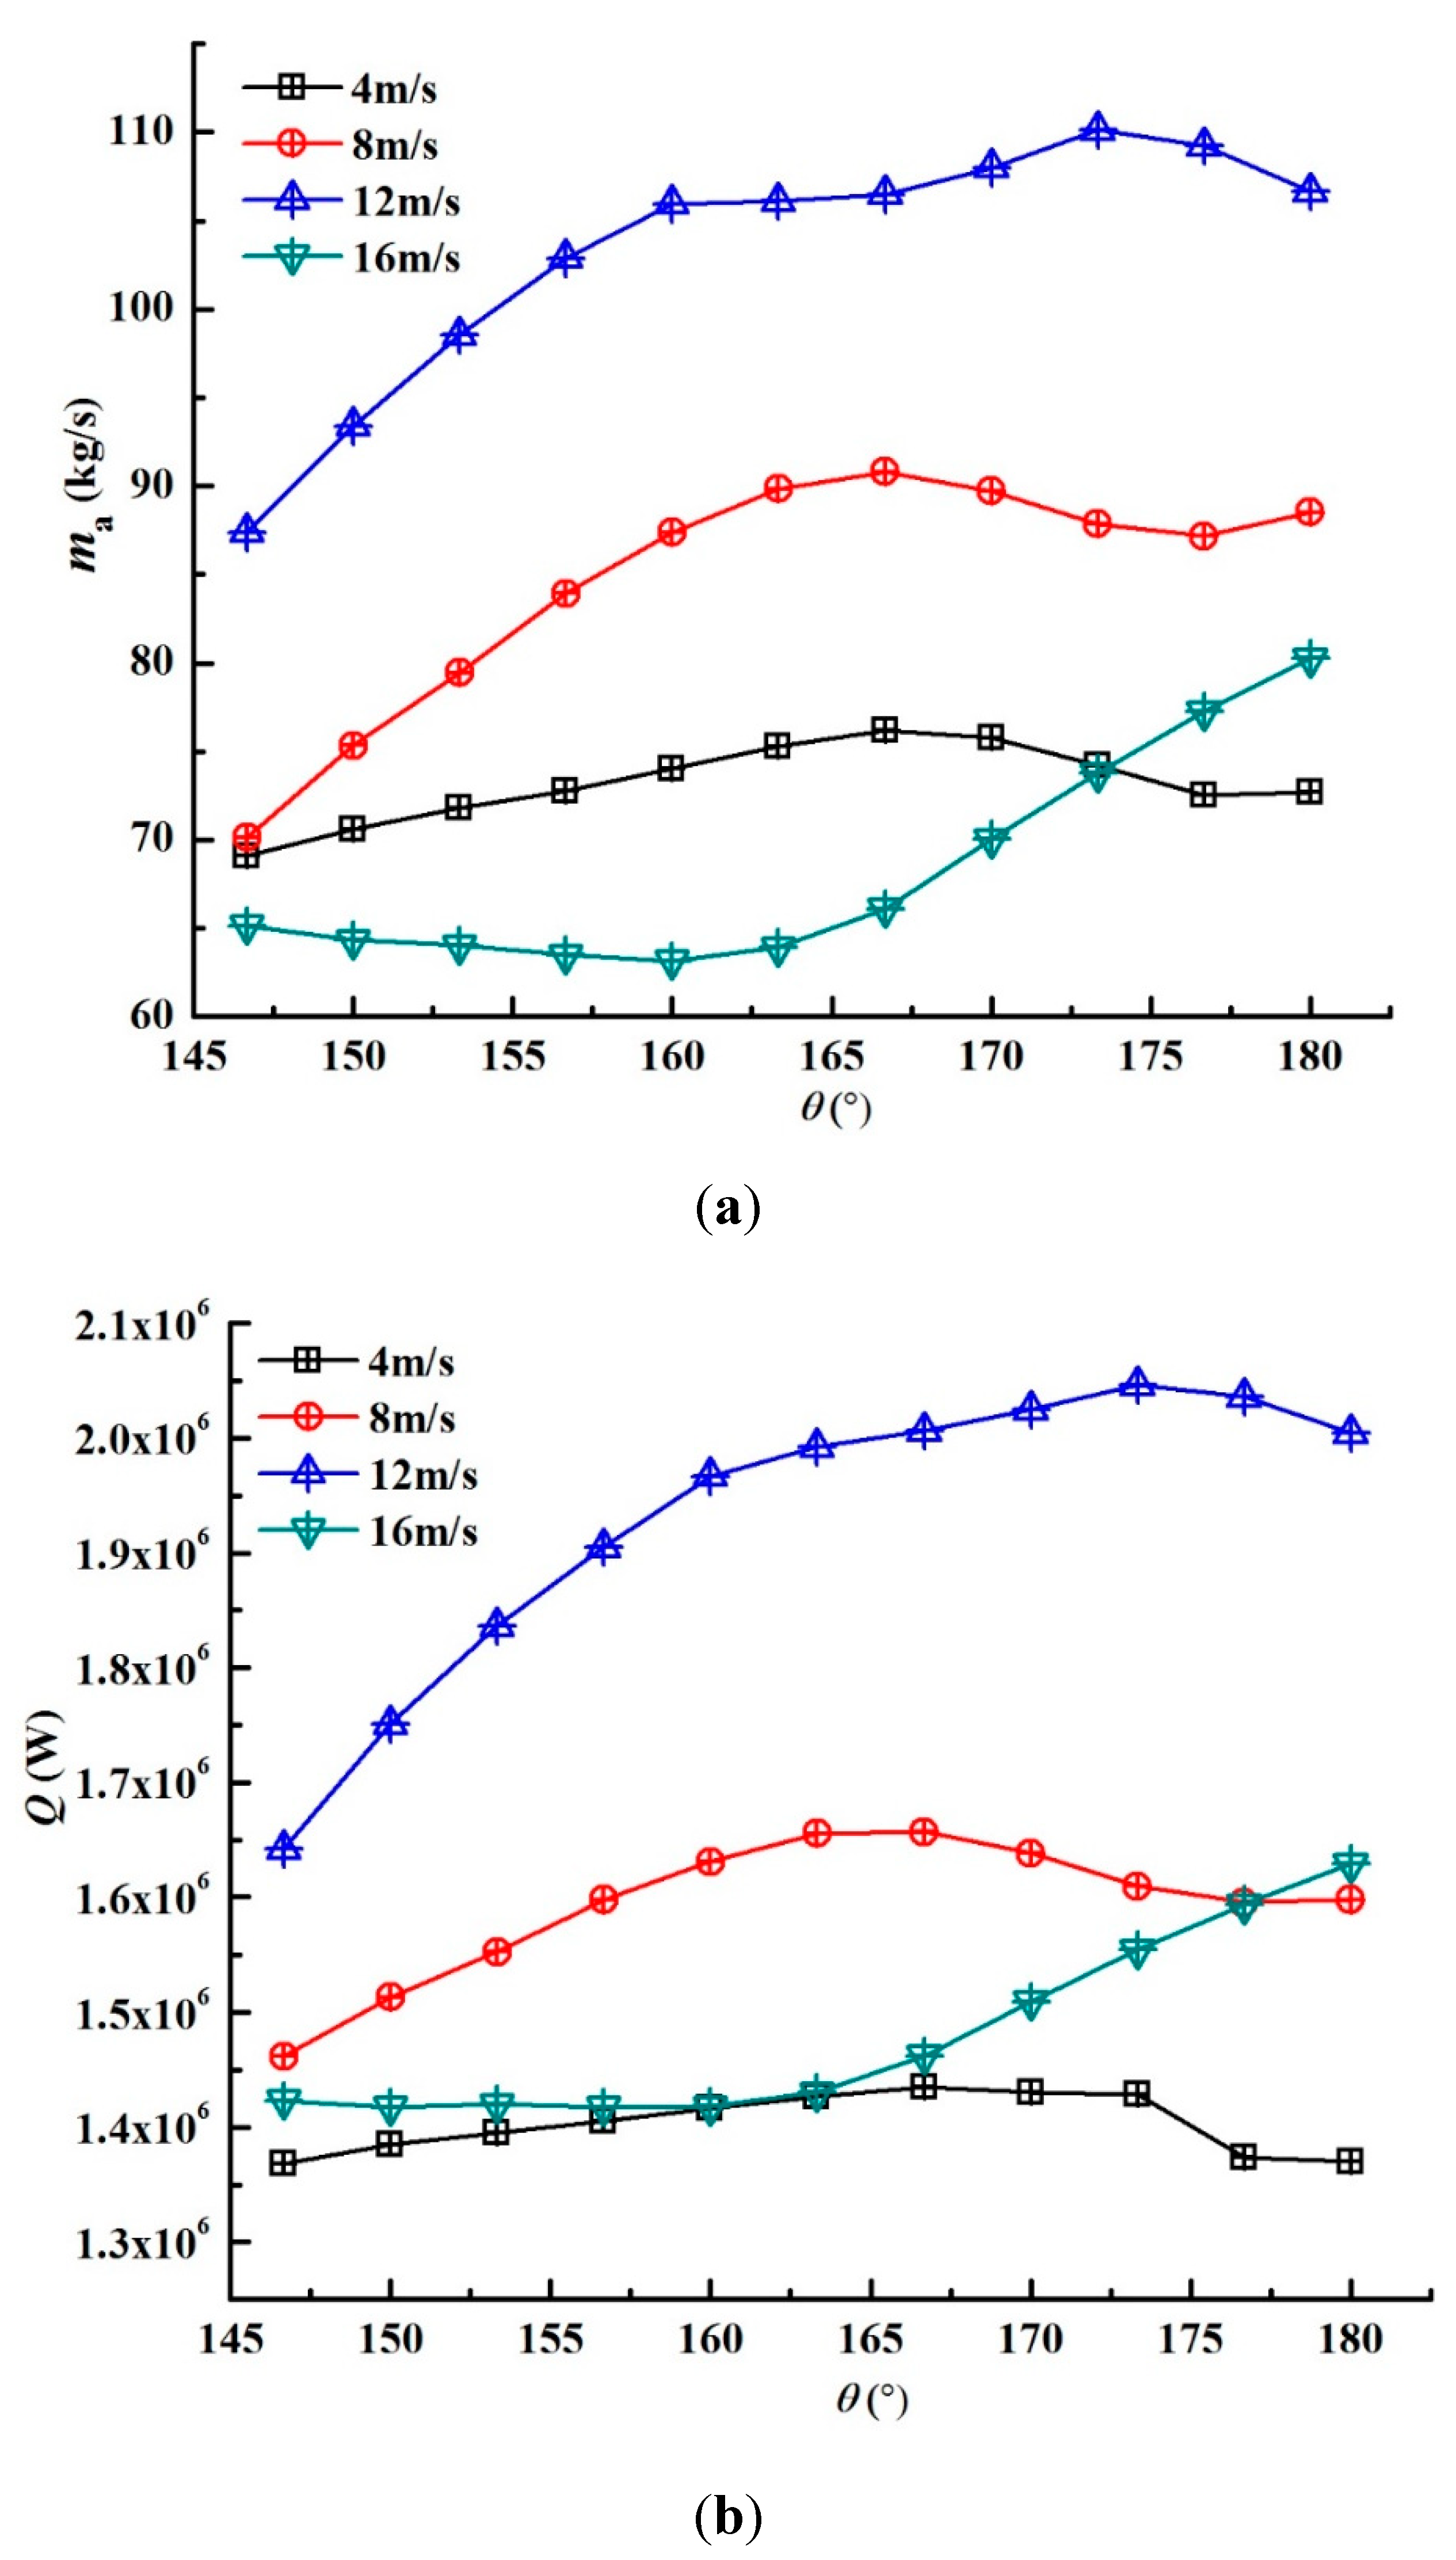
With the macro heat exchanger model, the 3D overall outlet temperature fields are presented for a large-scale air-cooled heat exchanger, and the quantitative thermo-flow performances are also compared at various wind speeds. The results show that the air mass flow rate and heat rejection for the frontal sector increase as the wind speed increases, but they show little variation for the middle-front sector. For the middle and middle-rear sectors, the thermo-flow performances vary dramatically with the wind speed, and they are the most deteriorated at a wind speed of 12 m/s; however, the rear sector receives the best performance at 12 m/s.
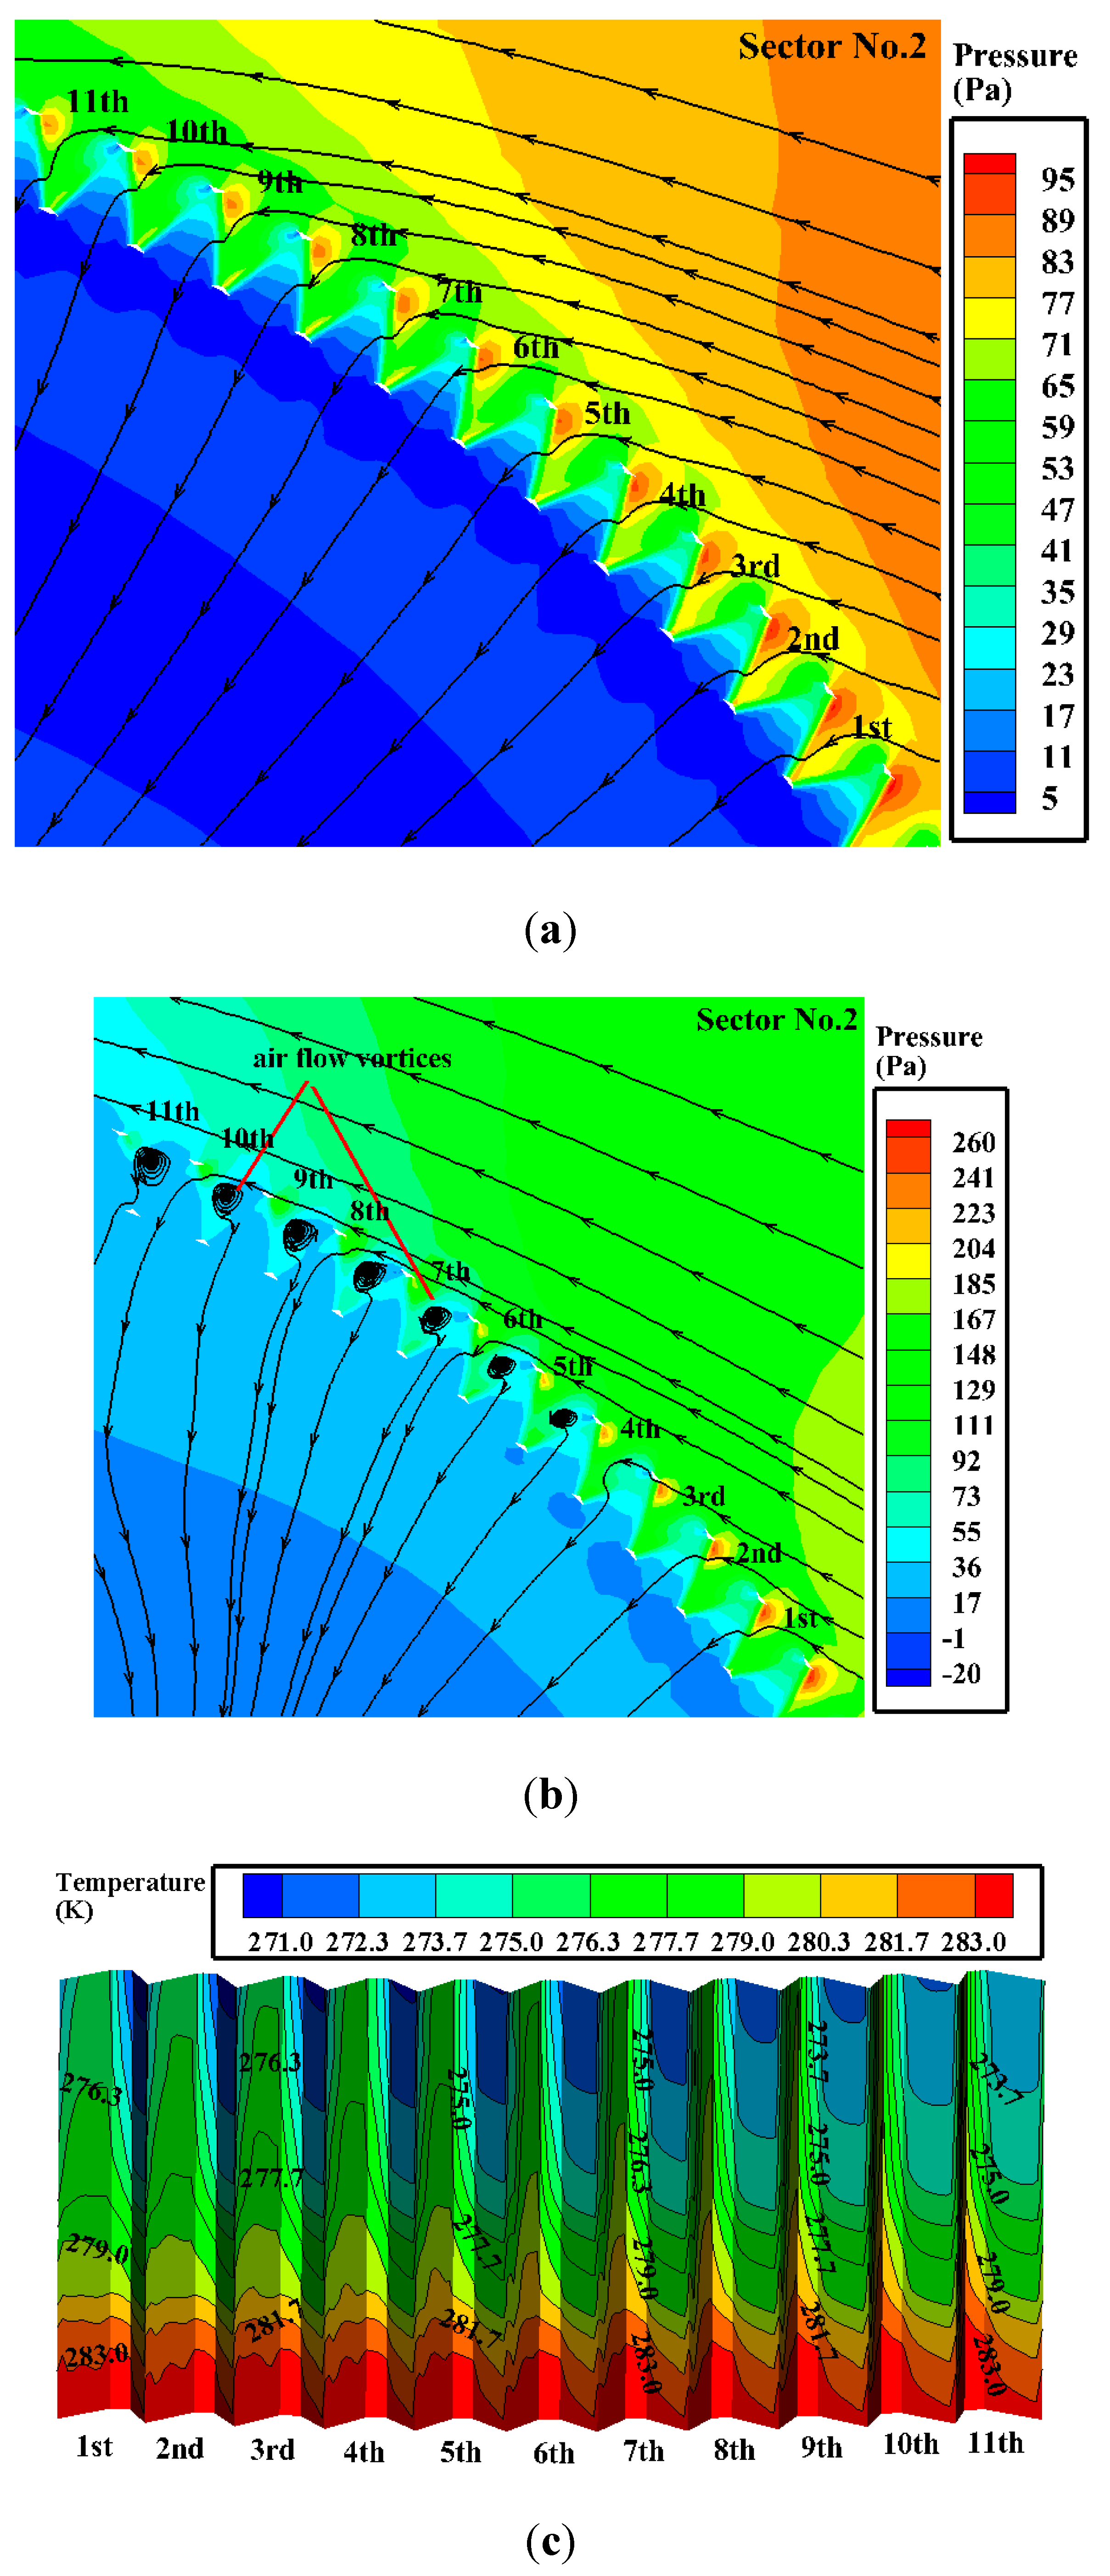
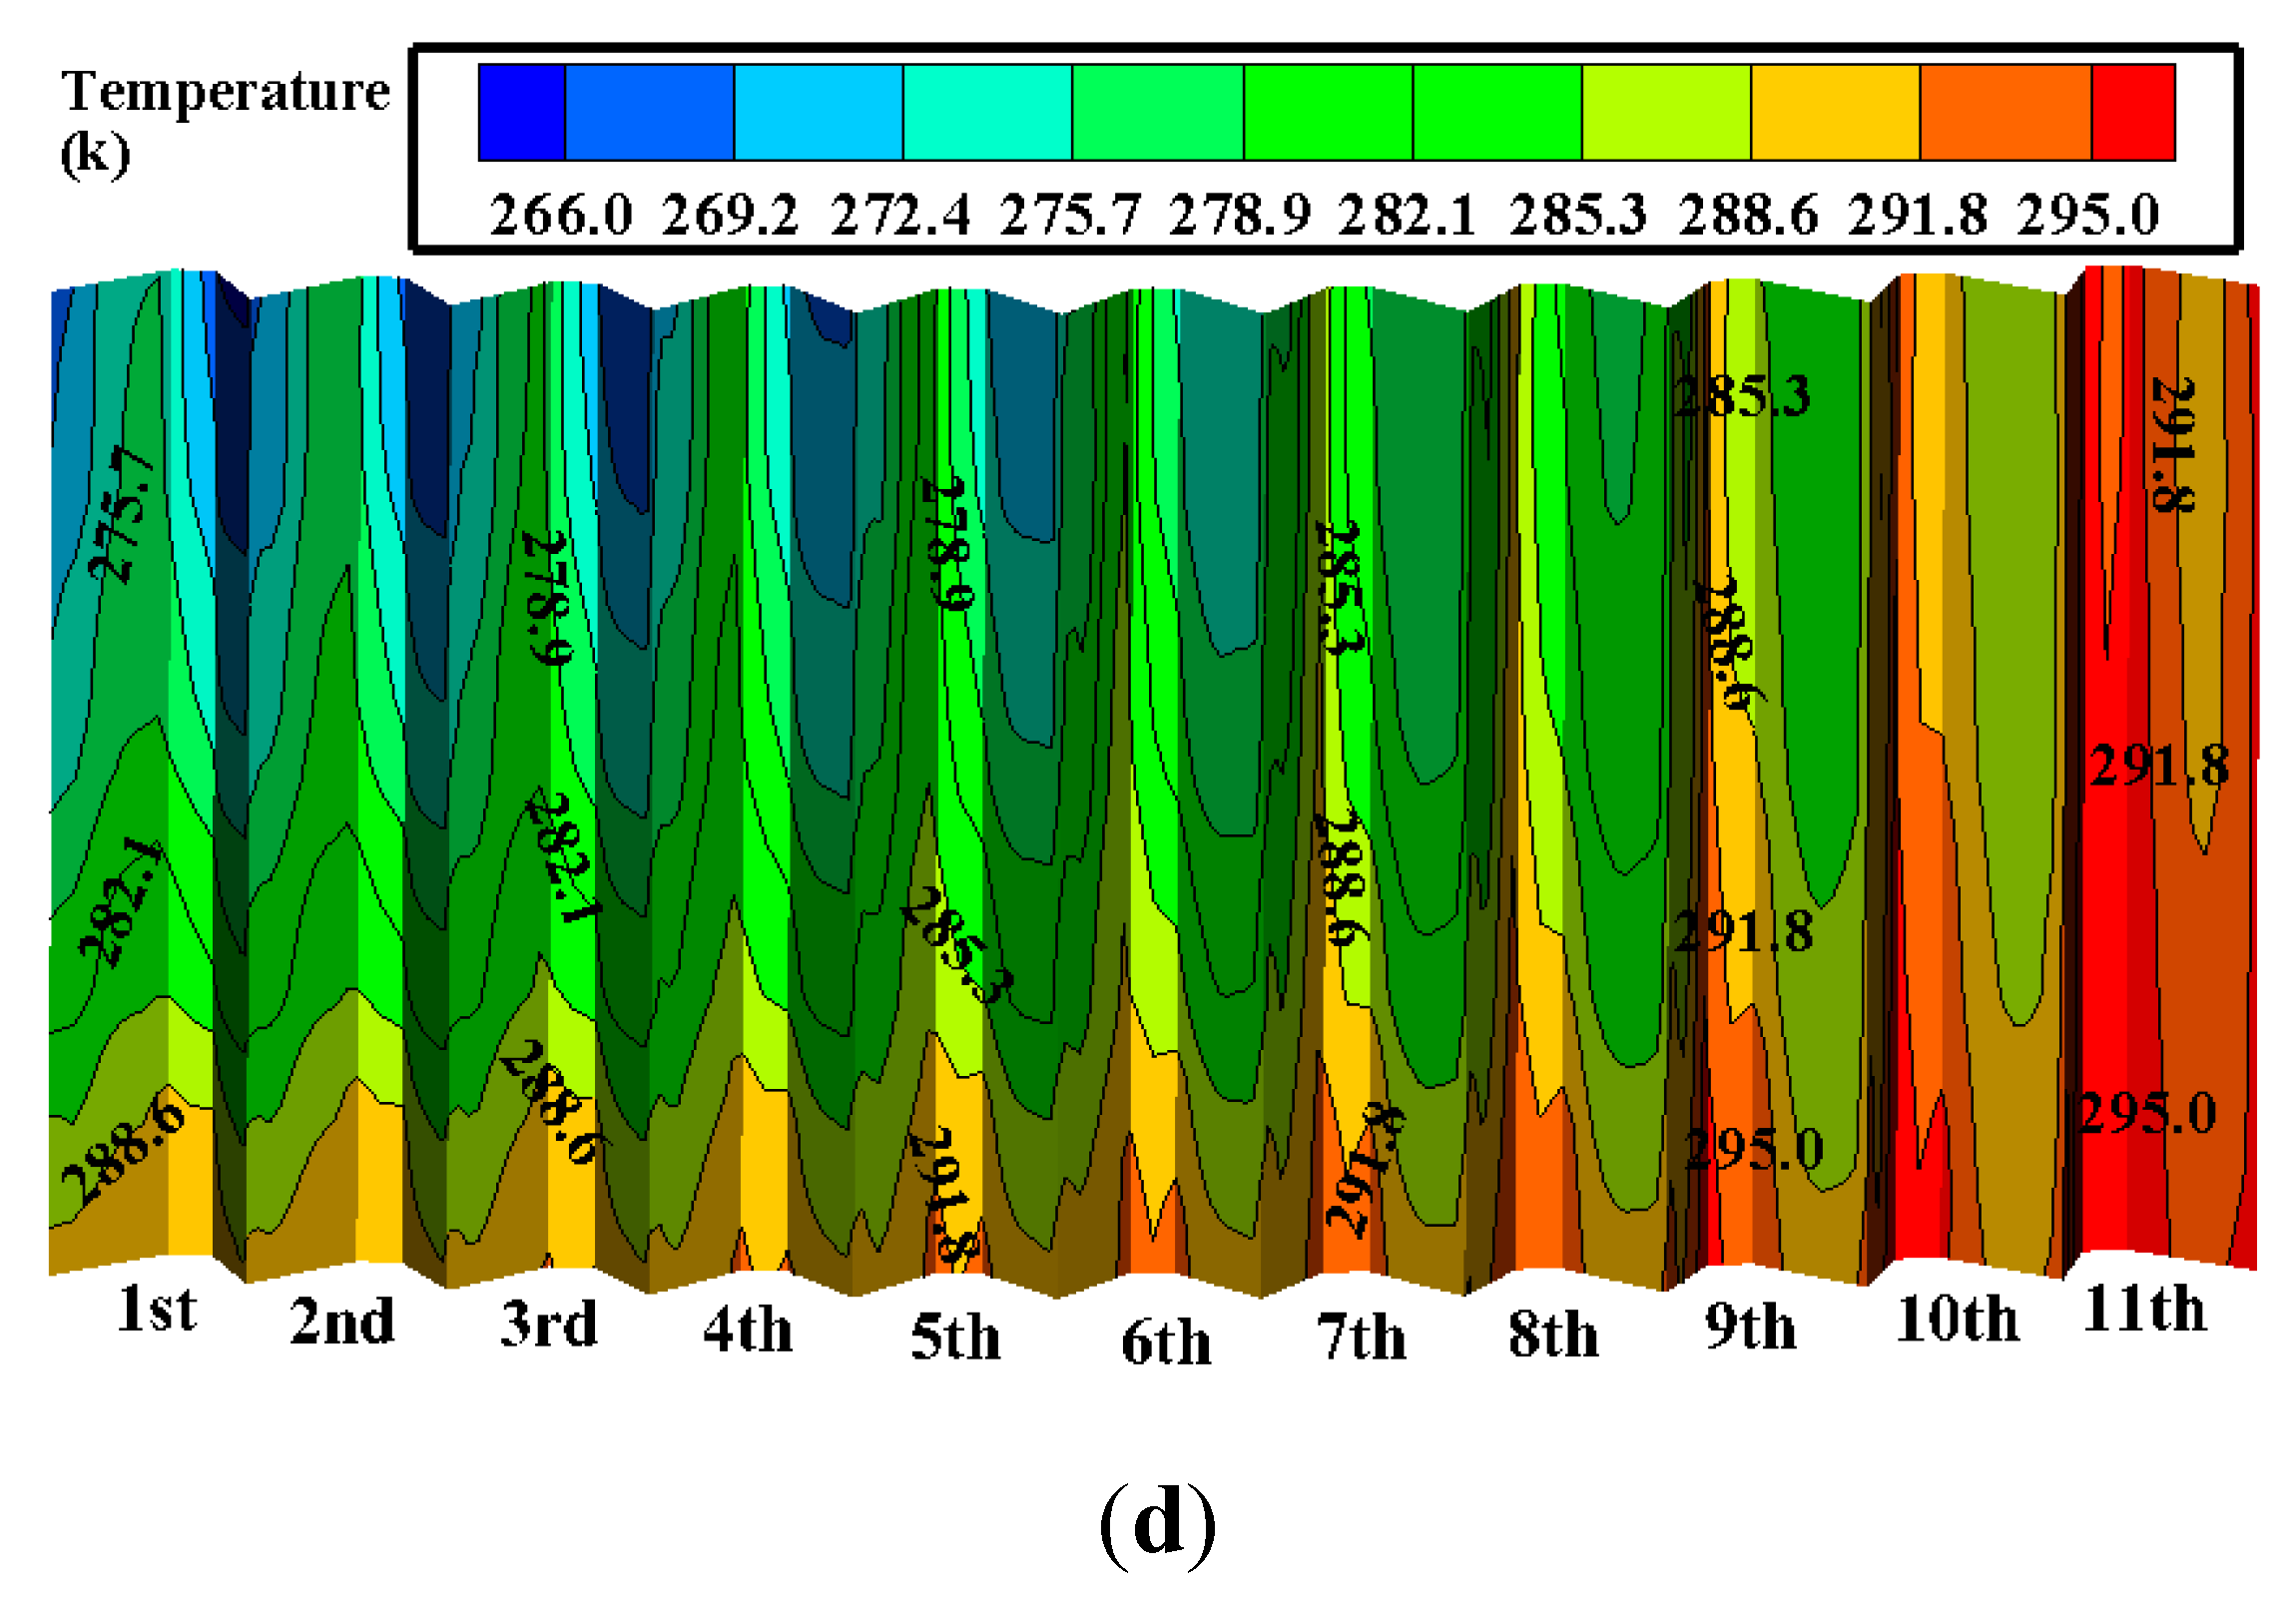
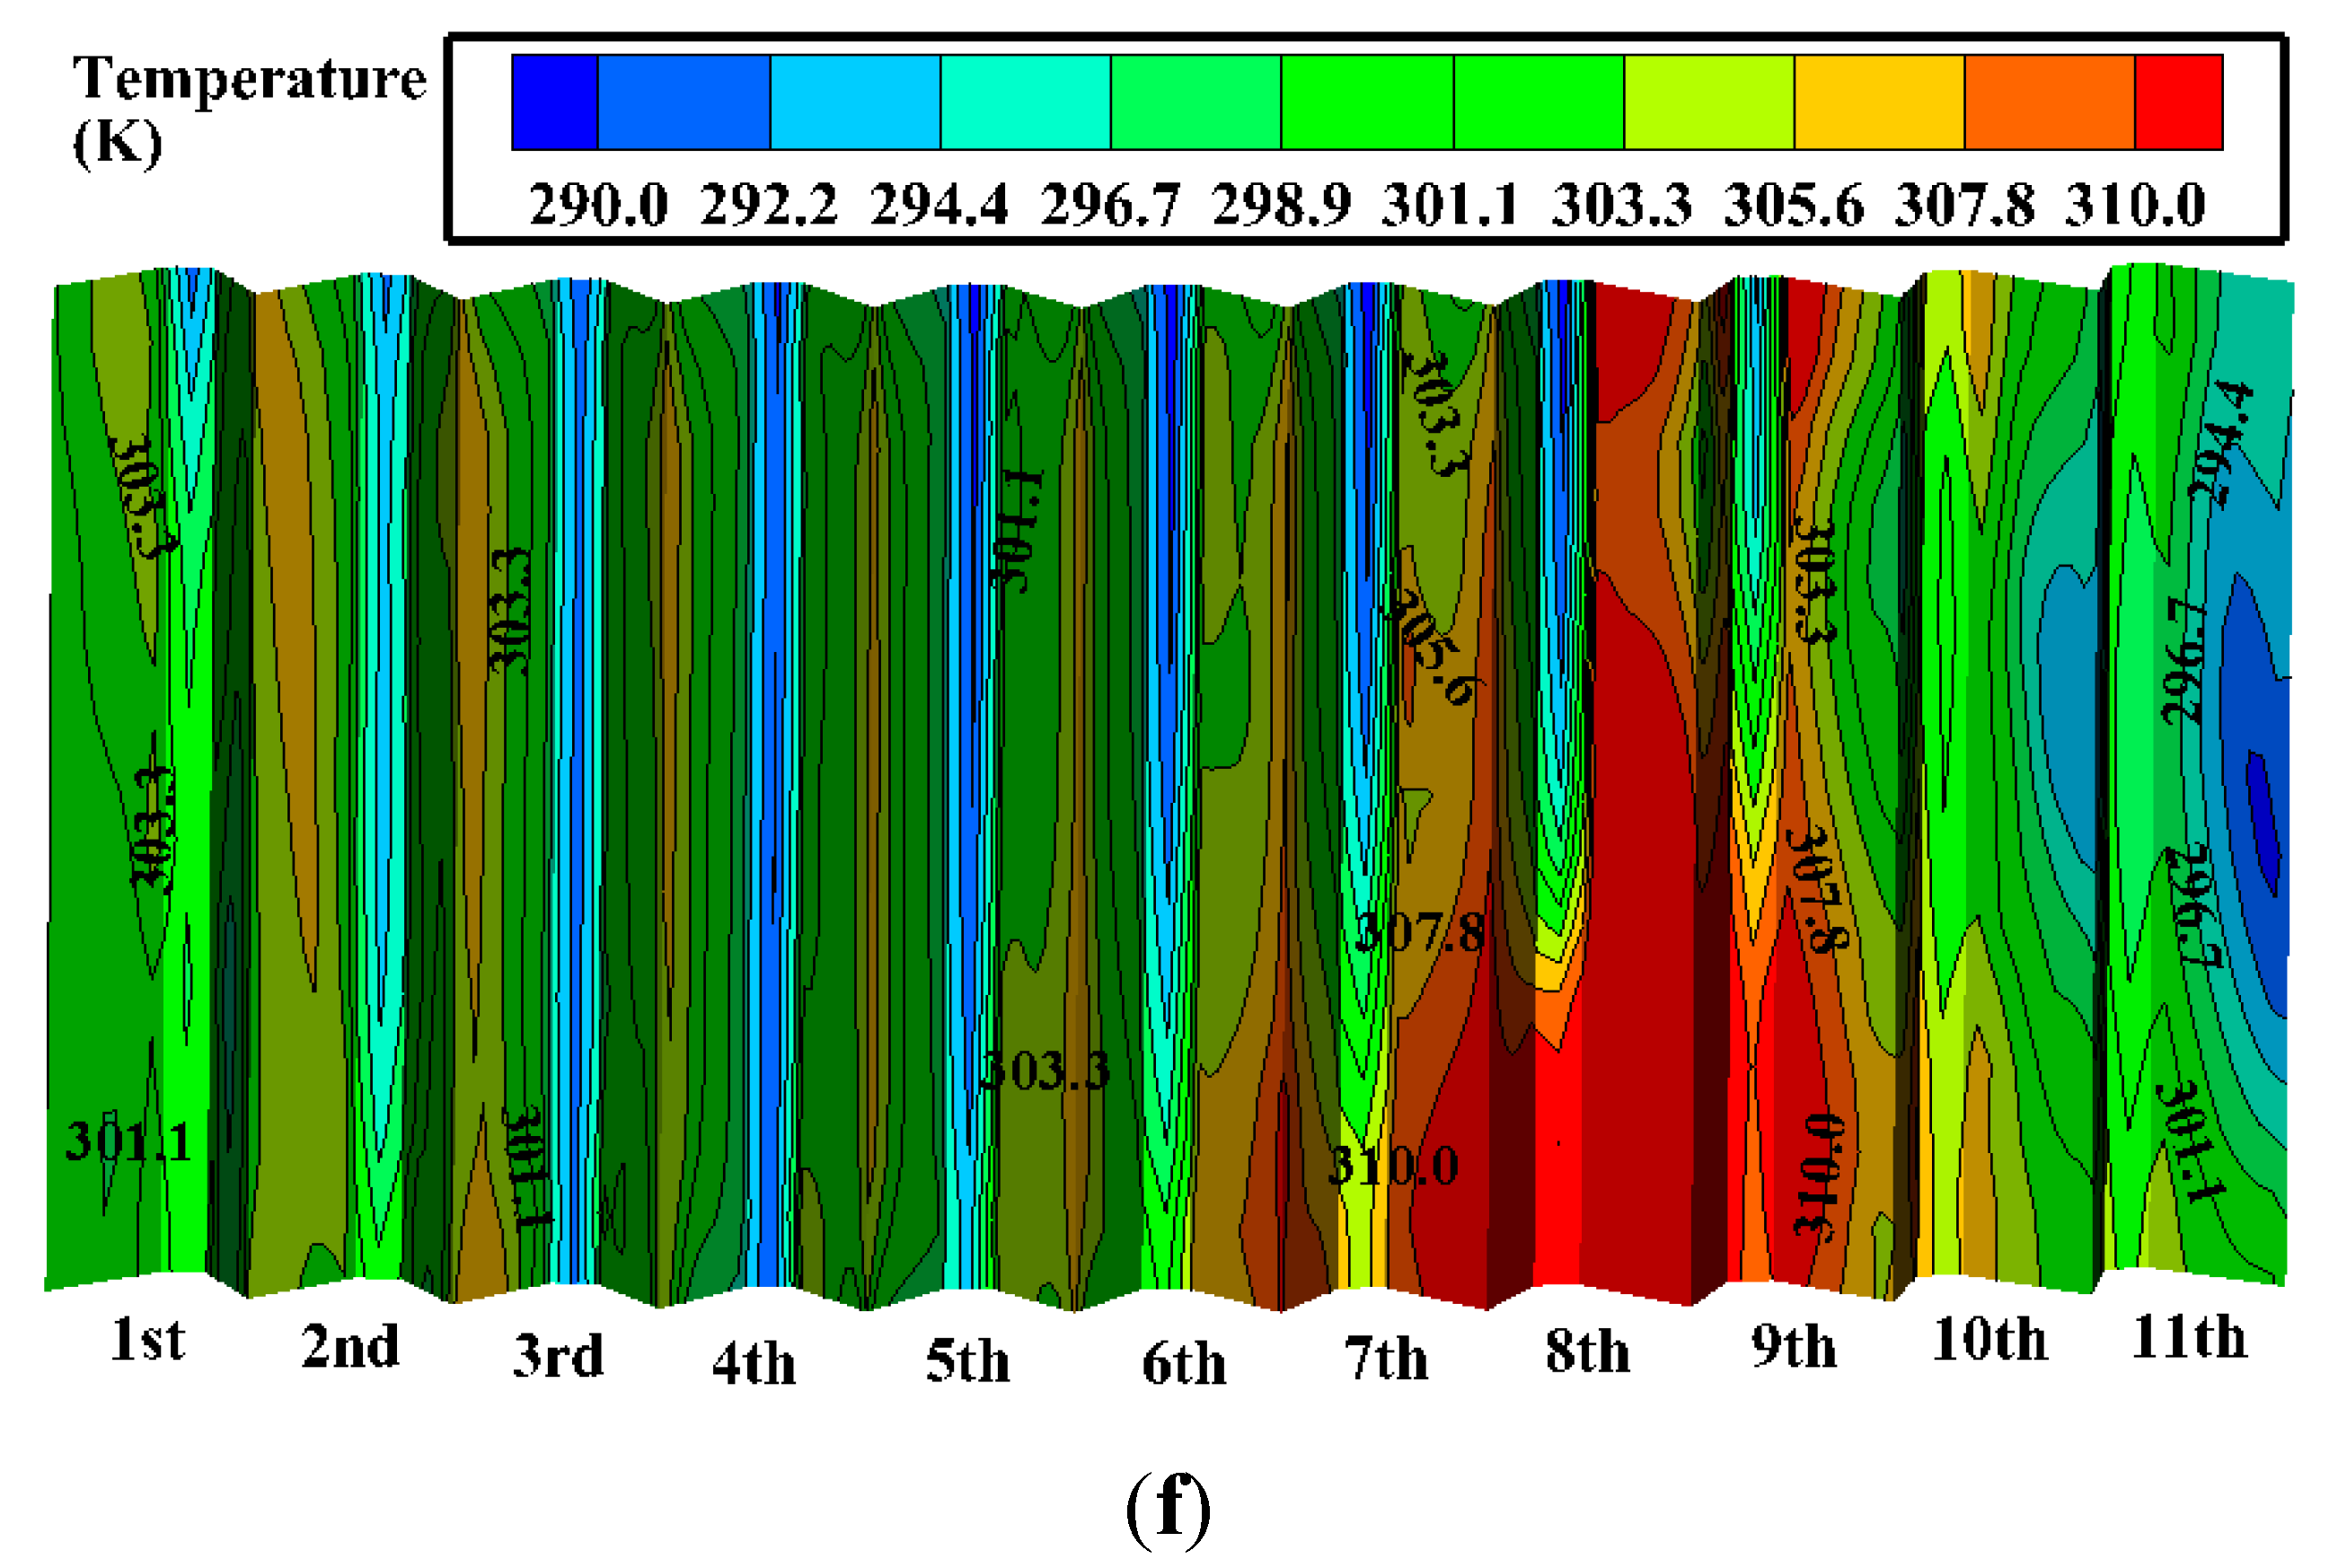
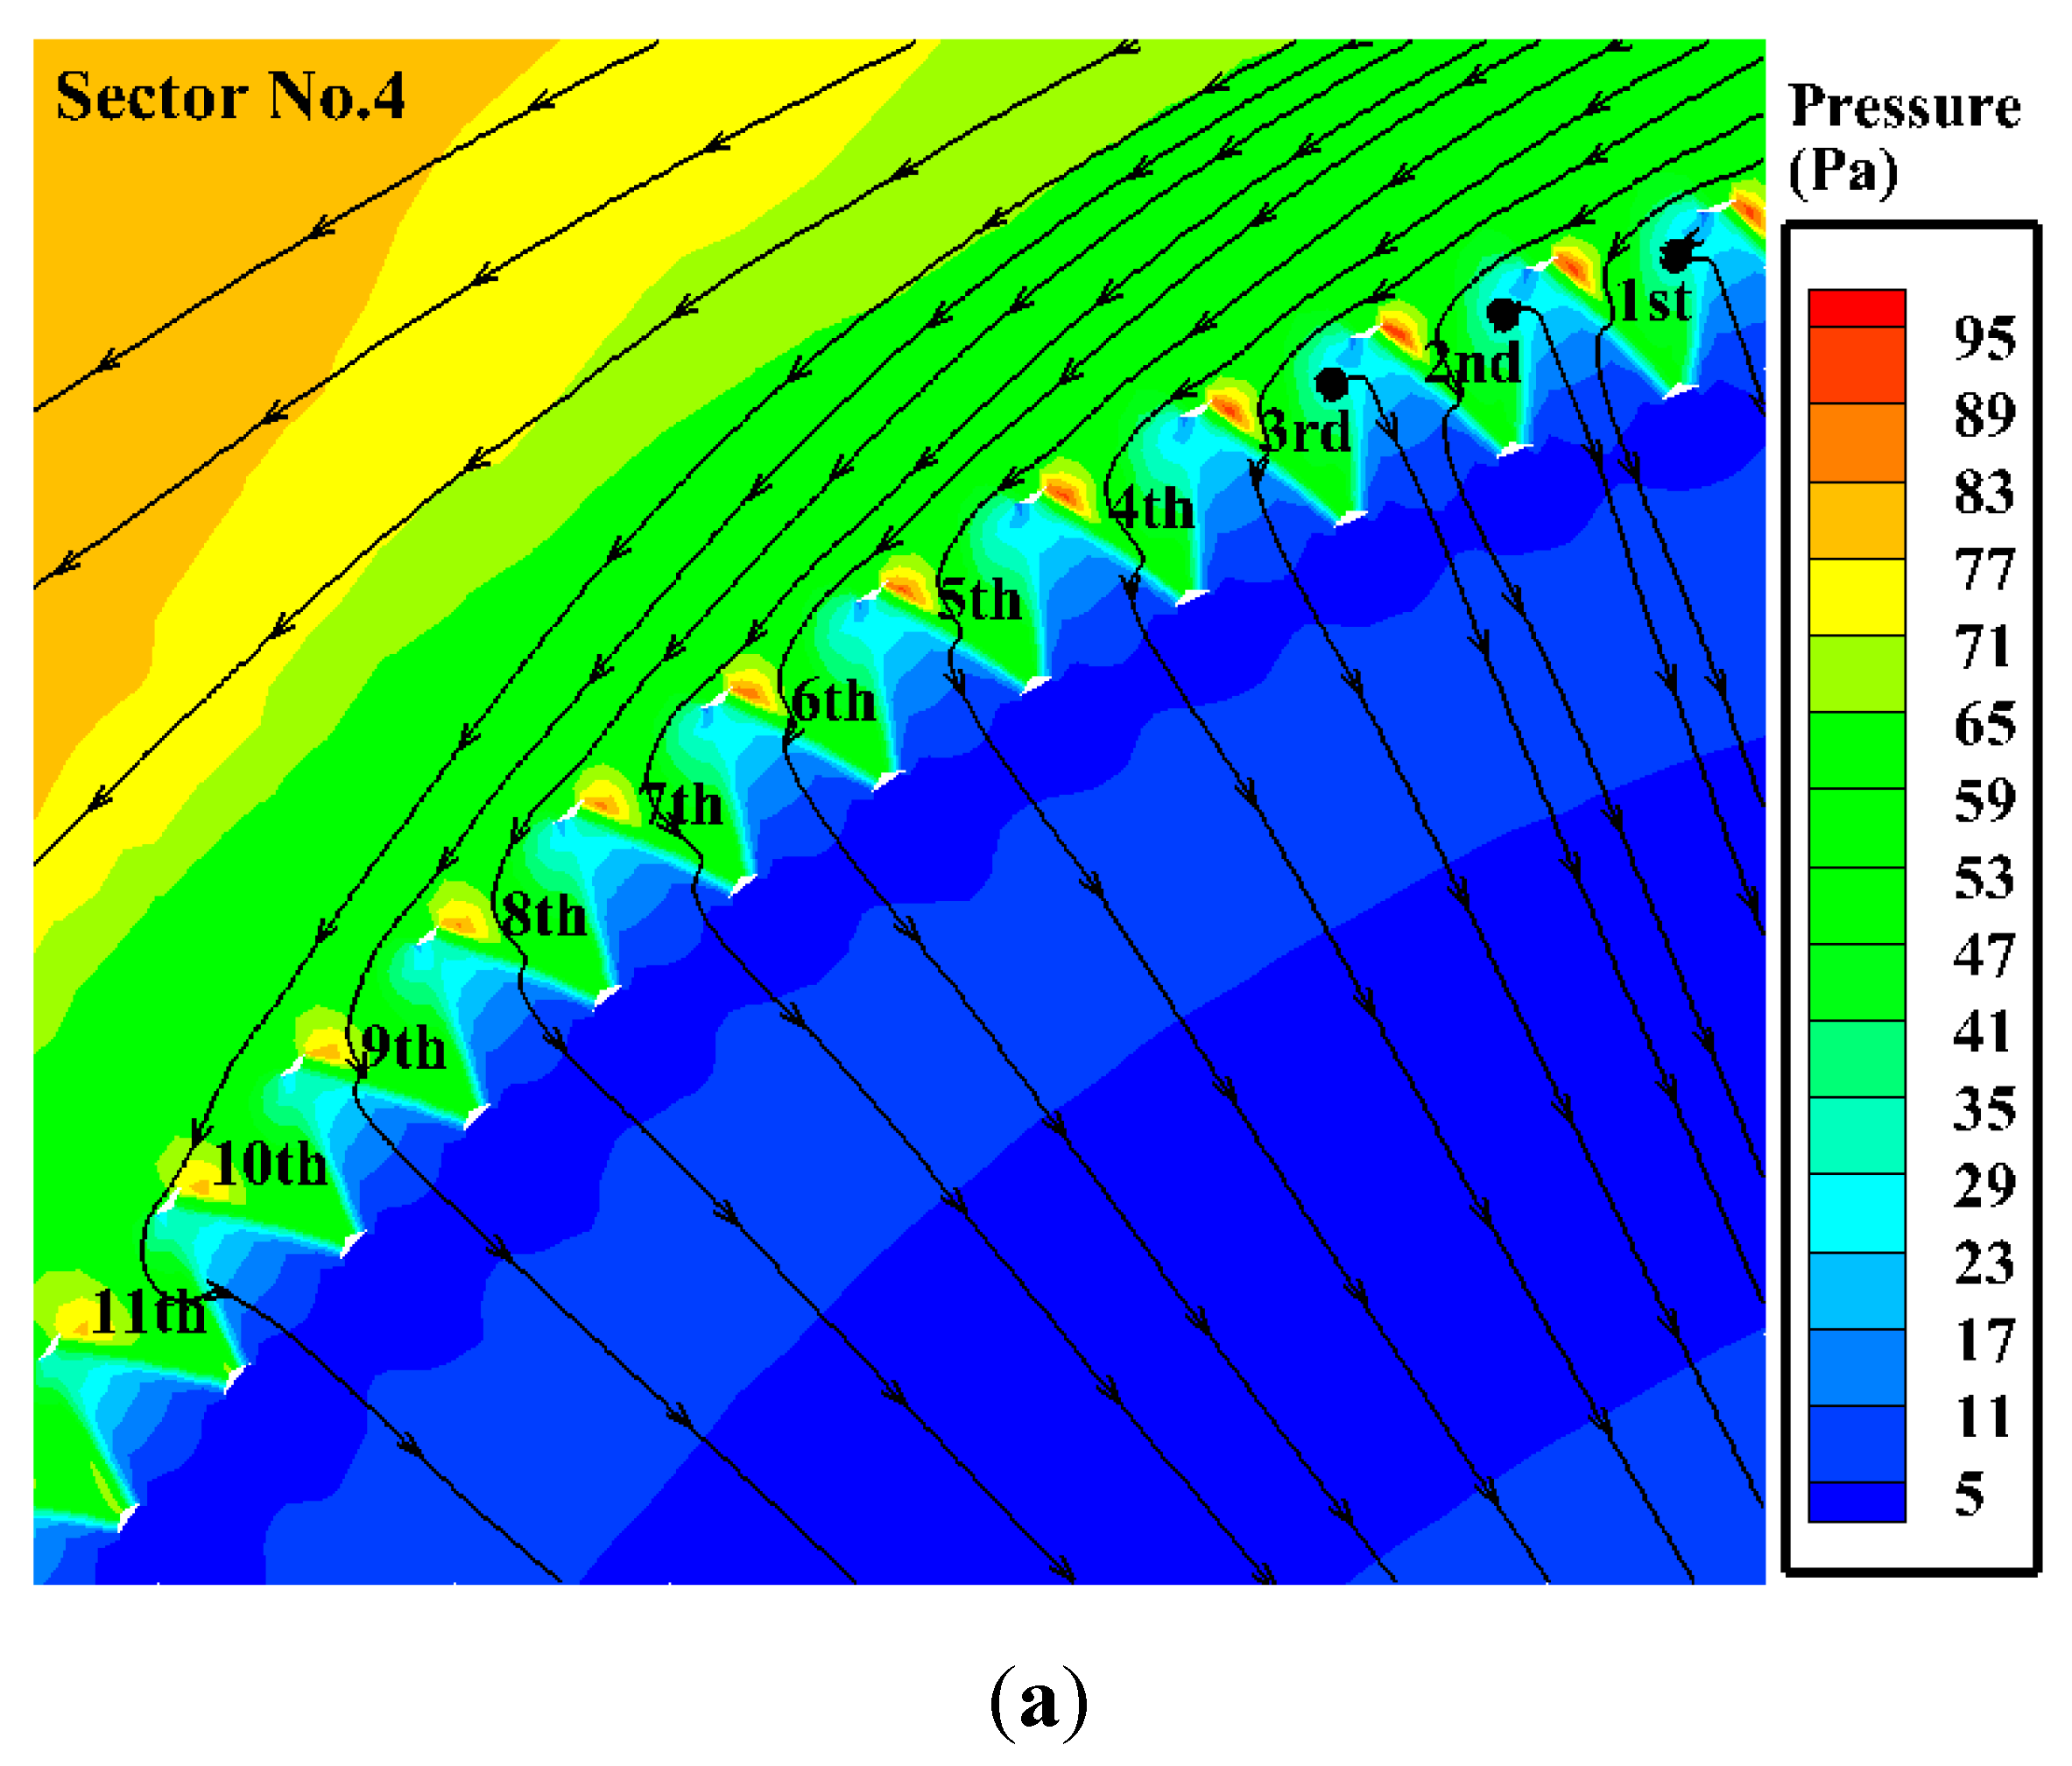
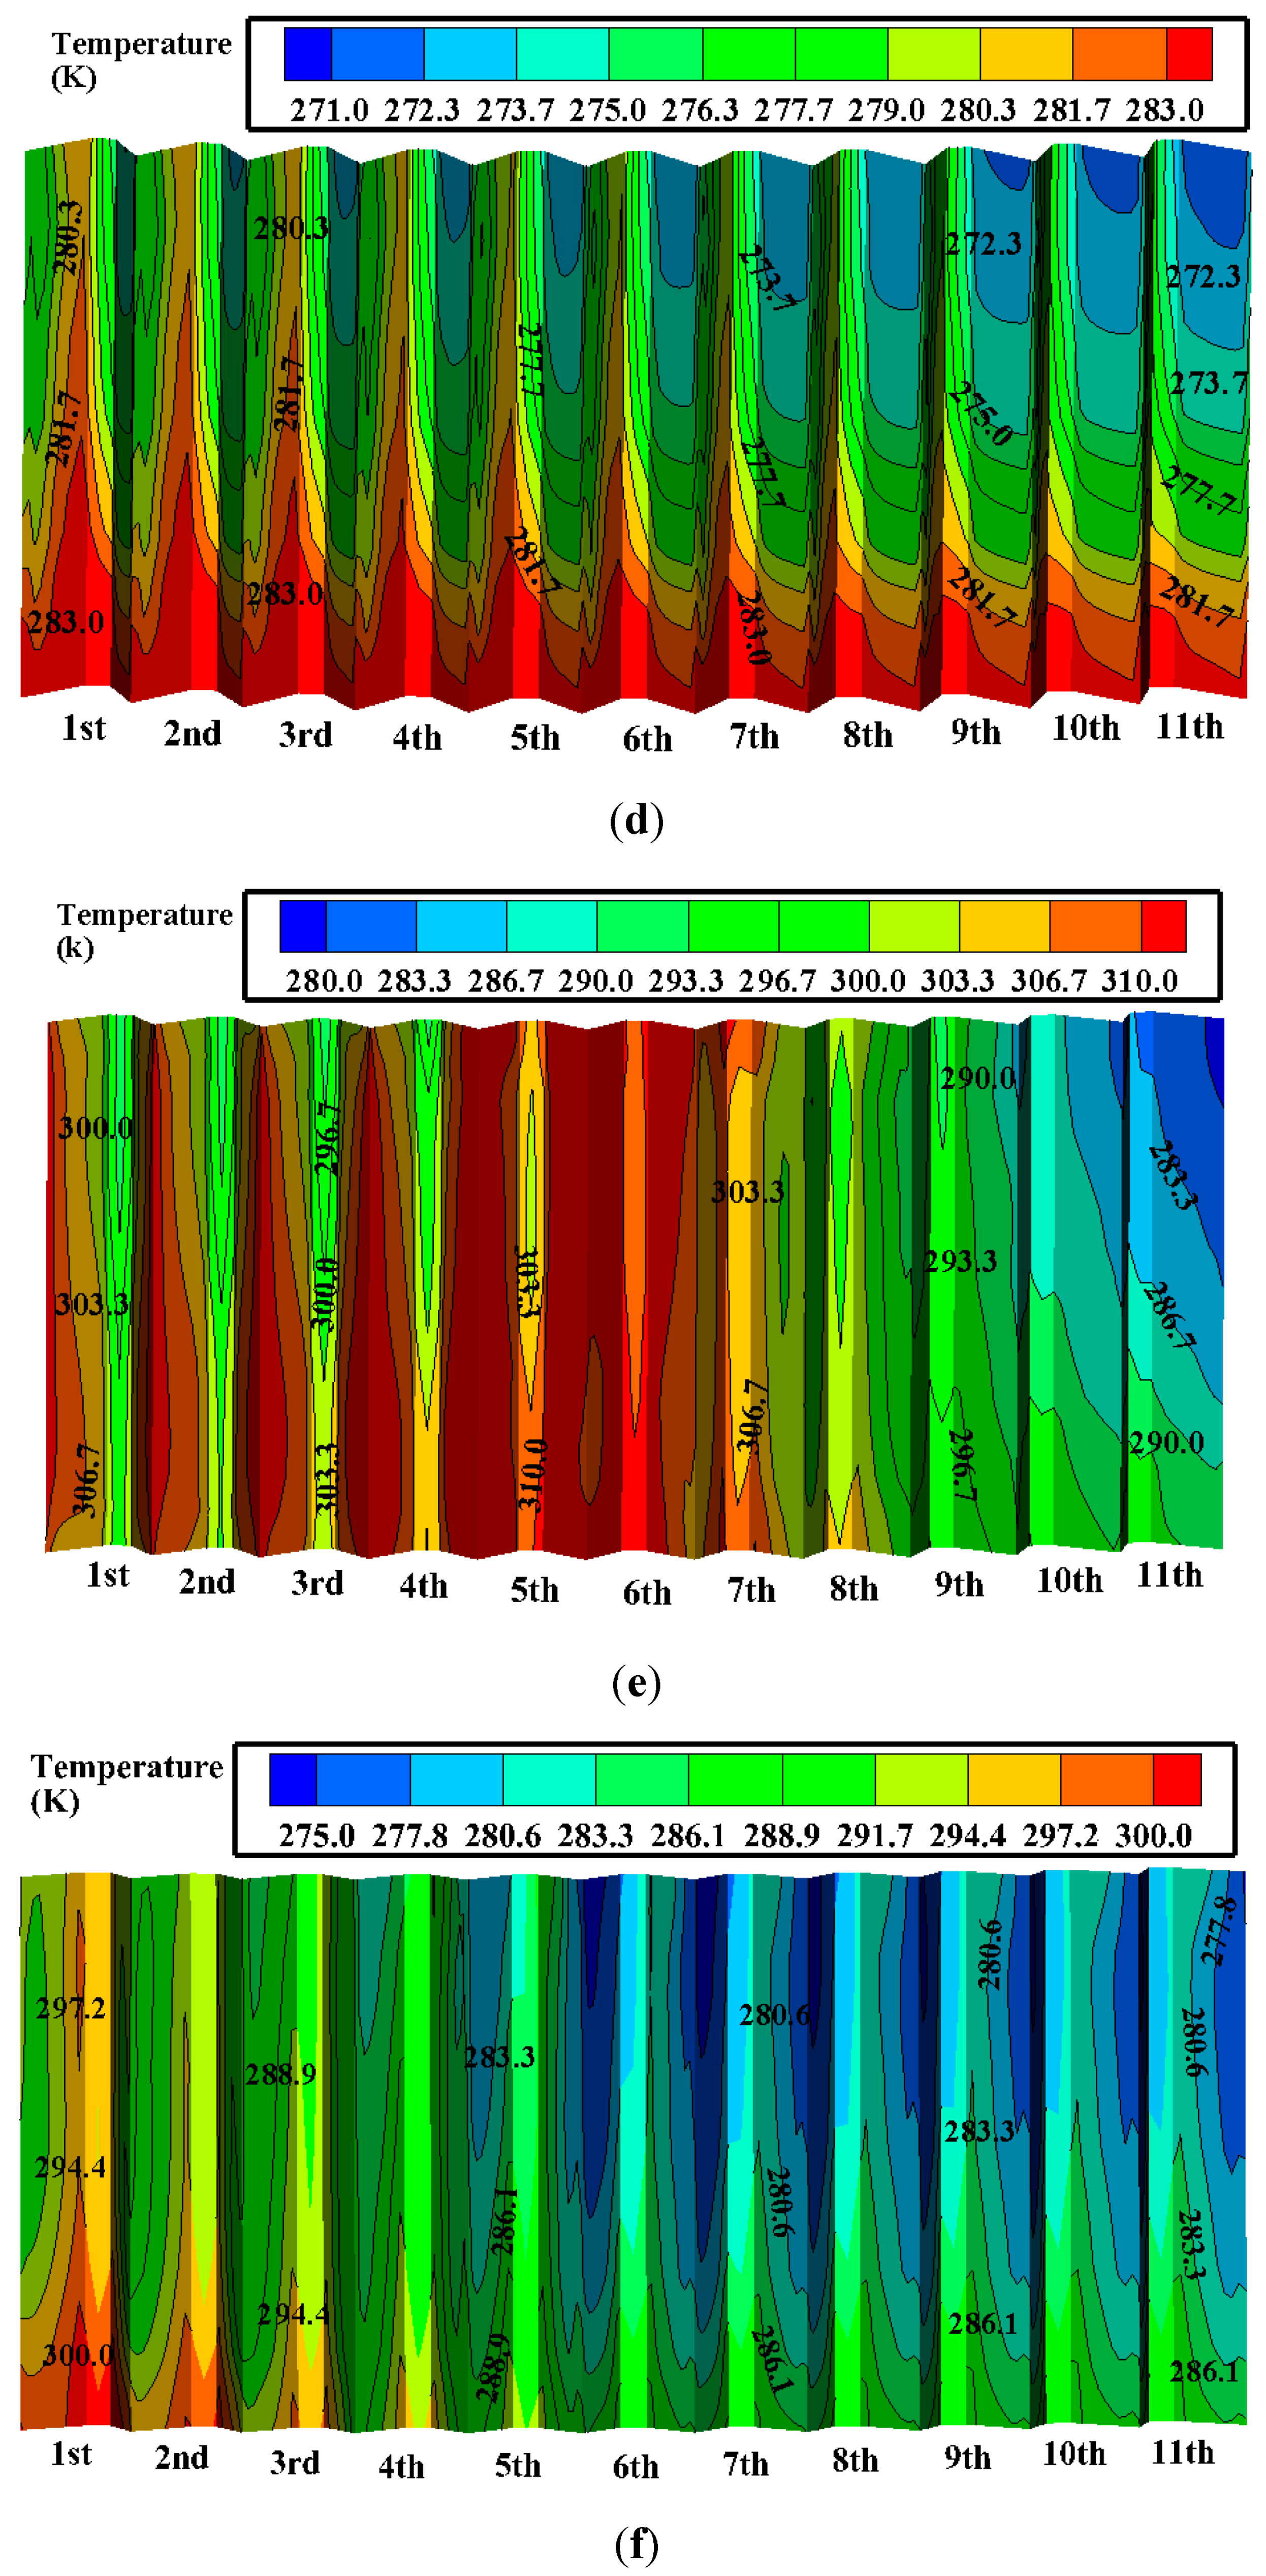
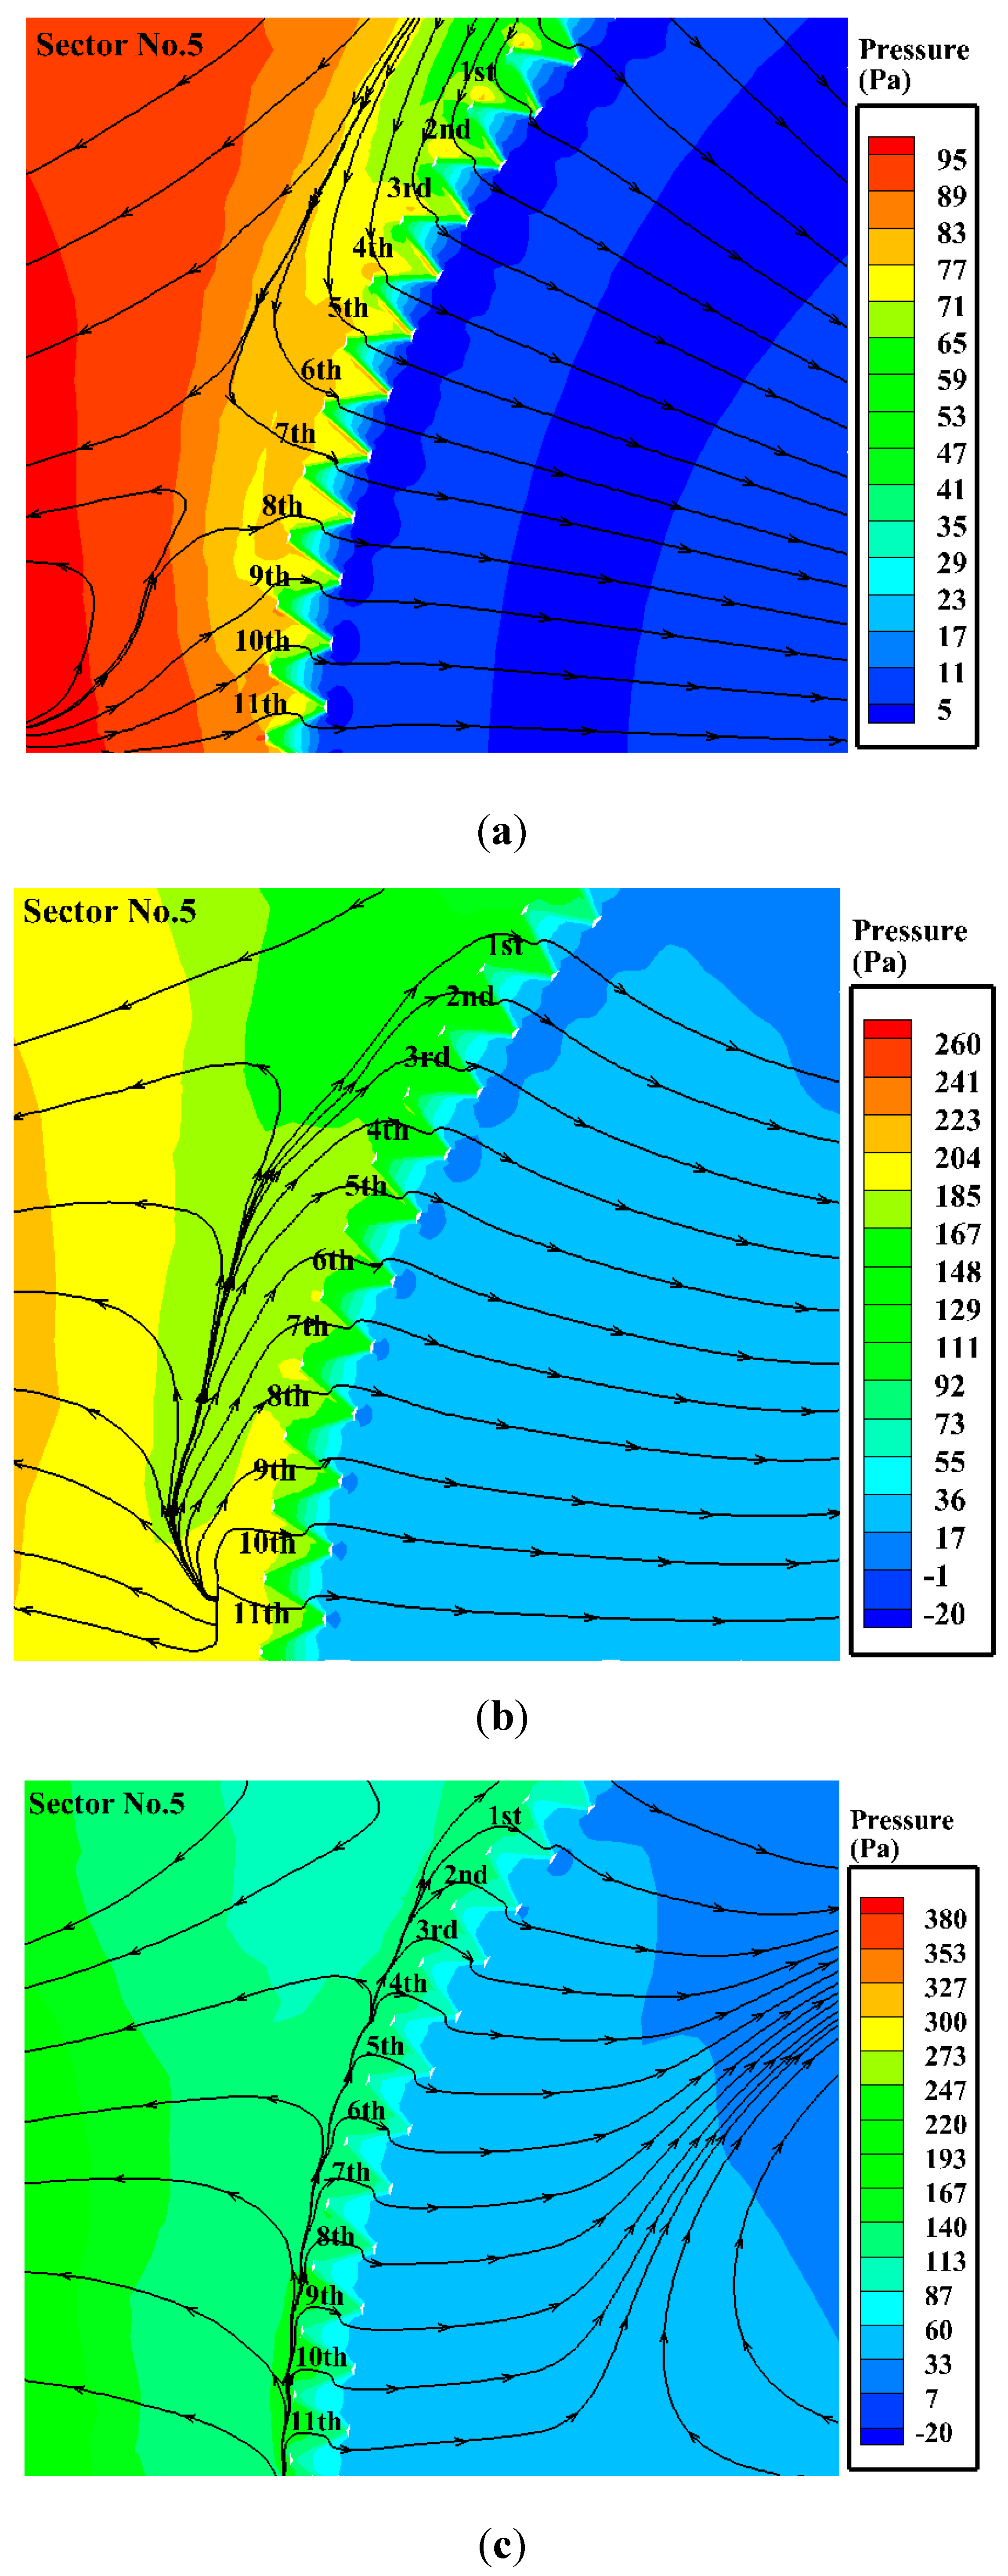
Most importantly, the local thermo-flow characteristics for the cooling deltas in various air-cooled sectors are specifically analyzed. For the frontal and middle-front cooling deltas, the thermo-flow performances become worse along the circumferential angle. The middle deltas show extremely deteriorated performances at high wind speeds, due to the hot-flow recirculation and the air-flow vortices, as well as the extremely chaotic outlet air temperature distribution. Most of the middle-rear deltas present the worst thermo-flow performances at 12 m/s, but the best performances are achieved for the sixth to 11th deltas, at 16 m/s. The rear deltas show the best flow and heat transfer performances at 12 m/s. Additionally, even most of the rear deltas have minimal air mass flow rates at 16 m/s, the heat rejection is higher than that at 4 m/s due to the expanded lower temperature regions along the upper parts of the cooling deltas.

Author Contributions

Writing-Original Draft Preparation, Y.K.; Formal Analysis, W.W.; Investigation, Z.Z.; Supervision, L.Y., X.D., C.X., Y.Y.

Funding

Financial support for this research coming from the National Natural Science Foundation of China (Grant No. 51776067), the Postdoctoral Innovative Talent Support Program of China (Grant No. BX20180098), and the Newton Advanced Fellowship of the Royal Society (Grant No. NA170093), are gratefully acknowledged.

Conflicts of Interest

The authors declare no conflict of interest.

Nomenclature

Aheat transfer surface area, m2
cpspecific heat, J/(kg·K)
Ddiameter, m
eexponent in the power-law equation of wind speed
fpressure loss coefficient
Hheight, m
kturbulent kinetic energy, m2/s2
mmass flow rate, kg/s
Nnumber
nnormal direction
Ppitch, m
ppressure, Pa
Qheat rejection, W
Ssource term in the generic equation
ttemperature, K
uvelocity, m/s
xjcoordinate in j direction, m
Greek symbols
εturbulence dissipation rate, m2/s3
εmacroheat exchanger effectiveness of macro control volume
Γdiffusion coefficient, m2/s
φscalar variable
ρdensity, kg/m3
δthickness, m
Subscripts
aair
hheight above the ground
refreference
wwindward
wawater
wdwind

References

  1. Kröger, D.G. Air-Cooled Heat Exchangers and Cooling Towers; Penn Well Corp.: Tulsa, OK, USA, 2004. [Google Scholar]
  2. Kloppers, J.C.; Kröger, D.G. A critical investigation into the heat and mass transfer analysis of crossflow wet-cooling towers. Numer. Heat Transf. A Appl. 2004, 46, 785–806. [Google Scholar] [CrossRef]
  3. Yang, L.J.; Chen, L.; Du, X.Z.; Yang, Y.P. Effects of ambient winds on the thermo-flow performances of indirect dry cooling system in a power plant. Int. J. Therm. Sci. 2013, 64, 178–187. [Google Scholar] [CrossRef]
  4. Yang, L.J.; Wu, X.P.; Du, X.Z.; Yang, Y.P. Dimensional characteristics of wind effects on the performance of indirect dry cooling system with vertically arranged heat exchanger bundles. Int. J. Heat Mass Transf. 2013, 67, 853–866. [Google Scholar] [CrossRef]
  5. Zhao, Y.B.; Long, G.Q.; Sun, F.Z.; Li, Y.; Zhang, C.J. Numerical study on the cooling performance of dry cooling tower with vertical two-pass column radiators under crosswind. Appl. Therm. Eng. 2015, 75, 1106–1117. [Google Scholar] [CrossRef]
  6. Zhao, Y.B.; Sun, F.Z.; Li, Y.; Long, G.Q.; Yang, Z. Numerical study on the cooling performance of natural draft dry cooling tower with vertical delta radiators under constant heat load. Appl. Energy 2015, 149, 225–237. [Google Scholar] [CrossRef]
  7. Ma, H.; Si, F.Q.; Kong, Y.; Zhu, K.P.; Yan, W.S. A new theoretical method for predicating the part-load performance of natural draft dry cooling towers. Appl. Therm. Eng. 2015, 91, 1106–1115. [Google Scholar] [CrossRef] [Green Version]
  8. Liao, H.T.; Yang, L.J.; Du, X.Z.; Yang, Y.P. Influences of height to diameter ratios of dry-cooling tower upon thermo-flow characteristics of indirect dry cooling system. Int. J. Therm. Sci. 2015, 94, 178–192. [Google Scholar] [CrossRef]
  9. Liao, H.T.; Yang, L.J.; Wu, X.P.; Du, X.Z.; Yang, Y.P. Impacts of tower spacing on thermo-flow characteristics of natural draft dry cooling system. Int. J. Therm. Sci. 2016, 102, 168–184. [Google Scholar] [CrossRef]
  10. He, S.; Gurgenci, H.; Guan, Z.Q.; Alkhedhair, A.M. Pre-cooling with munters media to improve the performance of natural draft dry cooling towers. Appl. Therm. Eng. 2013, 53, 67–77. [Google Scholar] [CrossRef]
  11. Preez, A.F.D.; Kröger, D.G. The effect of the heat exchanger arrangement and wind-break walls on the performance of natural draft dry-cooling towers subjected to cross-winds. J. Wind Eng. Ind. Aerodyn. 2015, 58, 293–303. [Google Scholar] [CrossRef]
  12. Chen, L.; Yang, L.J.; Du, X.Z.; Yang, Y.P. Performance improvement of natural draft dry cooling system by interior and exterior windbreaker configurations. Int. J. Heat Mass Transf. 2016, 96, 42–63. [Google Scholar] [CrossRef]
  13. Zavaragh, H.G.; Ceviz, M.A.; Tabar, M.T.S. Analysis of windbreaker combinations on steam power plant natural draft dry cooling towers. Appl. Therm. Eng. 2016, 99, 550–559. [Google Scholar] [CrossRef]
  14. Gu, H.F.; Wang, H.J.; Gu, Y.Q.; Yao, J.N. A numerical study on the mechanism and optimization of wind-break structures for indirect air-cooling towers. Energy Convers. Manag. 2015, 108, 43–49. [Google Scholar] [CrossRef]
  15. Wang, W.L.; Zhang, H.; Liu, P.; Li, Z.; Lv, J.F.; Ni, W.D. The cooling performance of a natural draft dry cooling tower under crosswind and an enclosure approach to cooling efficiency enhancement. Appl. Energy 2016, 186, 336–346. [Google Scholar] [CrossRef]
  16. Yuan, L.J.; Zhu, J.L.; Li, T.L.; Fan, H.L.; Lu, X.L. Numerical simulation of flow and heat transfer characteristics in solar enhanced natural draft dry cooling tower. Appl. Therm. Eng. 2015, 87, 98–105. [Google Scholar] [CrossRef]
  17. Zou, Z.; Gong, H.X. Numerical analysis of solar enhanced natural draft dry cooling tower configuration. Appl. Therm. Eng. 2016, 94, 697–705. [Google Scholar] [CrossRef]
  18. Zhu, D.S.; Zheng, W.Y.; Zhou, G.Y.; Wu, J.F.; Shi, Y.Y. Computational analysis of closed wet cooling towers. Numer. Heat Transf. A Appl. 2013, 63, 396–409. [Google Scholar] [CrossRef]
  19. Kong, Y.Q.; Yang, L.J.; Du, X.Z.; Yang, Y.P. Effects of continuous and alternant rectangular slots on thermo-flow performances of plain finned tube bundles in in-line and staggered configurations. Int. J. Heat Mass Transf. 2016, 93, 97–107. [Google Scholar] [CrossRef]
  20. Navarro, H.A.; Cabezas-Gómez, L. A new approach for thermal performance calculation of cross-flow heat exchangers. Int. J. Heat Mass Transf. 2015, 48, 3880–3888. [Google Scholar] [CrossRef]
  21. Li, X.X.; Xia, L.; Gurgenci, H.; Guan, Z.Q. Performance enhancement for the natural draft dry cooling tower under crosswind condition by optimizing the water distribution. Int. J. Heat Mass Transf. 2017, 107, 271–280. [Google Scholar] [CrossRef]
  22. Wang, W.J.; Kong, Y.Q.; Huang, X.W.; Yang, L.J.; Du, X.Z.; Yang, Y.P. Anti-freezing of air-cooled heat exchanger by switching off sectors. Appl. Therm. Eng. 2017, 120, 327–339. [Google Scholar] [CrossRef]
  23. Ma, H.; Si, F.Q.; Zhu, K.P.; Wang, J.H. Utilization of partial through-flow tower shell to cope with the excess cooling capacity of dry cooling tower in extremely cold days with crosswind. Int. J. Therm. Sci. 2019, 136, 70–85. [Google Scholar] [CrossRef]
  24. Zhao, Y.B.; Long, G.Q.; Sun, F.Z.; Li, Y.; Zhang, C.J.; Liu, J.B. Effect mechanism of air deflectors on the cooling performance of dry cooling tower with vertical delta radiators under crosswind. Energy Convers. Manag. 2015, 93, 321–331. [Google Scholar] [CrossRef]
  25. Moffat, R.J. Describing the uncertainties in experimental results. Exp. Therm. Fluid Sci. 1988, 1, 3–17. [Google Scholar] [CrossRef] [Green Version]
Figure 1. Geometric schematics of natural draft dry cooling system. (a) Dry cooling tower and vertically arranged heat exchanger, (b) cooling deltas and slotted finned tubes.
Energies 12 01128 g001
Figure 2. Air-cooled sectors specification for the circulating water distribution along wind direction.
Energies 12 01128 g002
Figure 3. Schematic of control volume unit of heat exchanger. (a) Macro and cell control volume, (b) detailed micro and cell unit.
Energies 12 01128 g003
Figure 4. Computational domain and detailed local meshes. (a) Computational domain and boundary condition, (b) local meshes.
Energies 12 01128 g004
Figure 5. Experimental system for flow and heat transfer performances of finned tube bundles. (a) schematic diagram, (b) fin and finned tube bundle (c) experimental setup, (d) experimental data of friction factor and heat exchanger effectiveness.
Energies 12 01128 g005aEnergies 12 01128 g005b
Figure 6. Experimental setup and results comparisons. (a) Measuring points, (b) comparisons of ascending velocities for two types of height-measuring points, without wind, and at a wind speed of 4 m/s.
Energies 12 01128 g006
Figure 7. Thermo-flow performances of various sectors at different wind speeds. (a) Overall outlet air temperatures at 4 m/s, (b) overall outlet temperatures at 12 m/s, (c) air mass flow rate, (d) heat rejection.
Energies 12 01128 g007aEnergies 12 01128 g007b
Figure 8. Variable fields of the frontal deltas. (a) Pressure and flow fields at 4 m/s, (b) pressure and flow fields at 12 m/s, (c) outlet air temperature at 4 m/s, (d) outlet air temperature at 12 m/s.
Energies 12 01128 g008aEnergies 12 01128 g008b
Figure 9. Thermo-flow performances of the frontal deltas. (a) Air mass flow rate, (b) heat rejection.
Energies 12 01128 g009
Figure 10. Variable fields of the middle-front deltas. (a) Pressure and flow fields at 4 m/s, (b) pressure and flow fields at 12 m/s, (c) outlet air temperature at 4 m/s, (d) outlet air temperature at 12 m/s.
Energies 12 01128 g010aEnergies 12 01128 g010b
Figure 11. Thermo-flow performances of the middle-front deltas. (a) Air mass flow rate, (b) heat rejection.
Energies 12 01128 g011
Figure 12. Variable fields of the middle deltas. (a) Pressure and flow fields at 4 m/s, (b) pressure and flow fields at 12 m/s, (c) pressure and flow fields at 16 m/s, (d) outlet air temperature at 4 m/s, (e) outlet air temperature at 12 m/s, (f) outlet air temperature at 16 m/s.
Energies 12 01128 g012aEnergies 12 01128 g012bEnergies 12 01128 g012c
Figure 13. Thermo-flow performances of the middle deltas. (a) Air mass flow rate, (b) heat rejection.
Energies 12 01128 g013aEnergies 12 01128 g013b
Figure 14. Variable fields of the middle-rear deltas. (a) Pressure and flow fields at 4 m/s, (b) pressure and flow fields at 12 m/s, (c) pressure and flow fields at 16 m/s, (d) outlet air temperature at 4 m/s, (e) outlet air temperature at 12 m/s, (f) outlet air temperature at 16 m/s.
Energies 12 01128 g014aEnergies 12 01128 g014bEnergies 12 01128 g014c
Figure 15. Thermo-flow performances of the middle-rear deltas. (a) Air mass flow rate, (b) heat rejection.
Energies 12 01128 g015
Figure 16. Variable fields of the leeward deltas. (a) Pressure and flow fields at 4 m/s, (b) pressure and flow fields at 12 m/s, (c) pressure and flow fields at 16 m/s, (d) outlet air temperature at 4 m/s, (e) outlet air temperature at 12 m/s, (f) outlet air temperature at 16 m/s.
Energies 12 01128 g016aEnergies 12 01128 g016b
Figure 17. Thermo-flow performances of the leeward deltas. (a) Air mass flow rate, (b) heat rejection.
Energies 12 01128 g017
Table 1. Geometric parameters of dry cooling system and heat exchanger bundles.
Dry Cooling System
Tower heightHt125 m
Base diameter of towerDb95.24 m
Outlet diameter of towerDo60 m
Throat height of towerHtt90 m
Throat diameter of towerDtt56 m
Height of heat exchangerHhe14 m
Outlet diameter of the heat exchangerDohe100.4 m
Number of sectors Ns10
Number of cooling deltasNd110
Heat Exchanger Bundles
Tube outside diameterDt25 mm
Tube row number 4
Transverse tube pitchPt25 mm
Longitudinal tube pitchPl30 mm
Fin thicknessδf0.3 mm
Fin pitchPf3.2 mm
Upper slotted strip heightH11.1 mm
Lower slotted strip heightH20.5 mm
Slotted strip lengthL17 mm
Slotted strip widthL22.75 mm
Table 2. Boundary conditions.
SectionBoundary typeSetting
Windward surfacevelocity inlet (with wind)
pressure inlet (without wind)
u = uz, T = 258.15 K (with wind)
P = 101.325 KPa, T = 258.15 K (without wind)
Leeward surfaceoutflow (with wind)
pressure inlet (without wind)
u / x = 0 , T / x = 0 (with wind)
P = 101.325 KPa, T = 258.15 K (without wind)
Side surfacesymmetry (with wind)
pressure inlet (without wind)
u / y = 0 , T / y = 0 (with wind)
P = 101.325 KPa, T = 258.15 K (without wind)
Top surfacesymmetry (with wind)
pressure outlet(without wind)
u / z = 0 , T / z = 0 (with wind)
P = 101.325 KPa, T = 258.15 K (without wind)
Tower bodywall u / n = 0 , T / n = 0
Bafflewall u / n = 0 , T / n = 0
Delta supportwall u / n = 0 , T / n = 0
Ground wall u / n = 0 , T / n = 0

