1. Introduction and Policy Background
Global residential energy demand has steadily increased over the past decades. [
1,
2]. A generalized higher level of basic comfort in the last years has translated to increased consumption in the sector. Larger homes, new services, and new and larger appliances and equipment, including the direct rebound effect, have boosted the demand for energy [
3]. At the same time, European countries experienced an increase in the energy efficiency of residential appliances, ICT (Information, Communication and Technology), lighting, and heating and cooling equipment mainly due to the implementation of energy efficiency policies [
4]. Technical progress on efficiency, changes in consumer behaviour, socio-economic characteristics, and policy interventions play an interconnected and key role in reducing residential energy consumption growth and in achieving energy savings.
Looking at the policy dimension, we observe a growing number of policy commitments and strategies, calling for action at local, regional, national, and global levels. Several policies and measures have been adopted in the European Union(EU) since the 1990s to reduce energy consumption in the residential sector, both at the EU level (eco-design [
5], energy labelling [
6], energy performances of buildings [
7,
8,
9], and energy efficiency [
10] directives) and at the national level (subsidies, information campaigns, energy supplier obligations, etc.) [
11]. At the core of the EU agenda, the energy and climate ‘20-20-20’ targets, based on the Europe 2020 Strategy for smart, sustainable, and inclusive growth, were adopted in 2007. The three pillars of the ‘20-20-20’ targets are the following: To reduce greenhouse gas emissions by 20% compared to 1990 levels; renewable resources to cover 20% of the EU’s final energy consumption (FEC); and to reach a 20% reduction in primary and final energy consumption compared to a business as usual baseline [
12] through improvements in energy efficiency. Therefore, energy efficiency has become one of the main policy goals in the European Union. Furthermore, the EU member states (MSs) have been very active in the area of energy efficiency, by implementing many policies and measures at the national level.
The Energy End-use Efficiency and Energy Services Directive (ESD) [
13] was the first directive which mandated MSs to adopt an energy saving target—namely a 9% reduction of the average final energy consumption of the years of 2001–2005—to be achieved in the nine-year period from 2008 to 2016. The directive requested MSs to adopt a National Energy Efficiency Action Plan (NEEAP), outlining the actions to achieve the 9% energy saving target. At the time of the ESD adoption, only a few member states had previously prepared and adopted national energy efficiency plans [
11,
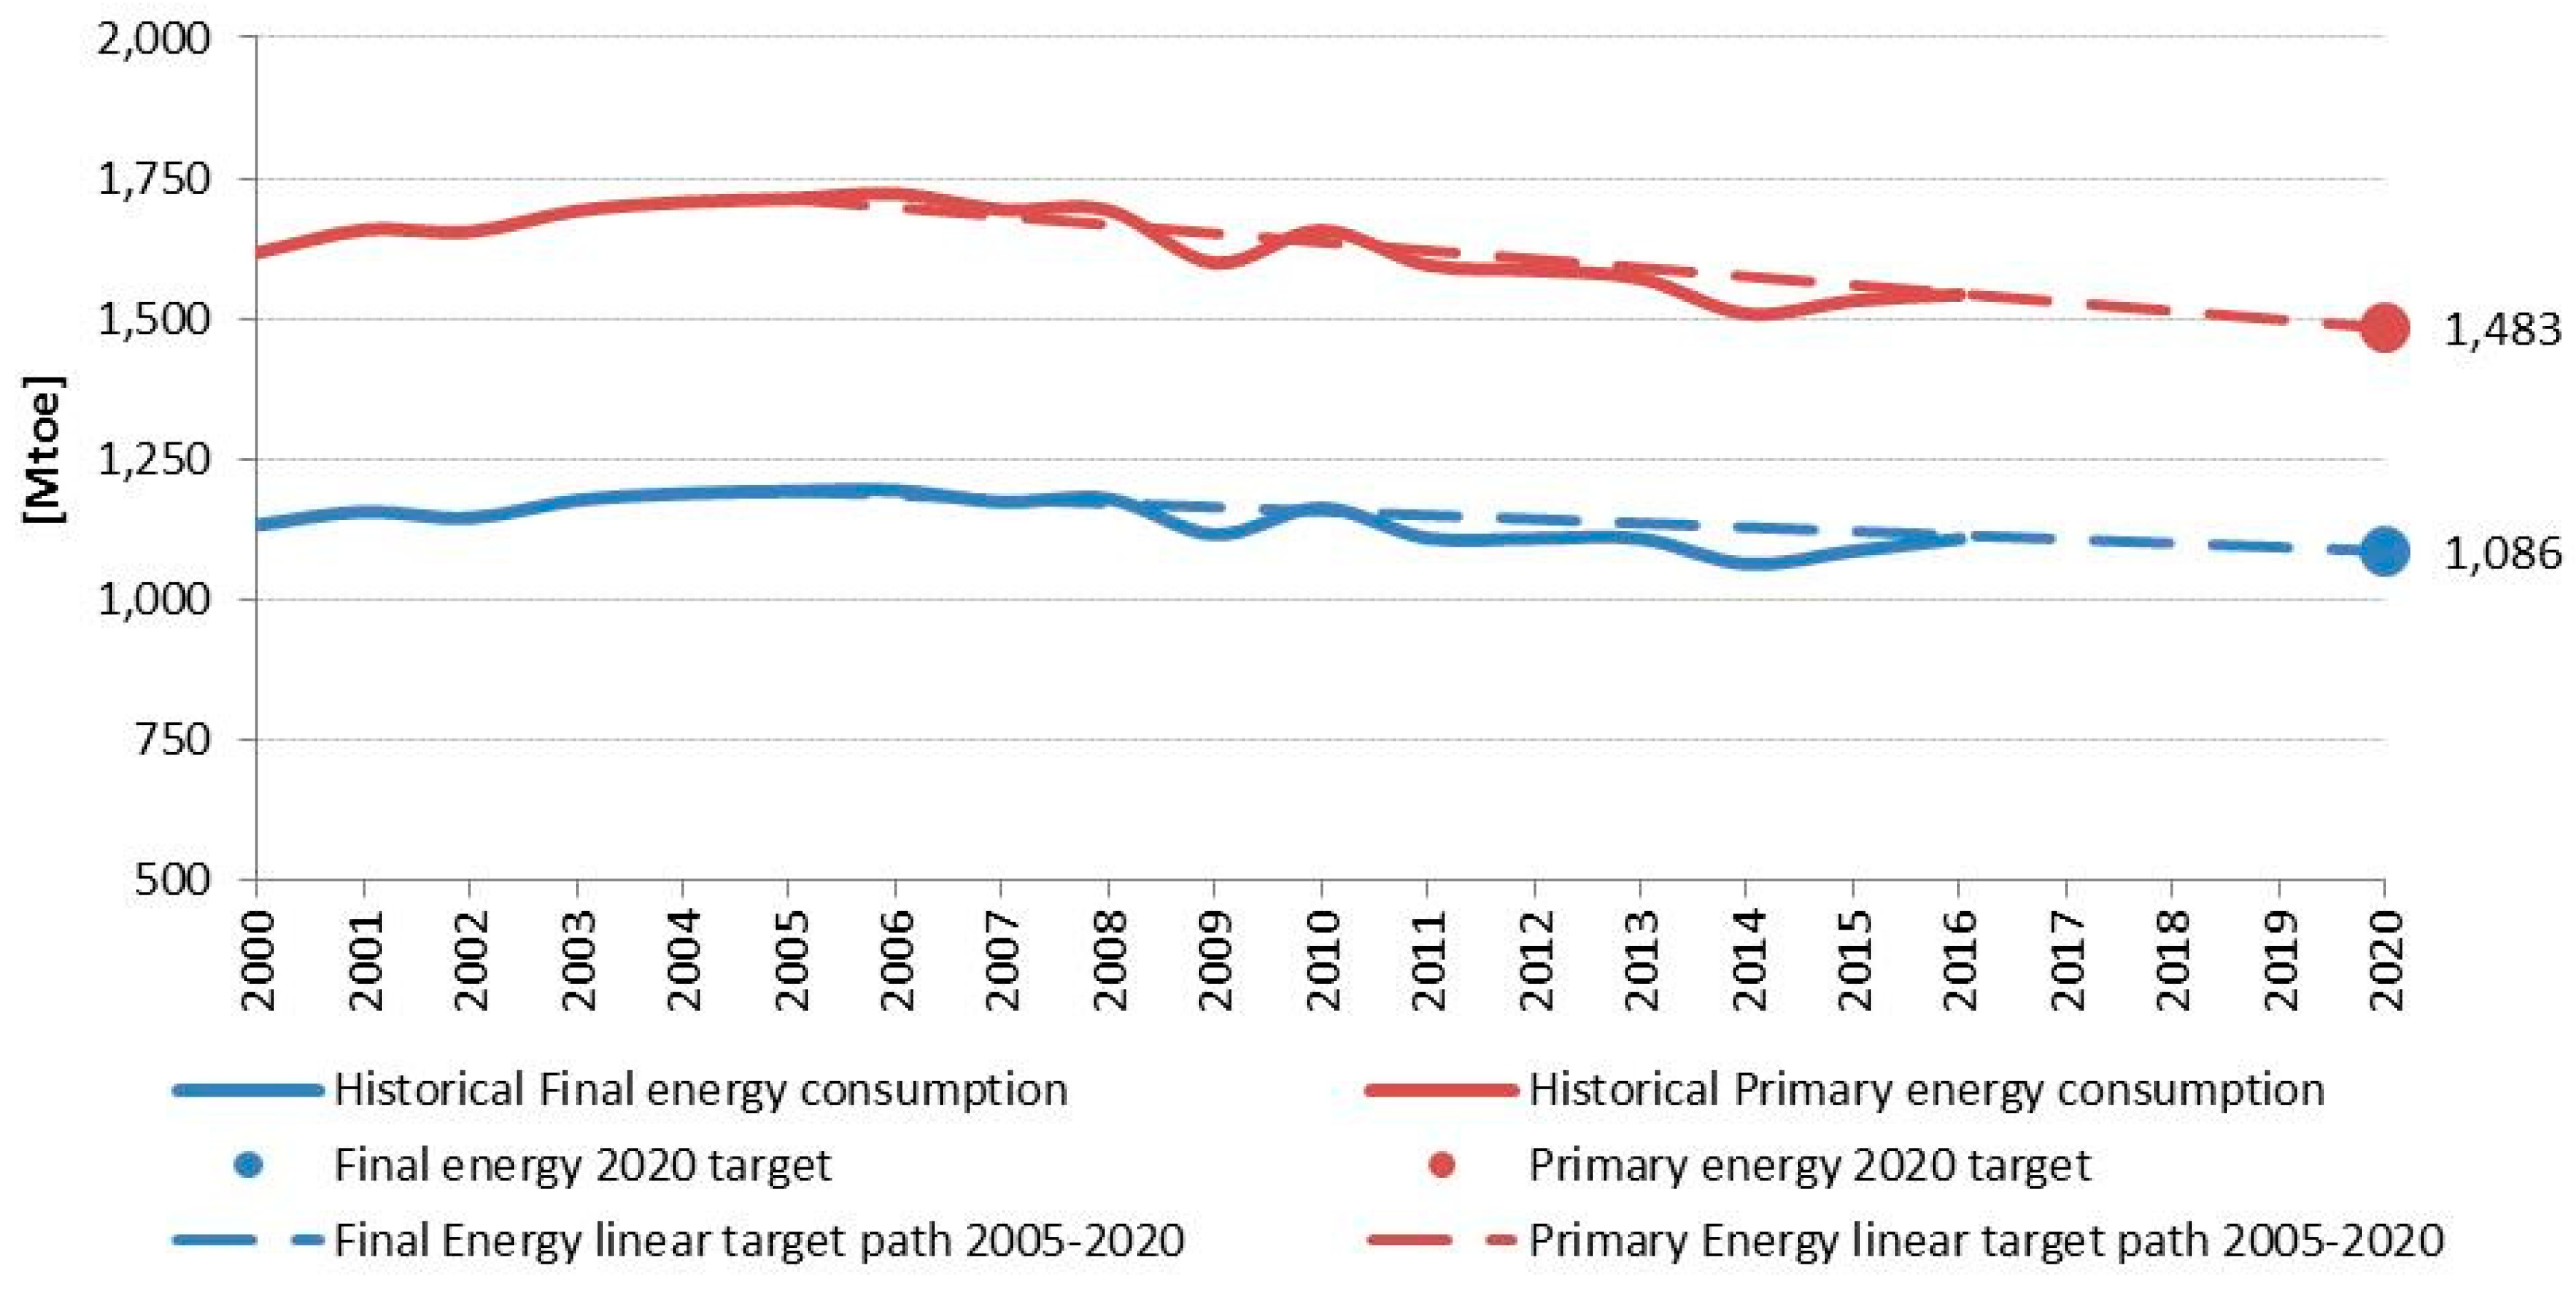
14]. The ESD requested MSs to prepare NEEAPs every three years, in 2008, 2011, and 2014. To boost effective energy efficiency policies in MSs, the Energy Efficiency Directive (EED) was adopted in December 2012 and replaced the ESD. The EED defined the 20% energy efficiency target as EU-28 primary energy consumption of 1483 Mtoe (Million Tonnes of Oil Equivalent)and final energy consumption of 1086 Mtoe in 2020. In addition to the primary and final energy reduction targets, the EED introduced some binding national measures, such as legal obligations to establish energy saving obligation schemes, mandatory energy audits, provision of metering and billing consumer information, renovation of public buildings, promotion of energy service, efficient cogeneration, programmes to change consumer behaviour, etc.
In particular, Article 7 mandated MSs to set up Energy Efficiency Obligation Schemes (EEOSs), through which distributors and/or retail energy sales companies have to deliver new annual energy savings, equivalent to 1.5% of the annual energy sales, amongst final energy consumers [
15]. As an alternative policy option, MSs can achieve the same energy savings through the implementation of alternative policy measures or a combination of alternative measures and EEOSs. The Article 7 energy savings must be delivered in the period from 2014 to 2020 [
16].
Following the Commission’s proposal for an update to the EED, including a new 30% energy efficiency target for 2030 and the proposal for an extension of the EEOSs till 2030, the revised EED entered into force on 24 December 2018. This included a 32.5% energy efficiency target for 2030 [
17].
One of the main EU policies targeting both residential and non-residential buildings is the Energy Performance of Buildings Directive (EPBD), which was adopted in 2002 [
7] and then revised in 2010 [
8] and 2018 [
9]. Under this directive, MSs implemented various measures at the national level, such as the Energy Performance Certificates that are issued when buildings are sold or rented. The EPBD requires that all new buildings must be Nearly Zero-Energy Buildings (NZEBs) by 31 December 2020 (new buildings occupied and owned by public authorities by 31 December 2018). In addition, the directive introduced a methodology to be used by MSs for setting cost-optimal Minimum Energy Performance Requirements (MEPs) for new buildings, major renovations of buildings, and for the replacement or retrofit of building elements. MSs also had to implement measures and other instruments (e.g., national financial incentives) to improve the energy efficiency of their national building stock.
In 2018, the EPBD was amended. The amendments included the acceleration of cost-effective renovations of existing buildings and the consideration of issues, such as the health and well-being of building users (i.e., ventilation and air quality) among others.
Another major energy efficiency policy action at the EU level is the establishment of minimum efficiency standards for energy-using and energy-related products introduced by the Ecodesign Directive. Under the Ecodesign Directive, minimum energy efficiency standards have been adopted for refrigerators, washing machines, dishwashers, lamps, air–conditioners, boilers, water heaters, consumer electronics, televisions, etc. [
4,
18]. This is complemented by the mandatory EU energy labelling schemes [
6] as established in the Energy Labelling Directive [
19,
20]. The combination of efficiency standards and energy labelling has been successful in improving the energy efficiency of residential equipment [
4].
This legislative framework, complemented by policies, programmes, and measures implemented by the member states, as described in the NEEAPs, is an important driver for the observed trends in energy consumption in the EU [
11].
This article focuses on the residential energy consumption and identifies driving factors (i.e., determinants) that may help in understanding current trends in addition to the adopted policies. The residential sector is one of the most important sectors due to the large amount of energy consumed (25.7% in 2016) and significant CO2 emissions produced by this sector, as well as due to the high energy expenditure of households and rising energy poverty levels in certain segments of the population. As a result, a major part of the EU and national energy efficiency policies address the residential sector. By determining the impact of the major determinants on energy consumption in the EU, the article aims to identify whether the current EU and member states’ energy efficiency policies in the residential sector have led to a decline in energy consumption, and thereby contributed to the achievement of the energy efficiency targets.
To assess the impact of the energy efficiency policies on the energy consumption trends in the residential sector, an indicator which incorporates all major determinants in the residential final energy consumption is proposed by the authors. The evolution of this indicator over time is studied with the aim to analyse the trends over the examined period. If the results show a decreasing trend, it can be concluded that this was associated with the impacts of policies and technologies. Although this hypothesis is not analysed using econometric model methods [
21] in the specific article, the analysis of the determinants and especially the new indicator proposed by the authors can provide new insights into the impact of energy efficiency policies. By controlling the main determinants, such as wealth, Gross Domestic Product (GDP), household characteristics, population, and weather conditions, we can conclude that the decreasing trend is the result of the implemented policies. Decomposition analysis is applied to quantify and confirm the results. This indicator-type analysis can help answer the research question addressed by this article regarding the impact of energy policies on energy consumption. It is important to stress that our approach has not been noted in the literature as there is a limited number of studies focusing on this kind of analysis.
The structure of the article is as follows.
Section 2 provides a literature review on the impact of policies and drivers on energy consumption.
Section 3 describes the methodology considered in this article and the data sources used.
Section 4 provides an overview of the EU’s general energy trends, focusing on primary and final energy consumption, and on the evolution of standard indicators, such as energy intensity and energy per capita as well as the new indicator proposed by the authors: The climate normalised specific residential final energy consumption per adjusted gross disposable income. In addition, it discusses the main energy trends in the residential sector and the identification of the potential determinants for residential energy demand identifying the direction of the impact of these factors on energy consumption. Finally, decomposition analysis is applied to identify and quantify the impact of various factors (population, wealth, intensity, and weather) on the latest residential energy consumption trends.
Section 5 provides some concluding remarks.
The article presents a number of graphs, which aim to provide insights into the impact of EU policies on the energy consumption trends of the residential sector. Firstly, it presents the final energy consumption trends in all sectors (
Figure 1,
Figure 2 and
Figure 3), followed by a more detailed discussion of the residential sector. Potential determinants, such as population (
Figure 4,
Figure 5 and
Figure 6), economic conditions (
Figure 7,
Figure 8,
Figure 9 and
Figure 10), dwelling-related characteristics (
Figure 11 and
Figure 12), and climatic conditions (
Figure 13), are identified and analysed on a yearly basis for each member state. Similarities in trends between the residential FEC and specific determinants are drawn to provide evidence on the correlation between variables. Consequently, these potential correlations are analysed using the regression analysis in an attempt to understand which determinants have the most pronounced impact on the residential FEC trends (
Figure 14,
Figure 15,
Figure 16 and
Figure 17). Linear regression correlation diagrams are applied for a specific year comparing the EU-28 member states. Finally, the residential FEC indicator proposed by the authors is analysed alongside all the described determinants (
Figure 18 and
Figure 19), with the aim to assess how energy consumption trends change if all the potential determinants are considered. If this indicator shows a declining trend in the time period studied, it could be viewed as evidence that the EU’s energy efficiency policies implemented in previous years, in addition to technological developments, have had a considerable impact. Decomposition analysis is also applied to support the results (
Figure 20).
3. Methodology
This article studies the EU residential energy consumption trends and possible determinants (economic conditions, population status, climatic conditions, household characteristics, energy prices). This is a fundamental step in evaluating if EU and national energy policies have had a positive impact on energy consumption trends in the context of the EU 2020 energy strategy. The article focuses on the period from 2000 to 2016; the year, 2016, is the latest year for which statistics were available when the analysis was carried out. For the completion of the article, an important amount of data was selected, elaborated, and analysed. The data used for the identification of the main determinants of the residential energy consumptions were extracted from two databases: The Eurostat Database [
35] and the Odyssee database [
36,
37]. The Eurostat Database is available online and provides high quality data and statistics about EU member states, enabling a direct comparison between them. In particular, the Eurostat Energy Balances, which are updated in January and June every year, were used to extract a variety of energy data. The update of the database in June 2018 was used. The database of the Odyssee project, on the other hand, is managed by Enerdata, and contains detailed energy efficiency and energy indicators and data on energy consumption, activity indicators, and their related CO
2 emissions. The Odyssee database includes, among others, data taken from national sources and from Eurostat. The Odyssee energy data used in this article were extracted from the Odyssee database of October 2018.
Both the Eurostat and Odyssee databases provide energy data for the main economic sectors (residential/households, services, industry, and transport) and for the EU-28 member states over the period of 1990–2016. This enables the comparison of the energy consumption trends between member states and between economic sectors. Eurostat was the main data source used in this article; however, Odyssee datasets were used as a complementary source, especially in cases of more elaborate energy indicators or detailed data, which are not currently covered by Eurostat.
The article starts from the analysis of the primary and final energy consumption trends at the EU level. These are compared with the targets defined under the EED. In this context, it should be noted that there is a mismatch between the official EU28 targets (as defined in 2013 with the accession of Croatia) and the sum of the indicative targets communicated and updated by member states. The sum of indicative member states’ primary energy targets is 3% greater than the EU28 target, while it is the opposite (−1%) for final energy targets [
38]. To reply to the question, ‘Is the EU on track to achieve its objectives?’, the linear regression path between the historical data of 2005 (the year before the transposition of the EPBD) and the 2020 target was considered. This linear regression path offers a theoretical “first-order” approximation path to the targets.
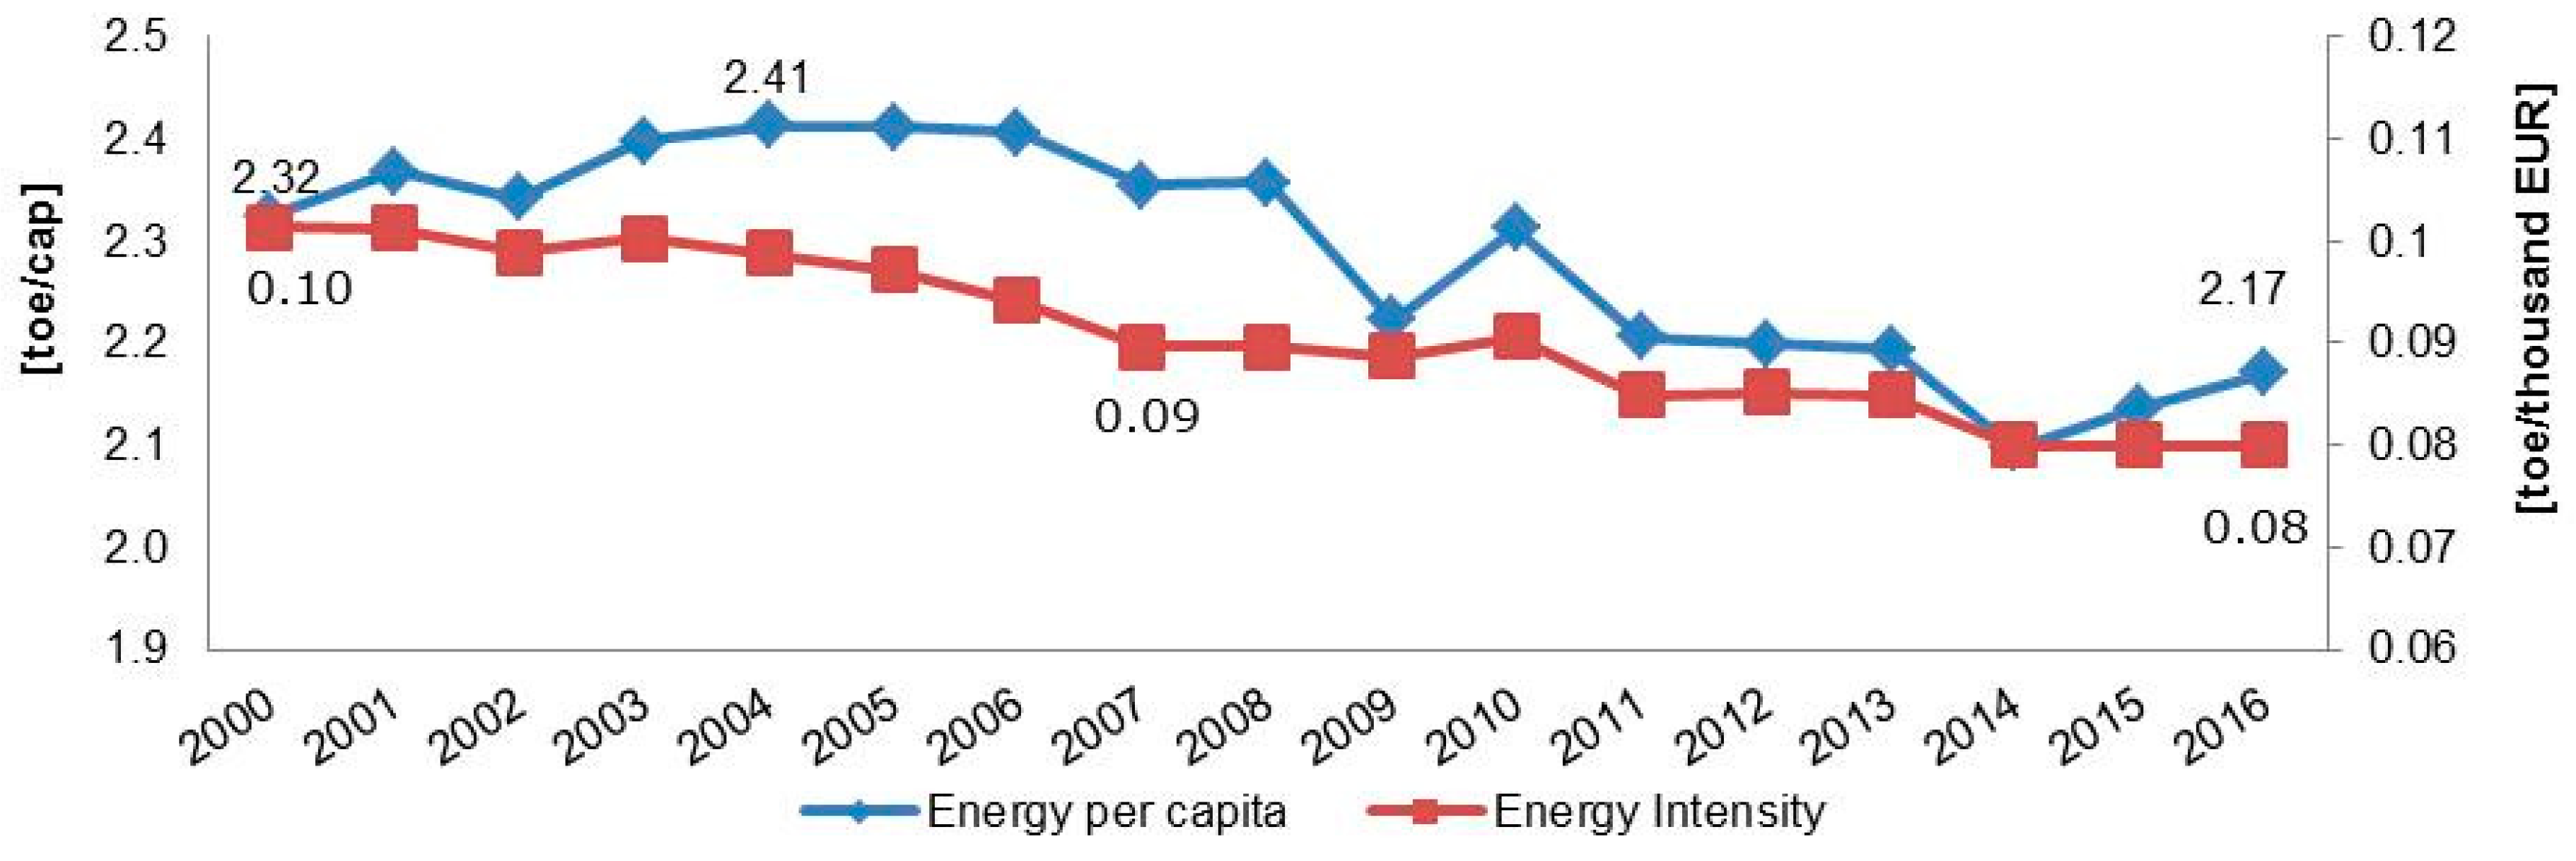
The analysis focuses on two significant indicators: Energy intensity and energy per capita. The first one, calculated as units of energy per unit of gross domestic product (GDP), is commonly used to measure the energy efficiency of an economy and it is the main indicator, which represents the decoupling of energy from the GDP. The second one is calculated by dividing the total energy consumption by the population.
Focusing on the residential sector, the trend of final energy consumption (FEC) is analysed in comparison with those of the other sectors, and relatively to the member states’ groups (both in absolute terms and per capita).
To identify the main influencing determinants on the residential energy consumption, the trends at the EU level and comparisons between member states are presented for several contextual parameters. Considering previous studies [
28,
39,
40,
41,
42,
43,
44] and the data availability, the choice fell on the following ones:
- -
- -
Gross domestic product per capita.
- -
Percentage of people without the ability to keep their home adequately warm in the population below the 60% of median equivalised disposable income.
- -
Adjusted gross disposable income of households per capita.
- -
Number of dwellings.
- -
Average number of people per household [
36].
- -
- -
Heating degree days.
Considering that population is an important driver, a discussion of the energy consumption per capita in the EU-28 is first provided. To explain the variation in energy consumption trends between member states, the GDP per capita is also analysed, including the percentage of people without the ability to keep their home adequately warm in the population below the 60% of median equivalised disposable income in the EU-28 Member States. In addition, the adjusted gross disposable income analysis is considered, as it can be a more representative economic indicator for the analysis of energy consumption in residential sector. According to Eurostat definitions [
45], the adjusted gross disposable income of a household includes all income from work and from investments and property, transfers between households as well as social transfers. To consider the influence of variations in household size and composition, the total disposable household income is divided by an equivalisation factor. The adjustment improves the comparison of income levels between member states by considering different levels of government involvement in the provision of free services to households.
The importance of the household conditions as an influencing factor is also studied by analysing the household size expressed as the average persons per household in the EU-28 member states. A causal relationship is expected between the number of persons per household and the use of equipment and appliances. In addition, the average floor area might be another significant indicator of households’ energy consumption. The larger the size of dwellings, the higher the heating and cooling needs as well as the use of lighting equipment.
Heating degree days (HDD) and cooling degree days (CDD), indicators which are related to the heating and cooling needs, are also studied. A degree-day is defined by Eurostat [
45] as a weather-based technical index designed to describe the need for the heating or cooling energy requirements of buildings. They are often used [
46] to evaluate the influence of climate and weather conditions in energy consumption trends. In this case, it is studied by analysing the residential energy consumption per dwelling in comparison with the heating degree days (HDD).
The importance of the impact of some of these determinants on energy indicators is studied using linear regression correlation diagrams. This approach can only allow general speculations (i.e., predictions are not generated) because high R-squared values are not expected for this field of application. In fact, the energy consumption of a sector as wide and articulated as the residential one depends heavily on the specific peculiarities of the national building stock and on social and cultural aspects that cannot be taken into account by an article like this [
21,
27]. Firstly, the correlation between the energy consumption per capita and per average floor area and the heating degree days is analysed. The correlation between the GDP per capita and energy consumption per capita as well as the correlation between the gross adjusted disposable income and energy consumption per capita are also studied.
To understand the trends in residential energy consumption in relation to some important determinants, such as climatic conditions, dwelling-related characteristics, and economic conditions, the authors propose the new indicator,
. This is expressed as the specific residential FEC (
)—that is, the final energy consumption per unit of floor area—corrected for both climatic and economic conditions. The subscripts, “c” and “e”, denote the climatic and economic corrections, respectively. The climatic correction is represented by the ratio of the actual heating degree days (
) divided by the mean heating degree days over the reference period of 2000–2016 (
), while the economic correction is given by the adjusted gross disposable income in the purchasing power standard (
) divided by the total number of dwellings (
). The time period of 2000–2015 was selected because of the availability of data. The results for this indicator are produced using the following equation:
The indicator was calculated using the Eurostat datasets of energy balances (Eurostat code: nrg_110a), adjusted gross disposable income per capita (Eurostat code: nasa_10_nf_tr), heating degree days (Eurostat code: nrg_chdd_a), and the Odyssee data on the average floor area per dwelling. The indicator enables the assessment of residential energy consumption trends after the aforementioned important corrections are made, thereby drawing a closer and more precise link between the evolution of the energy consumption trends and the impact of technological and policy effects. Finally, to quantify the impact of possible various factors, we apply decomposition analysis on recent EU-28 residential energy consumption changes in the period of 2005–2016. Decomposition analysis has been widely used by various national and international organisations and agencies [
47,
48,
49] as a tool to inform policy makers on the driving forces behind energy trends [
50,
51,
52,
53,
54]. Through the use of decomposition analysis, the impact of pre-defined factors—e.g., economic activity, structural shifts in the economy, and weather fluctuations—on changes in energy consumption is determined, thereby enabling the isolation of real energy efficiency trends from other influencing forces. Two of the most popular types of decomposition techniques include the index decomposition analysis (IDA) and structural decomposition analysis (SDA). The main difference between these two types lies in the input data used: The SDA method uses the input-output model to decompose the evolution of indicators, whereas the IDA uses only sectoral data. Among the different IDA methods, the Logarithmic Mean Divisia Index (LMDI-I) carries multiple advantages and was therefore selected as the preferred decomposition technique for this analysis [
55,
56]. These, inter-alia, include perfect decomposition (that is, the results do not contain any residual term), the possibility to investigate the effect of more than two factors, and the simple relationship between multiplicative and additive forms. The additive form decomposes the difference between two points in time, while the multiplicative form decomposes the ratio of change with respect to the base year. For the residential sector, factors associated with population, wealth, intensity, and weather effects are analysed for each EU member using the hybrid model proposed by Xu and Ang [
57]. Due to data restrictions, two subsectors are considered by the authors: (1) Space heating, and (2) all other end-uses. In addition to the population effect (
), the wealth effect is also studied. The wealth effect is represented by the total floor area of dwellings (
) per capita for the end use of space heating and adjusted gross disposable income in purchasing power standard per capita (
) for all other end uses. The climatic effect is defined as the ratio of the heating degree days of a specific year (
) over the mean heating degree days (
) in the reference period of 1990–2016. The climatic adjustment is considered only for the final energy consumption attributed to the space heating end use (
), while the share of the consumption associated with all other uses (
) remains unchanged. The decomposition is carried out using the following factorisation identity:
where
stands for the climate corrected final energy consumption for space heating, calculated by dividing the final energy consumption for space heating with the climatic factor:
The decomposition is carried for every two consecutive years (i.e., 2005 and 2006, 2006, and 2007, etc.) and the results are then chained to aggregate the results for the whole time period of 2005–2016. The member state results are added up to give the corresponding effect at the EU level. All applications are run using Eurostat data, except the data on floor area, which are derived from the Odyssee database, as before. The decomposition formulae presented by Ang [
58] are used to conduct the analysis.
4. Results and Discussion
4.1. The Macro Picture: EU Primary and Final Energy Consumption
As stipulated in the EED, primary energy consumption (PEC) covers the consumption of the energy sector, distribution and transformation losses, and the final end-user consumption. It does not include the energy used for non-energy purposes. In 2016, the main component of primary energy consumption is the final energy consumption that accounts for 71.5% of primary energy; followed by transformation losses (21.4%) and consumption in the energy sector (5.2%).
PEC in the EU-28 decreased from 1618 Mtoe in 2000 to 1543 Mtoe in 2016, with a total drop of 4.6% over the entire period. It registered a compound annual growth rate (CAGR) by 0.3%. In the first period from 2000 and 2006, PEC followed an upward trend (despite the small decrease in 2001–2002), reaching a peak in 2006 (1723 Mtoe). This trend was, somewhat, reversed over the following 10-year period as PEC followed a downward trend, albeit at a fluctuating manner, with the two most evident dips in 2009 and 2014. In 2014, the EU primary PEC reached the lowest value since 2000 (1509 Mtoe) with a fall of 4.0% compared to the previous year. In 2015, the consumption increased again at a growth rate of 1.5% compared to 2014, and in 2016, by 0.7% compared to 2015. Before the rise recorded in 2015, the EU was on track to reach the target. As of 2016, the gap to achieve the primary energy target stands at 4.0%.
In terms of final energy, the EU had already reached its final energy target in 2014 (1063.1 Mtoe in 2014 vs the final energy target of 1086.0 Mtoe). In 2015, FEC registered a slight increase compared to the previous year (1086.2 Mtoe) and thus slightly exceeded the 2020 target. In 2016 it increased even more, thus increasing the gap to the 2020 target (1107.8 Mtoe; corresponding to a gap of 2.0%). Compared to final energy consumption of 1133 Mtoe in 2000, the 2016 consumption fell by 2.2%.
By analysing the most significant energy indicators, such as energy intensity (the ratio between the final energy consumption and gross domestic product (GDP) calculated as chain linked volumes with 2010 as a reference year) and energy per capita, it is possible to observe that from 2000 to 2016, the EU-28 energy intensity dropped by 0.02 toe/thousand Euro, reaching a value of 0.08 toe/thousand Euro in 2016. This reduction is the result of various factors, such as structural economic changes and technological improvements, together with the positive impact of energy efficiency policies, both at the EU and national level. After reaching the lowest value in 2014 (2.10 toe/capita), energy per capita was 2.17 toe/capita in 2016. Given the mild evolution of population over the examined period, energy per capita follows closely the trend of final energy consumption.
4.2. Energy Consumption and Energy Efficiency Trends in the Residential Sector
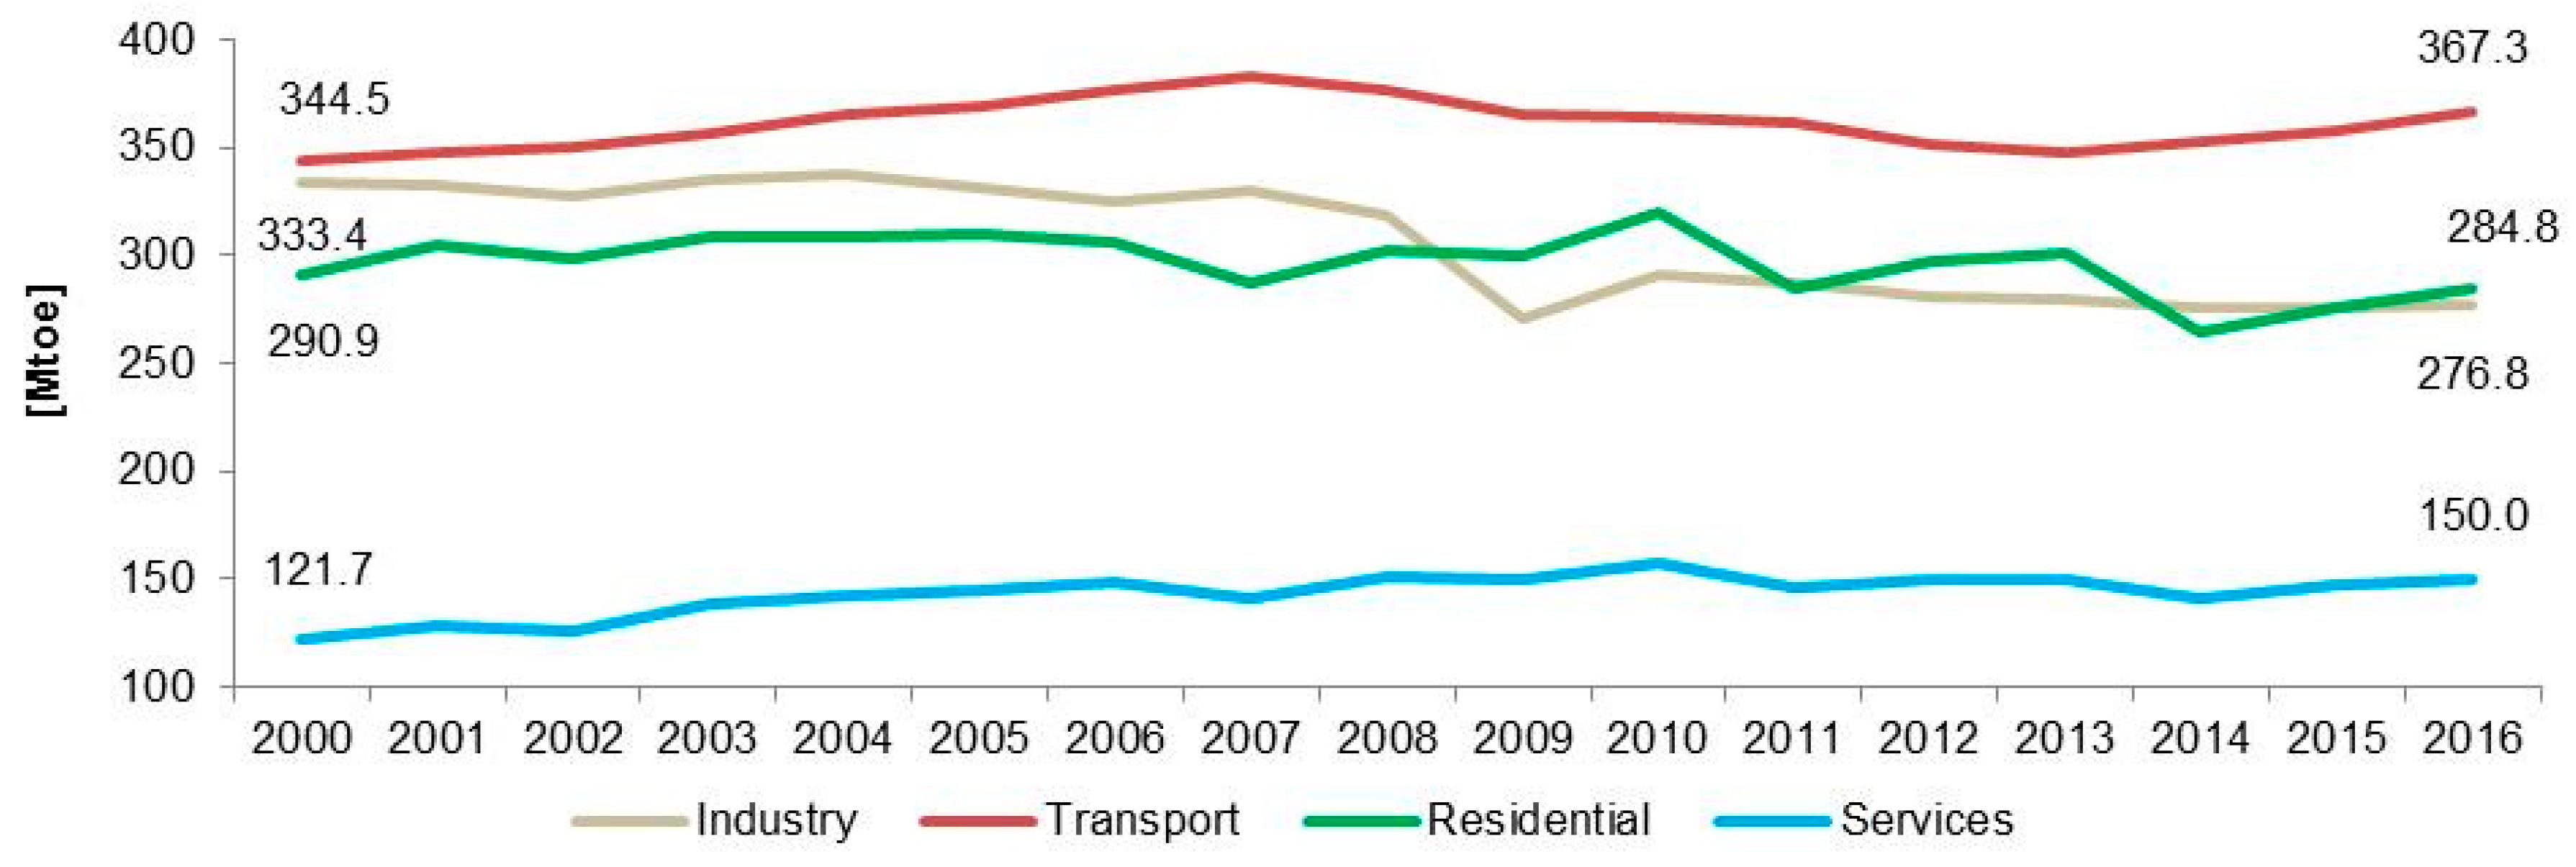
Figure 3 shows how the FEC per sector changed in the period of 2000–2016. In 2016, the residential sector consumed 25.7% of the final energy consumption in the EU. This makes it the second largest consuming sector after transport (33.2%). The increase of the final energy consumption in the transport and services sectors, combined with the decrease in the industrial sector, might be the result of the current tertiarization process in the EU. In 2016, however, the final energy consumption had increased in all sectors compared to the year, 2015, but mostly in the residential sector (3.1%).
Among the various sectors, the strongest fluctuations are noted in the residential sector, with significant consumption drops of 11.2% and 12.0 % in 2011 and 2014, respectively. Given that two of the warmest winters over this period were recorded in 2011 and 2014, a trend confirmed by the analysis of the heating degree days in
Figure 13, it can be concluded that the climatic conditions have a strong impact on the residential energy consumption. Conversely, 2010 represented one of the coldest years, largely explaining the increase in consumption registered in that year. The consumption peak in 2010 (320.0 Mtoe) and the dip in 2014 (265.1 Mtoe), in fact, represent the maximum and minimum consumption levels experienced in a period of a longer span that stretches over 27 years, from 1990 to 2016. As shown in
Figure 3, the residential FEC in the EU-28 decreased from 290.9 Mtoe in 2000 to 284.8 Mtoe in 2016. This is equivalent to a drop of 2.1%.
4.3. Potential Determinants Influencing Residential Energy Consumption
The analysis of the influencing factors can provide new insights into the study of energy consumption trends. In the case of the residential sector, it is possible to link energy consumption to specific variables, such as population, GDP per capita, adjusted disposable income, heating degree days, cooling degree days, number of dwellings, and average floor area. The mentioned variables were combined in different ways in an attempt to understand whether the behaviour of the residential FEC is still the same after correcting for these factors. Forecasts that go beyond the available data are not proposed, but general indications are provided, which are based on the assessment of energy consumption trends and the aforementioned determinants.
4.3.1. Population
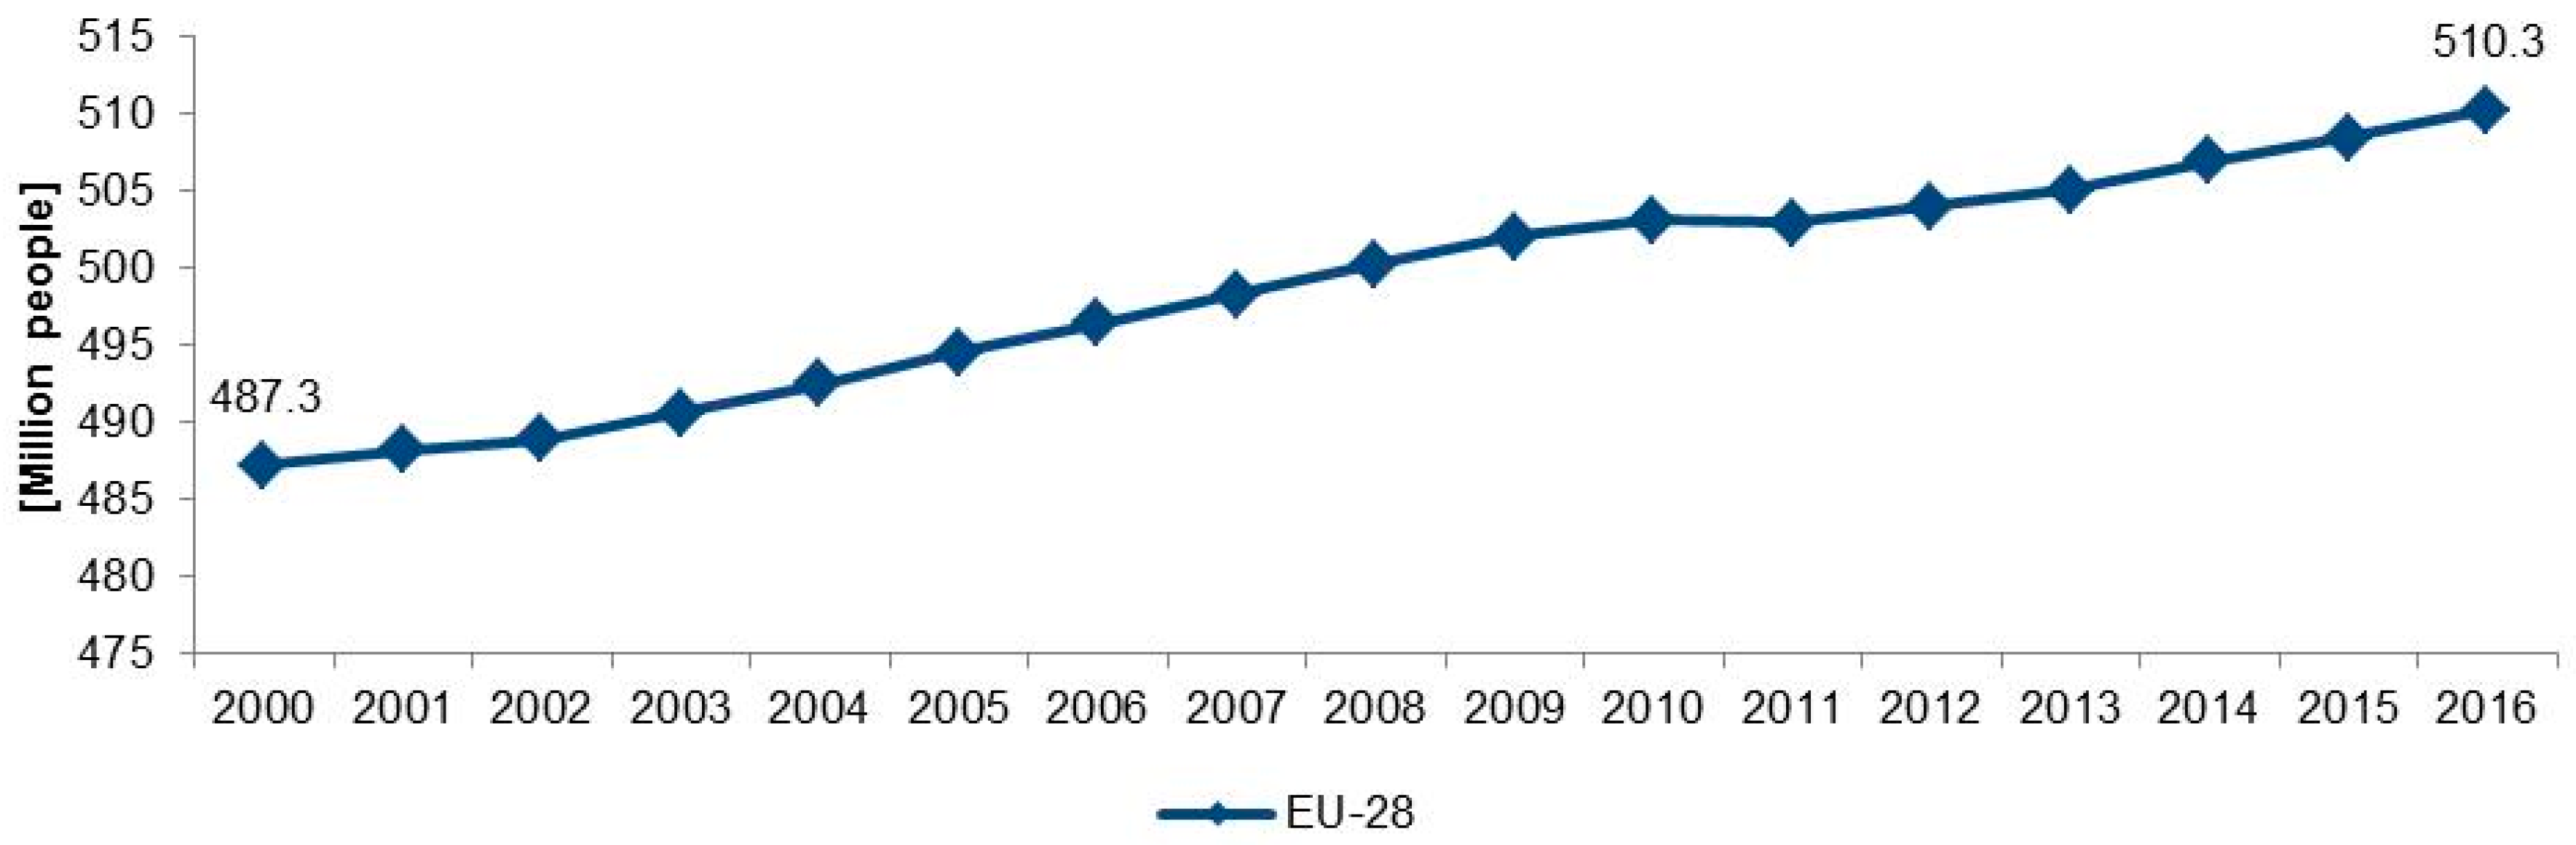
In 2016, the EU-28 population increased by 4.7% compared to 2000 while in the same period, the residential FEC declined by 2.1%, registering a positive CAGR by 0.3% and a negative CAGR by 0.1%, respectively.
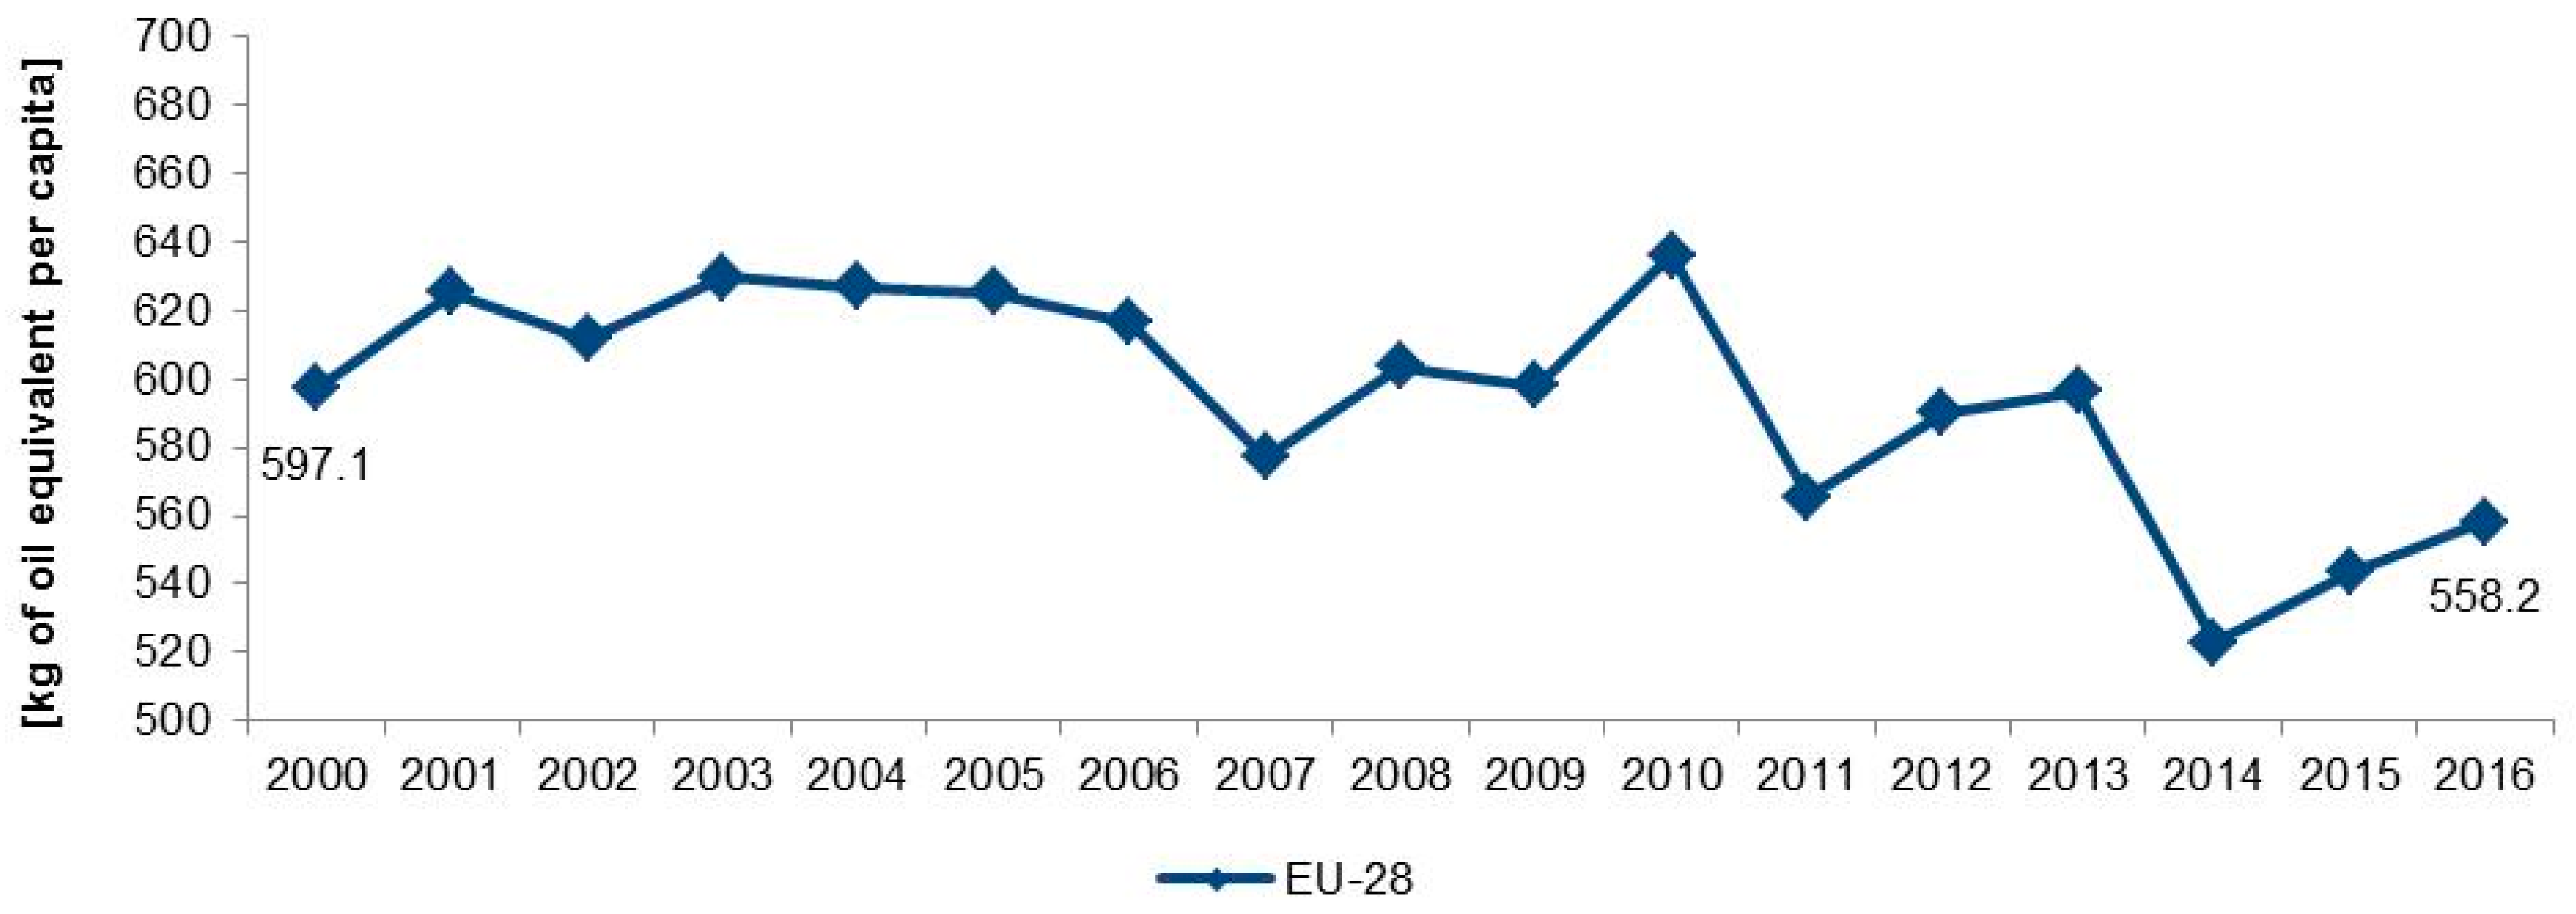
The residential FEC per capita declined by 38.9 koe in the EU-28 in the period of 2000–2016, representing a drop of 6.5% (a drop of 0.5% at CAGR). It can be observed that trends in residential FEC have a stronger impact on the trends of this indicator compared to the trends in population, as there are no significant changes in the population during the studied period. Consequently, despite the growth of the EU-28 population, its impact on the residential FEC is limited.
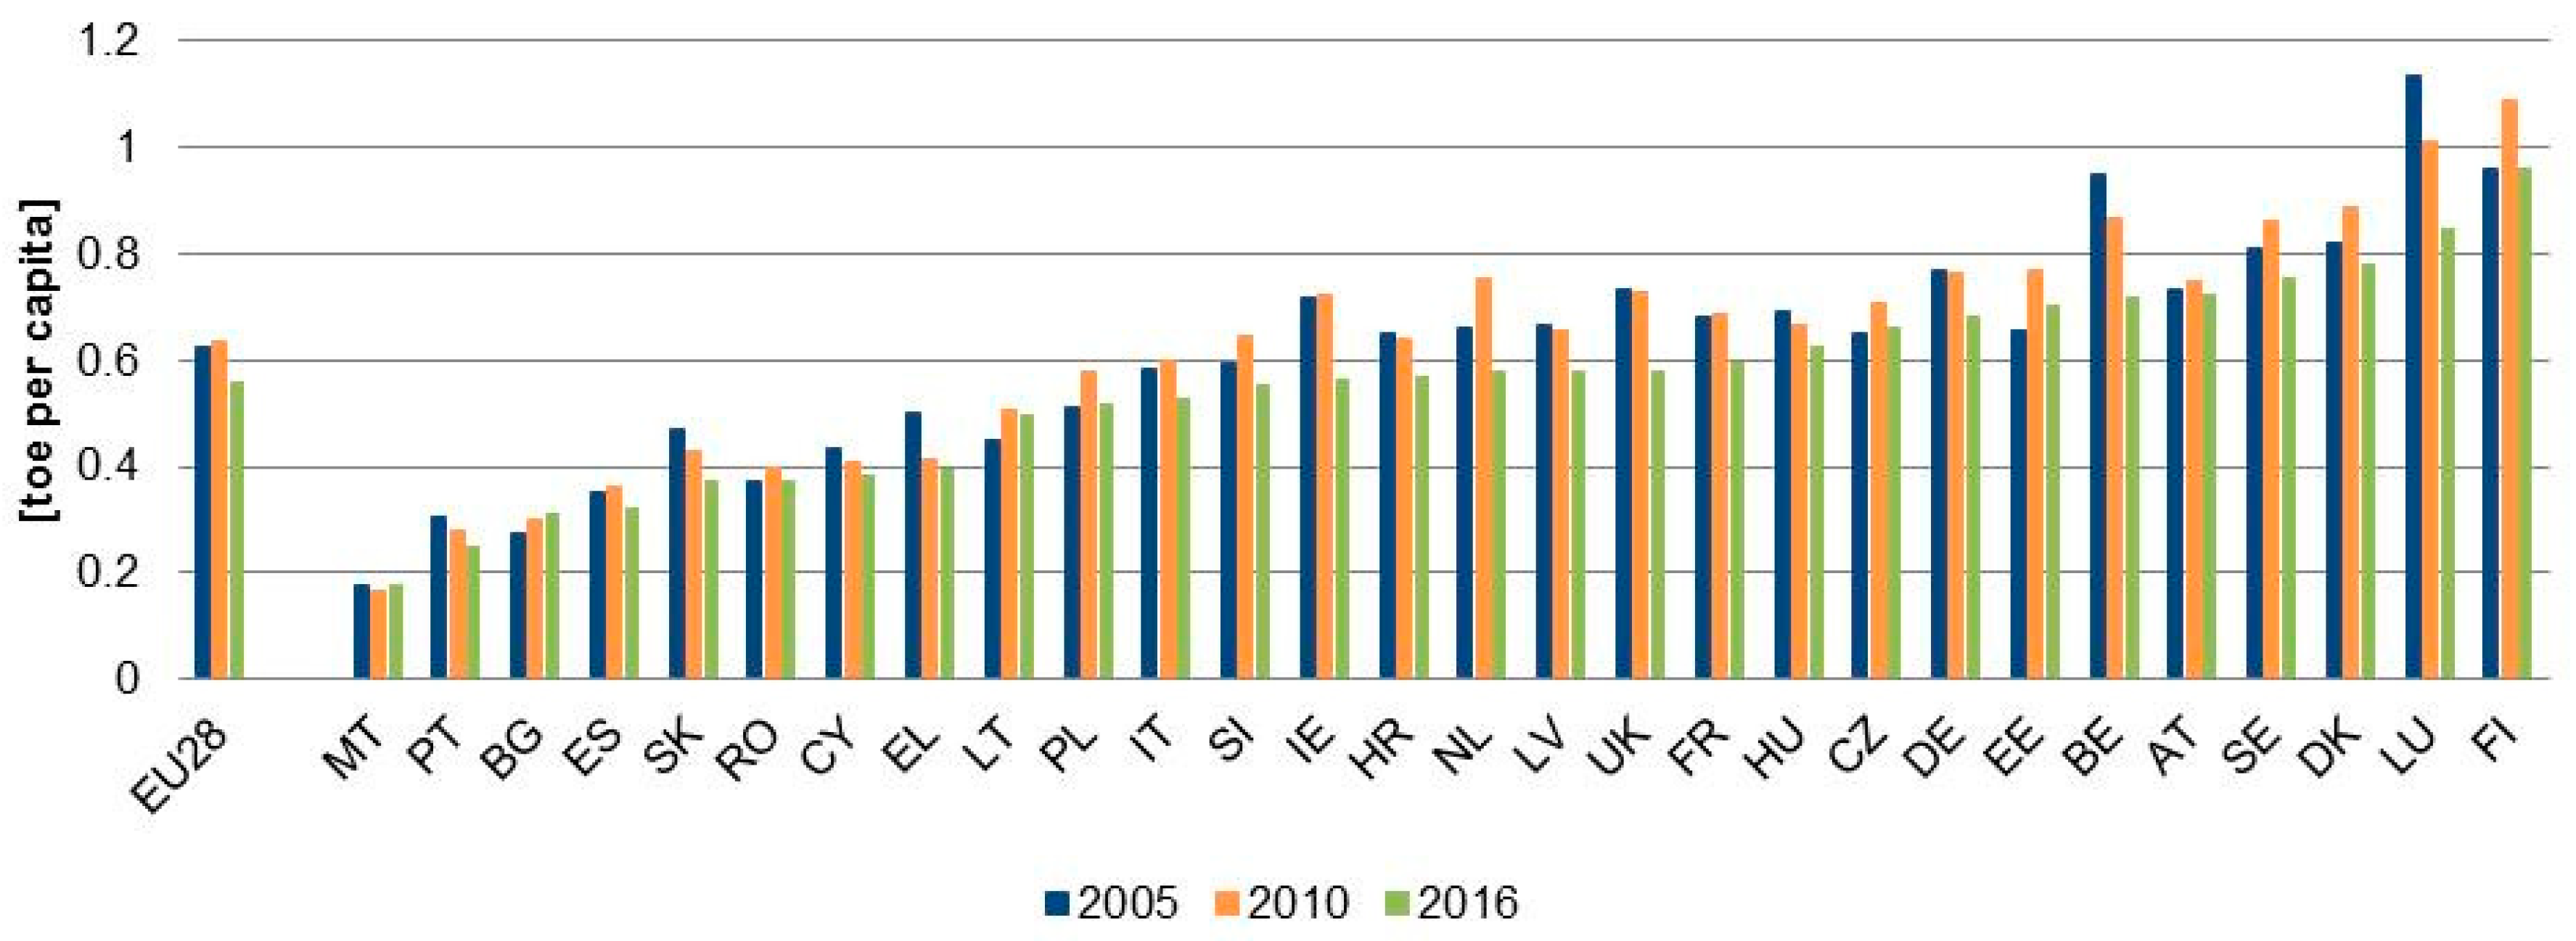
The analysis of the residential FEC per capita in the EU-28 member states (
Figure 5) shows that in 2016, the member states that consumed more were Finland with 0.96 toe/cap, Luxembourg (0.85 toe/cap), and Denmark (0.78 toe/cap). On the other hand, Malta, Portugal, and Bulgaria had the lowest values with 0.18, 0.25, and 0.32 toe/cap, respectively. The average EU-28 residential FEC per capita declined by 11.1% from 2005 to 2016 (from 0.63 toe/cap to 0.56 toe/cap). Almost half of the member states (12) had a final energy consumption per capita value below of EU-28 average (<0.56 toe/cap) in 2016. Half of these member states are Mediterranean countries with warmer climatic conditions. These are Malta, Portugal, Spain, Cyprus, Greece, and Italy. This confirms that climatic conditions are likely to be a significant driver of residential FEC as mild winters result in lower energy consumption. The remaining six member states are part of the EU New Member States (NMS-13) group, which joined the European Union after 2004, and may have important variations in factors beyond the adopted policies, such as cultural habits, economic growth, building characteristics, and the availability of sources compared to the other EU countries.
4.3.2. Economic Conditions
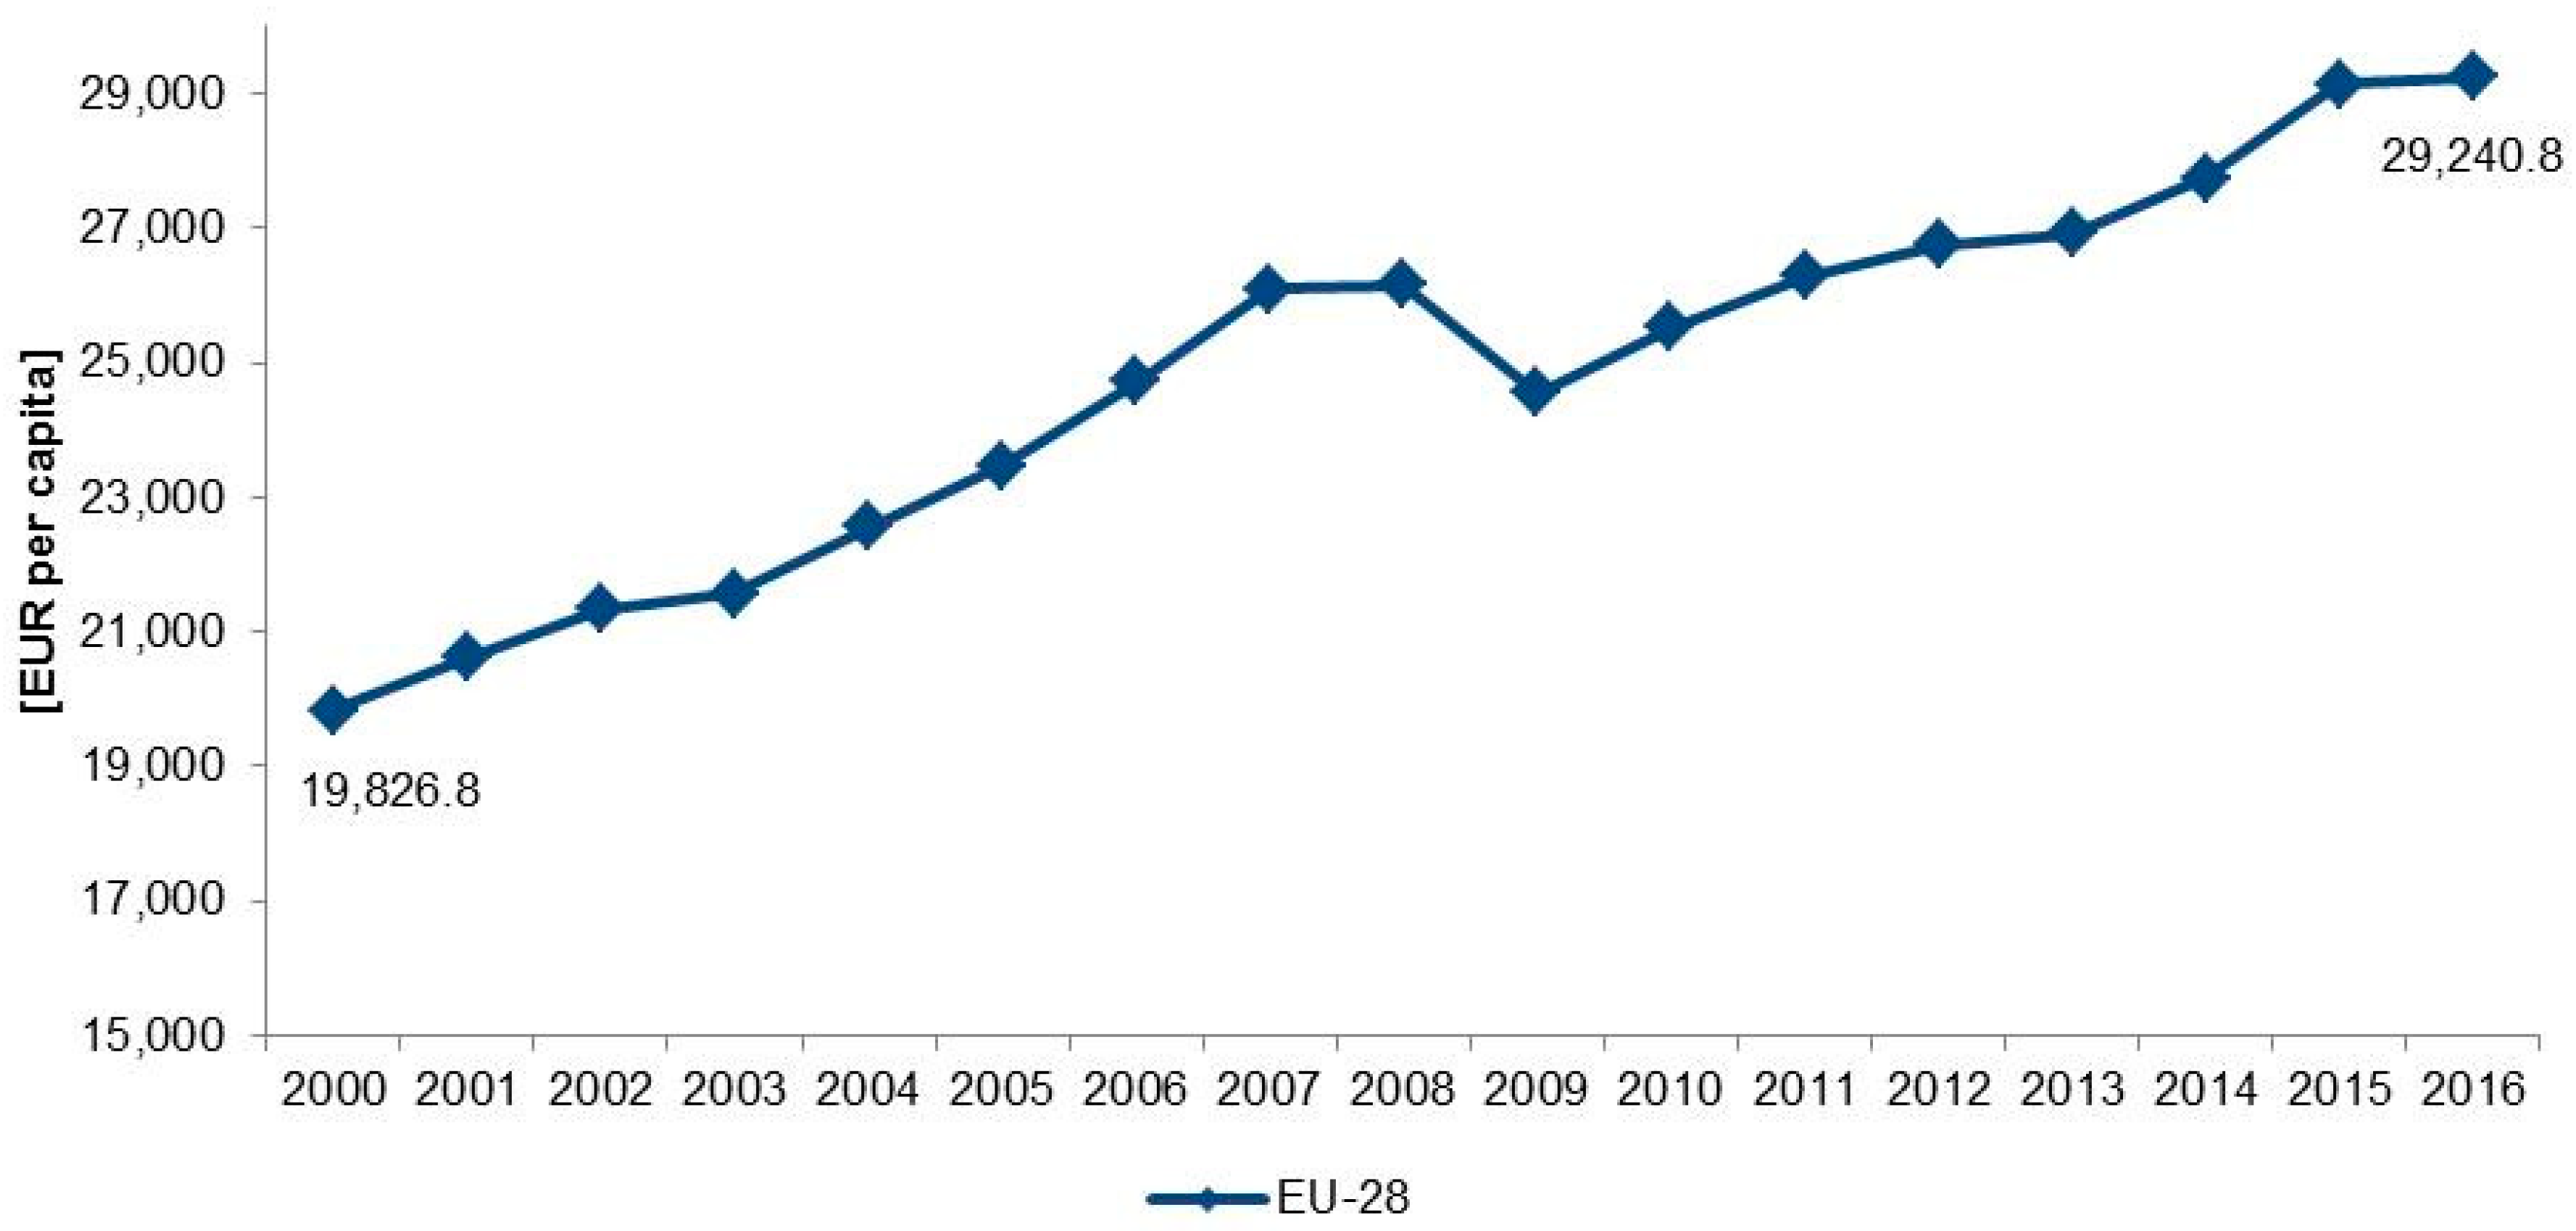
Other factors that may have an impact on energy consumption are the economic growth and the economic conditions of the countries. GDP per capita in the EU-28 (
Figure 7) has been continuously growing in the period from 2000 to 2016 except for a single fall in 2009 due to the economic and financial crisis. While GDP per capita increased by 47.5% (registering an increase by 2.4% at CAGR) over the period of 2000–2016, residential FEC per capita fell by 6.5% in the same period. It is observed that there is a large dispersion of GDP per capita in the EU-28, so it is important to look at the disaggregated data per country. Bulgaria registered the lowest GDP per capita (EUR 6728) and Luxembourg had the highest (EUR 91,982) in the face of an average GDP per capita in the EU-28 equal to EUR 29,241. It is easy to notice that Finland, Luxembourg, and Denmark, which are the countries with the highest consumption per capita, also have above average GDP per capita values. These data could suggest that higher GDP levels can result in the possibility of buying more energy, by having equipment at home that consumes more energy. In this point, it is important to note that residential energy consumption, especially in economically developed countries, is also influenced by the behavioural patterns and cultural habits of the building occupants. On the other hand, Bulgaria and Romania, which are the member states with the minimum GDP per capita, are also member states with low residential FEC per capita values. This could suggest that lower GDP levels may lead to the inability of many households to ensure the required levels of energy in the home, a condition commonly called energy poverty [
59].
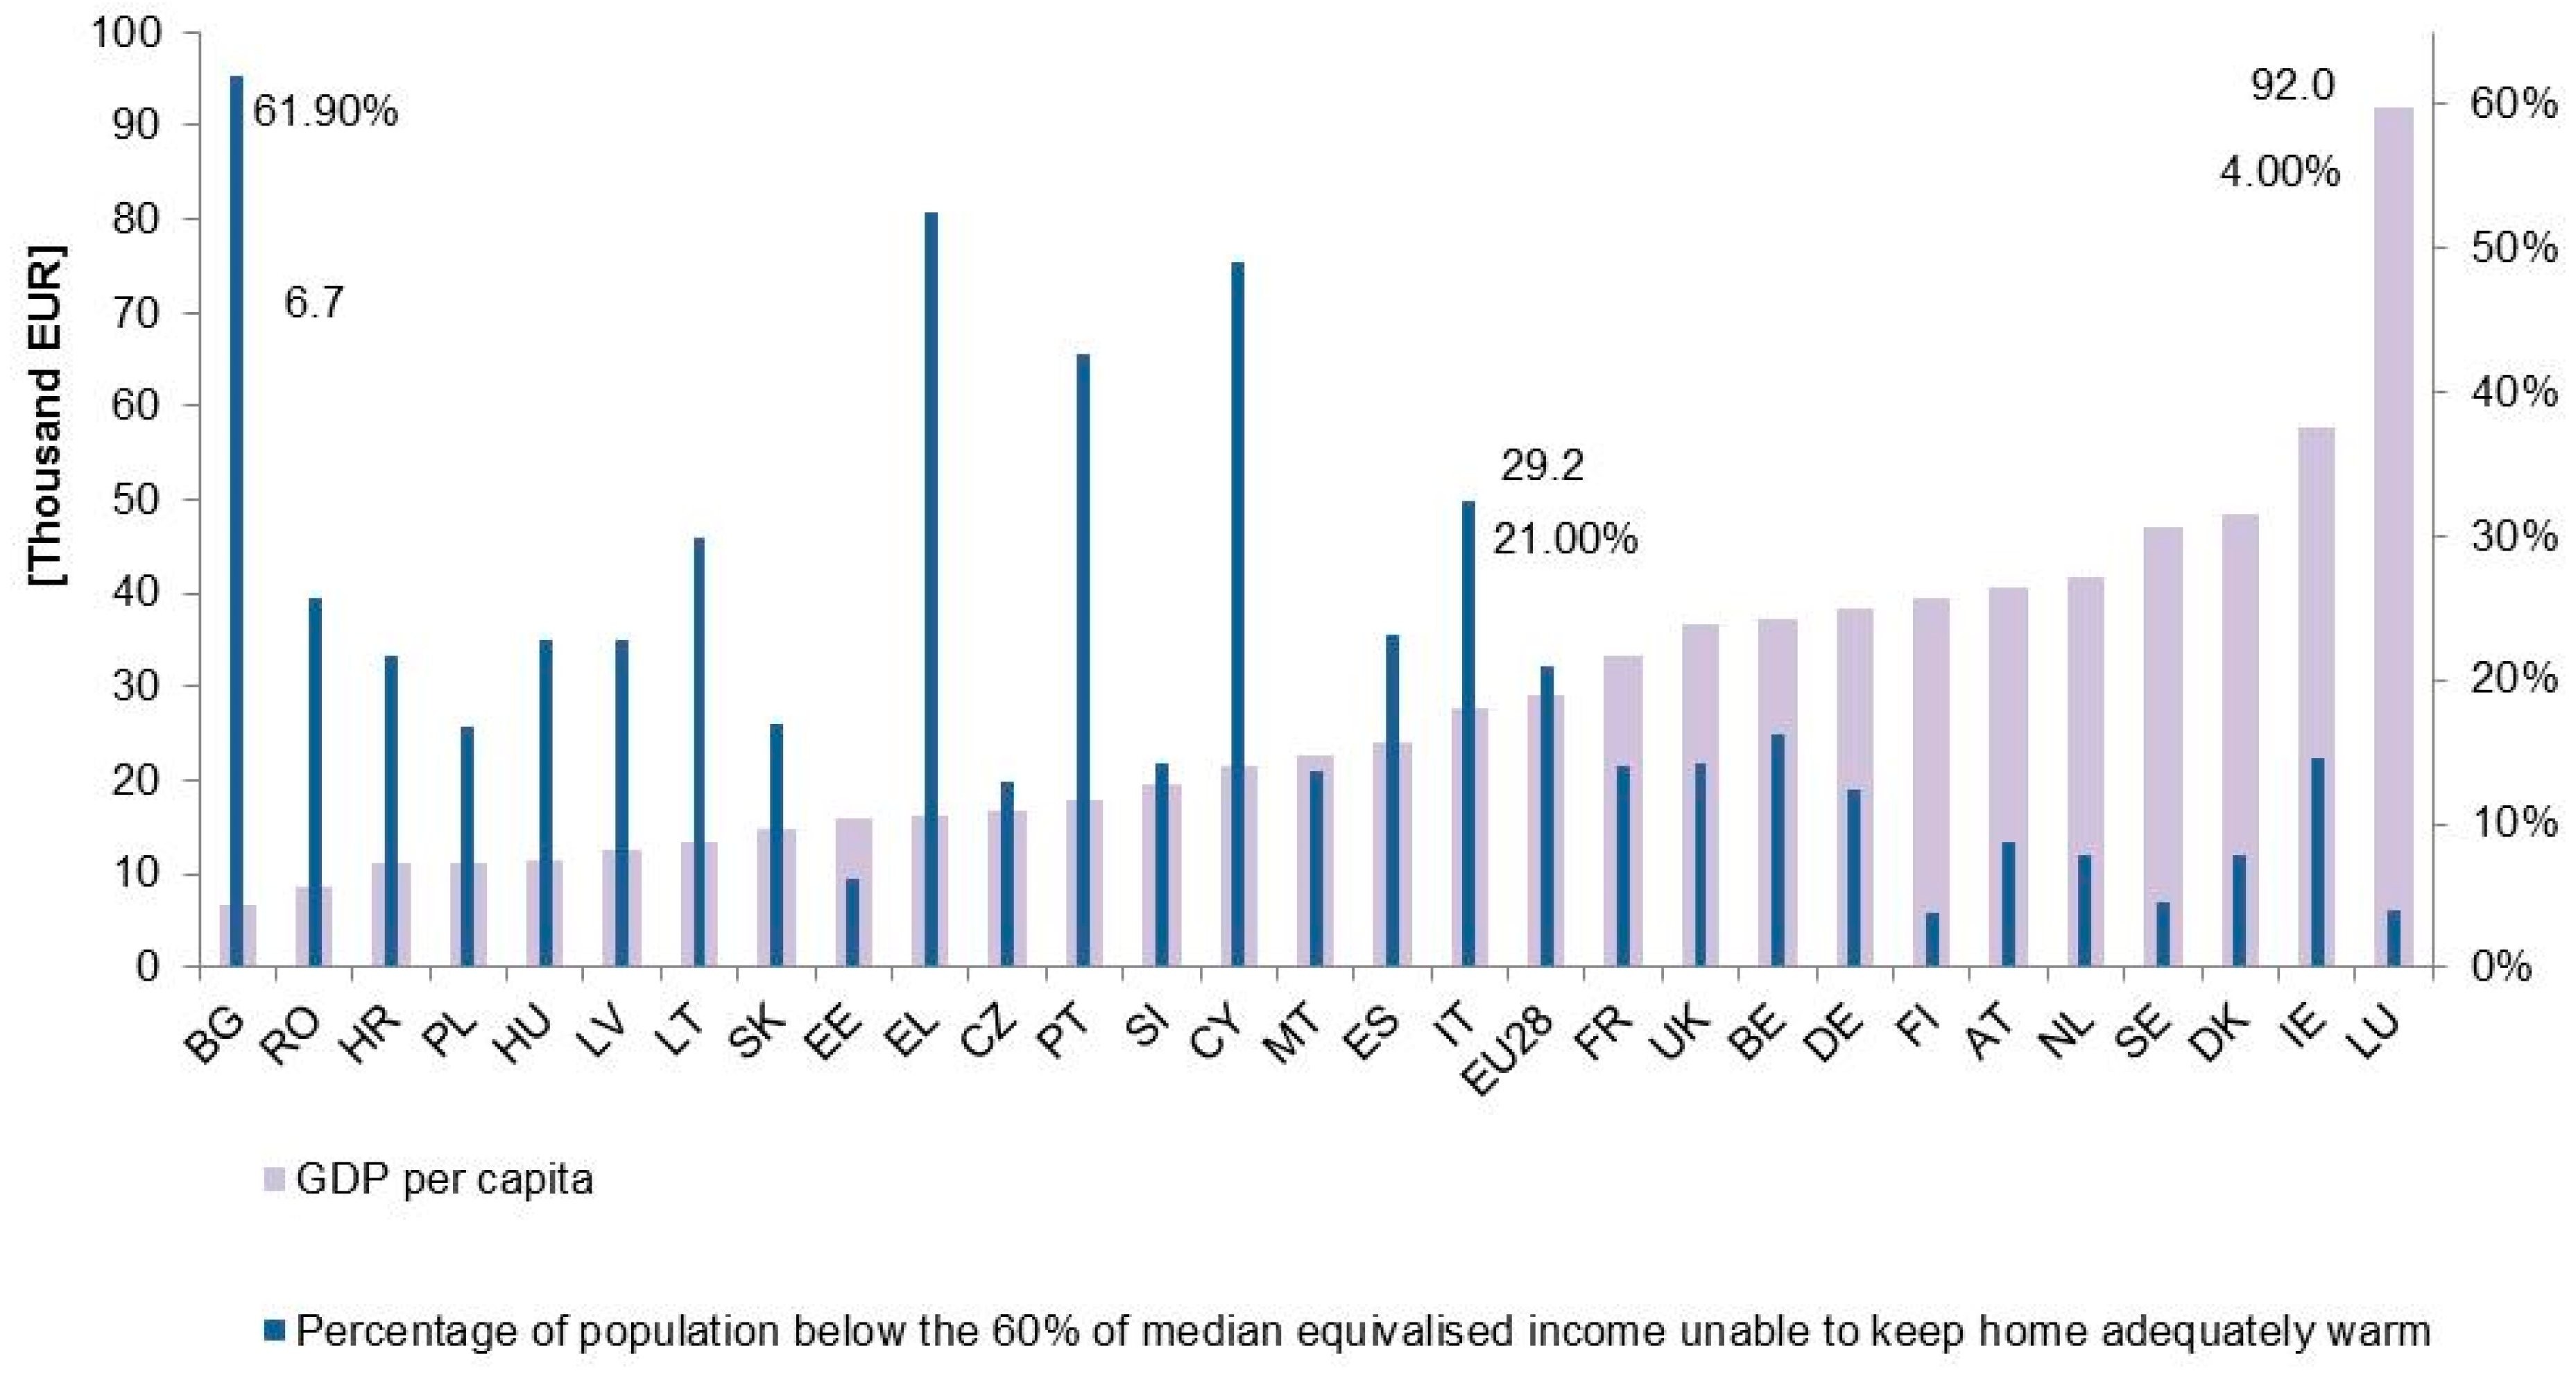
Indeed,
Figure 8 shows that many member states with GDP per capita levels below the EU-28 average and low final residential energy consumption values register high percentages of people without the ability to maintain a warm home in the total low income population. For example, the share of the population without the ability to keep their home adequately warm in the population below the 60% of median equivalised disposable income was above 50% in Bulgaria and Greece (61.9% and 52.5%, respectively).
On the other hand, Luxemburg and Denmark, both member states with high values of final residential energy consumption values, but also high GDP per capita values, registered low percentages in the low income population (4.0% and 7.9%, respectively) of people not able to ensure the energy required for heating needs. Overall, there is a slight decrease in the share of people not able to keep their home warm in the low income population (by 0.1%) in EU-28 from 2010 to 2016. Possibly, there is probably an inverse correlation between this indicator and GDP per capita.
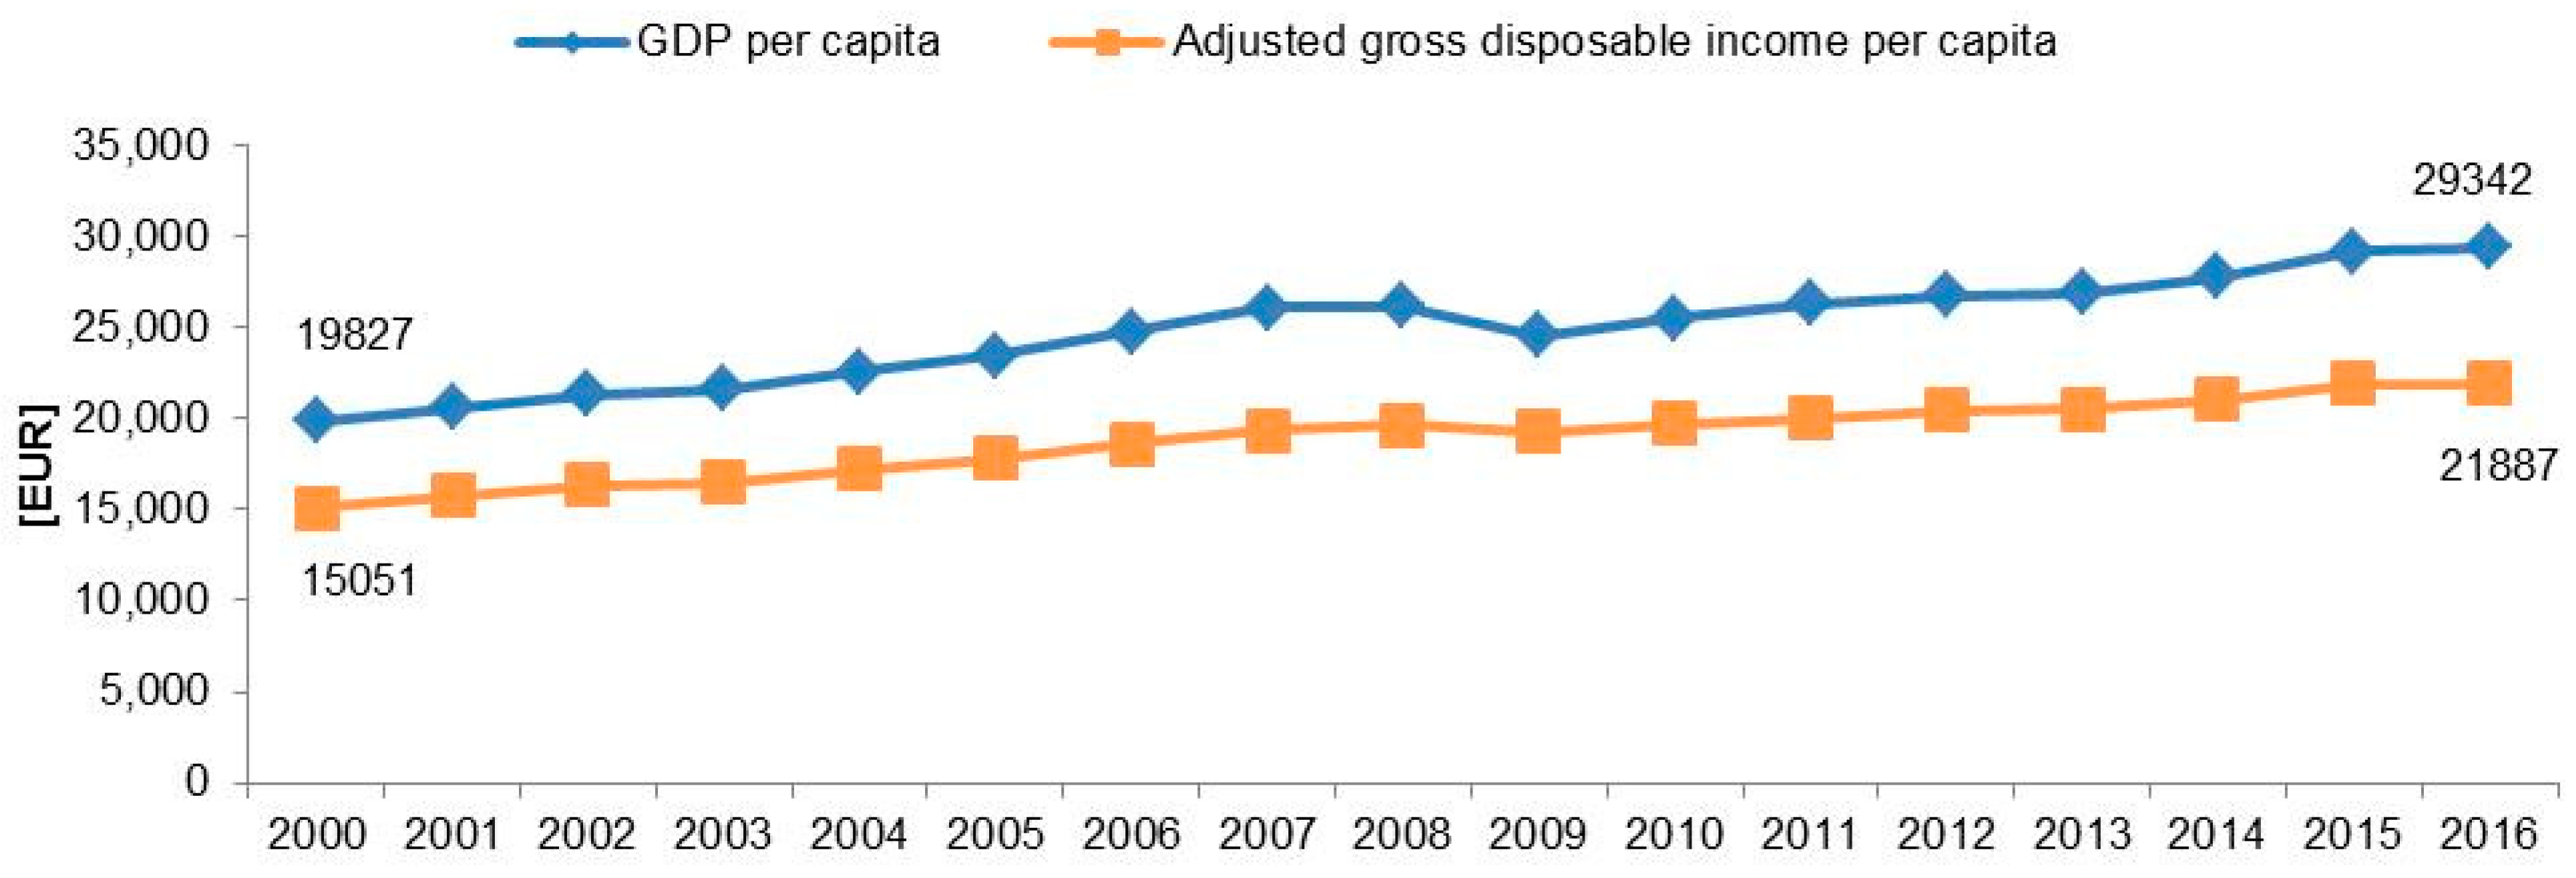
The growth in the GDP per capita, despite the population increase, can be the result of significant economic developments during recent years. The comparison of economic and energy consumption trends indicates that important economic growth has not been accompanied by a growth of the same magnitude in energy consumption. The adjusted gross disposable income per capita can be considered more relevant to the residential sector because it describes the wealth of households occupying residential buildings. In fact, by comparing the trend-lines of both adjusted gross disposable income per capita and GDP per capita for the 17-year period from 2000 to 2016 (
Figure 9), a notable difference between these two variables can be observed. In 2016, the difference reached EUR 7347. Thus, the GDP, although largely used, if adopted in the analysis of the residential sector, may not be a representative indicator for end-users as it does not reflect the real purchasing power of the inhabitants.
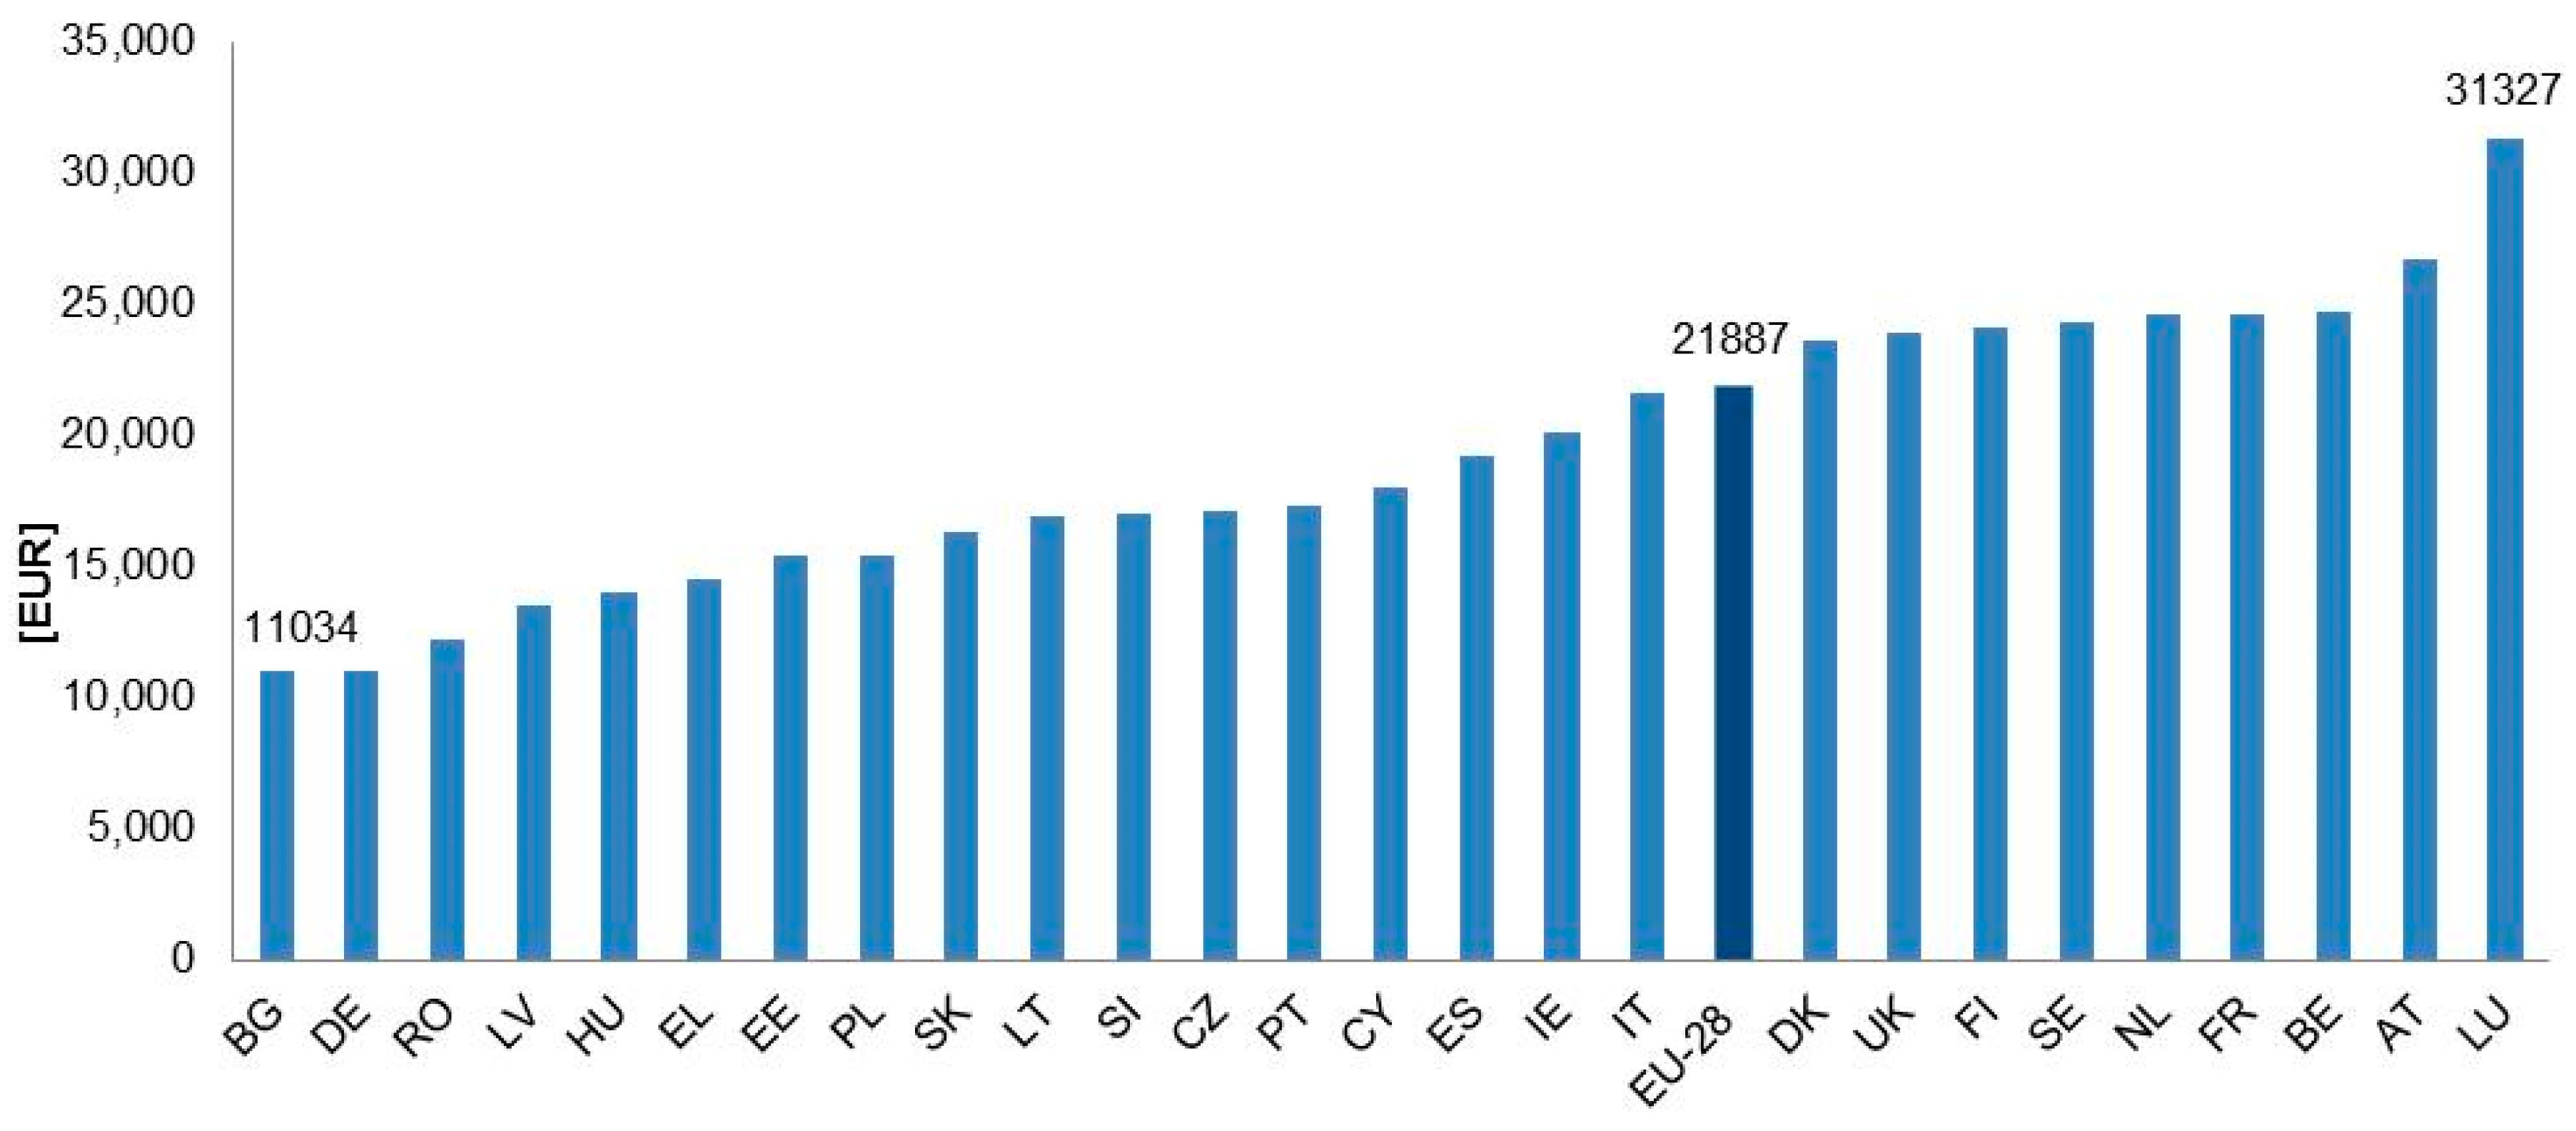
Figure 10 shows that the member states with the highest adjusted gross disposable income levels (Luxemburg, Austria, Belgium) are also among the countries with the highest final residential energy consumption per capita for the year of 2016. On the contrary, Bulgaria, which is the member state with the lowest adjusted gross disposable income per capita, also has the third lowest residential FEC per capita value after Malta and Portugal. This indicates that there is a correlation between the final residential energy consumption per capita and adjusted gross disposable income. However, dwelling-related and climatic corrections need to be applied to the final energy consumption per capita to assess whether there is a correlation between economic development and energy consumption trends. From this graph, Malta and Croatia were removed, as there are no available data for their adjusted gross disposable income for 2016.
4.3.3. Household Characteristics
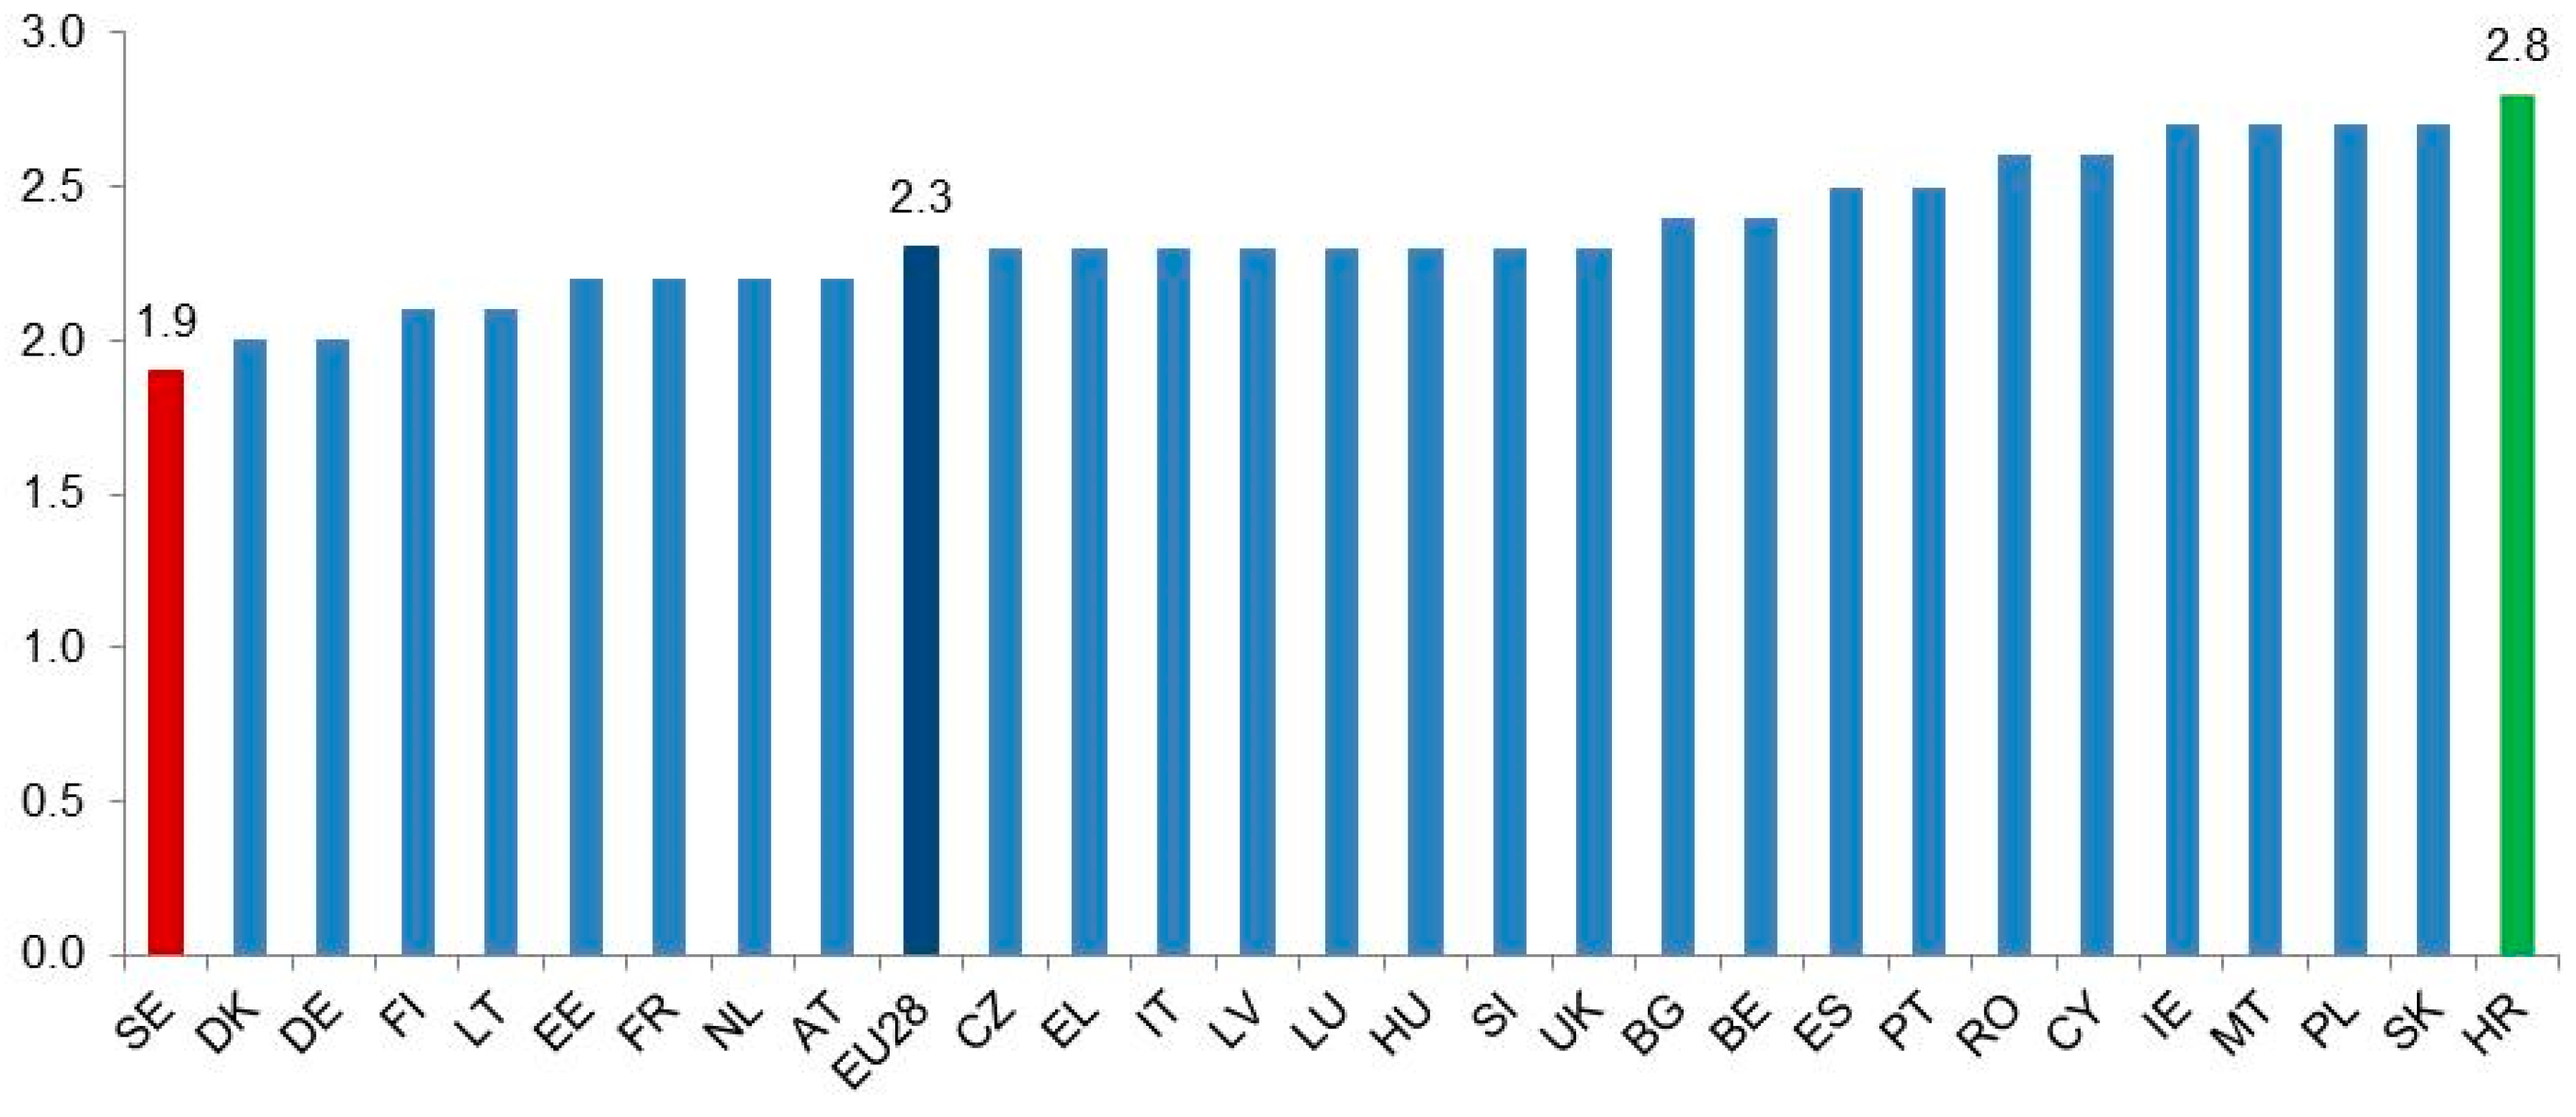
Another possible driver is the number of people living together in one household. The average number of persons per household in the EU-28 was 2.3 in the year of 2016. Sweden and Denmark have the lowest values (1.9 and 2.0) in the same year while Croatia has the highest (2.8), as shown in
Figure 11. The overall trend in Europe is the result of population growth in combination with the rise in the number of smaller households (households with fewer persons), which results in an increase in energy consumption per household during the period of 2000–2016. Consequently, this trend may result in a future increase in the total final residential energy consumption despite the moderate increase in population.
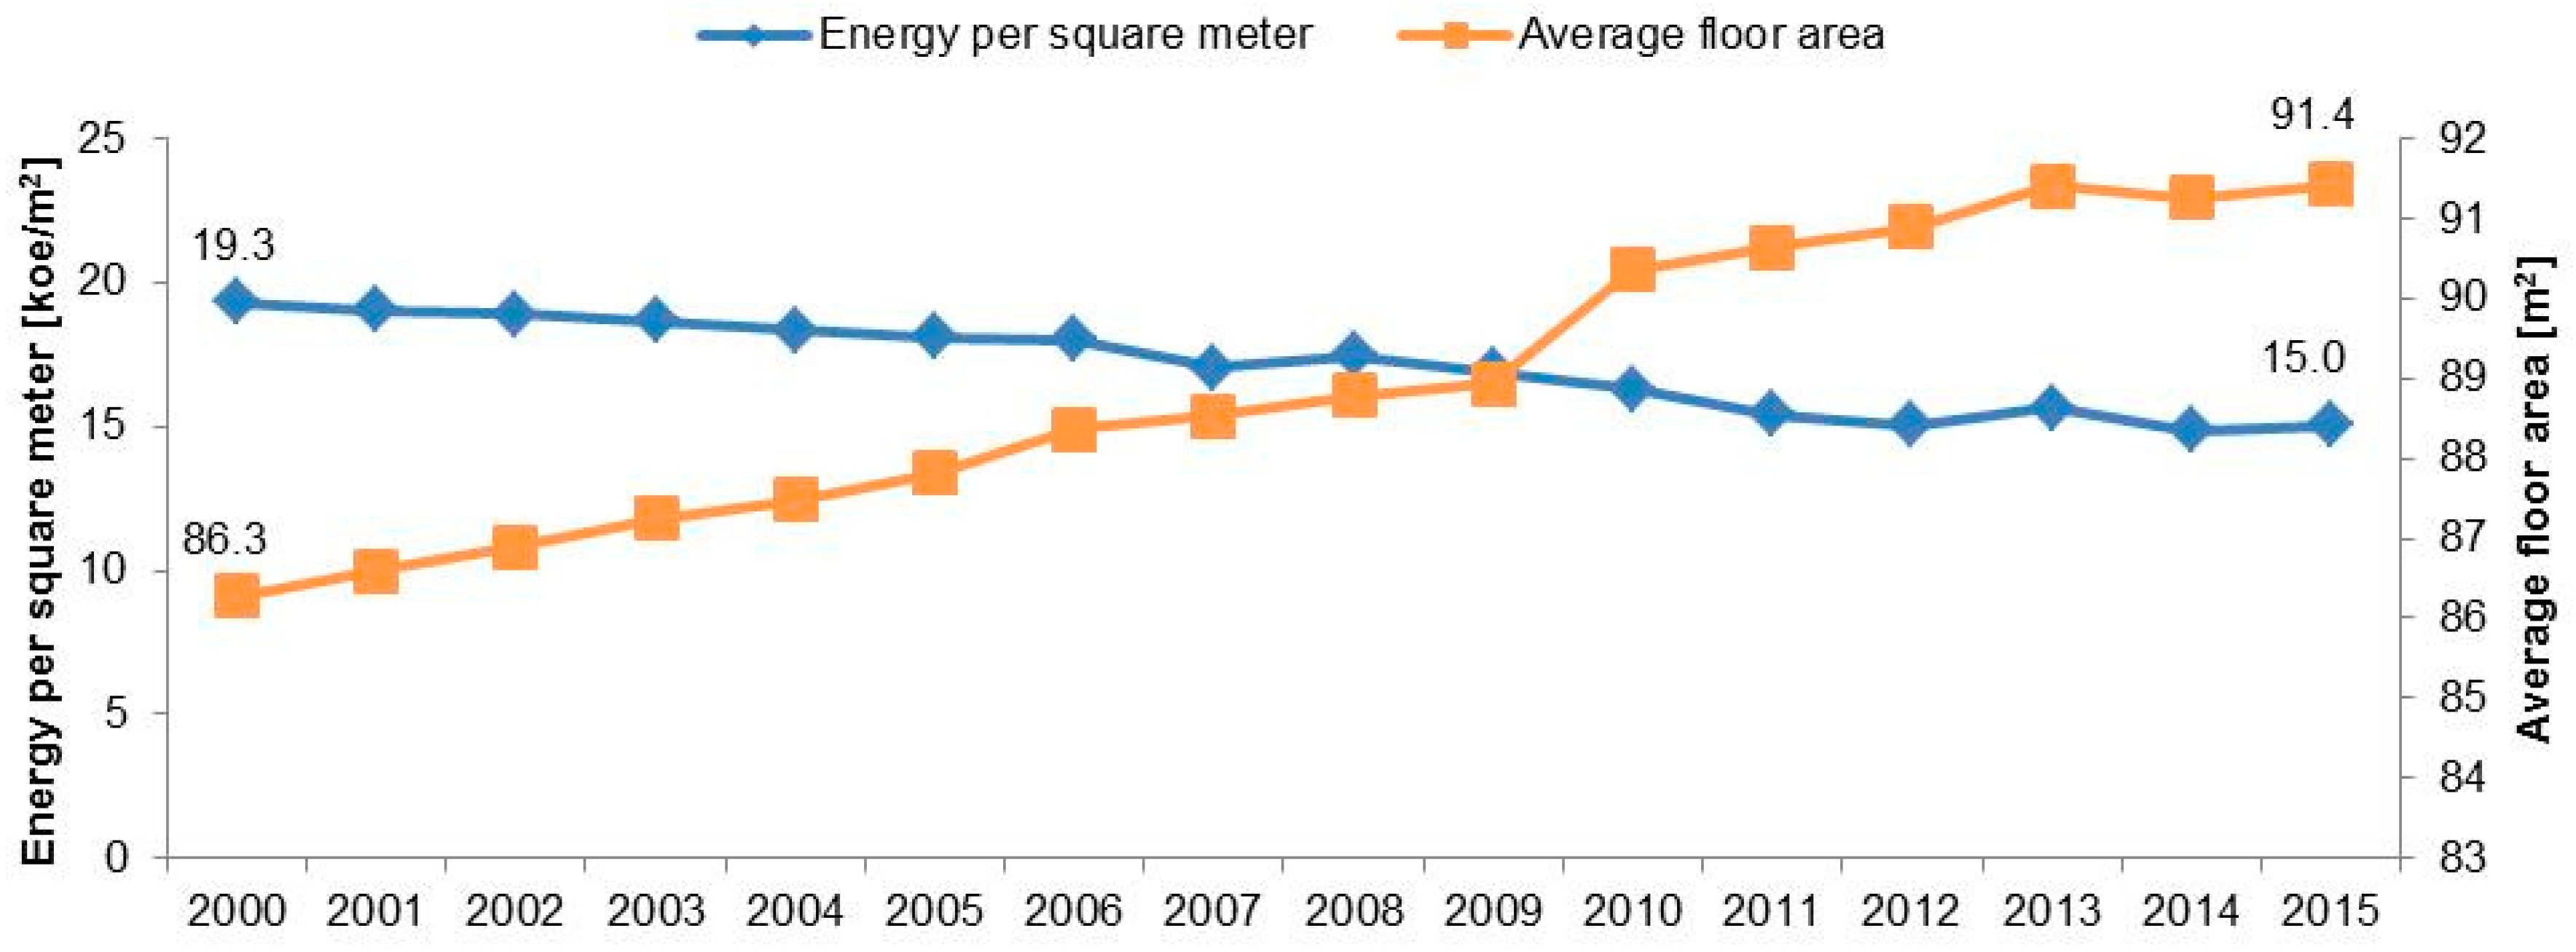
Figure 12 shows that between 2000 and 2015, the average floor area of EU-28 dwellings did not change considerably (increased by 5.1 m
2 or almost 6% in the whole period). The drop of 22% in the consumption per dwelling climatic corrected during the same period, which was calculated by Odyssee, thus cannot be explained by a higher population density or smaller houses. It might be the result of a higher share of more efficient equipment and appliances, and other improvements in building elements (e.g., envelopes and thermal systems). However, weather conditions may also have played an important role. The negative correlation between the two variables shown in this graph (estimated at around −0.98) is probably an indication of the fact that the observed progressive increase of floor areas has been accompanied by a decrease in energy consumption per unit of floor area of dwellings. This type of correlation has already been observed in the existing literature, mostly in relation to energy consumption for heating [
60,
61], and might be explained in terms of a higher energy efficiency resulting from smaller ‘surface-area-to-volume’ ratios (and hence heat losses) of larger dwellings. Further and more detailed studies would, however, be needed to verify this hypothesis on the data set used in the present analysis. The time period studied in this graph does not include 2016 as there are no available data for this year.
4.3.4. Climatic Conditions
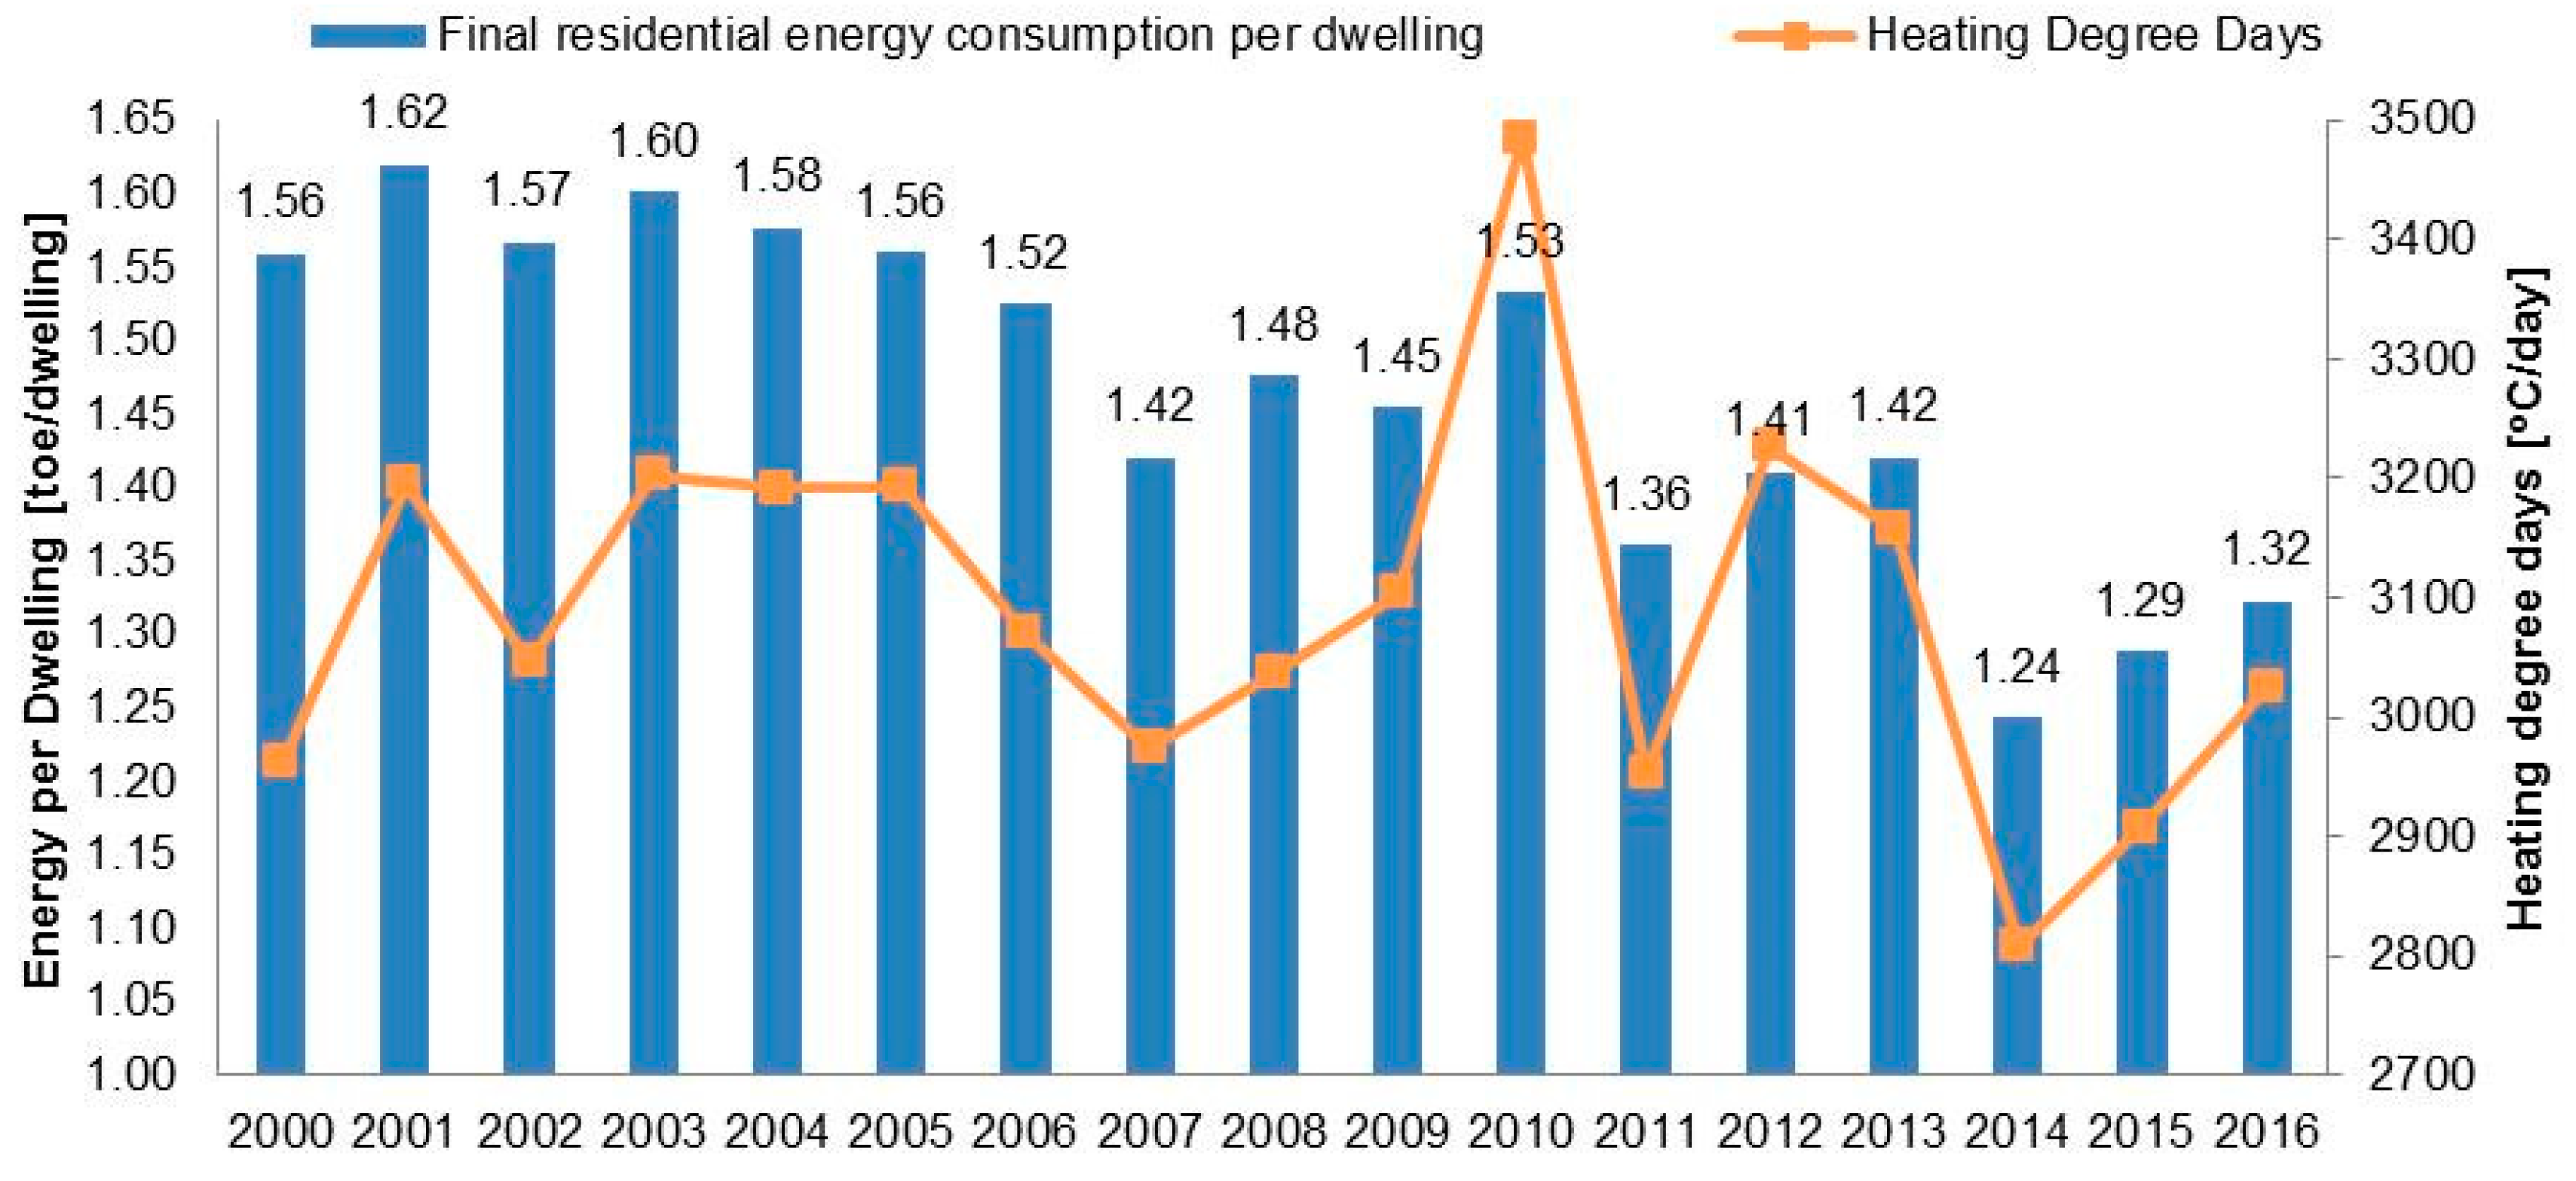
Environmental conditions, such as weather and climate, can affect energy consumption: For example, a cold winter or a hot summer can result in occasional consumption peaks. The residential FEC per dwelling has been dropping between 2000 and 2016 in the EU-28. In 2000, the residential consumption per dwelling was 1.56 toe. In 2016, the consumption per dwelling was 1.32 toe, corresponding to a fall of 18.2% (1% at CAGR). It is important to note that the final residential energy consumption per dwelling was calculated by the authors by dividing the final residential energy consumption by the stock of permanently occupied dwellings in the EU-28 as made available by Odyssee. Part of this decrease can be explained assuming that there is a correlation between the computed energy consumption per dwelling and the changing climatic conditions. A comparison between the total final energy consumption per dwelling and heating degree days is shown in
Figure 13. The EU-28 heating degree days are calculated by Eurostat based on the lowest mean air temperature not leading to air heating (15 °C). EU-28 heating degree days do not represent the average heating degree days of the EU-28 member states. Variations in the total final energy consumption per dwelling follow the HDD trend except for variations observed between 2008 and 2009 and between 2012–2013. These exceptions might be explained by the impact of other factors (notably income levels and occupants’ behaviour). In addition, the impact of the economic crisis on consumption in 2009 may explain the negative correlation between the final energy consumption and HDD, due to the drop in economic indicators registered that year.
4.3.5. Correlations
The following set of four figures aims to investigate how residential consumption is correlated with various climatic and economic conditions. The analysis provides some evidence about the strength and direction of the linear relationship between our variables of interest, and it does not have any predictive claim.
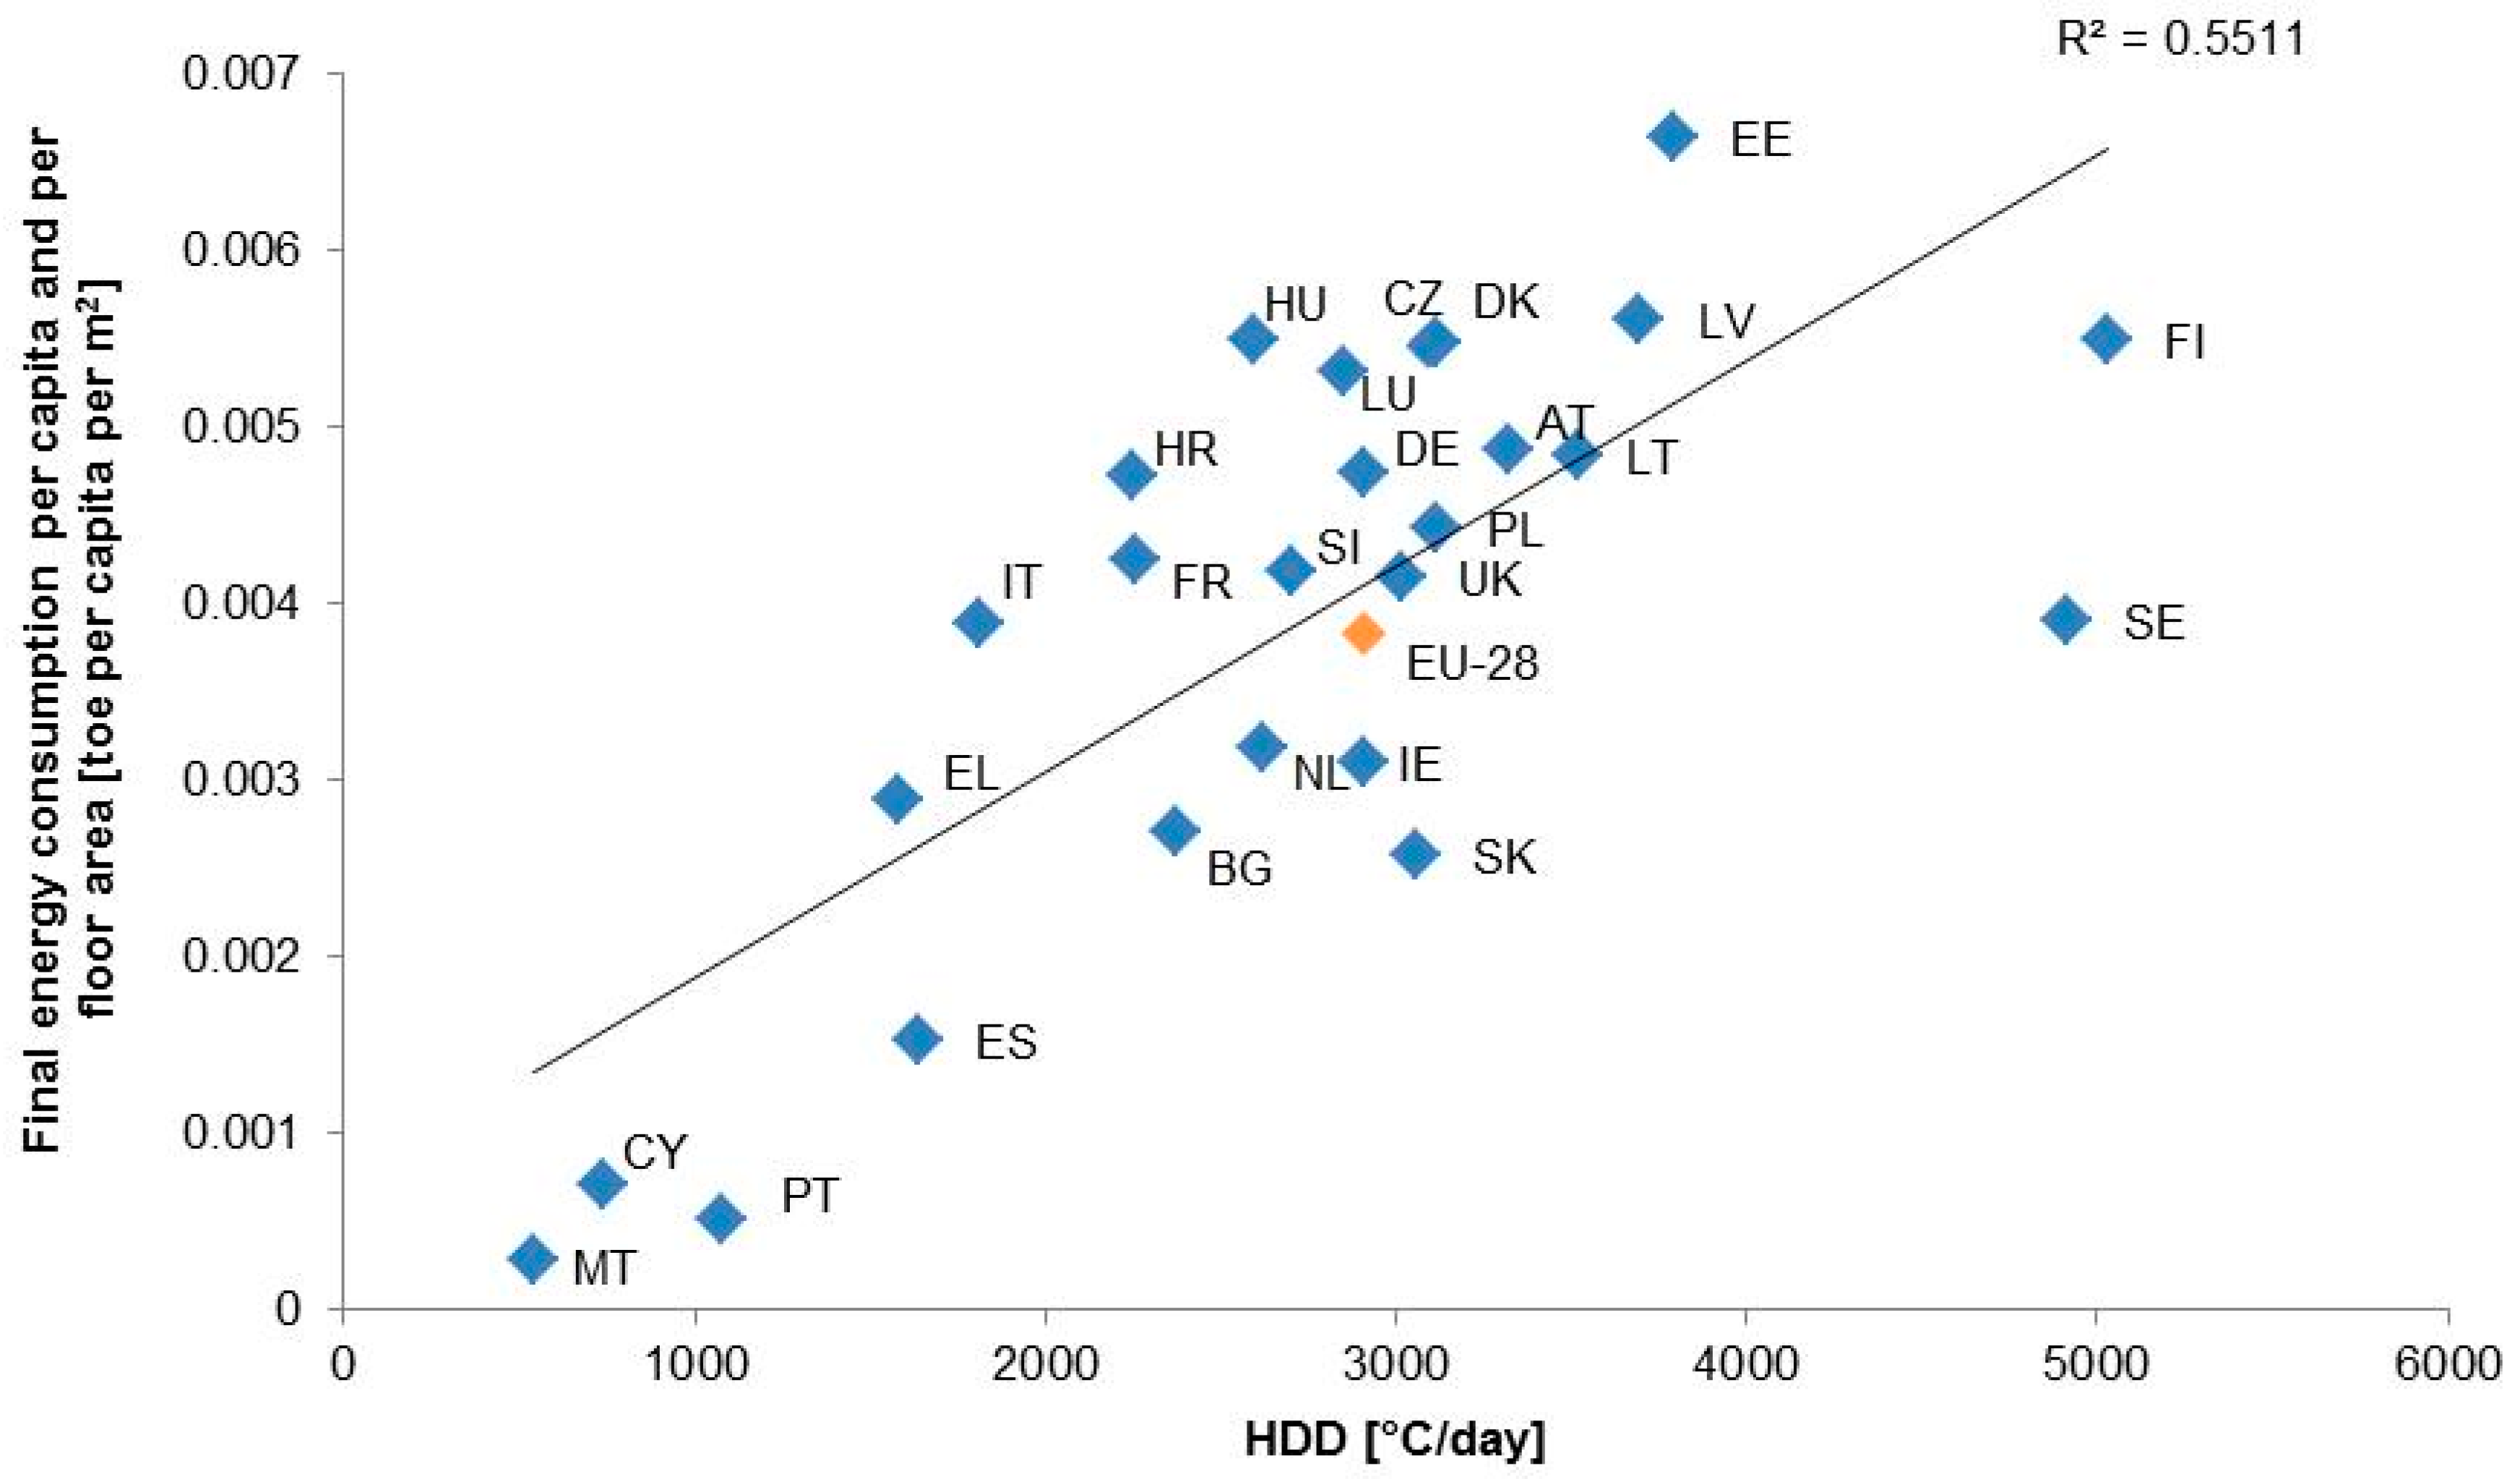
Figure 14 shows the correlation between residential energy consumption for space heating per capita and per m
2 and HDD in the EU-28 member states for the year of 2015. The selection of the year studied in this graph was made based on the availability of the data. Belgium and Romania were removed from the final results due to incomplete data. The first evidence is that, as expected, countries with a colder climate have, on average, higher levels of residential consumption. The second and more interesting evidence is that countries with the same climatic conditions can perform very differently in terms of residential consumption. Eastern European countries show a higher level of residential consumption with respect to the average. Among the countries with a colder climate, Finland and Sweden provide examples of a relatively low level of residential energy consumption. The behavioural, cultural and social habits, and lifestyle also have an impact on the energy consumption patterns in these countries. Nevertheless, it is impossible to perform a quantitative assessment of this impact due to the lack of data and, if available, due to the nature of these data, which are often not comparable among countries. The value of the R squared in
Figure 14 is around 0.55. This confirms that a linear relationship between energy consumption per capita and per m
2 and HDD exists and is positive, in line with our hypothesis.
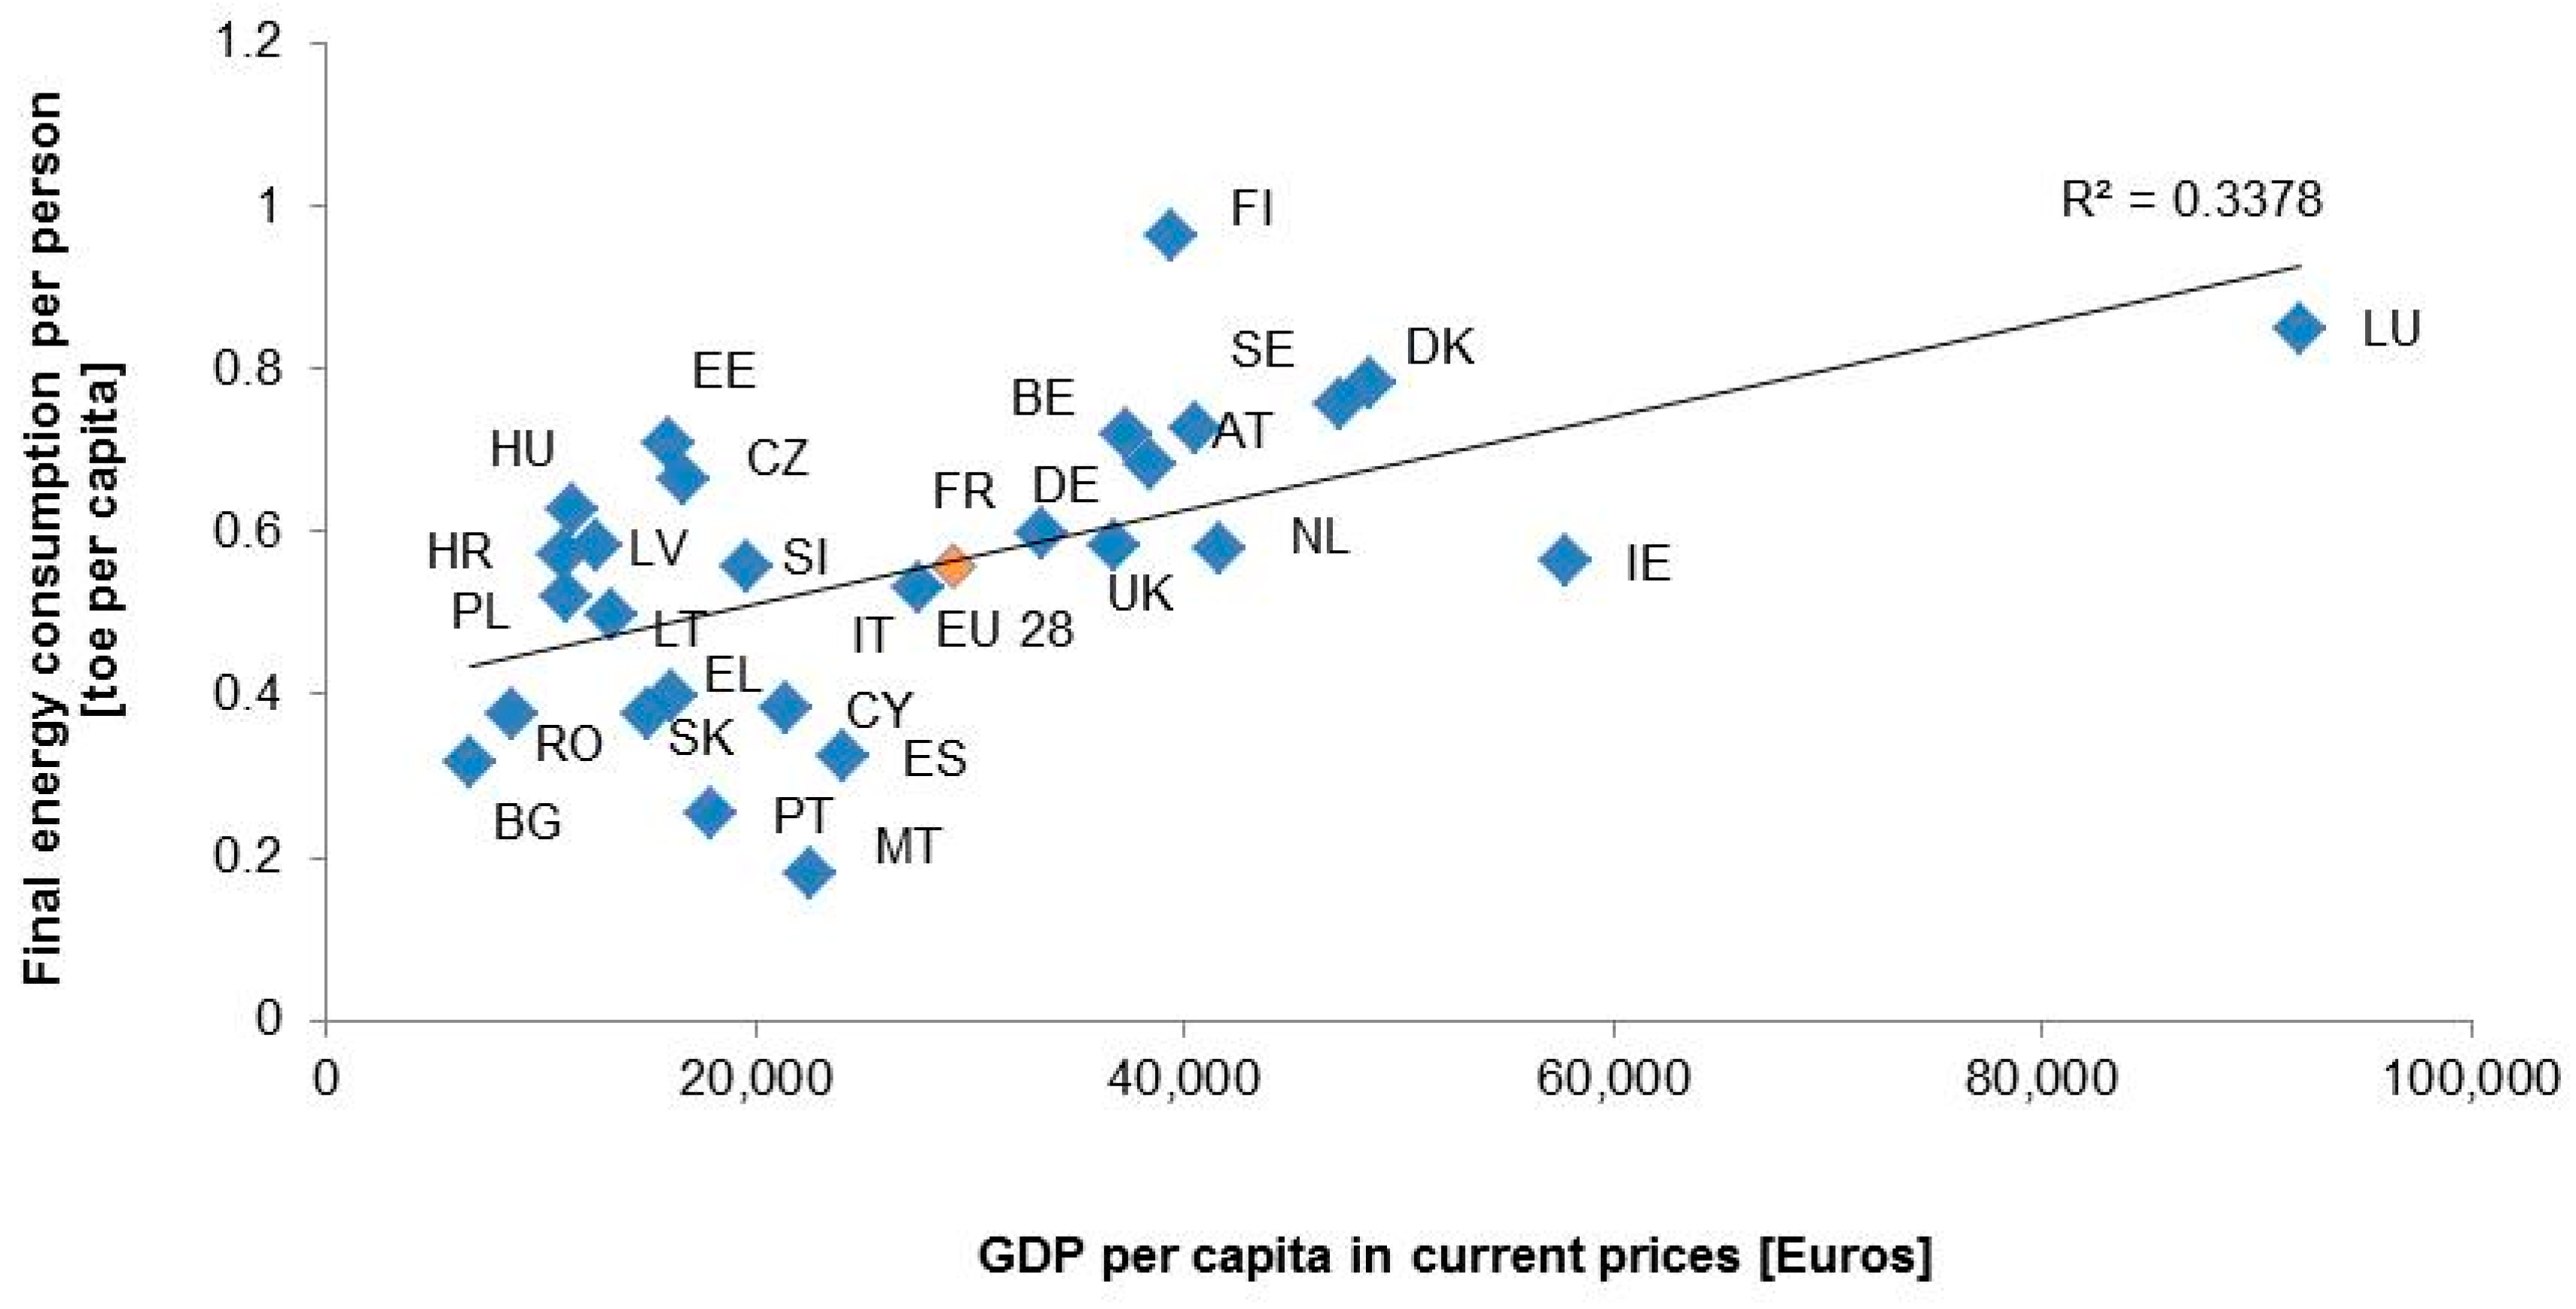
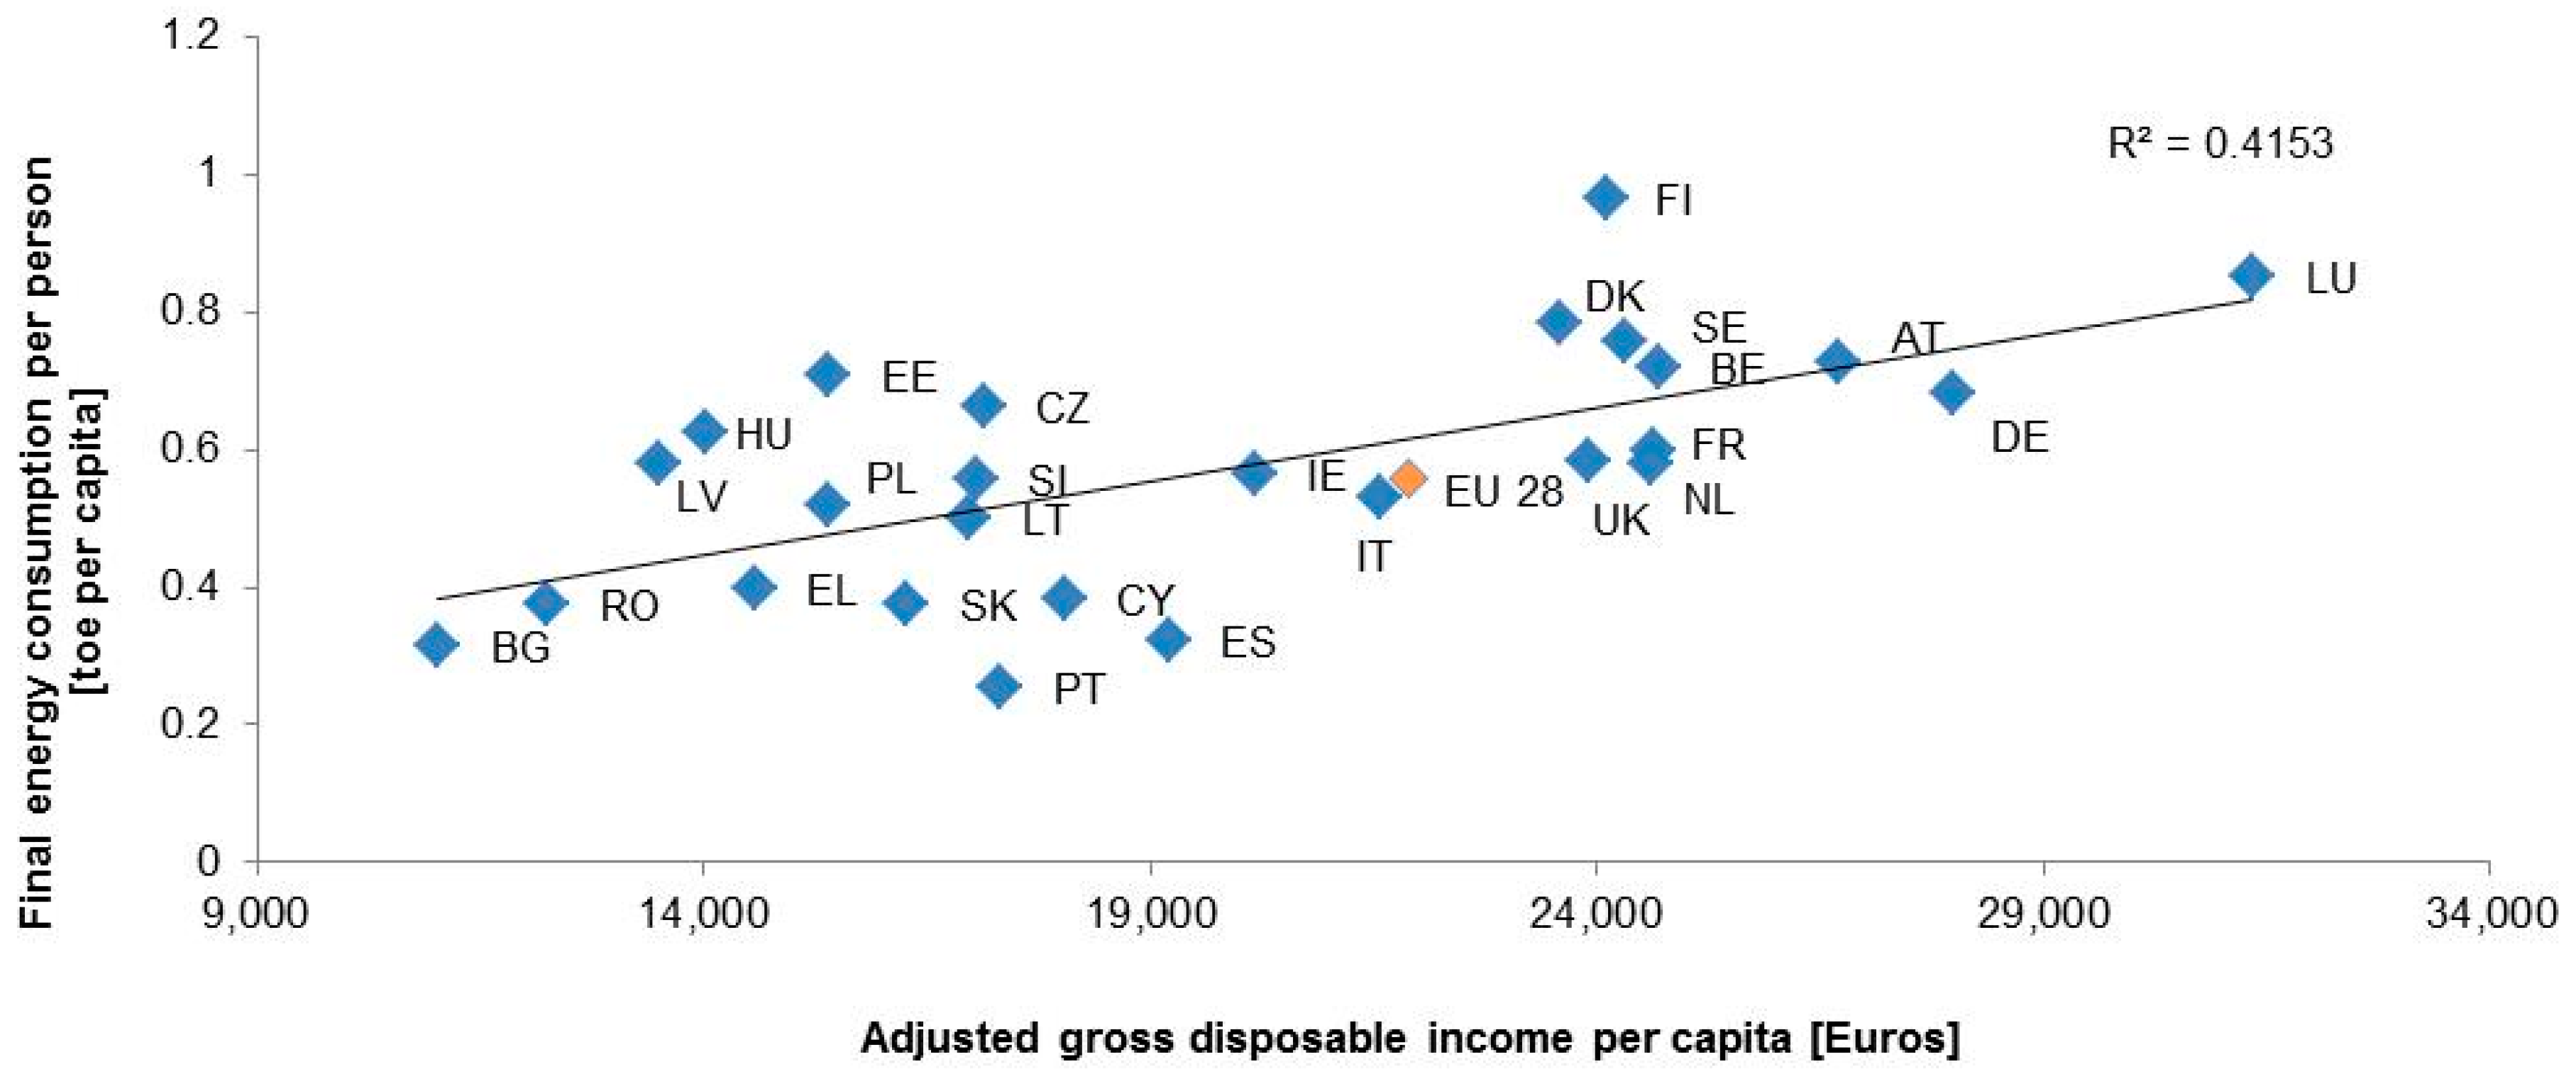
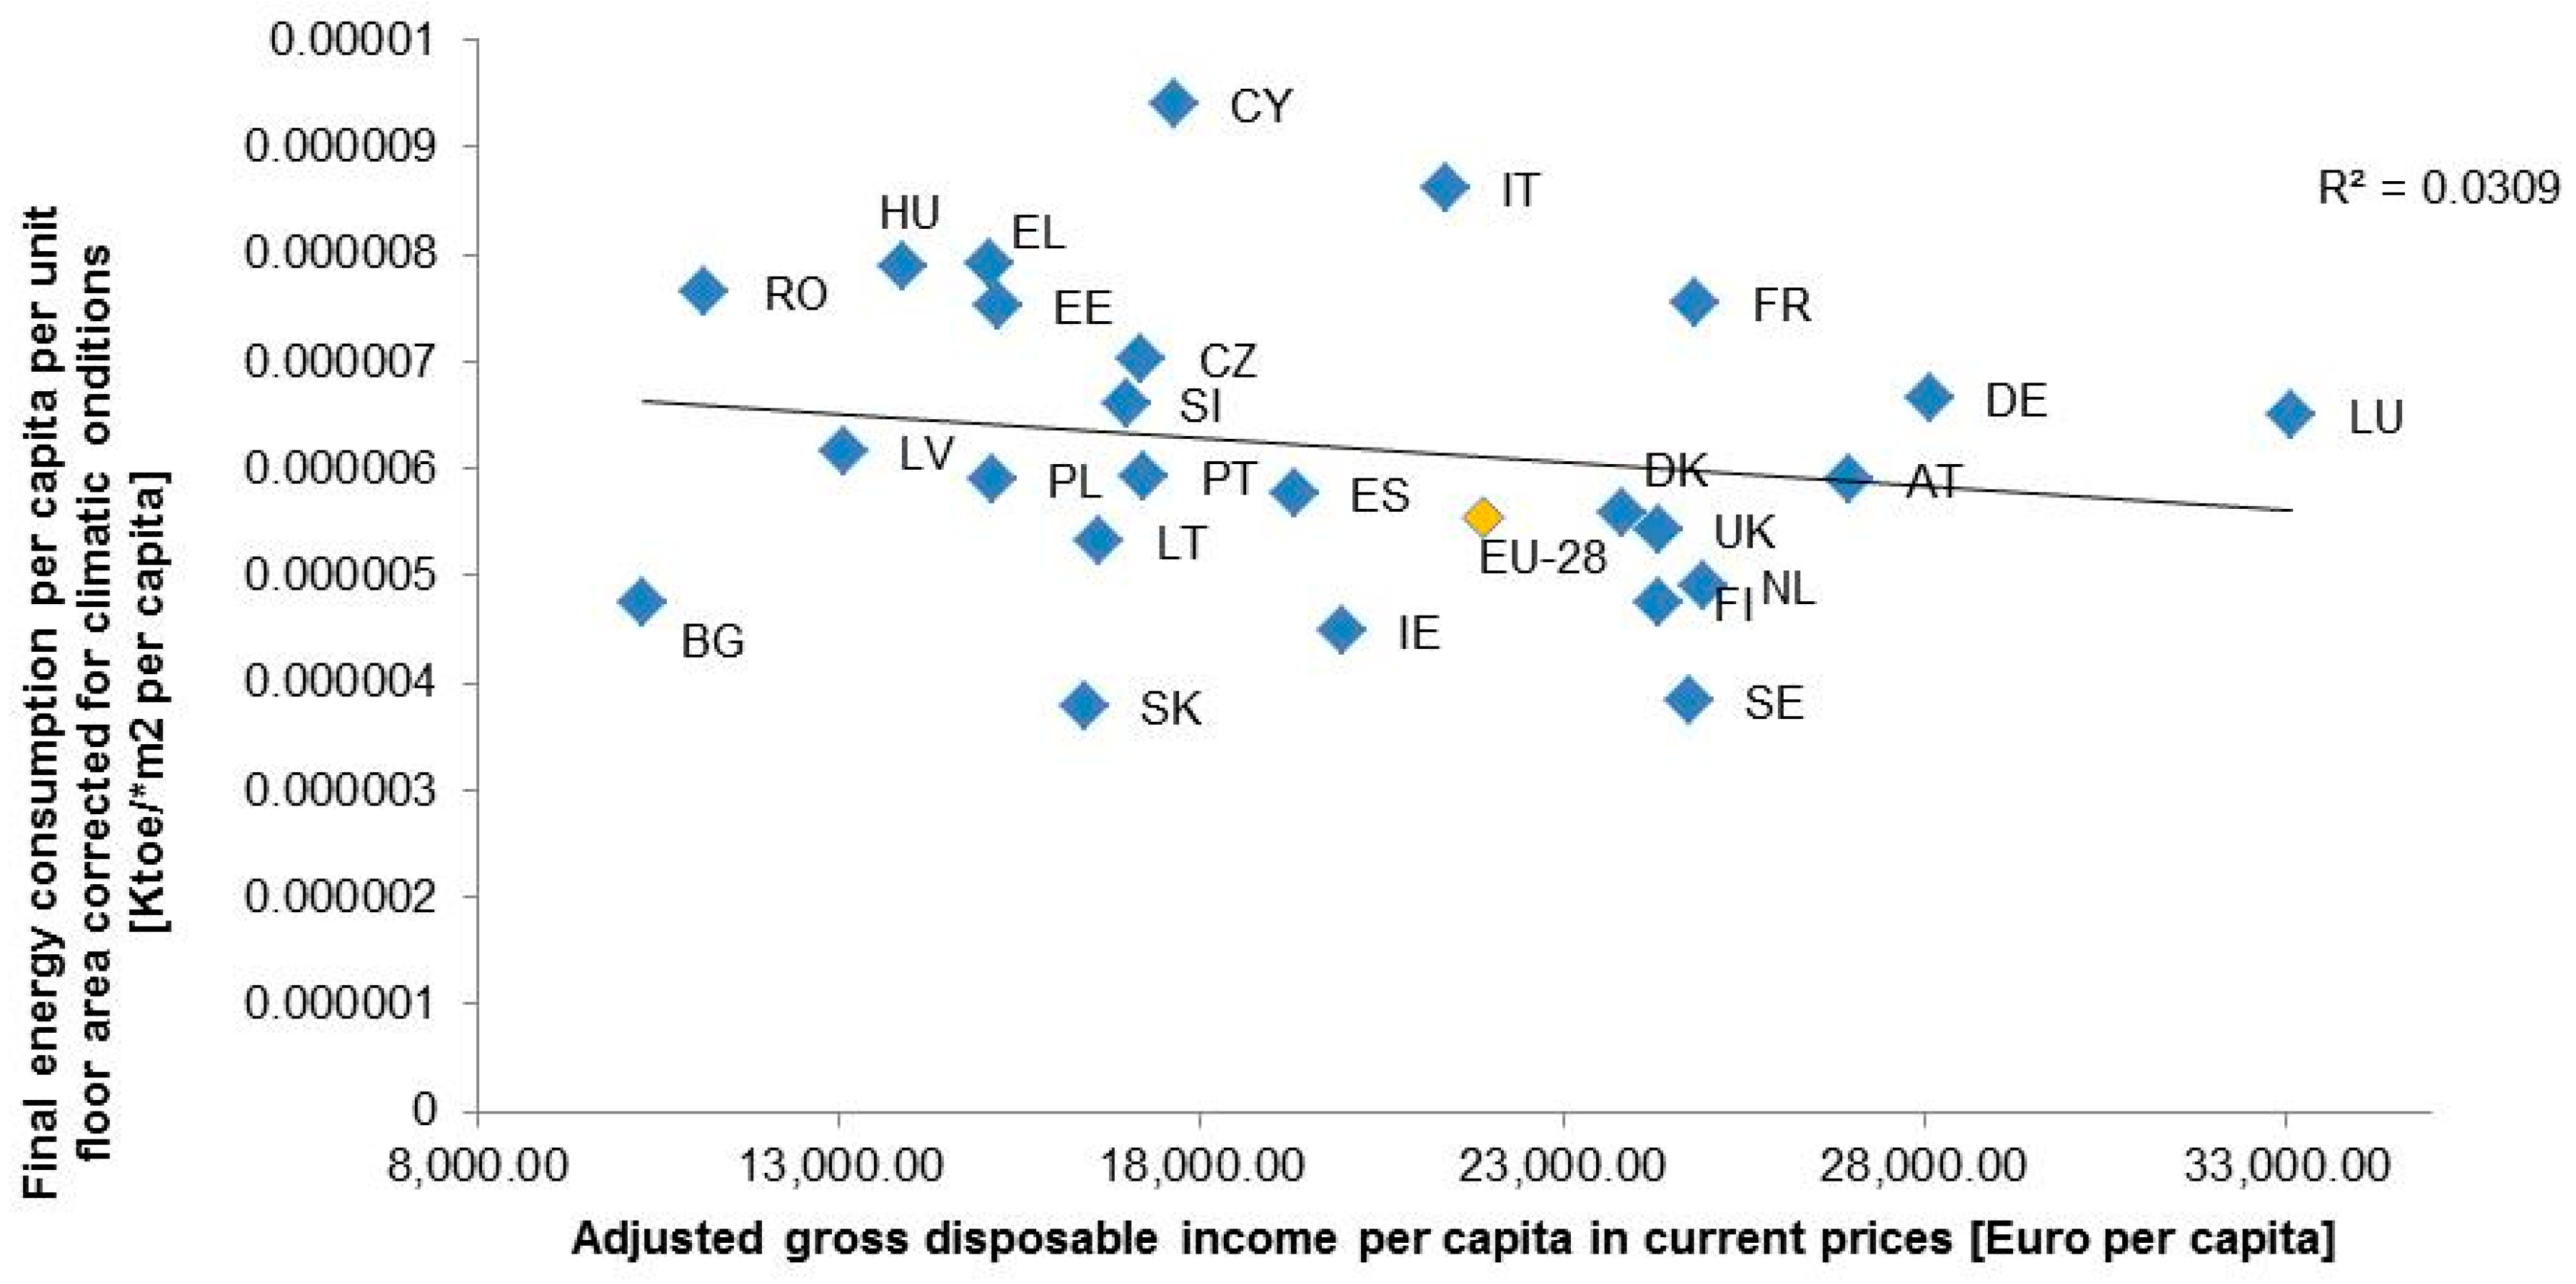
Figure 15 shows the correlation between residential final energy consumption per capita and GDP per capita in the EU-28 member states for the year of 2016. From the figure, it would seem that in some cases, countries with higher GDP per capita values (i.e., countries with better economic conditions) tend to consume more energy in the residential sector. However, there are notable differences in energy consumption between member states with similar levels of GDP per capita. Regarding countries below the trend-line with relatively high GDP per capita values, but also with increased heating needs due to their weather conditions, such as Luxemburg (2967.47 HDD, above EU-28 HDD average), it is possible to argue that they might have made more efficient use of energy sources. Similar conclusions can be gathered from
Figure 16, in which a slightly better correlation between the final residential energy per capita and adjusted disposable income (with a lower distance between the fitted line and all of the data points) is presented. This confirms that adjusted gross disposable income is a more representative economic indicator compared to GDP for the analysis of the residential energy consumption trends. It should be noted that Croatia and Malta were eliminated from
Figure 16 due to incomplete data. Looking at both figures, it is possible to observe that some points are close to the line, but other points are far from it, which indicates only a moderate linear relationship between the variables. It is also worth noticing that correlation coefficients are very sensitive to extreme data values. Even if the R squared value is below 0.5 in both cases, the slope of the regression lines is evidence showing the tendency of economically developed countries to consume more energy. Moving beyond a simple correlation by adding other explanatory variables would allow us to better capture the variability among data and to explain causality. However, inferring causality is out of the scope of this article and we lack some relevant behavioural variables that are crucial to explaining residential consumption patterns.
The analysis conducted so far demonstrates that every determinant discussed above influences in a certain way (but never in a definitive way) the residential final energy consumptions. Hence, it is plausible to try to compare the national values considering all the aforementioned influential factors in order to derive general considerations about how the energy policies implemented resulted in a more efficient use of energy. This could be achieved by calculating the final energy consumption normalized by indicators corresponding to the mentioned factors (HDD, average floor area, and population).
Figure 17 shows that the degree of correlation between the adjusted gross disposable income per capita and the climatic corrected residential final energy consumption per capita and per average floor area is very low. A low correlation coefficient does not necessarily imply that no relationship exists, but it simply suggests that this relationship is not linear. Consequently, based on this evidence, it is difficult to derive conclusions regarding the impact of disposable income on the “corrected” residential energy consumption trends. However, as before, we can interpret the negative correlation. The change in the sign of the correlation is important as it shows that the results change significantly when climatic data are applied. Indeed, countries with a colder climate, such as Denmark, Sweden, and Finland, are found below the trendline in this graph. To apply the climatic correction, the final residential energy consumption was divided by the climatic factor; that is, the heating degree days of a member state for the year of 2015 divided by the mean heating degree days of the EU-28 member states for the same year. 2015 was selected based on the availability of data. It should be noted that Malta, Croatia, and Belgium were removed from the graph due to incomplete data.
4.3.6. Analysis of a New Indicator: Climate Normalised Specific Residential FEC per Adjusted Gross Disposable Income
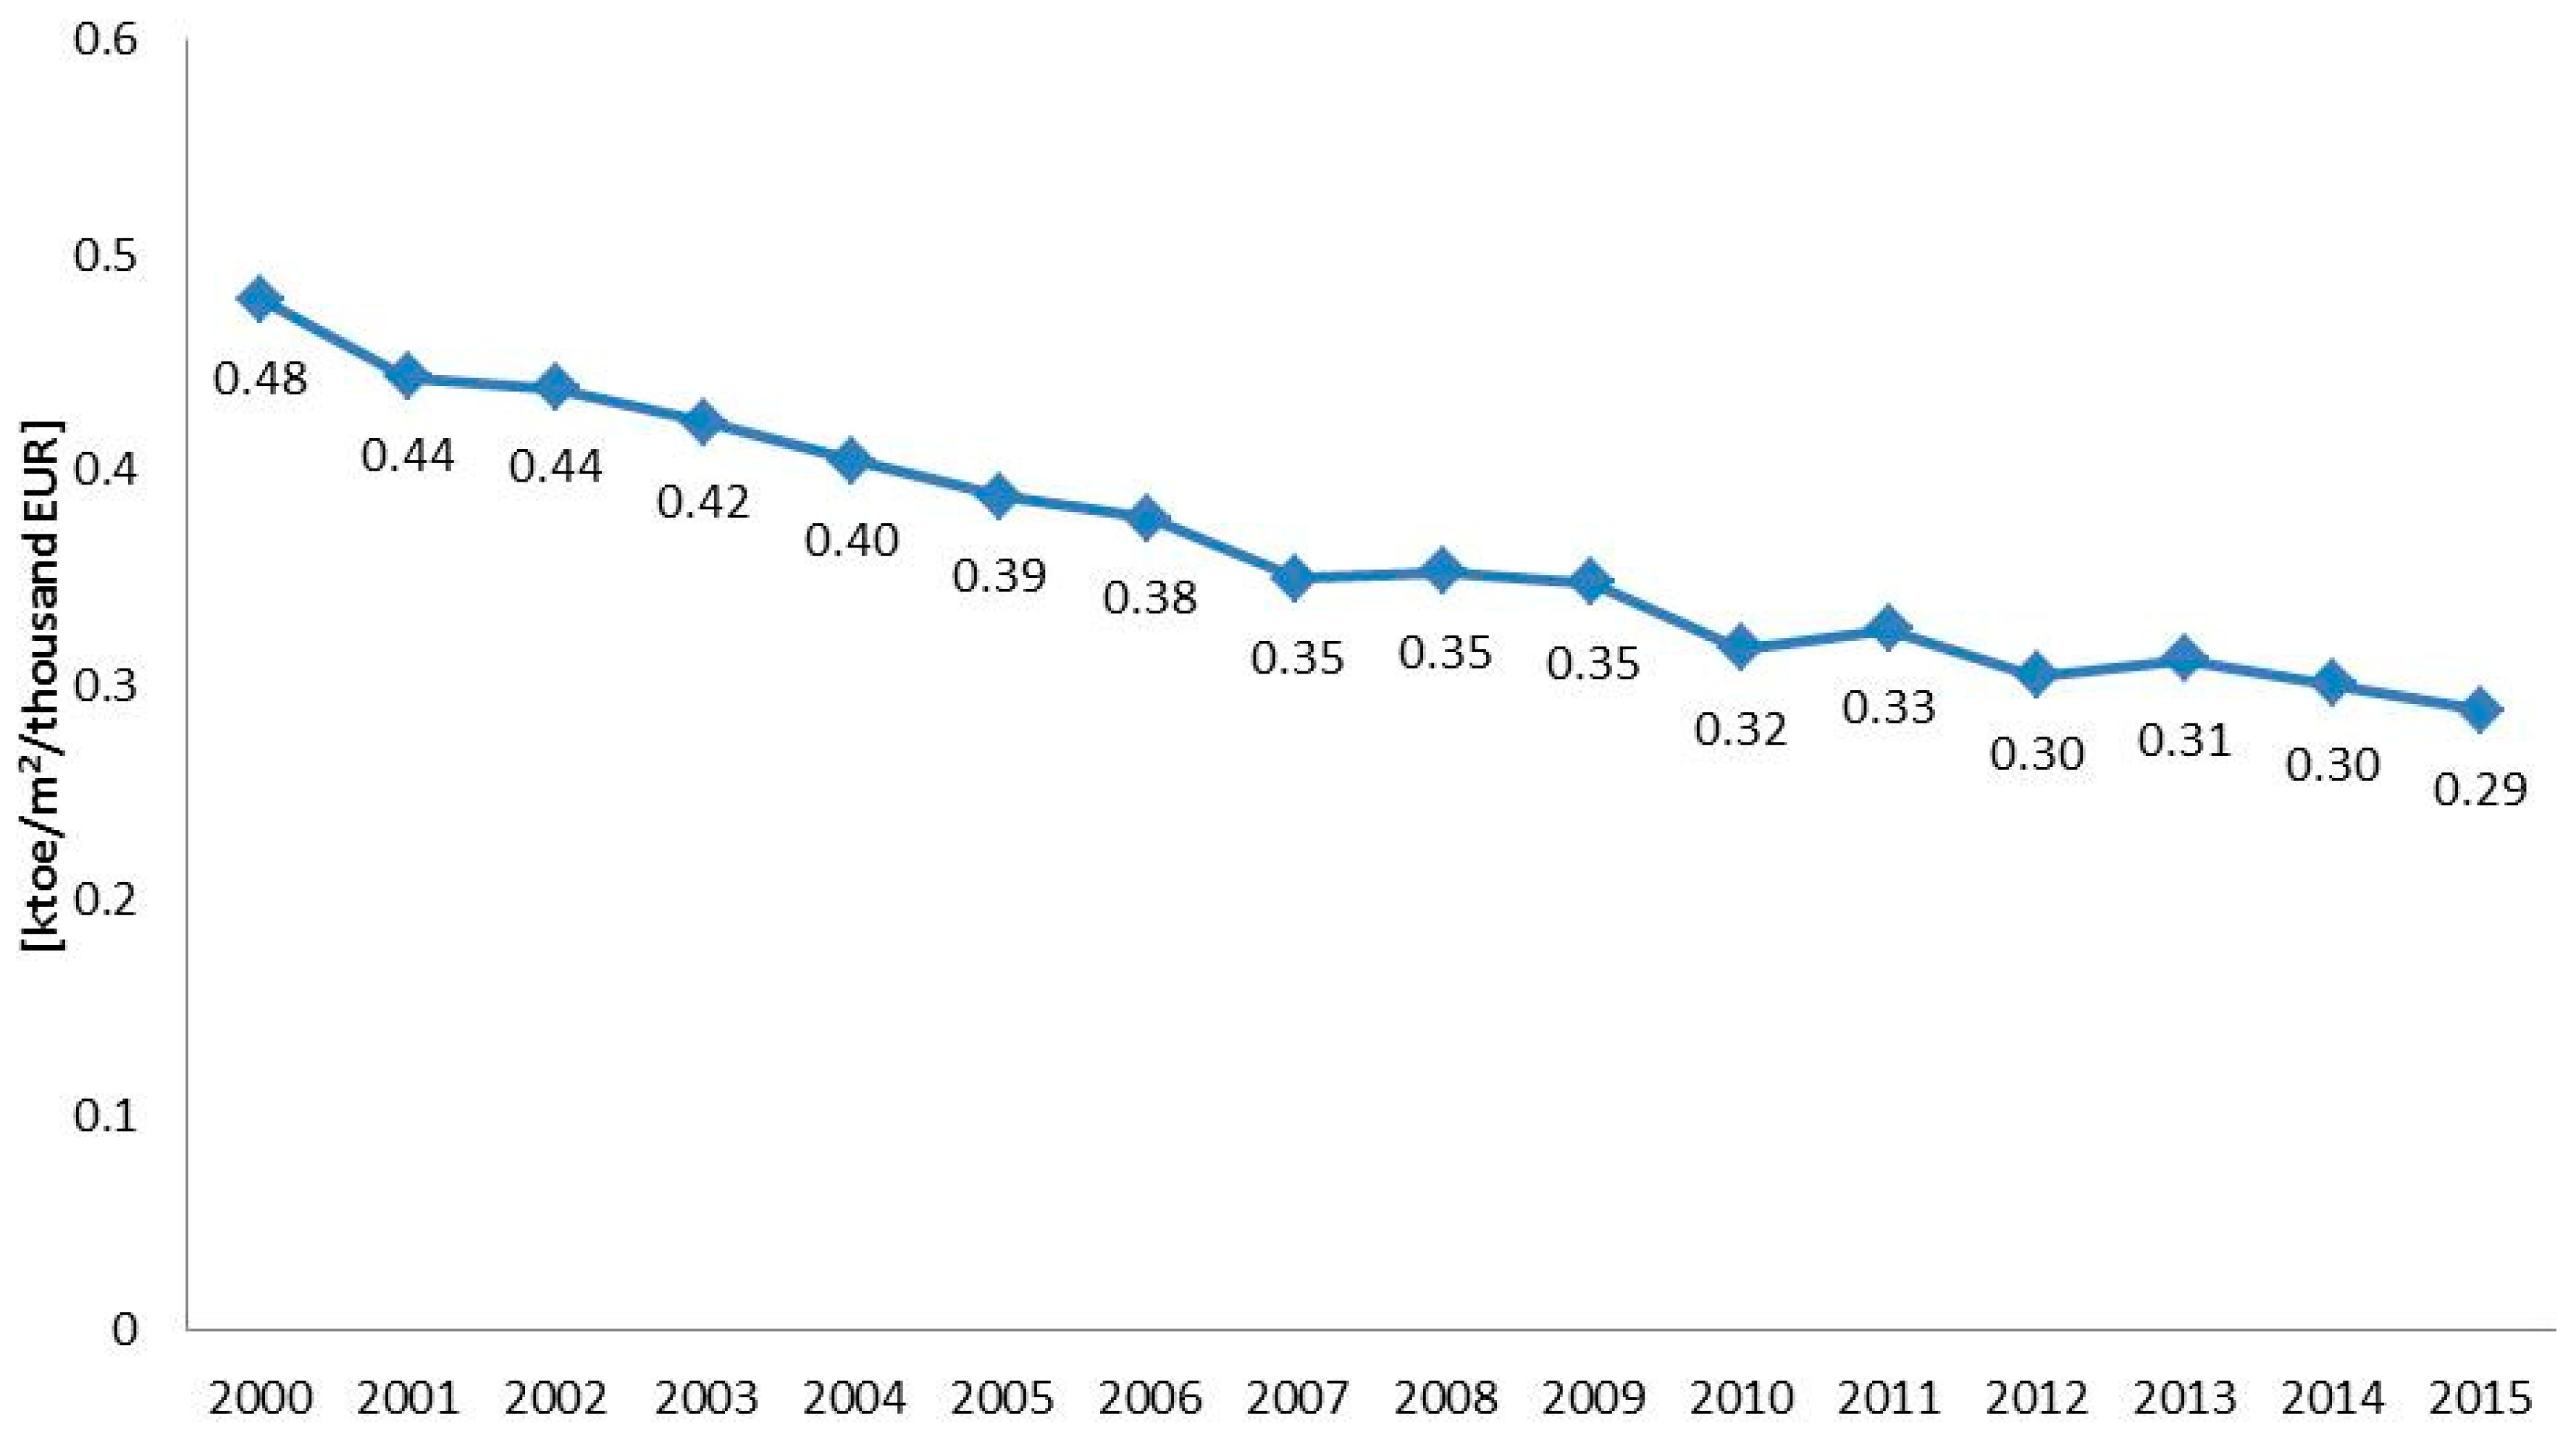
Figure 18 shows the trends of the indicator proposed by the authors for the period of 2000–2015. As discussed in
Section 3, this represents the final residential energy consumption adjusted to take into account all the factors mentioned above (adjusted gross disposable income per dwelling, climatic conditions, and floor area of dwellings). The climatic correction was applied by dividing the heating degree days for a specific year by the mean heating degree days for the period of 2000–2016. The results show a steady decline over the examined period, which resulted in an
drop of nearly 40% (or 3.4% at CAGR) in 2015 compared to 2000 (from 0.48 ktoe/m
2/thousand EUR in 2000 to 0.29 ktoe/m
2/thousand EUR in 2015). As a result of the corrections made, a more linear
trend is observed in
Figure 18. While the evolution of residential
without any corrections does not follow any specific path (a very low R
2 value of 0.26 is given for the linear relationship between residential
and time in
Figure 3), the evolution of
over time shown in
Figure 18 can be described by a clear linear relationship with an R
2 value of 0.96. By making all the aforementioned adjustments, we are thus capable of removing the yearly residential
fluctuations that are associated with variations in economic, climatic, and dwelling conditions.
Our analysis indicates that at the EU level, the impact of technological and policy changes over the period of 2000–2015 resulted in a constant annual
decline rate of 0.0127 ktoe/m
2/thousand EUR (
Figure 18).
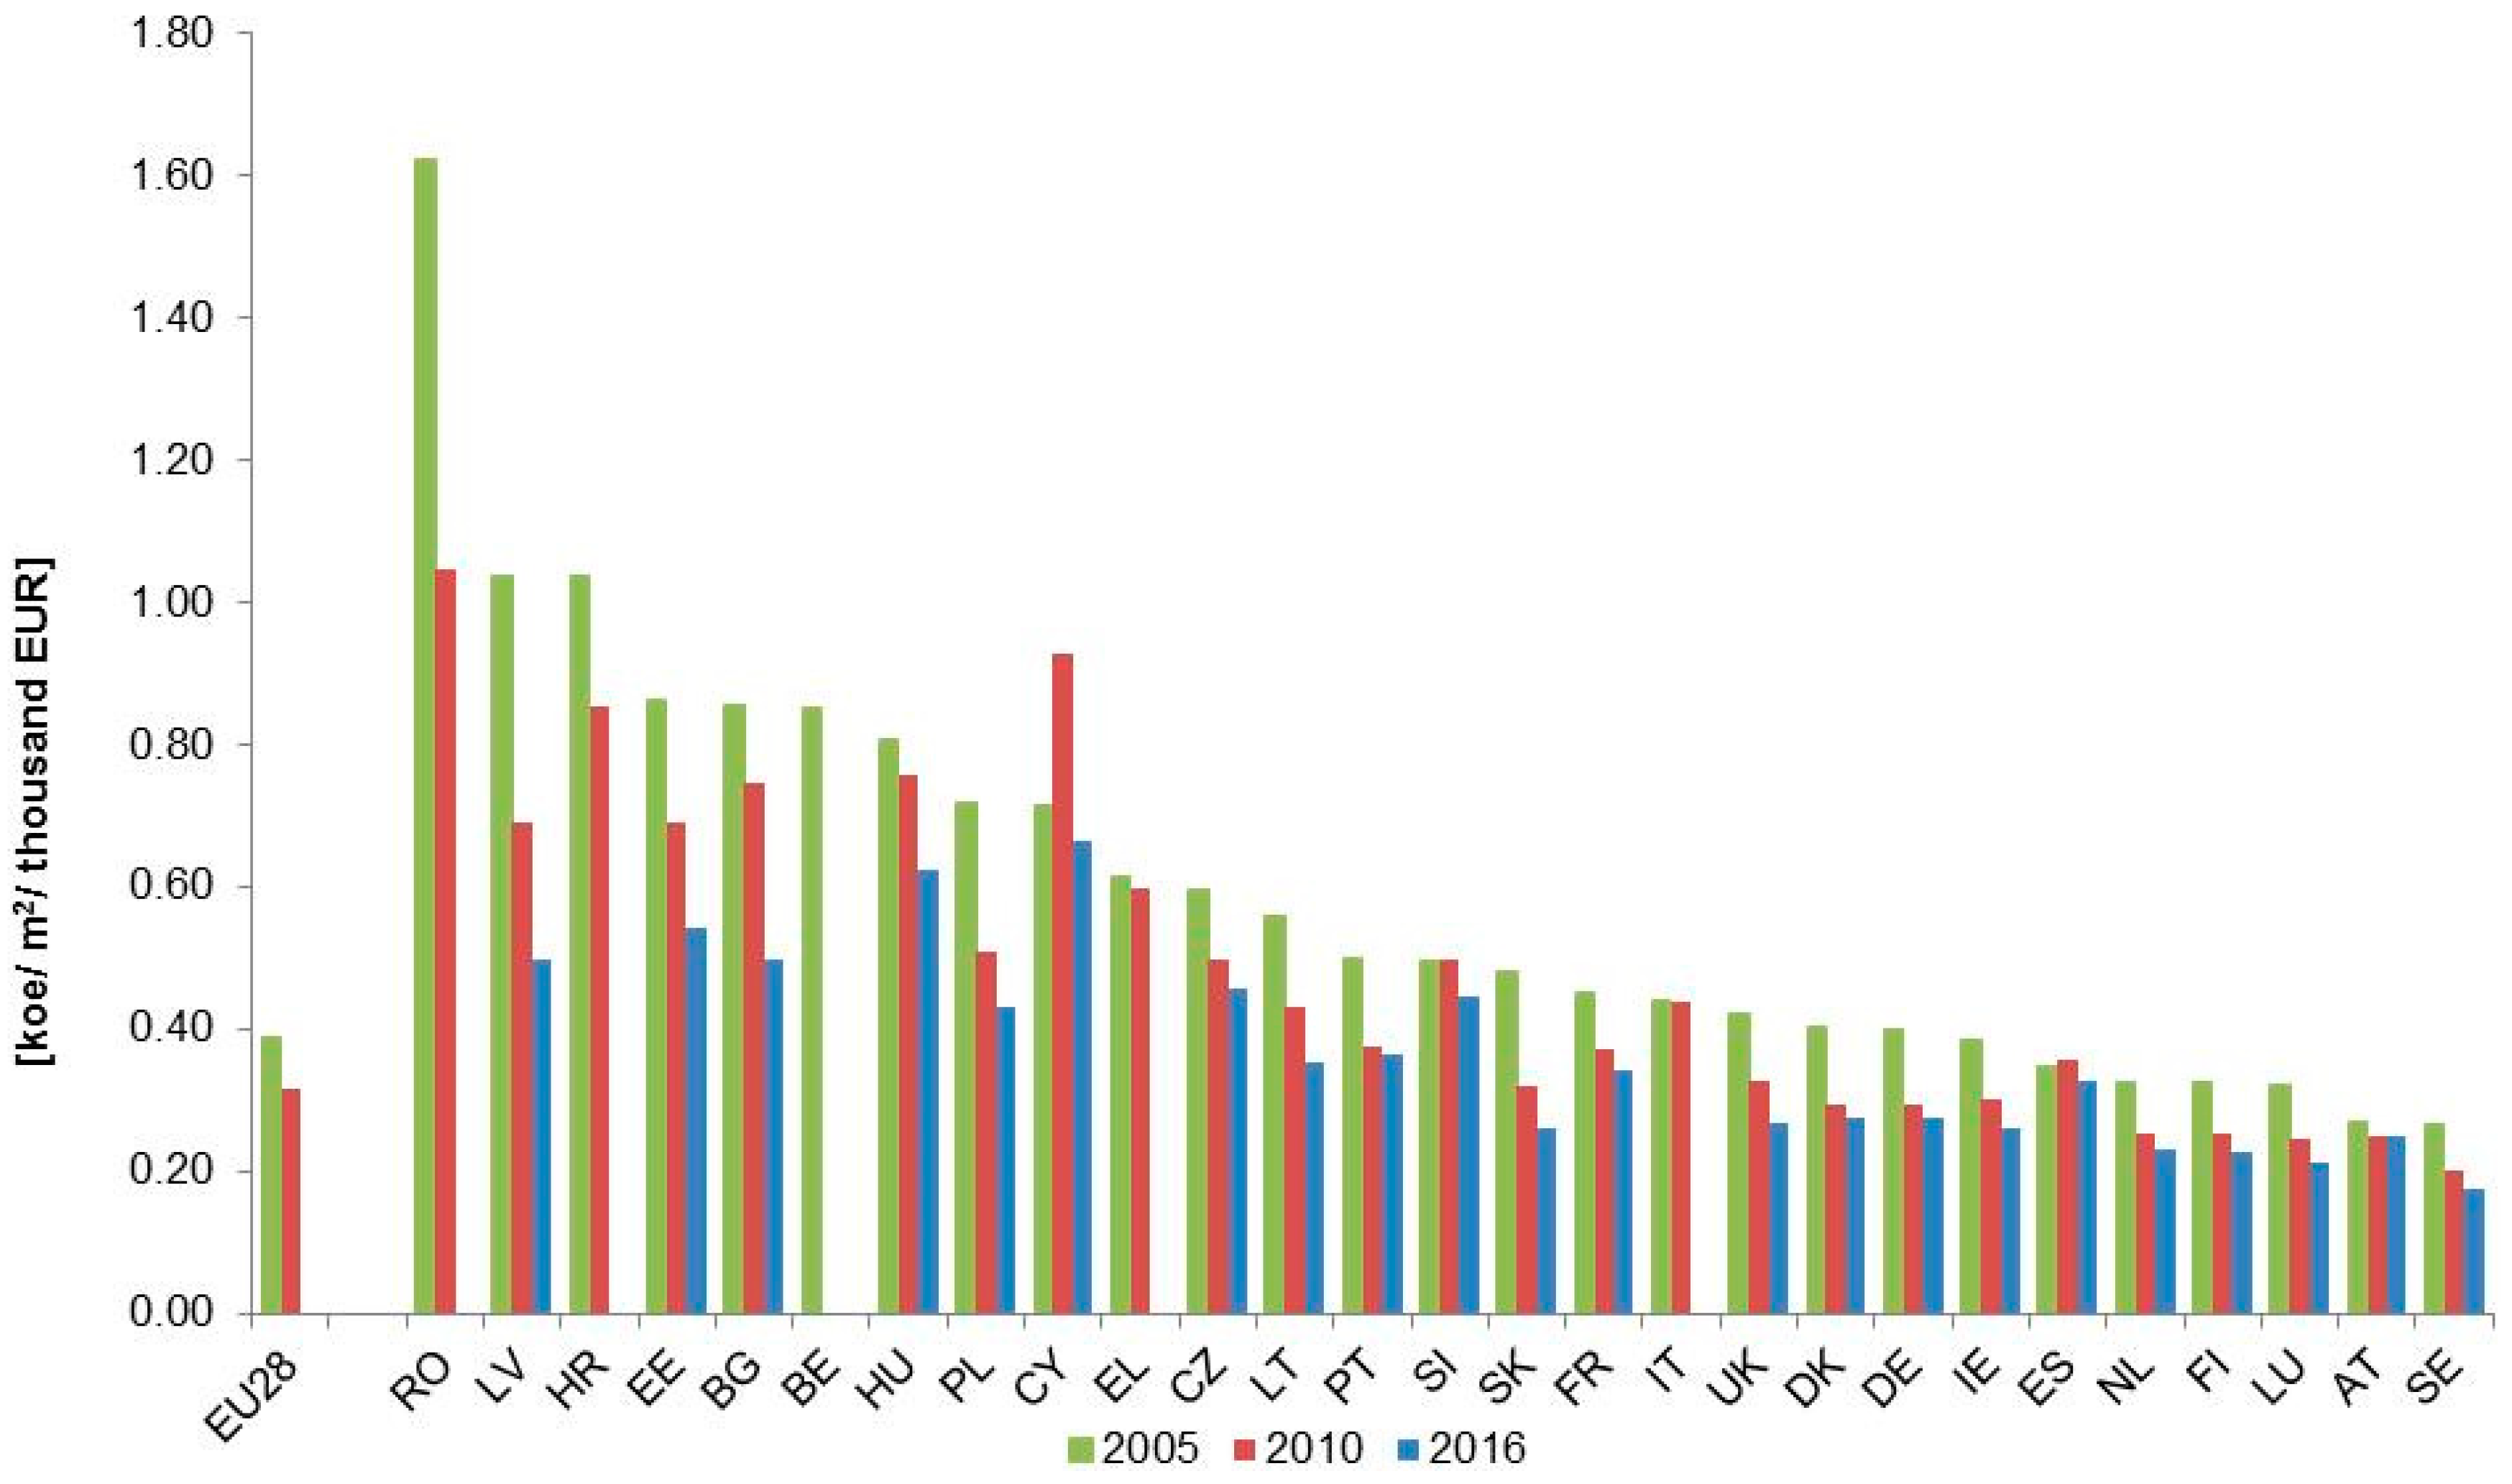
Figure 19 shows the specific residential FEC corrected for climatic and economic conditions for each member state. To harmonise geographical-related climatic variations in our analysis, the climatic correction was expressed as the ratio of the actual heating degree days of a given country and the mean heating degree days over the reference period of the EU. As shown in
Figure 19, a considerably different energy efficiency ranking of the member states is given compared to
Figure 5. By introducing climatic, economic, and dwelling-related corrections, Finland, Sweden, Austria, and Luxembourg—some of the highest consumers of energy based on our
Figure 5 analysis—are now the four countries with the lowest level of final residential energy consumption. At the same time, countries that performed very well in terms of absolute values of final energy consumption are ranked among the countries that consume the most according to
Figure 19. It should be noted that Malta was excluded from the figure due to the unavailability of data.
4.3.7. Decomposition Analysis
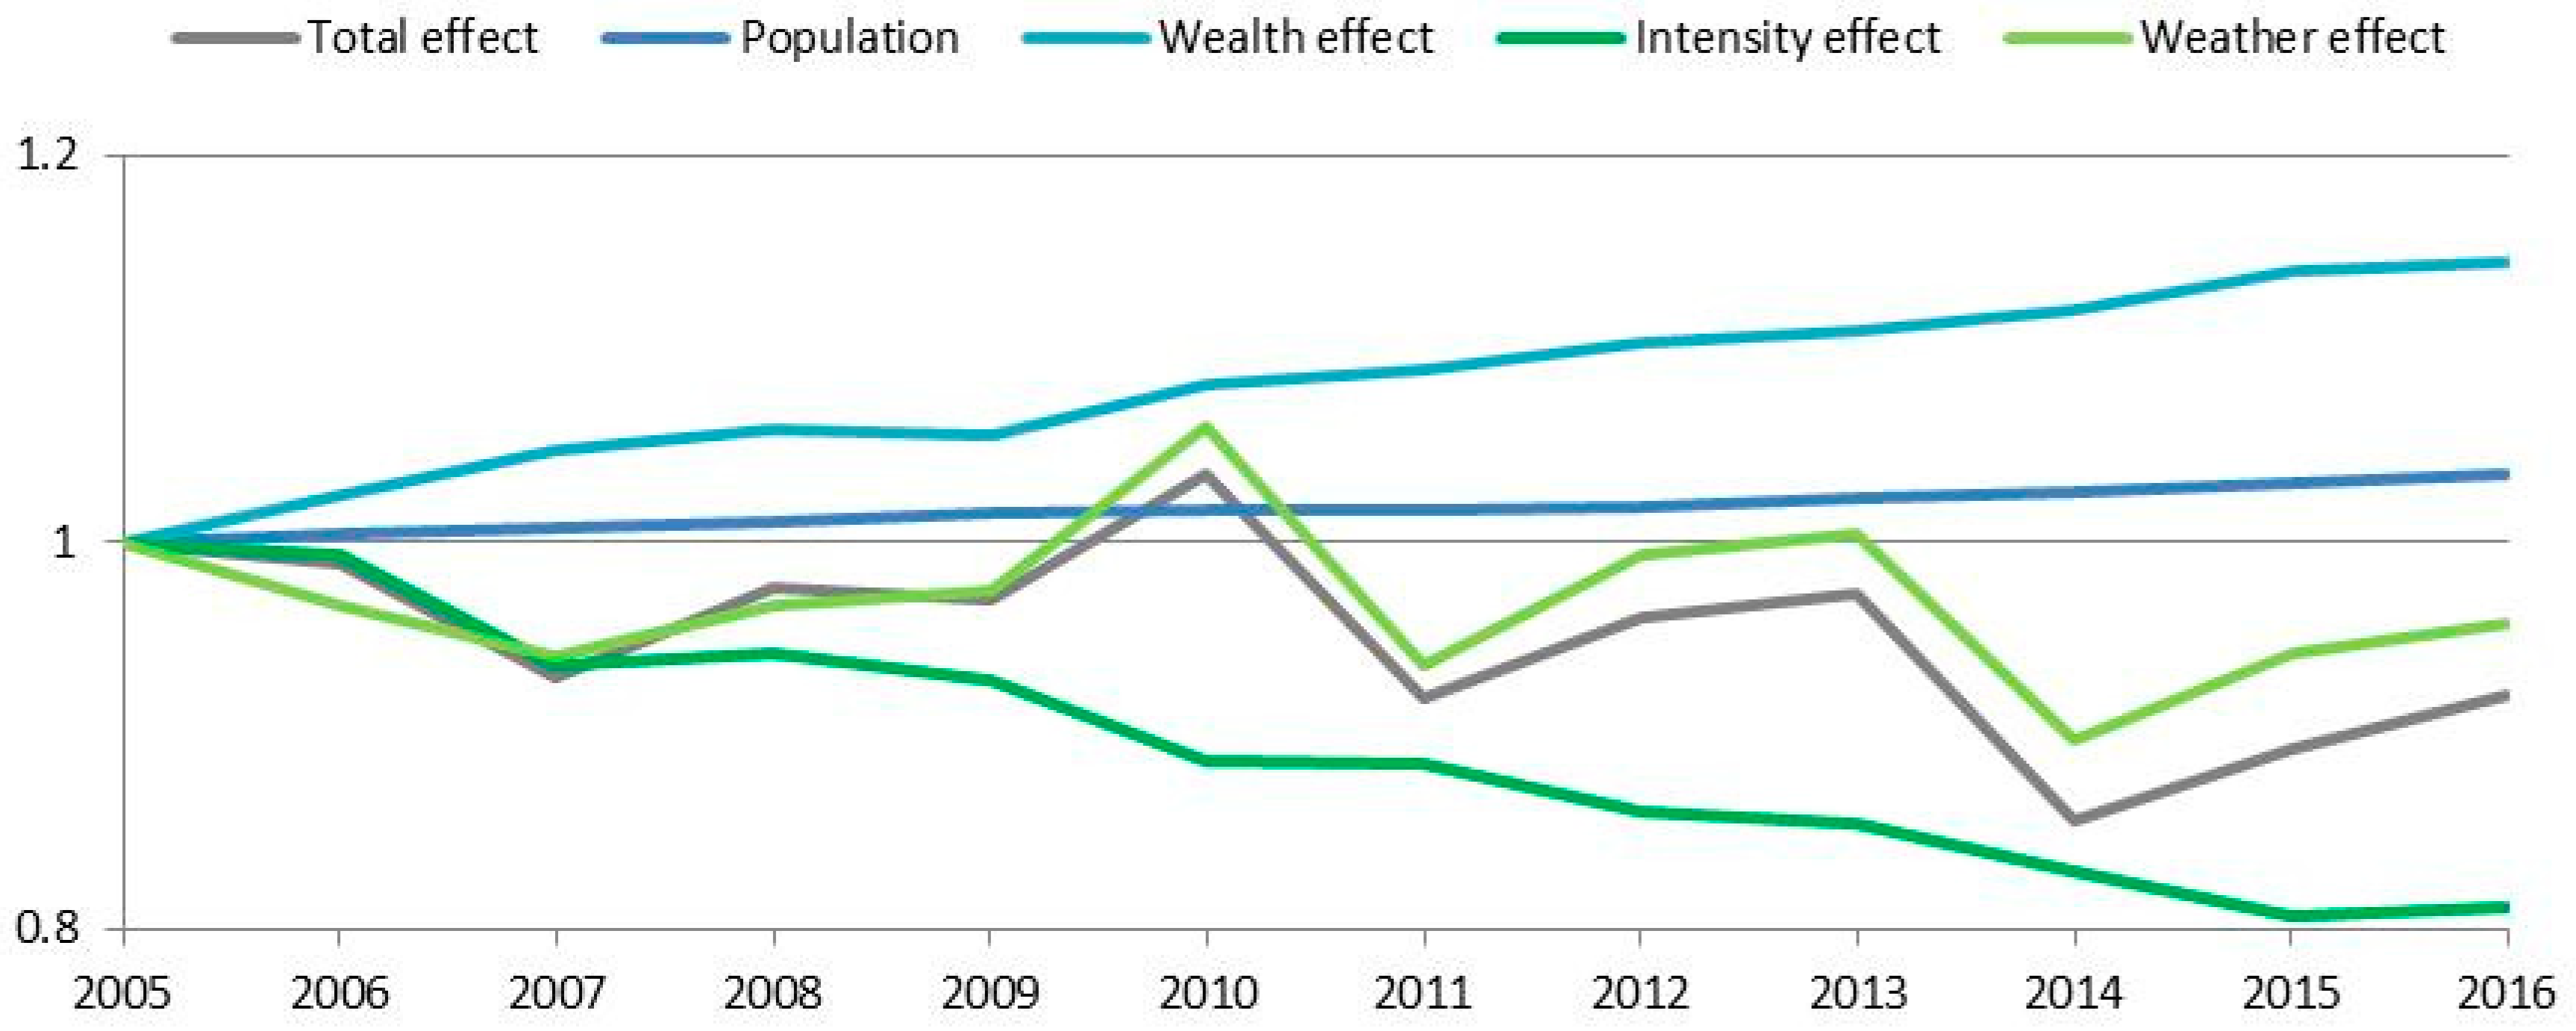
An alternative way to quantify the influence of the mentioned factors is the decomposition analysis that was applied in the EU-28 for the period of 2005–2016. The multiplicative decomposition results of the final energy consumption of the EU-28 in the residential sector are shown in
Figure 20. The decline of 8% (equivalent to 24.6 Mtoe) in EU-28 residential consumption over the examined period was primarily driven by improvements in energy intensity—which contributed to a reduction of 61.4 Mtoe in this sector, equivalent to a drop of 20% compared to 2005 consumption levels—and, to a lesser extent, warmer winters, which were associated with a drop of energy consumption by 13.1 Mtoe in 2016 compared to 2005 levels (4.2%). As a counteracting effect, activity, measured both in terms of changes in population and wealth, drove up consumption at the EU level: The population effect was responsible for a 9.9 Mtoe hike in consumption (3.2%) and the wealth effect caused an increase of 40 Mtoe (13.0%). The activity effect has been constantly rising in the period of 2005–2016, while the opposite is true for the intensity effect. It can also be seen that the weather effect trend is closely correlated with the total consumption trend, confirming the strong impact of weather fluctuations on the total residential energy consumption from our indicator-based analysis. This provides the main explanation behind the dip in consumption in 2011 and 2014, and, conversely, the hike in consumption in 2010. The recorded EU heating degree days in the years of 2011 and 2014 were 2953 and 2809, 10% and 5% higher than the average 3181 heating degree days over the period of 1990–2016, while 2010 was a cold year with a recorded 3485 degree days (11% above the average). The decomposition results show that by removing the population, wealth, and weather effects from the consumption trends, a clearer picture of the impact of policy and technological changes can be obtained. It can also be observed that the trend of the intensity effect seems to be closely interrelated with the
trend in the overlapped period (2005–2015). In line with the evolution of
shown in
Figure 18, a clear linear path of the intensity effect is also obtained in
Figure 20. This confirms the positive impact of technological and policy changes during the examined period. Our results, for the period of 2005–2016, obtained by using the multiplicative method, are in good agreement with previously published results [
34]. However, it is important to note that our results are not directly comparable with those of the study mentioned above, as Reuter et al. analysed the period of 2000–2015 by using the additive method.
5. Conclusions
This article described and analysed the energy consumption patterns in the EU for the period of 2000–2016, with a focus on the residential sector. This analysis aimed to give new insights into the impact and effectiveness of energy efficiency policies implemented in the EU for this sector. The results show that EU primary energy consumption and final energy consumption decreased by 4.6% and 2.2% in 2016 compared to 2000. Energy indicators, such as the final energy intensity and final energy per capita, decreased during the analysed period, by 20.0% and 6.5%, respectively (1.5% and 0.4% at CAGR).
The residential sector registered a final energy consumption drop of 2.1% in the period from 2000 to 2016. However, residential FEC increased by almost 6% from 2000 to 2005, and recorded its maximum in 2010. After the lowest value (over the period of 1990–2016) in 2014, final residential energy consumption increased by 4.3% in 2015 compared to the previous year. Additionally, in 2016, an annual increase of 3.1% was registered. Despite the recent hike of 2015 and 2016, consumption has remained below the average consumption of the last two decades. To better understand the role of the economic crisis in 2008 and the subsequent economic recovery, the adjusted gross disposable income was considered in the analysis, including the evolution of the residential energy consumption compared to the GDP per capita. As shown by the decomposition results, energy consumption in the residential sector dropped despite the upward driving force exerted by the wealth effect linked to economic growth. While the economic recession in 2008–2009 has strongly hit some MSs, its impact was not evident at the EU level as the overall wealth effect (reflected by the higher floor area per inhabitant over time as well as the increase in the adjusted gross disposable income) drove up the residential energy throughout the time period considered in this article.
Weather and climatic conditions, as expected, seem to have a profound impact on the residential energy demand. The results show that despite some exceptions, the colder the year, the higher the energy consumption. Our analysis showed a relatively strong correlation between the final energy consumption and heating degree days. The decomposition results also confirmed this positive correlation by quantifying the impact of climatic variations on the residential energy consumption. According to the decomposition results, the fluctuations in EU residential energy consumption were largely attributed to the climatic variations experienced over the studied period. Nevertheless, establishing a direct impact of climatic conditions on residential energy consumption is not easy, given that several other factors, such as building stock characteristics, social and cultural peculiarities as well as economic conditions, among others, affect the consumption.
Beyond climatic variations, the consideration of sector-specific determinants, such as household and building socio-economic characteristics (e.g., average floor area of dwellings, average number of persons per household), were assessed to gain a more complete picture of the energy efficiency improvements of the residential sector. The determinants used were in line with those adopted by other researchers.
To this end, the new
indicator proposed by the authors offers a better understanding of the residential final energy consumption trends by applying corrections for economic, climatic, and dwelling-related factors. The results showed a steady decline of
over the examined period, corresponding to an overall drop of nearly 40% in 2015 compared to 2000 and an annual decline rate of 0.0127 ktoe/m
2/1000 EUR. Moreover, our results showed that the decline of
over time can be described by a clear linear relationship. All these findings support a very important conclusion emerging from this article: When residential energy consumption is normalized for the most important drivers described in the article, residential energy consumption is still declining, thus implying that energy efficiency policy must have had a clear role in the decreasing trends. Indeed, this was confirmed also by the decomposition results, according to which declining energy intensity was the main driver behind the overall residential energy consumption over the examined period. To advance the understanding of residential energy demand, econometric modelling can offer additional insights of the actual impact of energy efficiency policies on these trends [
21]. Although this study does not allow the impact of energy policy to be isolated completely, it is coherent with the results from other studies [
21,
22,
27].
For what concerns policy implications, the increase in primary and final consumption registered in 2015 and 2016 stresses even more the need for continuing and strengthening policy efforts at the EU and MS level in the remaining years. Policies shall be pursued and reinforced to ensure that the 2020 and 2030 targets are reached. The 2018 EPBD and EED revisions will help, as well as the revision of MEPs adopted under the Ecodesign directive. Whilst the efficiency of appliances is rapidly increasing as a result of the Ecodesign directive, building refurbishments to MEPs are slowly progressing. Against this background, financing is critical and the launch of the Smart Finance for Smart Buildings Initiative [
62] can contribute to a more effective use of public funds, to a more complete assistance for the creation of project pipelines, and to a change in the risk perception of financiers and investors.
Further research is needed, including an analysis of the new Eurostat updates covering the 2017 energy data, as well as an assessment of electricity and gas consumption trends. In addition, an analysis of the consumption trends for the various end-uses (energy consumption for space heating, space cooling, lighting and appliances, etc.) as well as a more detailed decomposition analysis may be included in future research. Finally, further econometric analysis may complement the results.

 ,
, 


