Spot Market Mechanism Design for the Electricity Market in China Considering the Impact of a Contract Market


State Key Laboratory of Power Transmission Equipment & System Security and New Technology, Chongqing University, Chongqing 400044, China
*
Author to whom correspondence should be addressed.
Energies 2019, 12(6), 1064; https://doi.org/10.3390/en12061064
Submission received: 16 February 2019
/
Revised: 15 March 2019
/
Accepted: 15 March 2019
/
Published: 19 March 2019
Abstract
:To promote the reformation of the electricity market in China, a market mechanism that can support collaboration between the contract market and the upcoming spot market was designed in this paper. The focus of this paper was to develop a mechanism to institutionally stabilize the market by way of disciplining market power abuse through limiting arbitrage opportunities generated from multi-markets. To quantitatively describe the arbitrage opportunity, the arbitrage opportunity function (AOF) was defined. Based on inferences of the no-arbitrage principle and the AOF, a cost-based decomposition algorithm for contracts that could improve contract coverage was proposed. The incentive compatible settlement rule for the uncovered generation on the spot market was designed to properly manipulate the arbitrage opportunity. The decomposition algorithm and the settlement rule constituted the designed market mechanism. To verify the applicability and effectiveness of the proposed mechanism, the principles of incentive compatibility, individual rationality, and payment cost minimization were employed to test the designed market mechanism based on the concept of dominant policy equilibrium. This test was conducted on a fictitious case based on the IEEE-14 system. The analysis and results may provide valuable insights on market design in China based on the functional correlation between the contract market and the spot market.
1. Introduction
Designing an electricity market mechanism that supports collaboration between the current contract market and the upcoming spot market is in line with the current Chinese economic, environmental, and political agendas [1,2,3]. Considering the configuration of the network and the considerable market shares of state-owned power generation companies (GENCOs), the stabilization of market order, especially at the preliminary stages of the spot market construction, is quite important. The key to market stabilization is disciplining market power abuse. In the pursuit of more profits, large GENCOs tend to abuse their market power by deliberately submitting bids that deviate from the truth. Investigations into mitigating market power in a single market have been exhaustive [4,5,6,7,8], and the relative design mechanisms for single-market power mitigation [9,10,11,12,13,14] have also been well-documented. In sequential markets, arbitrage opportunities will appear when prices between the contract market and the spot market are distinct [15], which is the underlying incentive for the abuse of market power. A profit-driven GENCO can enhance its profitability by seeking out institutional arbitrage opportunities. Therefore, arbitrage opportunities should be institutionally addressed in the process of designing mechanisms to support cooperation between the contract market and spot market.
To be specific, the arbitrage opportunity presented in this paper is generated from trades in both the contract and spot markets for delivery at the same times and to the same locations. Electricity contracts should be decomposed in terms of each power generator involved and each time interval on the spot market. If a generator produces more output than its decomposed generation, then this incremental output is sold on the spot market, which is termed the uncovered generation or quantity in this paper. The uncovered generation on the spot market and the price differences between the two sequential markets represent the intuitive reflection of the arbitrage opportunity. The decomposition algorithm for the contract and settlement rules for the uncovered generation on the spot market are the key elements in the design mechanism. Specifically, a GENCO can deliberately alter the arbitrage opportunity by abusing their market power in the contract market, since the pool-based mode is applied in the monthly contract market in China, which is termed as the monthly pool-based contract market (PMCM). A brief explanation of the PMCM is given as follows: The contracts in the PMCM are quantity-fixed and price-fixed for a certain period, and they are signed in advance of the delivery. In the PMCM, GENCOs submit quantity–price pairs to the market operator. These pairs indicate the total quantity that a GENCO is able to provide for one month and the price per MWh at which the GENCO is willing to offer this electricity. Subsequently, the market operator runs a clearing program for the collection of pairs and publishes the cleared results, that is, the accepted quantity for each GENCO and the cleared price. Both the contract quantity and price will be fixed during the contracted period. However, the time resolution of these contracts is one month, which we attempt to improve to one hour for delivery using the decomposition algorithm. In this situation, a profit-driven GENCO can abuse its market power by withholding deliveries in the PMCM. In the Chinese spot market, contracts are ultimately implemented in the form of a contract for difference (CfD), which is only considered as the financial delivery on the spot market. Considering this special case, when designing the market mechanism, market power abuse in both markets should be framed within the context of managing the arbitrage opportunities.
Discussions on market mechanism designs to support the cooperation between contract markets and the spot market in China are extremely limited. In [16], the standard curve was implemented for the financial delivery of contracts. Meanwhile, the pricing mechanism and coordination with the bilateral market were dissected in [17], and proposals for developing a spot market were put forward. However, the impact of the PMCM was not included. Based on their contrastive analysis of three electricity markets, the authors of [18] recommended enriching the varieties and refining the energy contract. Moreover, the settlement rules should link the contract and spot prices together. However, detailed methods to achieve this were not included. Using the mechanism employed in the Philippines [19], the contracted energy was adequately accommodated on the spot market. Nonetheless, contracts in the Philippines are performed bilaterally, which is different from the centralized mode applied in the PMCM. Based on the analysis of different mechanisms in the Yunnan Province of China [20], a daily energy transaction method was implemented to help control bias and improve the contract compliance rate [21]. Although daily transactions achieved practical operational results, the time resolution of day-ahead transactions was one day, which could not be considered as a day-ahead market. However, designing a mechanism that supports multi-markets at the institutional level is rarely based on the quantitative analysis of arbitrage opportunities in mitigating market power abuse.
In this paper, the arbitrage opportunity function (AOF) was calculated by multiplying the uncovered power generations by the price difference between the two markets. Supported by the principle of no-arbitrage [22,23], which has been used in pricing flexible electricity contracts [24] and block flexible electricity contracts [25], we inferred that the reduction of arbitrage opportunities can effectively limit the incentive to abuse market power. Based on this inference, first, we qualitatively analyzed the interactions between trading results in the day-ahead market and the contract coverage, where we then indicated the effectiveness of high contract coverage on limiting market power abuse in the day-ahead market. This result is validated in many researches. As analytically or experimentally illustrated by several scholars [26,27,28,29,30,31,32], the proper implementation of contracts can effectively limit the abuse of market power on the spot market, wherein output is significantly covered by the contracts. The authors of [33] demonstrated that the existence of forward markets increases the overall competitiveness of a market for a commodity. Reference [34] showed the positive effects of long-term contracts on mitigating market power in England and Wales, which was further validated in [29]. Reference [35] illustrated how hedging contracts were used to reduce generators’ market power in the Australian electricity market. Reference [36] discussed the important role of long-term contracts in the California electricity market. The incentive contract menu proposed in [37] was also shown to stabilize and simultaneously lower the spot price. Therefore, our design aims involve a decomposition algorithm that could improve contract coverage and a settlement rule for the uncovered generation that is accompanied by incentive compatibility, as a means of managing arbitrage opportunities.
The cost-based decomposition algorithm (CDA) was proposed. As a functional supplement, the incentive compatible settlement rule (ICSR) was designed to settle the uncovered generation. Traditional decomposition algorithms always focus on fairness or economy, while neglecting the influence of contract coverage on market competition. For this purpose, the pool-based model was incorporated in the CDA. The core of this decomposition algorithm was to determine the apportionment for every hourly interval. We calculated the apportionment ratios by simulating competition in the day-ahead market, in which the customized bids of each GENCO were replaced by the marginal costs. The marginal cost of each unit was obtained by computing the technical characteristics of the generation unit and fuel prices. Subsequently, for a certain unit, the decomposed quantity would theoretically approximate the cleared quantity from the truth-telling day-ahead market in the same interval. Herein, a high contract coverage was guaranteed when there was no withholding behavior in the PMCM. Since the price difference between the two markets in a specific interval cannot be eliminated completely due to the functional discrimination of the contract market and the spot market, the uncovered quantity will have a significant impact on the value of the AOF, which will be utilized by GENCOs to enhance their profitability. Thus, the ICSR was designed as the functional complement to the CDA to properly handle the unavoidable arbitrage opportunities. The withholding criterion was inserted into the settlement rule, where the criterion is a threshold value defined by the uncovered ratio, i.e., the portion that the uncovered generation takes to the total generation in a specific interval. If there is withholding behavior in the PMCM, the uncovered ratio is higher than the non-withholding one. The uncovered generation then will be reflected by a punitive price. If no withholding behavior exists, the uncovered generations in the day-ahead market are priced according to their contributions to system balance. Additionally, to assist the settlement rule in minimizing the arbitrage opportunities, a dispatch rule was proposed as the market clearing model, which was termed as the no-arbitrage dispatch rule (NADR) in this paper. Under the NASR, the accepted quantity of a generator is negatively correlated to its bid level.
Moreover, the experimental verification of the proposed mechanism’s effectiveness was also indispensable. As adopted in many electricity markets, the identification of market power abuse is performed by investigating market behaviors using methods such as the conduct and impact test applied by the Midcontinent Interdependent System Operator (MISO), or the three pivotal supplier test employed in the Pennsylvania-New Jersey-Maryland areas (PJM). The most successful re-structured markets are markets with rules that account for the self-interested behavior of all market participants [38]. In other words, an appropriate mechanism should meet the incentive compatibility, individual rationality, and payment cost minimization principles in the design theory [14]. Therefore, whether these principles are satisfied can be answered by investigating the market behaviors of GENCOs and the corresponding economic benefits, e.g., the profit or the revenue. To simulate the GENCOs’ market behaviors and to analyze the economic benefits, the dominant equilibrium theory and the two-stage stochastic program with non-anticipativity constraints were adopted.
Some preconditions of this article are stated as follows. The spot market in China is planned to provide access only to GENCOs at the preliminary stage. Therefore, we only considered the generation side in the market design process. The spot market only refers to the day-ahead market. The intra-day and balancing markets are not involved owing to their minor trade share compared to that in the contract market or the day-ahead market. The withholding behaviors denote the GENCOs’ strategic behaviors in the PMCM. Emphatically, this paper focuses on limiting the abuse of market power, and not the elimination of market power, since possessing market power and abusing market power is discriminative. For instance, the report investigating the abuse of market power by the Ontario Power Generation Inc. (OPG), which is the largest generation company in Ontario (Canada), showed that OPG did not abuse its market power. This result was given by the Market Surveillance Panel (MSP) [39].
The remainder of this paper is organized as follows: The decomposition algorithm for contracts is illustrated in Section 2. The contrastive analysis of different settlement rules is given in Section 3. NADR is embedded in the description of the design of ICSR. The market design principles, and the concepts of dominant equilibrium are interpreted in Section 4. Section 5 shows two test cases for verification, and the conclusions are stated in Section 6.
2. Analytical Design of the Decomposition Algorithm for Financial Contracts
2.1. Basic Concept for Multi-Market Design
Arbitrage implies generating a profit by trading equivalent quantities of products in different markets at different prices. Whenever the price differences are eliminated, the arbitrage opportunities for participants are also removed, which is the concept behind the no-arbitrage principle. However, it is unreasonable to force the contract price and the day-ahead price to be identical. Owing to the price difference, the uncovered quantity will cause an arbitrage opportunity to arise, which will incite GENCOs to abuse their market power. Therefore, the concept of the arbitrage opportunity is extended, that is, the quantity difference and price difference in different markets are both incorporated. To quantitatively describe the arbitrage opportunity, we built the AOF for each market participant at a specific time interval t through multiplying the price differences by the quantity differences in the contract market and the spot market, as formulated in Equation (1):
where Pspot,t is the spot price at interval t and Pcontract is the contract price. qt is the generation and Qt is the obligatory quantity of contracts at interval t.
Think about this special case: when the obligatory quantity of the contract at a specific interval is equivalent to the quantity traded at the same interval in the day-ahead market, the price difference between the two markets can no longer yield an arbitrage opportunity. Therefore, the essential conditions for an arbitrage opportunity in the electricity market include the discrepancies in both quantity and price between the contract market and the spot market. In this situation, the no-arbitrage principle can be implemented by eliminating the uncovered quantity. However, the uncovered quantity cannot be completely reduced to zero.
Inferentially, the reduction of the uncovered quantity, as well as the price difference, is helpful in mitigating market power abuse. This logical inference was set as the basic concept in the market design process of this paper, including the design of the decomposition algorithm for the contract and settlement rule for uncovered generations in the spot market. The inference is first employed in designing the decomposition algorithms for energy contracts to improve the contract coverage. Logically, GENCOs will be less aggressive in abusing market power on the spot market if the contract coverage is high. As experimentally evidenced in [29], most generations were covered with contracts in the first year of the new market in Britain, which was the reason for the stabilization of the spot market. Additionally, as illustrated in [32], the GENCOs will not lift the spot price to the level which their market power allows, since there is a high degree of contract cover. Similar conclusions were approved in [40,41,42]. Therefore, a proper decomposition algorithm for financial contracts should ensure a high contract coverage of output on the spot market. In the following sections, we provide detailed explanations on the effects of contracts on mitigating market power, and then the technical details for improving contract coverage are also interpreted.
2.2. Illustration of the Coverage for Mitigating Market Power
As demonstrated in [3], the uncovered generation in the day-ahead market will be settled by the day-ahead price, i.e., the local marginal price settlement rule (LMP-SR). If the uncovered generations are large and the day-ahead price is higher than the contract price, a profit-driven GENCO will be more aggressive in bidding strategically, owing to the sizable AOF, as shown in Equation (1). These strategic behaviors are not encouraged. From this standpoint, the uncovered generations should be diminished. This conclusion is demonstrated using the theoretical deduction below.
Initially, the number of GENCOs is assumed as N. Each GENCO possesses one generator. The network constraints are disregarded. The real cost Creal and marginal cost Cmarg of GENCO m can be expressed as:
where am and bm are coefficients of the quadratic term and linear term in the cost function, respectively. The independent term cm is the fixed cost. The output is qm.
Generally, the bidding strategies of a GENCO can be interpreted as a linear supply function with some modifications to am and bm. In other words, when a GENCO tries to abuse market power, the submitted cost coefficients will deflect from the truths. The (slope intercept)-parameterization method [43] was adopted in this paper to define the bidding strategy of a GENCO. In this method, the GENCO simultaneously adjusts the slope am and the intercept bm of the supply function by multiplying the strategic variable k. For tractability, the unconstrained clearing model for a single period is exemplified in Equation (4). However, the procedure for modeling the single period problem can be extended to a multi-period problem. Therefore, the results of the single period case are applicable to the multi-period case:
The profit πmt, the AOF Δmt and the day-ahead price λt at interval t can be calculated as:
where Qmt and pc are the decomposed quantity and corresponding price at period t. λt represents the day-ahead price at period t which is derived using Equation (7). Obviously, GENCO m can alter the day-ahead price unilaterally by adjusting the strategic variable km.
Since both the contract price and the quantity are determined in advance of the delivery date, the second term in Equation (5), Qmt·pmc, represents a fixed profit stream to GENCO m before it makes offers to the day-ahead market. The first term in Equation (5), (qmt − Qmt)·λt, depends on the day-ahead price, but in such a way that can significantly limit the incentive for the GENCO to raise prices in the day-ahead market. That is to improve the contract coverage using the decomposition algorithm to reduce the value of (qmt − Qmt). Based on Equations (5) and (7), the impacts of the contract cover degree on market power are discussed as follows:
Case 1: qmt = Qmt. A GENCO cannot deploy market power. As shown in Equation (5) and (6), the profit πmt is independent from the day-ahead price λt and the AOF is zero. In this case, the strategic bids of a GENCO have no effect on its profit. Therefore, the motivation for bidding strategically will be eliminated.
Case 2: qmt < Qmt. The profit of GENCO m will decline, since the first term in Equation (5) is negative. To avoid an economic loss, GENCO m will hope that the λt is lower. Therefore, GENCO m is inclined to implement its market power through varying km. According to the theory of market clearing, the λt will decrease by diminishing km, and then the AOF approaches positive. Thus, the loss of profit caused by the negative uncovered energy will be reduced.
Case 3: qmt > Qmt. The profit of GENCO m will be improved, since the first term in Equation (5) is positive. To acquire more profit, GENCO m hopes that the λt is higher. The profit πmt will increase by raising λt and then the AOF will get positively larger. Therefore, the profit-driven behaviors of a GENCO involve lifting λt using strategic bids.
In summary, a profit-maximizing GENCO will exercise its market power when it is faced with Case 3. As interpreted in Equations (5)–(7), the uncovered quantity provides the GENCO with motivations to implement market power. The tendency of a GENCO to deploy market power is positively associated with the value of the uncovered quantity. These strategic behaviors will damage the market efficiencies and should be averted. Therefore, the contract coverage should be maintained at a relatively high level at each time interval.
The current decomposition algorithms for contracts are usually based on the forecasted load curves [3,16]. This kind of method utilizes the same apportionment ratios for all units at every hourly interval, termed as the uniform decomposition algorithm (UDA) in this paper. The shapes of each decomposed curve are identical. Actually, there are many other factors in the market clearing process, such as network constraints, rivals’ bidding scenarios, and so on. The load demand is just one of these constraints. As a result, this procrustean approach may lead to uncontrollable coverages and may stimulate GENCOs to deploy their market power in the day-ahead market. To fix the flaws of current decomposition algorithms, the cost-based decomposition algorithm (CDA) was proposed.
2.3. Procedure of the Decomposition Algorithm
In the proposed decomposition algorithm for contracts, the apportionment ratios were determined by simulating competition in the day-ahead market, in which the customized bids of each GENCO were replaced by the marginal costs. The marginal cost of each unit was obtained by computing the technical characteristics of the generation unit and the fuel prices.
The detailed procedure is as follows:
- Step 1.
- Input the forecasted load curve and technical characteristics of the generator and fuel prices.
- Step 2.
- Remove the renewable output and other required output (e.g., base output) from the forecast load curve.
- Step 3.
- Compute the marginal cost for each GENCO and set these as bids.
- Step 4.
- Input the bids and the load curve into the market clearing program.
- Step 5.
- Run the market clearing program and export the accepted quantity and prices of each GENCO at each time interval.
- Step 6.
- Determine the apportionment ratios based on the accepted quantity and prices of each GENCO at each time interval.
The formula of the decomposition algorithm is presented as:
where Qmc is the total contract quantity with a monthly time resolution. Γm is the vector constituted by the apportionment ratio in each hourly time interval.
For a certain unit, the decomposed quantity will theoretically approach the cleared quantity from the truth-telling day-ahead market at the same interval. Herein, the contract coverage is guaranteed when there is no withholding behavior in the PMCM. The GENCO can reduce its total contract quantity through withholding behavior in the PMCM. As a consequence, the average contract cover degree will drop and the uncovered generations will increase. Additionally, the load forecast is not accurate due to the limitations of the forecasting technique, especially for a long forecast period. The contract cannot exactly cover all the generations in the day-ahead market. A profit-maximizing GENCO will deploy its market power once the arbitrage opportunity arises, as caused by uncovered generations. As a functional complement, these problems can be handled by the settlement rule for the uncovered generation in the day-ahead market.
3. Institutional Design of Settlement Rule for uncovered Generations
As the major objective was to mitigate the abuse of market power, the logical inference deduced from the no-arbitrage principle should be the key factor when designing the settlement rule. However, many other inherent market performances should also be considered to ensure the feasibility of the designed settlement rule. The general description of market performances was given first, and then the deficiencies of the current rules were analytically demonstrated. Considering all these factors, the institutional design of the proposed settlement rule was introduced.
3.1. General Description of the Market Performances
Normally, the load demand can be horizontally classified as a peak period or a valley period. Meanwhile, the system status at each time interval includes upregulation and downregulation. In this paper, the upregulation status was defined as the situation in which the actual demand at a specific interval was higher than the forecast demand at the same interval. Similarly, we can define the downregulation as the situation where the actual demand is lower than the forecast demand at a certain time interval. The contracts are signed in advance of the day-ahead market. The contract price is fixed for all the time intervals, which is usually close to the average price in the day-ahead market. Therefore, during the peak period, the day-ahead price at each time interval is usually higher than the contract price due to the tight supply—the demand condition. This performance will be enhanced if the status of the peak period is that of upregulation. Analogously, the day-ahead price is lower than the contract price during the valley period, such that the status of valley period is that of downregulation. Arbitrage opportunities that guide GENCOs to make contributions to the system’s balance are considered as effective incentives. For instance, long generation (over the contract quantity) in the upregulation interval is encouraged, wherein an effective incentive should be matched with the positive arbitrage opportunity. In turn, short generation in this situation is discouraged and the negative arbitrage opportunity relates to effective incentives. These matching requirements should also be considered when designing a settlement rule.
For clarity and tractability in the further derivation and demonstration, the nomenclatures are defined as:
where xt is the forecast error of the load demand at interval t, which cannot be altered by the GENCOs. The system status is that of upregulation when xt < 0. Otherwise, the system status is that of downregulation. ymt represents the uncovered generation in the day-ahead market.
As general knowledge mentioned above, the day-ahead price λt is higher than the contract price pc during the peak period, and λt is lower than pc during the valley period. The upregulation (downregulation) status will enlarge the price difference during the peak (valley) period. Therefore, the price difference δt between λt and pc is considered to be positively correlated with the absolute value of xt. For simplification, δt is assumed to be linearly proportional to xt, which is graphically represented in Figure 1. The relationship between δt and xt can be formulated as:
where γ1 and γ2 are negative constants representing the slope of the lines in Figure 1. Conventionally, |γ1| > |γ2|. A GENCO can vary the value of γ by bidding strategically.
3.2. Current Rules: LMP-SR and NASR
In terms of the settled prices for uncovered generations, the current settlement rules can be categorized as LMP-SR and the no-arbitrage settlement rule (NASR). If the uncovered generations are settled using day-ahead prices, this kind of settlement rule is termed as the LMP-SR in this paper, expressed by Equations (12)–(14):
where πLMP,t is the sum profit at interval t from both markets. As defined in Equation (1), ΔLMP,t is the AOF of the LMP-SR. is the settled price under the LMP-SR.
By combining Equations (11)–(13), the ΔLMP,mt can be expressed as:
Based on Equation (15), straightforward information about the properties of LMP-SR can be attained as follows:
The positive arbitrage opportunities appear in the peak period when ymt > 0 and the valley period when ymt < 0. That means, long generation will receive a bonus during the peak period, while short generation will benefit during the valley period. If the arbitrage opportunity is large, the GENCOs will be motivated to abuse their market power. Moreover, contributions to the system’s balance are neglected in the LMP-SR. Therefore, the mismatches between the effective incentive and the arbitrage opportunities calculated by the AOF occur as shown in Table 1 and Table 2. The mismatches are not profitable for both the system and the GENCOs.
To overcome these problems, the NASR was devised based on the principle of no-arbitrage, which was previously introduced to settle wind energy deviations in a balancing market [41,42]. Under the NASR, the uncovered generations that help to reduce imbalance in the system are all settled by pc and the positive arbitrage opportunities are completely removed in theory. To be specific, the uncovered generations are settled by different prices, conditional upon the imbalance status of the system. Short generation is settled by pc during a downregulation period in both the peak and the valley periods. Similarly, long generation is also settled by pc during an upregulation period. The performances of the NASR are mathematically described in Equations (18)–(20) by substituting the settled price with in Equation (13):
As shown in Table 1 and Table 2, mismatches between the effective incentive and the arbitrage opportunities under the NASR still exist in condition 3 and condition 6. Moreover, the positive arbitrage opportunity is not completely eliminated as expected. The reason is that the relationships between pc and λt under different periods, that is, peak or valley, are missed. Additionally, under the NASR, a profit-driven GENCO will attempt to lift the contract price to gain more profit according to Equation (12). As a result, the contract quantity shrinks and the contract price rises. In extreme cases, the contract price may be higher than the day-ahead price in an upregulation interval from the peak period. Therefore, the general knowledge shown in Figure 1 may not hold anymore, and the market will be distorted. To approach all these deficiencies in the current rules, the incentive compatible settlement rule (ICSR) was introduced in the following section.
3.3. Analytical Design for the ICSR
To address the mismatches between the effective incentives and the AOF, the uncovered generations in the peak period and the valley period should be settled separately. While making the value of the AOF match with the effective incentive, the value of the AOF should be controlled at an appropriate level, since a large arbitrage opportunity will incite GENCOs to abuse their market power. A GENCO definitely has the ability to vary the AOF to enhance its profit by creating price differences and increasing the uncovered generations. In addition, the withholding behavior in the PMCM need to be identified and punished. Additionally, the compatibility of the individual and the collective should also be recognized. Considering all these factors, the ICSR was designed according to the inference deduced from the no-arbitrage principle. The diminishment of both the uncovered quantity and the price differences is significant. For clarity, the profit function and the AOF of the ICSR is formulated as follows:
A reasonable contract price is the precondition for implementation of the inference. The examination of strategic behaviors in the PMCM is significant. Usually, strategic behavior in the PMCM involves withholding the total quantity. Using the proposed decomposition algorithm CDA, the contract coverage at each interval will collectively drop if the total contract quantity is decreased through withholding behaviors. Therefore, the identification of withholding behaviors at each time interval can be performed by checking the contract coverage. The threshold can be empirically determined by the market operator. If the identifications imply that the withholding behaviors exist, the contract price will be substituted by a reference price. The reference price is customized as a punitive price, which will cause an economic loss to a withholding GENCO. By doing this, withholding behaviors in the PMCM will decline.
The diminishment of the uncovered quantity is considered first. Based on Equation (22), we analyzed case qmt > Qmt (ymt > 0) and case qmt < Qmt (ymt < 0), respectively. In case qmt > Qmt (ymt > 0), a GENCO tends to lift the day-ahead price through higher bids. If a high-bid GENCO individually receives a lower generation than expected, the uncovered quantity in Equation (22) will decrease and the GENCO will lose the incentive to bid strategically. For this purpose, the relationship between bids and the accepted generations in a pool-based market was dissected. Based on the market clearing model in Equation (4) and the Karush-Kuhn-Tucher conditions, the mathematical relation between bids and the accepted generations is explicitly expressed as below:
If the bids of GENCO m’s rivals in Equation (23) are constant, the value of qmt is negatively correlated with kdm as indicated in Figure 2. For this purpose, we can replace the rivals’ bids with the constant parameters obtained by computing the technical characteristics of the generation unit and fuel prices. In addition, the merit order of each generator should be clarified in advance. The last generator is regarded as the balancing point. The merit order in this paper was determined by the bid of each generator. This dispatching method is termed as the no-arbitrage dispatch rule (NADR). Under the case qmt < Qmt, a GENCO will be well remunerated if the day-ahead price is much lower than the contract price. Therefore, GENCOs will try to bid as low as they can. Based on Equation (23), qmt will increase with the decline of the bidding strategy kdm, and thus, ymt reduces.
Then, we considered the diminishment of the price difference. According to Table 1 and Table 2, the positive arbitrage opportunities in condition 3 and condition 6 under the NASR resulted from price differences. These arbitrage opportunities can be removed if the settled prices in condition 3 and condition 6 are adjusted as the contract price. Therefore, the positive arbitrage opportunities are totally eliminated. Theoretically, the LMP-SR will cause market power abuse and the NASR will reduce the willingness of GENCOs to produce electricity for the day-ahead market, which is vital for system balance. Therefore, we attempted to determine a settled price for condition 1 and condition 5 that could address the tradeoff between the LMP-SR and the NASR. Moreover, we hoped that the performance of the settled price could be manipulated by the market operator. Then the positive arbitrage opportunities or incentives could be preserved to a reasonable degree relative to the abuse of market power. Again, we followed the inference deduced from the no-arbitrage principle, and a function that could scale the settled price up or down around the contract price was designed. When the day-ahead price is higher than the contract price, the settled price is determined by scaling down the day-ahead price and the lower bound is considered the contract price. Contrariwise, the settled price is determined by scaling up the day-ahead price and the upper bound is the contract price. The scaling degree relies on the extent to which the day-ahead price is beyond or below the contract price. This function is expressed as follows:
where ζ is a constant determined by the market operator.
The profile of function F and the settled price in Equation (24) are shown in Figure 3a,b, respectively. The function F is monotonic in the positive and negative territories, respectively. The settled price curve of the ICSR is located between the LMP-SR price curve and the NASR price curve. During the peak period, when the market clearing price λt is higher than the contract price pc, the settled price of the ICSR keeps falling from the settled price of the LMP_SR with the increment of λt. Moreover, the falling speed rises progressively. With continuous increase of λt, the ICSR price will be lower than the contract price. Therefore, GENCOs that attempt to lift the λt will then incur economic losses for their strategic behaviors. Collusions are also noneffective. During the valley period, when the market clearing price λt is lower than the contract price pc, the difference between the settled price of the ICSR and the LMP-SR declines with the increase of the λt. In this case, GENCOs will be paid at a higher price when λt is lower, which will encourage GENCOs to bid as low as they can.
Under condition 1, proper incentives are maintained in the ICSR in contrast with the NASR, which has the significant effect of motivating GENCOs to voluntarily make contributions to the system’s balance. However, the arbitrage opportunities are much lower than that in the LMP-SR and they are easily controllable. The incentives for abusing market power will be effectively depressed. Under condition 5, the AOF of the ICSR will be close to that of the NASR if GENCOs bid truthfully. Owing to the higher contract price upon condition 5, a GENCO will not be underpaid under the ICSR and it is still willing to help balance the system. The settled prices of the ICSR are shown in Table 1 and Table 2. As indicated in Table 1 and Table 2, the effective incentives under most conditions match with the arbitrage opportunities of the ICSR. In summary, the flaws of the LMP-SR and NASR are resolved in the proposed ICSR. The details of the ICSR are summarized in the following section.
3.4. Institutional Summary of the ICSR
The uncovered ratio r = yt/qt and the threshold r0 are introduced in the ICSR to detect the withholding behaviors in the PMCM, defined as the withholding criterion. The value of r0 can be empirically determined by a market operator. If r < r0, the GENCO is regarded as a non-withholding participant and the settlement rule for yt is described in Equations (26)–(28) and (31)–(32). If r > r0, the GENCO is considered as a withholding participant and the settlement rule for yt is punitive during both the peak and valley periods, as shown in Equations (28) and (33). Certainly, the market operator can incite GENCOs to sell more energy in the contract markets by manipulating the value of r0. Detailed rules are as follows:
(1) xt < 0 and yt > 0
if r < r0:
if r > r0:
where Pref is the reference price given by the market operator according to the empirical contract prices. If pc is higher than Pref, then will decrease significantly.
When xt < 0, yt > 0, and r < r0, the long-generation GENCO should be rewarded. The settlement rule in Equation (26) will provide proper rewards for the exceeded generations as illustrated in the last section. If r < r0, the GENCO is justified as a withholding participant and it will be punished by the settlement rule in Equation (28).
(2) xt < 0 and yt < 0:
When xt < 0 and yt < 0, a short-generation GENCO should be punished for enhancing the system imbalance. Thus, it is necessary to ensure that the term ( − pc) in Equation (22) is nonnegative. To approach this problem, Equation (29) is adopted to define in this case. If λt > pc, an economic penalty will occur and it will subsequently release a correct signal to the market behavior of GENCOs. If λt < pc, the value of pc is assigned to to deter the GENCOs from benefiting.
(3) xt > 0 and yt > 0:
if r < r0:
if r > r0:
When xt > 0, yt > 0, and r < r0, the long-generation GENCO should be punished for enhancing the system imbalance. For this purpose, the term ( − pc) in Equation (22) should be ensured to be nonpositive. The smaller value between λt and pc is adopted. If r > r0, the GENCO will be underpaid by the settlement rule in Equation (33).
(4) xt > 0 and yt < 0:
When xt > 0 and yt < 0, the short-generation GENCO should be rewarded for relieving the system imbalance. Hence, the term ( − pc) in Equation (22) should be ensured to be nonpositive. If λt > pc, pc is assigned to . Then the GENCO will not be penalized. If λt < pc, λt is assigned to . Subsequently, the GENCO will earn a profit.
Thus far, the institutional design of the entire spot market mechanism has been accomplished. The overview of this mechanism is interpreted in Figure 4. The renewable energy and pre-determined delivery curves of contracts were disregarded. First, a GENCO will participate in the PMCM and report a Bidcm (m = 1, …, N) to the market operator, which is a quantity-price pair. The Bidcm indicates the total quantity that GENCO m is able to generate for one month and the price per MWh that GENCO m is willing to offer for these products. Then the market operator runs the market clearing program for the collection of bids and then publishes the cleared results, that is, the accepted quantity of each GENCO and the cleared price. Both the contract quantity and price will be fixed during the contracted period. The time resolution of these contracts is one month. The one month horizon must be divided into to one hour periods for delivery using the proposed CDA. The activities in the PMCM and the day-ahead market are chronological as shown in Figure 4. GENCO m then submits Biddm in the day-ahead market before the gate closure. The Biddm is the declared cost parameter of GENCO m. Then the market clearing is conducted based on the NADR. When the transactions in the PMCM and the day-ahead market are completed, then the settlement section will be performed. The ICSR is adopted in the settlement section and this rule belongs to the ex-post settlement. In general, ex-post pricing motivates participants to behave consistently with their bids [43]. During the contracted period, this procedure will be repeated every day until the last day. The core of the designed mechanism involves the cooperation of the ICSR, NADR, and CDA.
4. Formulation and Evaluation of Market Mechanisms
4.1. Principles of Market Evaluation
As indicated in [14], the incentive compatibility, individual rationality, and payment cost minimization principles should be guaranteed in a viable market mechanism. Under the mechanism with incentive compatibility, if each GENCO maximizes its profit individually at each time interval, the resulting power delivery schedule matches that from the centralized cost minimizing dispatch. The centralized goal can be achieved in a decentralized manner under the incentive-compatible mechanism. Therefore, the market behavior of the GENCOs can be employed to justify the principle of incentive compatibility, which is straightforward and effective. In an individually rational mechanism, the GENCOs will not be underpaid, which is usually considered as the participation constraint. Under the two principles, a rational GENCO will be willing to participate in the market and it will select truthful bids as the optimal bidding decisions. The payment cost minimization can be explained as the purchase cost to consumers, which can also be regarded as the revenue of the GENCOs. According to the consistency of the centralized and decentralized objectives, the payment to arbitrary GENCOs will be minimized if the market mechanism satisfies the principle of payment cost minimization. In conclusion, the simulation results of one GENCO’s market behavior and corresponding economic profit, as well as the revenue, can be adopted to analyze whether these principles are satisfied. Specifically, the model for the optimal bidding strategy is usually employed to determine a profit-chasing GENCO’s market behavior. Hereafter, the optimal bidding model and resolving approach are introduced in the following sections.
4.2. Model of Optimal Bidding Strategies
The development of optimal bidding strategies is modeled as bi-level problems [44]. The upper level is profit-maximization optimization, and the decision variable is the bidding strategy. The lower level is the market clearing model for determining market prices and dispatching based on the optimal power flow program. The decision variable in the day-ahead market clearing model is power generation, while in the PMCM, it is the total contract quantity. For simplification purposes, the optimal model in the day-ahead market is illustrated below as an example:
where qmt represents the accepted generation and kdm,t is the strategy variable for GENCO m at interval t. and are the lower and upper bounds of the strategy variable kdm. The inequality expressed by matrix F denotes the physical constraints for power output and power flow. MPt is the market clearing price at interval t.
By substituting the cost function in Equation (36) with the quantity–price pair and removing some constraints that are not required in the PMCM, the optimal model in the day-ahead market will then be recast as that in the PMCM. As a non-nearsighted GENCO, the customization of bidding strategies should not only focus on one single market. Therefore, the best bidding choice should maximize the profit of the GENCO in both markets, which is formulated in Equation (37):
where Qmt is the contract quantity of GENCO m at interval t, which is calculated by the proposed CDA. is the settled price for the uncovered generation in the day-ahead market, which is determined by the proposed ICSR. Kcm and Kdm are the strategy sets of GENCO m in the PMCM and the day-ahead market, respectively. k−m represents an arbitrary scenario generated by rivals’ bids.
If the probability of every scenario formed by the rivals Pr(k−m) is given, the expected profit of GENCO m, by implementing kcm in the PMCM and kdm at every interval in the day-ahead market, can be calculated as:
where K−m is the strategy set of GENCO m’s rivals, composed of k−m.
Equation (37) is the objective function of the optimal bidding model for GENCO m participating in both the PMCM and the day-ahead market. The constraints are the integration of conditions that should be considered in both the PMCM and the day-ahead market. Clearly, the optimal bidding model in this paper was composed by two bi-level models. To obtain the optimal strategy of each GENCO, the concept of market equilibrium was introduced in the following section.
4.3. Dominant Market Equilibrium
A Nash equilibrium is a standard solution concept for inducing GENCOs’ optimal bidding strategies under a certain market mechanism. The concept of the Nash equilibrium requests that each GENCO possess a probabilistic knowledge of its rivals’ possible strategies. In an electric power grid, it is unrealistic. A stronger equilibrium conception, the dominant strategy equilibrium, was thus introduced in this paper. Under the concept of the dominant strategy, the optimal strategy of each GENCO is tailored regardless of its beliefs regarding its rivals’ strategies k−m. Mathematically, the dominant strategy km of GENCO m in a pool-based market should satisfy the following inequality:
where stands for any other strategy adopted by GENCO m except for the strategy km. Formally, the strategy collection (k1, …, kN) is a dominant strategy equilibrium, in which km is a dominant strategy of GENCO m.
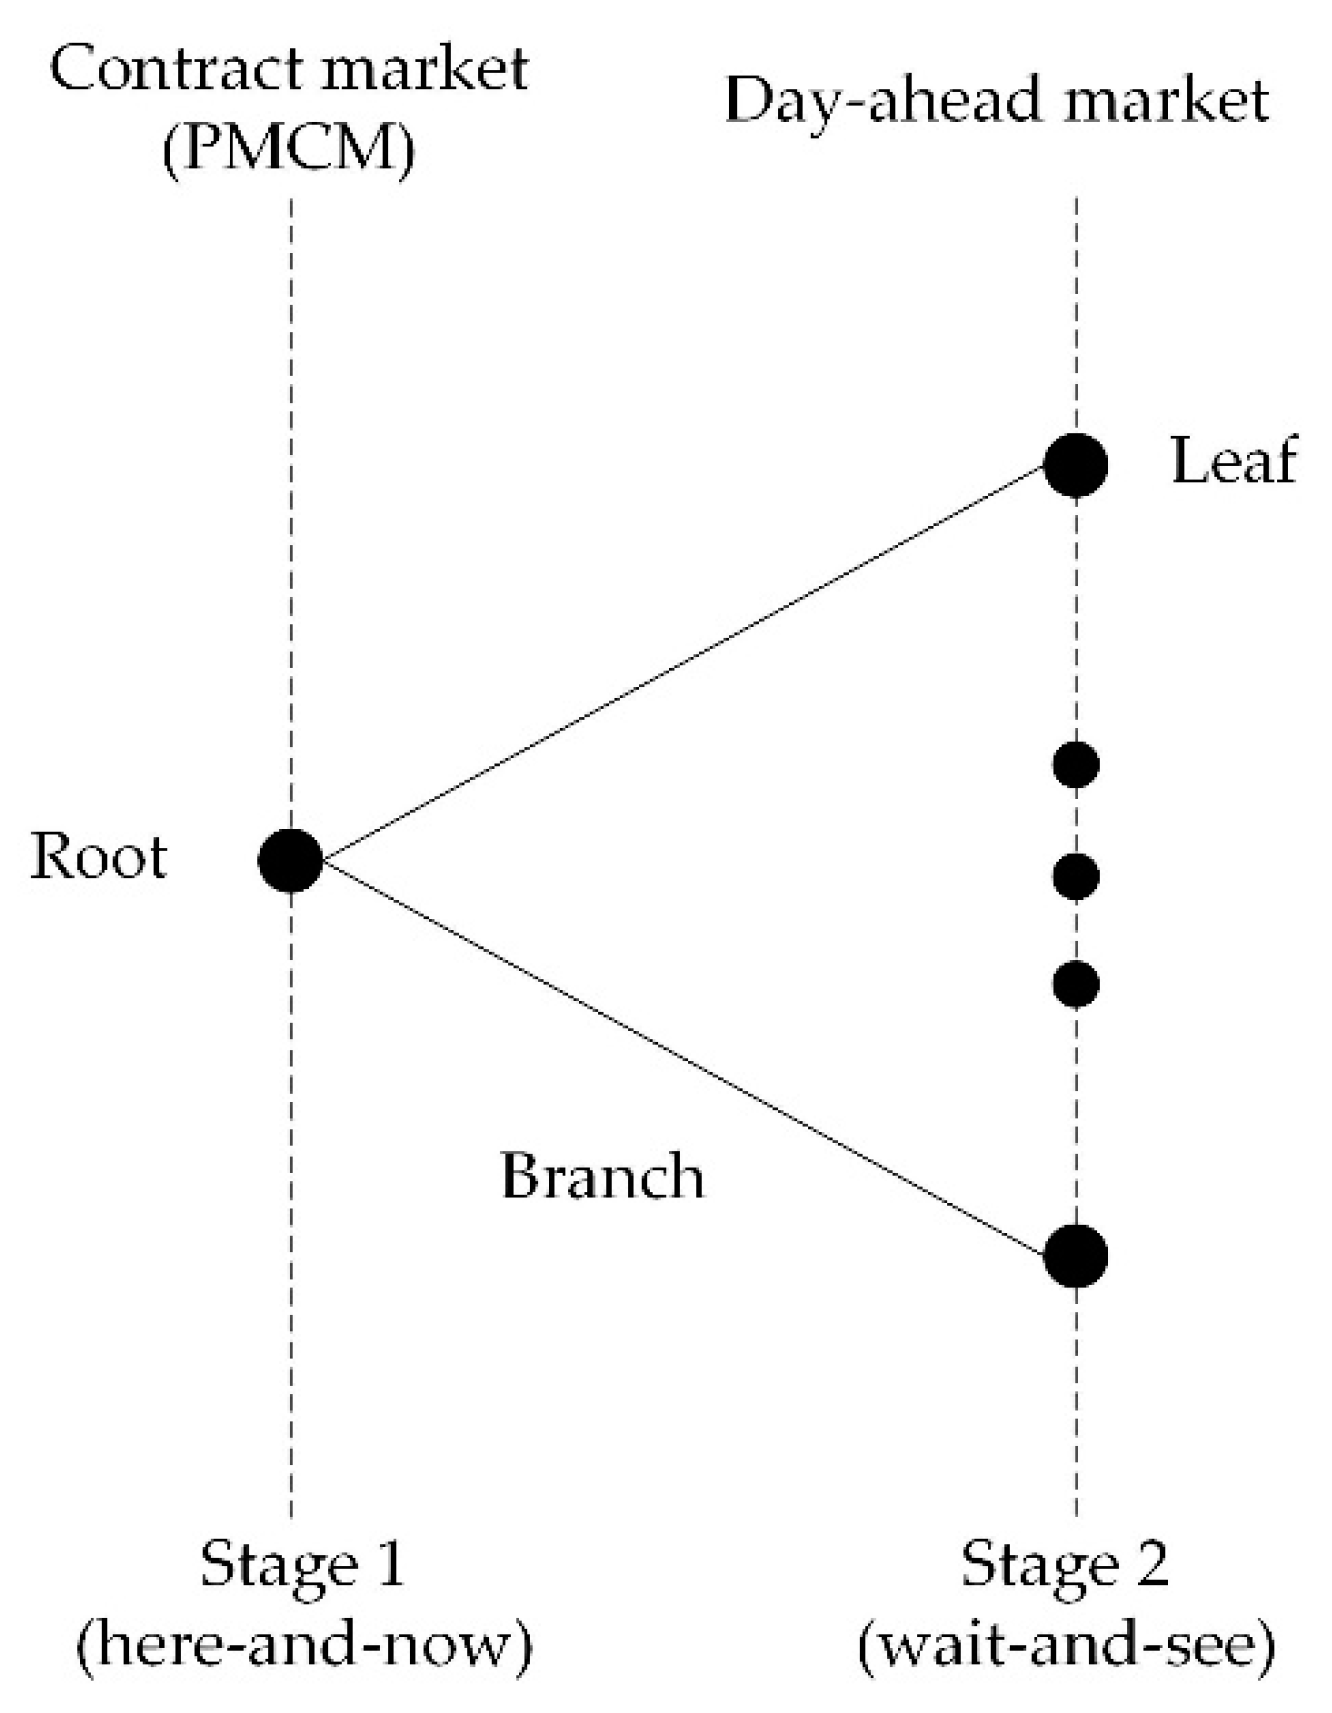
The proposed market mechanism was utilized to support the cooperation of the contract market and the day-ahead market. Accordingly, the GENCOs should chronologically reveal their bids in the PMCM and the day-ahead market. Thus, the decision-making problem for a GENCO under this mechanism is a two-stage process. Stage 1 is the PMCM and Stage 2 is the day-ahead market. The scenario tree of the two-stage problem is shown in Figure 5. A scenario tree comprises a set of nodes and branches. The nodes represent scenarios of the problem at a particular instant, i.e., the points where decisions are made. Each node has a single predecessor and can have several successors. The first node is called the root node, and it corresponds to the contract market in our manuscript. In the root node, first-stage decisions are made. The nodes connected to the root node are the second-stage nodes and represent the points where the day-ahead decisions are made. For a two-stage problem, the second-stage nodes are equal to the number of scenarios and are referred to as leaves. In a scenario tree, the branches represent different realizations of the random variables. The random variables in this paper refer to the bidding strategy of each rival. However, the dominant strategy equilibrium is the solution to the single-stage decision. To address this situation, the concept of dominant strategy equilibrium was extended to the dominant policy equilibrium. The policy involves a bidding decision at each stage. In this paper, the bidding decisions in the PMCM and at each period in the day-ahead market constituted that policy. Without the loss of generality, for a τ-stage decision-making process, a dominant policy νm = (, , …, ) of GENCO m satisfies the following condition:
where ν−m represents any possible policy combination of rivals. denotes any other policy adopted by GENCO m.
Similarly, the policy collection (ν1, …, νN) is a dominant policy equilibrium, in which νm is a dominant policy of GENCO m.
For a specific GENCO, the decisions in the PMCM are identical to any possible decisions that may be made at every time interval in the day-ahead market, which conforms to the concept of the two-stage stochastic program with non-anticipativity constraints. When considering the non-anticipativity constraints, the decision at the current stage depends on the choice at the previous stage, but it is independent on the decisions at future stages. Therefore, we employed the two-stage stochastic program with non-anticipativity constraints to generate the decision policies of each GENCO, and then we selected the dominant decision policy of each GENCO based on the concept of the dominant policy equilibrium. Specifically, when it is time to make day-ahead decisions, the contract price and quantity for each time interval are determined and available, since bidding decisions in the PMCM are made in advance of the day-ahead market. Thus, the decision-making at each time interval of the day-ahead market is temporally independent and disregards the ramping constraint. The policy set of GENCO m can be constructed as follows: decision kcm is selected first from the strategy set Kcm. Then, regarding kcm, the decision kdm at each time interval of the day-ahead market is picked from the strategy set Kdm. When the policy set of each GENCO is determined, the dominant policy of each participant can be obtained according to the concept of the dominant policy equilibrium.
The dominant policy, the profit, and the revenue of each GENCO under the dominant policy equilibrium can provide a straightforward view of the properties of the designed market mechanism. As an ideal market mechanism with the properties of incentive compatibility (inequality Equation (41)), individual rationality (inequality Equation (42)), and payment cost minimization (inequality Equation (43)), the following three constraints are required to be simultaneously satisfied:
where denotes the dominant policy of GENCO m composed of the truthful bids from each stage. ν in Equation (43) is an arbitrary policy collection from all the GENCOs. R*(ν) represents the payment cost under the proposed mechanism. R1 and R2 represent the payment costs under other market mechanisms.
5. Case Study
5.1. Basic Information
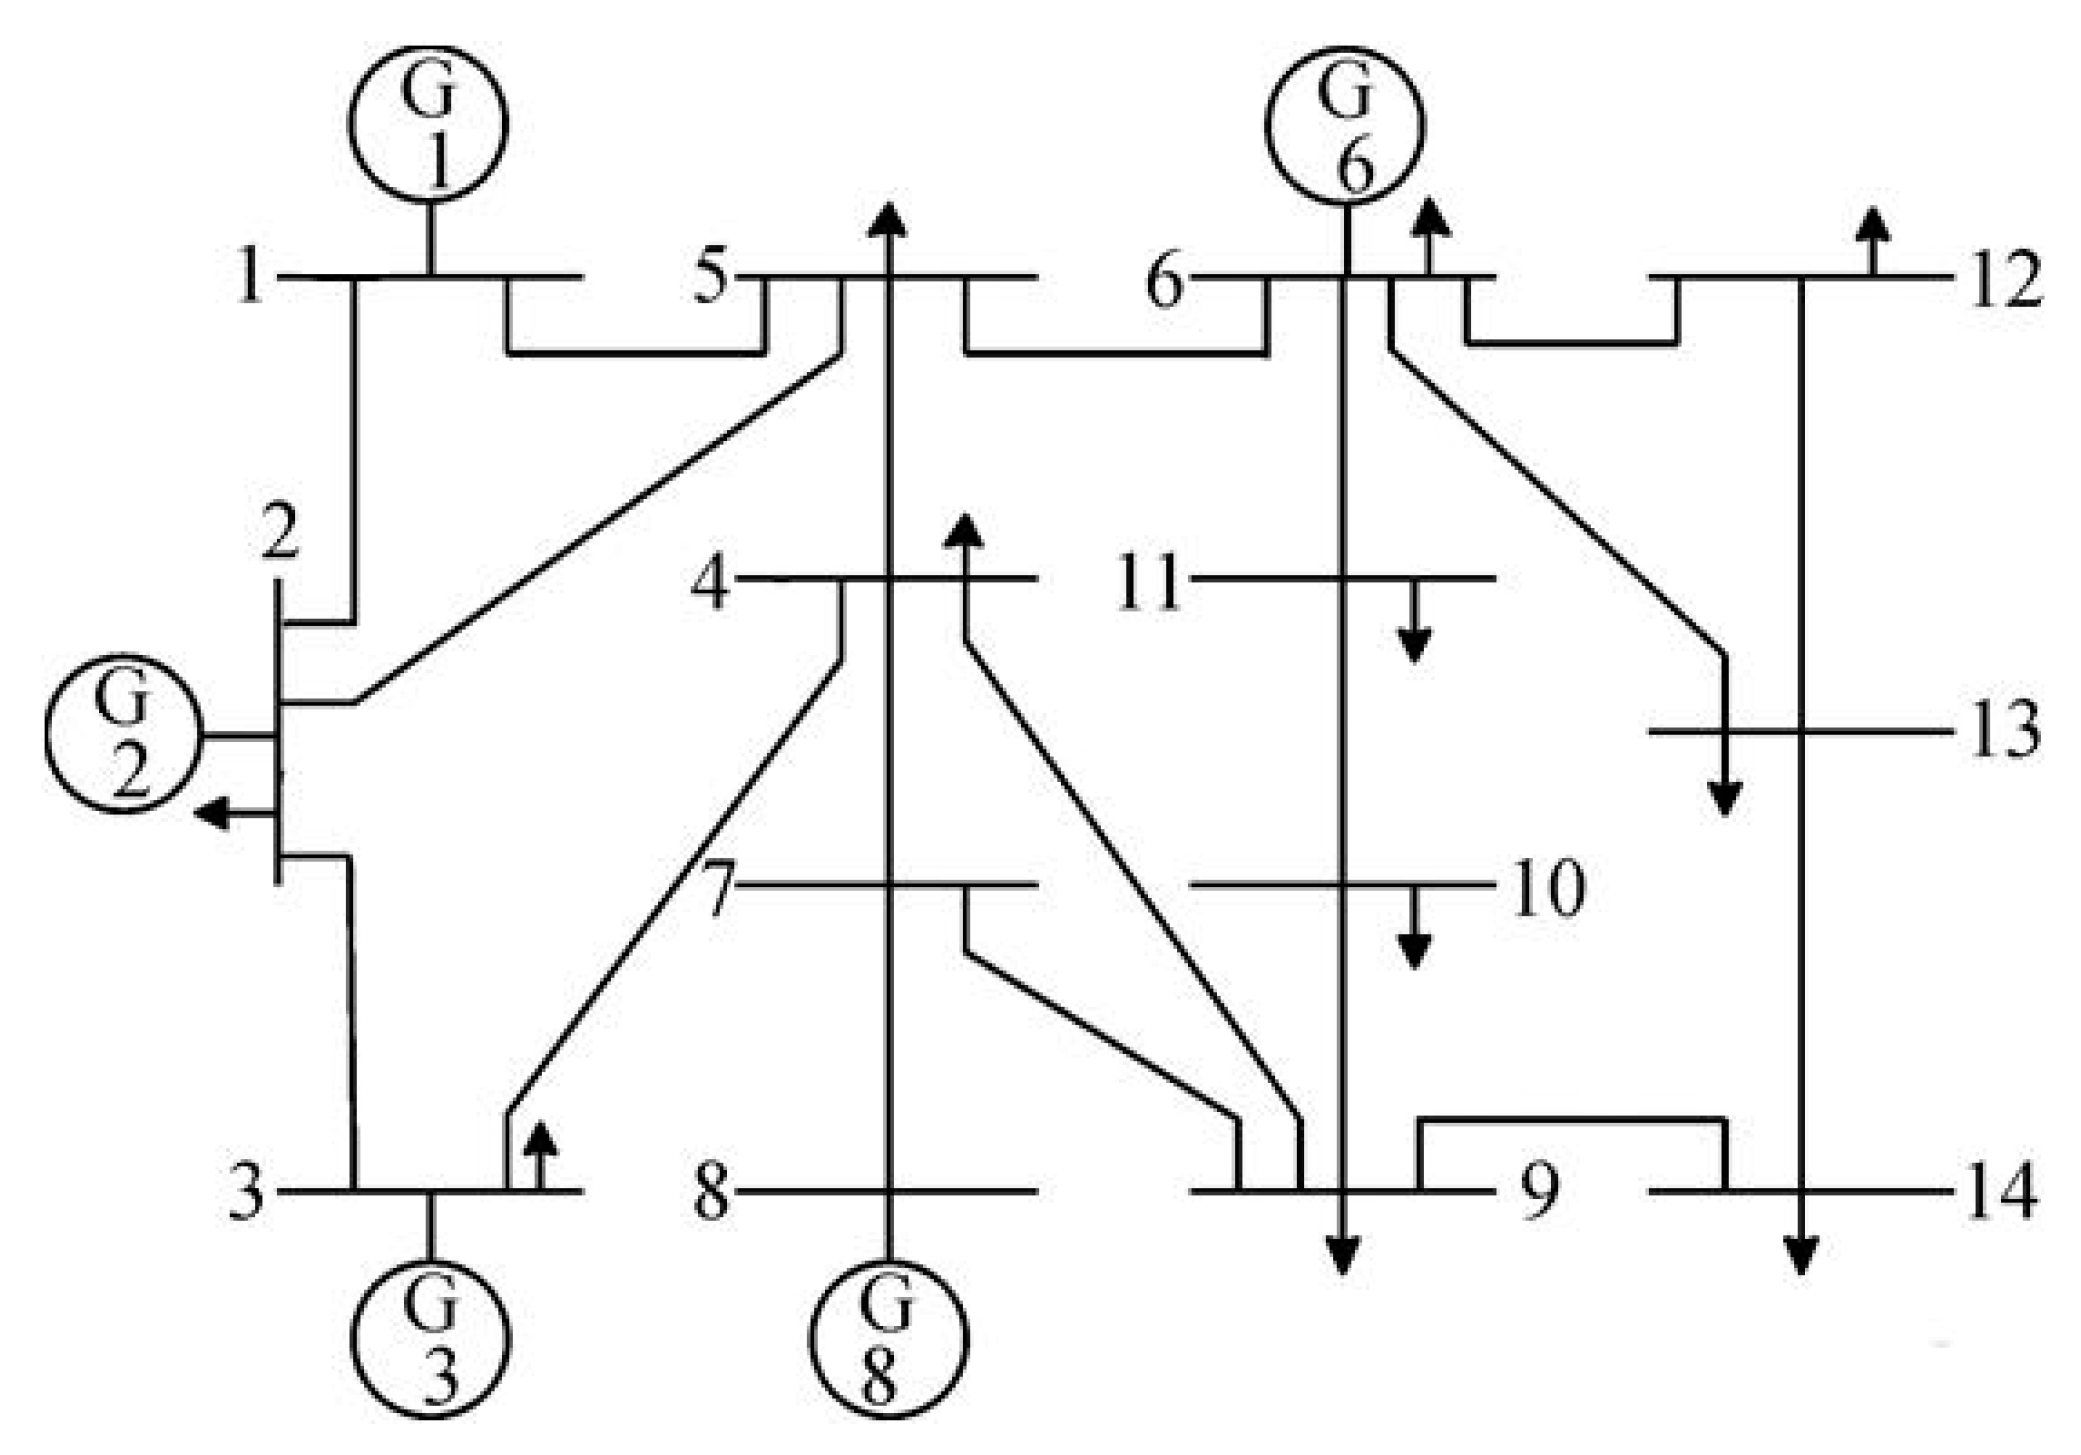
An IEEE 14-bus system was analyzed. The system diagram is visually illustrated in Figure 6 and the parameters of each generator are listed in Table 3. Each generator was regarded as a GENCO. A two-stage problem was designed to simulate the actual trading procedure for a GENCO involved in both the PMCM and the day-ahead market. In accordance with the designed market mechanism, the first stage was the energy contract transaction in the PMCM. Then, a GENCO would take part in the competition of the day-ahead market. All the bilateral contracts, base power generations, and renewable generations were ignored.
The sum of the forecasted load Qf was considered as the demand in the PMCM. The bidding strategies of the GENCOs in the PMCM and the day-ahead market were represented by kc and kd. The strategy sets of kc and kd were both discretized and each set consisted of two choices: high and low. Generally, the strategic variable ranged from 1 to 1.5. Then, 1 and 1.2 were assumed as the low and high choices, respectively. In this experimental study, r0 was set as 0.25 and pref was 80 $/MWh, while the value of ζ is assigned as 3.8.
5.2. Test 1: Comparison of CDA and UDA
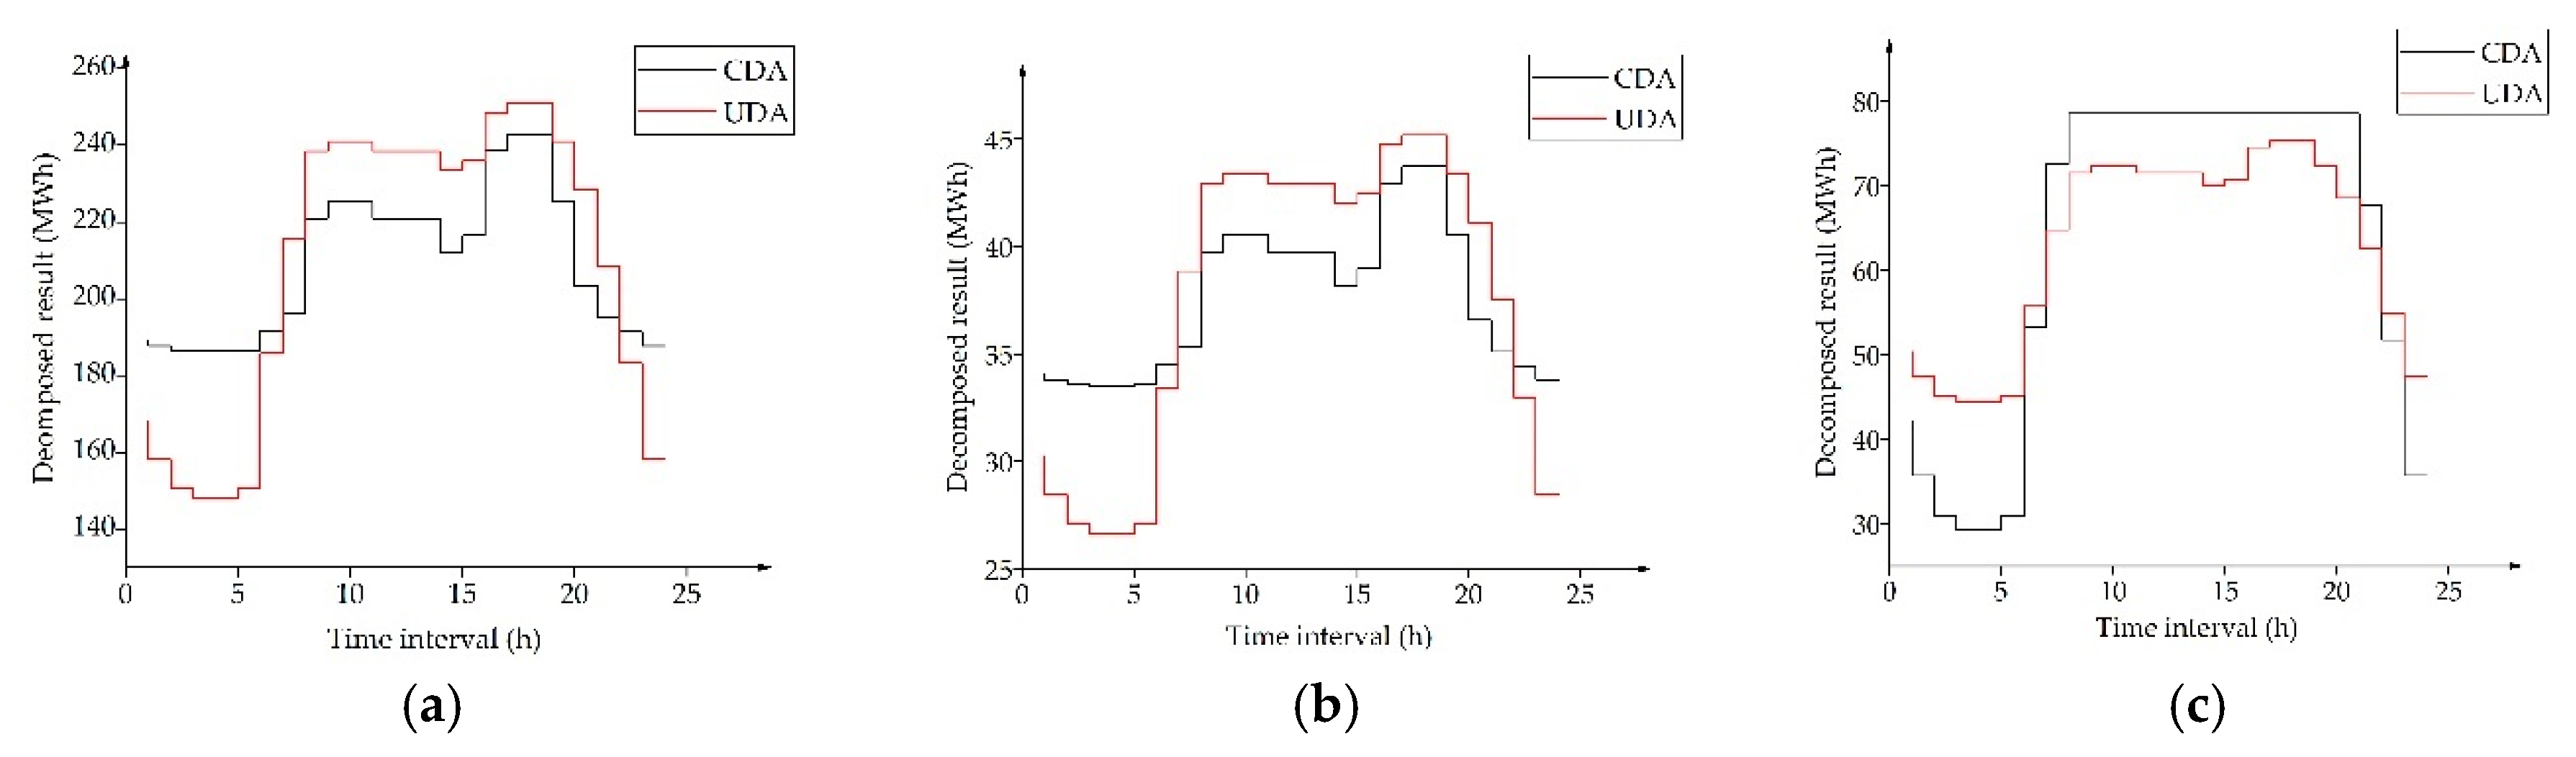
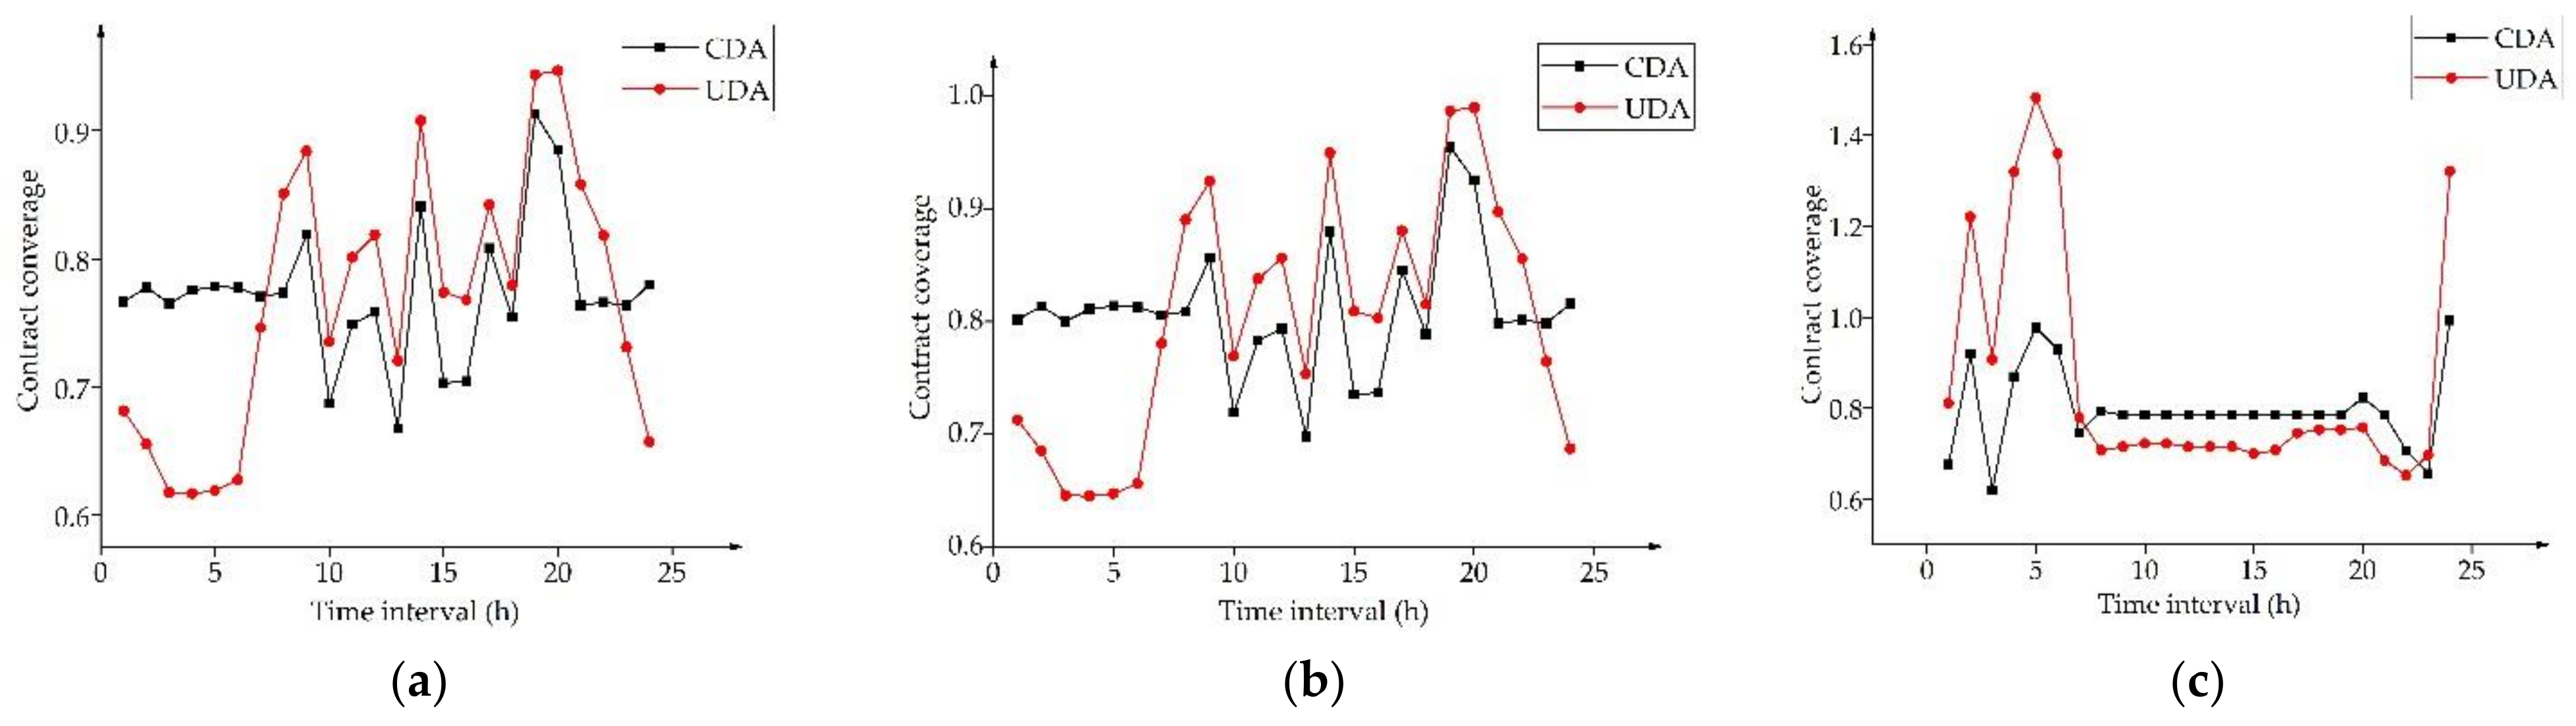
The UDA employs the uniform apportionment ratio for every GENCO, which is calculated from the forecast load curve. The apportionment ratio of the CDA is deduced from simulating the competition of GENCOs in the day-ahead market. The apportionment ratios for the different GENCOs are distinctive. For clarity, we selected a typical day with 24 intervals for illustration. The contract quantity of each GENCO is listed in Table 4. The peak period covers interval 8 to interval 22. The rest of the time intervals belonged to the valley period. The decomposition results of the UDA and CDA are indicated in Figure 7. The actual generations of the GENCOs are calculated based on the real load demand and the marginal costs. The contract coverages of the UDA and CDA are comparatively pictured in Figure 8.
The variable cost of each generator was considered in the CDA. G1 and G2 were the higher-priority GENCOs for generation during the valley period, since the intercepts of G1 and G2 were much smaller than that for G3, G6, and G8, as shown in Table 3. However, the apportionment ratios for G1 and G2 under the UDA were small due to the lower load demand. This conflict was addressed by the CDA as indicated in Figure 7a,b. Under the CDA, the decomposed generations of G1 and G2 were much higher than that under the UDA, which matched with practical market conditions. Contrariwise, the decomposed generations during the valley period of the lower-priority GENCOs, G3, G6, and G8, should be lower as shown in Figure 7c.
During the peak period, G3, G6, and G8 were the higher-priority GENCOs due to the smaller slope of the cost function. Therefore, G3, G6, and G8 deserved more decomposed generations. Conversely, the decomposed generations of the lower-priority G1 and G2 should be curtailed. Compared with the UDA, the improvement of the decomposed generations of G3, G6, and G8, as well as the curtailment of the decomposed generations of G1 and G2, were both significant under the CDA as demonstrated in Figure 7.
The contract coverage under the CDA had a significant improvement as shown in Figure 8. Notably, the coverage improvement under the CDA during the valley period was more apparent. In addition, the temporal fluctuations of the contract coverage under the CDA were effectively reduced compared with that under the CDA.
5.3. Test 2: Market Equilibriums under Different Combinations of Settlement Rules and Decomposition Algorithms
Hour 8 and 9 were typical intervals from the valley and peak periods, respectively. Moreover, the system statuses in these two intervals were opposite. We selected hour 8 and 9 as the simulation conditions in the day-ahead market. The simulated results could be readily extended to other time intervals from the whole time horizon. The load demand of hour 8 and 9 and the relative system status are listed in Table 5.
The dominant policy equilibriums under different combinations of decomposition algorithms and settlement rules are depicted in Table 6 and Table 7, respectively.
Table 6 shows the test results of the combinations of the UDA and the three settlement rules. Table 7 shows the test results of the combinations of the proposed CDA and the three settlement rules. The optimal bidding policy of each GENCO at each stage was shown in columns 3 to 5. The expected profit and revenues of each rule were listed in the last two columns. As observed, all the GENCOs chose to bid truthfully to maximize profits under the combination of the CDA and ICSR. The incentive compatibility principle was satisfied. Under this combination, the expected profit of each GENCO was positive and then the individual rationality principle was confirmed. Moreover, the expected revenue under this combination was the second-lowest. The lowest expected revenue was obtained from the combination of the UDA and the ICSR. However, under this combination, G1 would abuse market power by submitting higher bids in both markets and the expected profits of G3, G6, and G8 were negative. The incentive compatibility and individual rationality principles were not satisfied. On the whole, the cooperation of the CDA and ICSR could better support the integration of the day-ahead market into the current contract markets.
In the final analysis, the central concept of the designed spot market mechanism was the cooperation of the proposed CDA and the ICSR. The designed mechanism would encourage the GENCOs to participate in the market. Furthermore, the payment cost could be significantly reduced. The abuse of market power in both markets was evidenced to be successfully restricted. Thus, the incentive compatibility, payment cost minimization, and individual rationality principles were all met in the designed spot market mechanism. Meanwhile, the contract market in China can continue to operate as before. Therefore, the spot market mechanism will help to further stabilize the market order and facilitate the seamless integration of the upcoming spot market in China.
6. Conclusions
To support the smooth integration of the spot market in China, a spot market mechanism was designed in this paper. In the designed spot market mechanism, the competition in the pool-based contract market was considered and the main goal of the mechanism was to limit the abuse of market power in both markets by controlling the arbitrage opportunities. The proposed CDA and ICSR are the core of the spot market mechanism. The character of the cost function of each generator is incorporated in the CDA and the contract coverage, which will then be improved when no withholding behaviors exist in the contract market. The withholding criterion is embedded in the ICSR. This criterion can help to identify withholding behaviors, following which the settled price will be changed to a punitive price. The NADR helps to reduce the uncovered generations in the market clearing process. Then, the ICSR prices the uncovered generations according to their contributions to the system balance. As demonstrated in the experimental results, the abuse of market power in both markets was effectively restricted and the three mechanism evaluation principles were satisfied.
According to the construction of electricity markets all over the world, the character of the development of an electricity market is path dependency, and China is no exception. At the start-up stage, only the generation side is deregulated and the stabilization of market order should be guaranteed first. The designed mechanism can guide the GENCOs to reveal the truthful marginal costs, thereby avoiding the abuse of market power. Moreover, under this mechanism, the current contract transactions will not be affected and the contract market will be closely coordinated with the spot market. Based on these factors, the reformation of the electricity market in China can be implemented more rapidly and more smoothly. Specifically, the results of this study are supported by the no-arbitrage principle, which sheds light on the design mechanism for multi-markets based on the investigation of arbitrage opportunities. The quantitative analysis of arbitrage opportunities can provide intuitive insights on the effects of contracts and settlement rules on market power mitigation. The theoretical analysis and straightforward consequences demonstrate that this approach is effective, which will be helpful to Chinese regulators in designing or upgrading the spot market mechanism in the near future.
Author Contributions
All authors have worked on this paper and all authors have read and approved the final paper.
Funding
This research is supported by National Natural Science Foundation of China (Grant No. 51677012).
Conflicts of Interest
The authors declare no conflict of interest.
References
- Opinions of the CPC Central Committee and the State Council on Further Deepening the Reform of the Electric Power System. Available online: http://tgs.ndrc.gov.cn/zywj/201601/t20160129_773852.html (accessed on 15 March 2015).
- Notice of the National Development and Reform Commission, the State Energy Bureau on Issuing the Supporting Documents for the Reform of the Electric Power System. Available online: http://www.ndrc.gov.cn/zcfb/zcfbtz/201511/t20151130_760016.html (accessed on 30 November 2015).
- South China Energy Regulatory Office of National Energy Administration. Trading Rules of Electricity Spot Market for Southern China (Start in Guangdong Province). Available online: http://nfj.nea.gov.cn/adminContent/initViewContent.do?pk=7182247 (accessed on 31 August 2018).
- Hao, S. A study of basic bidding strategy in clearing pricing auctions. IEEE Trans. Power Syst. 2002, 15, 975–980. [Google Scholar]
- Hobbs, B.F.; Metzler, C.B.; Pang, J.-S. Strategic gaming analysis for electric power systems: An MPEC approach. IEEE Trans. Power Syst. 2000, 15, 638–645. [Google Scholar] [CrossRef]
- Tao, L.; Shahidehpour, M. Strategic bidding of transmission-constrained GENCOs with incomplete information. IEEE Trans. Power Syst. 2005, 20, 437–447. [Google Scholar]
- Green, R.J.; Newbery, D.M. Competition in the British electricity spot market. J. Political Econ. 1992, 100, 929–953. [Google Scholar] [CrossRef]
- David, A.K.; Wen, F. Market Power in Electricity Supply. IEEE Trans. Energy Convers. 2002, 21, 67–68. [Google Scholar]
- Hobbs, B.F.; Rothkopf, M.H.; Hyde, L.C.; O’Neill, R.P. Evaluation of a Truthful Revelation Auction in the Context of Energy Markets with Nonconcave Benefits. J. Regul. Econ. 2000, 18, 5–32. [Google Scholar] [CrossRef]
- Xu, Y.; Low, S.H. An Efficient and Incentive Compatible Mechanism for Wholesale Electricity Markets. IEEE Trans. Smart Grid 2017, 8, 128–138. [Google Scholar] [CrossRef]
- Silva, C.; Wollenberg, B.F.; Zheng, C.Z. Application of mechanism design to electric power markets (Republished). IEEE Trans. Power Syst. 2001, 16, 862–869. [Google Scholar] [CrossRef]
- Liu, Z.; Zhang, X.; Lieu, J. Design of the incentive mechanism in electricity auction market based on the signaling game theory. Energy 2010, 35, 1813–1819. [Google Scholar] [CrossRef]
- Wang, J.; Zhong, H.; Xia, Q.; Wang, Y.; Lai, X. Competitive Mechanism Design in Electricity Markets Based on Fair Benefit Allocation. In Dianli Xitong Zidonghua/Automation of Electric Power Systems; Nanjing Zidonghua Yanjiusuo/Nanjing Automation Research Institute: Nanjing, China, 2018. [Google Scholar]
- Zou, P.; Chen, Q.; Xia, Q.; He, C.; Kang, C. Incentive compatible pool-based electricity market design and implementation: A Bayesian mechanism design approach. Appl. Energy 2015, 158, 508–518. [Google Scholar] [CrossRef]
- Khan, M.A.; Sun, Y. Exact arbitrage, well-diversified portfolios and asset pricing in large markets. J. Econ. Theory 2003, 110, 337–373. [Google Scholar] [CrossRef]
- Guo, H.; Chen, Q.; Zhong, H.; Yang, W.; Zhang, W.; Xia, Q. Spot Market Mechanism Design and Path Planning Based on Standard Curve for Financial Delivery. Autom. Electr. Power Syst. 2017, 41, 1–8. [Google Scholar]
- Peng, Z.; Chen, Q.; Xia, Q.; Chang, H.E.; Rui, G.E. Logical Analysis of Electricity Spot Market Design in Foreign Countries and Enlightenment and Policy Suggestions for China. Autom. Electr. Power Syst. 2014, 38, 18–27. [Google Scholar]
- Zhou, M.; Yan, Y.; Ding, Q.; Wu, Z.; He, Y.; Long, S. Transaction and Settlement Mechanism for Foreign Representative Power Markets and Its Enlightenment for Chinese Power Market. Autom. Electr. Power Syst. 2017, 41, 1–8. [Google Scholar]
- Weng, W. Brief Analysis on the Philippine Electricity Market with Inspiration to China. Autom. Electr. Power Syst. 2017, 41, 22–26. [Google Scholar]
- Cheng, C.; Chen, F.; Li, G.; Tu, Q. Market Equilibrium and Impact of Market Mechanism Parameters on the Electricity Price in Yunnan’s Electricity Market. Energies 2016, 9, 463. [Google Scholar] [CrossRef]
- Yang, Q.; Cai, H.; Yan, M.; Zhang, M.; Liu, S.; Xing, Y. Design and Application of Electricity Market Mechanism for Yunnan Based on Theory of Incentive Compatibility and Game in Depth. Autom. Electr. Power Syst. 2017, 41, 27–34. [Google Scholar]
- Hull, J.C. Options Futures and Other Derivatives; Pearson Education India: Chennai, India, 2003. [Google Scholar]
- Luenberger, D.G. Investment Science; Oxford University Press: Oxford, UK, 1997. [Google Scholar]
- Bjorgan, R.; Song, H.; Liu, C.C.; Dahlgren, R. Pricing flexible electricity contracts. IEEE Trans. Power Syst. 2000, 15, 477–482. [Google Scholar] [CrossRef]
- Zhang, X.; Wang, X.; Song, Y.H. Modeling and pricing of block flexible electricity contracts. IEEE Trans. Power Syst. 2003, 18, 1382–1388. [Google Scholar] [CrossRef]
- Anderson, E.J.; Hu, X. Forward contracts and market power in an electricity market. Int. J. Ind. Organ. 2008, 26, 679–694. [Google Scholar] [CrossRef]
- Brandts, J.; Pezanis-Christou, P.; Schram, A. Competition with forward contracts: A laboratory analysis motivated by electricity market design. Econ. J. 2010, 118, 192–214. [Google Scholar] [CrossRef]
- McRae, S.; Wolak, F.A. How Do Firms Exercise Unilateral Market Power? Evidence from a Bid-Based Wholesale Electricity Market; European University Institute: Fiesole, Italy, 2009. [Google Scholar]
- Green, R. The Electricity Contract Market in England and Wales. J. Ind. Econ. 1999, 47, 107–124. [Google Scholar] [CrossRef]
- Stoft, S. Power System Economics: Designing Markets for Electricity. J. Energy Lit. 2002, 99, 58–63. [Google Scholar]
- Nam, Y.W.; Yoon, Y.T.; Hur, D.; Park, J.; Kim, S. Effects of long-term contracts on firms exercising market power in transmission constrained electricity markets. Electr. Power Syst. Res. 2006, 76, 435–444. [Google Scholar] [CrossRef]
- Wolfram, C.D. Measuring Duopoly Power in the British Electricity Spot Market. Am. Econ. Rev. 1999, 89, 805–826. [Google Scholar] [CrossRef]
- Allaz, B.; Vila, J.L. Cournot Competition, Forward Markets and Efficiency. J. Econ. Theory 1993, 59, 1–16. [Google Scholar] [CrossRef]
- Newbery, D.M. Power Markets and Market Power. Energy J. 1995, 16, 39–66. [Google Scholar] [CrossRef]
- Wolak, F.A. An Empirical Analysis of the Impact of Hedge Contracts on Bidding Behavior in a Competitive Electricity Market. Int. Econ. J. 2000, 14, 1–39. [Google Scholar] [CrossRef]
- Borenstein, S. The Trouble with Electricity Markets: Understanding California’s Restructuring Disaster. J. Econ. Perspect. 2002, 16, 191–211. [Google Scholar] [CrossRef]
- Yu, Y.; Jin, T.; Zhong, C. Designing an Incentive Contract Menu for Sustaining the Electricity Market. Energies 2015, 8, 12419. [Google Scholar] [CrossRef]
- Strbac, G.; Wolak, F.A. Electricity Market Design and Renewables Integration in Developing Countries; University of California: Berkeley, CA, USA, 2017. [Google Scholar]
- Panel, M.M.S. Report on An Investigation into Allegation of Withholding of Coal-fired Generation. Available online: http://www.ontarioenergyboard.ca/oeb/_Documents/MSP/MSP_Report_Coal-Withholding-Complaint.pdf (accessed on 9 September 2011).
- Miller, N.H.; Podwol, J. Forward Contracts, Market Structure, and the Welfare Effects of Merger; Social Science Electronic Publishing: New York, NY, USA, 2017. [Google Scholar]
- Brown, D.P.; Eckert, A. Electricity market mergers with endogenous forward contracting. J. Regul. Econ. 2017, 51, 269–310. [Google Scholar] [CrossRef]
- Moiseeva, E.; Hesamzadeh, M.R.; Bunn, D.W.; Biggar, D.R. The Strategic Effects of Lack of Transparency in Forward Contracting by Generators with Market Power; PESD Working Paper Series 106; Stanford University: Stanford, CA, USA, 2018. [Google Scholar]
- Petoussis, A.G.; Zhang, X.; Petoussis, S.G.; Godfrey, K.R. Parameterization of Linear Supply Functions in Nonlinear AC Electricity Market Equilibrium Models—Part I: Literature Review and Equilibrium Algorithm. IEEE Trans. Power Syst. 2013, 28, 650–658. [Google Scholar] [CrossRef]
- Weber, J.D.; Overbye, T.J. A Two-Level Optimization Problem for Analysis of Market Bidding Strategies. In Proceedings of the 1999 IEEE Power Engineering Society Summer Meeting, Edmonton, AB, Canada, 18–22 July 1999; Volume 2, pp. 682–687. [Google Scholar]
Figure 1.
Relationship between xt and δt. (a) Peak load period. (b) Valley load period.

Figure 2.
Relationship between the cleared generation and bidding strategy of GENCO m under the NADR.
Figure 2.
Relationship between the cleared generation and bidding strategy of GENCO m under the NADR.

Figure 3.
Curves for function F and settled prices. (a) Function F. (b) Settled prices of the three rules.
Figure 3.
Curves for function F and settled prices. (a) Function F. (b) Settled prices of the three rules.

Figure 4.
Overview of the proposed market mechanism.

Figure 5.
Scenario tree for two-stage problems.

Figure 6.
IEEE 14-bus system.

Figure 7.
Comparisons for decomposed results between the decomposition algorithms. (a) Decomposed results of G1. (b) Decomposed results of G2. (c) Decomposed results of G3, G6, G8.
Figure 7.
Comparisons for decomposed results between the decomposition algorithms. (a) Decomposed results of G1. (b) Decomposed results of G2. (c) Decomposed results of G3, G6, G8.

Figure 8.
Comparisons for contract coverage between the decomposition algorithms. (a) Contract coverage of G1. (b) Contract coverage of G2. (c) Contract coverage of G3, G6, G8.
Figure 8.
Comparisons for contract coverage between the decomposition algorithms. (a) Contract coverage of G1. (b) Contract coverage of G2. (c) Contract coverage of G3, G6, G8.


Table 1.
Performance of different settlement rules during the peak period (λt > pc).
| Condition | Effective Incentive | LMP-SR | NASR | ICSR | ||||
|---|---|---|---|---|---|---|---|---|
| Price | AOF | Price | AOF | Price | AOF | |||
| 1 | xt < 0, ymt > 0 | + | λ | + | pc | 0 | + | |
| 2 | xt<0, ymt < 0 | – | λ | – | λ | – | λ | – |
| 3 | xt > 0, ymt > 0 | – | λ | + | λ | + | pc | 0 |
| 4 | xt > 0, ymt < 0 | + | λ | – | pc | 0 | pc | 0 |
Table 2.
Performance of different settlement rules during the valley period (λt < pc).
| Condition | Effective Incentive | LMP-SR | NASR | ICSR | ||||
|---|---|---|---|---|---|---|---|---|
| Price | AOF | Price | AOF | Price | AOF | |||
| 5 | xt < 0, ymt > 0 | + | λ | – | pc | 0 | – | |
| 6 | xt < 0, ymt < 0 | – | λ | + | λ | + | pc | 0 |
| 7 | xt > 0, ymt > 0 | – | λ | – | λ | – | λ | – |
| 8 | xt > 0, ymt < 0 | + | λ | + | pc | 0 | λ | + |
Table 3.
Parameters of generators of IEEE 14-bus system.
| Unit ID | Max Production (MW) | Cost Coefficient | ||
|---|---|---|---|---|
| a ($/MWh2) | b ($/MWh) | c ($) | ||
| G1 | 332.4 | 0.0430293 | 20 | 0 |
| G2 | 140 | 0.25 | 20 | 0 |
| G3 | 100 | 0.01 | 40 | 0 |
| G6 | 100 | 0.01 | 40 | 0 |
| G8 | 100 | 0.01 | 40 | 0 |
Table 4.
Contract quantity of each GENCO.
| Unit ID | G1 | G2 | G3 | G6 | G8 |
|---|---|---|---|---|---|
| Contract quantity (MWh) | 5000 | 900 | 1500 | 1500 | 1500 |
Table 5.
Load level and system status for hours 8 and 9.
| Time Interval | Forecast (MW) | Actual (MW) | System Status |
|---|---|---|---|
| 8 | 575 | 600 | Upregulation |
| 9 | 635 | 620 | Downregulation |
Table 6.
Dominant policy equilibriums under the combinations of the three rules and the UDA.
| Settlement Rule | Dominant Policy | Expected Profit ($) | Expected Revenue ($) | |||
|---|---|---|---|---|---|---|
| Unit ID | PMCM | Day-Ahead Market | ||||
| Hour 8 | Hour 9 | |||||
| LMP-SR | G1 | H | L | L | 11,261 | 24,854 |
| G2 | H | H | H | 2621 | 6594 | |
| G3 | H | H | H | 1531 | 9631 | |
| G6 | H | H | H | 1531 | 9631 | |
| G8 | H | H | H | 1531 | 9631 | |
| NASR | G1 | H | L | L | 11026 | 24,619 |
| G2 | H | L | H | 2466 | 6439 | |
| G3 | H | L | H | 1324 | 9424 | |
| G6 | H | L | H | 1324 | 9424 | |
| G8 | H | L | H | 1324 | 9424 | |
| ICSR | G1 | H | H | H | 9451.1 | 20,350 |
| G2 | L | L | L | 1032.1 | 5006 | |
| G3 | L | L | L | −84 | 8016 | |
| G6 | L | L | L | −84 | 8016 | |
| G8 | L | L | L | −84 | 8016 | |
Table 7.
Dominant policy equilibriums under the combinations of the three rules and the CDA.
| Settlement Rule | Dominant Policy | Expected Profit ($) | Expected Revenue ($) | |||
|---|---|---|---|---|---|---|
| Unit ID | PMCM | Period 8 | Period 9 | |||
| LMP-SR | G1 | H | L | L | 11,326 | 24,918 |
| G2 | H | H | H | 2639 | 6613 | |
| G3 | H | H | H | 1488 | 9588 | |
| G6 | H | H | H | 1488 | 9588 | |
| G8 | H | H | H | 1488 | 9588 | |
| NASR | G1 | H | L | L | 11059 | 24651 |
| G2 | H | L | H | 2476 | 6450 | |
| G3 | H | L | H | 1302 | 9402 | |
| G6 | H | L | H | 1302 | 9402 | |
| G8 | H | L | H | 1302 | 9402 | |
| ICSR | G1 | L | L | L | 9095.9 | 22688 |
| G2 | L | L | L | 975 | 4948 | |
| G3 | L | L | L | 448.2 | 8548 | |
| G6 | L | L | L | 448.2 | 8548 | |
| G8 | L | L | L | 448.2 | 8548 | |
© 2019 by the authors. Licensee MDPI, Basel, Switzerland. This article is an open access article distributed under the terms and conditions of the Creative Commons Attribution (CC BY) license (http://creativecommons.org/licenses/by/4.0/).
Share and Cite
MDPI and ACS Style
Zhang, C.; Yan, W. Spot Market Mechanism Design for the Electricity Market in China Considering the Impact of a Contract Market. Energies 2019, 12, 1064. https://doi.org/10.3390/en12061064
AMA Style
Zhang C, Yan W. Spot Market Mechanism Design for the Electricity Market in China Considering the Impact of a Contract Market. Energies. 2019; 12(6):1064. https://doi.org/10.3390/en12061064
Chicago/Turabian StyleZhang, Chen, and Wei Yan. 2019. "Spot Market Mechanism Design for the Electricity Market in China Considering the Impact of a Contract Market" Energies 12, no. 6: 1064. https://doi.org/10.3390/en12061064
Note that from the first issue of 2016, this journal uses article numbers instead of page numbers. See further details here.