Study of Floating Wind Turbine with Modified Tension Leg Platform Placed in Regular Waves


School of Mechanical Engineering, Pusan National University, 2, Busandaehak-ro 63beon-gil, Geumjeong-gu, Busan 46241, Korea
*
Author to whom correspondence should be addressed.
Energies 2019, 12(4), 703; https://doi.org/10.3390/en12040703
Submission received: 17 December 2018
/
Revised: 18 February 2019
/
Accepted: 19 February 2019
/
Published: 21 February 2019
(This article belongs to the Special Issue Wind Turbine Power Optimization Technology)
Abstract
:In this study, the typical ocean environment was simulated with the aim to investigate the dynamic response under various environmental conditions of a Tension Leg Platform (TLP) type floating offshore wind turbine system. By applying Froude scaling, a scale model with a scale of 1:200 was designed and model experiments were carried out in a lab-scale wave flume that generated regular periodic waves by means of a piston-type wave generator while a wave absorber dissipated wave energy on the other side of the channel. The model was designed and manufactured based on the standard prototype of the National Renewable Energy Laboratory (NREL) 5 MW offshore wind turbine. In the first half of the study, the motion and structural responses for operational wave conditions of the North Sea near Scotland were considered to investigate the performance of a traditional TLP floating wind turbine compared with that of a newly designed TLP with added mooring lines. The new mooring lines were attached with the objective of increasing the horizontal stiffness of the system and thereby reducing the dominant motion of the TLP platform (i.e., the surge motion). The results of surge translational motions were obtained both in the frequency domain, using the response amplitude operator (RAO), and in the time domain, using the omega arithmetic method for the relative velocity. The results obtained show that our suggested concept improves the stability of the platform and reduces the overall motion of the system in all degrees-of-freedom. Moreover, the modified design was verified to enable operation in extreme wave conditions based on real data for a 100-year return period of the Northern Sea of California. The loads applied by the waves on the structure were also measured experimentally using modified Morison equation—the formula most frequently used to estimate wave-induced forces on offshore floating structures. The corresponding results obtained show that the wave loads applied on the new design TLP had less amplitude than the initial model and confirmed the significant contribution of the mooring lines in improving the performance of the system.
1. Introduction
Offshore wind turbines generate more electricity than their onshore counterparts owing to higher wind speeds occasioned by the low surface roughness of the ocean. Due to increased interest in the design of offshore wind farms, the foundation of traditional fixed-bottom offshore wind turbines has been changing to the prolific floating type, which may be more feasible and less expensive for deep water. The diversity in the specifications of each floating platform type and the fact that wind turbines encounter a variety of wind, current, and wave loading at sea have resulted in active research into the dynamic response of offshore floating wind turbine support systems under various conditions with a view to ensuring security and reliability.
Jonkman et al. [1] provided the characteristics and specifications of the National Renewable Energy Laboratory (NREL) 5 MW offshore wind turbine, which is now considered the baseline wind turbine. This model has been mounted on various types of floating platforms and studies conducted on each structure. Wayman and Scalavonous [2] conducted comparative static and dynamic analyses of a Tension Leg Platform (TLP) FOWT and a shallow drafted barge FOWT to explore the effects of water depth, wind speed, and combined wind–wave conditions on system performance. In their study, they evaluated the response amplitude operator (RAO) standard deviation of the system in order to define the natural frequency at each degree of freedom. Lee [3] investigated the dynamic response of a spar buoy wind turbine by defining the nacelle acceleration, dynamic tensions on catenaries, and maximum tension acting on the anchors based on an extreme sea state condition for a 100-year return period. Lee showed that as water depth decreases the dynamic performance of the system becomes more challenging. Naqvi [4] performed experiments using a 1:100 scale TLP and spar buoy derived from the NREL prototype to study the motion and tension in the cables in response to regular waves and operational wind speed.
Hong et al. [5] utilized a 1:100 spar buoy to analyze the effects of center of gravity, mooring line tension, and fairlead location on the translational and rotational deviations of the system in response to regular waves. Most of the previous studies in this area were concentrated on analyzing the behavior of the platform under various environmental conditions. However, several studies were conducted in which either the best features of the platforms were combined or a new design was developed in order to increase the performance of the structure and minimize the drawbacks of each platform in a manner that enhanced the structural stability of the system to satisfactorily withstand all the environmental loads. Withee [6] studied the coupled dynamic analysis of a floating wind turbine system that combined the best features of both the TLP and the spar buoy with the objective of dampening the pitch and roll and reducing the loads on the structure. In the study, all modes of motion and the tether forces were investigated experimentally and numerically for a range of operational as well as severe wave and wind conditions. Murray et al. [7] proposed a 1:92 model of an extended TLP for deployment at a water depth of 1500 m and investigated its corresponding extreme responses, tether tensions, and platform deviations.
Karimirad and Moan [8] subsequently analyzed a spar-type offshore wind turbine with two distinct mooring systems under operating and survival conditions and focused on their stochastic dynamic motion and structural responses. The first concept was a catenary-moored spar wind turbine that used a taut system instead of the catenary mooring lines normally used for the spar buoy, while the second design was a spar with a tension leg mooring. The latter design consisted of a spar platform mounted in a single pre-tensioned mooring line. Experiments were carried out on the effect of hydrodynamic damping and the extreme structural responses under intense environmental conditions to examine the wind–wave-induced and wave-induced responses on the two mooring model concepts. Nianxin et al. [9] carried out experiments on a 1:60 TLP model to investigate the performance of the floating wind turbine in a coupled wind–wave environment. The model was derived from another prototype of TLP and additional catenaries were attached to it. The platform motion in surge, sway, and heave, as well as the tether forces, were investigated. Martinez et al. [10] studied the feasibility of a semi-floating spar buoy wind turbine attached to mooring lines strongly anchored to the bed with a spherical joint, with the objective of reducing the oscillations of the system and thereby reducing the fatigue and maximum loads compared to the spar buoy turbine. Regarding the data modeling of sea height, there have been a series of measurements taken at the Northern Sea near Scotland (see Hadjihosseini et al. [11,12,13]). In addition, the approach to analyze the evolution of stochastic properties associated to the operation of wind turbines has been made, particularly in what concerns loads on the wind turbine (see Lind et al. [14,15]). Regarding the aeroelastic behavior, such as the case when the turbine is in power production the dynamic response, the behavior of wind turbine is completely different due to a significant increase of aerodynamic damping (see Marino et al. [16,17]). Regarding the improvements of Morison equation for steep waves and for diffraction regimes, there have been some reference works (see Nielsen et al. [18]; Paulsen et al. [19]; Bredmose et al. [20]; Patel and Witz [21]).
In this study, the design of the traditional TLP floating platform derived from the NREL prototype and a conceptual TLP design with additional mooring lines were experimentally investigated. The additional mooring lines reinforce the horizontal stiffness of the system and thereby diminish the dominant motion, which is obviously the surge motion, to enable safe performance in deep water. In the study, a series of experiments were conducted using a 1:200 scale model to determine the impact of waves on the performance of the model. The range of operational and extreme waves used in the experiments was based on real data for a 100-year return period of the Northern Sea of California to ensure the feasibility of installing the new system in the chosen site. Another objective of this study was determination of the wave loads on the platform; this was achieved experimentally using the Morison equation.
Previous studies predominantly focused on measurement of the wave loads acting on a fixed-bottom offshore wind turbine. Peeringa [22] showed that an acceptable prediction of the wave loads for non-breaking waves is achievable by using the Morison equation and the stream function wave model. However, the hydrodynamic forces are underestimated by the applied methods in the case of breaking and post-breaking waves. Journee and Massie [23] and Sarpkay and Isaacson [24] proposed various methods to define the drag and inertia coefficients for better estimation of the solution to the Morison equation. Burrows et al. [25] also defined several techniques, such as least square, cross-spectral, and the methods of moments, to identify these coefficients, and subsequently measured the wave loads using the Morison equation to prove the accuracy of predicting random forces using the equation. The measured data were later shown to sufficiently match the predicted values, which confirmed the suitability of the equation for measuring wave loads. Henderson [26] subsequently enumerated several methods to determine wave load models and structural dynamics models depending not only on the turbine selected but also the support structure. The studies conducted revealed that the selection of a relevant approach for defining the resulting loads plays a fundamental role in the cost of the structure and its ability to resist environmental loads. Dean and Dalrymple [27] presented several methods to define appropriate wave kinematics theoretically or experimentally.
Considering the results of the above studies, in this study, the Morison equation was applied to measure the wave loading on the offshore wind turbine’s TLP platform to verify its accuracy in predicting the wave loading on an offshore floating structure. The remainder of this paper is organized as follows: Section 2 describes the experimental setup used to perform the experiments on the scale model. An enumeration of the main properties of the model along with the laws that permit scaling it down and a sketch of the new design are also given, and the difficulties and errors dealt with while performing the experiments outlined. Section 3 provides a theoretical outline of all the governing equations used in our study in order to facilitate a thorough understanding of the physics underlying the phenomena under investigation. Section 4 analyzes, discusses, and interprets the data collected in the experiments. The data are associated with both the dynamic performance of the two concepts in response to regular and extreme waves and also the wave loading on the structure. Finally, Section 5 concludes by summarizing all the results obtained and outlines plans for further work.
2. Design of the Laboratory Experiment
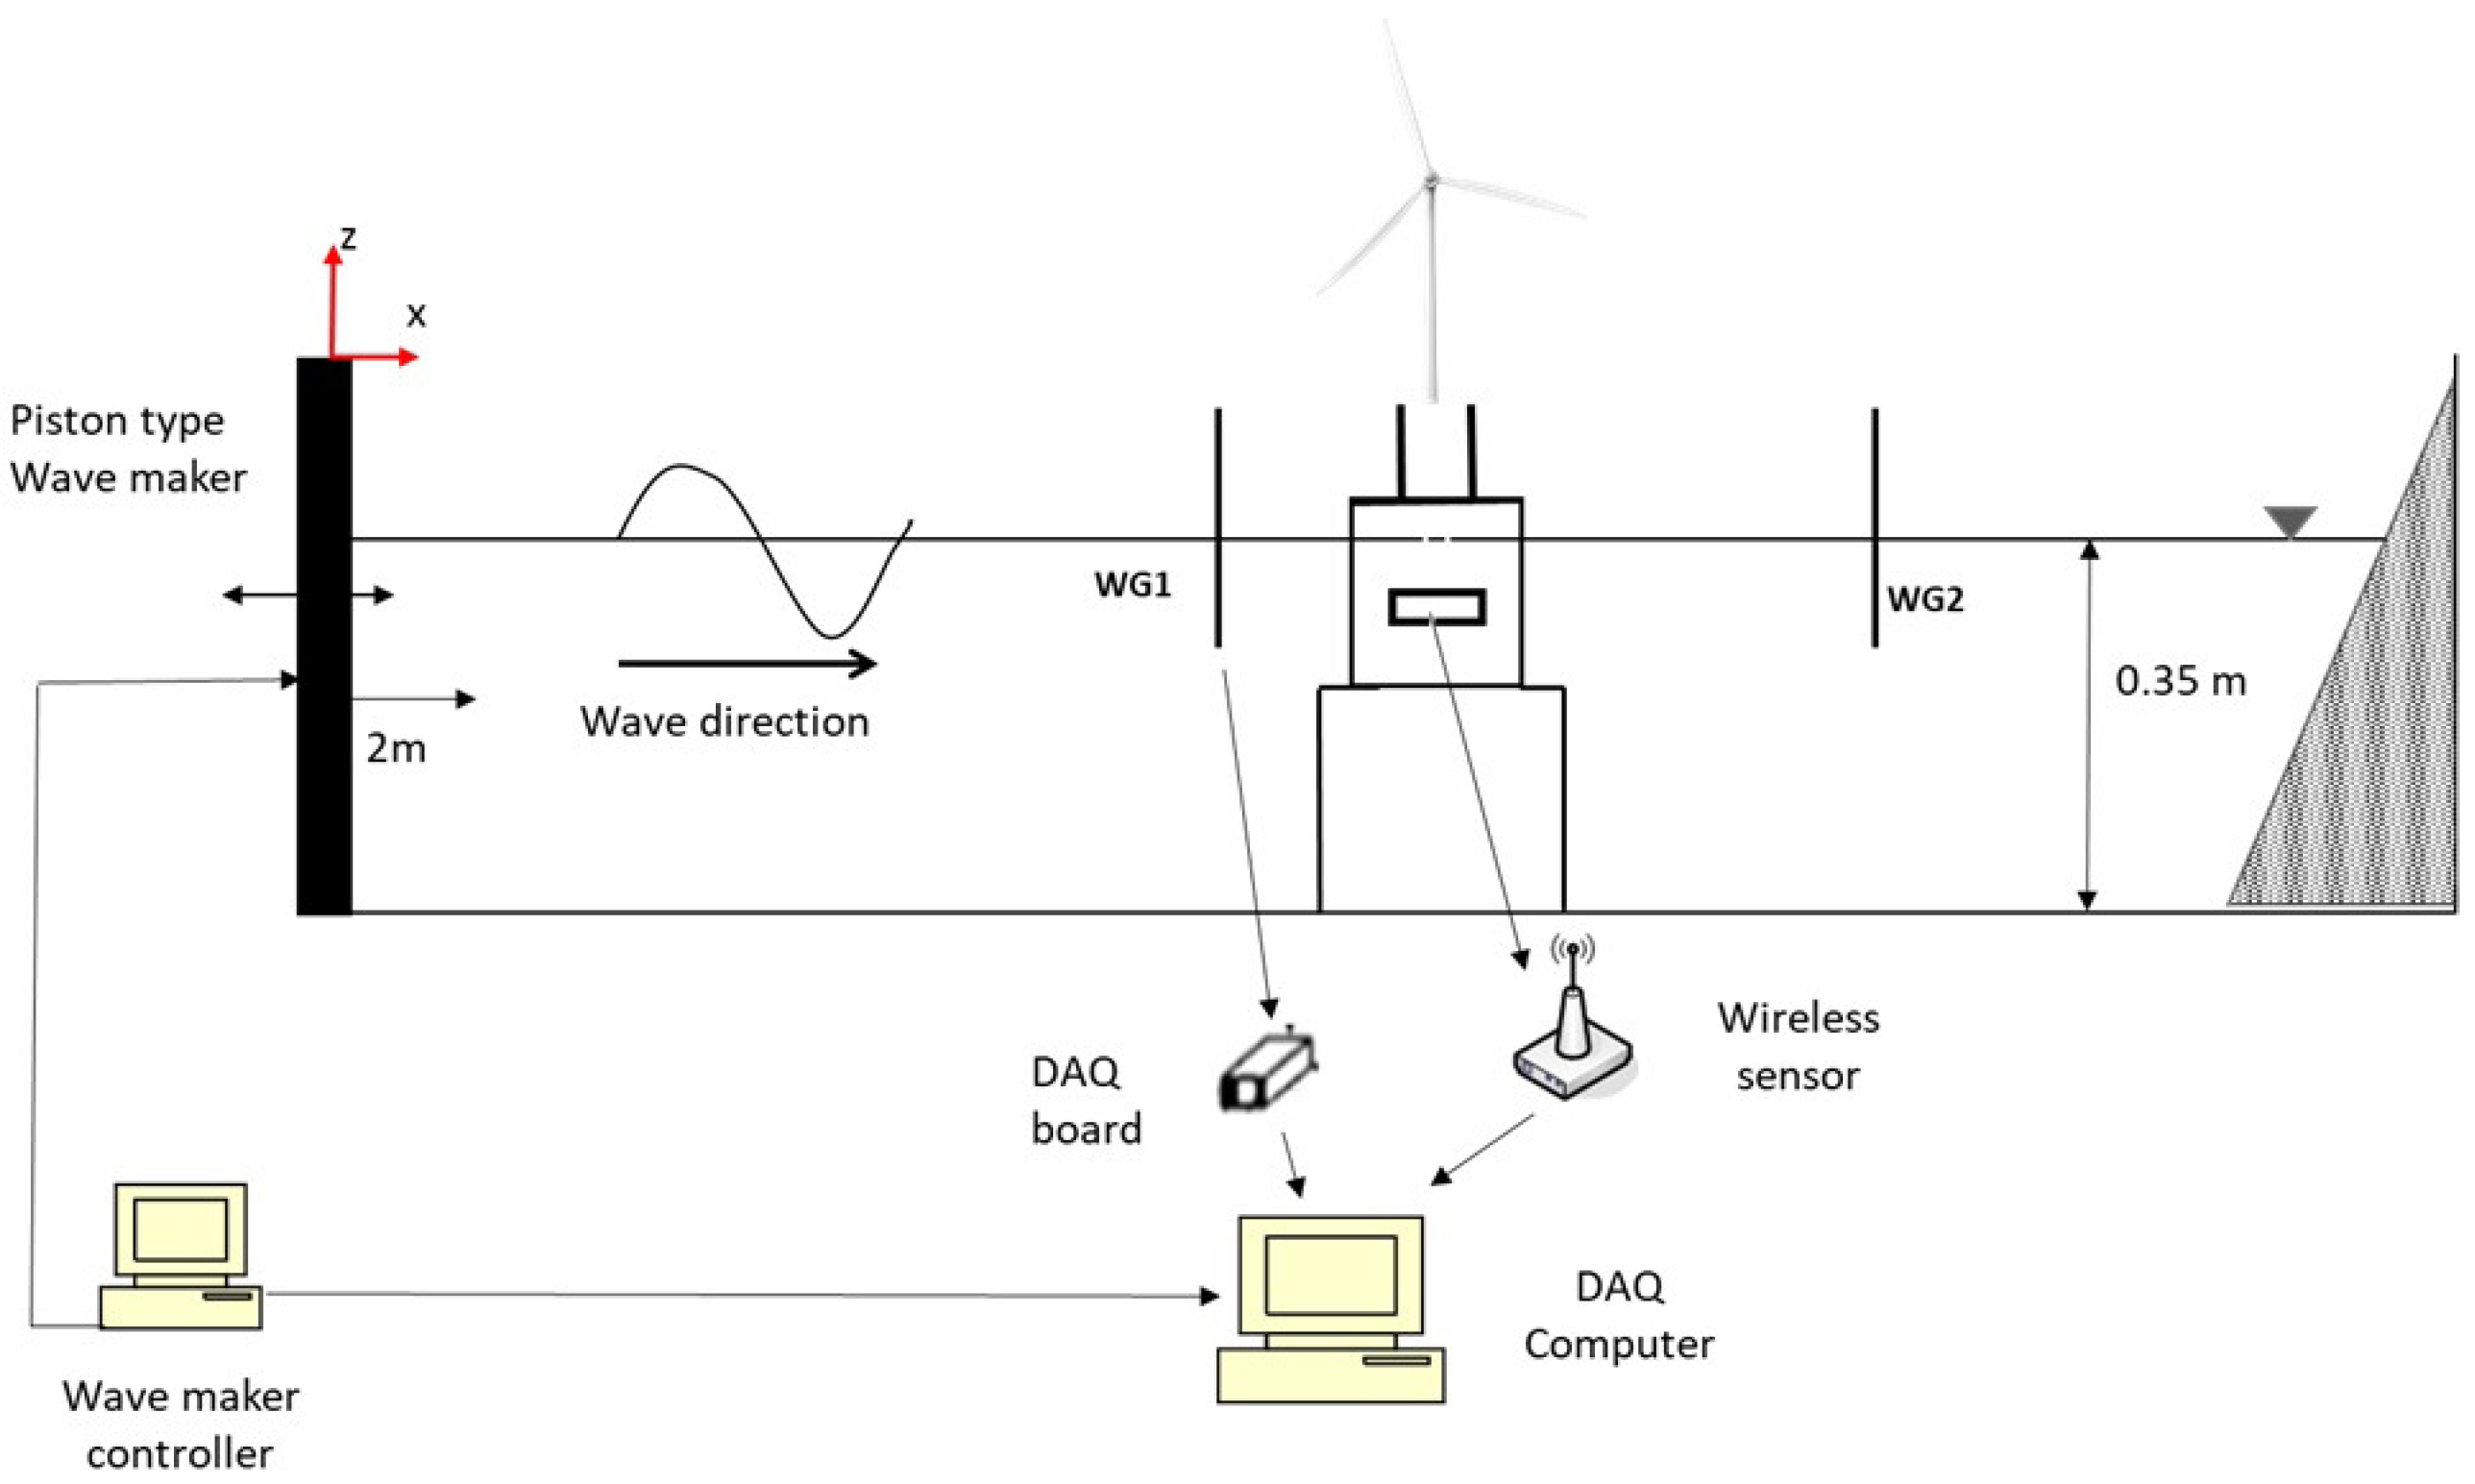
Considering the dimensional restrictions imposed by the wave flume, the scale of the model was set at 1:200. The subscript “m” denotes the scale of the model and “p” the scale of the prototype (see Figure 1). Froude scaling was applied in order to establish scaling factors between the model and the full-scale prototype (Jonkman et al. [1]). The latter was derived from the NREL 5 MW wind turbine. In the flume experiment, the piston-type wave maker was used to generate a propagating wave more effectively because the horizontal water particle velocities of the wave and paddle are nearly constant over the water column. In the flume, a passive wave absorbers comprised a hard filling material was installed in the channel. Based on the wave theory and reflectance, two wave gauges (KENEK, Wave height Meter CH-606) were used to take proper samples for a period, approximately 30 s (see more details in the papers of Lim [28] and Zhu and Lim [29]). To make reliable result, the experiment considered the effect of evanescent waves in the wave flume, which could contaminate test areas leading unexpected data. To avoid this effect, the model was placed around three times away from the wave maker. However, due to the size limitation of the wave flume, the influence of evanescent waves was not severe, but still remained (see Lim [28] and Zhu and Lim [29]).
The model was made from acrylic plastic; the design parameters for all the various dimensions, which were scaled according to Froude law, are listed in Table 1. The shape was identical to that of the prototype and the model surface was smooth in order to prevent deterioration of the surface over time and model deformations. However, scaling all the parameters precisely was difficult to achieve because of the large scale chosen for our study and the fact that we were primarily interested in the hydrodynamic motion of the platform. For these reasons, the aerodynamic properties of the wind turbine were not scaled, which means that the blades, rotor, and nacelle were not taken into consideration and only the height of the tower along with the overall mass of both the tower and the rotor nacelle assembly were matched with the real wind turbine parameters for the 5 MW wind turbine specifications (see Jonkman et al. [1]). In addition, for the TLP model, as proven previously, the larger is the length scale, the more dominant will be the scale effects, and the more complicated it will be to obtain identical ratios between the model and its prototype. Thus, the model was scaled more to the perfect weight than the perfect length in such a manner as not to impair the scaling of the moment of inertia of the system, which is a parameter that is directly proportional to both the length and the weight.
The modified concept developed in this study was actualized by connecting additional mooring catenaries to the system (see Figure 2). The catenaries were directly attached to the platform in the bottom surface in order to increase the horizontal stiffness and give more stability to the system. As shown in Figure 2, the rigid body, comprising the wind turbine and the floating support, undergoes oscillatory translational and rotational motions as a result of wind and wave loadings. Surge and sway ( and ) describe horizontal motions along the x and y axes, respectively. The horizontal axes of the system were aligned with the four spokes to which the floater tethers were connected. Heave () represents the vertical motion of the floater. The oscillatory angular motions are referred to as the roll, pitch, and yaw. The surge, sway, and yaw describe the three rigid-body motions. The tether lengths were assumed to remain constant during rigid-body motion.
Figure 3 illustrates the configuration of the modified TLP with the added inclined lines. Four small holes were drilled in the bottom surface of the cylinder and filled with glue. The steel wire ropes, containing a soft spring at each line, were then introduced into the holes and glue applied to make it harden. The combination of spring and steel wire resulted in a non-homogeneous model for modeling the axial stiffness and neglecting the bending stiffness (Bartrop [30]).
The scale model tests were then carried out in the wave flume of our laboratory. (see Table 2) On one side, the wave tank was fitted with a piston-type wave maker that generated regular monochromatic waves with different heights and periods. On the downstream section of the flume, a wave absorber was installed to dissipate wave energy and to avoid reflected waves inside the tank.
The response of the TLP model to the wave loading was then studied through a sensor via a wireless data acquisition system, which eliminated the need for cables that would otherwise affect the platform motions and hence the experimental results. The sensor used in the experiments was placed inside the cylinder of the model’s platform; it facilitated the measurement of six degrees-of-freedom deviations simultaneously. The waves generated by the wave maker were recorded using the wave gauge placed upstream of the model, and the depth of water in the flume was kept constant. The order of the test wave amplitudes was varied from 0 to 40 mm with a test wave period from 0.4 to 2 s. The experimental data were recorded and controlled using National Instruments LabVIEW software.
3. Theoretical Approach
3.1. Equation of Motion
An offshore wind turbine mounted on a TLP undergoes six degrees-of-freedom motion forming three rigid body translational motions and three rotational motions. When it is excited by waves, the assumption based on the linear hydrodynamic analysis and a linear damping allows the motion equations for surge, heave, pitch, and yaw to be solved in the frequency domain. Sway and roll are identical to surge and pitch, thus are not treated here. It was also assumed that no waves are generated by the floater, since the wavelengths of the ambient waves were assumed to be much greater than the floater diameter. The wave–floater interaction problem can therefore be solved in a simplified manner. The governing equation describing the balancing of the exciting forces for the surge behavior is derived from Newton’s second law (see Withee [6]), and is stated as follows:
and the uncoupled heave and yaw equations of motion are:
where are the components of the mass matrix of the system; and are the frequency-dependent damping and added mass coefficients, respectively; are the external exciting forces due to waves; and are the hydrostatic restoring coefficients.
The term represents the dimensional acceleration of the system in each mode of motion at each frequency, is the system’s velocity in each mode, and is the system’s displacement. The solution to these coefficients is fundamental for solving the equation of motion; a solution procedure was described in detail by Withee [6], with the assumption that the restoring is achieved by a stiff mooring tether that limits any significant motion in pitch and drives the restoring in pitch toward infinity (Wayman and Sclavonous [2]). The eigenvalues of this equation give the natural frequencies for the modes of motion in this study.
In order for the system to be analyzed using linear frequency domain analysis, all of the linear quantities must be analyzed relative to the wave elevation:
where A is the wave amplitude. The linear wave excitation forces acting on the platform are defined relative to the local coordinate system and by virtue of linearity adopt the complex representation:
where is the complex amplitude of the exciting force or moment in the i-direction. The platform motions in the six degrees of freedom also adopt the complex representation:
where is the complex response amplitude for the platform in the j-direction (i.e., RAO).
The water particle components are essential in defining the wave-induced forces on floating structures. Therefore, the Airy wave theory, often called the linear wave theory, was used to predict the horizontal water velocity and acceleration where the cylinder is located (Dean and Dalrymple [27]).
3.2. Modified Morison Equation
In deep water, the waves are assumed to have a low steepness (small wave height compared to wavelength). This enabled us to use the Airy linear wave theory. This latter assumption and the assumption that the waves are unidirectional are considered basic assumptions for the use of the Morison equation for calculating the wave loading on offshore structures.
A simple equation was developed by Morison for calculating the wave loads on floating submerged structures in water. The equation is stated as follows:
where is total wave force; U and are fluid velocity and acceleration, respectively; V and are the relative velocity and acceleration of the floating structure; and are the added-mass and drag coefficient; is density; and D is the cylinder diameter. The first two terms on the right side of the equation represent the inertia forces, while the last term determines the drag forces on the platform. The inertia forces comprise the Froude–Krylov force and the hydrodynamic mass force.
4. Results and Analysis
The scale floating wind turbine model was experimentally tested against a series of regular waves generated by the wave maker to obtain the dynamic response of the system in the six degrees of freedom. Regular wave parameters were chosen based on historical wave data for the North Sea near Scotland, where it was assumed that the offshore TLP wind turbine will operate.
4.1. Surge Dynamic Analysis of the TLP in Response to Regular Wave
All the physical structures including the floaters displayed natural frequencies in their motion. It is well known that a structure tends to oscillate at this frequency when stimulated by external forces. Under resonance conditions, a small force applied at this frequency produces a large oscillatory response. Thus, a dynamic force applied to a physical object causes it to vibrate. It is therefore important to know, on the one hand, the natural frequencies within a system and, on the other hand, the frequencies at which excitation is likely to occur to ensure that they do not coincide. It is generally not possible to control excitation frequencies of excitation, but the natural frequency of a system—which depends on physical characteristics such as mass and stiffness—can be altered.
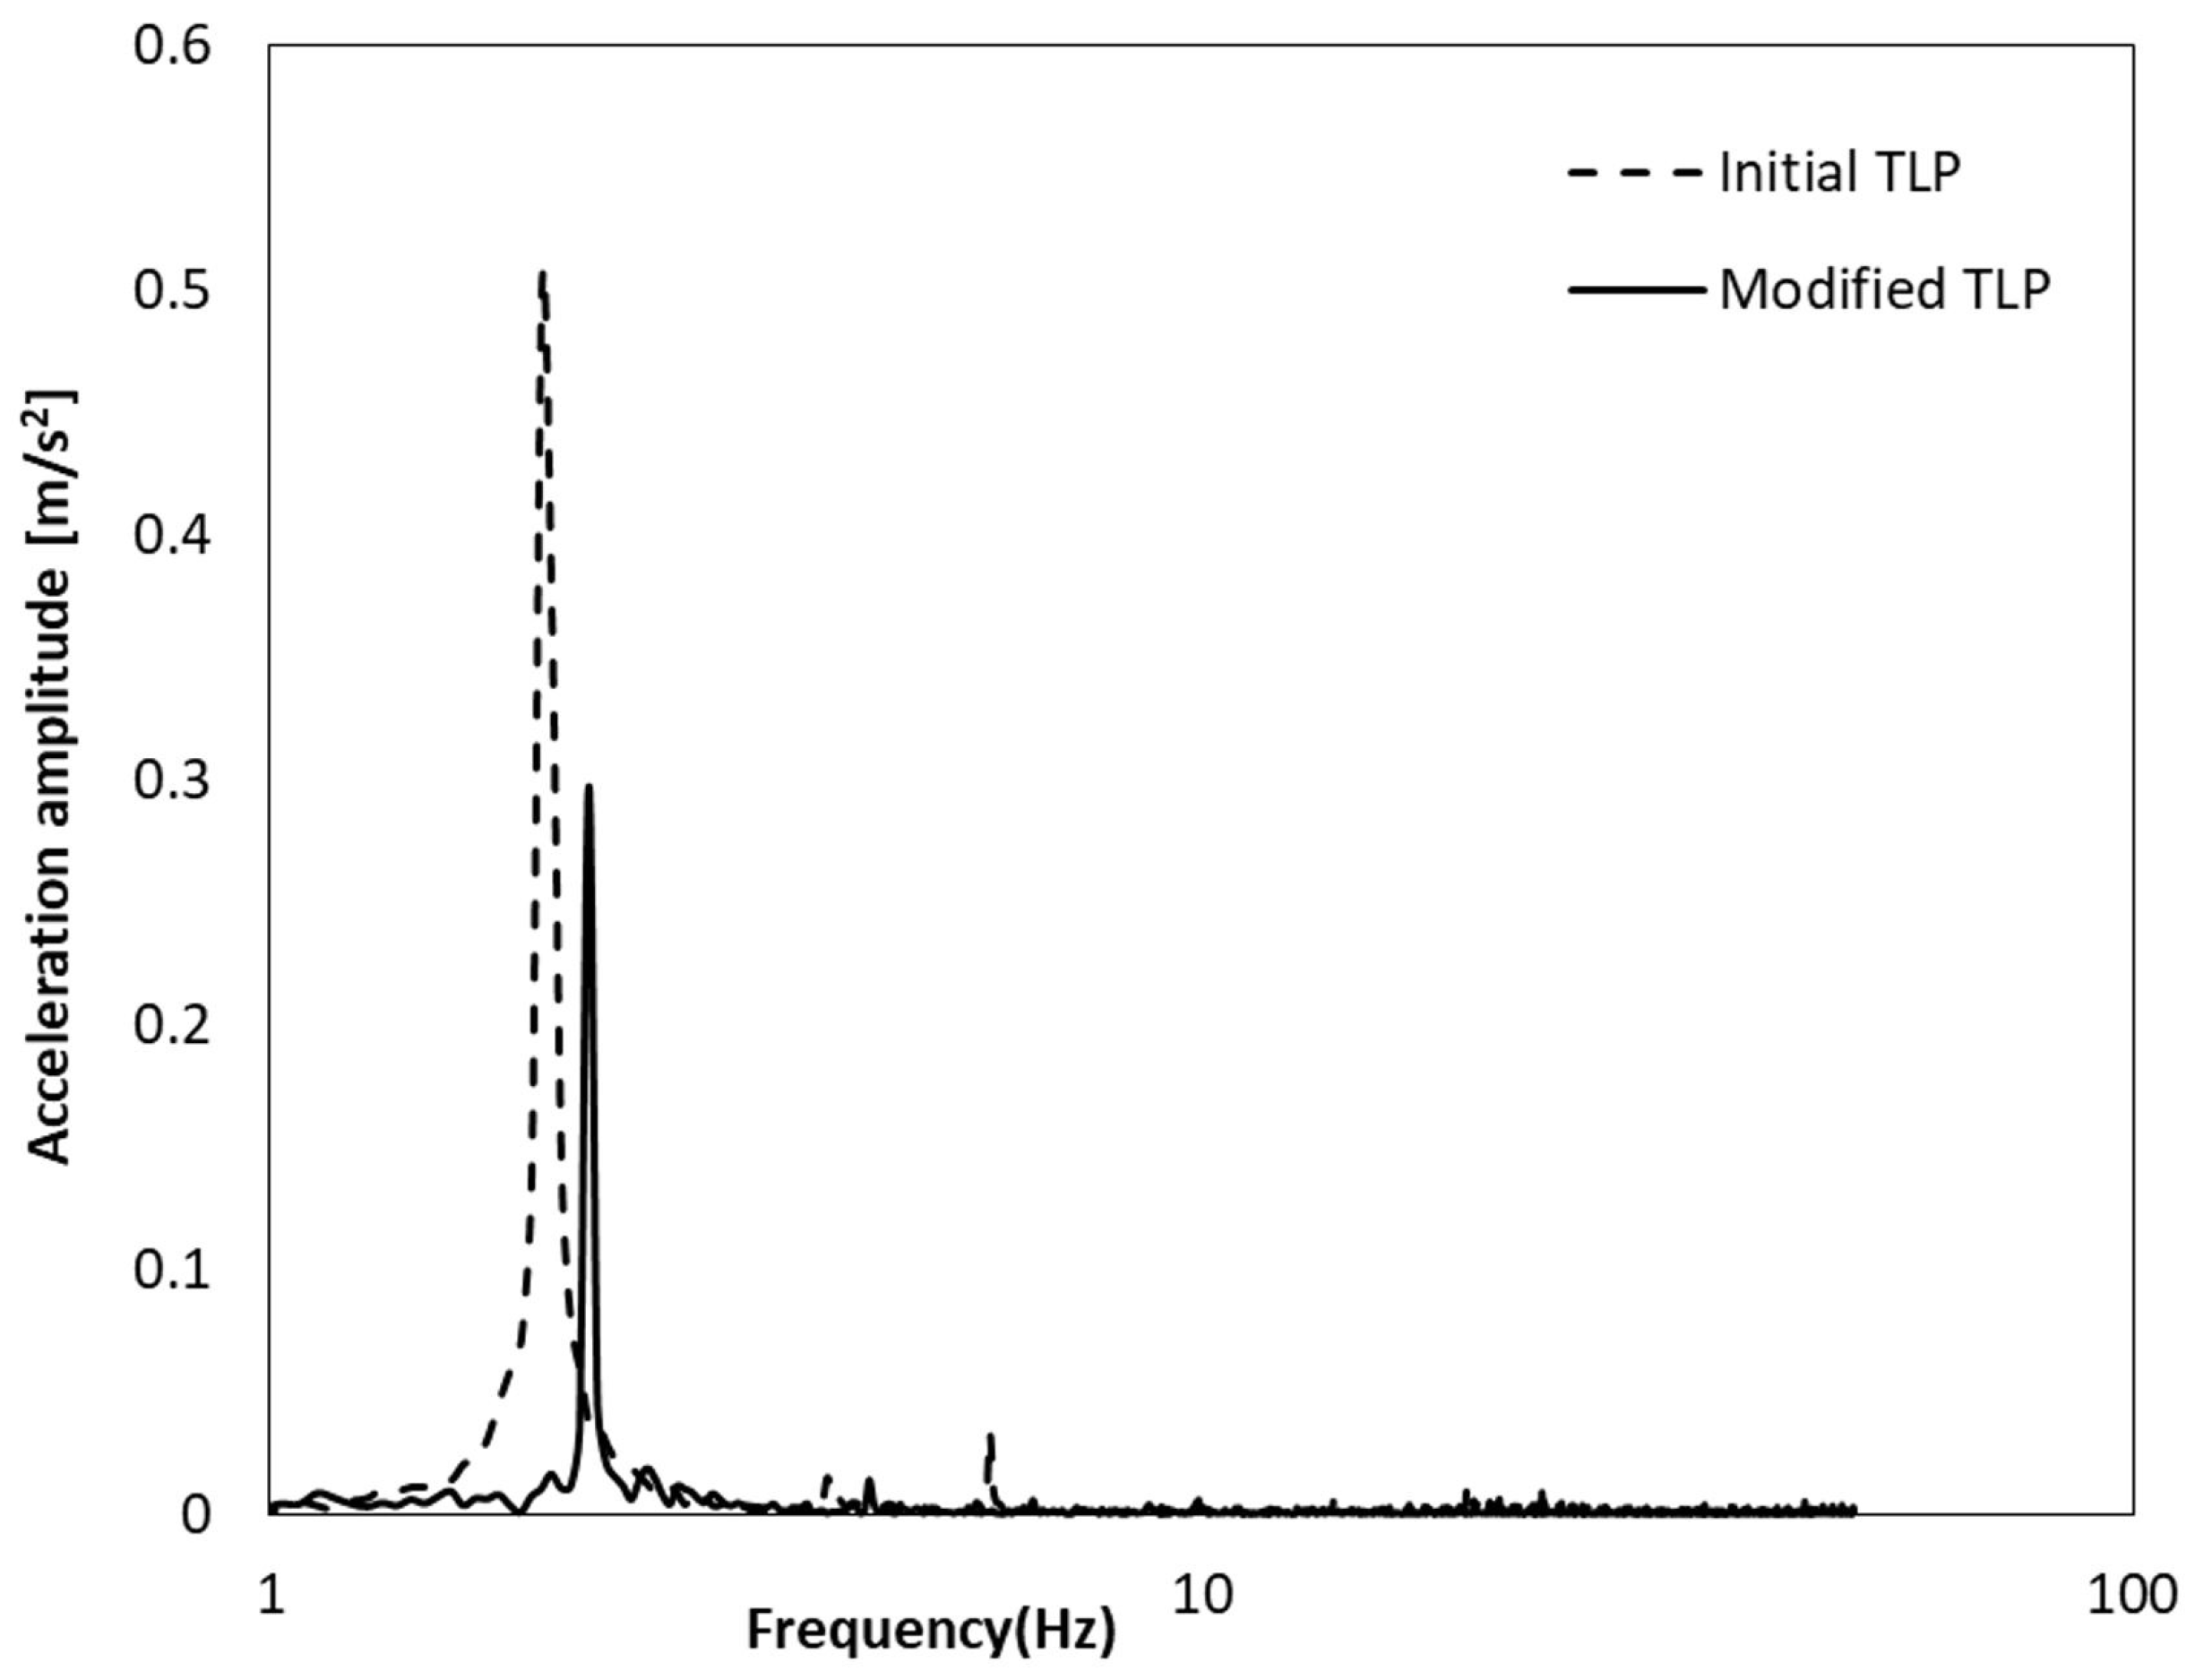
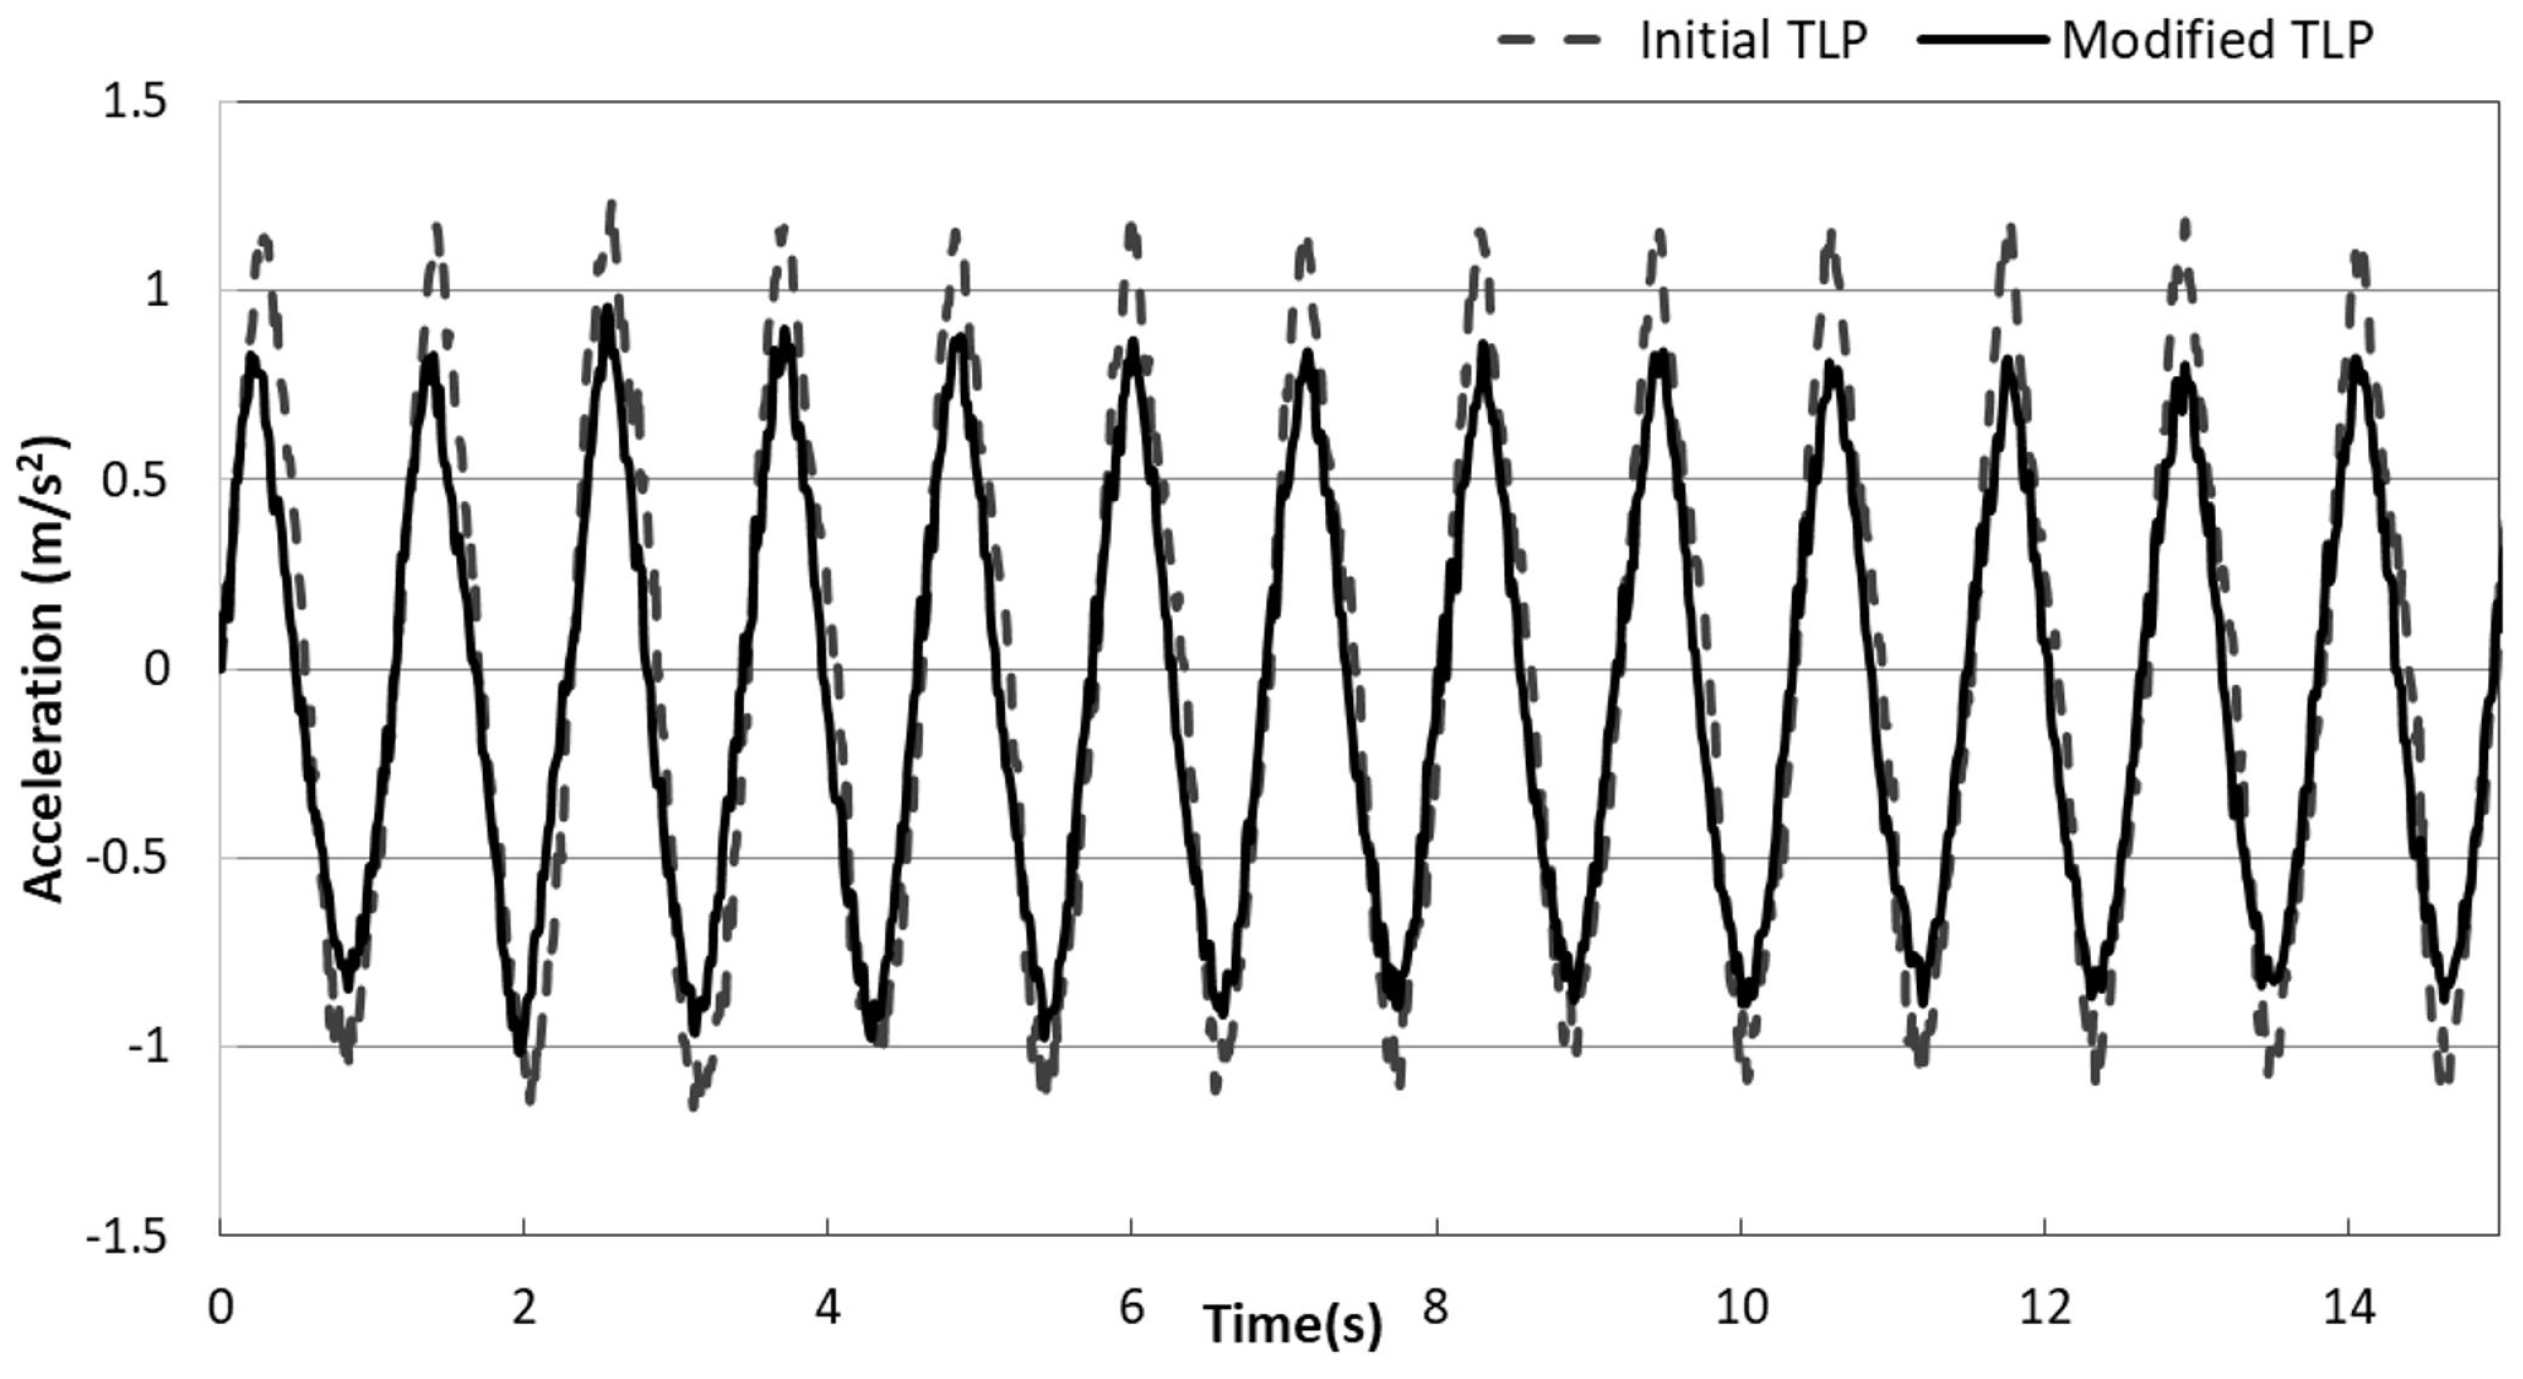
When the TLP model is subjected to regular waves, the mooring lines may help to reduce the rotational motion around the three axes, even though they were mainly designed to reduce the surge acceleration and displacement. Incoming regular waves were assumed to be uniform and incident on the platform in the surge direction and a wave with an amplitude of approximately 12 mm and a wave period of T = 0.8 s was chosen for this experiment. Figure 4 shows the temporal variation of surge acceleration for the initial TLP and modified TLP concepts, while the corresponding surge amplitude spectrum comparison of the initial and modified concepts after applying Fast Fourier Transform (FFT) to the signal’s temporal variation is given in Figure 5.
As shown in Figure 4 and Figure 5, the amplitude of the surge acceleration decreased as a result of addition of the mooring lines. This indicates that the new configuration contributes significantly to enable effective damping of the surge motion compared to the vertical tendons only, and hence improves the performance of the platform under wave attack. In addition, the spectra display well-defined peaks because of the periodic harmonic motion displayed in the time domain, even though the spectrum of the initial model appears to be noisier than that of the modified TLP for the same wave frequency. There are a couple of reasons to explain the improvement. One would be larger amplitude motion in the initial model, and the other an additional mooring line in modified TLP configuration; nevertheless, the peaks remain well defined in both cases. These findings confirm that the modified concept helps to stabilize the system’s motion, which is essential to improving the performance of the wind turbine, because reducing the motion positively affects power production and turbine structural loading. In other words, platform motion causes larger inertial loads on the entire structure, which potentially leads to reduced efficiency and increased fatigue loading. Furthermore, the tether pretension also plays a fundamental role in the stability of the system. This also explains why the modified TLP with its higher initial pretension is more stable than the initial four-legged TLP. The new tethers were inclined, instead of being straight, in order that they not exceed the operational range of the tether’s pretension.
4.2. RAO Analysis for Regular Wave Tests
In this study, the water depth was kept constant at 35 cm in the wave flume, and a series of regular wave tests was carried out on both the initial model and the new design. This was done to validate previous results and to study the natural period and natural frequency of the new model compared to the initial one using the RAO method. The RAO is defined as the non-dimensional ratio of the surge to the surface elevation, which is used to analyze the dynamic motion of floating structures.
Figure 6 shows the RAOs for the NREL TLP, the modified TLP, and a numerical simulation of the same prototype (i.e., modified TLP) developed by Nematbakhsh [31]. For the translational accelerations (surge, sway, and heave), the RAO is determined by
where represents the dimensional response of the structure in each mode of motion in the frequency domain and is the wave power spectral density. As shown in the figure, both the initial TLP and the new design have the same trend with a slight decrease in the surge RAO response. However, the natural frequency, defined graphically as the frequency at which the peak occurs, was slightly shifted to a higher frequency for the new design but remained smaller than 0.4 rad/s. In addition, it was considered as the operational natural wave condition for FOWT, which is defined by ITTC spectrum for different sea states and provides a significant wave height of 5.0 m and a modal period of 12.4 s (see Kim and Hong [32]). On top of this condition, the water flume was only operated by a wave generator so that it was purely affected by the wave loading because wind tunnel was not turned on. On the other hand, the reference data of numerical simulation were also based on the nonlinear hydrodynamic forces on the platform, while wind speed was assumed constant. Therefore, the natural frequency can be inferred from the surge RAO response of the test model itself exerted by the wave loading. Consequently, both concepts can operate safely in the chosen site. Furthermore, to validate the results, the experimental surge RAO data were compared to the numerical representation. This latter was performed for a range of wave periods, from 0.6 to 1.2 s. The results obtained show that, for the same range of wave frequencies, a good similarity was found between the numerical and experimental data as the RAO motion increases while moving close to the natural frequency. It was expected that the peak in the numerical model would occur within the same range of wave frequency since the natural frequency in surge was defined to be 15 s.
4.3. Water Depth Effect
Considering that offshore wind turbines are suited to operate in rated power case as well as in deep water, the effect of water depth was investigated and experiments conducted to ensure the capability of the modified concept TLP to operate in deep water. Figure 7 compares the surge RAO’s response in two different water depths for the TLP with the additional cables.
As shown in Figure 7, the RAO shows that the motion of the platform decreases with increasing water depth, which confirms that the TLP is a suitable structure for deep water. On the other hand, the natural frequency of the system was shifted to lower frequency in the case of the TLP with additional mooring cables in greater water depth. This was achieved as a result of the increase in the length of the tendons and the added mooring lines when operating in deeper water. The increase in the length of the tethers and the added mooring lines influenced the amplitude motion as well as the natural frequency, and they enabled an acceptable restoration in the surge of the system reducing the natural frequency. The same results were obtained by Wayman and Sclavonous [2], who investigated the water depth effect for an NREL TLP. Those results and the results of this actual study are in good agreement as both studies indicate that the water depth not only contributes to reduce the motion but also lowers the natural frequency. Thus, it is possible to tune the tether stiffness of a system to match a certain experimental natural frequency by means of restoring.
4.4. Wave Loading Using Morison Equation for Regular Waves
The wave loads were calculated using the Morison equation. The experimental values obtained for the initial TLP were then compared to those for the TLP with the additional cables. The experimental conditions were similar for both cases and the same wave height and wave period were applied in the case of a regular wave test.
4.4.1. Omega Arithmetic Method for Relative Velocity
One of the requirements of the Morison equation for predicting wave loading in floating structures is the definition of the relative velocity of the system while being subjected to the action of the incoming waves. The relative velocity was integrated from the acceleration data using the omega arithmetic method, which is considered to be the best method for the integration to convert acceleration into velocity (see Appendix A for omega arithmetic code)..
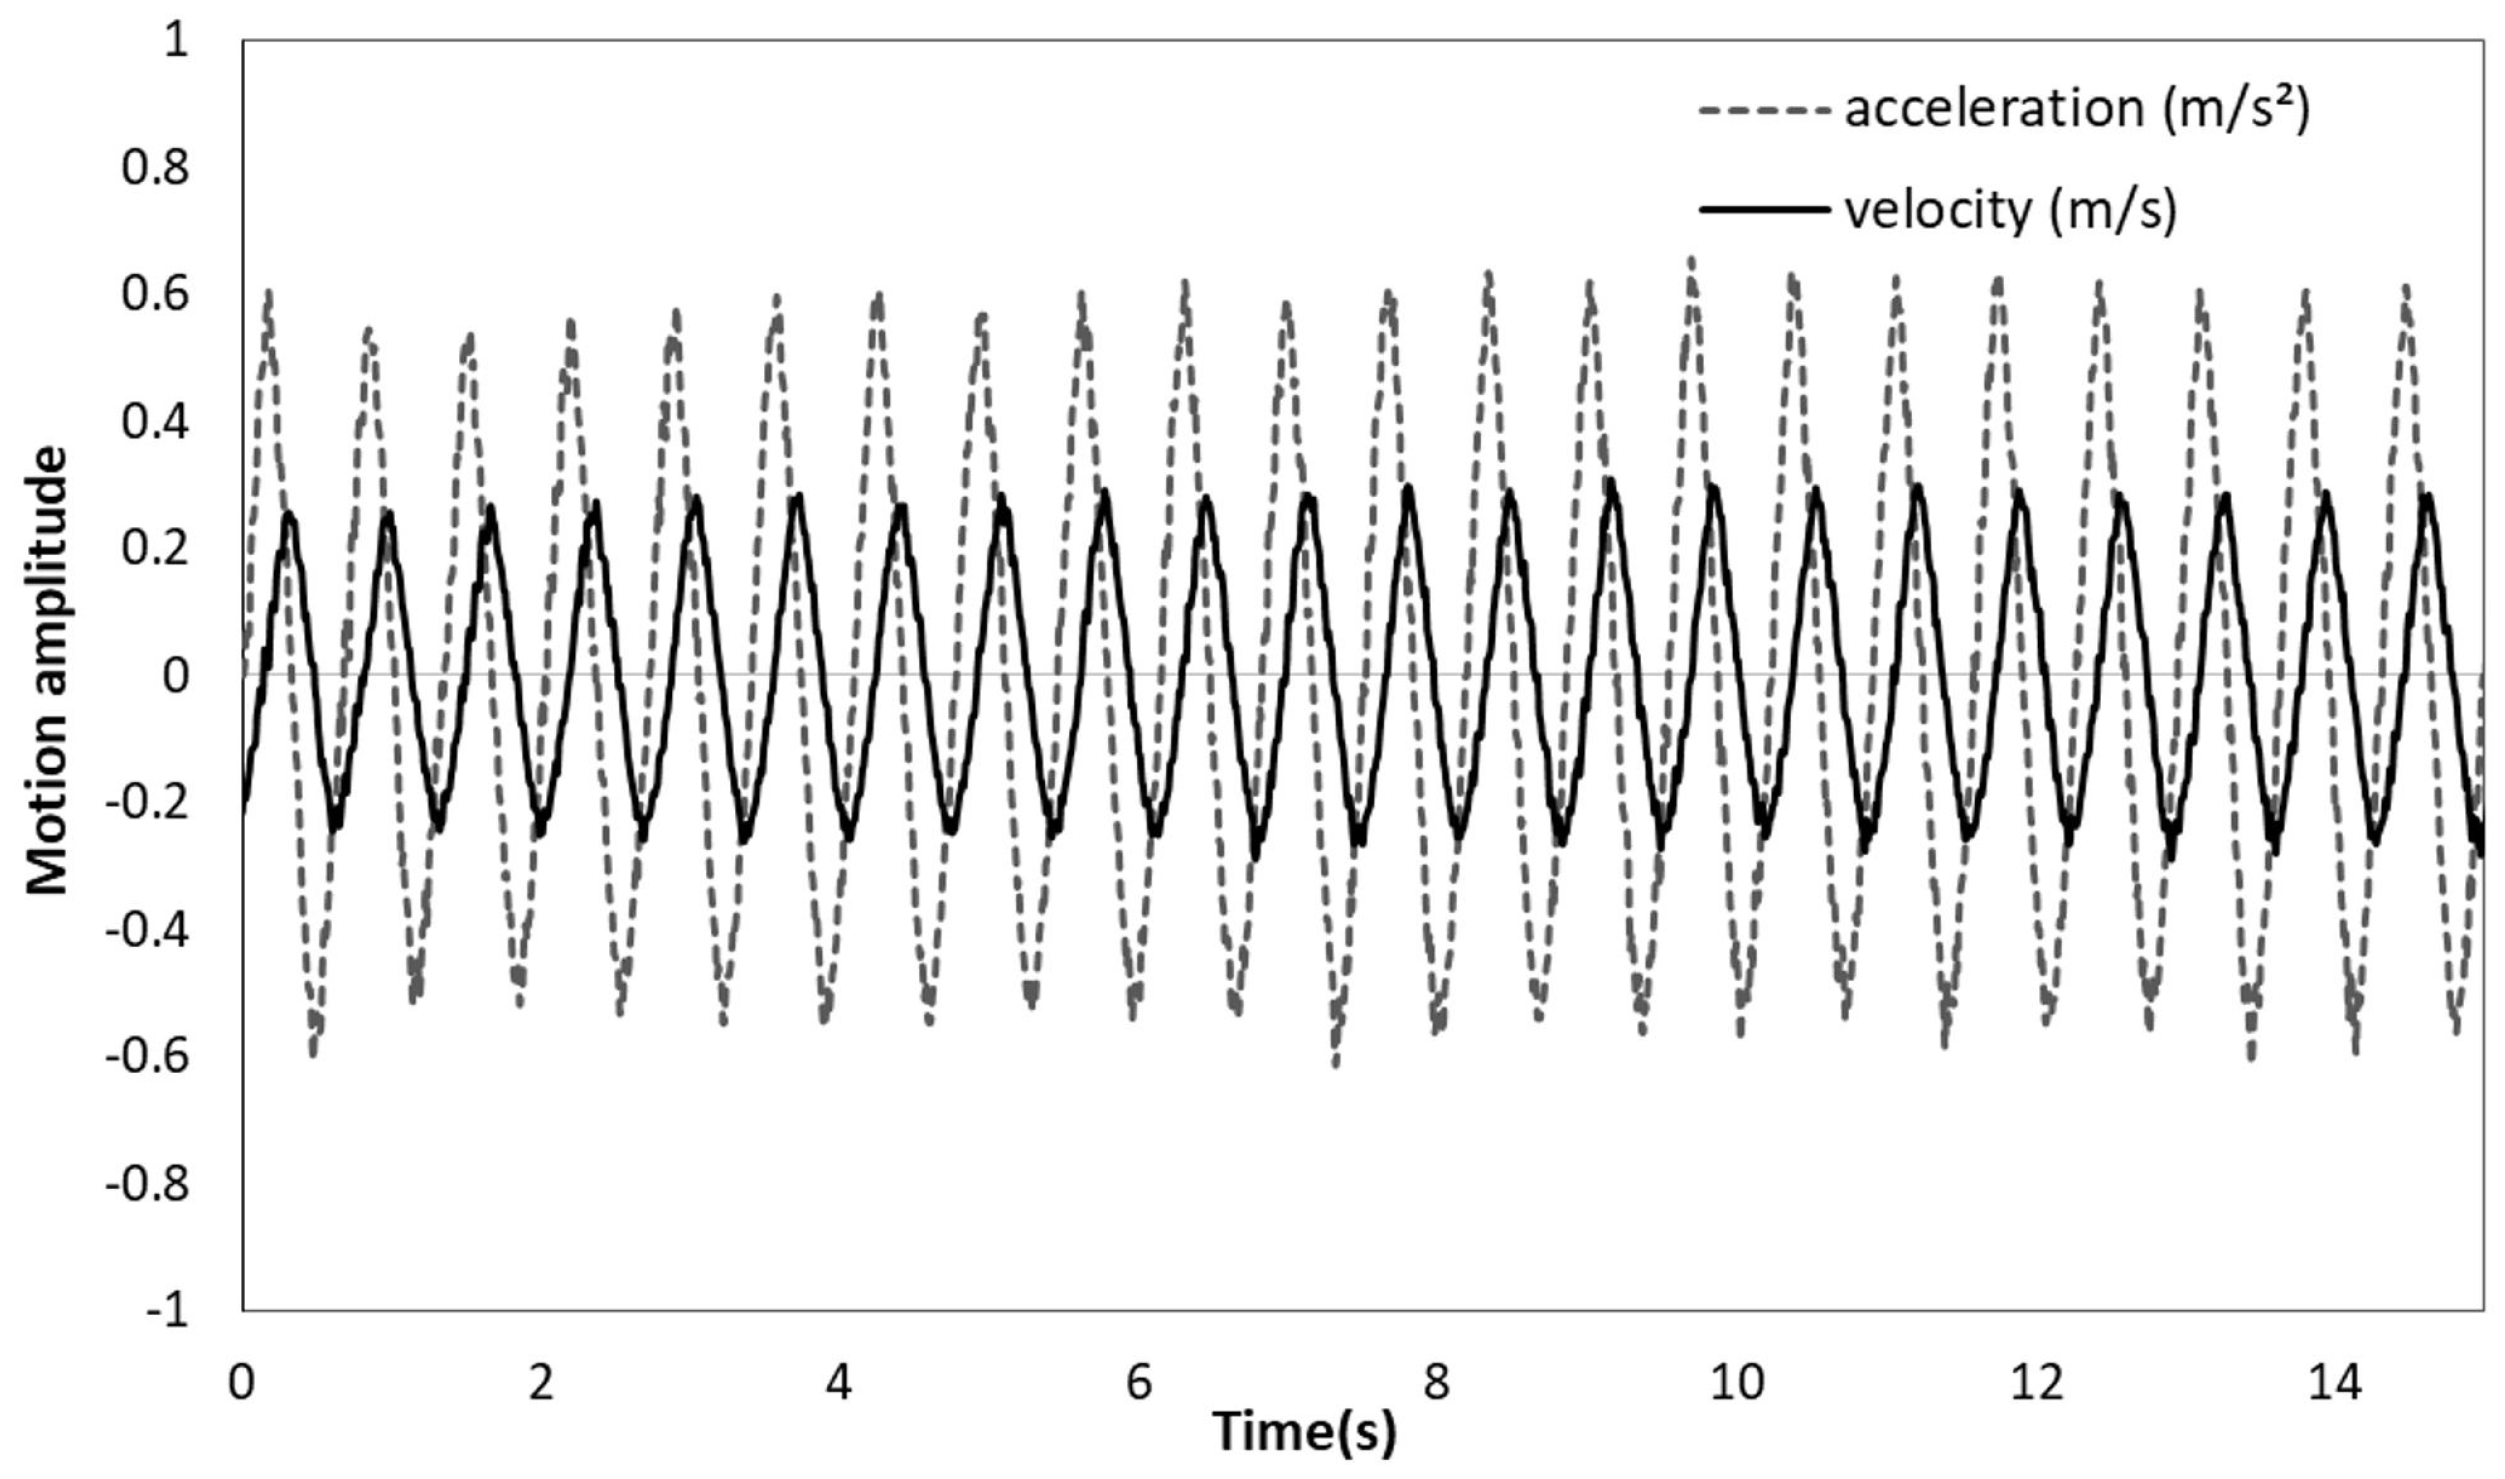
As shown in Figure 8, the relative velocity is represented after being integrated from the acceleration data using the omega arithmetic method outlined above. The method determines the corresponding velocity from an acceleration dataset without going through the formal integration in time. Meanwhile, this method is obviously influenced by the frequency behavior of the signal, as the conversion process was carried out in the frequency domain rather the time domain signal. In other words, the time series were converted to the frequency domain using FFT, integrated by dividing by , and then converted back to the time domain using the inverse FFT. Thus, this procedure is the most accurate for the conversion process because neither the time domain integration nor the application of a high pass filter before performing the integration was a good solution for integrating the relative velocity in this case.
Because the acceleration motion response is a harmonic function, the velocity has a sinusoidal variation, but it is not in phase. The phase relationship between acceleration and velocity is such that the velocity is 90° out of phase with acceleration. This is noticeable from the figures; when the structure passed through the equilibrium position, the velocity was at its maximum and the acceleration was zero.
Figure 9 compares the relative velocity of the TLP with tendons only and the modified concept with additional mooring lines attached. It shows that the magnitude of the velocity was smaller in the new model than in the prototype. The results confirm the findings that the mooring lines helped to reduce not only the surge acceleration but also the velocity of the structure when it was subjected to monochromatic regular waves.
4.4.2. Wave Loading Results
The water particle kinematics in the case of a regular wave can be defined on the basis of the extrapolated Airy wave theory. The Airy theory was used because of its suitability for a wide range of waves at any site, including extreme and fatigue cases. However, it has a drawback in that it does not consider the peaks and troughs of waves. Conversely, the extrapolated Airy theory, known as the wheeler stretching method, makes the original theory more flexible by calculating the kinematics both at the mean water level and at the water elevation surface, which results in a kinematics prediction that is closer to reality.
Numerous methods also exist for defining the inertia and drag coefficients. The results published by the DNV (Det Norske Veritas) are widely accepted (Journee and Massie [23]). The DNV has calculated coefficients for different types of cylinders based on their roughness with respect to the KC (Keulegan–Carpenter) number because of the primary dependence of the coefficients on the number. The KC number is expressed by the following equation (which is valid for the deep-water studies):
where U is the water particle velocity, T is the wave period, D is the cylinder diameter, and H is the wave height. Based on the DNV report, the inertia coefficient of a smooth floating cylindrical platform is related to the added mass coefficient by the following relation:
where in the case of a circular cylinder. This leads to an inertia coefficient with an approximate value of two and a drag coefficient close to one for low KC numbers, as is the case in this study where the inertia forces are dominant and the drag forces are not important. In this study, to get both coefficients, the Morison’s method was applied (see Journee and Massie [23]). This method is based on the measured force (N), velocity (m/s) and acceleration (m/s2) from the flume experiment. Given that the fundamental data were provided, the Morison equation can be decomposed into two parts: inertia and drag terms. Therefore, based on the Morison’s method, the drag coefficient can be obtained while making the relative acceleration becomes zero, whereas the inertia coefficients can also be calculated while having relative velocity zero. More details are also well described in the paper (see Wolfram and Naghipour [33]).
From the results for operational range, it is clear that the forces caused by the interaction between the cylinder and the waves on the new design are less than those on the initial model (see Figure 10). This confirms that the new mooring lines not only contribute to a stable system but also results in lower load on the platform. Moreover, the horizontal component of the total force per unit length has a harmonic shape because of the accelerating and decelerating movements in the body motion, which imply a change in the kinetic energy of the fluid within the control volume. Furthermore, the unstable drag and inertia coefficients also have an effect on the forces as they depend primarily on the KC number, which in turn depends on the velocity of the fluid. As a result, the better estimation of the water kinematics enabled the Morison equation to be more accurate in predicting the wave loading on the TLP’s cylinder. It is also notable that the loads have a nonzero mean value. This offset may be explained by the excess buoyancy and the pretension on the tether, which requires that the cylinder support some of the load in order to keep the system sufficiently balanced. This is because the pretension of the tethers is related to the buoyancy force and the overall mass of the system times the gravitational acceleration.
4.5. Extreme Design Sea Condition Analysis
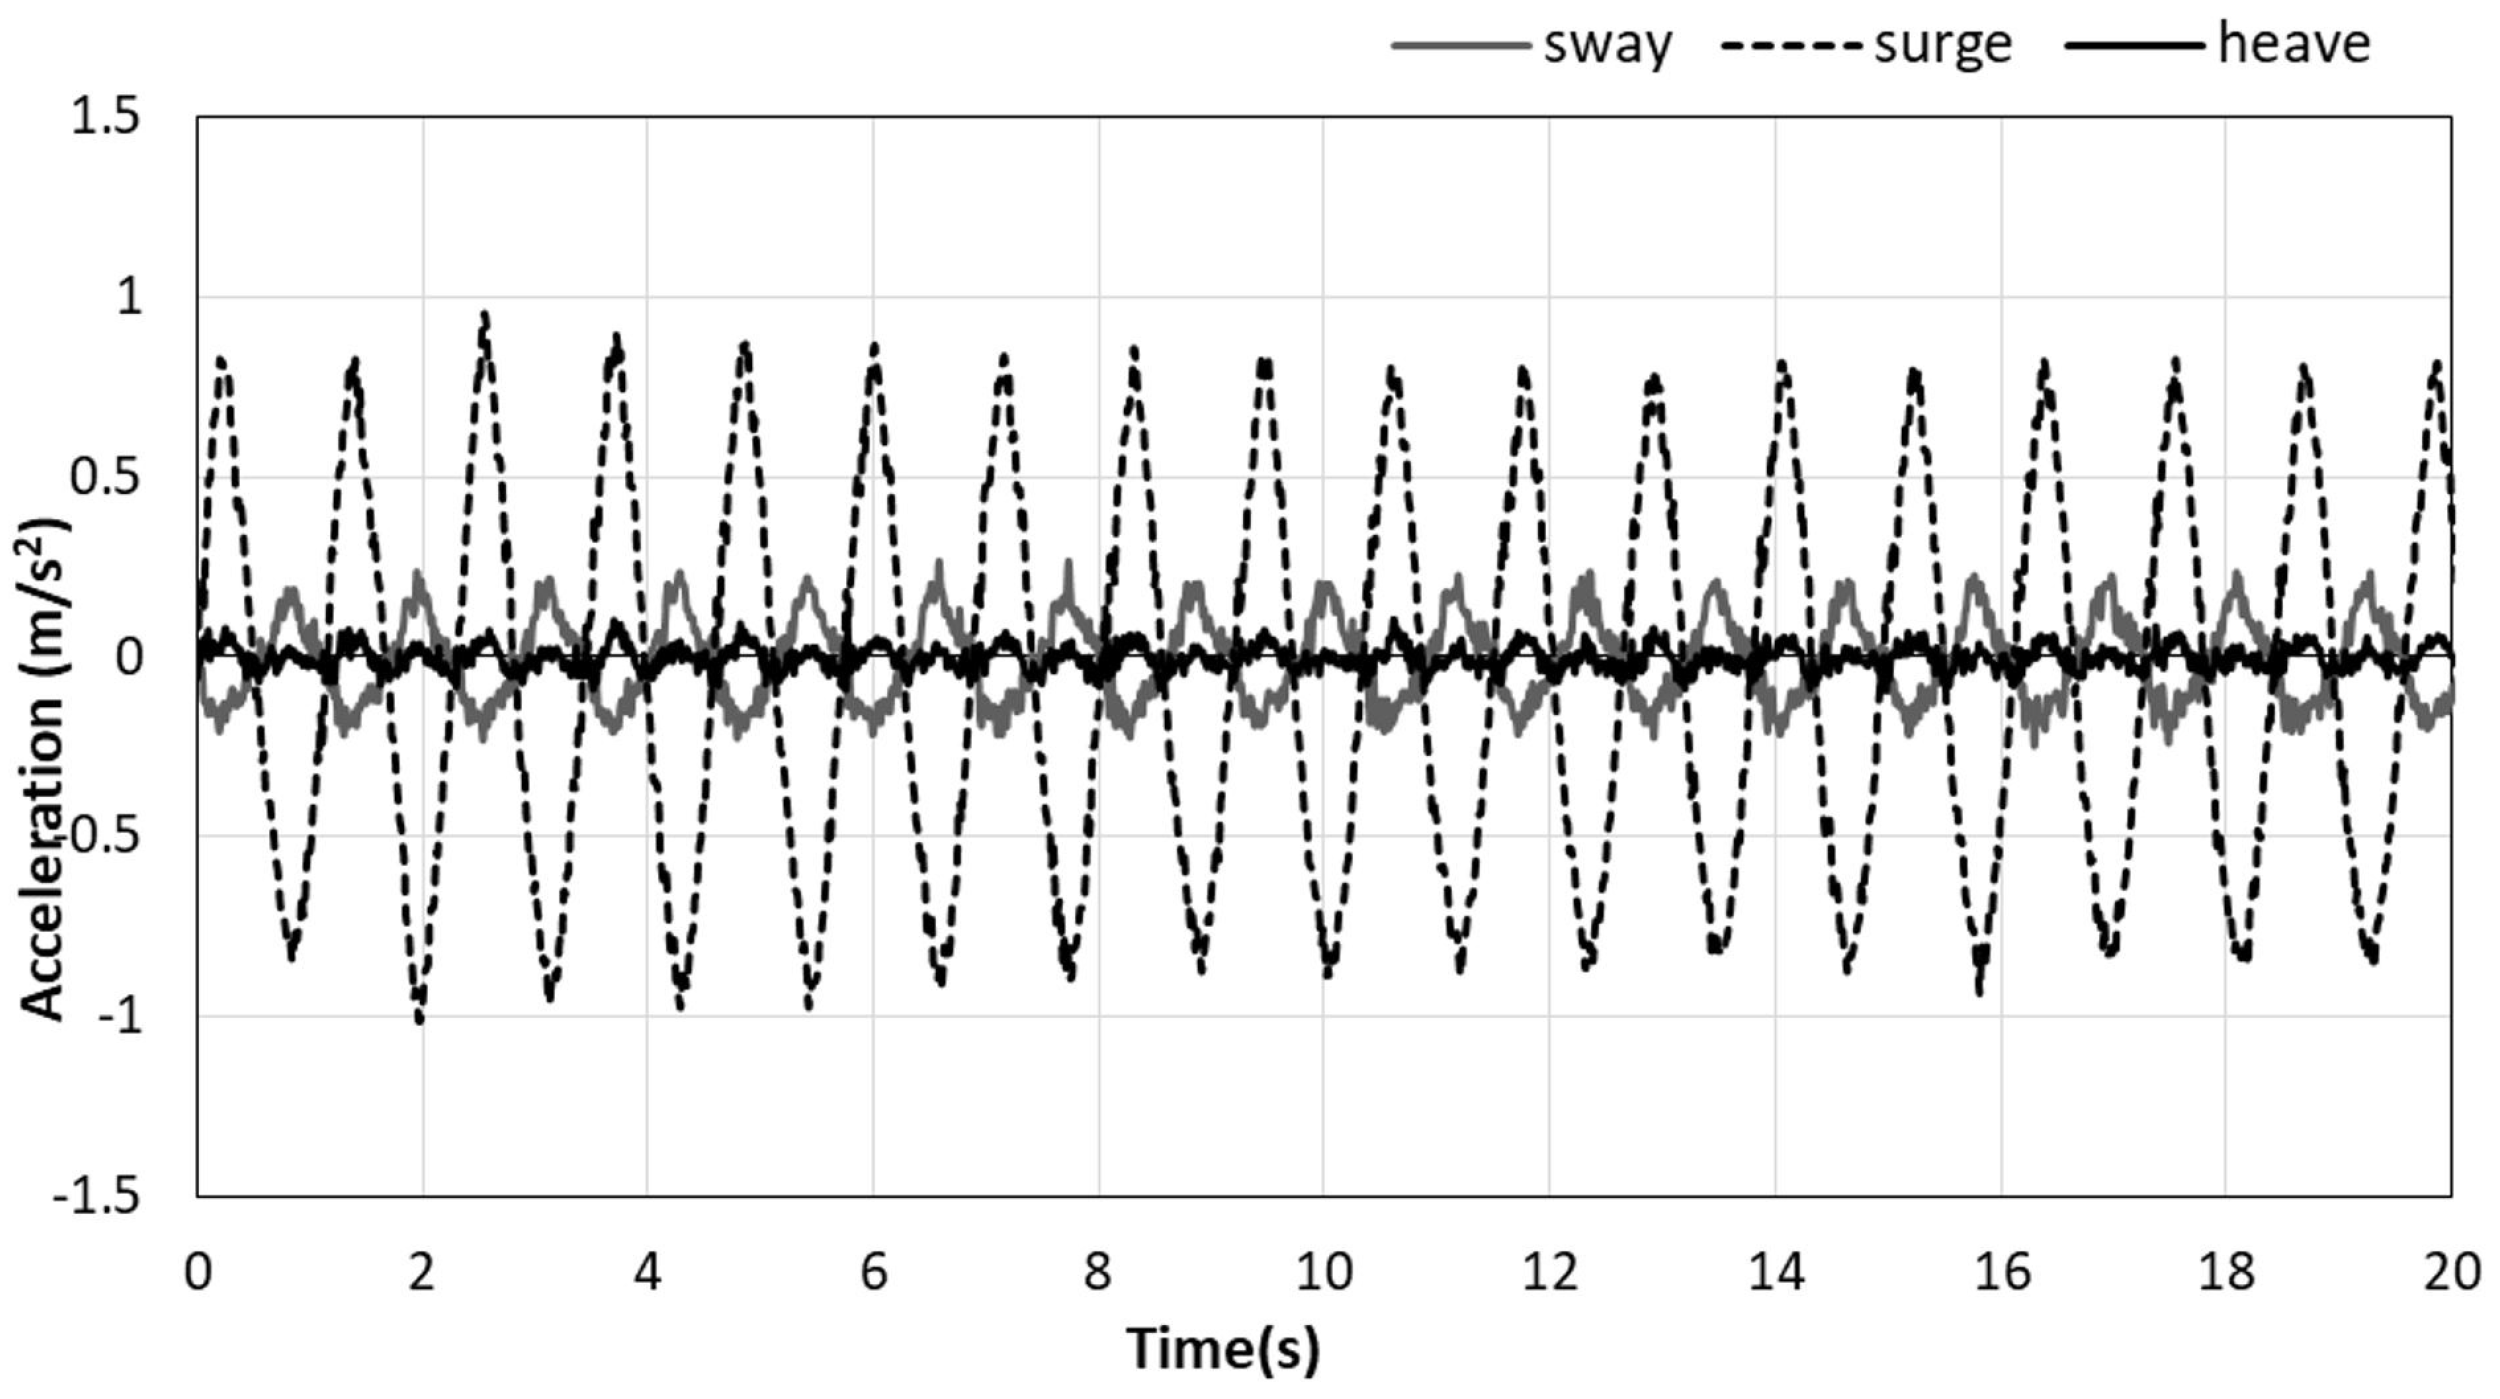
The ability of the new system with added mooring lines to withstand extreme sea conditions in Northern sea of California was verified. This verification was performed with the objective of ensuring that the new design can operate in a severe sea state, which makes it suitable for both regular and extreme sea states. The extreme sea conditions were issued by the Center for Offshore Safety, USA, and the parameters of the waves were chosen based on their report (Berg [34]). The chosen wave amplitude was 5 cm with a wave period of 1.2 s based on the scale ratio of 1:200 used in this study.
As shown in Figure 11 and Figure 12, the surge acceleration remained the most obvious of the three translational motions with a larger amplitude than regular waves because of the severe sea state. However, the extreme design case caused the platform to have significant motion in the sway direction, which cannot be neglected as in the case of the regular wave, because of the substantial contribution of the mooring lines in effectively damping all the other rigid body and rotational motions. In addition, the ability of the system to respond was demonstrated and it was also shown that severe wave conditions tend to increase the motion amplitude of the modified TLP above the regular and operational range. However, this amplitude remained in the acceptable range where a structure can ensure its operability without affecting the performance of the installed wind turbine.
As shown in Figure 13, the surge amplitude spectra derived from the time domain using the FFT, which defines a comparison between the surge acceleration in the extreme conditions of the two concepts, confirmed the mooring lines contribution in damping the surge motion even in extreme conditions. However, because the exhibited motion had a larger amplitude, the spectra appeared noisier than in the regular case, but the peaks were still well defined. Another aspect of concern is the loads applied to the structure in the extreme wave event. It was expected that the wave would have a significant impact on the structure in terms of loading, as it was proven that the added mass generated in the case of an extreme wave is higher owing to the high kinetic energy of the fluid around the structure, which causes an increase in both the body’s motion and the water kinematics. Therefore, the loading on the system exerted a high tension on the tethers and the new mooring lines; however, this tension should remain within the safe range because an excess on the design value would result in the consequent destruction of the system. This means that the new model withstood the extreme design wave condition for a 100-year return period for the chosen site.
The new findings in the behavior of the modified TLP under the onslaught of waves may play a fundamental role in providing better stability and thereby improve the overall performance of the system, especially in critical environmental loads. This is because the mooring lines tend to increase the stiffness, which contributes to the rigidity of the system, and the design life of offshore wind turbines may be enhanced as well.
5. Conclusions
A new tension leg platform conceptual design for offshore wind turbines was proposed with the objective of reducing the dominant surge motion of this kind of platform. The feasibility of the new model to operate under different wave conditions was also investigated. The design was proposed based on the NREL prototype and the wave conditions were chosen according to a report in the USA regarding the Northern Sea of California, where it is assumed that the new system will operate.
For the operational range of regular waves, the following can be stated:
- The modified concept model tends to decrease the velocity and acceleration of the overall system. A new method, known as the omega arithmetic method, which provides accurate and exact conversions, was introduced to integrate the displacement from the acceleration data.
- The RAO surge response proved that the two concepts avoid the natural wave frequency. This means that resonance is avoided, which is one of the main requirements for FOWT in order to operate in a safe environment. Furthermore, the water depth also has the same effect as the mooring lines, as it was proven that the motion amplitudes decrease with increasing water depth, which confirms that the new model is suitable for deep water.
- As regards extreme sea conditions for a return period of 100 years, the experimental results indicate that the motion amplitude will increase without exceeding the range of accelerations where the floating system is known to be able to operate safely. Further, the modified concept was verified to have smaller motion amplitude than the initial concept even in harsh environmental conditions.
- The loads applied on the structure by the waves were also measured using the Morison equation after matching all the conditions required for the use of the equation.
- The results obtained for the new model show that the addition of the mooring lines plays a positive role in reducing the wave loads compared to the initial model in the case of both regular and extreme waves.
These findings on the performance of the model under wave effect should be taken into account when constructing this kind of platform in the future. However, additional studies need to be conducted in order to investigate the coupled dynamic motion under all combined environmental loads combined with the tension on the tethers to enable optimization of the modified TLP system with additional lines. This would further improve the modified concept TLP system and help to effectively minimize the drawbacks to withstanding all environmental loads and increase the performance of offshore wind turbines. On top of these findings, the scaling issue would be one of the important considerations when the test data of scaled model match the full scale model. In particular, most measurements in the flume ertr made only on a small-scale model, which needs further investigation in the future.
Author Contributions
Supervision, J.S.; Writing—original draft, H.-C.L.
Funding
This research received no external funding.
Acknowledgments
This work was supported by “Human Resources Program in Energy Technology” of the Korea Institute of Energy Technology Evaluation and Planning (KETEP), granted financial resource from the Ministry of Trade, Industry & Energy, Republic of Korea (No. 20164030201230). In addition, this work was supported by the National Research Foundation of Korea (NRF) grant funded by the Korea government (MSIP) (No. 2016R1A2B1013820).
Conflicts of Interest
The authors declare no conflict of interest.
Appendix A
Matlab code: omega arithmetic method for converting acceleration into velocity and displacement.
Fs=100; dt=1/Fs; et=15; t=0:dt:et;
y=xlsread(’surge’);
subplot(2,1,1); plot(t,y,’r’);
xlabel(’time(s)’); Y=fft(y); n=length(y); Amp=abs(Y)/n; NumuniquePts=ceil((n+1)/2);
freq=(0:NumuniquePts-1)*Fs/(n-1); freq2=-1*freq(end:-1:1);
if mod(n,2)==0
freq2(1)=[ ];
end
freq3=[freq,freq2];
freq3’;
size(freq3)
if mod(n,2)==1
freq3(n+1)=[ ];
end
if mod(n,2)==0
freq3(n)=[ ]];
end
subplot(2,1,2); plot(freq,Amp(1:NumuniquePts),’b’);
subplot(2,1,1); plot(freq,Amp(1:NumuniquePts),’b’);
xlabel(’frequency(hz)’); ylabel(’amplitude’);
B=reshape(Y,1,1501); G=B./(2*pi*freq3*1i);
G(1)=[1];
if mod(n,2)==0
G(n)=[1];
end
inversed=ifft(G);
plot(t,real(inversed),’b’)
hold on
plot(t,y,’r’)
title(’omega arithmetic’);
xlabel(’time(s)’);
ylabel(’velocity blue,Accel red’);
References
- Jonkman, J.; Butterfield, S.; Musial, W.; Scott, G. Definition of 5-MW Reference Wind Turbine for Offshore System Development; Tech. Report NREL/TP-500-38060; NREL: Golden, CO, USA, 2009. [Google Scholar]
- Wayman, E.N.; Sclavonous, P.D. Coupled Dynamic Modeling of Floating Wind Turbine Systems. In Proceedings of the Offshore Technology Conference, OTC, Houston, TX, USA, 1–4 May 2006. [Google Scholar]
- Lee, S. Dynamic Response Analysis of Spar Buoy Floating Wind Turbine Systems. Master’s Thesis, Massachusetts Institute of Technology, Cambridge, MA, USA, 2008. [Google Scholar]
- Naqvi, S.K. Scale Model Experiments on Floating Offshore Wind Turbines. Master’s Thesis, Worcester Polytechnic Institute, Worcester, MA, USA, 2012. [Google Scholar]
- Hong, S.; Lee, I.; Park, S.H.; Lee, C. An Experimental Study of the Effect of Mooring systems on the Dynamics of a SPAR Buoy-type Floating Offshore Wind Turbine. J. Naval Archit. Ocean Eng. 2015, 7, 559–579. [Google Scholar] [CrossRef]
- Withee, J.E. Fully Coupled Dynamic Analysis of a Floating Wind Turbine System. Ph.D. Thesis, Massachusetts Institute of Technology, Cambridge, MA, USA, 2004. [Google Scholar]
- Murray, J.; Yang, C.K.; Wooseuk, Y. An Extended Tension Leg Platform Design for Post-Katrina Gulf of Mexico. In Proceedings of the International Offshore and Polar Engineering Conference, ISOPE, Osaka, Japan, 21–26 July 2009. [Google Scholar]
- Karimirad, M.; Moan, T. Wave and Wind-Induced Dynamic Response of a Spar-Type Offshore Wind Turbine. J. Waterw. Port Coast. Ocean Eng. 2011, 138, 9–20. [Google Scholar] [CrossRef]
- Ren, N.; Li, Y.; Ou, J. The Wind-Wave Tunnel of a Tension Leg Platform Type Floating Offshore Wind Turbine. J. Renew. Sustain. Energy 2012, 631, 1–17. [Google Scholar] [CrossRef]
- Martinez, M.S.; Natarajan, A.; Henriksen, L.C. Feasibility Study of a Semi Floating Spar Buoy Wind Turbine Anchored with a Spherical Joint to the Sea Floor; Technical Report INWIND; EWEA: Frankfurt, Germany, 2013. [Google Scholar]
- Hadjihosseini, A.; Peinke, J.; Hoffmann, N.P. Stochastic Analysis of Ocean Wave States with and without Rogue Waves. New J. Phys. 2014, 16, 053037. [Google Scholar] [CrossRef]
- Hadjihosseini, A.; Wächter, M.; Hoffmann, N.P.; Peinke, J. Capturing Rogue Waves by Multi-point Statistics. New J. Phys. 2016, 18, 013017. [Google Scholar] [CrossRef]
- Hadjihosseini, A.; Lind, P.G.; Mori, N.; Hoffman, N.P.; Peinke, J. Rogue waves and entropy consumption. Front. Phys. 2017, 120, 30008. [Google Scholar] [CrossRef] [Green Version]
- Lind, P.G.; Herraez, I.; Wächter, M.; Peinke, J. Fatigue Load Estimation through a Simple Stochastic Model. Energies 2014, 7, 8279–8293. [Google Scholar] [CrossRef] [Green Version]
- Lind, P.G.; Vera-Tudela, L.; Wächter, M.; Kühn, M.; Peinke, J. Normal Behaviour Models for Wind Turbine Vibrations: Comparison of Neural Networks and a Stochastic Approach. Energies 2017, 10, 1944. [Google Scholar] [CrossRef]
- Marino, E.; Lugni, C.; Borri, C. The role of the nonlinear wave kinematics on the global responses of an OWT in parked and operating conditions. J. Wind Eng. Ind. Aerodyn. 2013, 123, 363–376. [Google Scholar] [CrossRef]
- Marino, E.; Giusti, A.; Manuel, L. Offshore wind turbine fatigue loads: The influence of alternative wave modeling for different turbulent and mean winds. Renew. Energy 2017, 102, 157–169. [Google Scholar] [CrossRef] [Green Version]
- Nielsen, A.W.; Schlutter, F.; Sorensen, J.V.T.; Bredmose, H. Wave loads on a monopole in 3D waves. In Proceedings of the ASME 2012 31st International Conference on Ocean, Offshore and Arctic Engineering, Rio de Janeiro, Brazil, 1–6 July 2012. [Google Scholar]
- Paulsen, B.T.; Bredmose, H.; Bingham, H.B. An efficient domain decomposition strategy for wave loads on surface piercing circular cylinders. Coast. Eng. 2014, 86, 57–76. [Google Scholar] [CrossRef]
- Bredmose, H.; Slabiak, P.; Sahlberg-Nielsen, L.; Schlutter, F. Dynamic Excitation of Monopiles by Steep and Breaking Waves: Experimental and Numerical Study. In Proceedings of the ASME 2013 32nd International Conference on Ocean, Offshore and Arctic Engineering, Nantes, France, 9–14 June 2013. [Google Scholar]
- Patel, M.H.; Witz, J.A. Compliant Offshore Structures; Butterworth-Heinemann Ltd.: Oxford, UK, 2013; pp. 80–83. [Google Scholar]
- Peeringa, J.M. Wave Loads on Offshore Wind Turbines; Tech. Report Duurzame Energie; ECN Publisher: Amsterdam, The Netherlands, 2004. [Google Scholar]
- Journee, J.M.J.; Massie, W.W. Wave Forces on Slender Cylinders. In Offshore Hydromechanics, 1st ed.; Delft University of Technology: Delft, The Netherlands, 2001; pp. 469–498. [Google Scholar]
- Sarpkaya, T.; Isaacson, M. Mechanics of Wave Forces on Offshore Structures; van Nostrand Reinhold: New York, NY, USA, 1981. [Google Scholar]
- Burrows, R.; Tickell, R.G.; Hames, D.; Najafian, G. Morison Wave Forces Coefficients for Application to Random Seas. J. Appl. Ocean Res. 1997, 19, 183–199. [Google Scholar] [CrossRef]
- Henderson, A.R. Design Methods for Offshore Wind Turbines at Exposed Sites; Tudelft: Delft, The Netherlands, 2003. [Google Scholar]
- Dean, R.G.; Dalrymple, R.A. Water Wave Mechanics for Engineers and Scientists; World Scientific Publishing Co. Pte. Ltd.: Singapore, 1984. [Google Scholar]
- Lim, H.C. Optimum Design of a Sloping-wall-type Wave Absorber Placed in a Sinusoidal Propagating Wave. Ocean Eng. 2014, 88, 588–597. [Google Scholar] [CrossRef]
- Zhu, L.; Lim, H.C. Hydrodynamic Characteristics of a Separated Heave Plate Mounted at a Vertical Circular Cylinder. Ocean Eng. 2017, 131, 213–223. [Google Scholar] [CrossRef]
- Barltrop, N.D.P. Floating Structures: A Guide for Design and Analysis; Oilfield Publications, Inc.: Surrey, UK, 1998. [Google Scholar]
- Nematbakhsh, A. A Nonlinear Computational Model of Floating Wind Turbines. Ph.D. Thesis, Worcester Polytechnic Institute, Worcester, MA, USA, 2013. [Google Scholar]
- Kim, H.J.; Hong, S.Y. The Shape Design and Analysis of Floating Offshore Wind Turbine Structures with Damper Structure and Shallow Draft. J. Ocean Wind Energy 2014, 1, 170–176. [Google Scholar]
- Wolfram, J.; Naghipour, M. On the Estimation of Morison Force Coefficients and Their Predictive Accuracy for Very Rough Circular Cylinders. Appl. Ocean Res. 1999, 21, 311–328. [Google Scholar] [CrossRef]
- Berg, J.C. Extreme Ocean Wave Conditions for Northern California Wave Energy Conversion Device; Tech. Report SAND2011-9304; Sandia Report: Livermore, CA, USA, 2011. [Google Scholar]
Figure 1.
Measurement setup sketch.

Figure 2.
Sketch of TLP system (left); and catenary mooring system (right).

Figure 3.
Modified tension leg configuration.

Figure 4.
Time domain surge acceleration comparison for new and initial TLP concept.

Figure 5.
Surge spectrum for initial and modified TLP concept.

Figure 6.
The surge RAO comparison for the two concepts.

Figure 7.
The water depth effect on the motion of the modified TLP with cables.

Figure 8.
The time domain for surge acceleration and velocity of the initial TLP.

Figure 9.
Time domain surge velocity comparison for new and initial TLP concept.

Figure 10.
Experimental wave loads comparison in a regular wave.

Figure 11.
Translational accelerations in extreme design condition for modified TLP.

Figure 12.
Surge acceleration comparison for both concepts in extreme design case.

Figure 13.
Initial and modified TLP’s surge spectrum in extreme case.


Table 1.
Main design parameters of the Tension-Leg Platform (TLP) model.
| TLP Properties | Full Scale | Scale Ratio | Model |
|---|---|---|---|
| Diameter | 22 m | 11 cm | |
| Cylinder height | 21.5 m | 10.75 cm | |
| Concrete ballast height | 4.5 m | 2.25 cm | |
| Installed draft | 20.01 m | 10 cm | |
| Deck clearance | 1.49 m | 1.5 cm | |
| Steel thickness | 0.01 m | 0.2 cm | |
| Concrete mass | 4.345 × 10⁶ kg | 455 g | |
| Turbine mass | 0.698 × 10⁶ kg | 110 g | |
| Buoyant mass | 7.797 × 10⁶ kg | 780 g | |
| Total mass | 5.249 × 10⁶ kg | 715 g | |
| Center of gravity | −9.4 m | −4.5 cm | |
| Center of buoyancy | −10.01 m | −5 cm | |
| Surge resonant period | 15 s | 1.1 s | |
| Pitch resonant period | 0.5 s | 0.2 s | |
| No. of tethers | 4 | - | 4 |
Table 2.
Spoke and mooring lines design parameters.
| Parameter | Full Scale | Model |
|---|---|---|
| Spoke | Length = 14 m | Length = 17 cm |
| Diameter = 3 m | Diameter = 1.5 cm | |
| Tension leg | Length = 46 m | Length = 23 cm |
| Diameter = 0.48 m | Diameter = 0.2 m | |
| Fairlead location = 24 m | Fairlead location = 12 cm | |
| Pretension = 2.3 × 10⁴ N | Pretension = 2.3015 N | |
| New tethers | Length = 60 m | Length = 30 cm |
| Diameter = 0.48 m | Diameter = 0.2 mm | |
| - | Spring stiffness = 1.471 N/mm | |
| - | Maximum load = 23.2 N |
© 2019 by the authors. Licensee MDPI, Basel, Switzerland. This article is an open access article distributed under the terms and conditions of the Creative Commons Attribution (CC BY) license (http://creativecommons.org/licenses/by/4.0/).
Share and Cite
MDPI and ACS Style
Song, J.; Lim, H.-C. Study of Floating Wind Turbine with Modified Tension Leg Platform Placed in Regular Waves. Energies 2019, 12, 703. https://doi.org/10.3390/en12040703
AMA Style
Song J, Lim H-C. Study of Floating Wind Turbine with Modified Tension Leg Platform Placed in Regular Waves. Energies. 2019; 12(4):703. https://doi.org/10.3390/en12040703
Chicago/Turabian StyleSong, Juhun, and Hee-Chang Lim. 2019. "Study of Floating Wind Turbine with Modified Tension Leg Platform Placed in Regular Waves" Energies 12, no. 4: 703. https://doi.org/10.3390/en12040703
Note that from the first issue of 2016, this journal uses article numbers instead of page numbers. See further details here.