Article

A Stochastic Optimization Method for Energy Storage Sizing Based on an Expected Value Model

1
China Electric Power Research Institute, No.15 Xiaoying East Road, Haidian District, Beijing 100192, China
2
School of Electronics, Electrical Engineering and Computer Science, Queen’s University Belfast, Belfast BT9 5AH, UK
*
Author to whom correspondence should be addressed.
Energies 2019, 12(4), 702; https://doi.org/10.3390/en12040702
Submission received: 21 January 2019 / Revised: 17 February 2019 / Accepted: 18 February 2019 / Published: 21 February 2019
(This article belongs to the Section D: Energy Storage and Application)

Abstract

:
Energy storage technologies have been rapidly evolving in recent years. Energy storage plays different roles in various scenarios. For electricity consumers, they are concerned with how to use the energy storage system (ESS) to reduce their costs of electricity or increase their profits. In this paper, a stochastic optimization method for energy storage sizing based on an expected value model for consumers with Photovoltaic Generation (PV) is proposed. Firstly, the Gaussian mixture model clustering method is used to cluster the historical load and PV data and calculate the probability of each cluster. Secondly, the optimal model of total system profit is established. Finally, according to the expected value model, the optimal ESS power and capacity are determined. Two case studies are used to demonstrate the calculation of optimal ESS capacity. The results obtained by the method proposed in this paper are compared with the results produced by the deterministic method. Through the analysis and comparison, the validity and superiority of the method proposed in this paper are verified. The profits obtained by the method proposed in this paper are 0.87% to 127.16% more than the deterministic method.

1. Introduction

An energy storage system (ESS) has the ability of flexible adjustment at different time scales and can be regarded as a variable power source or a variable load [1,2]. Based on its response time, power density, and other characteristics, ESS can play different roles to help improve various aspects of power quality, increase dispatchable PV power generation, and bring economic benefits to consumers [3,4,5]. However, the current price of ESS is relatively expensive, and we cannot install ESS without a consideration of what profits it will accrue. Therefore, how to obtain the maximum profits with a minimum investment cost is one of the major problems when applying energy storage in practical applications.
The research focus of this paper is how to estimate the optimal sizing of ESS on the consumer side where a PV plant is also installed, in order to maximize the consumer’s benefits. It is well-known that the optimal sizing of the ESS is closely related to its operational flexibility. For electricity consumers who are incentivized by electricity price signals, it is useful to investigate how we can use the energy storage system to change demand behaviors in order to maximize economic benefits, as well as to reduce the stress of a grid during the high peak demand period [6,7]. To achieve this, the optimal size of energy storage, the optimal operation and co-ordination of energy storage, local demand, and PV plants need to be fully investigated [8].
Optimal allocation and sizing of energy storage systems has been investigated thoroughly in the literature [9,10,11,12]. Reference [9] proposed a novel control scheme and found the boundary values of compensator gains. This method has a good ability of tight dc-link voltage regulation, with effective power management at the DC-link. Reference [11] proposed an ESS sizing method which leads to a considerable reduction of the ESS. In [12], a distributed control strategy for state-of-charge balancing is proposed. It provides advantages in terms of reduced communication requirements and increased modularity. In [13], when consumers lose their power supply from a distribution network, an energy storage system optimization configuration method is proposed to improve the reliability of consumer electricity supply. The application scenario includes consumers, PV, and energy storage. It does not take the uncertainty into consideration, which has an important effect on the optimal result. Reference [14], based on the time-of-use (TOU) price of the consumer side, the optimal allocation of energy storage considering the advanced multi-pass dynamic programming and expert knowledge base rules has been proposed. The purpose is to provide consumers with the greatest economic benefits. In [14], two instances are analyzed via simulation. The article [15] proposed a method of optimal allocation of the energy storage system. The optimization problem was divided into two time scales. For the long-term sizing of ESS, it does not include the elements of uncertainty and TOU, but the optimal model is worth learning. In the above literature, the energy storage system is optimally configured by a deterministic method. This method neglects the uncertainty of load and PV, which is an important element in the stochastic optimization. Although they built some models, the results obtained by deterministic methods may not be the most economical, due to the uncertainty of load and PV.
In the literature [16], an optimization algorithm based on a self-adapted evolutionary strategy and Fischer-Burmeister algorithm was proposed to reduce the one-time investment and annual running costs. In different scenarios, the investment costs of the energy storage system ware calculated. Reference [17] considers the uncertainty of wind power and proposes a linear optimization model of energy storage to reduce the operating costs of the micro-grid and the investment costs of the energy storage system. However, PV power has different characteristics than wind power. In the distribution network, most of the distribution generations are PV, but not wind power. For the terminal electric consumer, it is necessary to study the situation including PV, load, and TOU. In [18], a model predictive control method is proposed to optimize the ESS. However, the wind power has uncertainties and its prediction has some errors. Reference [18] takes these features into account and directly solves the problem using stochastic optimization. Most studies of stochastic optimization for the sizing of ESS are focused on wind generation uncertainty. With the increase of distributed PV and the development of the electricity market, the stochastic optimization method considering the uncertainties of PV and load will generate a more reasonable configuration result for the consumer.
The purpose of this paper is to propose a stochastic optimization method based on an expected value model for electricity consumers with a PV plant. Here, we assume that the ESS is not allowed to sell electricity to the grid. The ESS is used to provide consumers with some economic benefits. In this paper, the following issues are the main contributions:
(1) A stochastic optimization method for ESS sizing based on the expected value model is proposed, which takes into account the uncertainty of load and PV in a year, and makes the optimization result more reasonable under different application scenarios;
(2) The Gaussian mixture model is used to cluster the historical data of load and PV, which lays the foundation for establishing the expected value model;
(3) The profit model for load, PV, and energy storage is established. This model takes into consideration the consumer’s electricity costs, the profits of PV, time-of-use price, energy storage investment and maintenance costs, and so on;
(4) The expected value model taking power and capacity as variables of optimal sizing is established on the basis of (1)‒(3), and a more reasonable optimization result than that of the deterministic method is obtained;
(5) The profits of a sodium sulfur (NAS) battery, vanadium redox battery (VRB), polysulfide bromine battery (PSB), value-regulated lead-acid (VRLA) battery, and lithium-ion (Li-ion) battery are compared. The profits of the expected value model and deterministic scenario method are also compared.
The other parts of this paper are organized as follows: Section 2 formulates the proposed optimal model based on the expected value model; Section 3 presents the application of the proposed procedure to two cases; and conclusions are presented in Section 4.

2. Problem Formulations

Under expected constraints, the mathematical programming that maximizes the expected value of the objective function is called the expected value model. The expected value model is one of the common forms in mathematical programming, such as minimizing the expected costs, maximizing the expected value model, and so on [19]. The basic function expression for the expectation model is
{ max E ( f ( X , ξ ) ) E ( g j ( X , ξ ) ) = 0 , j = 1 , , m .
X is an n-dimensional decision vector, ξ is a t-dimensional random vector, f is the objective function, g i is a random constraint function, E ( · ) is the expected value, and m is the number of constraint function.
In a system that contains both consumers and PV, the ESS is installed. In order to minimize the consumer’s costs over the whole life of the ESS, we propose a method to size the energy storage system using the expected value model. As shown in Figure 1, which is the overall architecture of the expected value model, the basic steps are as follows:
(1) The clustering method of the Gaussian mixture model is used to divide the consumer load curve and PV generation curve into different scenarios. Moreover, the probabilities of different scenarios are calculated;
(2) The total profit model involving the consumer, the PV, and the energy storage system is established to calculate the costs in the entire life cycle of energy storage in different scenarios of step (1). The profit model includes the initial investment costs, operation and maintenance costs, energy storage profits, PV, and load costs;
(3) For different storage system configuration values, the expected values of consumer total profits are calculated. When the expected value is the maximum, the sizing of the energy storage system is the optimal result.

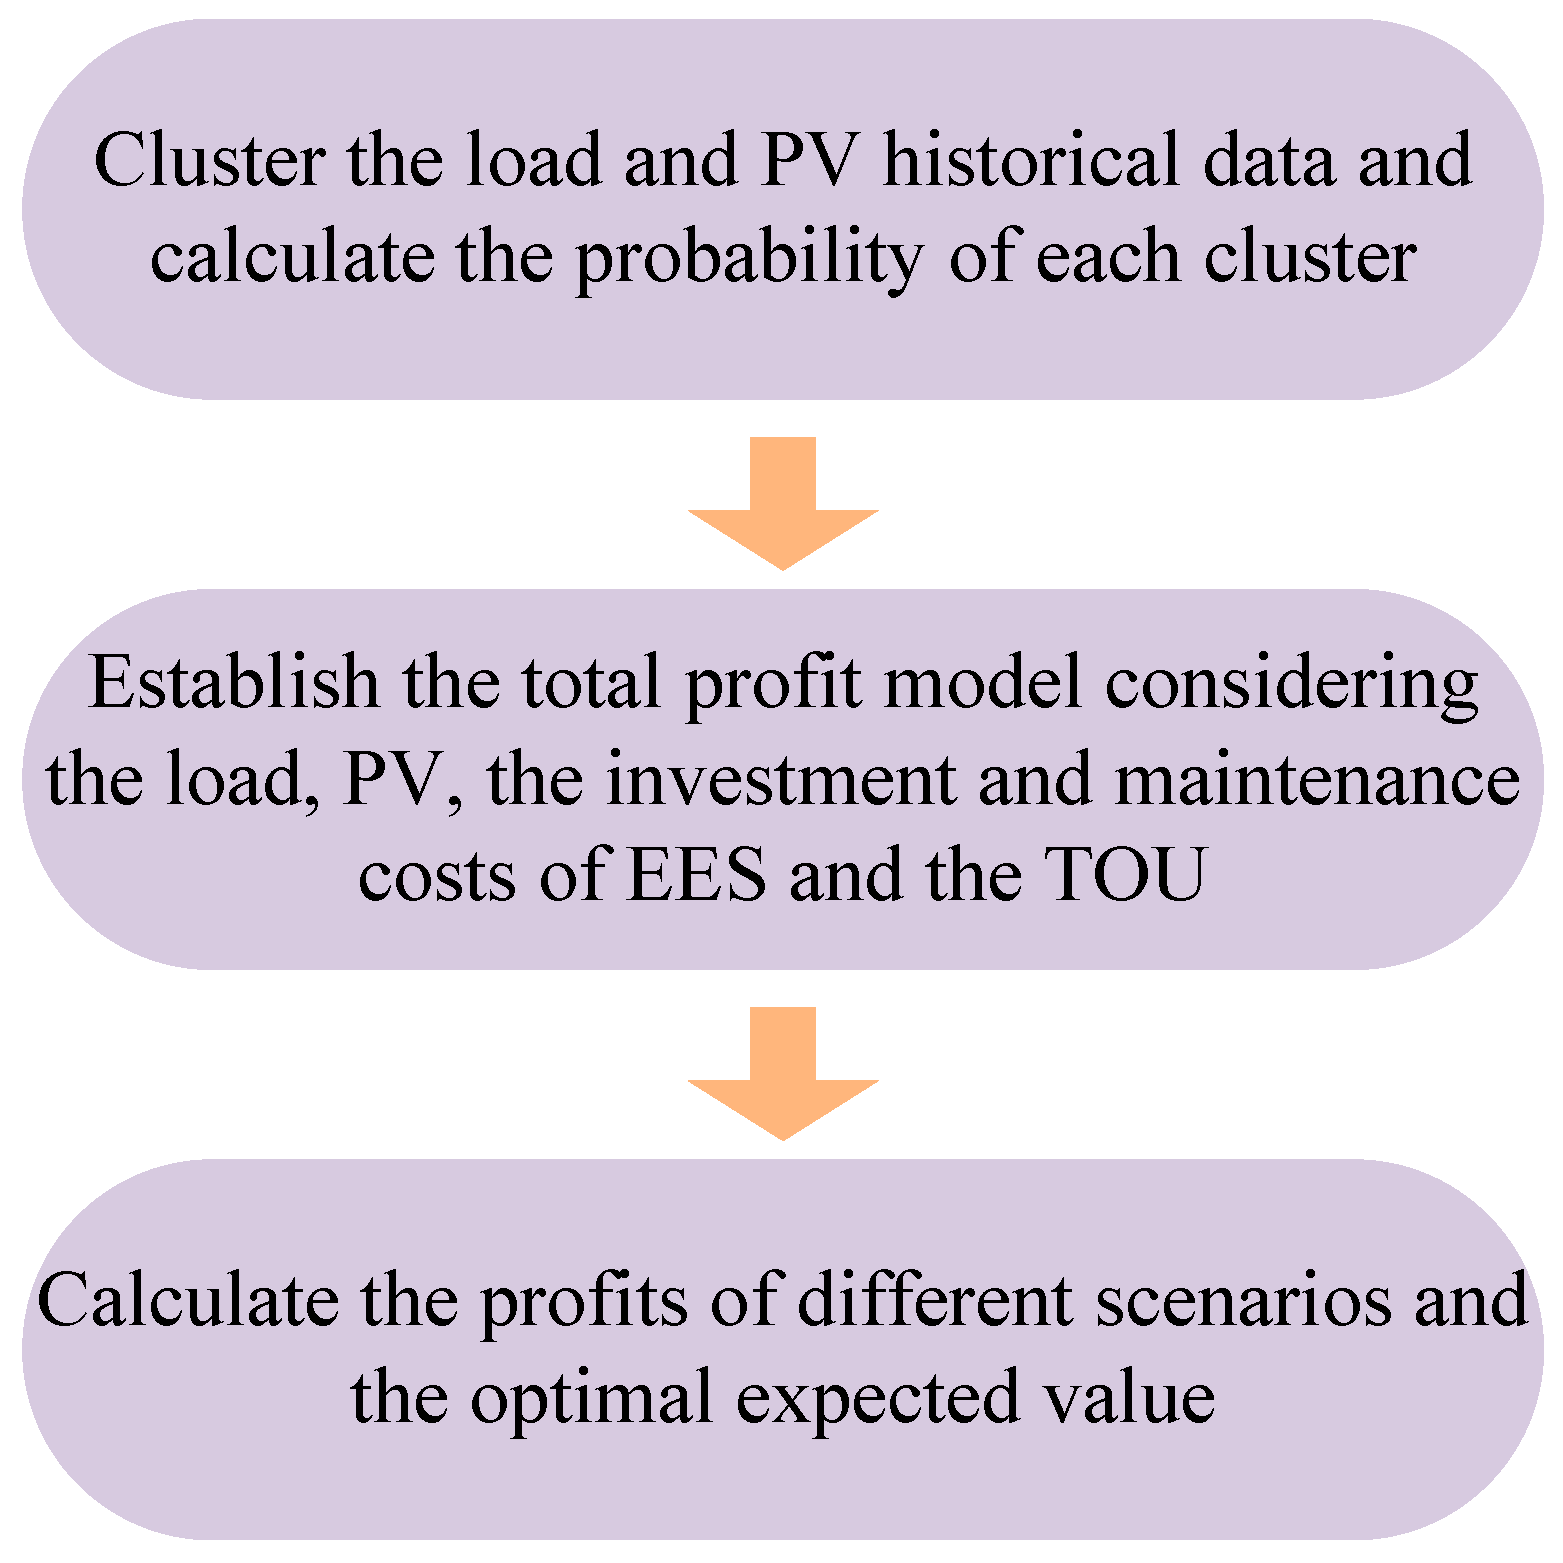
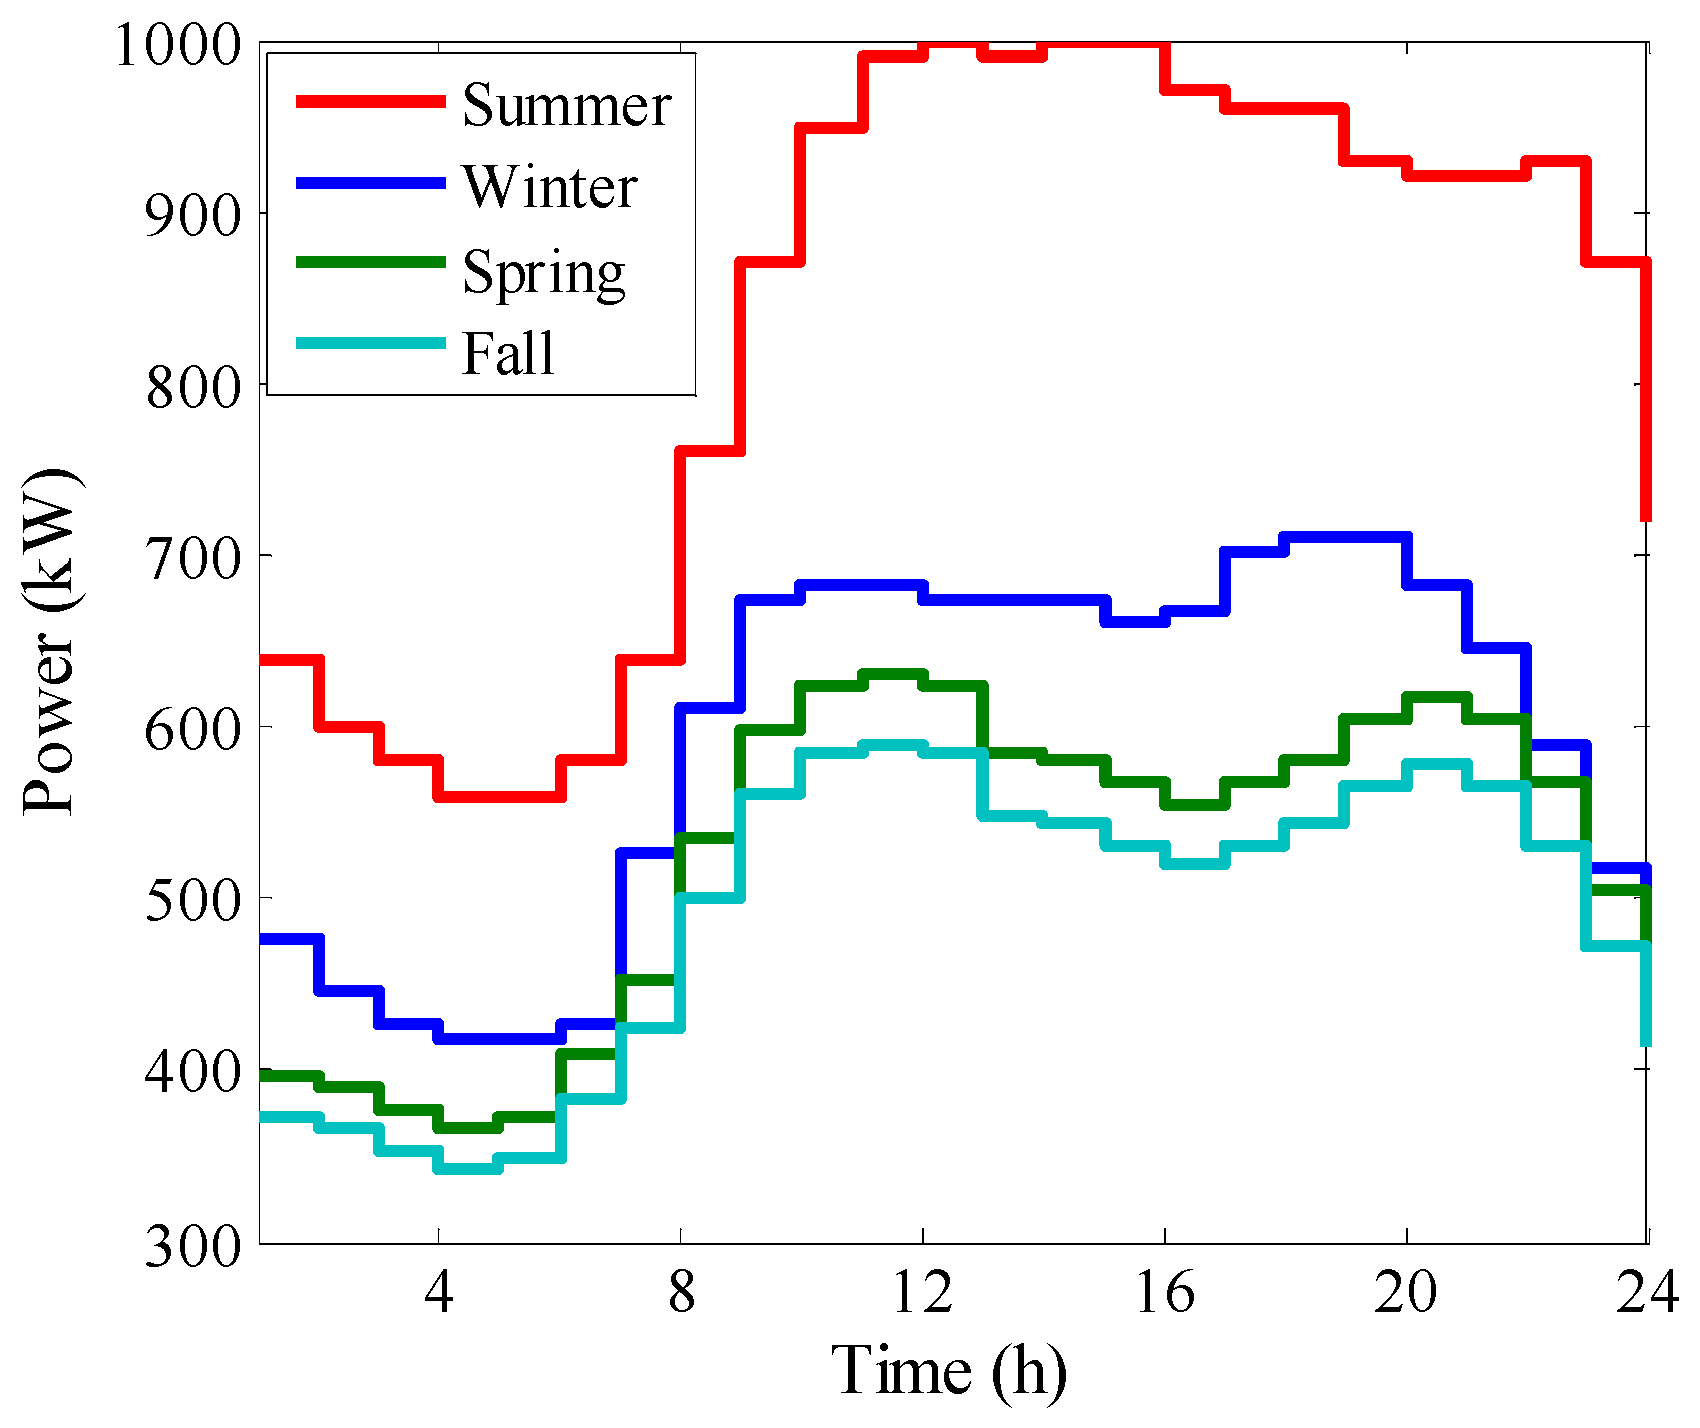
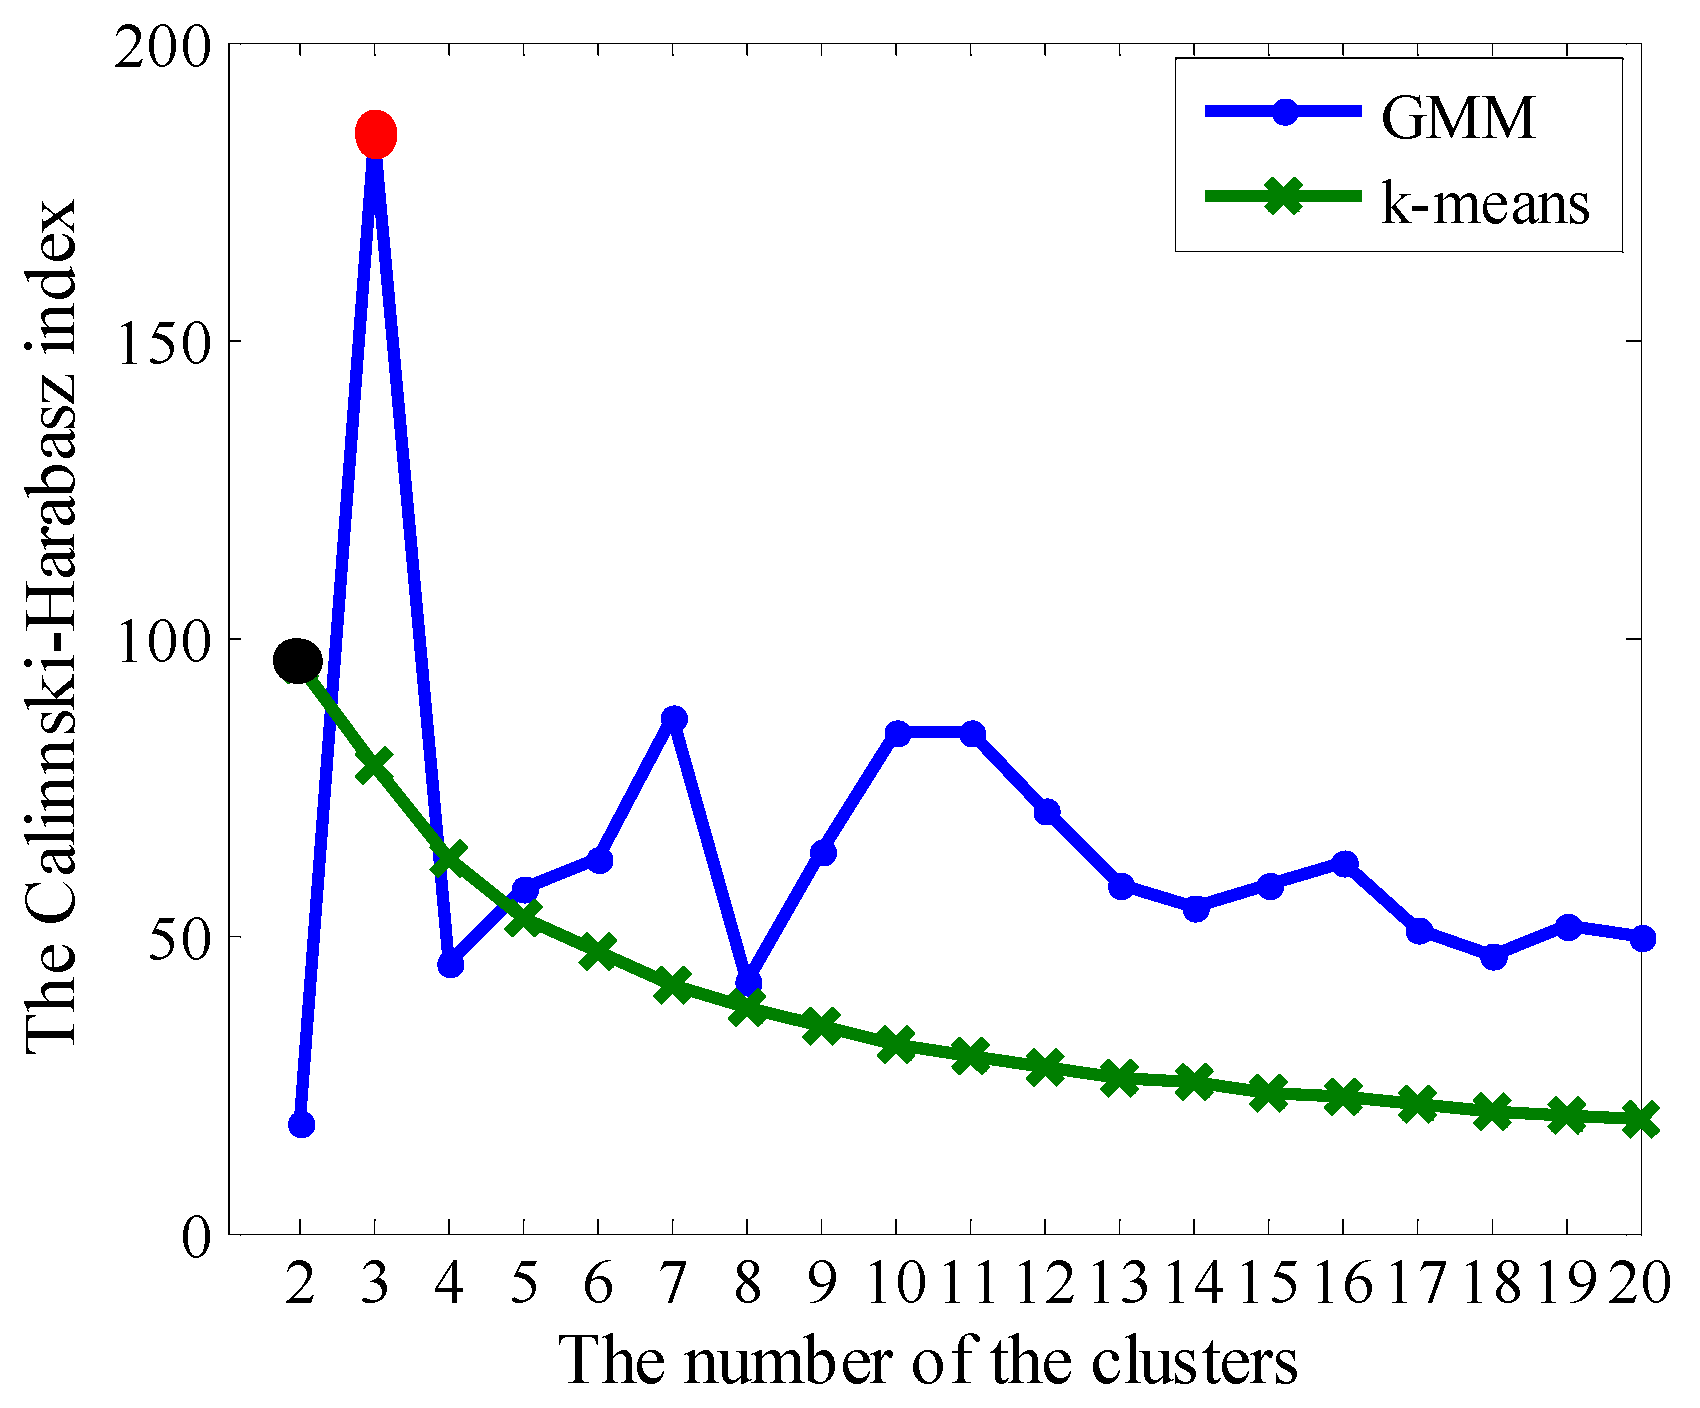
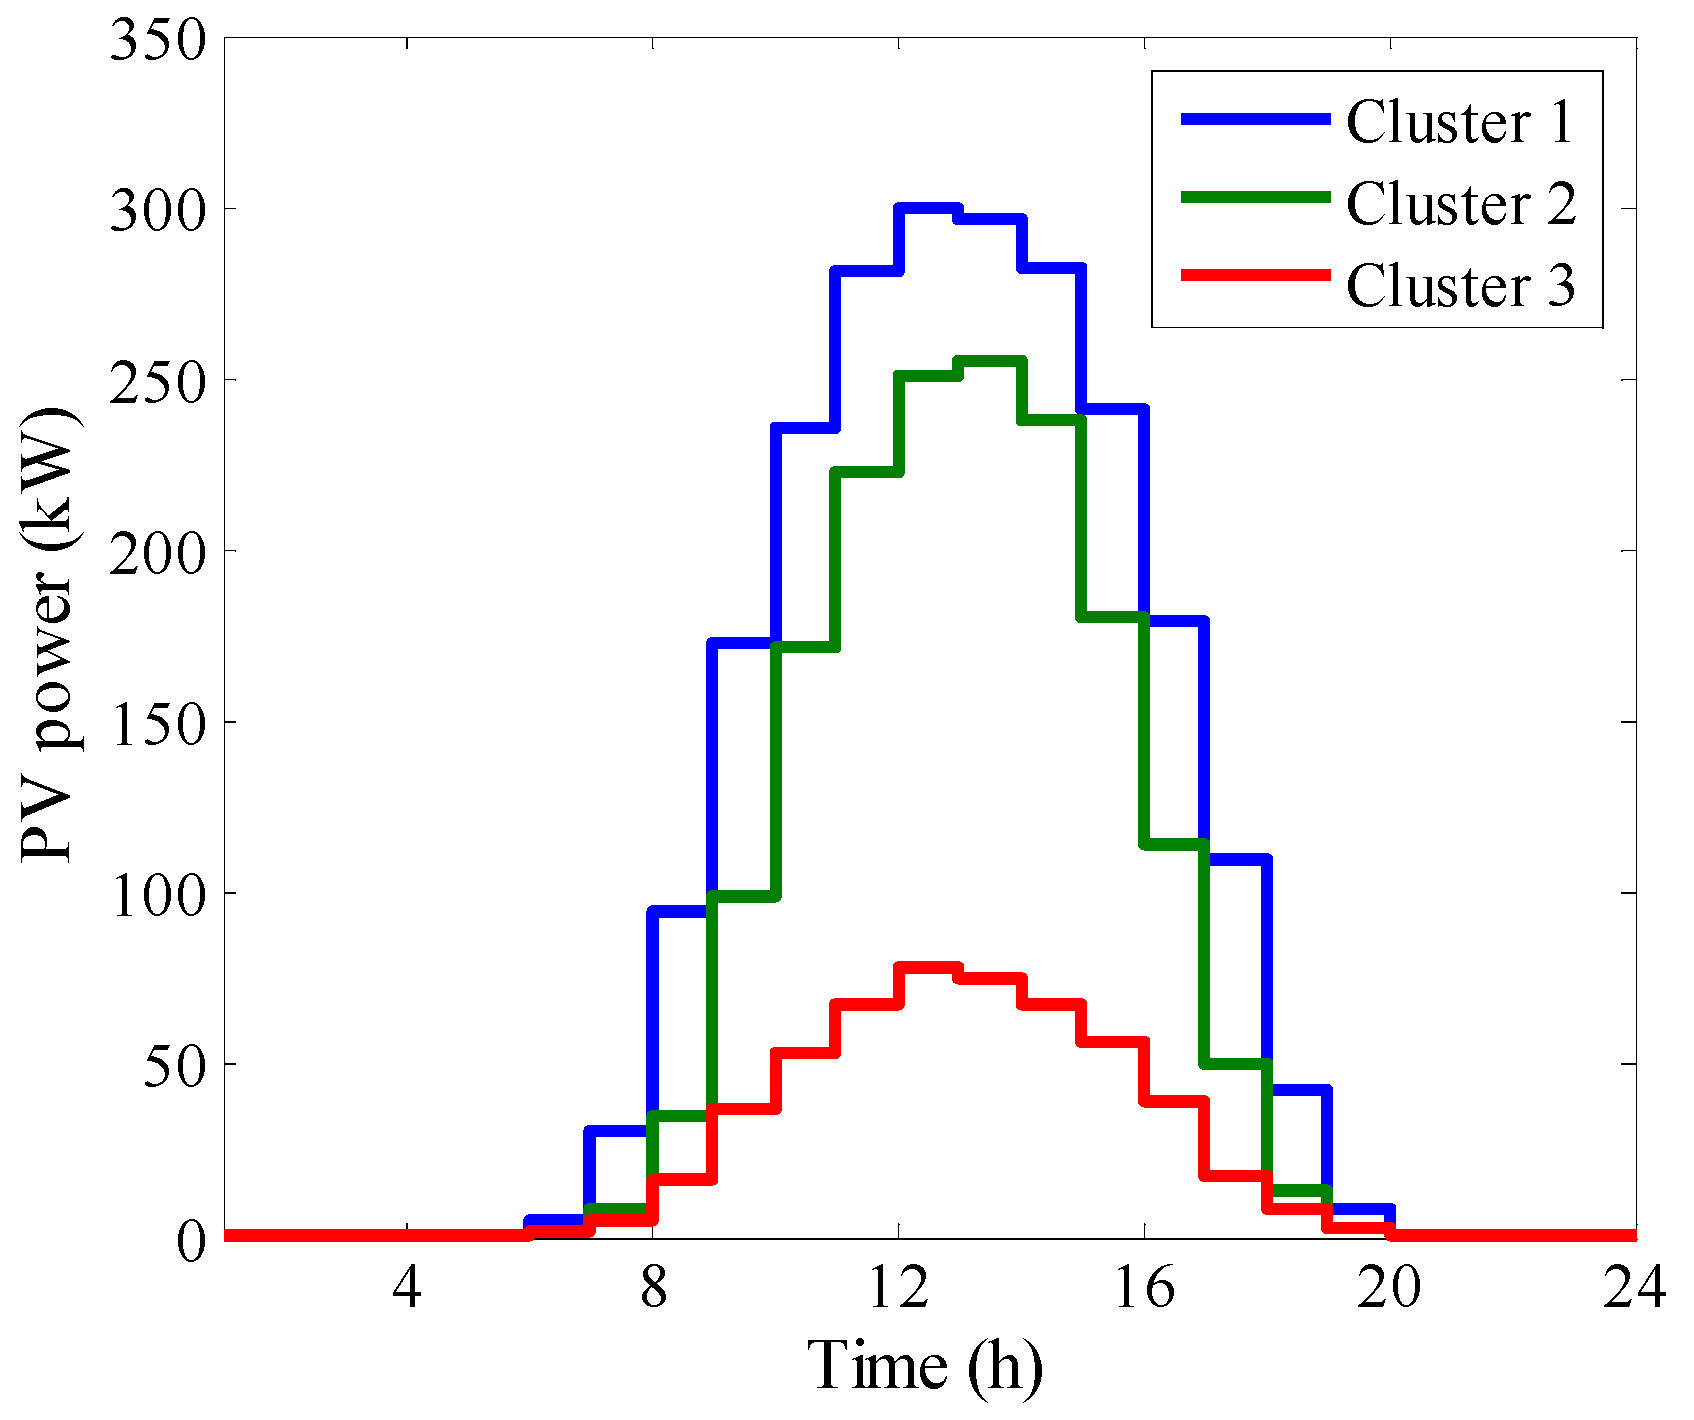
2.1. Clustering the Load Curve and the PV Curve

When using the expected value model to size the energy storage, different random variables and their probabilities need to be determined. In this paper, different clusters can be obtained by analyzing the daily historical data of a year of consumer load and PV.
The Gaussian mixture model (GMM) [20], sometimes called soft clustering, can obtain the probability that each sample point belongs to each cluster, instead of judging that it belongs to exactly one cluster. This method can be divided into different clusters of load and PV curve, and calculate the probability of each cluster, which is the essential parameter of the expected value model. Firstly, we assume that the data are generated by the GMM. Then, we just need to introduce the probability distribution of GMM based on the data, and the K components of GMM actually correspond to K clusters.
An important parameter for clustering using the Gaussian mixture model is the number of mixture models; that is, the number of clusters. In this paper, we use the Calinski-Harabasz [21] index to evaluate the number of clusters. The within-cluster variance is the square of the distance between each point in the cluster and the center of the cluster. The between-cluster variance is the square of the distance between the center points of each cluster and the center of the data set.
I k = S B S W × N k k 1
S B is the overall between-cluster variance, S W is the overall within-cluster variance, k is the number of clusters, and N is the number of observations.
S B = i = 1 k x i m i m 2
S W = i = 1 k x c i x m i 2
m i is the centroid of cluster i , m is the overall mean of the sample data, x i is the number of points in cluster k , and x is a data point. Here, well-defined clusters have a large S B and a small S W . The larger the Calinski-Harabasz index I k , the better the data partition. To determine the optimal number of clusters, we should maximize I k with respect to k . The optimal number of clusters is the solution with the highest Calinski-Harabasz index value.
According to the above index, the number of clusters of the daily load and PV curves in a year can be determined. The load and PV are respectively divided into n and m clusters, and the corresponding probabilities are p n and p m . In this paper, we assume that the load and PV are independent, so there are n × m scenarios with the probabilities p n × p m .

2.2. The Optimization Model of Total Profits

In a system without energy storage, the consumer purchases electricity from the grid and uses the PV power considering the price of the electricity. The energy storage system has the ability to charge and discharge power. When the grid load is low, the electricity price is low, and the energy storage system can be charged during this period; while during peak load, the energy storage system can provide power to the load, thereby reducing the costs of the consumer. At present, the ESS of the consumer side is not allowed to sell power to the grid in China. Therefore, we assumed that the energy storage system considered in this paper is not allowed to sell power to the grid and the energy stored in the ESS is only used by the consumer. However, the PV power can be sold to the grid.
An energy storage system requires an initial capital cost when installed, so calculating the total profits for a consumer over the entire life of the energy storage is reasonable. Therefore, the optimization model in this paper considers the investment of the energy storage system, the maintenance costs, the purchase costs of the consumer, and the costs saved by the energy storage. The electric power has different kinds of time-of-use price in reality. In this paper, we use a kind of typical price to explain the advantage of the stochastic optimization method. For the deterministic method for sizing the EES, this total profit model is regarded as the optimal sizing model. In the proposed method, we calculate the total profits in difference scenarios, which are the variable of the expected value model.
f = f 1 ( f 2 + f 3 + f 4 )
The total costs without the ESS are the costs of purchasing power from the grid minus the profits of the PV power sold to the grid, that is
f 1 = t = 1 T 1 ( 1 + α 1 + β ) t · 365 · t = 1 24 ( C G t ( P L t P P V 1 t ) C P V t P P V 2 t )
When the ESS is installed, the initial investment costs of the energy storage system include power costs and capacity costs [22].
f 2 = C P P E S + C E E E S
The maintenance costs of the energy storage system [22] are
f 3 = t = 1 T 1 C M P E S ( 1 + α 1 + β ) t
After installing the energy storage system, the positive power bought by the consumer from the grid at time t is
P G t = P L t + P E t P P V 1 t
The operating costs of a combined system of load, energy storage, and PV are the costs of purchasing power from the grid minus the costs of PV power sold to the grid, that is
f 4 = t = 1 T 1 ( 1 + α 1 + β ) t · 365 · t = 1 24 ( C G t P G t C P V t P P V 2 t )
P P V 2 t = P P V t P P V 1 t
P E S and E E S represent the rate of power and energy of the ESS, respectively; C P , C E , and C M represent the price of per unit of power, energy, and maintenance, respectively; P P V 1 t represents the PV power used by the consumer at time t; P E t represents the power of the energy storage system, which is positive during charging and negative during discharging; P L t is the load power; α and β are the inflation rate and discount rate, respectively; and T 1 is the cycle life of ESS, and its unit is year.
The costs of energy storage and the costs of operation consider the full life cycle of the energy storage system. During this cycle, the impact on the total costs of the factors, such as the inflation rate, needs to be taken into account. Therefore, in Equations (6), (8), and (10), the costs are multiplied by the coefficient ( 1 + α ) / ( 1 + β ) . For Equation (5), it is the difference of cost without ESS and with ESS. If it is positive, it means that ESS brings some profit for the consumer and the consumer should install the ESS. If it is negative, it means that installing the ESS makes the consumer lose some money. Therefore, we can determine whether the consumer should install the ESS.
In the progress of operation, there are several constrains. The PV power sold to the grid and used by the consumer should follow the inequality Equation (12). As we mentioned above, the ESS is not allowed sell power to the grid. Therefore, when the ESS discharges ( P E t is negative), the inequality Equation (13) should be followed.
{ 0 P P V 1 t P P V t 0 P P V 2 t P P V t
P L t + P E t > 0
The charge and discharge model of ESS is
{ S E S t = S E S t 1 + η c h P E S t 1 Δ t / E E S ,   P E S t 1 > 0 S E S t = S E S t 1 + η disc h P E S t 1 Δ t / E E S ,   P E S t 1 < 0
In the operation of the joint system, the energy storage system needs to meet the following constraints:
{ | P E S t | P E S , max S E S , min S E S t S E S , max
P E S t is the energy storage output power at time t; P P V 1 t is the PV power sold to the grid; S E S t is the state of charge of energy storage at t ; η c h and η d i s c h are the charge and discharge efficiency, respectively; Δ t is the time of charge or discharge; P E S , max is the maximum power of the ESS; and S E S , min and S E S , max are the minimum and maximum SoC, respectively.
Given the power and capacity of the energy storage system, the above optimization model can be used to calculate the maximum profits caused by the ESS in every scenario over the cycle life of the energy storage. It is necessary to mention that we use the Genetic Algorithm [23] to solve the object function. Because it is not the keynote of this paper, we do not describe its detailed steps. In the progress of solving, we set enough generations of GA to ensure that it has a good accuracy.

2.3. Expected Value Model

In the first step, we can get the clustering results and the probabilities of the load and PV curves in a year. Therefore, the probabilities and clusters of load and PV curve are the known quantities. Regarding the power and capacity of ESS as the variables, we can get the maximum total profits in all scenarios that are clusters with different probabilities. The expected value is
E ( P E S , E E S ) = n = 1 N ξ n F n
ξ n and F n are the probability and the maximum total profits of the nth scenario, respectively. The the maximum value of all the expected values can be found, where the result is the best energy storage sizing value.

3. Case Studies

According to the optimal method of the expected value model mentioned in the second part, the Li-ion battery is taken as an example to carry out the simulation analysis. The parameters of batteries [22] are shown in Table 1. The S E S , min is 10% and the S E S , max is 90%. P E S , max is the rated power of ESS, w is the energy efficiency, and T is the battery life.
In the second part, the TOU price and the price of the PV power sold to the grid are considered in the model. For some consumers, the TOU price of Jiangsu Province is as shown in Table 2. In this paper, it is assumed that the daily TOU prices are fixed. The price of PV sold by the consumer is 1 CNY/ kWh. CNY is Chinese Yuan.

3.1. Case 1

As shown in Figure 2, the consumer daily load data is from the literature [24]. The data is divided into four clusters corresponding to four seasons. It is assumed that the probability of each cluster is 25% and the maximum load is 1000 kW. The vertical axis is the load power. The horizontal axis is the time.
PV data is the one-year PV power generation of a 300 kW PV power plant in a factory in Jiangsu Province. According to the clustering method in the second section, the Calinski-Harabasz index of the GMM and the k-means can be seen in Figure 3. The vertical axis is the index. The horizontal axis is the number of clusters. The index of the red point reaches the maximum, and the clustering effect is the best. Here, the highest index of the GMM is better than the k-means.
The three clusters of PV curves obtained by Gaussian mixture model clustering are shown in Figure 4. Among them, the first, second, and third cluster have a probability of 27.93%, 45.25%, and 26.82%, respectively, in one year. The results of the clustering will serve as the basis for the optimization of the expected value model. Therefore, the results of the clustering, including the curves and probabilities, will have an impact on the final calculation.
It is assumed that the PV and load curves are independent of each other in the following scenarios. The power rating of the energy storage system considered is 400 kW. As shown in Table 3, S1‒S12 represent 12 scenarios. The first column is the capacity of the energy storage system in kW. The last column is the expected value of profits. As shown in this table, the profits generated by ESS during the whole life-cycle can be obtained under different capacity values. When the capacity is 3200 kWh, the expected value of profits is the largest. Therefore, the best Li-ion capacity is 3200 kWh when the power rating of ESS is 400 kW.
However, the variables are the power and the capacity in Equation (16). Therefore, we need to consider the impact of changes in the power, as well as the capacity variables. Figure 5 shows how the choice of power rating impacts the profits as the capacity of ESS is changed. The profit curves are illustrated at 200 kW intervals. The vertical axis is the profit accrued by the ESS and the horizontal axis is the capacity of ESS installed. We can see that each curve will first increase as the capacity increases and then decrease. Figure 5 shows that when the storage capacity exceeds an optimal size, the consumer cannot use this capacity, and it is essentially wasted. Clearly, the highest point represents the highest profits for systems of different power ratings. When the power is 400 kW, the highest point is 3200 kWh, which corresponds the best expected value in Table 3.
In fact, we calculate more results at the 50 kW intervals, which show that the highest profits are obtained when the power and the capacity are 550 kW and 4400 kWh, respectively. As shown in Figure 6, it is the operated curves of load, PV, and ESS in scenario 1, where the load curve is cluster1 in Figure 2 and the PV curve is cluster1 in Figure 4. The Ppv1 curve is the PV power used by the consumer. The Ppv2 curve is the PV power sold to the grid. For obtaining the maximum operated profits, from 1 to 8 o’clock, the ESS is charged and all PV power should be sold to the grid. From 8 to 12 and from 18 to 21o’clock, the ESS is discharged, and at the same time, some proportion of the PV power is used by the consumer and the rest of it is sold to the grid. The ESS changes the utilization of the PV power and brings more profits to the consumer. It is worth noting that all the PV power should be used by the consumer under the scenario when there is no energy stored in the ESS between 9 and 13 o’clock.
The optimal results of different batteries are shown in Table 4. The unit of the data in the table is 105 CNY. The results of the fourth column are calculated by the method presented in this paper. The profits of PSB are the highest. This means that, in this case, PSB is the best choice for the consumer. The results of the seventh column are calculated by a deterministic scenario, which does not consider multiple scenarios and their probabilities, but is just based on the price signal. It considers the average load and the average PV generation of one year. We can see that the profits are lower than the fourth column. However, this single deterministic scenario considering only one type of load or PV curve in one year may not be reliable. As shown in the last column of Table 4, when we use 12 scenarios to test the power and the capacity obtained in the fifth and sixth column, the profits are lower than the fourth column. The profits in the fourth column are 12.71% to 68.58% more than the profits in the seventh column. Therefore, the deterministic single scenario approach has its shortcomings, which cannot guarantee more profits for consumers in real multiple scenarios.

3.2. Case 2

Case 2 uses one-year historical data of a factory in Jiangsu Province. The different Calinski-Harabasz index shows that the optimal number of clusters for this factory is 2, as shown in Figure 7. The GMM method is better than the k-means method in this case. As proposed above, a larger index indicates better clustering. The load curves of the two clusters obtained by the Gaussian mixture model clustering are shown in Figure 8, where the probabilities of cluster 1 and 2 are 49.18% and 50.82%, respectively.
Assuming that the PV and load curves are independent of each other, in this case, there are six scenarios in total, and the following simulation results are available for each scenario. When the power of the energy storage system is 400 kW, the simulation results in Table 5 can be obtained. It shows the consumer profits in different capacities and scenarios. The unit of the data in the table is 105 CNY. The highest expected profits are achieved when the capacity is 3200 kWh.
As shown is Figure 9, we draw the profit curves at the 200kW intervals. We can see that each curve initially increases to a maximum and then decreases. The trend of each curve is similar to Figure 5. The highest point of the 400 kW system corresponds to the optimum expected value of Table 4. It is observed that some power rating exhibits a sharper peak zenith in the Figure 5. This is due to limitations in the discharge power. When the capacity of ESS increases, the profits do not increase in the original trend.
In this case, we also calculate the results of different batteries, as shown in the Table 6. The unit of the data in the table is 105 CNY. The PSB is again the best choice. The results of the seventh column are obtained from the scenario where the load and the PV curve are the average value of one year. As the last column of Table 6 shows, when we use six scenarios to test the power and the capacity, the profits are lower than the results of the expected value model. The profits in the fourth column are 0.87% to 127.16% more than the profits in the seventh column.
Figure 10 shows the operational curves when the power and capacity of the Li-ion battery are 450 kW and 3600 kWh, respectively. At 12 o’clock, the load power is too small to limit the discharge power of ESS, which accords with Equation (12). In each table of each case, the best choice of battery is revealed. Obviously, the results of the deterministic scenario of the average curve are better than the results of the expected value model. However, when we use different scenarios to test the optimal results of the deterministic scenario method, the profits are reduced. The method proposed in this paper takes more factors into account relative to the deterministic approach. These factors include the stochastic features of the consumer’s load power due to the consumer’s electricity consumption habit and PV power due to changes of the weather or season. Therefore, the results are more credible.

4. Conclusions

In this paper, an energy storage sizing method based on the expected value model is proposed, which is applied to the consumer side with the PV system. Through the analysis and simulation in two cases, the following conclusions are drawn:
(1) The best cluster number and subsequent clusters of load and PV historical data of a factory in Jiangsu Province are achieved by GMM. The clustering results are obtained as the basis of the expected value model. Different clustering results will have an impact on the final result;
(2) The profit model of the consumer during the entire storage life-cycle is established. The profit model considers the load, PV, storage, and TOU. In different scenarios, the results of the model are obviously different;
(3) The profits of different batteries are obtained from our method. The best batteries in two cases are both PSB. The efficiency of PSB is lower than other batteries, but its price is advantageous;
(4) The result of the expected value model combines the results of multiple scenarios. Compared with the deterministic method, it more fully summarizes the load and PV conditions and produces more reliable results.
Future research will be devoted to the research on the PV and load data cluster. There are many clustering methods and evaluated indexes, which can produce different clustering results when the data needed to be clustered is different. Obviously, different scenarios will produce different profits. In two cases, we use history data of the load and PV to calculate the operated profits. To improve this, the ESS can be operated according to the forecast data of the load and PV.

Author Contributions

D.Z. designed the stochastic optimization framework and wrote the paper. J.L. and X.L. reviewed and edited the paper. J.G. and X.L. provided helpful advice. S.X. provided the load and PV data.

Funding

This work was supported by The Project of State Grid Corporation of China (Research and Application Demonstration of the Aggregation Effect of Multipoint Distributed Energy Storage in Power Grid, DG71-17-012), Key Technologies and Engineering Demonstration of 10MW Lithium Battery Energy Storage System (DG71-17-016) and China Electric Power Research Institute Innovation Fund (Research on Aggregation Control Strategy of User Side Distributed Energy Storage System, DG83-18-005).

Conflicts of Interest

The authors declare no conflict of interest.

References

  1. Ghofrani, M.; Arabali, A.; Etezadi-Amoli, M.; Fadali, M.S. A framework for optimal placement of energy storage units within a power system with high wind penetration. IEEE Trans. Sustain. Energy 2013, 4, 434–442. [Google Scholar] [CrossRef]
  2. Celli, G.; Mocci, S.; Pilo, F.; Loddo, M. Optimal integration of energy storage in distribution networks. In Proceedings of the 2009 IEEE Bucharest PowerTech, Bucharest, Romania, 28 June–2 July 2009. [Google Scholar]
  3. Donnellan, B.J.; Vowles, D.J.; Soong, W.L. A review of energy storage and its application in power systems. In Proceedings of the 2015 Australasian Universities Power Engineering Conference (AUPEC), Wollongong, Australia, 27–30 September 2015. [Google Scholar]
  4. Coppez, G.; Chowdhury, S.; Chowdhury, S.P. Impacts of energy storage in distributed Power Generation: A review. In Proceedings of the 2010 International Conference on Power System Technology, Hangzhou, China, 24–28 October 2010. [Google Scholar]
  5. Carr, S.; Premier, G.C.; Guwy, A.J.; Dinsdale, R.M. Energy storage for active network management on electricity distribution networks with wind power. IRT Renew. Power Gener. 2014, 8, 249–259. [Google Scholar] [CrossRef]
  6. Yang, P.; Tang, G.; Nehorai, A. A game-theoretic approach for optimal time-of-use electricity pricing. IEEE Trans. Power Syst. 2013, 28, 884–892. [Google Scholar] [CrossRef]
  7. Galvis, J.C.; Costa, A. Demand side management using time of use and elasticity price. IEEE Lat. Am. Trans. 2016, 14, 4267–4274. [Google Scholar] [CrossRef]
  8. Abdeltawab, H.H.; Mohamed, A.R.I. Mobile energy storage scheduling and operation in active distribution systems. IEEE Trans. Ind. Electron. 2017, 64, 6828–6840. [Google Scholar] [CrossRef]
  9. Ahmad, T. A hybrid grid connected pv battery energy storage system with power quality improvement. Sol. Energy 2016, 125, 180–191. [Google Scholar] [CrossRef]
  10. Goebel, C.; Jacobsen, H.A. Bringing distributed energy storage to market. IEEE Trans. Power Syst. 2016, 31, 173–186. [Google Scholar] [CrossRef]
  11. Bludszuweit, H.; Dominguez-Navarro, J.A. A probabilistic method for energy storage sizing based on wind power forecast uncertainty. IEEE Trans. Power Syst. 2011, 26, 1651–1658. [Google Scholar] [CrossRef]
  12. Morstyn, T.; Momayyezan, M.; Hredzak, B.; Agelidis, V.G. Distributed control for state-of-charge balancing between the modules of a reconfigurable battery energy storage system. IEEE Trans. Power Electron. 2016, 31, 7986–7995. [Google Scholar] [CrossRef]
  13. Habib, A.H.; Disfani, V.R.; Kleissl, J.; Callafon, R.A.D. Optimal energy storage sizing and residential load scheduling to improve reliability in islanded operation of distribution grids. In Proceedings of the 2017 American Control Conference (ACC), Seattle, WA, USA, 24–26 May 2017. [Google Scholar]
  14. Lee, T.Y.; Chen, N. Determination of optimal contract capacities and optimal sizes of battery energy storage systems for time-of-use rates industrial customers. IEEE Trans. Energy Convers. 1995, 10, 562–568. [Google Scholar]
  15. Kargarian, A.; Hug, G. Optimal sizing of energy storage systems: A combination of hourly and intra-hour time perspectives. IET Gener. Transm. Distrib. 2016, 10, 594–600. [Google Scholar] [CrossRef]
  16. Ahmad, M.A.E.M.; Kazim Bekdache, S.; Barrios, L.A. Optimal sizing for a hybrid power system with wind/energy storage based in stochastic environment. Renew. Sustain. Energy Rev. 2016, 59, 1149–1158. [Google Scholar]
  17. Karimi, A.; Ranjbar, Z.; Fereidunian, A.; Lesani, H. A stochastic approach to optimal sizing of energy storage systems in a microgrid. In Proceedings of the 2016 Smart Grids Conference (SGC), Kerman, Iran, 20–21 December 2016. [Google Scholar]
  18. Baker, K.; Hug, G.; Li, X. Energy storage sizing taking into account forecast uncertainties and receding horizon operation. IEEE Trans. Sustain. Energy 2017, 8, 331–340. [Google Scholar] [CrossRef]
  19. Li, F.; Wang, L. Generalized Expected Value Model for Stochastic Programming and Its Application in Transportation Problems. In Proceedings of the 2009 First International Conference on Information Science and Engineering, Nanjing, China, 26–28 December 2009. [Google Scholar]
  20. Goldberg, M.; Shlien, S. A clustering scheme for multispectral images. IEEE Trans. Syst. Man Cybern. 1978, 8, 86–92. [Google Scholar] [CrossRef]
  21. Maulik, U.; Bandyopadhyay, S. Performance evaluation of some clustering algorithms and validity indices. IEEE Trans. Pattern Anal. Mach. Intell. 2002, 24, 1650–1654. [Google Scholar] [CrossRef] [Green Version]
  22. Xiang, Y.; Wei, Z.; Sun, G.; Sun, Y.; Shen., H. Life Cycle Cost Based Optimal Configuration of Battery Energy Storage System in Distribution Network. Power Syst. Technol. 2015, 39, 264–270. (In Chinese) [Google Scholar]
  23. Deb, K.; Pratap, A.; Agarwal, S.; Meyarivan, T. A fast and elitist multiobjective genetic algorithm: Nsga-ii. IEEE Trans. Evol. Comput. 2002, 6, 182–197. [Google Scholar] [CrossRef]
  24. Atwa, Y.M.; El-Saadany, E.F.; Salama, M.M.A.; Seethapathy, R.; Assam, M.; Conti, S. Adequacy evaluation of distribution system including wind/solar dg during different modes of operation. IEEE Trans. Power Syst. 2011, 26, 1945–1952. [Google Scholar] [CrossRef]
Figure 1. The overall architecture of the expected value model.
Energies 12 00702 g001
Figure 2. The typical daily load curves of four seasons.
Energies 12 00702 g002
Figure 3. The comparison of PV Calinnski-Harabasz index of two different clustering methods.
Energies 12 00702 g003
Figure 4. The cluster center curves of three PV clusters obtained by the GMM method.
Energies 12 00702 g004
Figure 5. The profit curves of different rate powers of ESS.
Energies 12 00702 g005
Figure 6. The operated curves when the power and capacity are 550 kW and 4400 kWh, respectively.
Energies 12 00702 g006
Figure 7. The comparison of Calinnski-Harabasz index of two different clustering methods.
Energies 12 00702 g007
Figure 8. The cluster center curves of two load clusters obtained by the GMM method.
Energies 12 00702 g008
Figure 9. The profit curves of different rate powers of ESS.
Energies 12 00702 g009
Figure 10. The operated curves when the power and the capacity of Li-ion battery are 450 kW and 3600 kWh, respectively.
Energies 12 00702 g010
Table 1. The parameters of different batteries.
ParameterLi-ionNaSVRBPSBVRLA
CP(CNY/kW)27801600280010502000
CE(CNY/kWh)13601250650450950
CM(CNY/kWa)6560606070
w/%9080706085
T/year1515151510
Table 2. The time-of-use electricity price.
Time/h1‒89‒1213‒1718‒2122‒24
Price/CNY0.32001.10020.66011.10020.6601
Table 3. The total profits in different scenarios and capacity of energy storage.
Energy of ESS (kWh)The Total Profits in Twelve Different Scenarios (105 CNY)Expected Profits (105 CNY)
S1S2S3S4S5S6S7S8S9S10S11S12
E = 27008.458.188.468.468.468.458.468.468.468.468.458.188.43
E = 28009.268.919.289.289.289.229.289.289.289.289.268.919.24
E = 290010.089.6010.0910.0910.0910.0010.0910.0910.0910.0910.089.6010.03
E = 300010.8910.2910.9010.9010.9010.7410.9010.9010.9010.9010.8910.2910.82
E = 310011.7110.9911.7211.6711.7211.4811.7211.7211.7211.7211.7110.9911.61
E = 320012.5211.6412.5312.4512.5312.2112.5312.5312.5312.5312.5211.6412.38
E = 330011.1610.2811.1711.0911.1710.8511.1711.1711.1711.1711.1610.2811.02
E = 34009.808.929.819.739.819.499.819.819.819.819.808.929.66
E = 35008.447.568.458.378.458.138.458.458.458.458.447.568.30
E = 36007.086.207.097.017.096.777.097.097.097.097.086.206.94
E = 37005.724.845.735.655.735.415.735.735.735.735.724.845.58
Table 4. The comparison of different batteries’ results obtained by two optimization methods.
BatteryExpected Value Model MethodDeterministic Method of Single Scenario
Power Rating(kW)Energy Rating (kWh)Expected Profits (105 CNY)Power Rating (kW)Energy Rating (kWh)Profits (105 CNY)
Li-ion550440016.19650520011.2
NaS550440012.0765052007.16
VRB550440016.17650520012.85
PSB600475019.06700560016.91
VRLA550440011.865052008.11
Table 5. The total profits in different scenarios and capacity of energy storage.
Energy of ESS
(kWh)
The Total Profits in Six Different ScenariosExpected Profits
(105 CNY)
S1S2S3S4S5S6
E = 27007.118.457.478.468.388.468.04
E = 28007.849.268.209.289.159.288.82
E = 29008.5710.088.9310.099.9210.099.60
E = 30009.3010.899.6710.9010.7010.9010.38
E = 310010.0211.7110.4011.7211.4611.7211.16
E = 320010.4312.5210.8512.5311.9112.5311.79
E = 33009.0711.169.4911.1710.5511.1710.43
E = 34007.719.808.139.819.199.819.07
E = 35006.358.446.778.457.838.457.71
E = 36004.997.085.417.096.477.096.35
E = 37003.635.724.055.735.115.734.99
Table 6. The comparison of different batteries’ results obtained by two optimization methods.
BatteryExpected Value Model MethodDeterministic Method of a Single Scenario
Power Rating (kW)Energy Rating (kWh)Expected Profits (105 CNY)Power Rating (kW)Energy Rating
(kWh)
Profits (105 CNY)
Li-ion450360012.4785068008.52
NaS45036009.285068004.05
VRB600480013.52850680012.29
PSB900720018.57900720018.41
VRLA45036009.0985068006.17

