Article

Rotor Fault Detection in Induction Motors Based on Time-Frequency Analysis Using the Bispectrum and the Autocovariance of Stray Flux Signals

by
Miguel E. Iglesias-Martínez
1,2,
Jose Alfonso Antonino-Daviu
3,*,
Pedro Fernández de Córdoba
2 and
J. Alberto Conejero
2
1
Departamento de Telecomunicaciones, Universidad de Pinar del Río, Pinar del Río, Martí #270, CP 20100, Cuba
2
Instituto Universitario de Matemática Pura y Aplicada, Universitat Politècnica de València (UPV), Camino de Vera s/n, 46022 Valencia, Spain
3
Instituto Tecnológico de la Energía, Universitat Politècnica de València (UPV), Camino de Vera s/n, 46022 Valencia, Spain
*
Author to whom correspondence should be addressed.
Energies 2019, 12(4), 597; https://doi.org/10.3390/en12040597
Submission received: 20 January 2019 / Revised: 10 February 2019 / Accepted: 11 February 2019 / Published: 14 February 2019
(This article belongs to the Special Issue Fault Diagnosis in Electric Motors)

Abstract

:
The aim of this work is to find out, through the analysis of the time and frequency domains, significant differences that lead us to obtain one or several variables that may result in an indicator that allows diagnosing the condition of the rotor in an induction motor from the processing of the stray flux signals. For this, the calculation of two indicators is proposed: the first is based on the frequency domain and it relies on the calculation of the sum of the mean value of the bispectrum of the flux signal. The use of high order spectral analysis is justified in that with the one-dimensional analysis resulting from the Fourier Transform, there may not always be solid differences at the spectral level that enable us to distinguish between healthy and faulty conditions. Also, based on the high-order spectral analysis, differences may arise that, with the classical analysis with the Fourier Transform, are not evident, since the high order spectra from the Bispectrum are immune to Gaussian noise, but not the results that can be obtained using the one-dimensional Fourier transform. On the other hand, a second indicator based on the temporal domain that is based on the calculation of the square value of the median of the autocovariance function of the signal is evaluated. The obtained results are satisfactory and let us conclude the affirmative hypothesis of using flux signals for determining the condition of the rotor of an induction motor.

1. Introduction

In the electric motor condition monitoring area, there is a continuous search for new techniques that are able to enhance the performance and to avoid the drawbacks of the currently existing ones. In this context, the analysis of alternative machine quantities is being explored, as a way to complement the information provided by the well-known methods that are widespread in the industry (currents and vibrations). This is especially important, taking into consideration that no single quantity has been proved to be reliable enough to diagnose the condition of the whole machine, and that the best option seems to be to combine the information obtained from different sources [1,2,3].
Induction motor fault detection (FD) methods, such as stray flux data analysis [4,5,6,7,8], have specific advantages that make them especially attractive for certain applications. Fault diagnosis and processing techniques based on stray flux signals are completely non-invasive and their set up is relatively simple, although the application of this approach requires a specific sensor and a priori knowledge of the distribution of the magnetic field around the electrical machine, which depends, in general, on the manufacturing characteristics of the induction motor [1].
In reference [6], fault detection from the analysis of stray flux signals is based on the variation of the amplitude versus the load of a specific harmonic for two different positions of the flux sensor. The advantage of this method is that it does not require information about the machine behavior in a healthy state. In reference [4], the use of an analytical model that allows us to determine the magnetic flux approximation under conditions of healthy and faulty states for the case of a short circuit between the stator turns and the broken bars is explained. We also refer to [7] for another method for short circuitdetection using stray flux signals.
Fault diagnosis using stray flux signals is based on spectral analysis, through statistical methods, of the harmonics signals obtained from the flux sensor at different relative positions. Compared with classical methods based on analysis of currents such as MCSA (Monte Carlo Statistical Analysis), a disadvantage is that the results may depend on the position of the sensor, and it is not possible to theoretically establish a general rule to obtain the optimum position in the measurement. Moreover, there are no defined thresholds to determine the severity of the fault based on the analysis of these quantities.
In spite of the drawbacks of stray flux data analysis, the progressive cost decrement of necessary flux sensors together with the aforementioned advantages of this technique have led to a renewed dynamism in the research devoted to the study of this technique. Recent works have even extrapolated its application to transient analysis, showing especial advantages in comparison with other methods [9]. Stray flux analysis is adequate to avoid occasional false indications appearing when other techniques are applied to rotor fault detection [10]. Moreover, the suitability of stray flux analysis for non-adjacent bar breakage detection has been explored in [11,12]. Regarding statistical analysis using stray flux signals, an algorithm has been proposed in [13] that relies on the use of the mean value and the standard deviation of the spectral components. Its performance has been tested with three levels of faults, see also [14,15].
In the present work, an algorithm to determine the rotor condition of induction motors from the analysis of stray flux signals is proposed. The detection of the healthy and faulty state conditions is based on a time-frequency analysis of the bispectrum and of the autocovariance function. The results are satisfactory and show the potential of this approach, which provides valuable information to detect the state of the rotor or, at least, to supplement the information provided by other quantities, improving the performance of classical techniques.

2. Materials and Methods

2.1. Data Acquisition

The experimental test bench was based on a 1.1 kW induction motor that was driving a direct current generator. Stray flux measurements were obtained by registering the electromotive force waveforms induced in an external coil sensor that was attached tovarious positions of the motor frame. The flux sensor was a coil with 1000 turns with an external diameter of 80 mm and an internal diameter of 39 mm.
Different operating conditions of the motor were considered. To differentiate the results by working regimes, our samples were taken during the motor startup (the motor was fed at 60% of the rated voltage) and at steady state (in this case the motor was fed 100% of the nominal voltage). We have obtained eight samples of flux signals of a healthy motor and sixteen samples of flux signals of a motor with adamaged rotor (one broken bar). All the measurements in the experiments were taken under similar characteristics in both cases, in order to facilitate subsequent comparisons. In both experiments, the sampling frequency was 5 kHz.
We show in Table 1 and Table 2 the different conditions of the experiments for capturing the flux signals of the healthy and faulty motors during start-up (60% of the supply voltage), as well as the corresponding sensor positions (see Figure 1). In these tables, NL stands for ‘No load’ whereas FL means ‘Full Load’.
Similar experiments were carried out with the motor under permanent regime (100% of the supply voltage). We summarize in Table 3 and Table 4 the experimental conditions of the motor operation at steady state.

2.2. Analysis in the Frequency Domain: Theoretical Foundation

Let { x ( n ) } ,   n = 0 , ± 1 , ± 2 , be a stationary random vector. Let us consider the high-order moments, see [13,14],
m k x ( τ 1 , τ 2 , , τ k 1 ) = E { x ( n ) x ( n + τ 1 ) x ( n + τ k 1 ) }
that represents the moment of order   k   of the vector, which depends only on the different time intervals τ 1 , τ 2 , τ k 1 , τ i = 0 , ± 1 , for all i . Since, in practice cumulants are functions dependent on the expected value, they have to be estimated, since we have a finite amount of data to process   { x ( n ) } n = 0 N 1 .
These estimators are of a stationary nature and are characterized by first- and second-order statistical functions such as the mean value and variance. Then, let { x ( n ) } ,   n = 0 , ± 1 , ± 2 , be a stationary process of zero mean value. The third ordercumulant is given by:
C 3 x ( τ 1 , τ 2 ) = 1 N n = N 1 N 2 x ( n ) · x ( n + τ 1 ) · x ( n + τ 2 )
where N 1   and N 2 are chosen in such a way that the summation involves only x(n) with n [ 0 ,   N 1 ] , N being the number of samples to be evaluated in the cumulant region, see [15]. Likewise, the bispectrum is defined by the Fourier Transform of the third order cumulant, which is given by:
B x N ( f 1 , f 2 ) = τ 1 = N 1 N 1 τ 2 = N 1 N 1 C 3 x ( τ 1 , τ 2 ) · e 2 π f 1 τ 1 · e 2 π f 2 τ 2 = 1 N 2 X ( f 1 , f 2 ) · X ( f 1 ) · X ( f 2 )
where X ( f ) is the Fourier Transform of the sequence   { x ( n ) } n = 0 N 1 , see [15].
For the detection of the healthy and the damaged state conditions of an induction motor, an algorithm based on the sum of the mean value of the bispectrum absolute values ( B x m e a n N ( f ) ) of the flux signal is proposed. From (3), we can obtain its formal description, shown as follows:
( B x m e a n N ( f ) ) = 1 N i = 1 N | B x N ( f 1 , f 2 ) | i
where N is the number of rows of the N × N square matrix obtained from the bispectrum. The obtained result in (4) is a 1 × N vectorthat contains the average frequency values of the amplitude bispectrum matrix of the flux signal. From the obtained result in (4), we define an indicator variable in the frequency domain by the following expression, as the summation of every average frequency values of the amplitude bispectrum:
Ind ( f ) = i = 1 N B x m e a n N ( f ) ( i )
that will be used for the detection of the healthy and faulty condition of the induction motor.

2.3. Temporal Domain Analysis

First, we process the flux signals in the time domain, using the initial data of the experiment, see Table 1, Table 2, Table 3 and Table 4. During the start-up, it is shown that the indicator variable in the frequency domainleads to good results and a palpable difference is observed, which enables us to discriminate between healthy and damaged state conditions of arotor. However, when the motor works at steady state, at 100% of the rated voltage, the method based on the analysis in the frequency domain is not completely effective.
Therefore, to solve the aforementioned issues and to obtain a reliable indicator to be applied in both situations, enabling the discrimination between healthy and damaged rotors, an algorithm based on the autocovariance function of the stray flux signals is proposed. This algorithm is based on the square value of the median of the autocovariance matrix of the flux signal. The theoretical foundations of the proposed are described below:
The autocovariance function of a random stationary process   { x ( n ) } n = 0 N 1 is a measure of its dispersion around its mean value and is defined as a function dependent on the first- and second-order moments as follows [16]:
C 2 x ( τ ) = m 2 x ( τ ) ( m 1 x ) 2
where m 2 x ( τ ) is the autocorrelation function and ( m 1 x ) 2 is the first order moment. From (6), it can be noted that if the process is of zero mean value, the autocovariance coincides with the autocorrelation function. Then, replacing in (6) m 2 x ( τ ) and applying second order statistics we have:
C 2 x ( τ ) = 1 N t = 0 N 1 τ x ( t ) · x ( t + τ )
Then, after obtaining the autocovariance function, we proceed to calculate the square value of the median, for each sample used in the experiment, which is as follows [16,17]:
Let be x 1 , x 2 , x 3 , , x n the data of an ordered sample in increasing order and designating the median as M e , if   n   is odd, the median is the value that the position occupies: M e ( c 2 x ) = c 2 x ( τ ) ( n + 1 ) 2 , then if n is pair, the median is the arithmetic mean of the two central values. Then, M e ( c 2 x ) would be:
M e ( c 2 x ) = c 2 x ( τ ) ( n 2 ) + c 2 x ( τ ) ( n 2 + 1 ) 2
Substituting to find out the temporary indicator:
I n d t = ( M e ( c 2 x ) ) 2
The obtained result in (9) will be taken as the variable of indication in the time domain for the detection of the healthy and faulty conditions in the induction motor.

3. Results

3.1. Results in the Frequency Domain

Using the data obtained in the experiments, we have applied the algorithm described in the Section 2.2 in order to obtain the indication variable in the frequency domain, based on the bispectrum of the flux signal. This enabled us to discriminate between the healthy and faulty conditions of an induction motor. The bispectrum has been calculated in a window of 1024 samples, which results in a square matrix, where the number of rows and columns coincides with the data window to be processed, i.e., 1024 × 1024.
We have used the algorithm based on the bispectruminstead of the analysis based on the one-dimensional Fourier transform. The reason is the following: when applying the proposed method using the sum of the mean of the frequency spectrum absolute value, no relative differences were observed between the healthy and the damagedstates if the one-dimensional Fourier transform is used, as mentioned above.
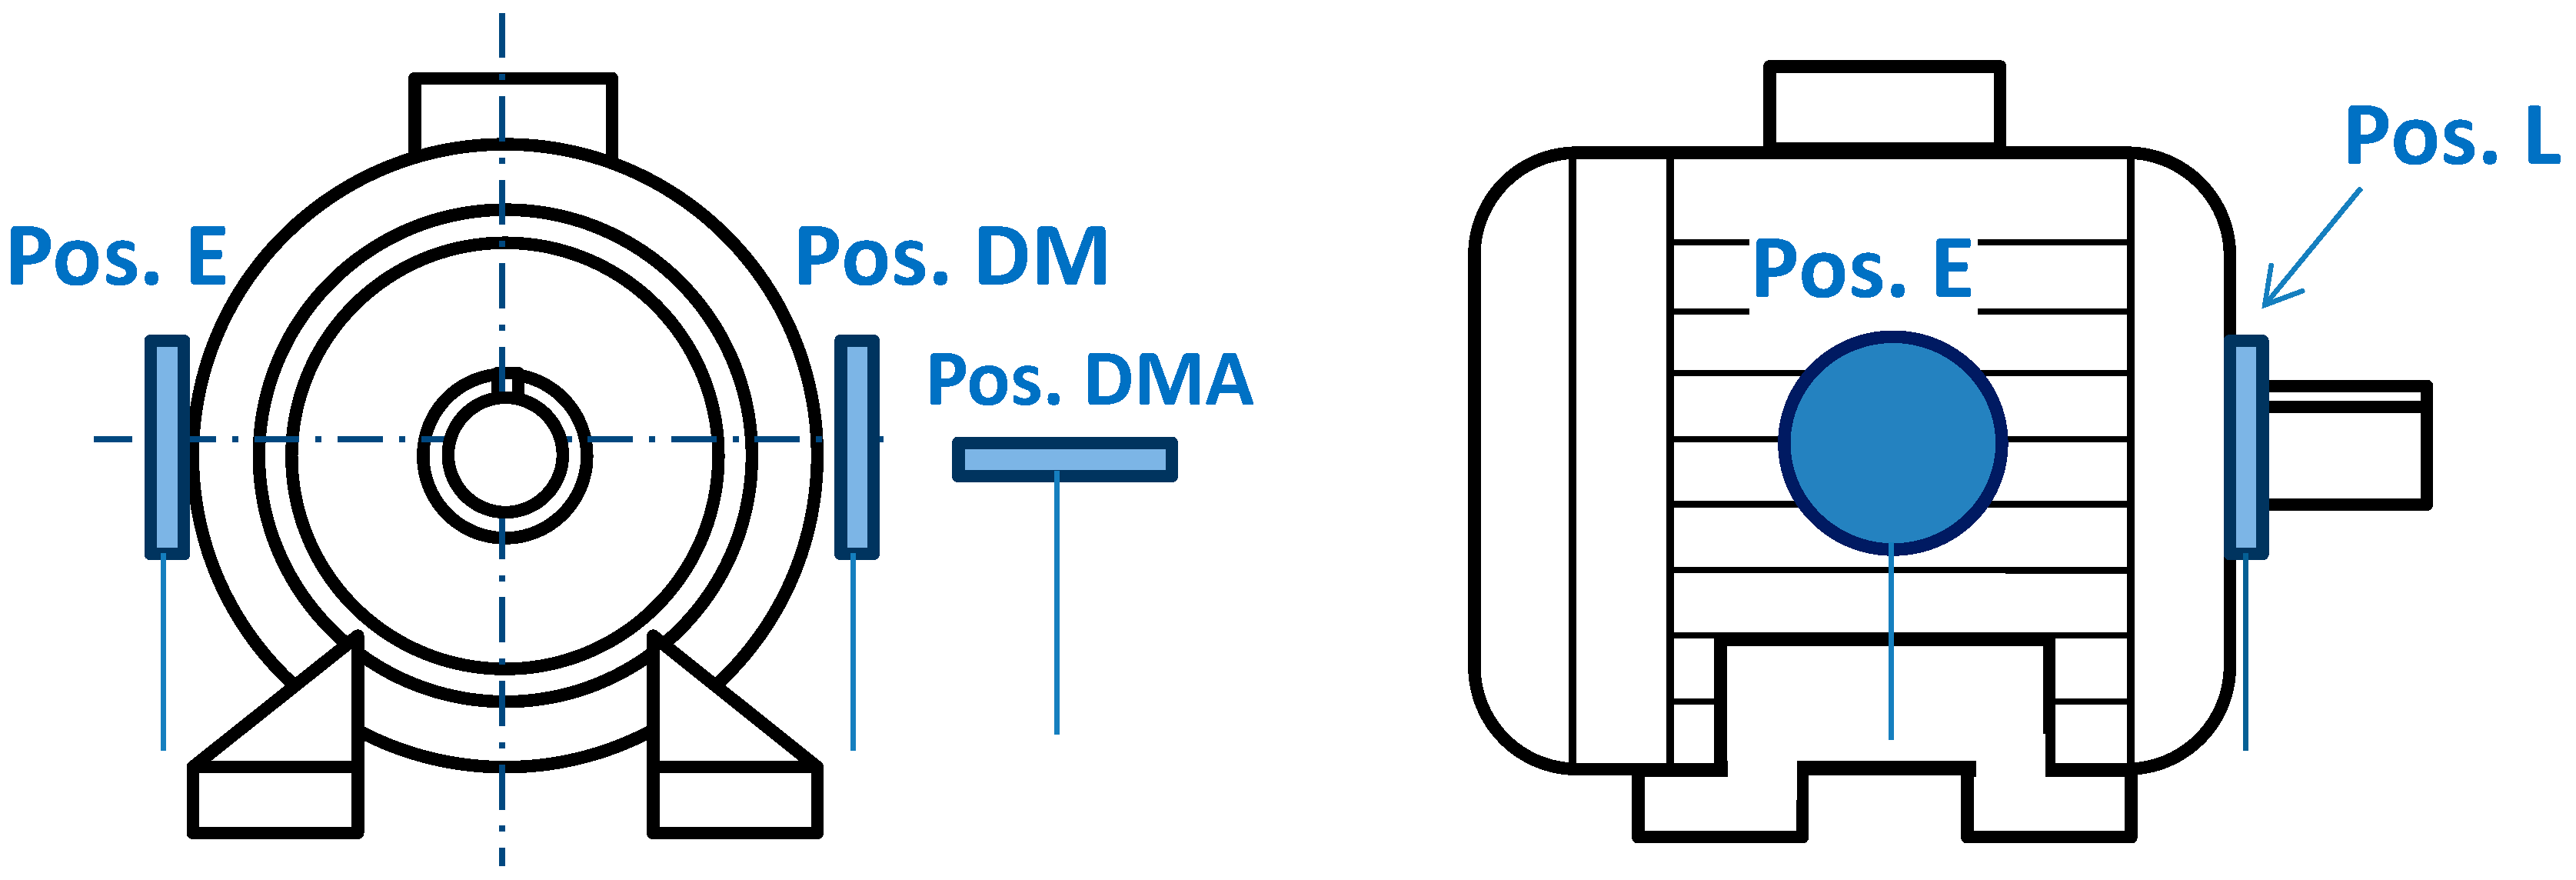
This statement has been checked using sample 0 (position DMA of Table 1) corresponding to the samples of flux signals of the healthy motor and comparing the results with sample 0 (position DMA of Table 2) corresponding to the samples of flux signals of the motor with one broken rotor bar. The obtained results are shown in Figure 2 and Table 5, respectively.
In Table 5, the difference that exists between both values of the indicator is 2.7857·10−5, which is not significant to reliably discriminate between healthy and faulty conditions. Likewise, in 
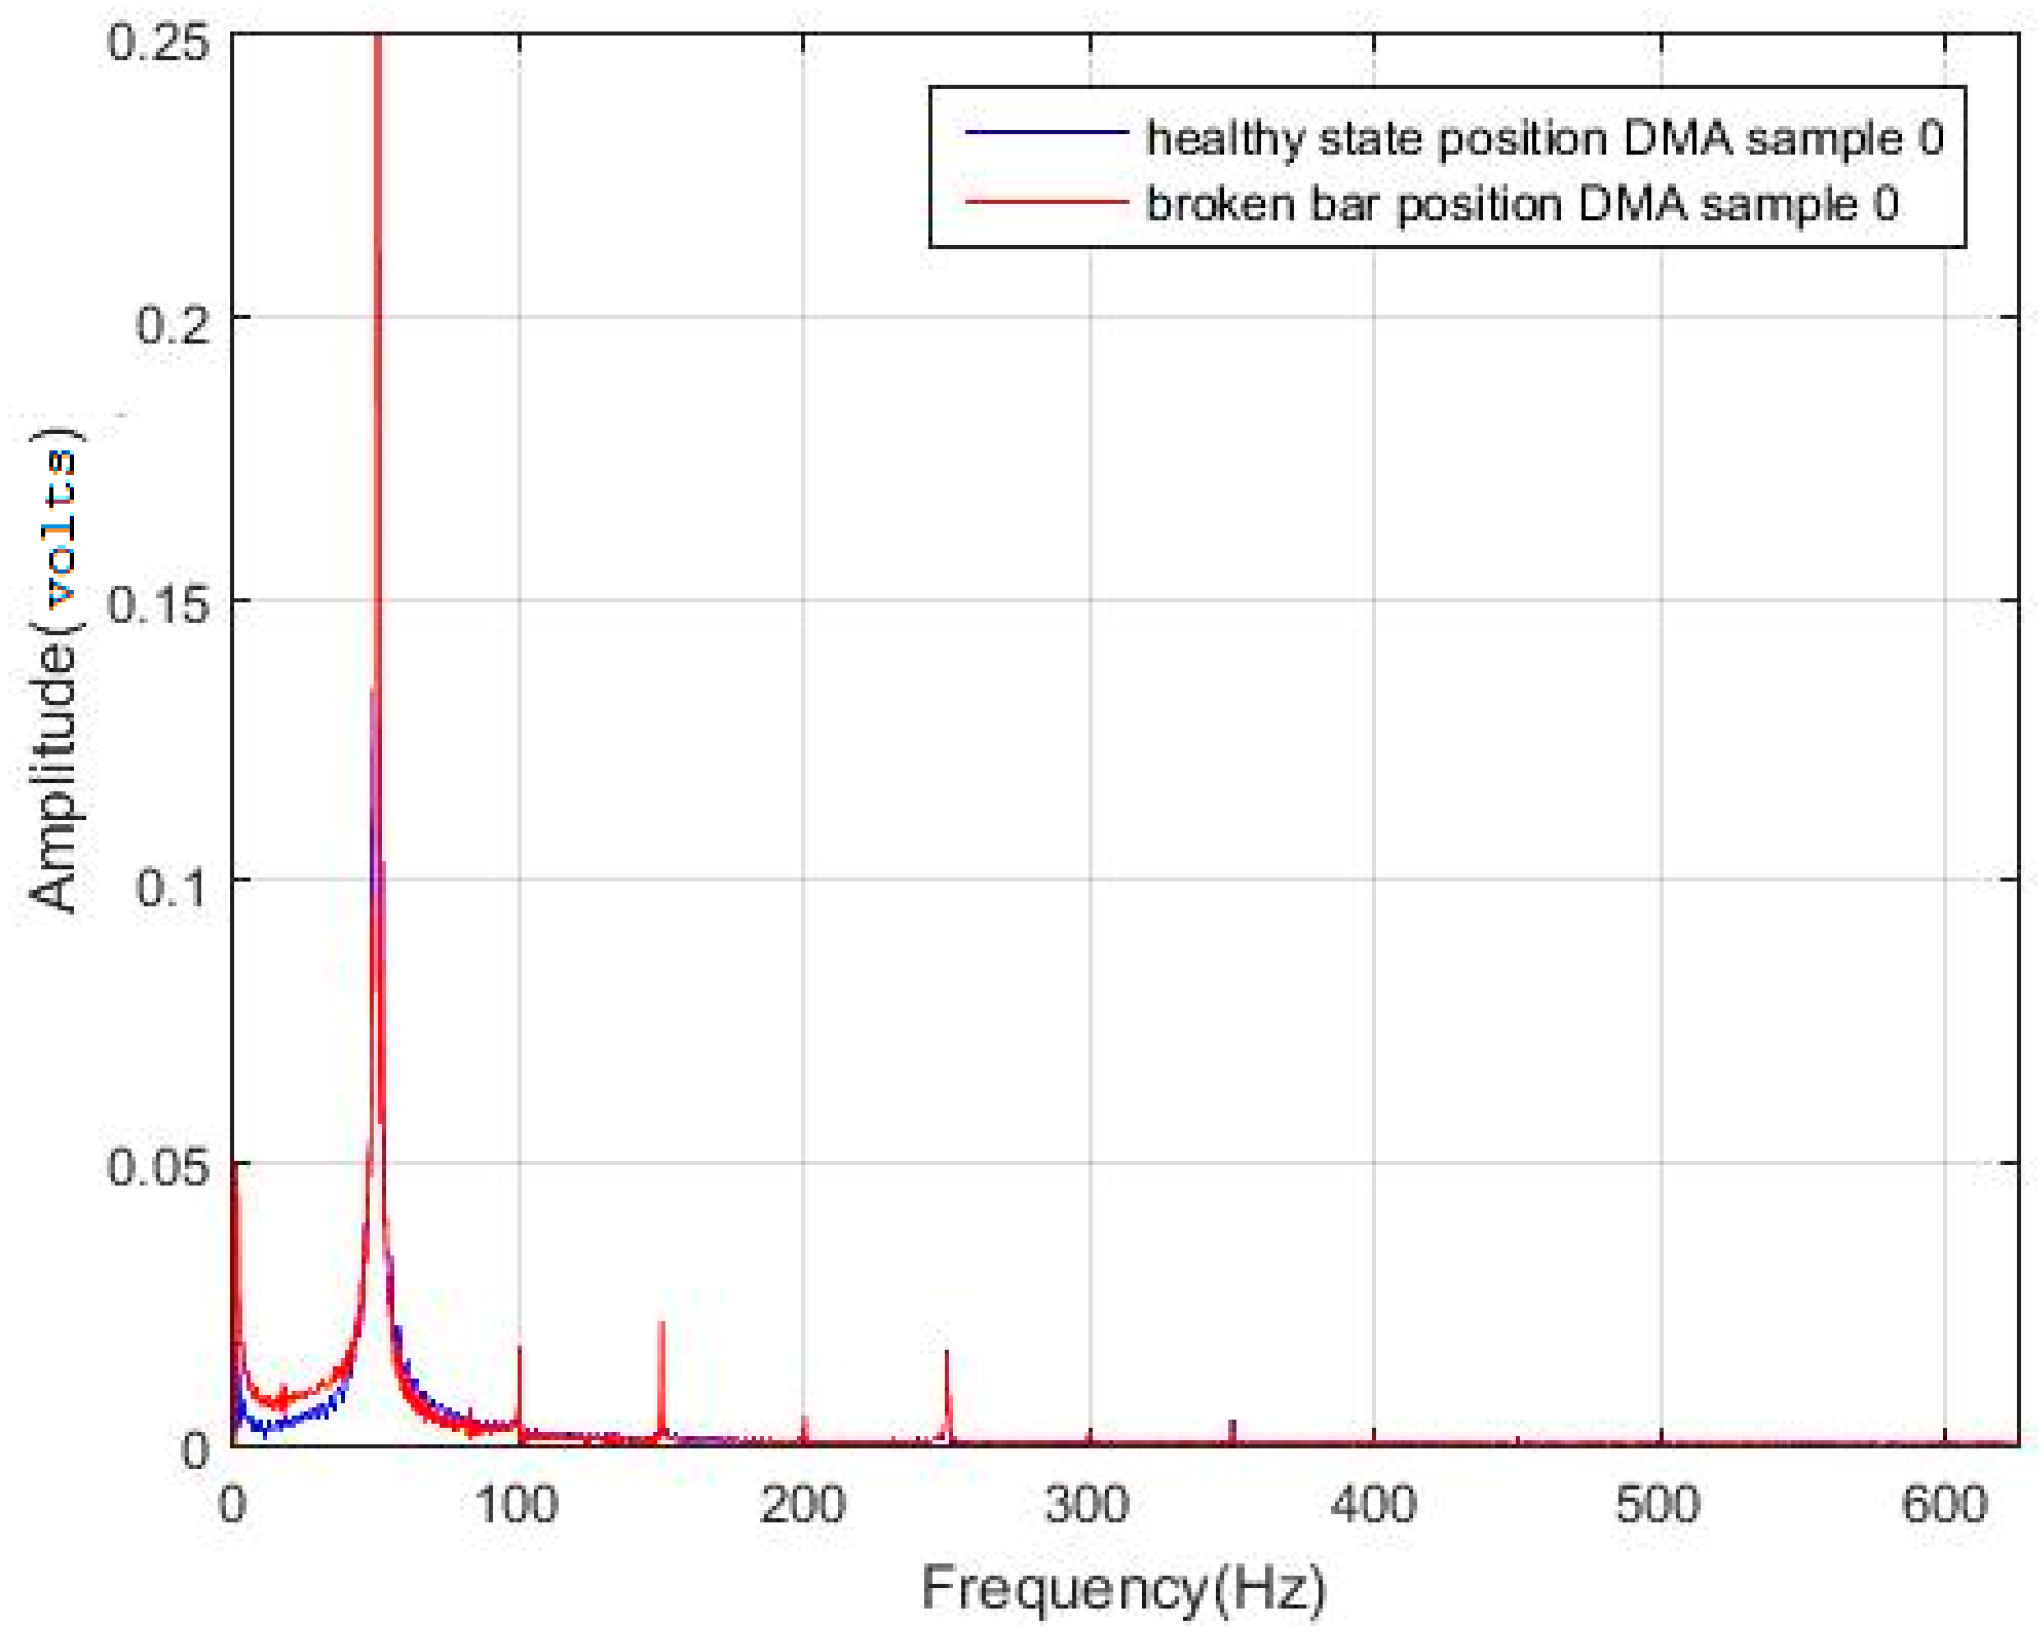
Figure 2, no relevant differences are clearly observed in the spectra of both samplesfor the same position (DMA).
Taking into consideration the previous results, we decided to use the bispectrum of the flux signals. The algorithm based on Equations (4) and (5) was applied to obtain an indication variable that was able to detect differences between the healthy and damaged conditions. 
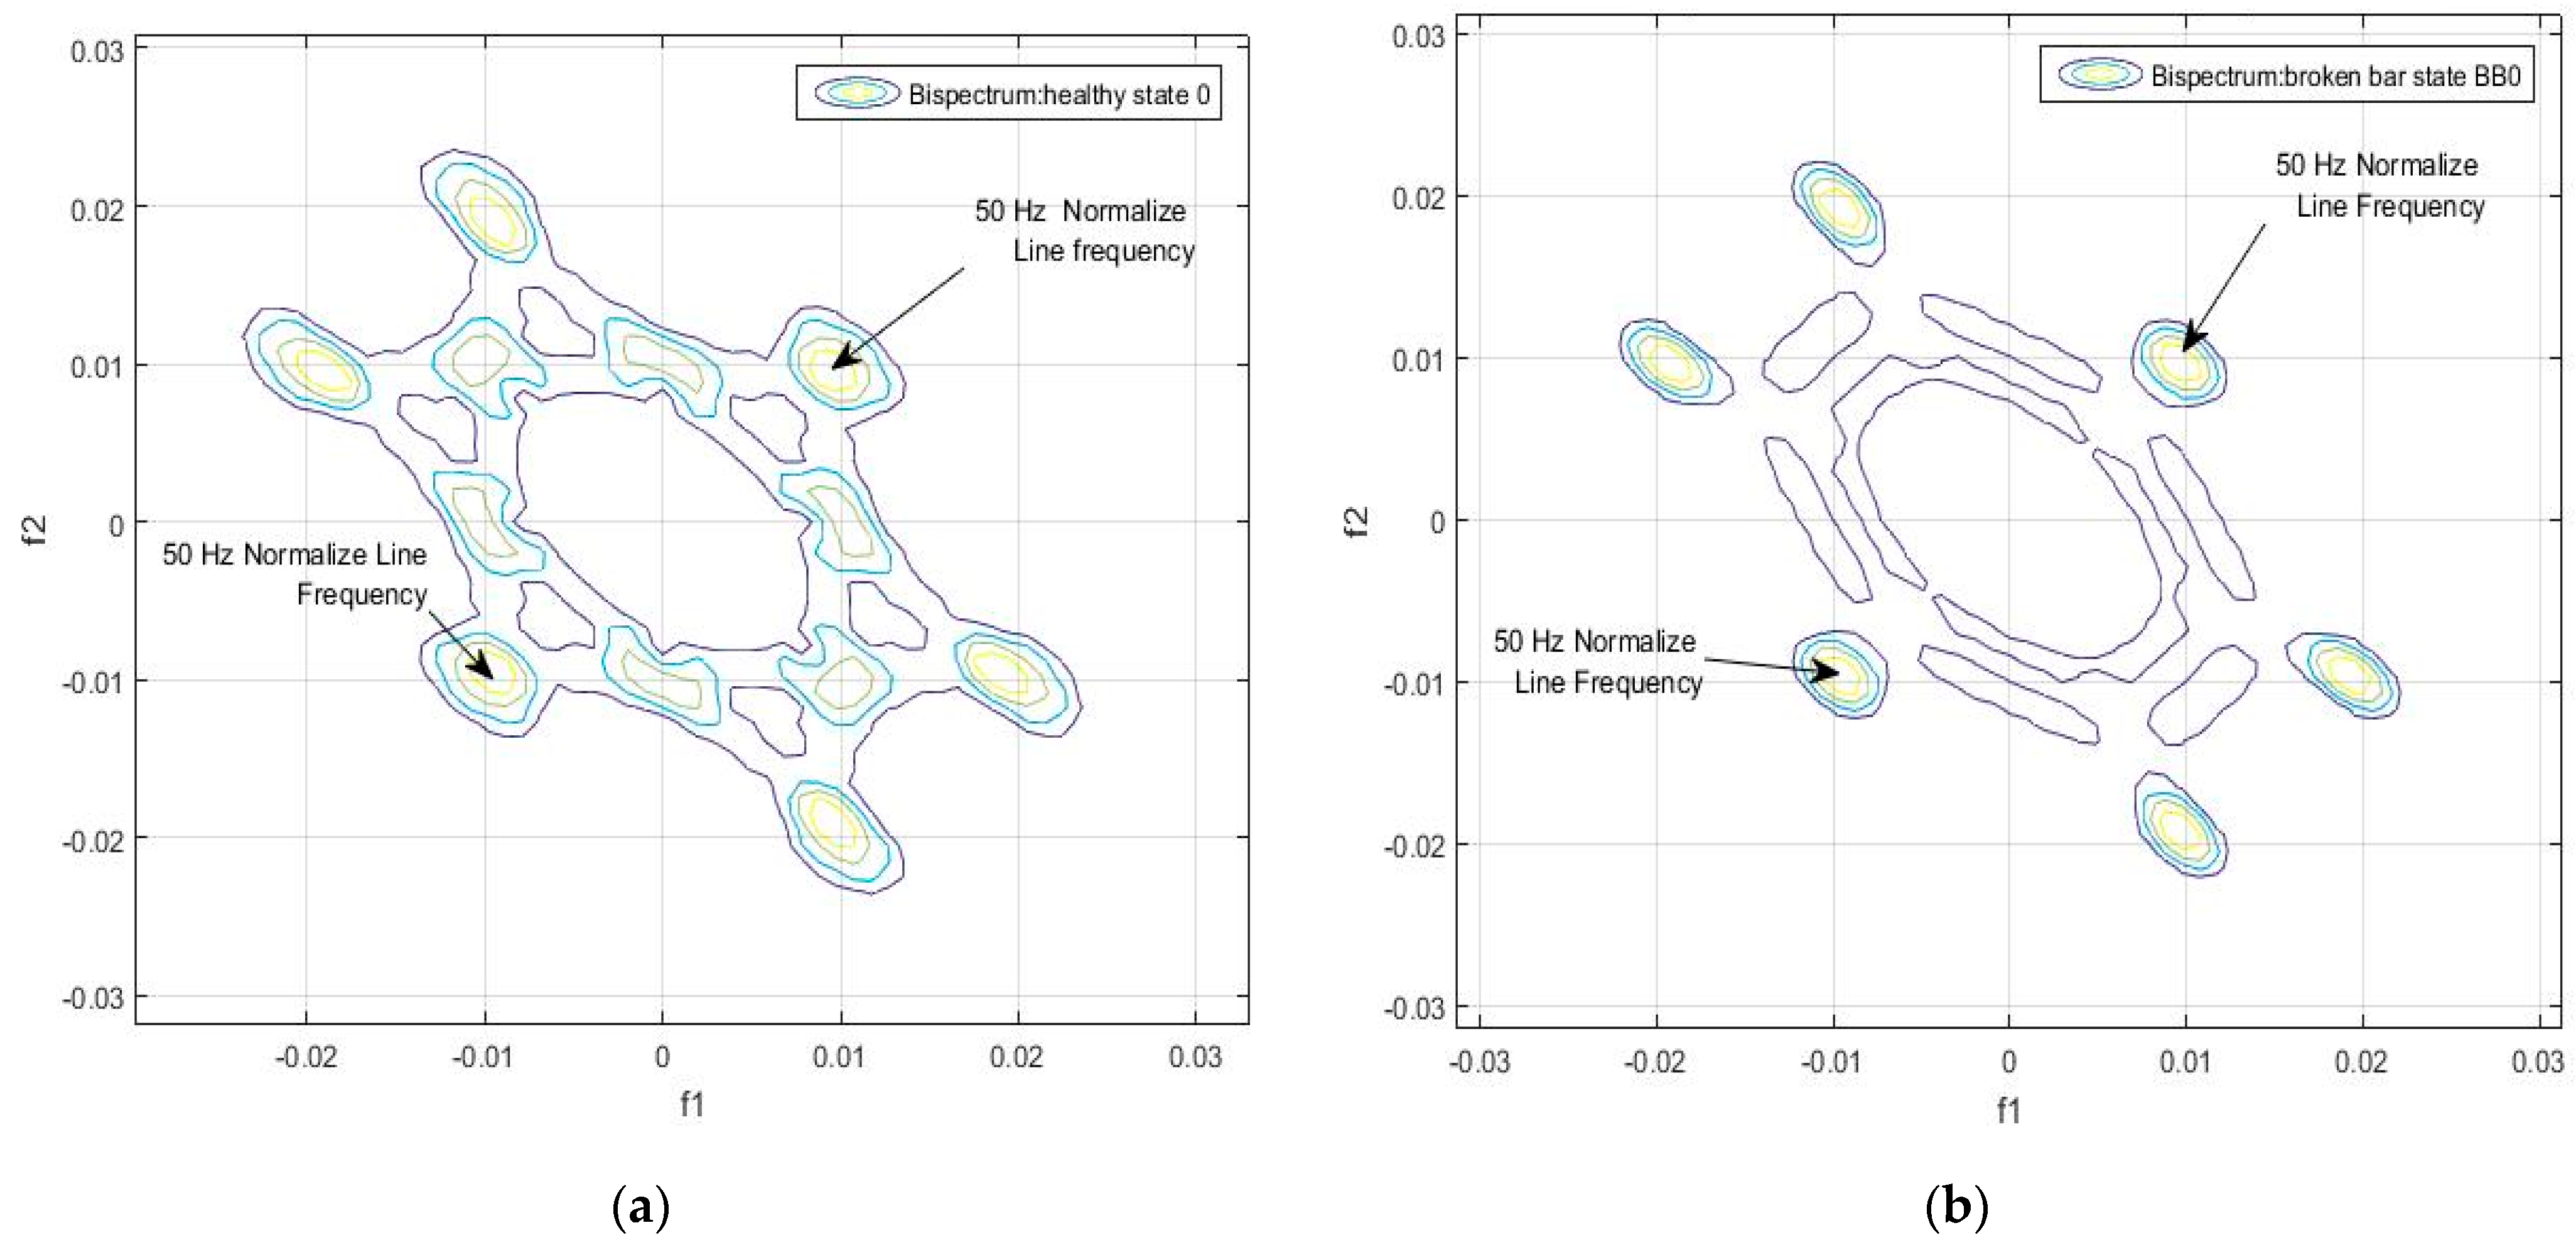
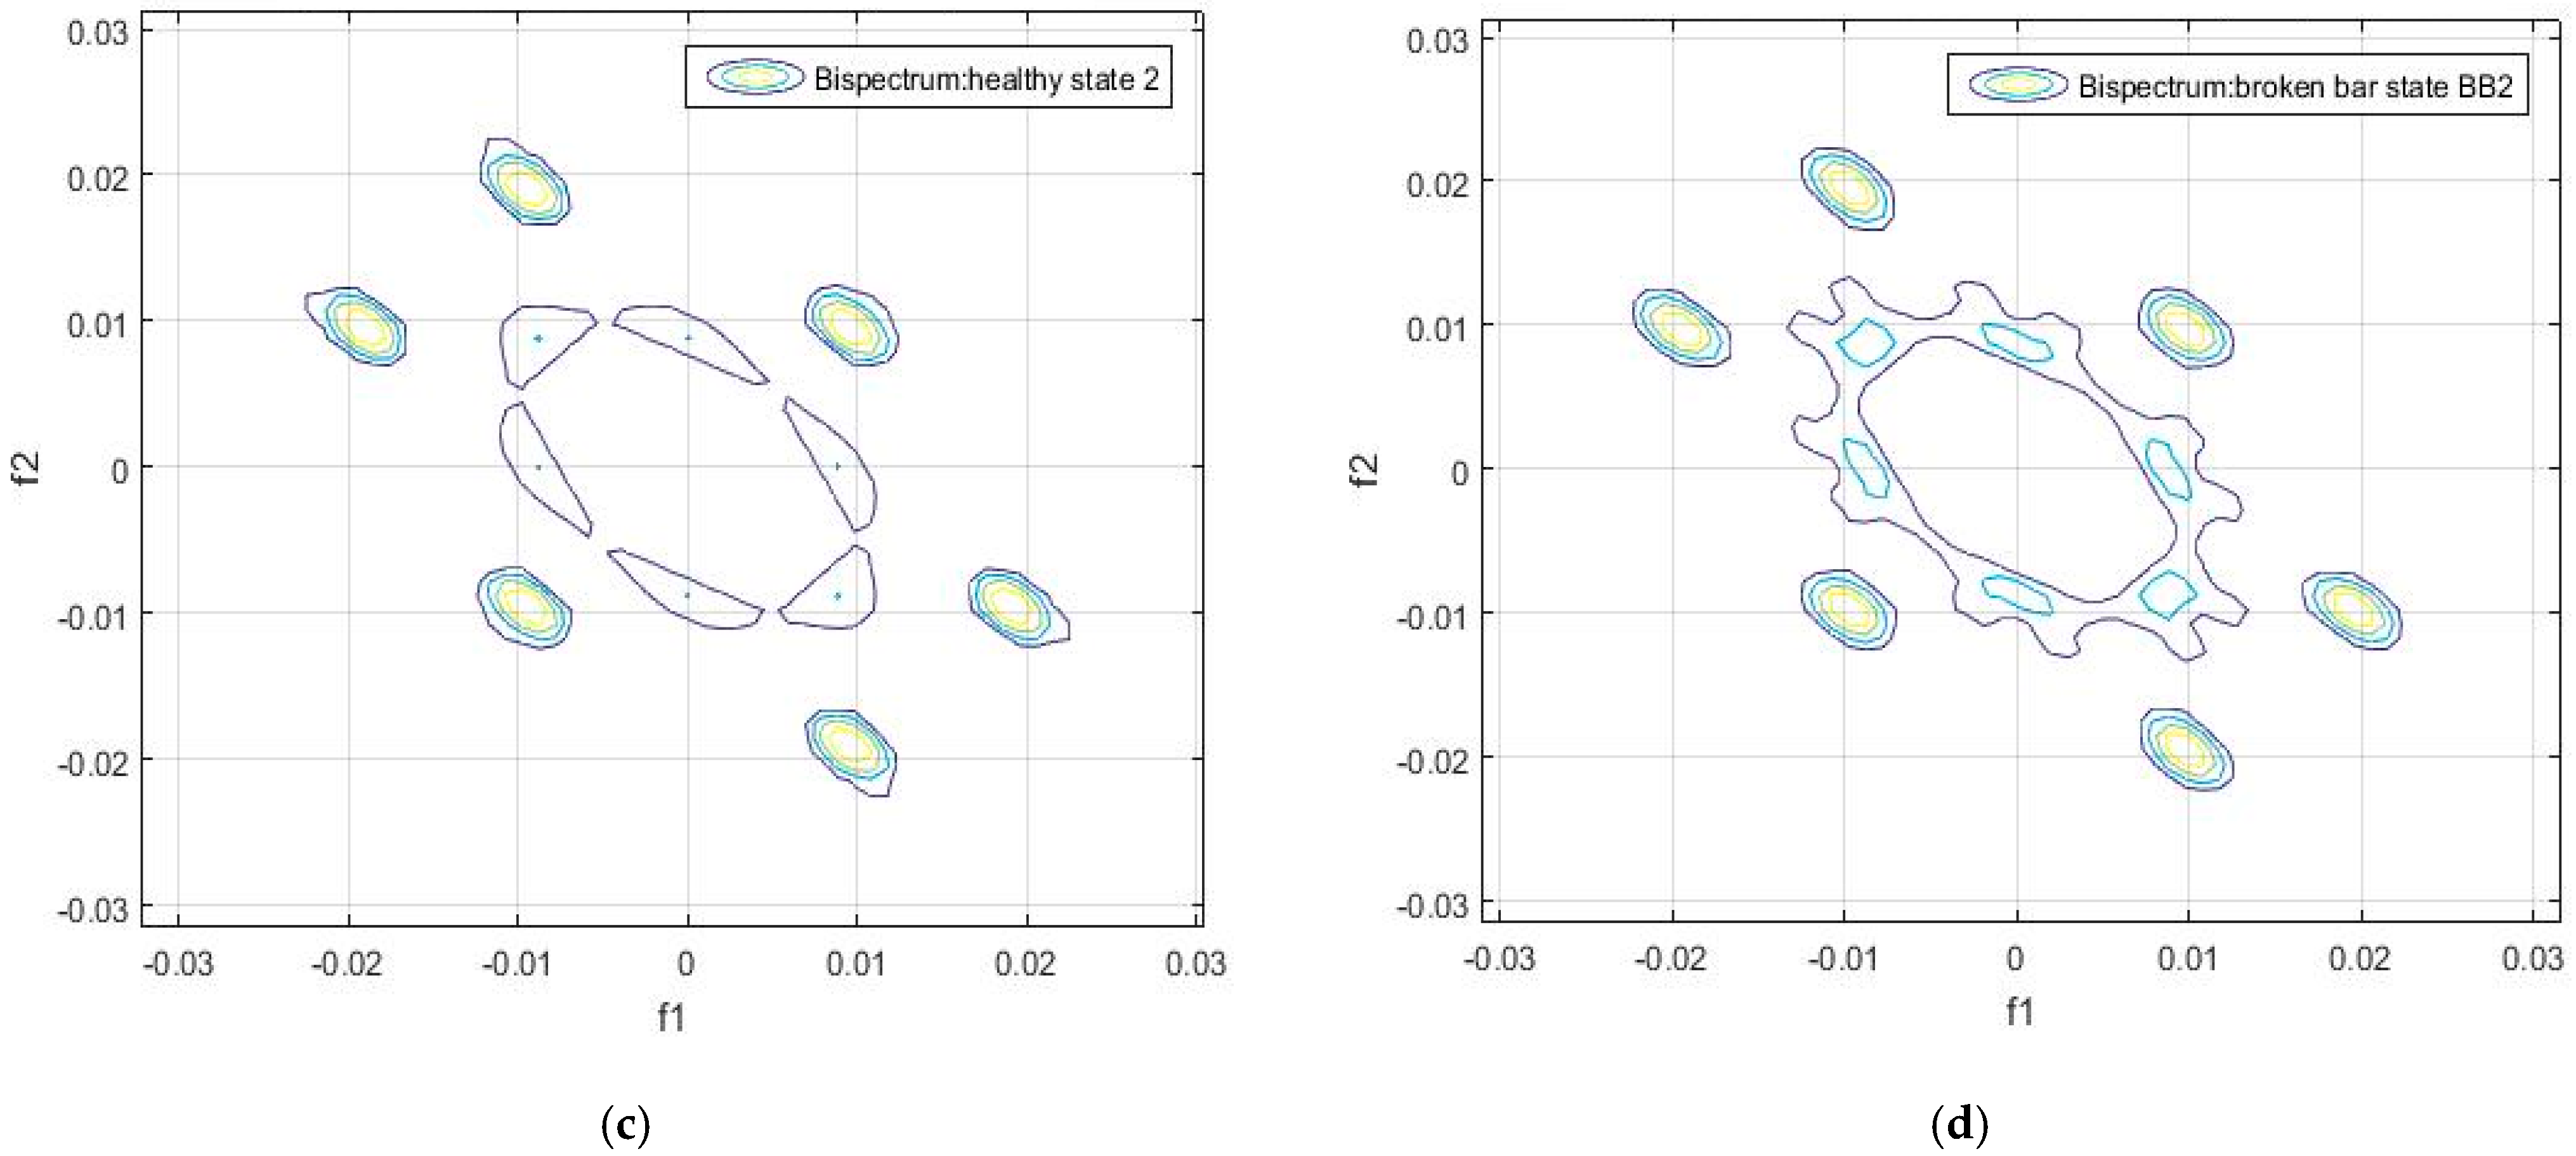
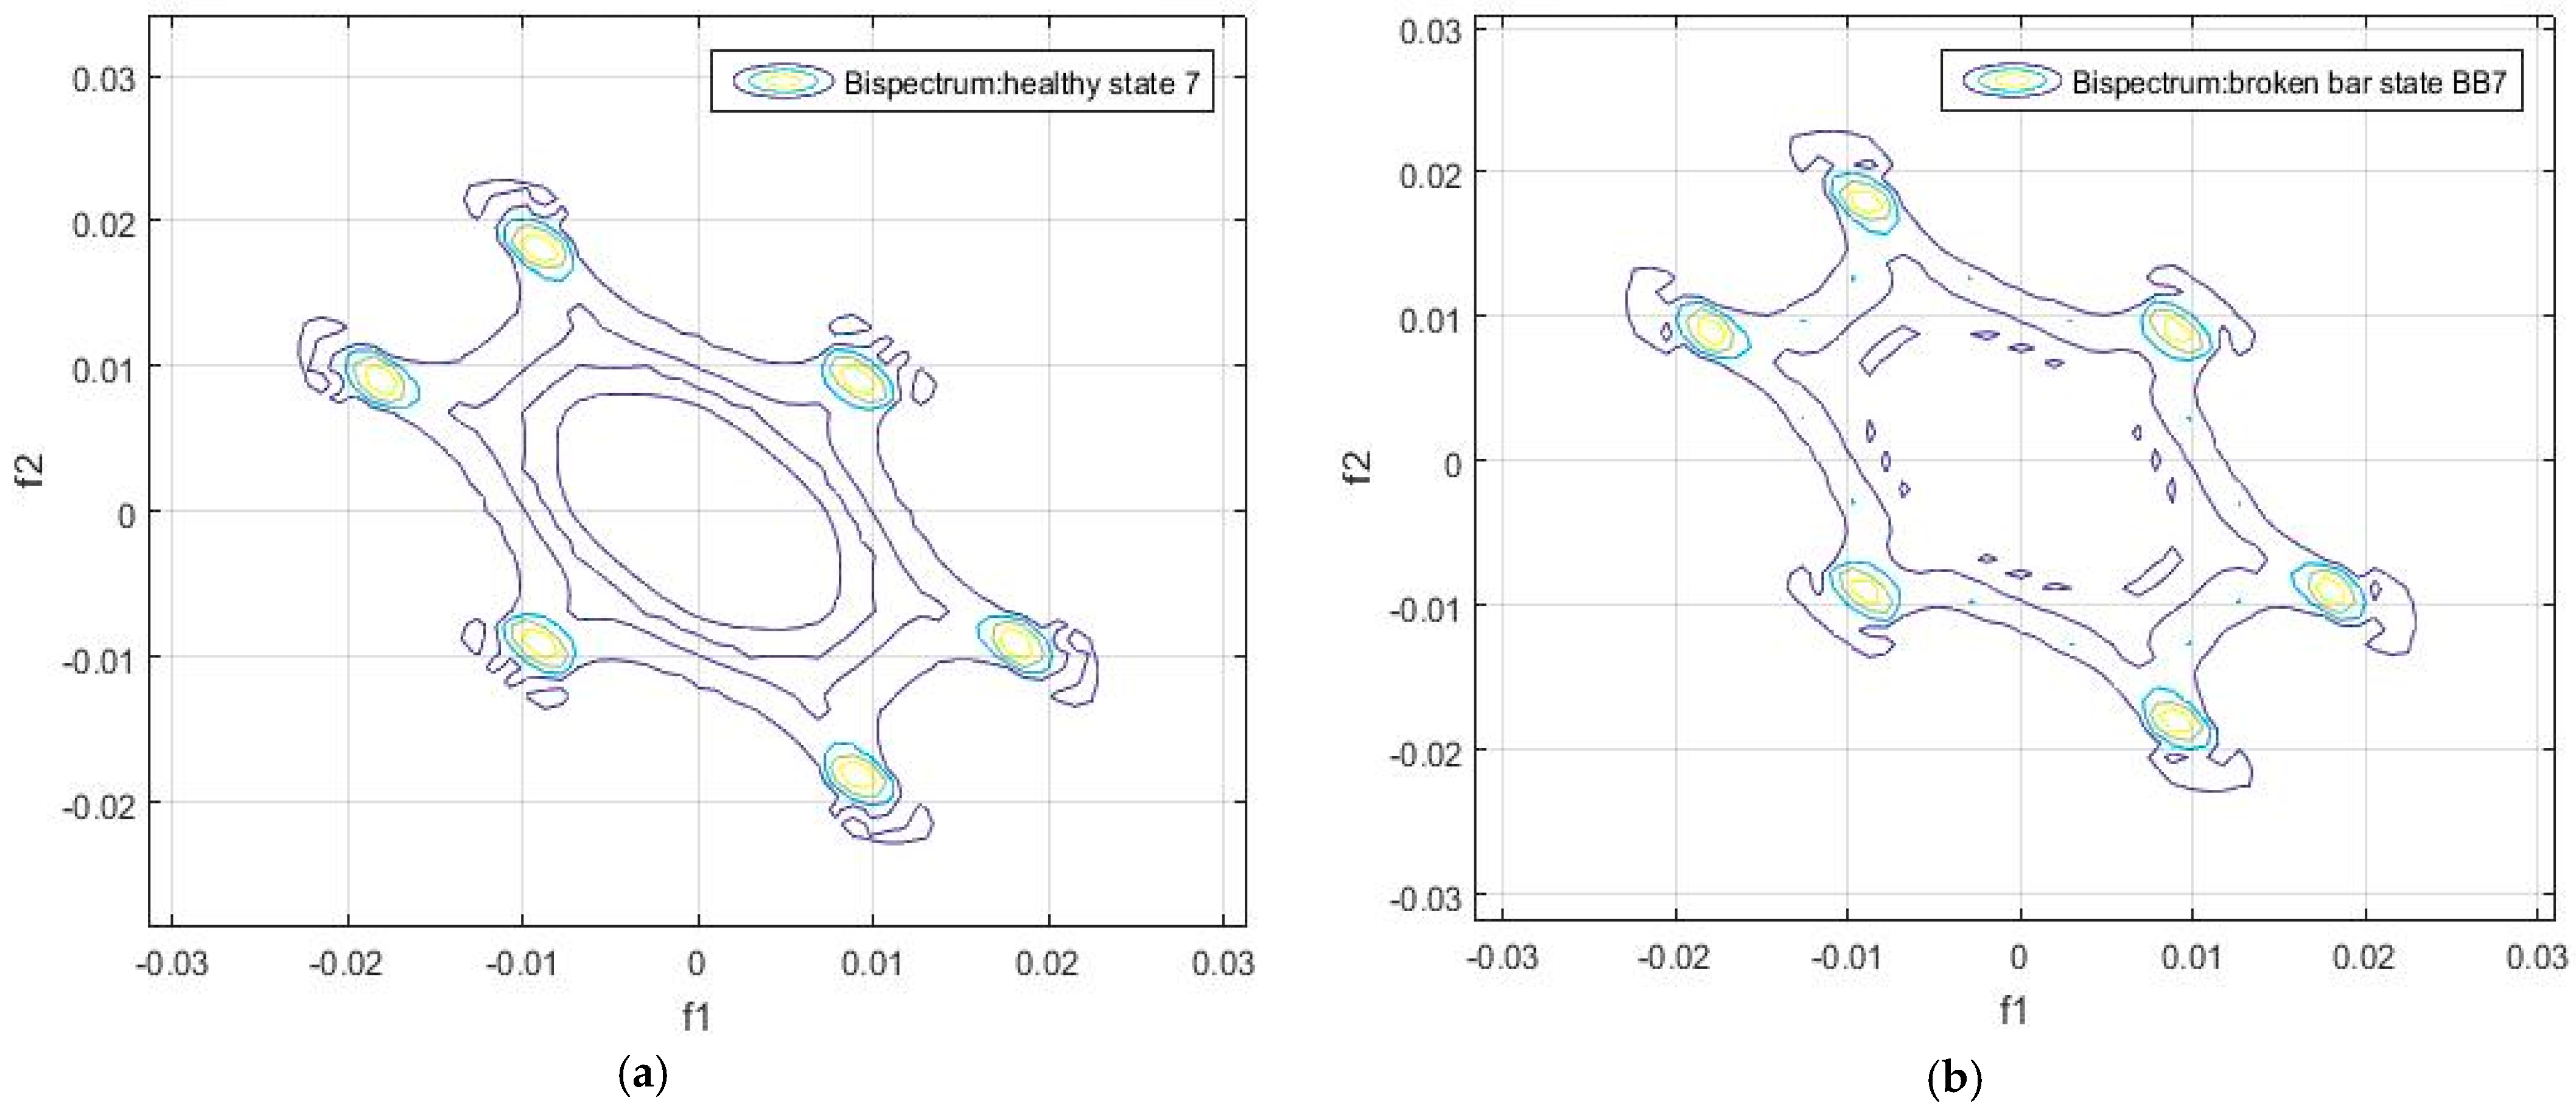
Figure 3 shows the bispectrum of the flux signal in the healthy state (sample 0, position DMA) and faulty state (sample 0, position DMA).
As can be seen in Figure 3, the bispectrum has two circles corresponding to fundamental frequency values of the form ( f 1 ,   f 2 ) , in this case (0.01,0.01), which corresponds to the frequency of 50 Hz (normalized to 1), depicted in Figure 2, corresponding to the frequency spectrum using the one-dimensional Fourier transform.
Similarly, around these two points there are other four circles which correspond to the frequency values, multiples of the fundamental frequency of 50 Hz. As shown in Figure 3, there are differences between the bispectrum of the flux signal of the healthy motor and of the damaged motor.
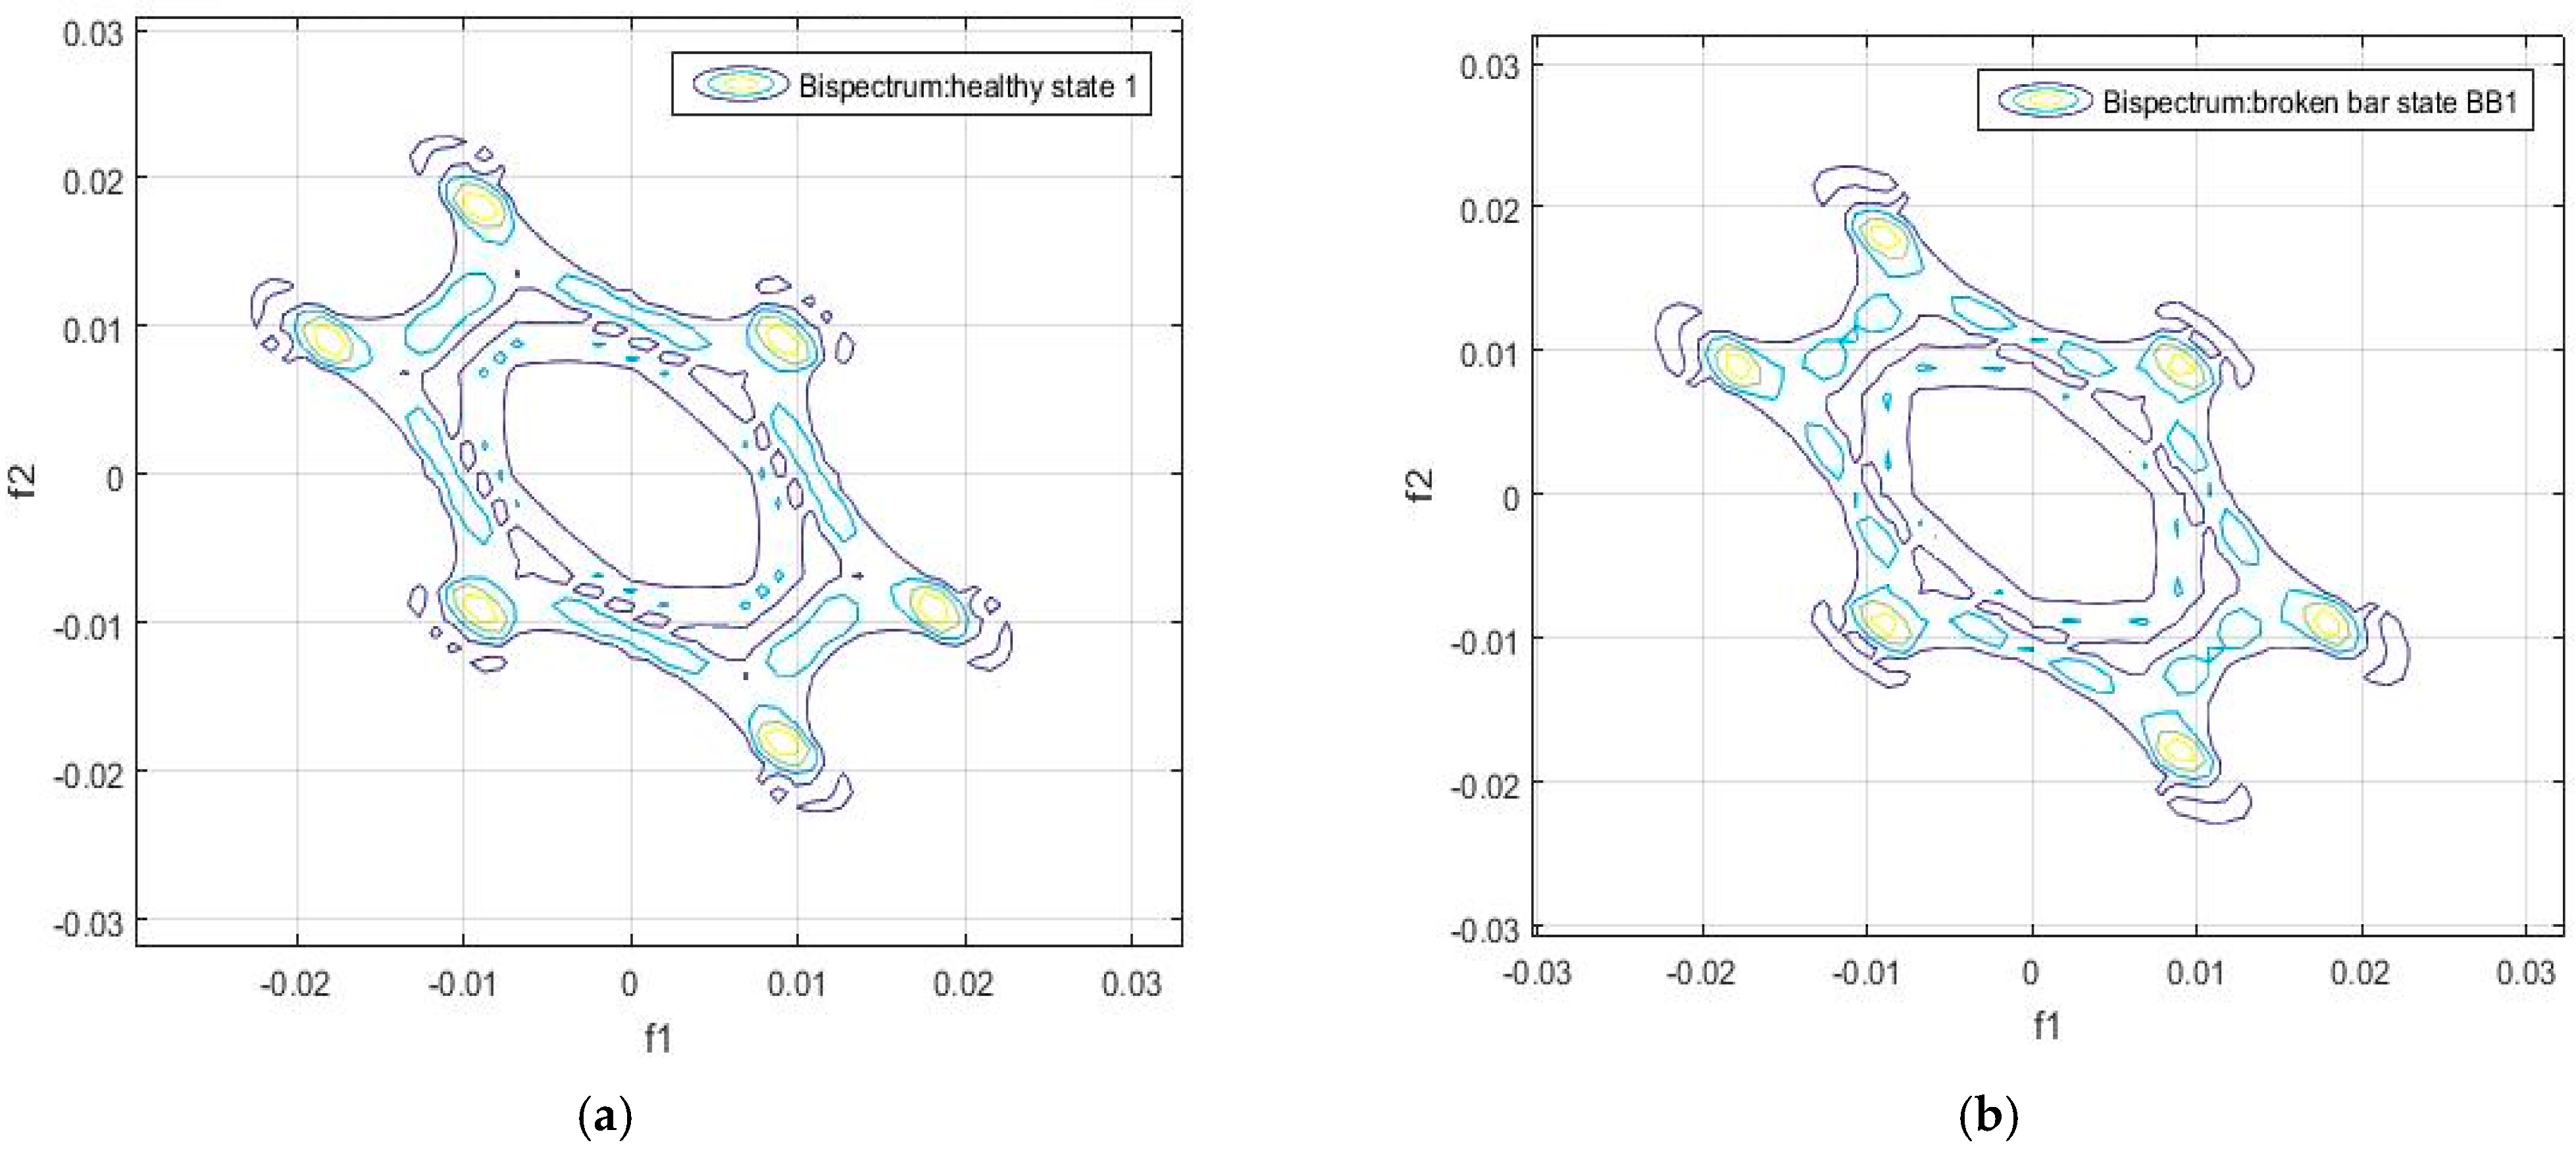
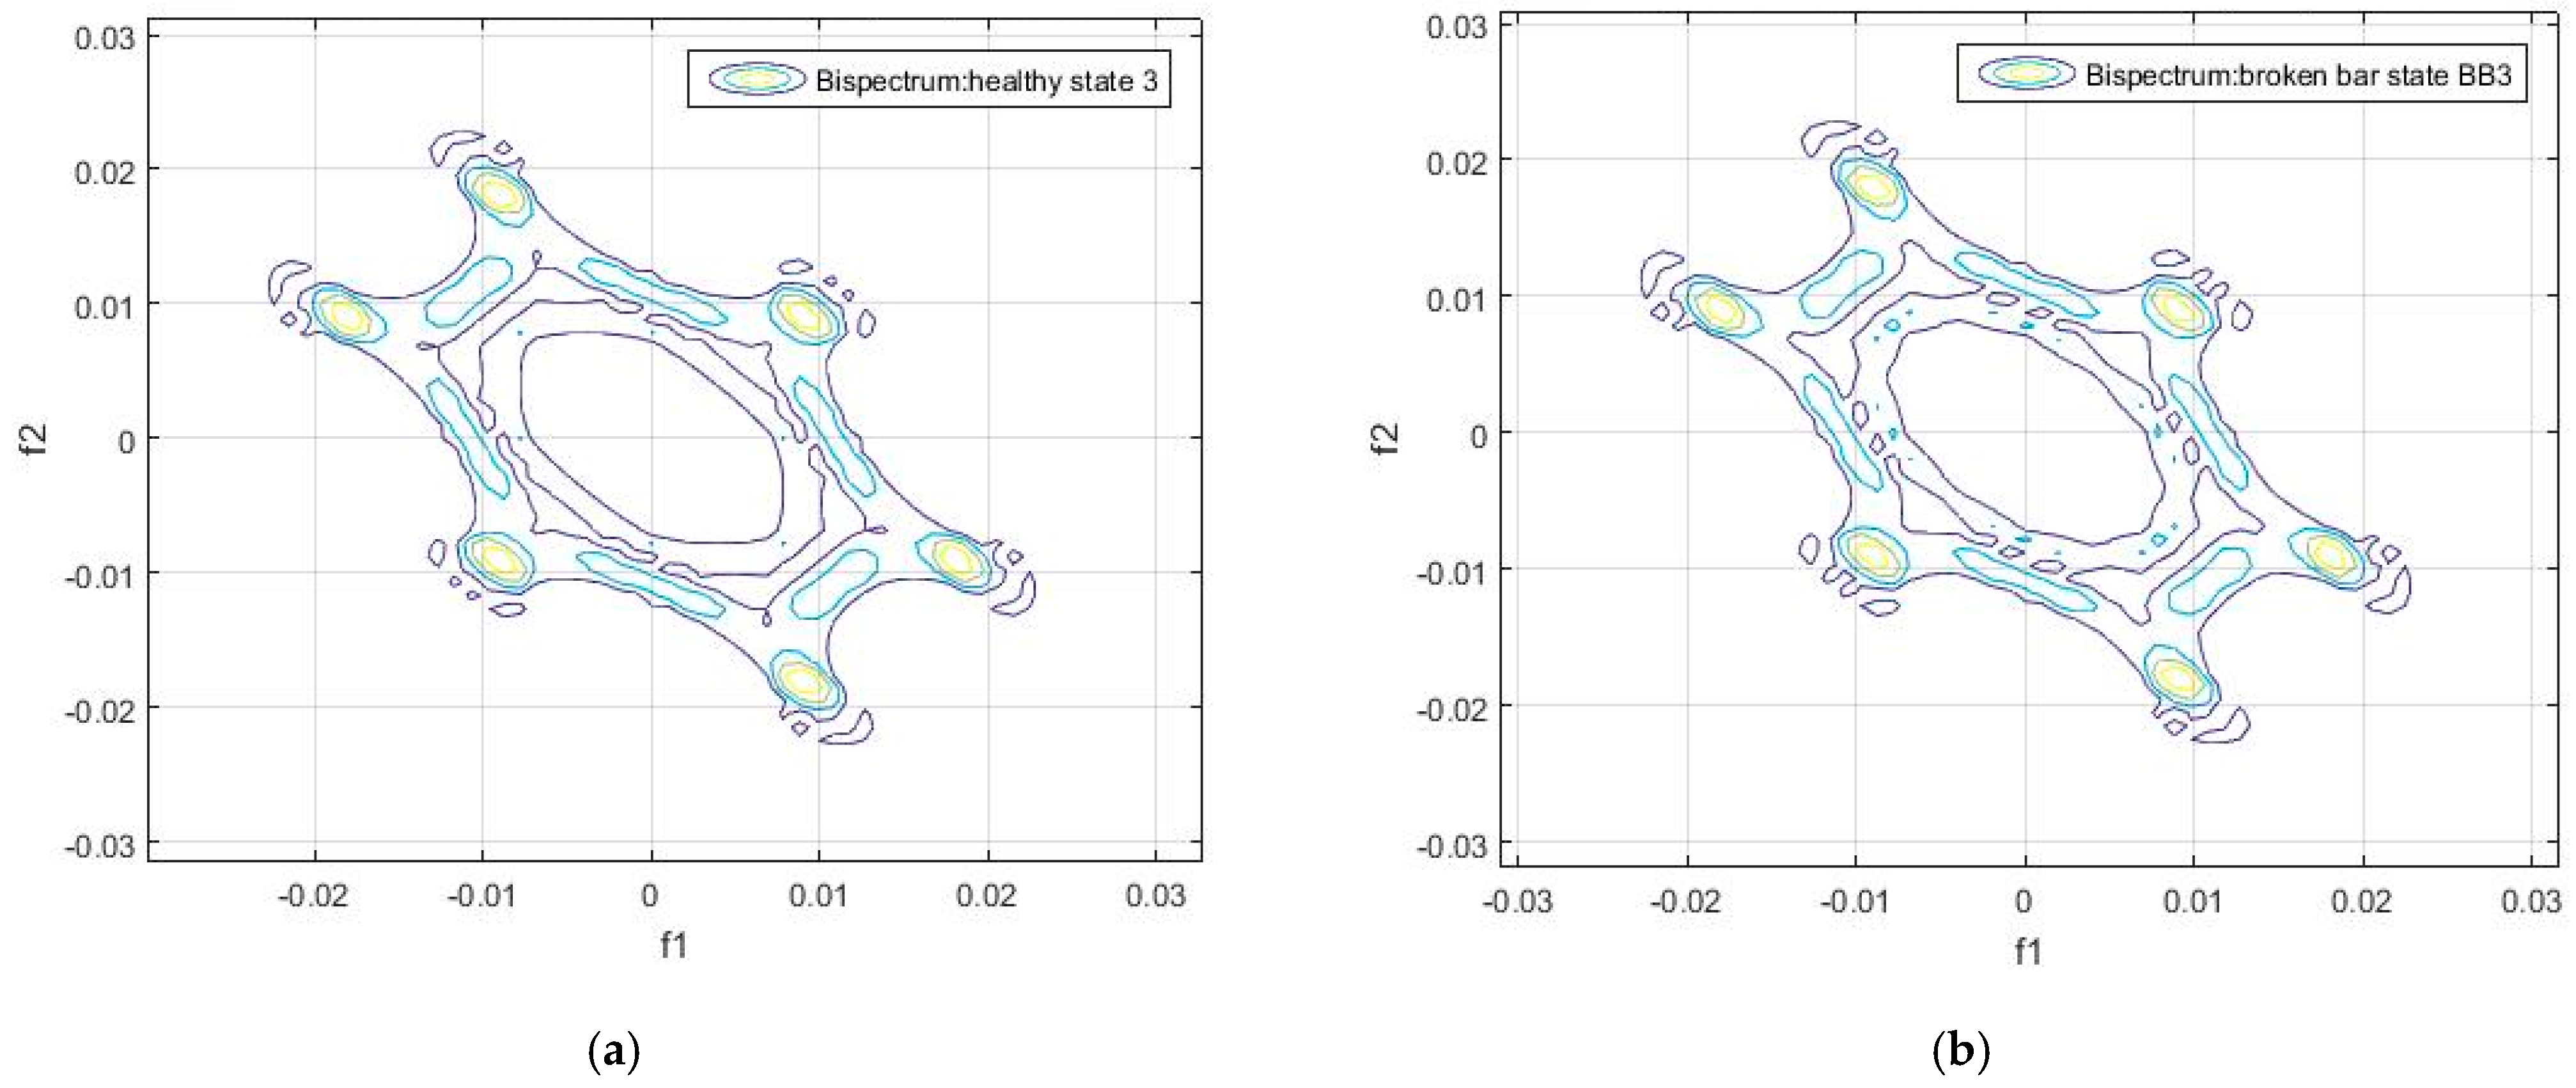
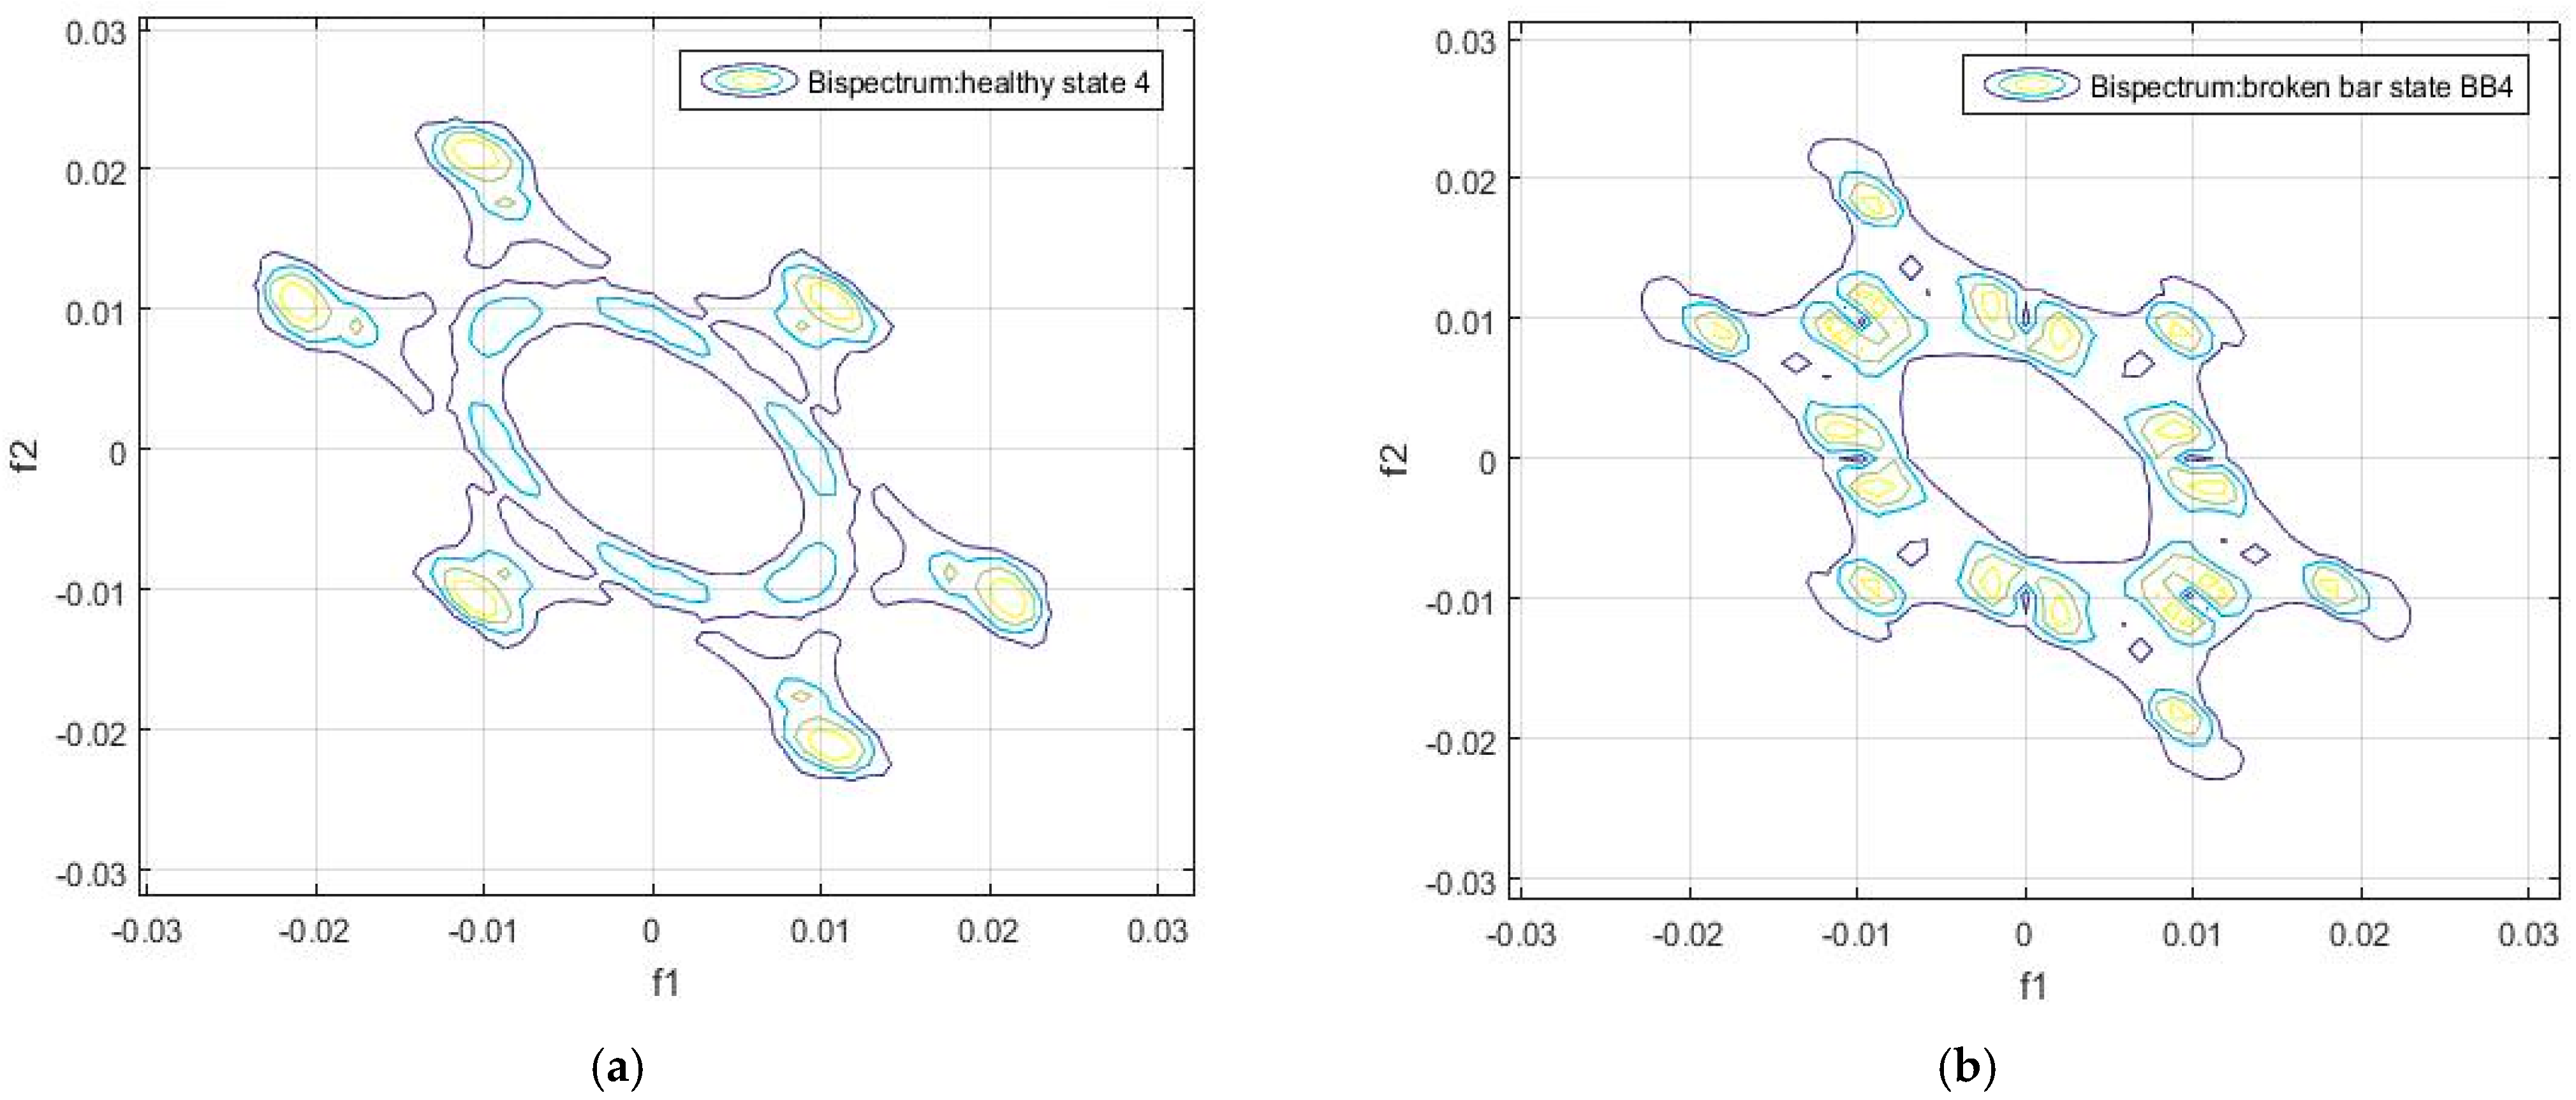
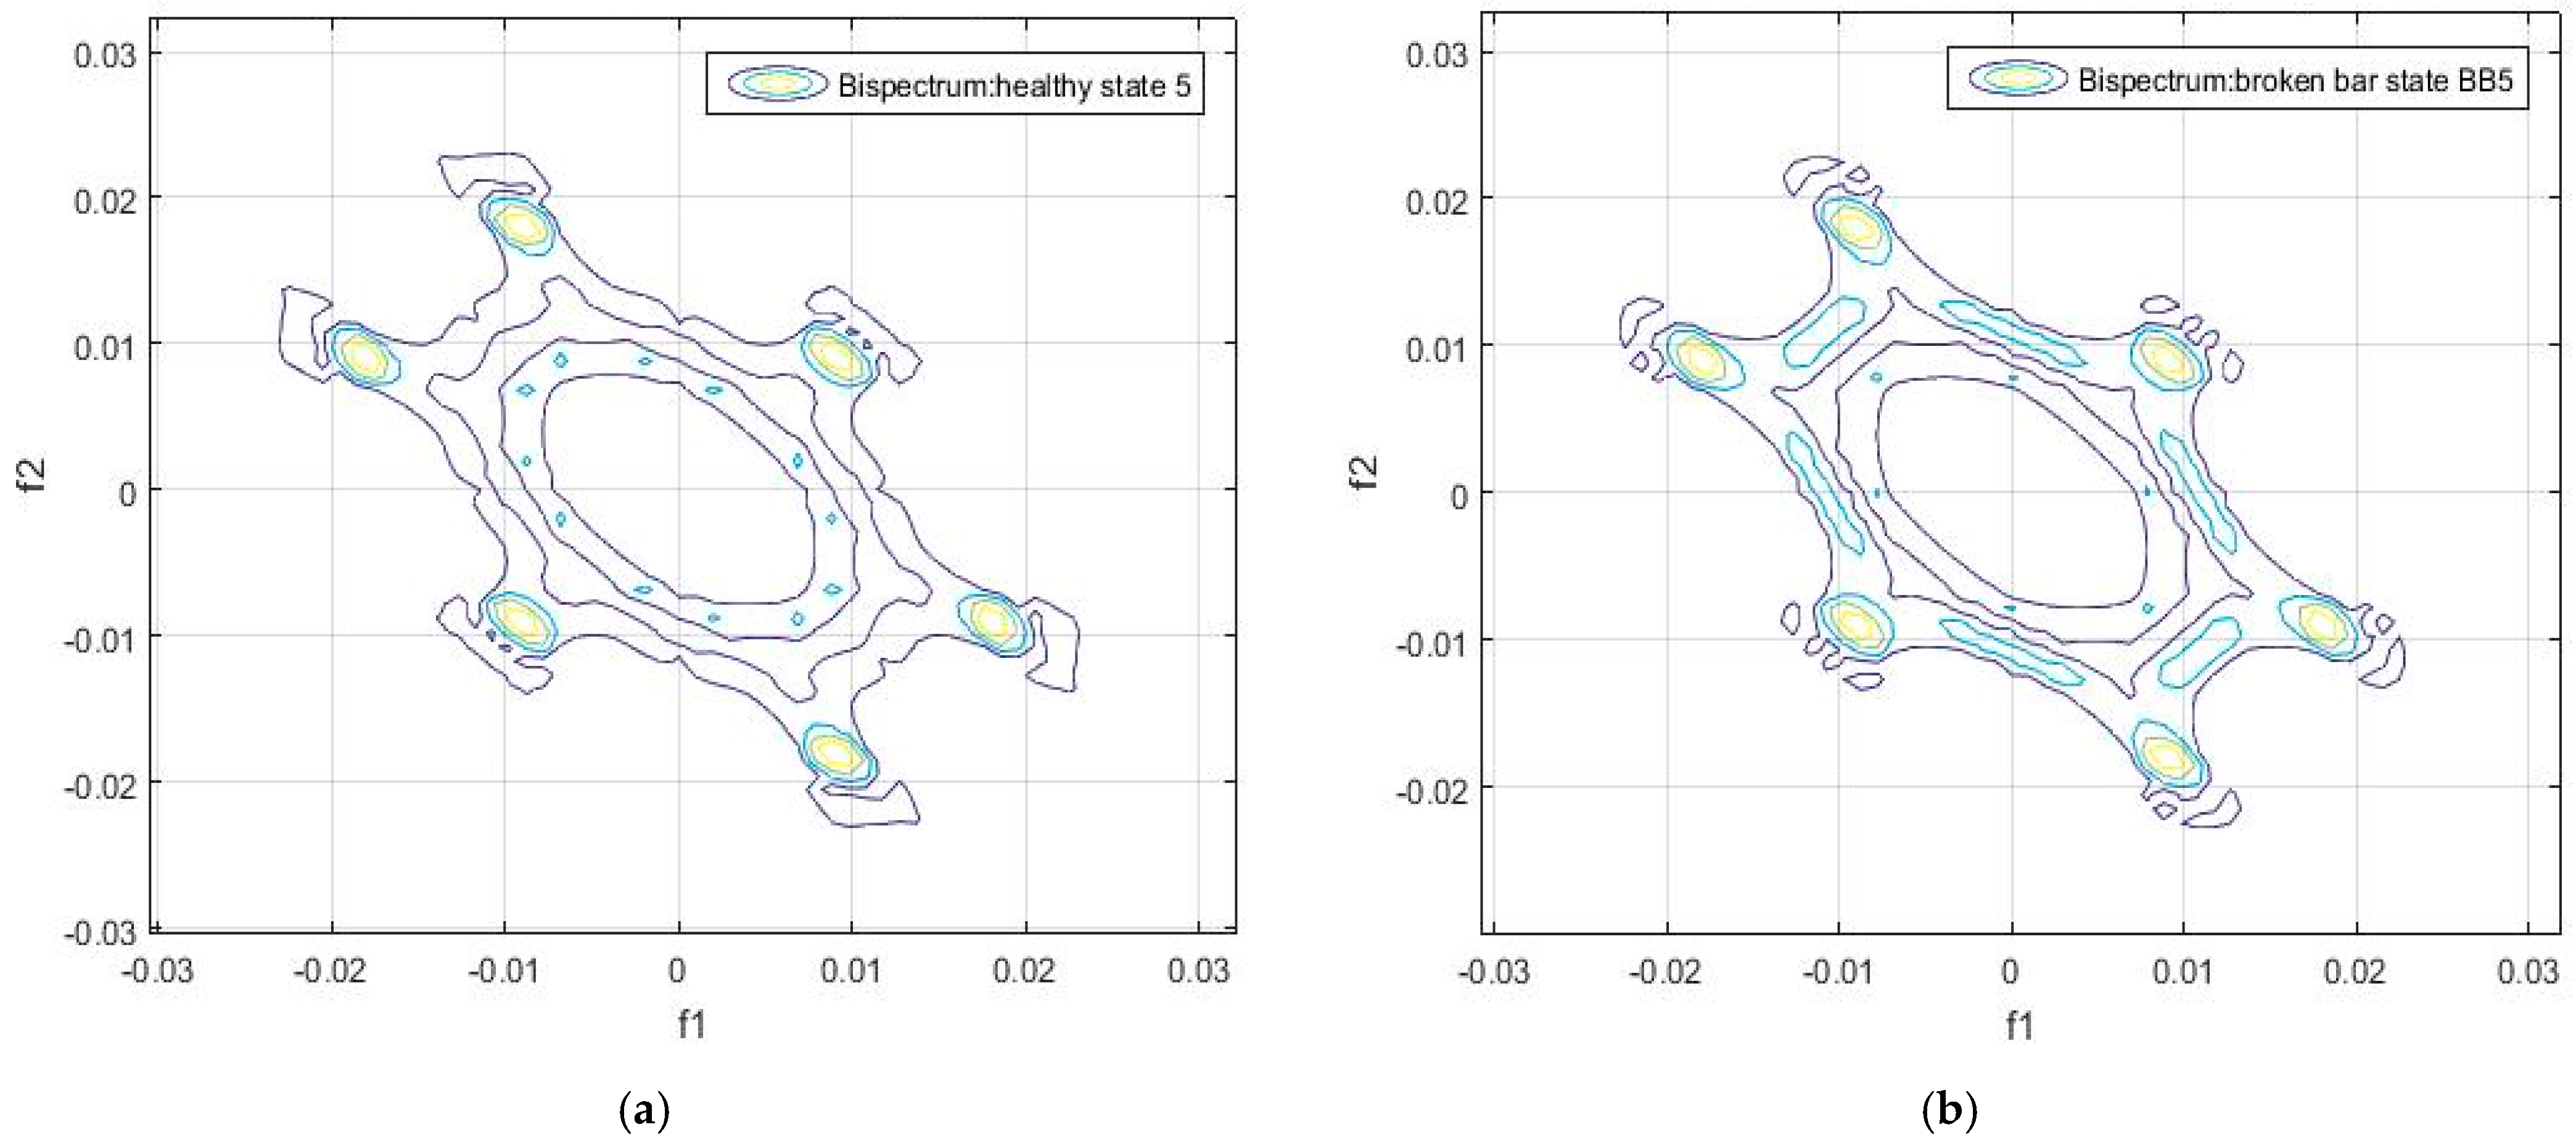
These six circles visualized in the contour of the bispectrum appear in all the analyzed samples, both in the healthy and in the faulty state conditions. This can be observed in Figure 4, Figure 5, Figure 6, Figure 7, Figure 8 and Figure 9.
In Figure 3, Figure 4, Figure 5 and Figure 6 we show the differences in the bispectrum between the healthy and the damaged motors, for the different positions at which the measurements of the flux signals were taken. Note that in some graphs there are more substantial differences, such as in Figure 3 as well as in Figure 4c,d. The differences depend on the position in which the measurement was taken, as well as on the load, and on the supply, and will also depend on obtaining a more or less significant difference in relation to the value of the indicator in the frequency domain (Equation (5)).
The calculation of the indicator in the frequency domain based on Equations (4) and (5) was performed for the data in Table 1, Table 2, Table 3 and Table 4, which correspond to the motor under healthy and faulty conditions. The obtained results are shown in Table 5 and Table 6.
From the results shown in Table 6 and 
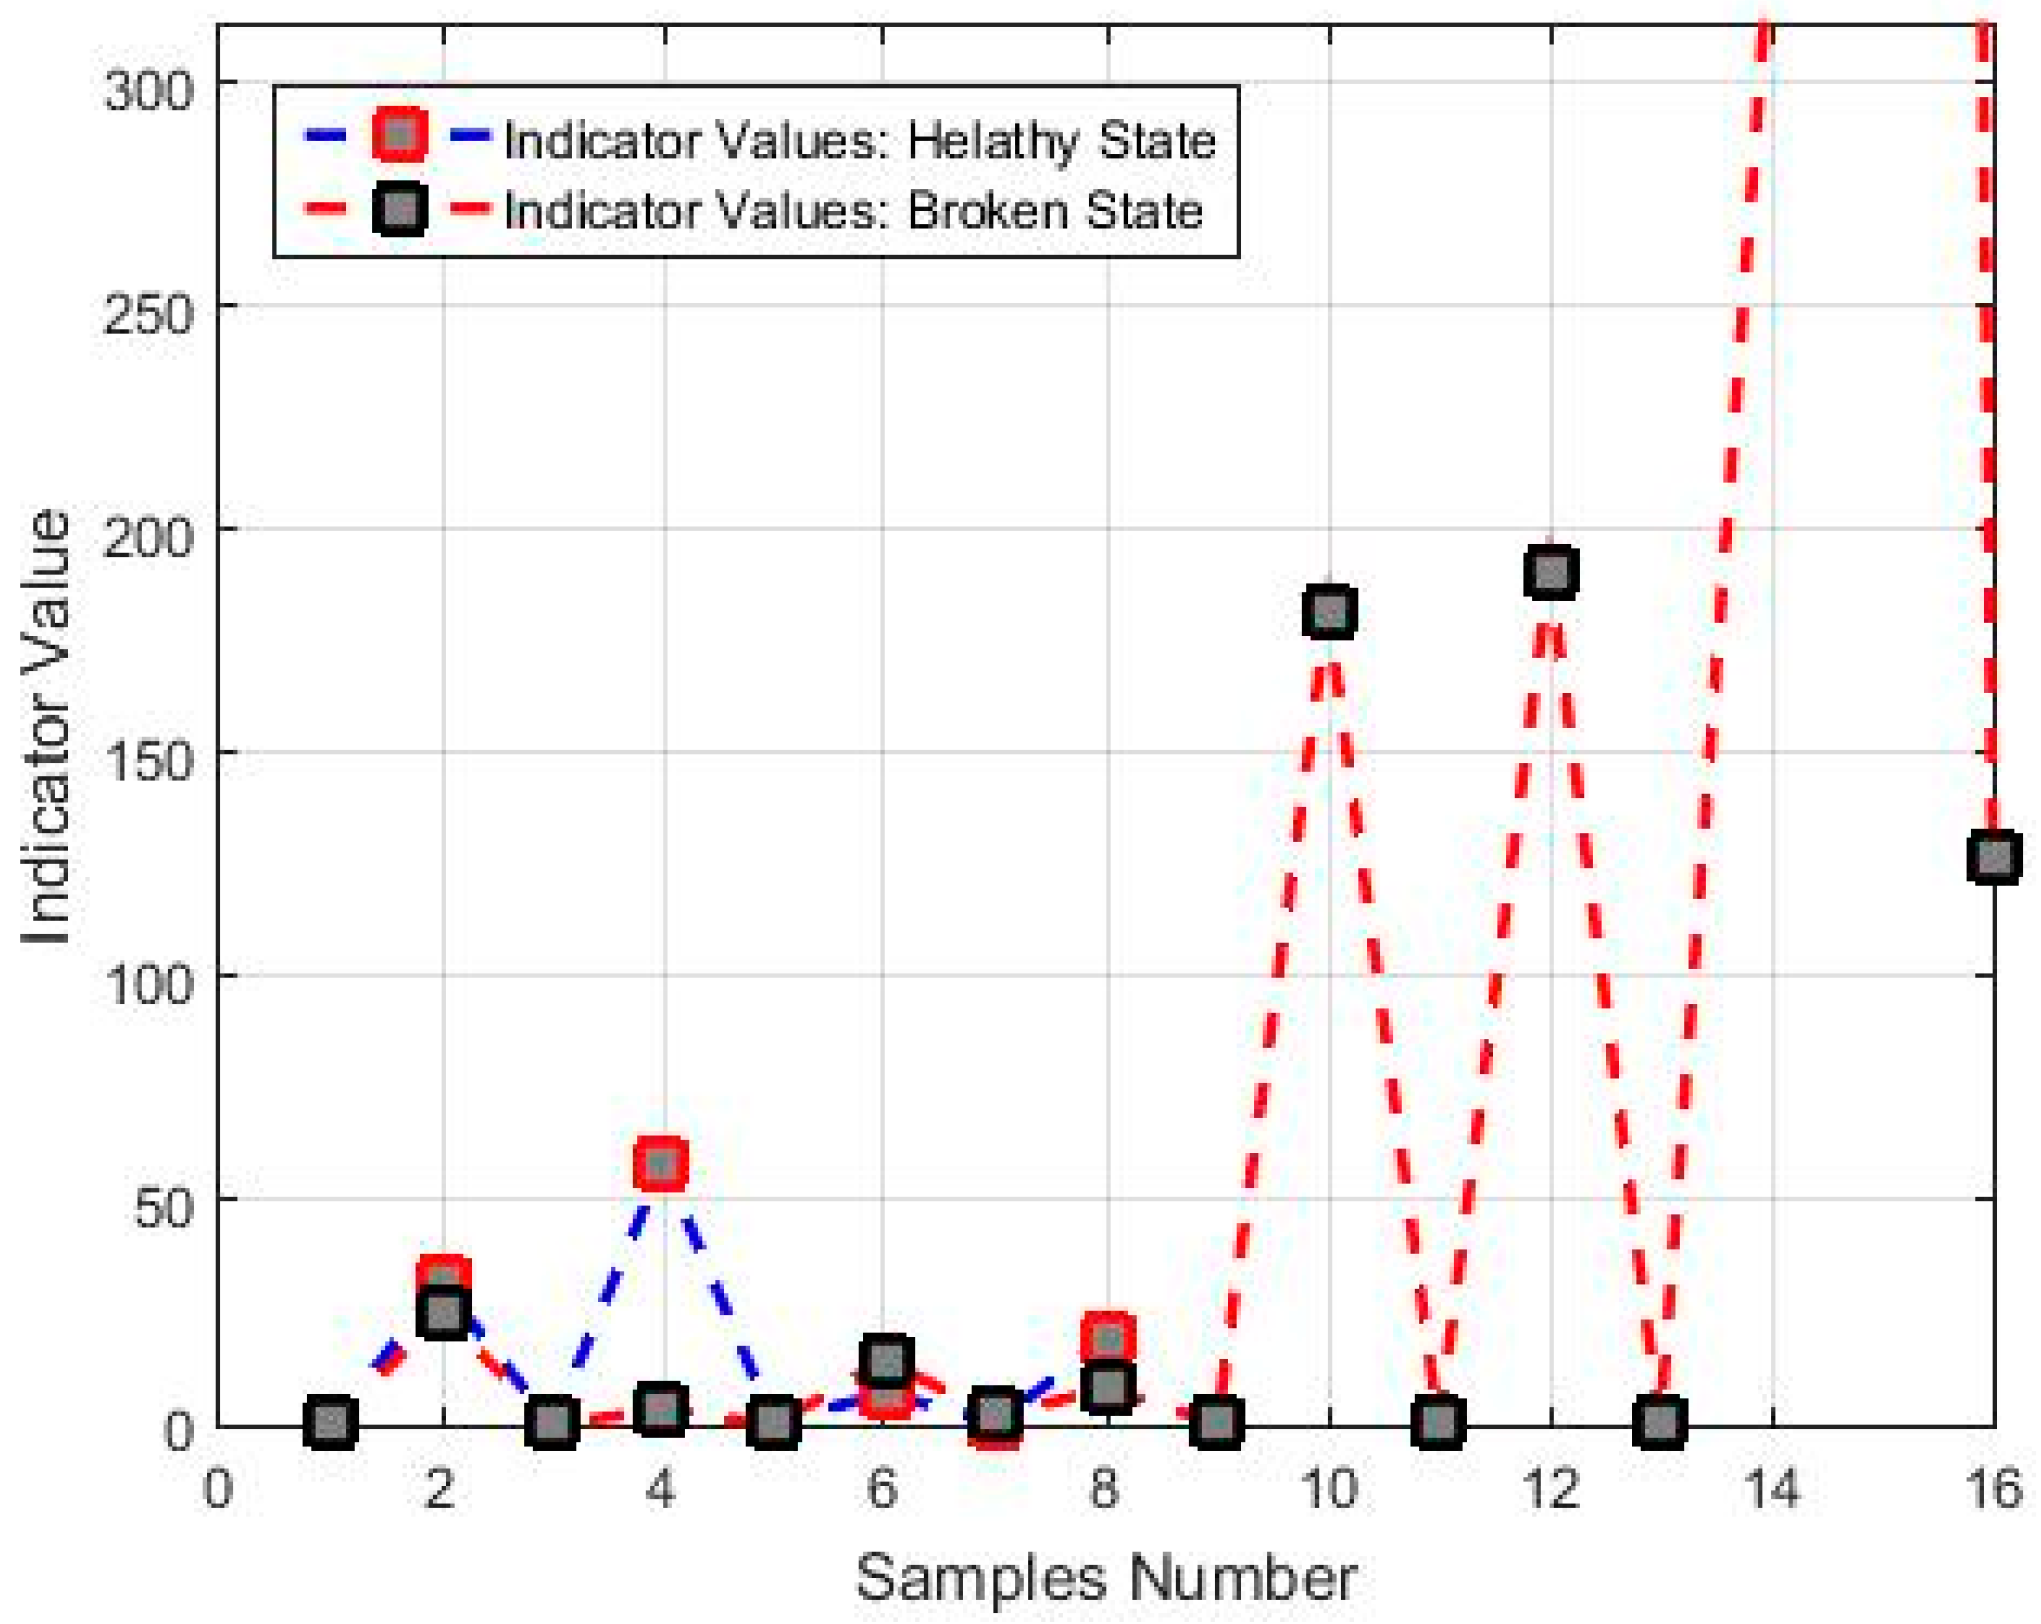
Table 7, it can be seen that for similar operating conditions, the indicator in the frequency domain depends on the position of the sensor, as can be seen for samples 0, 4, 8 and 14. In these cases, the relative differencesare appreciable and it is possible to discern between one state and the other. On the other hand, the difference in the values of the indicator for the other positions, such as with samples 2 and 6, is not significant. In any case, the values of the indicator for the faulty condition are always greater than those of the equivalent healthy one.
On the other hand, we show in Table 8 and Table 9 show the values of the indicator when the motor works at steady-state (100% of the nominal voltage).
From the results shown in Table 8 and Table 9, it is noted that the differences between the values of the indicator in the frequency domain for healthy and faulty conditionsare not significant when the motor works at steady state. This may be due to the fact that, during startup, certain harmonics vary in frequency and amplitude [9]. This does not happen under the steady state regime, during which the harmonics maintain well-defined frequencies and amplitudes, as long as the load level does not change.
From the results shown in the above tables, it can be deduced that, under the healthy condition, the indicator in the frequency domainreachesa maximum value of 30.38804, and the minimum value is 0.597756. On the other hand, the indicator for the faulty condition (motor with a broken bar) ranges between 0.709328 and 41.0198. The value of the indicator for the healthy condition never exceeds the value of 31 for all measurements.
All the comparisons related to the values of the indicator have been carried out between measurements that were obtained under similar operating conditions. This leads to the conclusion that the position of the sensor plays a crucial role and that significant differences are not obtained in every position.

3.2. Results in the Time Domain

Taking into consideration the previous results obtained in the frequency domain, a new algorithm based on the square value of the median of the autocovariance matrix of the flux signal was proposed, as described in Equation (8). This gives a fault detection indicator in the time domain. The results obtained after applying this last algorithmare shown in Figure 10, and they are summarized in Table 10, Table 11, Table 12 and Table 13.
The previous results show that there is a notable difference between the values of the indicator when the motor works at steady-state (100% of the rated supply), but not during the start-up, when it works at 60% of the rated supply.

4. Discussion

We group the previous results with respect to the flux sensor location in order to compare the indicator values obtained in the frequency and time domains, for different fault conditions and operating regimes, see Table 14 and Table 15.
For the sample corresponding to the DMA position, the difference of the indicators values is noticeable at the startup, when working in the frequency domain. The difference in the temporal indicator between the healthy and faulty condition is preceded by a multiplication factor of 20. When the motor works at steady-state (with 100% of the rated supply), the difference in the values of the time indicator is appreciable. At startup, the indicator in the frequency domain is always greater for the faulty state; the opposite occurs with the temporary indicator at steady-state.
For the sample corresponding to the DM position, the difference of the indicators values at startup is not as noticeable compared to the values obtained at the DMA position, when working in the frequency domain. The difference in the time indicator between the healthy and damaged state is preceded by a multiplication factor of 3. When the motor works at steady-state, the difference of the time indicator is as significant as for the DMA position. At startup, the indicator in the frequency domain is always greater for the faulty condition; the opposite occurs with the temporal indicator at steady-state.
For the sample corresponding to the E position, there is a significant difference between the values of the indicator in the frequency domain at the startup, as with the DMA position. The difference in the temporal indicator between the healthy and the faulty condition is preceded by a multiplication factor of 45. At steady-state, with 100% of the rated voltage, the differences of the temporal indicatorsare significant. At startup, the indicator in the frequency domain is always greater for the faulty state; the same occurs in this case for the time indicator at steady-state, contrary to what happens in positions DM and DMA.
For the sample corresponding to the L position, the difference of the indicator at start-up is not clearly noticeable when working in the frequency domain as with the DMA and E sensor positions. The difference in the temporal indicator between the healthy and the faulty conditions is preceded by a multiplication factor of 4. When working at steady-state, the difference of the temporal indicator is significant. The indicator in the frequency domain is higher for the faulty state during start-up; the opposite occurs with the temporal indicator at steady-state.
From the results obtained in Table 14, Table 15, Table 16 and Table 17, for the four sensor positions analyzed (DMA, DM, E, L), the following can be concluded:
  • The indicator in the frequency domain for the healthy condition varies in a range of 26 I n d f 30 , and for the faulty condition it varies from 28 I n d f 38 during start-up. In this regime, the values of the indicator in the frequency domain for the healthy state are always lower than the corresponding values for the faulty state.
  • When the motor operates at steady state, the indicator in the time domain ranges from 6 I n d t 58 for the healthy condition, and between 3 I n d t 24 for the faulty one.
  • The best results are obtained when the measurement is carried out in the DMA position, since the values of both indicators are within the limits of obtained values.
  • In order to discern between the healthy and faulty conditions, the signal obtained from the flux sensor must first be evaluated during the start-up, for which the indicator is calculated based on the analysis in the frequency domain. At steady-state, the signal should be better evaluated using the time indicator.
  • A diagnostic decision based on the limit values for both indicators should be finally adopted. In order to obtain a more reliable conclusion of the rotor condition, the two indicators must be evaluated.
The accuracy of the proposed method as a classification of the condition of the damaged-healthy state of the induction motor depends, to a large extent, on the relative position where the measurement is made. Although regardless of the obtained results and the relative positions of each measurement, it can be noted that the average of the indication values obtained for the indicator in the frequency domain never exceeds the value of 28.250275 for the healthy state and 33.644395 for the damaged case. Similarly, if the analysis is performed for the indicator in the time domain, we have an average value of 28.91757275 for the healthy state, and of 12.5445985 for the faulty one. That is, in an a priori analysis, a result of the indication variable greater than these values, both for the frequency and time domains, can be concluded as an affirmative diagnosis of failure, as shown for the cases of the DMA and E positions.

5. Conclusions

The spectral analysis based on the bispectrum of the flux signals captured at external positions of an induction motor was proposed in order to provide a criterion to discriminate between healthy and faulty rotor conditions in induction motors.
To this end, an algorithm based on the sum of the mean value of the bispectrum module of the induction motor flux signal was theoretically described and implemented.
To demonstrate the results experimentally, several real samples of flux signals were registered, both for healthy and faulty conditions of the rotor cage, and for different operating conditions.
The proposed algorithms are based on the sum of the mean value of the bispectrum module of the flux signal and on the square value of the median of the autocovariance function. The results have shown they can be considered as indicators that enable us to provide a criterion for the discrimination between healthy and faulty conditions of the motor.
We can also conclude that the position where the measurement of the flux signal is carried out is an important factor, as well as the operating regime of the motor.
In conclusion, the study carried out in this paper implies that, with the analysis of stray flux signals, it is possible to obtain indicator variables that discriminate between faulty and healthy motors, which is an improvement and a complementtoexisting results obtained by using classical techniques for the diagnosis of failures in electrical machines and, in the future, may be a contribution to the development of portable industrial diagnostic devices.
As future work, it is proposed to carry out an estimation analysis of the accuracy of the proposed method and to obtain an algorithm for the optimization of the relative position of the flux sensor at the time of the measurement.

Author Contributions

Conceptualization, M.E.I.-M., J.A.A.-D., P.F.d.C., and J.A.C.; Methodology, M.E.I.-M.; Software, M.E.I.-M.; Validation, M.E.I.-M., J.A.A.-D., P.F.d.C., and J.A.C.; Formal Analysis, M.E.I.-M.; Investigation, M.E.I.-M., J.A.A.-D., P.F.d.C., and J.A.C.; Resources, M.E.I.-M., J.A.A.-D., P.F.d.C. and J.A.C.; Data Curation, M.E.I.-M. and J.A.A.-D.; Writing—Original Draft Preparation, M.E.I.-M., J.A.A.-D., P.F.d.C., and J.A.C.; Writing—Review & Editing, M.E.I.-M., J.A.A.-D., P.F.d.C., and J.A.C.; Visualization, M.E.I.-M.; Supervision, J.A.A.-D., J.A.C.

Funding

This research was funded by MEC, grant number MTM 2016-7963-P.

Conflicts of Interest

The authors declare no conflict of interest. The funders had no role in the design of the study; in the collection, analyses, or interpretation of data; in the writing of the manuscript, or in the decision to publish the results.

References

  1. Nandi, S.; Toliyat, H.A.; Li, X. Condition monitoring and fault diagnosis of electrical motors—A review. IEEE Trans. Energy Convers. 2005, 20, 719–729. [Google Scholar] [CrossRef]
  2. Henao, H.; Capolino, G.-A.; Fernández-Cabanas, M.; Filippetti, F.; Bruzzese, C.; Strangas, E.; Pusca, R.; Estima, J.; Riera-Guasp, M.; Kia, S.H. Trends in fault diagnosis for electrical machines. IEEE Ind. Electron. Mag. 2014, 8, 31–42. [Google Scholar] [CrossRef]
  3. Riera-Guasp, M.; Antonino-Daviu, J.A.; Capolino, G. Advances in electrical machine, power electronic, and drive condition monitoring and fault detection: State of the art. IEEE Trans. Ind. Electron. 2015, 62, 1746–1759. [Google Scholar] [CrossRef]
  4. Chen, J.; Sufei, L.; Thomas, G.H. A review of condition monitoring of induction motors based on stray flux. In Proceedings of the IEEE Energy Conversion Congress and Exposition (ECCE), Cincinnati, OH, USA, 1–5 October 2017. [Google Scholar] [CrossRef]
  5. Romary, R.; Pusca, R.; Lecointe, J.P.; Brudny, J.F. Electrical machines fault diagnosis by stray flux analysis. In Proceedings of the IEEE Workshop Electrical Machines Design, Control and Diagnosis (WEMDCD), Paris, France, 11–12 March 2013; pp. 245–254. [Google Scholar]
  6. Cabanas, M.F.; Norniella, J.G.; Melero, M.G.; Rojas, C.H.; Cano, J.M.; Pedrayes, F.; Orcajo, G.A. Detection of Stator Winding InsulationFailures: On–line and Off–line Tests. In Proceedings of the IEEE Workshop Electrical Machines Design, Control and Diagnosis (WEMDCD), Paris, France, 11–12 March 2013; pp. 208–217. [Google Scholar]
  7. Pusca, R.; Demian, C.; Mercier, D.; Lefevre, E.; Romary, R. An improvement of a diagnosis procedure for AC machines using two external flux sensors based on a fusion process with belief functions. In Proceedings of the IECON 2012—38th Annual Conference on IEEE Industrial Electronics Society, Montréal, QC, Canada, 25–28 October 2012; pp. 5096–5101. [Google Scholar]
  8. Frosini, L.; Borin, A.; Girometta, L.; Venchi, G. A novel approach to detect short circuits in low voltage induction motor by stray flux measurement. In Proceedings of the 2012 XXth International Conference on Electrical Machines, Marseille, France, 2–5 September 2012; pp. 1536–1542. [Google Scholar]
  9. Ramirez-Nunez, J.A.; Antonino-Daviu, J.A.; Climente-Alarcón, V.; Quijano-López, A.; Razik, H.; Osornio-Rios, R.A.; Romero-Troncoso, R.D. Evaluation of the Detectability of Electromechanical Faults in Induction Motors Via Transient Analysis of the Stray Flux. IEEE Trans. Ind. Appl. 2018, 54, 4324–4332. [Google Scholar] [CrossRef]
  10. Park, Y.; Yang, C.; Kim, J.; Kim, H.; Lee, S.B.; Gyftakis, K.N.; Panagiotou, P.; Kia, S.H.; Capolino, G.A. Stray Flux Monitoring for Reliable Detection of Rotor Faults under the Influence of Rotor Axial Air Ducts. IEEE Trans. Ind. Electron. 2018. [Google Scholar] [CrossRef]
  11. Iglesias-Martínez, M.E.; Fernández de Córdoba, P.; Antonino-Daviu, J.A.; Conejero, J.A. Detection of Bar Breakages in Induction Motor via Spectral Subtraction of Stray Flux Signals. In Proceedings of the XIII IEEE International Conference on Electrical Machines (ICEM), Alexandroupoli, Greece, 3–6 September 2018; pp. 1796–1802. [Google Scholar] [CrossRef]
  12. Panagiotou, P.A.; Arvanitakis, I.; Lophitis, N.; Antonino-Daviu, J.A.; Gyftakis, K.N. Analysis of Stray Flux Spectral Components in Induction Machines under Rotor Bar Breakages at Various Locations. In Proceedings of the XIII IEEE International Conference on Electrical Machines (ICEM), Alexandroupoli, Greece, 3–6 September 2018; pp. 2345–2351. [Google Scholar]
  13. Mendel, J.M. Tutorial on higher-order statistics (spectra) in signal processing and system theory: Theoretical results and some applications. IEEE Proc. 1991, 79, 278–305. [Google Scholar] [CrossRef]
  14. Nikia, C.L.; Mendel, J.M. Signal Processing with higher-order spectra. IEEE Signal Process. Mag. 1993, 10, 10–37. [Google Scholar] [CrossRef]
  15. Swami, A.; Mendel, J.M.; Nikias, C.L. Higher-Order Spectral Analysis Toolbox User’s Guide, Version 2; UnitedSignals & Systems, Inc.: Ranco Palos Verde, CA, USA, 2001. [Google Scholar]
  16. Vaseghi, S.V. Advanced Digital Signal Processing and Noise Reduction, 4th ed.; John Wiley & Sons: Hoboken, NJ, USA, 2008. [Google Scholar]
  17. Murua, A.; Sanz-Serna, J.M. Vibrational resonance: A study with high-order word-series averaging. Appl. Math. Nonlinear Sci. 2016, 1, 239–246. [Google Scholar] [CrossRef]
Figure 1. Different positions considering the flux sensor.
Energies 12 00597 g001
Figure 2. Comparison of the frequency spectra of the flux signals for the healthy state (blue) and for the faulty state with one broken bar (red). Sample 0, DMA position.
Energies 12 00597 g002
Figure 3. (a) Contour of bispectrum of the motor flux signal in healthy condition (sample 0, DMA position) (b) Contour of bispectrum of the motor flux signal in faulty condition (sample 0, DMA position).
Energies 12 00597 g003
Figure 4. Contour of the bispectrum of the motor flux signal: (a) Sample 1 of the healthy motor, (b) Sample 1 of the damaged motor, (c) Sample 2 of the healthy motor, (d) Sample 2 of the damaged motor.
Energies 12 00597 g004aEnergies 12 00597 g004b
Figure 5. Contour of the bispectrum of the motor flux signal: (a) Sample 3 of the healthy motor and (b) Sample 3 of the damaged motor.
Energies 12 00597 g005
Figure 6. Contour of the bispectrum of the motor flux signal: (a) Sample 4 of the healthy motor, (b) Sample 4 of the damaged motor.
Energies 12 00597 g006
Figure 7. Contour of the bispectrum of the motor flux signal: (a) Sample 5 of the healthy motor and (b) Sample 5 of the damaged motor.
Energies 12 00597 g007
Figure 8. Contour of the bispectrum of the motor flux signal: (a) Sample 6 of healthy the motor, (b) Sample 6 of the damaged motor.
Energies 12 00597 g008
Figure 9. Contour of the bispectrum of the motor flux signal: (a) Sample 7 of the healthy motor, and (b) Sample 7 of the damaged motor
Energies 12 00597 g009
Figure 10. Values of the indicator in the time domain for all the samples used in the experiments.
Energies 12 00597 g010
Table 1. Characteristics of the experiment for the healthy motor during start-up.
SamplePositionLoadSpeed (r/min)Torque (Nm)Supply Voltage (%)Time (s)
0DMANL9880.49601
2DMNL9880.49601
4ENL9870.51601
6LNL9860.54601
Table 2. Characteristics of the experiment for the damaged motor with a broken bar during start-up.
SamplePositionLoadSpeed (r/min)Torque (Nm)Supply Voltage (%)Time (s)
0DMANL9850.49601
2DMNL9880.49601
4ENL9870.49601
6LNL9850.49601
8DMAFL7555.1601
10DMFL7505601
12EFL7605601
14LFL7655601
Table 3. Characteristics of the experiments for the healthy motor at steady state.
SamplePositionLoadSpeed (r/min)Torque (Nm)Supply Voltage (%)Time (s)
1DMANL9940.491008
3DMNL9940.481008
5ENL9950.511008
7LNL9950.51008
Table 4. Characteristics of the experiment for the damaged motor with a broken bar at steady state.
SamplePositionLoadSpeed (r/min)Torque (Nm)Supply Voltage (%)Time (s)
1DMANL9940.521008
3DMNL9940.531008
5ENL9940.551008
7LNL9970.581008
9DMAFL9406.21008
11DMFL9406.131008
13EFL9406.11008
15LFL9406.091008
Table 5. Obtained results by applying the one-dimensional Fourier Transform and calculating the indicator (Equations (4) and (5)).
SampleObtained Indicator in Frequency Domain
0, DMA position, healthy state9.1160·10−4
0, DMA position, damage state (one broken bar)8.8375·10−4
Table 6. Results of the indicator in the frequency domain based on Equations (4) and (5) for the data of the experiment with the healthy motor during start-up.
SamplePositionLoadSpeed (r/min)Torque (Nm)Supply Voltage (%)Time (s)Indicator
0DMANL9880.4960130.38804
2DMNL9880.4960127.28881
4ENL9870.5160128.56996
6LNL9860.5460126.75429
Table 7. Results of the indicator in the frequency domain based on Equations (4) and (5) for the data of the experiment with the faulty motor with a broken bar, during start-up.
SamplePositionLoadSpeed (r/min)Torque (Nm)Supply Voltage (%)Time (s)Indicator
0DMANL9850.4960138.15795
2DMNL9880.4960128.76003
4ENL9870.4960138.77947
6LNL9850.4960128.88013
8DMAFL7555.160132.06025
10DMFL750560125.04451
12EFL760560123.42840
14LFL765560141.01978
Table 8. Results of the indicatorin the frequency domain based on Equations (4) and (5) for the data of the experiments with the healthy motor at steady state.
SamplePositionLoadSpeed (r/min)Torque (Nm)Supply Voltage (%)Time (s)Indicator
1DMANL9940.4910081.152108
3DMNL9940.4810081.192266
5ENL9950.5110080.597756
7LNL9950.510080.726403
Table 9. Results of the indicator in the frequency domain based on Equations (4) and (5) for the data of the experiments with the faulty motor with a broken bar at steady state.
SamplePositionLoadSpeed (r/min)Torque (Nm)Supply Voltage (%)Time (s)Indicator
1DMANL9940.5210080.842987
3DMNL9940.5310080.854711
5ENL9940.5510080.975386
7LNL9970.5810080.709328
9DMAFL9406.210083.707399
11DMFL9406.1310083.254082
13EFL9406.110083.979508
15LFL9406.0910082.998851
Table 10. Results of the indicatorin the time domain, based on Equations (6)–(8), for the data of the experiments with the healthy motor during startup.
SamplePositionLoadSpeed (r/min)Torque (Nm)Supply Voltage (%)Time (s)Indicator
0DMANL9880.496010.071959
2DMNL9880.496010.027691
4ENL9870.516010.435514
6LNL9860.546010.537173
Table 11. Results of the indicator in the time domain, based on Equations (6)–(8), for the data of the experiments with the motor with one broken bar during startup.
SamplePositionLoadSpeed (r/min)Torque (Nm)Supply Voltage (%)Time (s)Indicator
0DMANL9850.496010.003537
2DMNL9880.496010.009451
4ENL9870.496010.009606
6LNL9850.496012.046191
8DMAFL7555.16010.370122
10DMFL75056010.033363
12EFL76056010.005345
14LFL76556012227.965
Table 12. Results of the indicator, based on Equations (6)–(8), for the data of the healthy motor experiments under the steady state regime.
SamplePositionLoadSpeed (r/min)Torque (Nm)Supply Voltage (%)Time (s)Indicator
1DMANL9940.49100831.38462
3DMNL9940.48100858.30218
5ENL9950.5110086.948441
7LNL9950.5100819.03505
Table 13. Results of the indicator, based on Equations (6)–(8), for the data of the faulty motor experiments under the steady state regime.
SamplePositionLoadSpeed (r/min)Torque (Nm)Supply Voltage (%)Time (s)Indicator
1DMANL9940.52100824.67371
3DMNL9940.5310083.342042
5ENL9940.55100814.26557
7LNL9970.5810087.897072
9DMAFL9406.21008181.7043
11DMFL9406.131008190.5501
13EFL9406.11008334.8858
15LFL9406.091008126.3791
Table 14. Results of the time and frequency indicators for the DMA position.
SamplePositionLoadSpeed (r/min)Torque (Nm)Supply Voltage (%)Time (s)Frequency IndicatorTime IndicatorState
0DMANL9880.4960130.388040.071959Healthy
DMANL9940.4938.157950.003537Faulty
1DMANL9940.4910081.15210831.38462Healthy
DMANL9940.520.84298724.67371Faulty
Table 15. Results of the time and frequency indicators for the DM position.
SamplePositionLoadSpeed (r/min)Torque (Nm)Supply Voltage (%)Time (s)Frequency IndicatorTime IndicatorState
2DMNL9880.4960127.288810.027691Healthy
DMNL9880.4928.760030.009451Faulty
3DMNL9940.4810081.19226658.30218Healthy
DMNL9940.530.8547113.342042Faulty
Table 16. Results of the time and frequency indicators for the E position.
SamplePositionLoadSpeed (r/min)Torque (Nm)Supply Voltage (%)Time (s)Frequency IndicatorTime IndicatorState
4ENL9870.5160128.569960.435514Healthy
ENL9870.4938.779470.009606Faulty
5ENL9950.5110080.5977566.948441Healthy
ENL9940.550.97538614.26557Faulty
Table 17. Results of the time and frequency indicators for the L position.
SamplePositionLoadSpeed (r/min)Torque (Nm)Supply Voltage (%)Time (s)Frequency IndicatorTime IndicatorState
6LNL9860.5460126.754290.537173Healthy
LNL9850.4928.880132.046191Faulty
7LNL9950.510080.72640319.03505Healthy
LNL9970.580.7093287.897072Faulty

