Article

Effect of Compression Ratio of Graphite Felts on the Performance of an All-Vanadium Redox Flow Battery

1
Institute of Nuclear Energy Research, Atomic Energy Council, No. 1000 Wenhua Rd., Jiaan Village, Longtan District, Taoyuan City 32546, Taiwan
2
Department of Mechanical Engineering and Advanced Institute of Manufacturing with High-tech Innovations, National Chung Cheng University, No. 168, University Rd., Minhsiung Township, Chiayi County 62102, Taiwan
*
Author to whom correspondence should be addressed.
Energies 2019, 12(2), 313; https://doi.org/10.3390/en12020313
Submission received: 16 November 2018 / Revised: 13 January 2019 / Accepted: 14 January 2019 / Published: 19 January 2019
(This article belongs to the Special Issue Battery Storage Technology for a Sustainable Future)

Abstract

:
All-vanadium redox flow batteries (VRFBs) are considered promising candidates for large-scale energy storage systems due to their flexible power scale design, high efficiency, deep discharge, long cycle life and environmental friendliness. The performance and efficiency of a VRFB is affected by many factors, including component materials, battery design, electrolyte composition and operating conditions. Among the key components, porous electrodes play a key role, as the electrochemical reaction occurs on the fiber surface of the electrode. As such, many studies have focused on improving reaction kinetics by modifying the surface of the electrode. In this work, the effect of varying the compression ratio (CR) of graphite felts on the performance and efficiency of a VRFB are investigated. The impedance of a single VRFB under varying CRs of graphite felts at various operating conditions were also measured. The results suggest that performance of a VRFB increases with increasing CR due to the decrease of area resistance and concentration overpotential. The porous electrode compressed from 6.5 to 4 mm demonstrates the optimal energy efficiency of 73% at the operating current density 80 mA cm−2 and electrolyte flow rate 100 mL min−1.

1. Introduction

All-vanadium redox flow batteries (VRFBs) have drawn attention over the past decade as potential energy storage systems to compensate for fluctuations in output power generated from stochastic renewable energy systems, such as wind or solar power sources [1,2]. The electrolytes of a VRFB consist of a VO2+/VO2+ redox couple in the positive tank and a V2+/V3+ redox couple in the negative tank. By employing the same metal ion in different oxidation states in the positive and negative electrolytes, the risk of explosion in the case of cross-contamination is eliminated. The reactions occurring at the positive and negative electrode in a VRFB are as follows, respectively:
VO 2 + + 2 H + + e Charge Discharge VO 2 + + H 2 O
V 2 + Charge Discharge V 3 + + e
Unlike other secondary batteries [3,4], the energy of the VRFB is stored in the electrolytes located outside of the battery stack, making VRFB suitable for large-scale application because of its independent design of power rating and energy capacity [5]. The power rating is determined by the stack size, whereas the energy capacity is determined by the concentration and volume of the electrolyte. In addition, the VRFB demonstrates a promising potential to integrate with renewable power sources due to several advantages, including long cycle life, slow self-discharge, low maintenance cost and low environmental toxicity [6,7].
The efficiency of a VRFB depends on the battery design [8,9], component materials and operating conditions, such as the operating current density and electrolyte flow rate [10]. The electrochemical reaction occurs on the electrode surface at the electrode/electrolyte interface. An ideal porous electrode has high conductivity, high chemical stability and large specific fiber surface area. Currently, graphite felts, carbon felts and carbon papers are the most commonly used electrode materials. Graphite felts are mainly composed of graphite fibers, which provide a path for electron transport. The electrolyte transports in the porous space between graphite fibers. Many researchers have examined the impact of surface modification of the electrode, including acid treatment [11,12], heat treatment [13,14,15], plasma [16] and catalyst deposition, on the performance of VRFBs.
The components of a VRFB are clamped together to reduce the contact resistance between components. The contact resistance between the electrode and membrane and between the electrode and graphite plate are reduced. Compression of the porous electrode during assembly may affect the electrical and mechanical properties of the electrode. Although the reduced porosity within the electrode may enhance electrolyte transport to reduce mass transport overpotential, this increased the pumping power required to deliver the electrolyte. Few studies have been reported on the effect of compression on VRFB performance. Park et al. [17] assembled VRFBs with compression ratios (CRs) of 10%, 20% and 30% and suggested that an electrode with a CR of 30% had optimum performance in terms of maximum power and capacity. However, the studied VRFBs with a CR of 20% had the highest energy efficiency, due to the combined effects of cell resistance, electrolyte transport and longer charge/discharge time.
Chang et al. [18] investigated the electrical, mechanical and morphological properties of a compressed carbon-felt electrode in a VRFB. Wang et al. [19] experimentally studied the effect of non-uniformly compressed carbon-felt electrodes on the performance of VRFBs, Wang et al. found that the charge/discharge time increased with increasing CR and that the energy efficiency was improved to 19.4% with a CR of 41.8%. Davies et al. [20] investigated the effect of compression pressure on the properties of electrodes, including porosity, contact resistance and felt resistance. Their results suggested that a VRFB under a compression pressure of 7.5 bar using Nafion 212 membrane can achieve a peak power density of 669 mW cm−2. Ghimire et al. [21] systematically studied the effect of CR on electronic conductivity, pressure drop and performance in a VRFB and concluded that 25% CR is optimal in their study.
A multimeter or a four-point resistance measurement device has commonly been used to measure the specific resistance of the electrode at various CRs. Although this technique can be used to measure the electrode resistance under various CRs, it cannot be used to measure the specific resistance of a complete VRFB. Therefore, this work measures the specific resistance of a VRFB under various electrode CRs using electrochemical impedance spectroscopy (EIS). The specific resistance at various operating conditions is measured and compared, including under varying state of charge (SOC) and electrolyte flow rate. The performance was evaluated by charge-discharge curves measured at various operating conditions. The effect of mass transfer due to varying CRs on overall performance is also discussed.

2. Experimental

The experimental setup, comprising a VRFB system, a battery tester (PFX2021, Kikusui Electronics Corp., Yokohama, Japan) and an impedance meter (KFM2150, Kikusui Electronics Corp., Yokohama, Japan), was designed to measure the charge/discharge performance and impedance of the battery during operation and is illustrated in Figure 1.

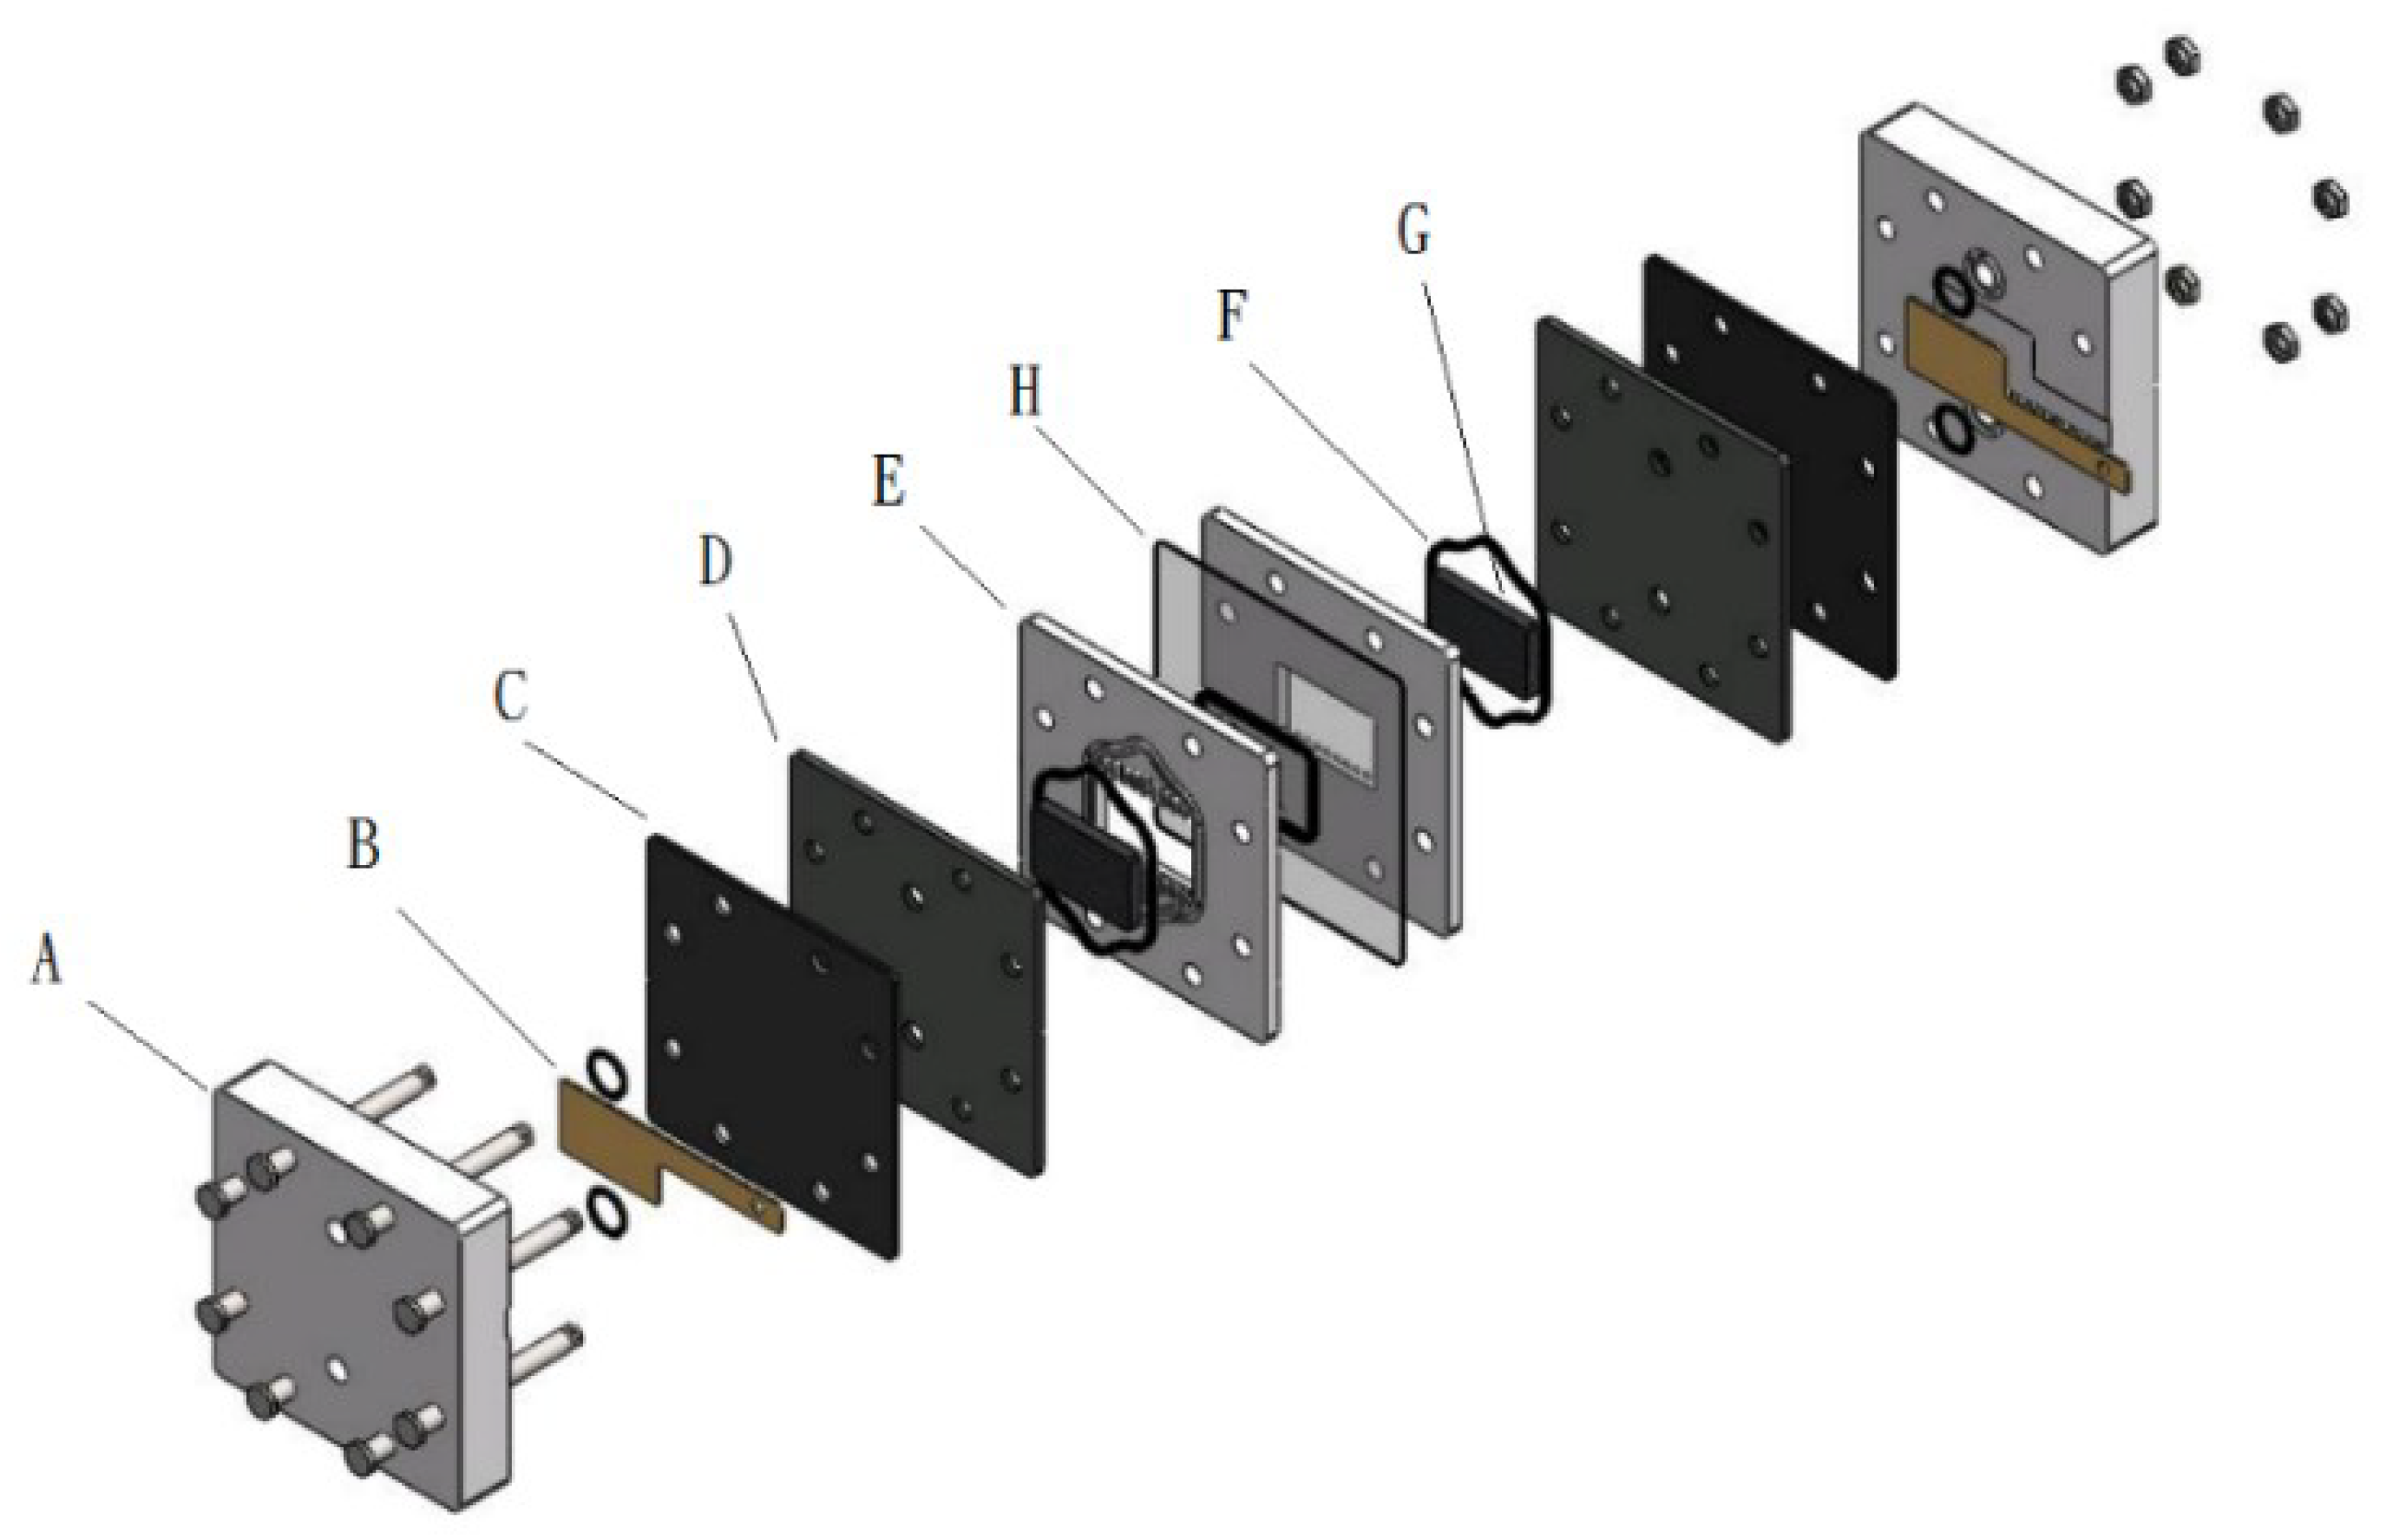
2.1. VRFB Preparation

A single VRFB designed for the experiment with an active area of 2.5 × 4.0 cm2 was used for performance measurements. A proton-exchange membrane (Nafion 117, Dupont, Wilmington, DE, USA) pretreated with sulfuric acid at 60 °C for 24 h was used as the separator. The graphite felts (GF065, CeTech, Taichung, Taiwan) used for the positive and negative electrodes with a thickness of 6.5 mm were treated with sulfuric acid at 60 °C for 12 h. Interchangeable frames 3, 4 and 5 mm thick were placed between the membrane and graphite plate, as shown in Figure 2, to control the CR of the electrodes. Flow distributors at the inlet and outlet of the electrolyte were included on one side of the frame to improve the electrolyte uniformity within the electrode. A flexible graphite foil was placed between the graphite plate and current collector to diminish the contact resistance. The VRFB was compressed using eight nuts and bolts with a torque of 4 N m.
The electrolyte was prepared by dissolving 1.5 M VOSO4 in 2.0 M H2SO4. The initial volumes of positive and negative electrolytes were 100 and 50 mL, respectively. The electrolytes were delivered and recirculated between the tanks and the VRFB by two diaphragm pumps (SMART digital DDA7.5-16AR-PVC/V/C, Grundfos, Bjerringbro, Denmark). In the pre-charge step, the VRFB was charged in a constant-current mode at 40 mA cm−2 then in constant-voltage mode at 1.71 V until colors of positive and negative electrolytes turned yellow and lilac, respectively. At the end of pre-charge step, the V4+ initially in the positive and negative electrolyte tanks was converted and V5+ and V2+, respectively. Half of the positive electrolyte was then removed so that the electrolyte volume in the two tanks was equal and both V5+ and V2+ concentrations were 1.5 M. During the pre-charge and following experimental processes, both electrolyte tanks were filled with N2 to avoid electrolyte oxidation.

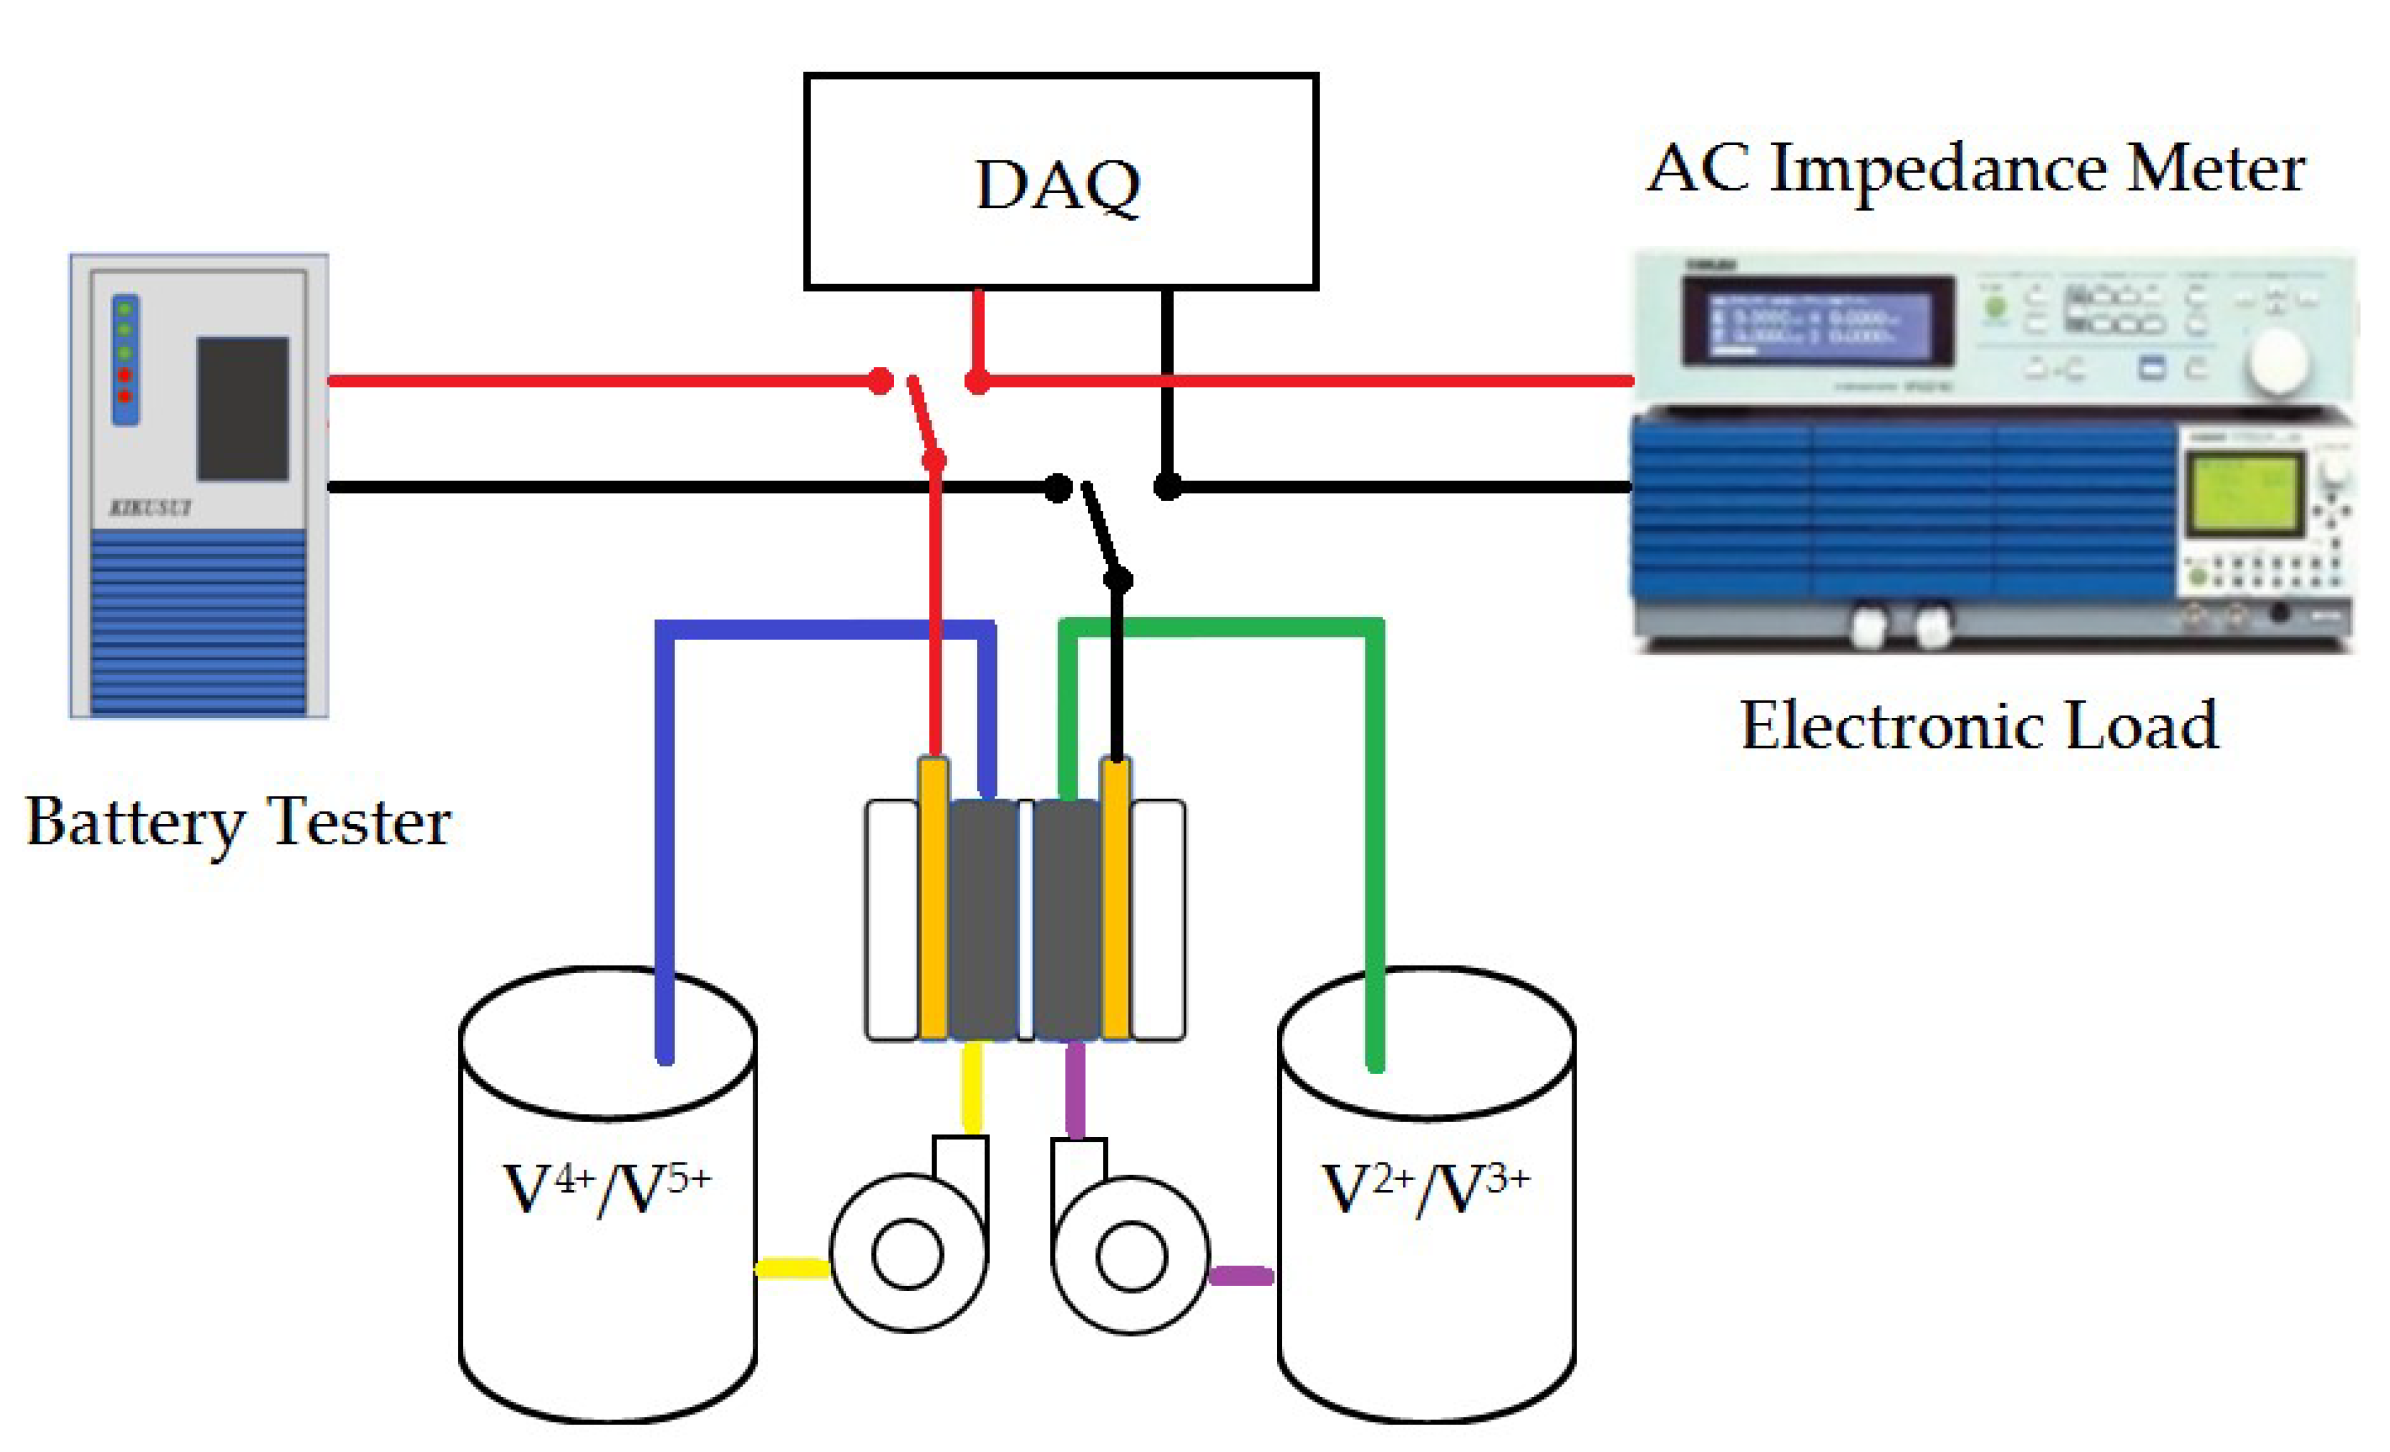
2.2. Performance Measurement

A battery tester was used to measure the charge-discharge curves of the VRFB operating under current densities of 40, 60 and 80 mA cm−2. At each current density, the electrolytes were recirculated with two varied flow rates: 50 and 100 mL min−1. The purpose of choosing the flow rate of 100 mL min−1 is to reduce the concentration effect and focus on the effect of CR on VRFB performance. Both the positive and negative electrolytes were supplied with the same flow rate. Under each operating condition, the VRFB was charged and discharged between 0.7 and 1.71 V for five cycles, the last three of which were used to evaluate the efficiency. The coulombic (CE), voltage (VE) and energy efficiency (EE) and discharge capacity (DC) were calculated by the following equations, respectively:
CE = i discharge ( t ) d t i charge ( t ) d t ,
VE = V avg , discharge V avg , charge ,
EE = CE × VE ,   and
DC = i discharge ( t ) d t .
Additionally, EIS was employed to investigate the VRFB resistance at selected operating conditions under various electrode CRs. An impedance meter was connected with the electronic load (PLZ664WA, Kikusui Electronics Corp., Yokohama, Japan) to measure the impedance of the VRFB during the constant-current discharge. The impedance measurement was conducted at the SOCs of 5%, 50% and 95% to investigate the effect to SOC on VRFB impedance. To alleviate the influence of electrolyte concentration variation due to discharge on the impedance, the impedance measurement was completed in approximately 20 min with the scanning frequency from 20 kHz to 1 Hz. Since the impedance meter used did not provide continuous voltage recording, the VRFB voltage was monitored and recorded during discharge using a data acquisition card (NI 9219, National Instrument, Austin, TX, USA). The resistance and reactance obtained from EIS were used to prepare Nyquist plots.

3. Results and Discussion

In this section, the effects of varying the CR of the electrodes on the performance of the VRFB are presented by comparing the efficiency, discharge capacity, impedance and concentration overpotential at various operating conditions.

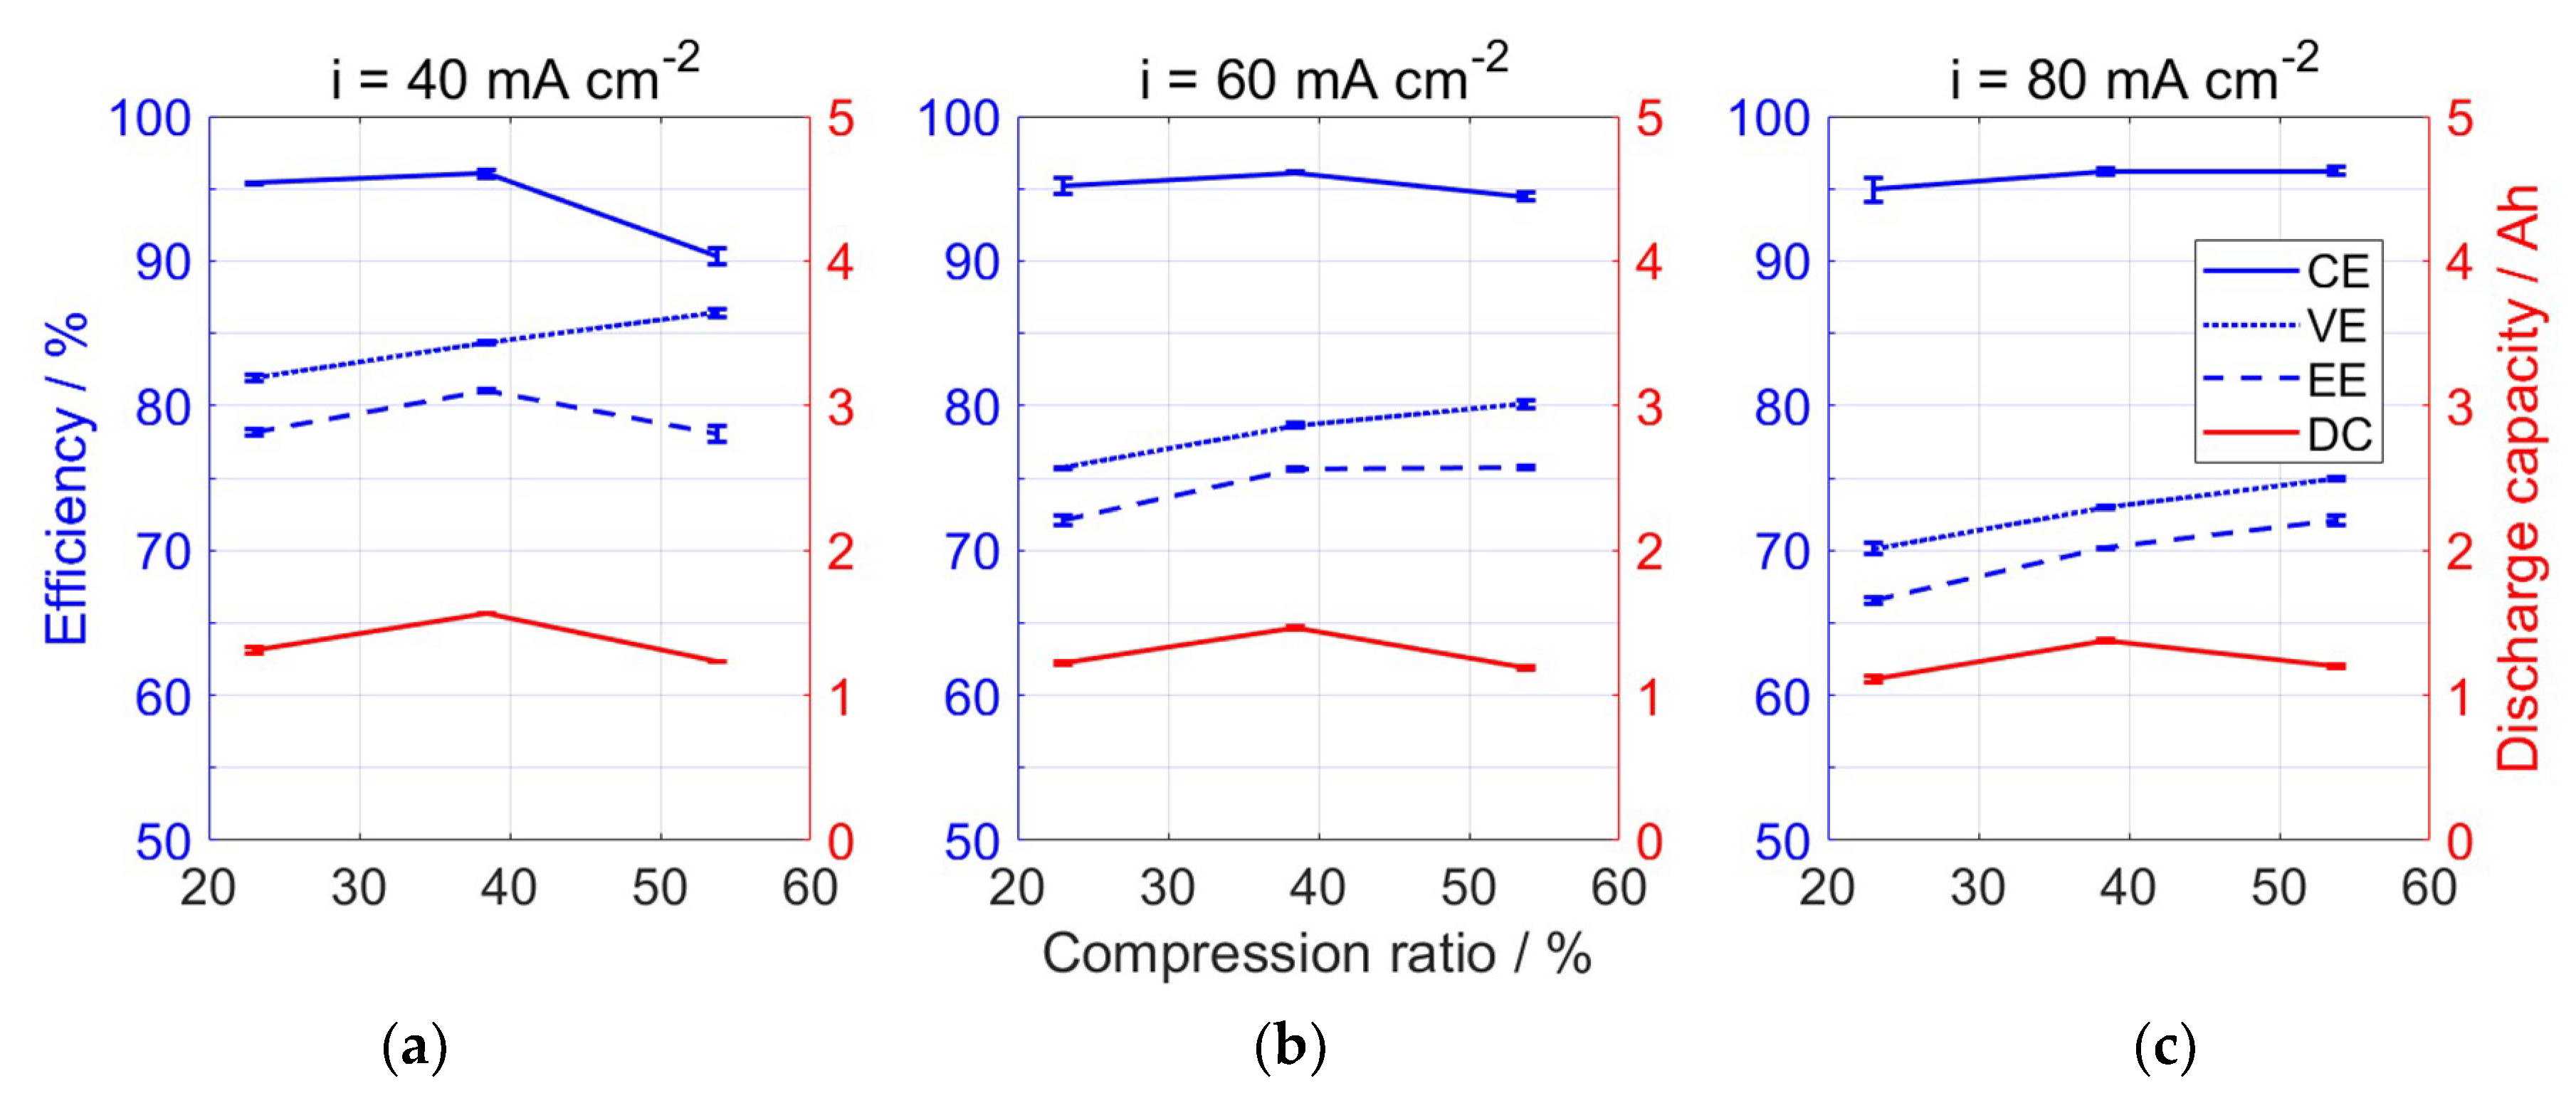
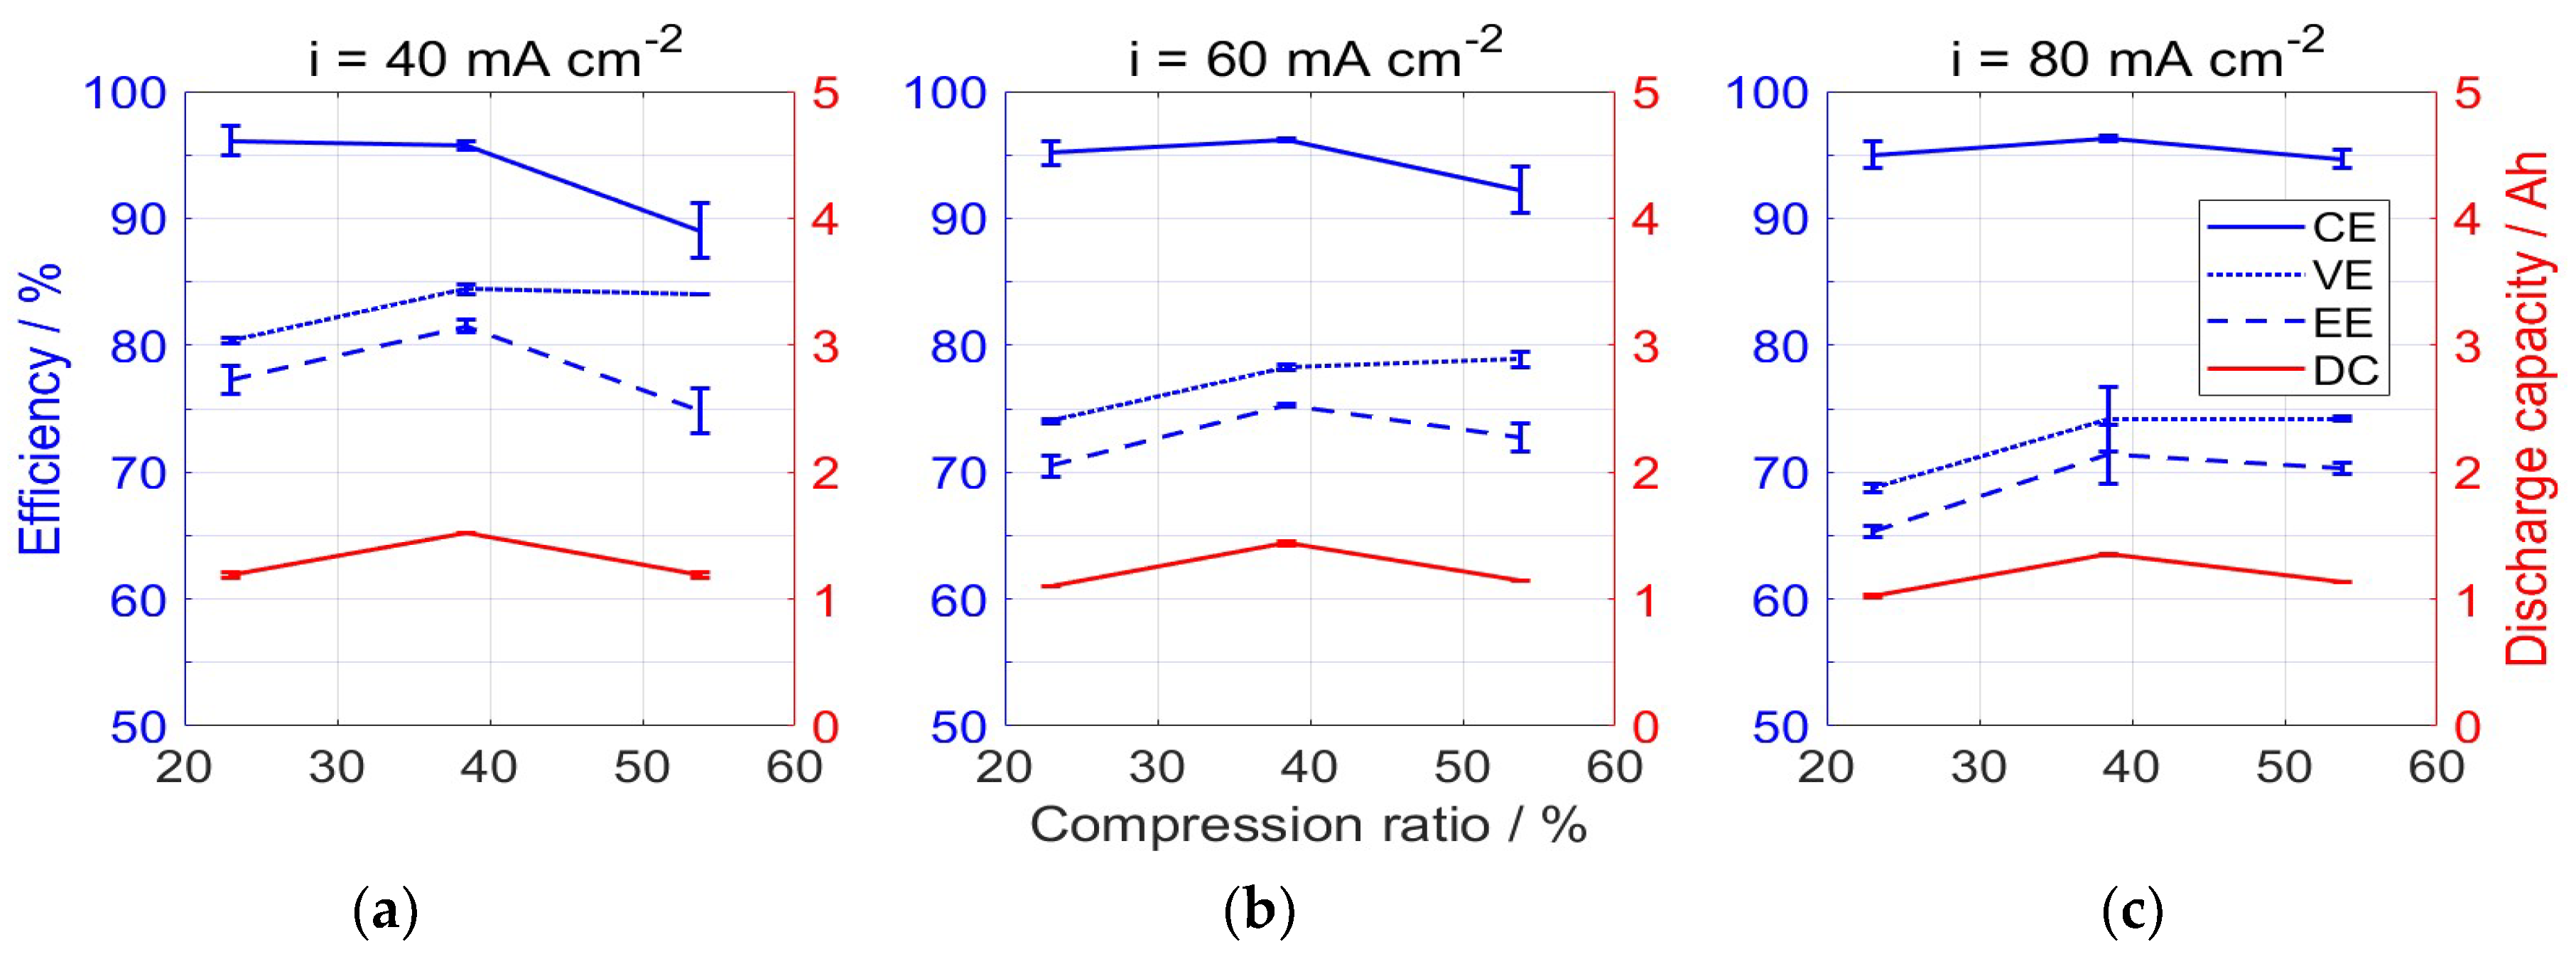
3.1. Effect of Electrode CR on Efficiencies

Using interchangeable frames with a thickness of 3, 4 and 5 mm provided a CR of the porous electrode of 53.8%, 38.5% and 23.1%, respectively, calculated using the following equation:
CR = t 0 t c t 0 ,
where t0 and tc are the thicknesses of the uncompressed and compressed graphite felts, respectively. At the CR larger than 50%, the pressure drop may be too high and cause higher pump power consumption; however, the aim of this study is for the investigation of CR on the VRFB performance at current stage.
The resulting efficiency variation of the VRFB under the three studied CRs operating at three current density levels under an electrolyte flow rate of 100 mL min−1 is presented in Figure 3, where the error bars represent the standard deviation (SD) obtained from the experimental data of three charge/discharge cycles. The standard deviation was calculated as
SD = i = 1 N ( x i x ¯ ) 2 N ,
where xi is the value of the data, x ¯ is the mean value and N is the number of data points. The small error bars indicate the high consistency of three charge/discharge cycles.
At a CR of 23.1%, the CE at all three current density levels were near 95%. Increasing the CR to 38.5% increased the CE at all three current density levels to 96%. However, further increasing the CR to 53.8% caused a decrease in the CE under 40 mA cm−2 with decreasing current density. The decrease of CE at the CR of 53.8% may be attributed to the over compression of the graphite felt, causing reduced porosity and specific fiber surface area where the redox reaction occurs.
Additionally, the VE decreased within increasing current density due to larger ohmic overpotentials at higher operating current densities. Under constant current density, the VE increased with increasing CR because of the increased contact between graphite fibers, which decreases the contact resistance. Similar results also have been reported in Park’s study.
The EE was obtained by multiplying the CE and VE. The maximum EE for current densities of 40 and 60 mA cm−2 were approximately 81%, 76%, respectively, at the CR of 38.5%, whereas the maximum EE for 80 mA cm−2 was 73.1% at the CR of 53.8%. The lower EEs for 40 and 60 mA cm−2 at the CR of 53.8% were mainly due to the decrease in CE. The results suggested that the high CR had a higher impact on CE than on VE. Although the EE of 73.1% at 80 mA cm−2 was lower than that in the recently published study [21] due to different treatments on electrodes, the VRFB in this study showed consistent performance during cycling tests and could be used for further experiments.
The DC at all three current density levels studied showed a similar trend: a slight increase then decrease with increasing CR. The decreased DC at a CR of 53.8% may be due to over compression, as this can cause open pores in the electrode to close or shrink in size, making electrolyte flow more difficult. When the electrolyte is trapped in the pores, the products of the redox reaction cannot be removed quickly, hindering the overall electrochemical reaction.
Similarly, the resulting efficiency variation of the VRFB under the three studied CRs operating at three current density levels under an electrolyte flow rate of 50 mL min−1 is presented in Figure 4. The CE was lower at the higher CR of 53.8% for all current density levels, whereas VE increased with increasing CR. The maximum EE and DC occurred at the CR of 38.5%.

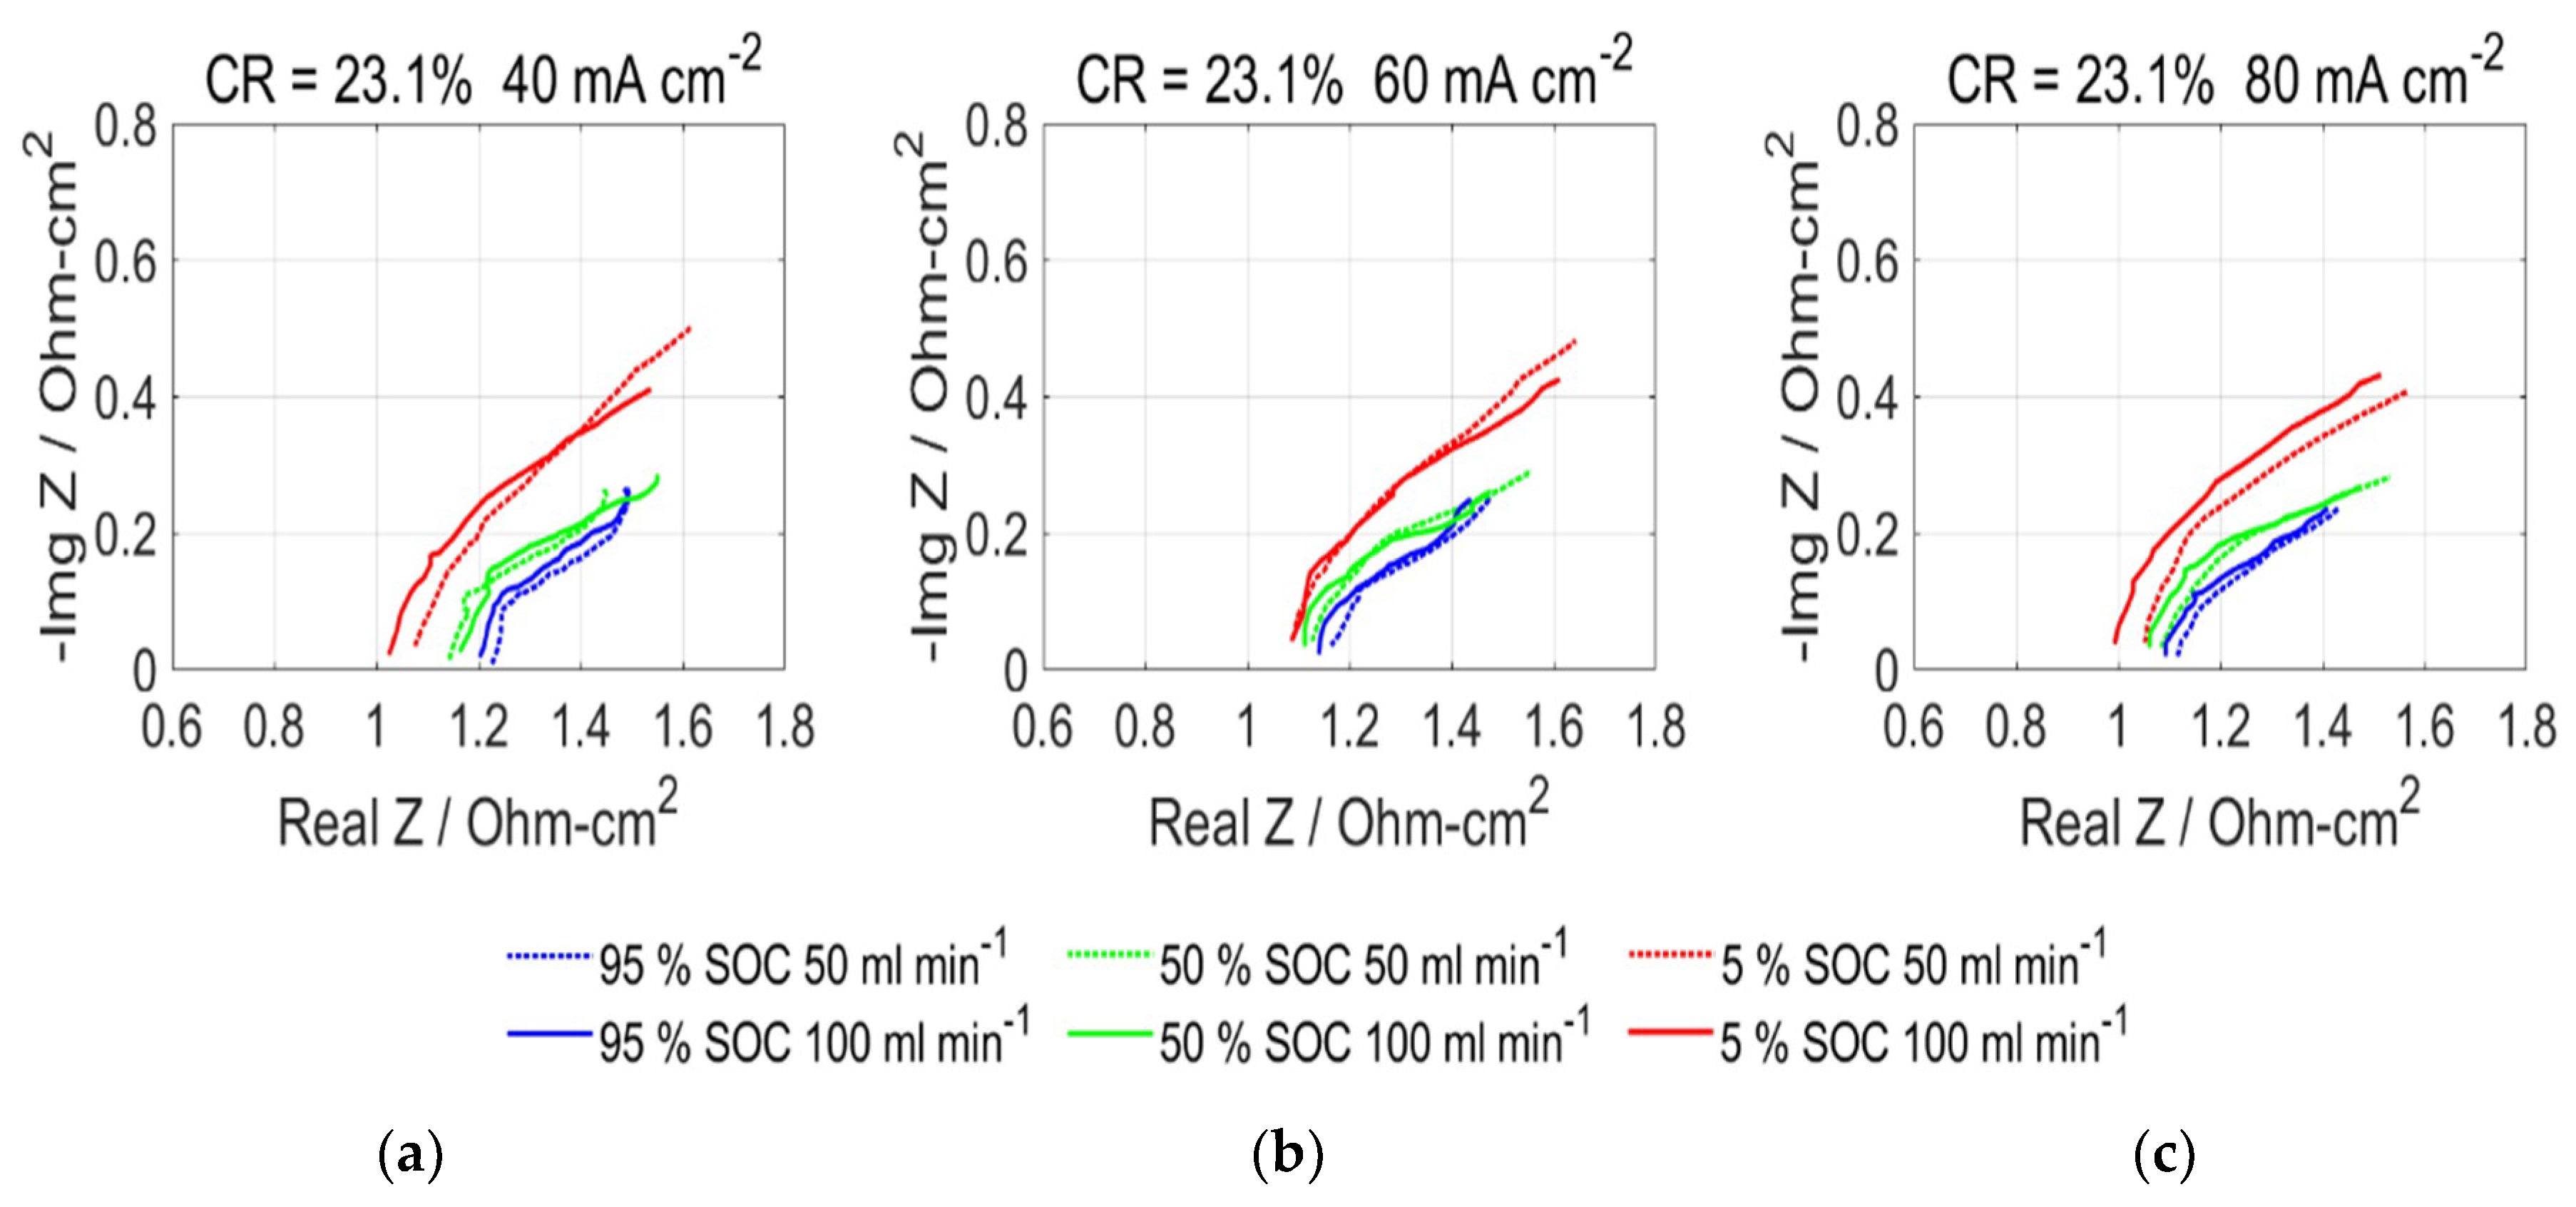
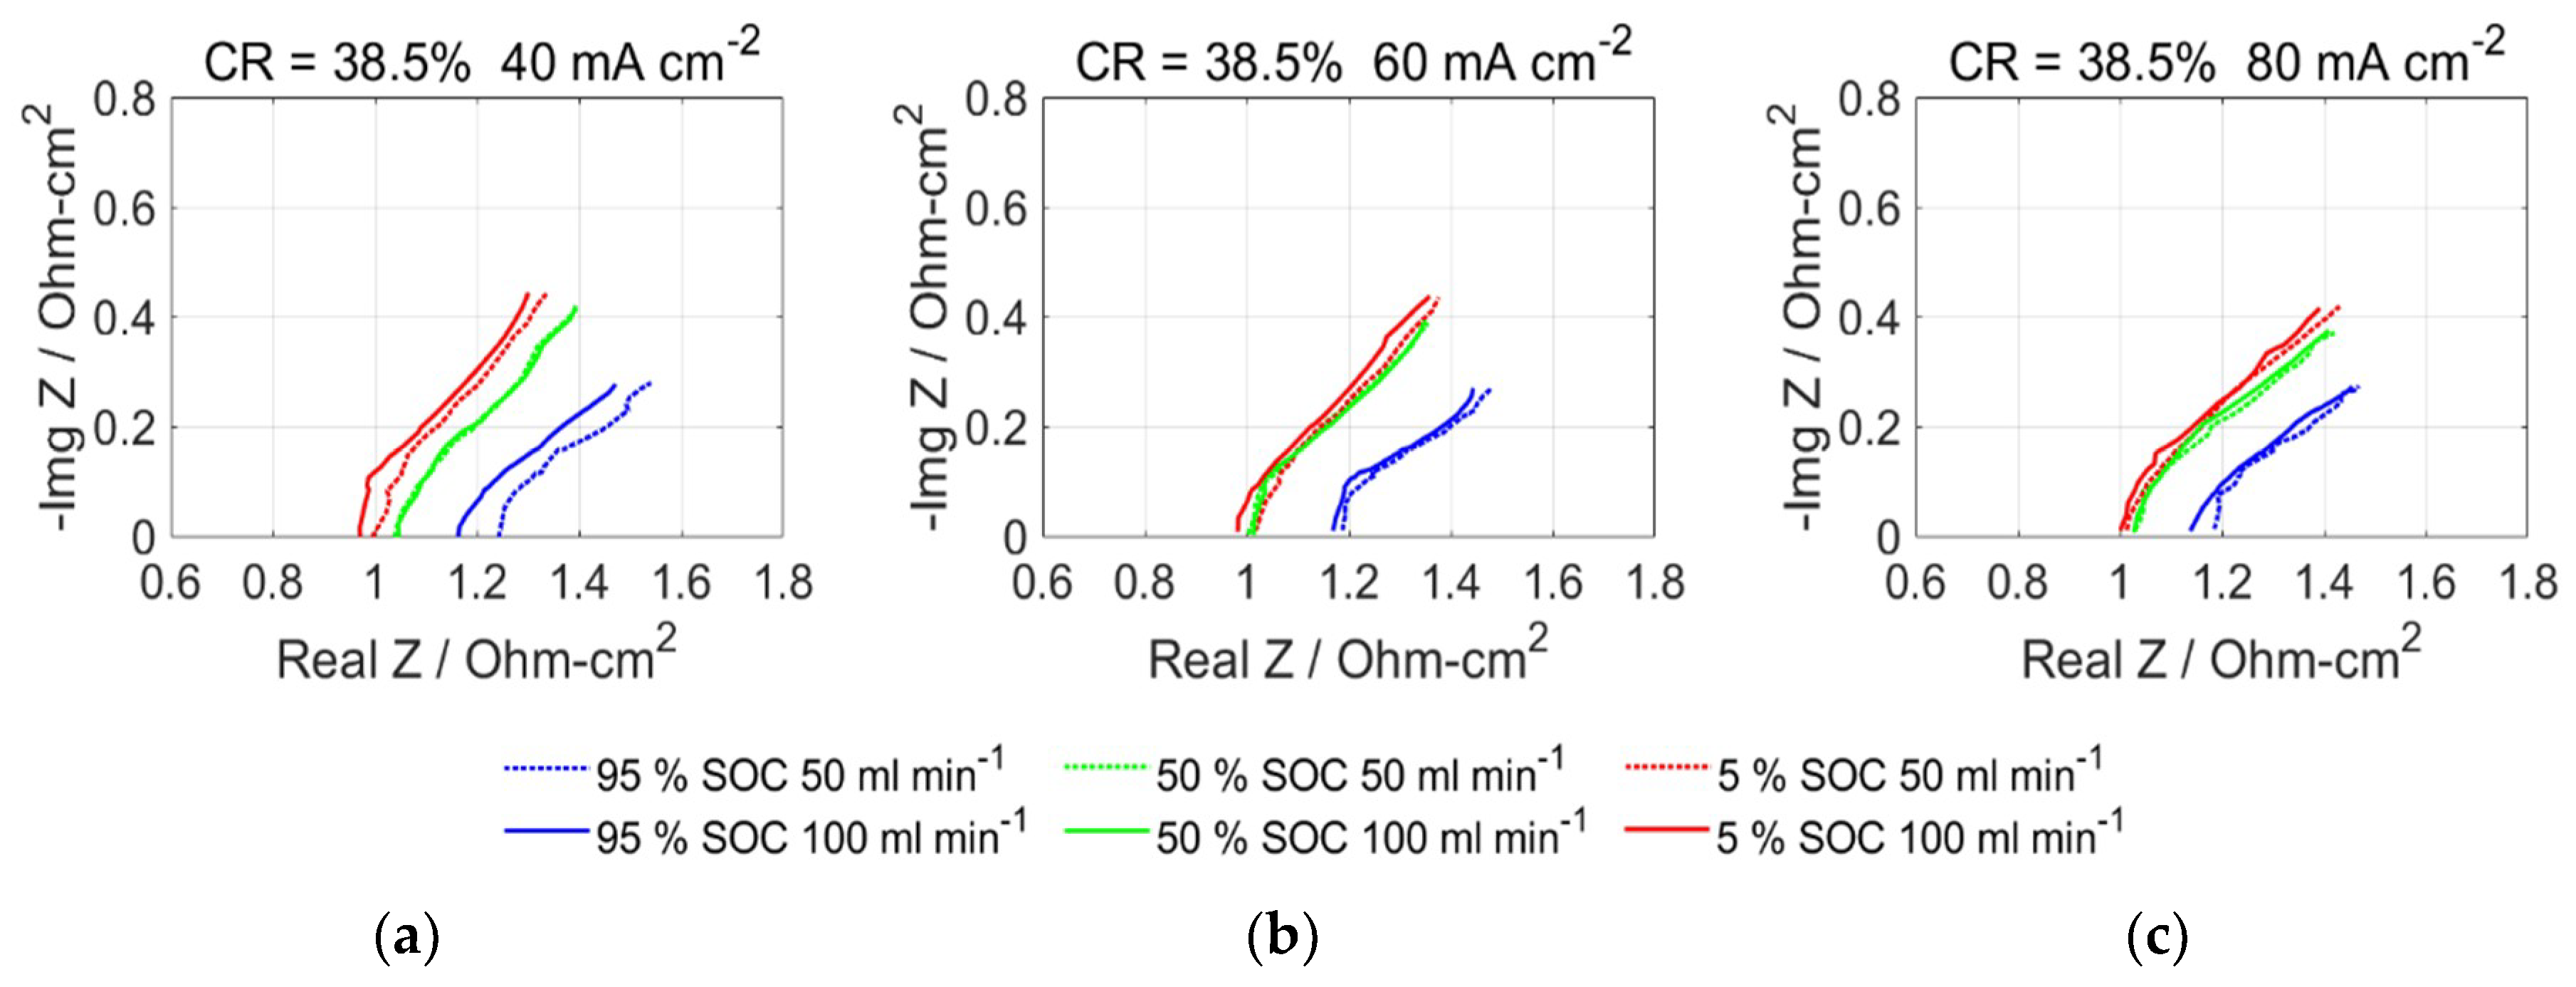
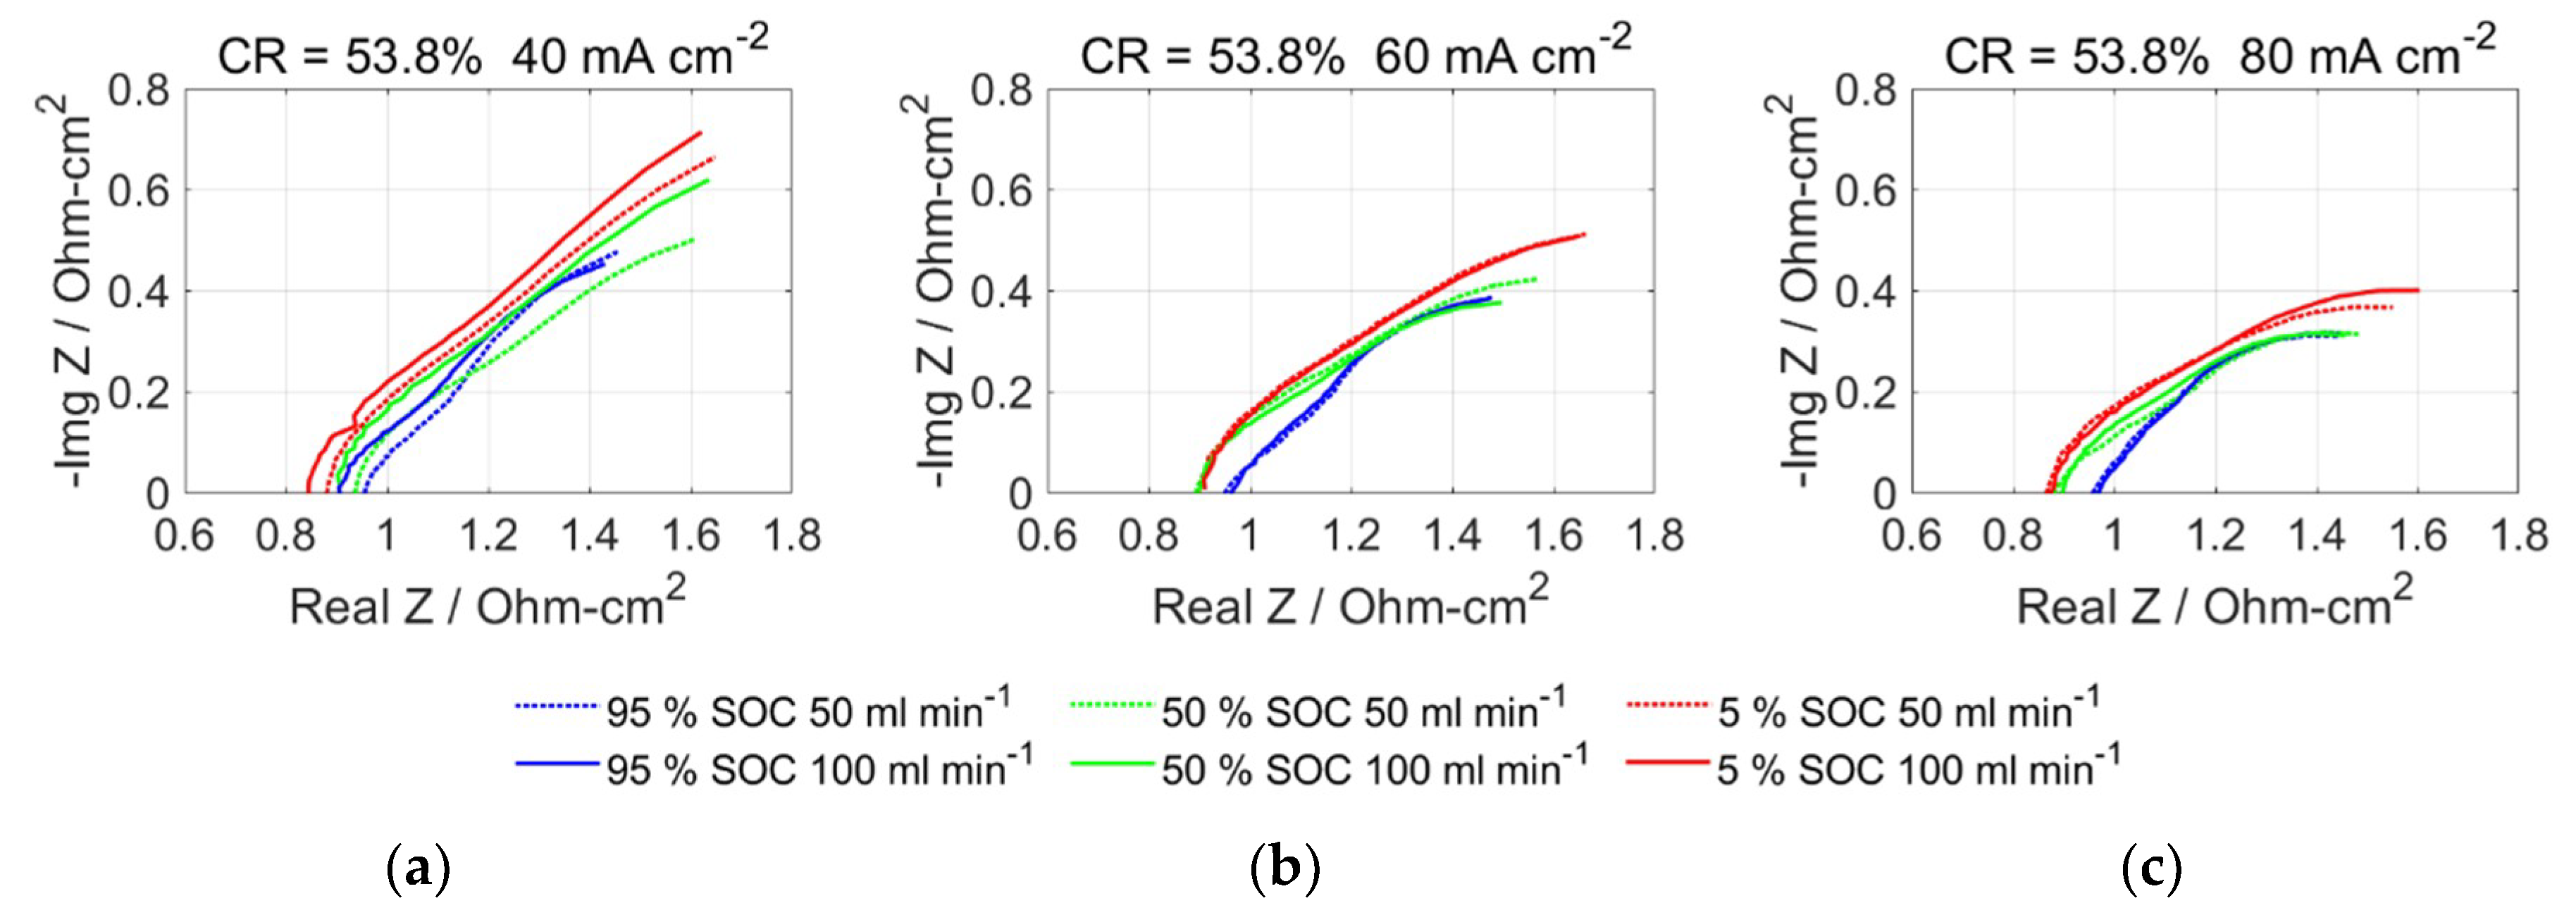
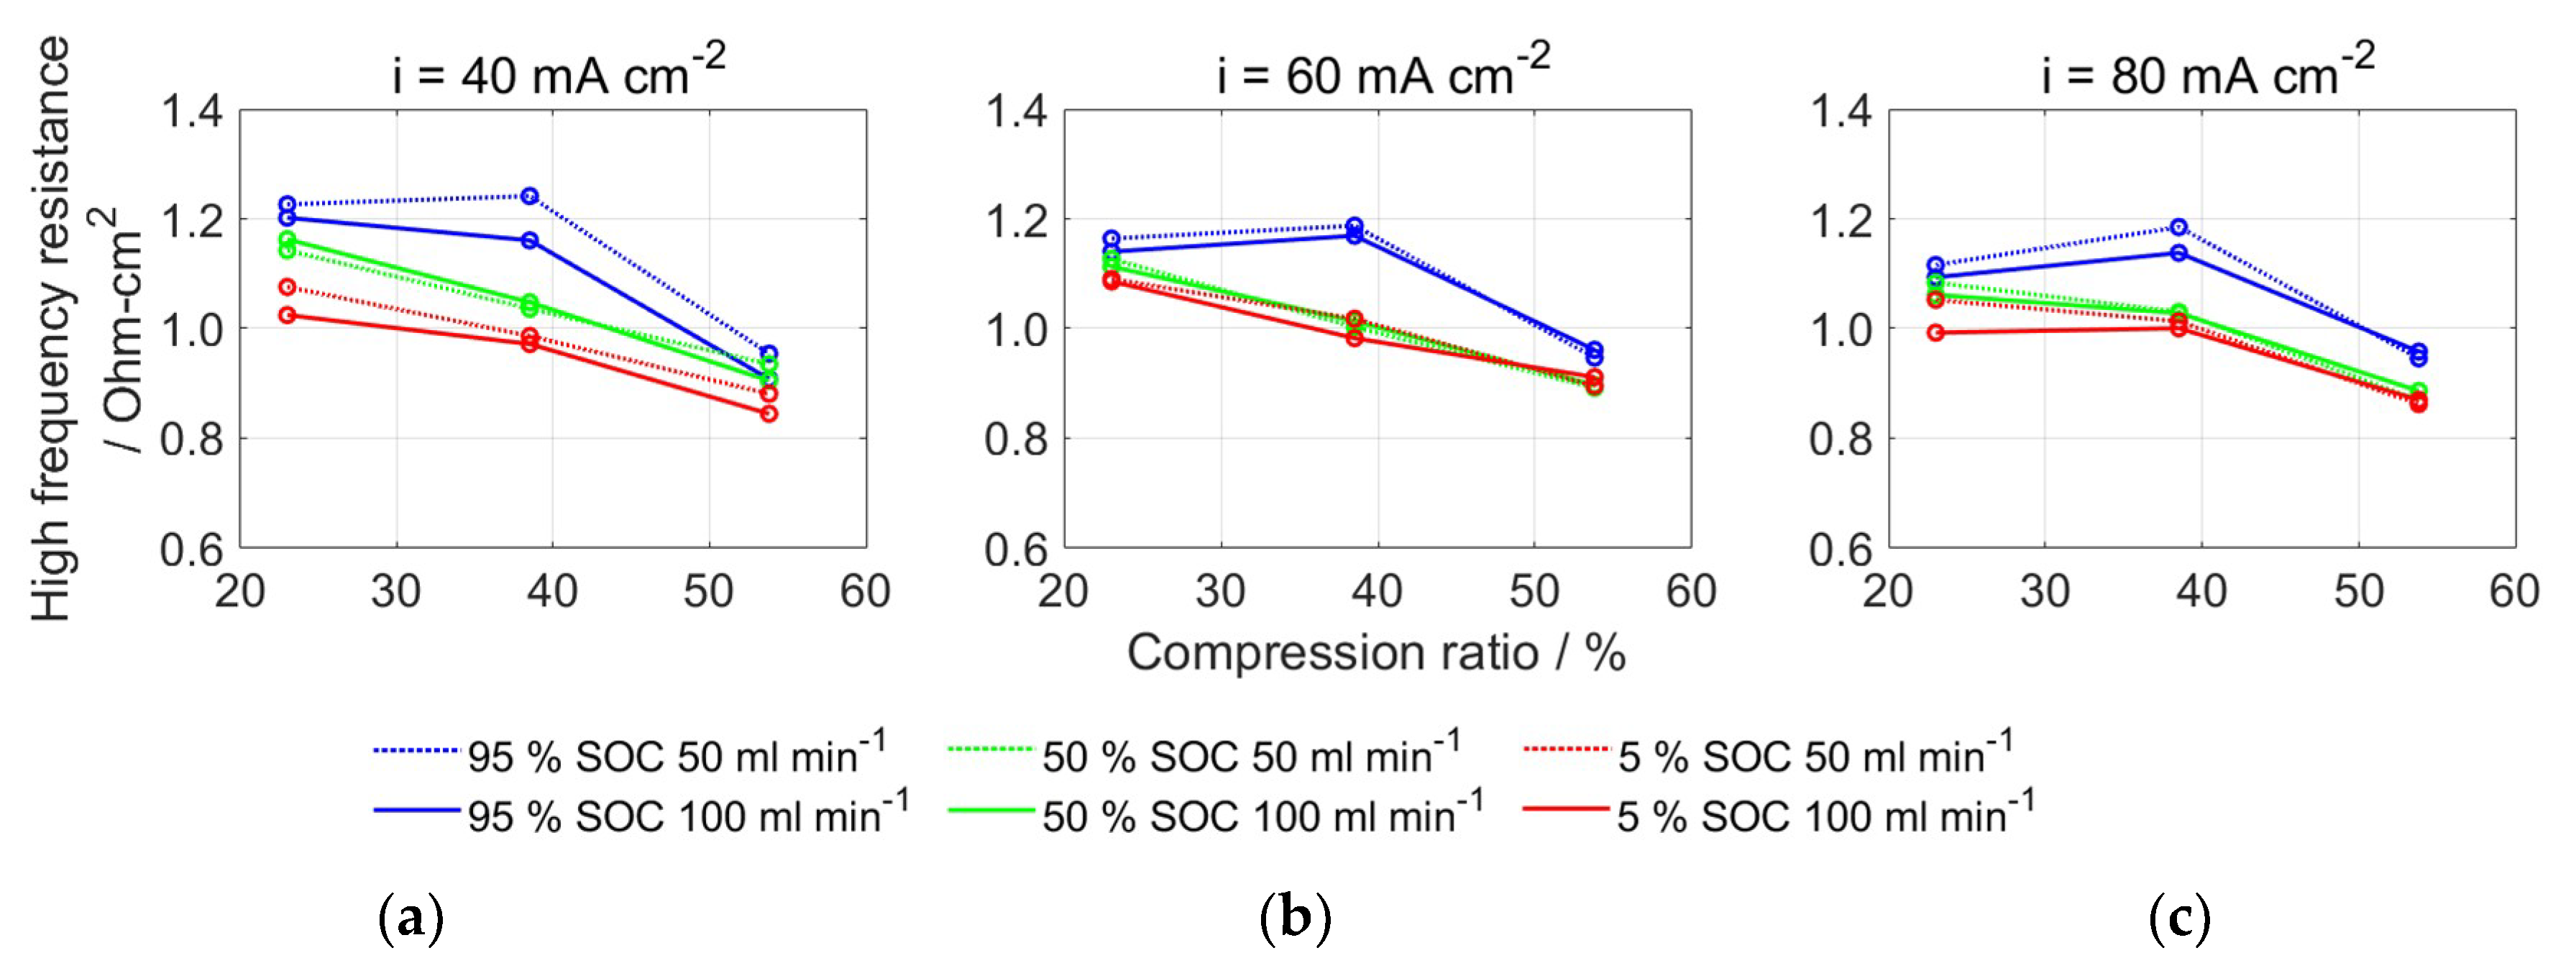
3.2. Effect of Electrode CR on Impedance

The Nyquist plots of the EIS for the VRFB under various operating conditions and a CR of 23.1% is shown in Figure 5. The semi-circles are not completely shown because the scanned frequency ranged only from 20 to 1 kHz to reduce the required measurement time. The impedance measurement at each operating condition was completed in approximately 20 min to reduce the influence of electrolyte concentration variation due to continuous discharge. During discharge, the high-frequency resistance (HFR) ranged between 1 and 1.2 Ω cm2 and reduced with decreasing SOC. The HFR can be attributed to the Nafion 117 membrane, which has a much lower conductivity than the electrolyte: approximately 78 mS cm−1 [22] versus 200–400 mS cm−1 [23], respectively. During discharge on the positive side, a proton is consumed to be combined with VO 2 + , causing a decrease in proton concentration in the positive electrolyte, as shown in Equation (1). As a result, proton transport through the membrane from the negative side to the anode side is enhanced, causing the decrease of HFR.
The HFR was slightly reduced at the higher electrolyte flow rate, as shown by comparing the solid (100 mL min−1) and dashed (50 mL min−1) lines in Figure 5. This may be due to an enhancement of proton transport through the membrane caused by diffusion of the electrolyte by the high flow rate.
Nyquist plots of the VRFB under a CR of 38.5% are shown in Figure 6. The HFRs at an SOC of 95% were similar under a CR of 23.1% and 38.5%. However, the HFR at SOCs of 50% and 5% decreased when the CR was increased to 38.5%. This may be caused by the reduced contact resistance caused by the increased CR. The HFR was consistent among all studied current density levels, implying that a CR of 38.5% is suitable for a wider operating current density range and provides more stable operating conditions for the VRFB, as the VRFB operating with a CR of 38.5% demonstrated the highest energy efficiency, as shown in Figure 4.
When the CR of the graphite electrodes was increased to 53.1%, the HFR dropped below 1 Ω cm2 due to the decrease of contact resistance, as shown in Figure 7. However, the effect of electrolyte flow at current density levels of 60 and 80 mA cm−2 was not noticeable, possibly because the contribution of increased flow speed has reached its upper limit at a CR of 53.1%. Therefore, an increased flow rate of 100 mL min−1 has a limited contribution to the battery performance.
The effect of CR on the HFR of the VRFB under various operating conditions is shown in Figure 8. The HFR decreased with increasing CR for most of the cases except for the operating conditions at the SOC of 95%, in which HFR showed a slight increase when CR increased from 23.1% to 38.5%. A significant decrease of HFR was observed at the CR of 53.8%. However, the VRFB with 53.8%-CR electrodes did not demonstrate the best performance among all cases. The effect of CR on VRFB performance needs further discussion.

3.3. Effect of Electrode CR on Overpotential

When the porous graphite felt electrode is compressed, its porosity and cross-sectional area in the flow direction are reduced, resulting in an increase of flow velocity. The increased velocity helps agitate the electrolyte flow and enhance electrolyte convection on the graphite fiber surface of the electrode, resulting in the decrease of concentration overpotential. The concentration overpotential can be expressed in a general form:
E con = R ¯ T F ln ( i L i L i ) ,
where R is the universal gas constant, T is the operating temperature, F is the Faraday’s constant, i is the operating current density and iL is the limiting current density, determined by [24,25]:
i L = n F k m c b .
In Equation (10), n represents the electrons involved in the redox reaction, cb is the bulk concentration and km is the mass transfer coefficient, which is approximately related by an empirical equation [26]:
k m = 1.6 × 10 4 v 0.4 .
Here, v is the mean electrolyte velocity and can be expressed as [27]
v = Q L avg A felt ε L felt ,
where Q is electrolyte flow rate, Afelt is the cross-sectional area (Afelt = wfelt × tc), ε is the porosity of the electrode, Lavg is the average length of the fluid paths and Lfelt is the geometrical length of the felt. The ratio Lavg/Lfelt is known as the tortuosity of a porous medium and depends on the porosity [28]. The porosity of a compressed graphite felt can be estimated by the equation,
ε = ρ fiber ρ felt ρ fiber ,
where ρ fiber and ρ felt represent the densities of graphite fibers and compressed electrodes, respectively. The effect of varying the CR on these properties, the concentration overpotential and the ohmic overpotential are summarized in Table 1 for the VRFB operating at a current density of 80 mA cm−2 and an SOC of 0.5. Values in Table 1 was calculated with wfelt = 4 × 10⁻² mm and cb = 750 mol m−3). The area resistance can be obtained from Figure 5, Figure 6 and Figure 7.
When the CR increased from 23.1% to 38.5%, both the concentration and ohmic overpotentials decreased by approximately 4 and 2 mV at flow rates of 50 and 100 mL min−1 (Q = 8.33 × 10⁻⁷ and 1.67 × 10⁻⁶ m3 s−1), respectively. When the CR increased further to 53.8%, the concentration and ohmic overpotential decreased by 3.4 mV and 7.2 mV, respectively, at 50 mL min−1 and by 2.1 mV and 10.4 mV, respectively, at 100 mL min−1. This implies that a slight porous electrode compression contributes to both the decrease of concentration and ohmic overpotentials, whereas a considerable compression contributes to the decrease of the ohmic overpotential.

4. Conclusions

The performance and electrochemical impedance of VRFBs assembled with three CRs (23.1%, 38.5% and 53.8%) of graphite felts were measured at various operating conditions. The following conclusions were drawn from the results:
  • An increase of the CR to 38.5% was shown to increase the CE. However, when the graphite felts were over-compressed to a CR of 53.8%, the CE decreased. Additionally, the VE was found to increase with increasing CR. The VRFB with a CR of 38.5% of graphite felts showed an optimum EE of 73% at the operating current density 80 mA cm−2 and electrolyte flow rate 100 mL min−1.
  • Obtained EIS data indicated that HFR is lower when a greater electrolyte flow rate is present. The HFR was shown to reduce with increasing CR. The HFR at a CR of 38.5% showed consistency under all operating current densities, resulting in a maximum EE.
  • A slight compression of a porous electrode was found to contribute to both the decrease of concentration and ohmic overpotentials, whereas a considerable compression contributed mainly to the decrease of the ohmic overpotential.

Author Contributions

Conceptualization and Methodology, C.-L.H.; Data Curation and Visualization, P.-H.T.; Validation and Formal Analysis, N.-Y.H.; Writing-Original Draft Preparation, Y.-S.C.

Funding

Authors would like to thank the Institute of Nuclear Energy Research, Atomic Energy Council of Taiwan, R.O.C. for the financial support for this study under project No. NL1070670.

Conflicts of Interest

The authors declare no conflict of interest.

Nomenclature

Aarea (m2)
cconcentration (mol m−3)
Epotential (V)
FFaraday constant (96485 C mol−1)
icurrent density (A m−2)
kmass transfer coefficient (m s−1)
Llength (m)
nnumber of electron
Qflow rate (m3 s−1)
R ¯ universal gas constant (8.314 kJ kg−1 K−1)
Rarea specific resistance (Ω cm2)
tthickness (m)
Ttemperature (K)
vvelocity (m s−1)
Vcell voltage (V)
Greek Symbols
εporosity
ρ density (g cm−3)
Ωohmic
Superscripts and Subscripts
Avgaverage
chargecharge process
conconcentration
dischargedischarge process
feltfelt
fiberfiber
Llimiting

References

  1. Wang, Y.; Zhang, P.; Li, W.; Xiao, W.; Abdollahi, A. Online overvoltage prevention control of photovoltaic generators in microgrids. IEEE Trans. Smart Grid 2012, 3, 2071–2078. [Google Scholar] [CrossRef]
  2. Tonkoski, R.; Turcotte, D.; El-Fouly, T.H. Impact of high PV penetration on voltage profiles in residential neighborhoods. IEEE Trans. Sustain. Energy 2012, 3, 518–527. [Google Scholar] [CrossRef]
  3. Panchal, S.; Mathew, M.; Fraser, R.; Fowler, M. Electrochemical thermal modeling and experimental measurements of 18650 cylindrical lithium-ion battery during discharge cycle for an EV. Appl. Therm. Eng. 2018, 135, 123–132. [Google Scholar] [CrossRef]
  4. Panchal, S.; Dincer, I.; Agelin-Chaab, M.; Fraser, R.; Fowler, M. Transient electrochemical heat transfer modeling and experimental validation of a large sized LiFePO4/graphite battery. Int. J. Heat Mass Transf. 2017, 109, 1239–1251. [Google Scholar] [CrossRef]
  5. Zhang, X.; Li, Y.; Skyllas-Kazacos, M.; Bao, J. Optimal sizing of vanadium redox flow battery systems for residential applications based on battery electrochemical characteristics. Energies 2016, 9, 857. [Google Scholar] [CrossRef]
  6. Qiu, X.; Nguyen, T.A.; Guggenberger, J.D.; Crow, M.L.; Elmore, A.C. A field validated model of a vanadium redox flow battery for microgrids. IEEE Trans. Smart Grid 2014, 5, 1592–1601. [Google Scholar] [CrossRef]
  7. Li, L.; Kim, S.; Wang, W.; Vijayakumar, M.; Nie, Z.; Chen, B.; Zhang, J.; Xia, G.; Hu, J.; Graff, G.; et al. A stable vanadium redox-flow battery with high energy density for large-scale energy storage. Adv. Energy Mater. 2011, 1, 394–400. [Google Scholar] [CrossRef]
  8. Chang, C.-H.; Chou, H.-W.; Hsu, N.-Y.; Chen, Y.-S. Development of integrally molded bipolar plates for all-vanadium redox flow batteries. Energies 2016, 9, 350. [Google Scholar] [CrossRef]
  9. Chen, Y.-S.; Ho, S.-Y.; Chou, H.-W.; Wei, H.-J. Modeling the effect of shunt current on the charge transfer efficiency of an all-vanadium redox flow battery. J. Power Sources 2018, 390, 168–175. [Google Scholar] [CrossRef]
  10. Hsieh, W.-Y.; Leu, C.-H.; Wu, C.-H.; Chen, Y.-S. Measurement of local current density of all-vanadium redox flow batteries. J. Power Sources 2014, 271, 245–251. [Google Scholar] [CrossRef]
  11. Sun, B.; Skyllas-Kazacos, M. Chemical modification of graphite electrode materials for vanadium redox flow battery application—Part II. Acid treatments. Electrochim. Acta 1992, 37, 2459–2465. [Google Scholar] [CrossRef]
  12. Yue, L.; Li, W.; Sun, F.; Zhao, L.; Xing, L. Highly hydroxylated carbon fibres as electrode materials of all-vanadium redox flow battery. Carbon 2010, 48, 3079–3090. [Google Scholar] [CrossRef]
  13. Kim, K.J.; Kim, Y.-J.; Kim, J.-H.; Park, M.-S. The effects of surface modification on carbon felt electrodes for use in vanadium redox flow batteries. Mater. Chem. Phys. 2011, 131, 547–553. [Google Scholar] [CrossRef]
  14. Agar, E.; Dennison, C.R.; Knehr, K.W.; Kumbur, E.C. Identification of performance limiting electrode using asymmetric cell configuration in vanadium redox flow batteries. J. Power Sources 2013, 225, 89–94. [Google Scholar] [CrossRef]
  15. Pezeshki, A.M.; Clement, J.T.; Veith, G.M.; Zawodzinski, T.A.; Mench, M.M. High performance electrodes in vanadium redox flow batteries through oxygen-enriched thermal activation. J. Power Sources 2015, 294, 333–338. [Google Scholar] [CrossRef] [Green Version]
  16. Chen, J.-Z.; Liao, W.-Y.; Hsieh, W.-Y.; Hsu, C.-C.; Chen, Y.-S. All-vanadium redox flow batteries with graphite felt electrodes treated by atmospheric pressure plasma jets. J. Power Sources 2015, 274, 894–898. [Google Scholar] [CrossRef]
  17. Park, S.-K.; Shim, J.; Yang, J.H.; Jin, C.-S.; Lee, B.S.; Lee, Y.-S.; Shin, K.-H.; Jeon, J.-D. The influence of compressed carbon felt electrodes on the performance of a vanadium redox flow battery. Electrochim. Acta 2014, 116, 447–452. [Google Scholar] [CrossRef]
  18. Chang, T.-C.; Zhang, J.-P.; Fuh, Y.-K. Electrical, mechanical and morphological properties of compressed carbon felt electrodes in vanadium redox flow battery. J. Power Sources 2014, 245, 66–75. [Google Scholar] [CrossRef]
  19. Wang, Q.; Qu, Z.G.; Jiang, Z.Y.; Yang, W.W. Experimental study on the performance of a vanadium redox flow battery with non-uniformly compressed carbon felt electrode. Appl. Energy 2018, 213, 293–305. [Google Scholar] [CrossRef]
  20. Davies, T.J.; Tummino, J.J. High-performance vanadium redox flow batteries with graphite felt electrodes. C 2018, 4, 8. [Google Scholar] [CrossRef]
  21. Ghimire, P.C.; Bhattarai, A.; Schweiss, R.; Scherer, G.G.; Wai, N.; Yan, Q. A comprehensive study of electrode compression effects in all vanadium redox flow batteries including locally resolved measurements. Appl. Energy 2018, 230, 974–982. [Google Scholar] [CrossRef]
  22. Sone, Y.; Ekdunge, P.; Simonsson, D. Proton Conductivity of Nafion 117 as Measured by a four-electrode AC impedance method. J. Electrochem. Soc. 1996, 143, 1254–1259. [Google Scholar] [CrossRef]
  23. Skyllas-Kazacos, M.; Kazacos, M. State of charge monitoring methods for vanadium redox flow battery control. J. Power Sources 2011, 196, 8822–8827. [Google Scholar] [CrossRef]
  24. You, D.; Zhang, H.; Chen, J. A simple model for the vanadium redox battery. Electrochim. Acta 2009, 54, 6827–6836. [Google Scholar] [CrossRef]
  25. Ma, X.; Zhang, H.; Xing, F. A three-dimensional model for negative half cell of the vanadium redox flow battery. Electrochim. Acta 2011, 58, 238–246. [Google Scholar] [CrossRef] [Green Version]
  26. Schmal, D.; Erkel, J.; Duin, P.J. Mass transfer at carbon fiber electrodes. J. Appl. Electrochem. 1986, 16, 422–430. [Google Scholar] [CrossRef]
  27. Bear, J. Dynamics of Fluids in Porous Media; Dover: New York, NY, USA, 1972. [Google Scholar]
  28. Matyka, M.; Khalili, A.; Koza, Z. Tortuosity-porosity relation in porous media flow. Phys. Rev. E 2008, 78, 026306. [Google Scholar] [CrossRef]
Figure 1. Schematic of experimental setup.
Energies 12 00313 g001
Figure 2. Exploded view of the VRFB. A: end plate; B: current collector; C: flexible graphite foil; D: Graphite plate; E: interchangeable frame; F: gasket; G: graphite felt; H: membrane.
Energies 12 00313 g002
Figure 3. Effect of CR on the coulombic, voltage and energy efficiency and discharge capacity of the VRFB operating at 100 mL min−1 under various current density levels: (a) 40 mA cm−2; (b) 60 mA cm−2; (c) 80 mA cm−2.
Energies 12 00313 g003
Figure 4. Effects of CR on the coulombic, voltage and energy efficiency and discharge capacity of the VRFB operating at 50 mL min−1 under various current density levels: (a) 40 mA cm−2; (b) 60 mA cm−2; (c) 80 mA cm−2.
Energies 12 00313 g004
Figure 5. Nyquist plots of EIS of the VRFB under various operating conditions at CR = 23.1%: (a) 40 mA cm−2; (b) 60 mA cm−2; (c) 80 mA cm−2.
Energies 12 00313 g005
Figure 6. Nyquist plots of EIS of the VRFB under various operating conditions at CR = 38.5%: (a) 40 mA cm−2; (b) 60 mA cm−2; (c) 80 mA cm−2.
Energies 12 00313 g006
Figure 7. Nyquist plots of EIS of the VRFB under various operating conditions at CR = 53.8%: (a) 40 mA cm−2; (b) 60 mA cm−2; (c) 80 mA cm−2.
Energies 12 00313 g007
Figure 8. Effects of CR on the high frequency resistance of the VRFB operating under various operating conditions: (a) 40 mA cm−2; (b) 60 mA cm−2; (c) 80 mA cm−2.
Energies 12 00313 g008
Table 1. Impact of varying CRs on VRFB properties at an operating current density of 80 mA cm−2 and SOC of 0.5.
CR (%)εLavg/LfeltQ (m3 s−1)V (m s−1)km (m s−1)iL (A m−2)Econ (mV)RΩ (Ω cm2)Eohm (mV)
23.10.9331.058.33 × 10−74.69 × 10−31.87 × 10−5135523.11.0886.4
1.67 × 10−69.37 × 10−32.47 × 10−5178815.41.0684.8
38.50.9161.078.33 × 10−76.08 × 10−32.08 × 10−5150419.61.0382.4
1.67 × 10−61.22 × 10−32.74 × 10−5198513.31.0382.4
53.80.8881.098.33 × 10−78.52 × 10−32.38 × 10−5172116.20.9475.2
1.67 × 10−61.70 × 10−33.14 × 10−5227111.20.9072.0

