Integrated Control Strategy for Inductive Power Transfer Systems with Primary-Side LCC Network for Load-Average Efficiency Improvement

1
Department of Electrical and Computer Engineering, Sungkyunkwan University, 2066, Seobu-ro, Jangan-gu, Suwon-si, Gyeonggi-do 16419, Korea
2
Automotive Research & Development Division, Hyundai Motor Group, 150, Hyundaiyeonguso-ro, Namyang-eup, Hwaseong-si, Gyeonggi-do 18280, Korea
*
Author to whom correspondence should be addressed.
Energies 2019, 12(2), 312; https://doi.org/10.3390/en12020312
Submission received: 13 December 2018
/
Revised: 11 January 2019
/
Accepted: 18 January 2019
/
Published: 19 January 2019
(This article belongs to the Special Issue Wireless Power for Electric Vehicles)
Abstract
:An inductive power transfer (IPT) system has lower peak efficiency and significantly lower load-average efficiency over the entire range of output power than typical power conversion systems because it transmits power wirelessly through magnetically coupled coils. In order to improve the load-average efficiency of the IPT system, this paper proposes an integrated control strategy consisting of full-bridge, phase-shift, and half-bridge control modes. The coupling coefficient and output power conditions for each control mode are theoretically analyzed, and the proposed control algorithm is established. In order to verify the analysis results, a 3.3 kW IPT system prototype is constructed, and it is experimentally verified that the load-average efficiency is improved by up to 3.75% with respect to the output power when using the proposed control scheme. In addition, the proposed control has the additional advantage that it can be directly applied to the existing IPT system without changing or adding hardware.
1. Introduction
Efficiency is an essential factor for evaluating the performance of power conversion systems (PCSs). Recently, owing to the development of next-generation power electronic devices, such as gallium nitride (GaN) and silicon carbide (SiC) devices, many DC–DC converters have achieved a peak efficiency of 98–99% [1,2,3]. However, in an inductive power transfer (IPT) system for electric vehicles (EVs), the peak efficiency from the DC link to the DC battery load is still 95–96%, and load-average efficiency, which is averaged over the entire range of output power, is much lower than the typical DC–DC converters [4,5,6,7,8]. This is because the IPT system has loosely coupled primary and secondary coils that transmit power through a wide air gap [9]. A major factor exists that makes it difficult and challenging to improve the efficiency of the IPT system: the coupling coefficient k between the two coils is small compared to that of a typical transformer, and it varies with respect to the vertical distance changes and horizontal misalignment, which depend on the type of vehicle, tire pressure, and parking position. Thus, the efficiency of the IPT system for EVs is inherently lower than other PCSs [10,11].
Various studies have been conducted to solve the efficiency problem of the IPT system, including optimization of PCSs, improvement of resonant networks, and methods for impedance tuning. First, a diode rectifier and a DC–DC converter on the secondary side of the IPT system have been replaced with a semi-bridgeless rectifier with phase-shift (PS) control to reduce the number of power conversion stages [6,12]. In addition, the switches of the semi-bridgeless rectifier have been changed to GaN switches with synchronous rectification control, and maximum efficiency of >93% was achieved [13]. However, in order to control the secondary-side active rectifier, the switching signals should be synchronized with the high-frequency resonant voltage or current on the secondary side. For this reason, very accurate frequency or phase detection circuits, along with additional driving circuits, are necessary, and the computational complexity of the microcontrol unit is thus increased. For improvement of resonant networks, a double-sided LLC compensation network has been analyzed and a peak efficiency of >96% from the DC source to the battery load has been achieved [7,8]. However, the secondary-side LLC resonant network can decrease the driving distance of an EV because its passive components decrease power density and increase the weight of the secondary-side system. An impedance tuning method, using an additional secondary DC–DC converter to change the effective output resistance, has been proposed, leading to an efficiency of 91% and dynamic tuning against the variation of k [14]. However, an additional power conversion stage is needed; this additional stage requires a driving circuit, which reduces the power density of the secondary system.
As previously mentioned, most of the previous studies focused on increasing the peak efficiency. The improvement of the light-load efficiency, which is the main cause of the decrease in load-average efficiency, has not been actively studied. The light-load efficiency can be improved by reducing the load-independent current. In the case of primary-side LCC networks, which have been widely used in IPT systems, the primary coil current is independent of the load and coupling coefficient variations at the resonant frequency [15,16,17]. The reduction of this current can improve the light-load efficiency and the coil-to-coil efficiency, which is the main cause of decreased efficiency of the IPT system. Therefore, in order to improve the load-average efficiency by reducing the primary coil current, this paper proposes an integrated control strategy consisting of full-bridge (FB) control, PS control, and half-bridge (HB) control. In the proposed control strategy, the HB control is added to the conventional control scheme, which is composed of FB and PS controls. The main purpose of the additional HB control is to reduce unnecessary primary coil current under conditions where the coupling coefficient is high enough and the output power is low enough to allow sufficient power transfer. The proposed control strategy has the following advantages:
- (1)
- The proposed control method increases the coil-to-coil efficiency and the light load efficiency by reducing the load-independent primary coil current in the primary LCC network. This means that the proposed control can improve the load-average efficiency.
- (2)
- Hardware changes or additional components are not required, hence making it easier to apply the proposed control to the existing IPT system [17]. Moreover, it is possible to maintain the secondary power density and weight, so that the driving distance of EVs is not reduced.
This paper is organized as follows: The operating principle and selection of the control mode for the proposed control are analyzed in Section 2. The proposed control algorithm, which is designed according to the analysis results, is explained in Section 3. The theoretical analysis and the proposed algorithm are experimentally verified in Section 4, and the advantages of the proposed control are summarized in Section 5.
2. Analysis of Proposed Control Strategy
2.1. Configuration and Specifications of IPT System
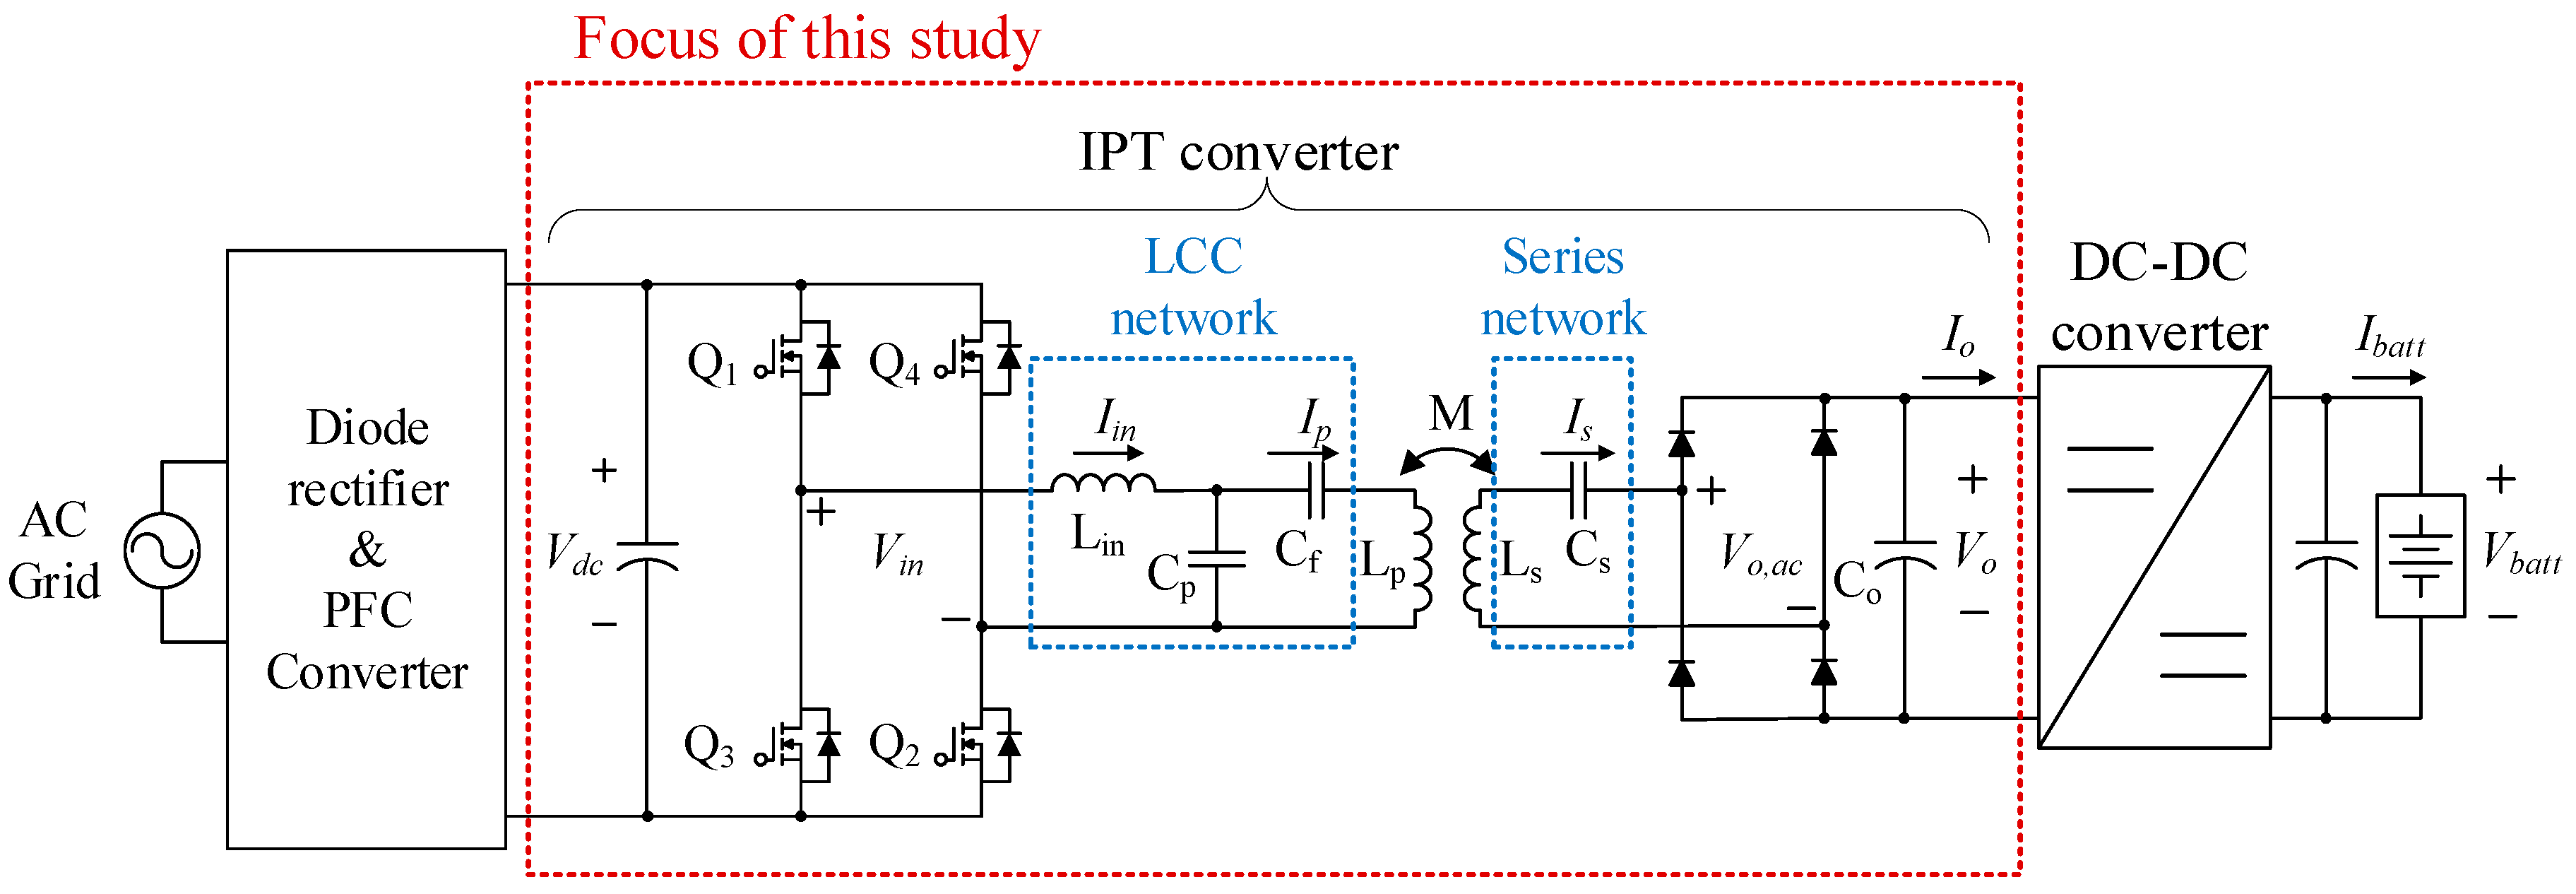
Figure 1 represents a schematic diagram of a 3.3 kW IPT system for EVs. There is a power factor correction (PFC) converter between the AC grid and the DC link, and there is an FB inverter consisting of four switches (Q1–Q4) after the PFC converter. Primary- and secondary-side resonant networks are used to compensate for the leakage inductance of the coils, and the AC equivalent output voltage of the resonant network Vo,ac is rectified to output voltage Vo by a diode rectifier. In this paper, an IPT converter is defined as a converter that includes an FB inverter, resonant networks, and a diode rectifier. Following the IPT converter, a DC–DC converter is connected for battery charging control. Regarding the IPT coils, Lp and Ls are self-inductances of the primary and secondary coils, and M is the mutual inductance between the two coils. The coupling coefficient k is measured with respect to vertical distances and horizontal misalignment tolerances. Because the IPT coils are loosely coupled through a large air gap, the magnetic coupling intensity of the two coils is significantly weaker than that of a typical transformer, as shown in Table 1. As a result, the efficiency of the IPT converter is far lower than that of the primary PFC converter and the secondary DC–DC converter. Therefore, this paper focuses on improving the load-average efficiency of the IPT converter to increase overall system efficiency.
2.2. Analysis of Proposed Control
As shown in Figure 1, the primary-side LCC network and the secondary-side series network are employed. This network has two significant characteristics. First, the primary current, Ip, is constant—independent of k and the output power—at the resonant point, as shown in (1) [17]. This load-independent current is a direct cause of the decrease in the light-load efficiency.
Second, because of the constant Ip, the secondary induced voltage is only proportional to k [17]; output voltage, Vo, is also constant and independent of the output power, but it is proportional to k, as shown in (2) [17].
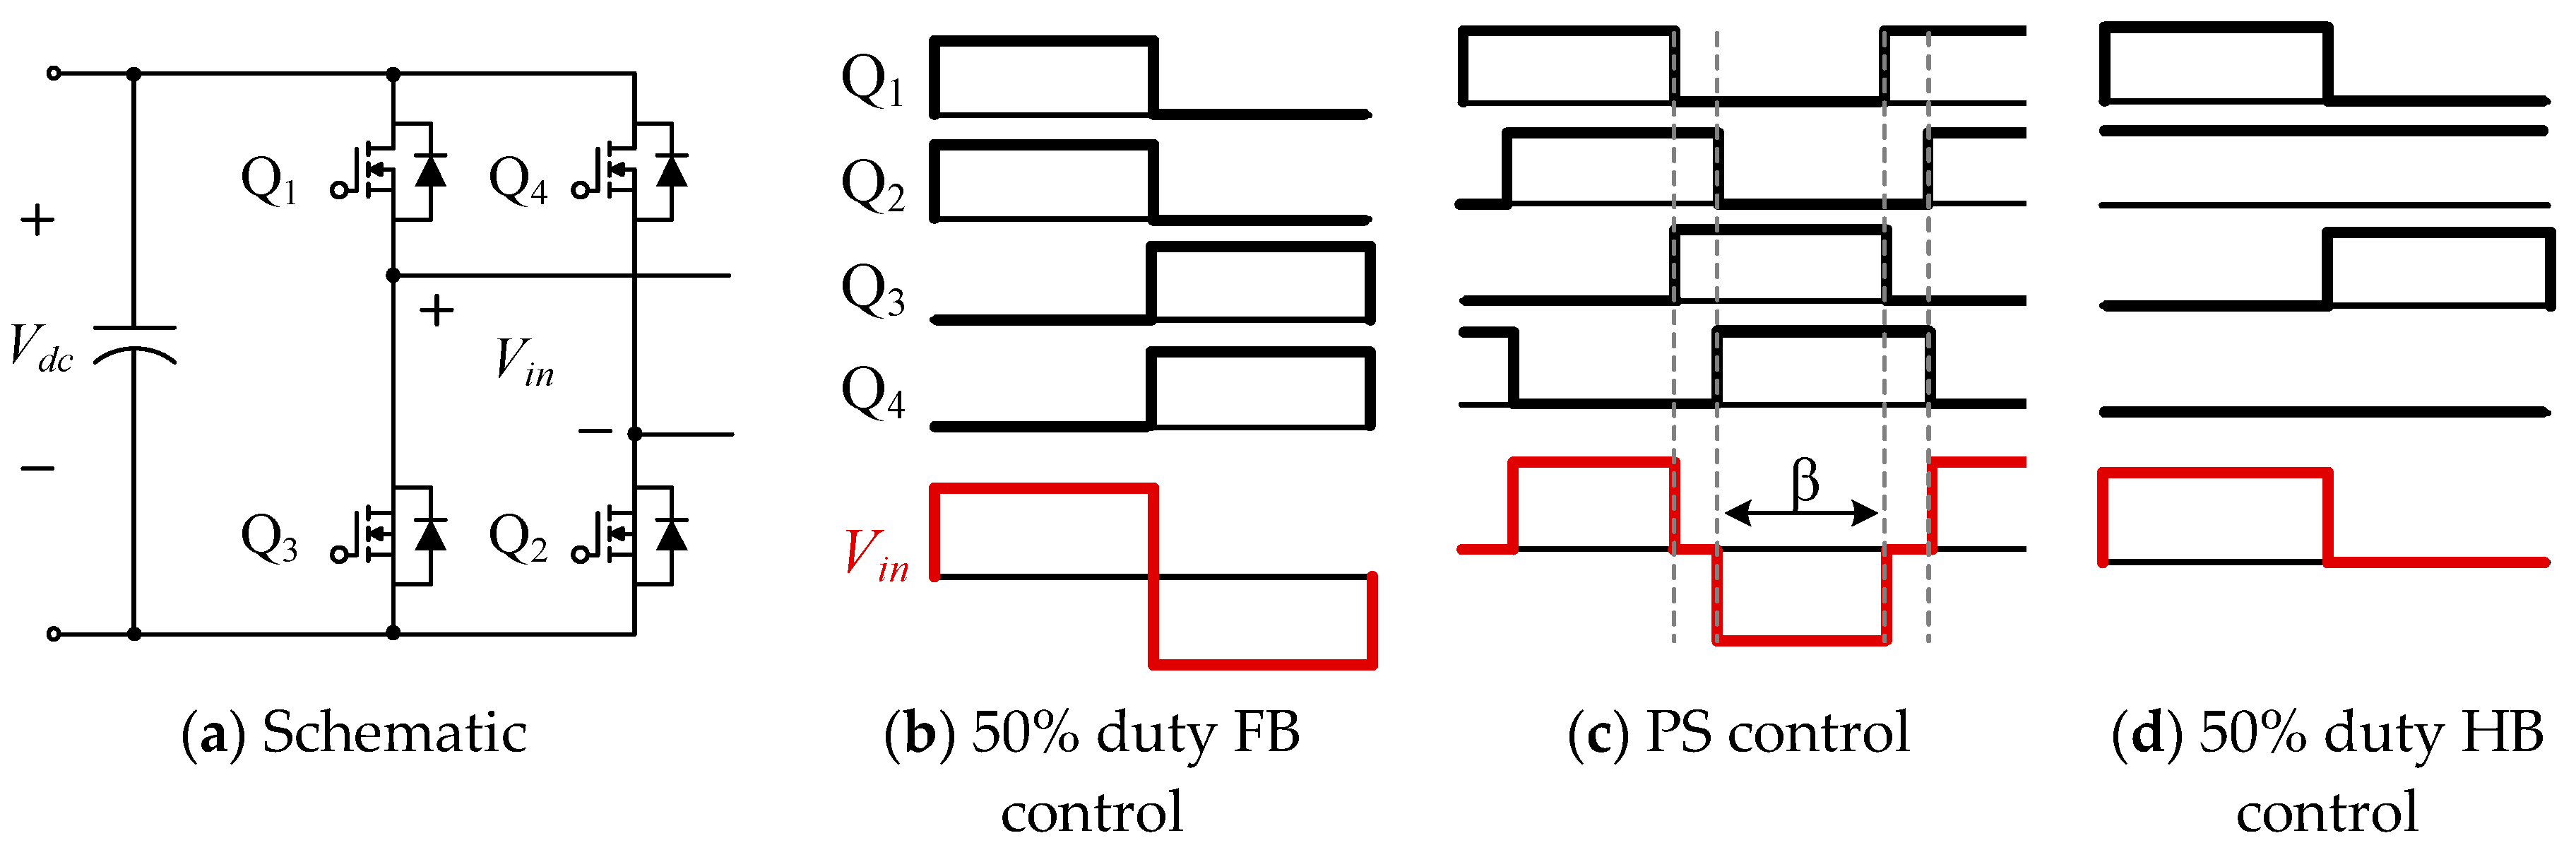
The minimum value of Vo is designed to be 165 V under the minimum-k condition by selecting the maximum boosting ratio of the secondary DC–DC converter as 2.5, and the input voltage of the DC–DC converter is designed to be 165–450 V considering the voltage rating of power electronic devices. With this design, when the primary-side inverter is controlled with 50% duty FB control, and Vo increases to 576 V under the maximum-k condition, it results in damage to the DC–DC converter [17]. The excessive output voltage can be prevented by decreasing Ip, as Ip induces a voltage at the secondary coil. Because Ip is proportional to the input voltage, Vin, as indicated by (1), Ip decreases when Vin is reduced. Therefore, in a previous study, when Vo exceeded 450 V, Vo was limited at 450 V through the application of input voltage cancellation control, such as PS control [17]. However, because the input current, Iin, increases as Vin is cancelled under the same output condition, the current value when the switch is turned off becomes large; thus, the switching loss increases, which reduces the light-load efficiency. Therefore, in this paper, 50% duty HB control is proposed for reducing Ip and improving the light-load efficiency. However, as shown in Table 1, because the IPT system for EVs has a wide range of output power, it is difficult to operate under all output power conditions via only HB control. Thus, in this paper, FB control, PS control, and HB control are combined in accordance with k and output power conditions. Figure 2 presents a schematic of the FB inverter and the switching signals of the three control methods. As shown, the fundamental root-mean-square (RMS) value of Vin is the largest under FB control, and the RMS value of Vin is decreased by the voltage cancellation under PS control [18]. When HB control is applied, the RMS value of Vin is decreased by half compared to the case when FB control is applied [19]. Ip and Vo are also decreased by half owing to the decreased Vin, but Iin and Is, which are load-dependent currents, are doubled at the same output condition.
Table 2 shows the relative value of voltages and currents depending on the control modes under the same output power condition and load dependencies of voltages and currents of the network. As shown, when HB control is applied, the light-load efficiency can be improved owing to the decreasing load-independent Ip, but the load-dependent currents are doubled; thus, the efficiency can decrease if the output power increases. When HB control is applied under the low-k condition, the input voltage condition of the DC–DC converter cannot be satisfied, because the output voltage of the IPT converter is reduced by half compared to the case when FB control is applied. Therefore, when applying HB control, the k condition and the output power condition should be considered simultaneously. The k and the output power conditions applicable to HB control are analyzed in Section 2.3.
2.3. Selection of Control Mode
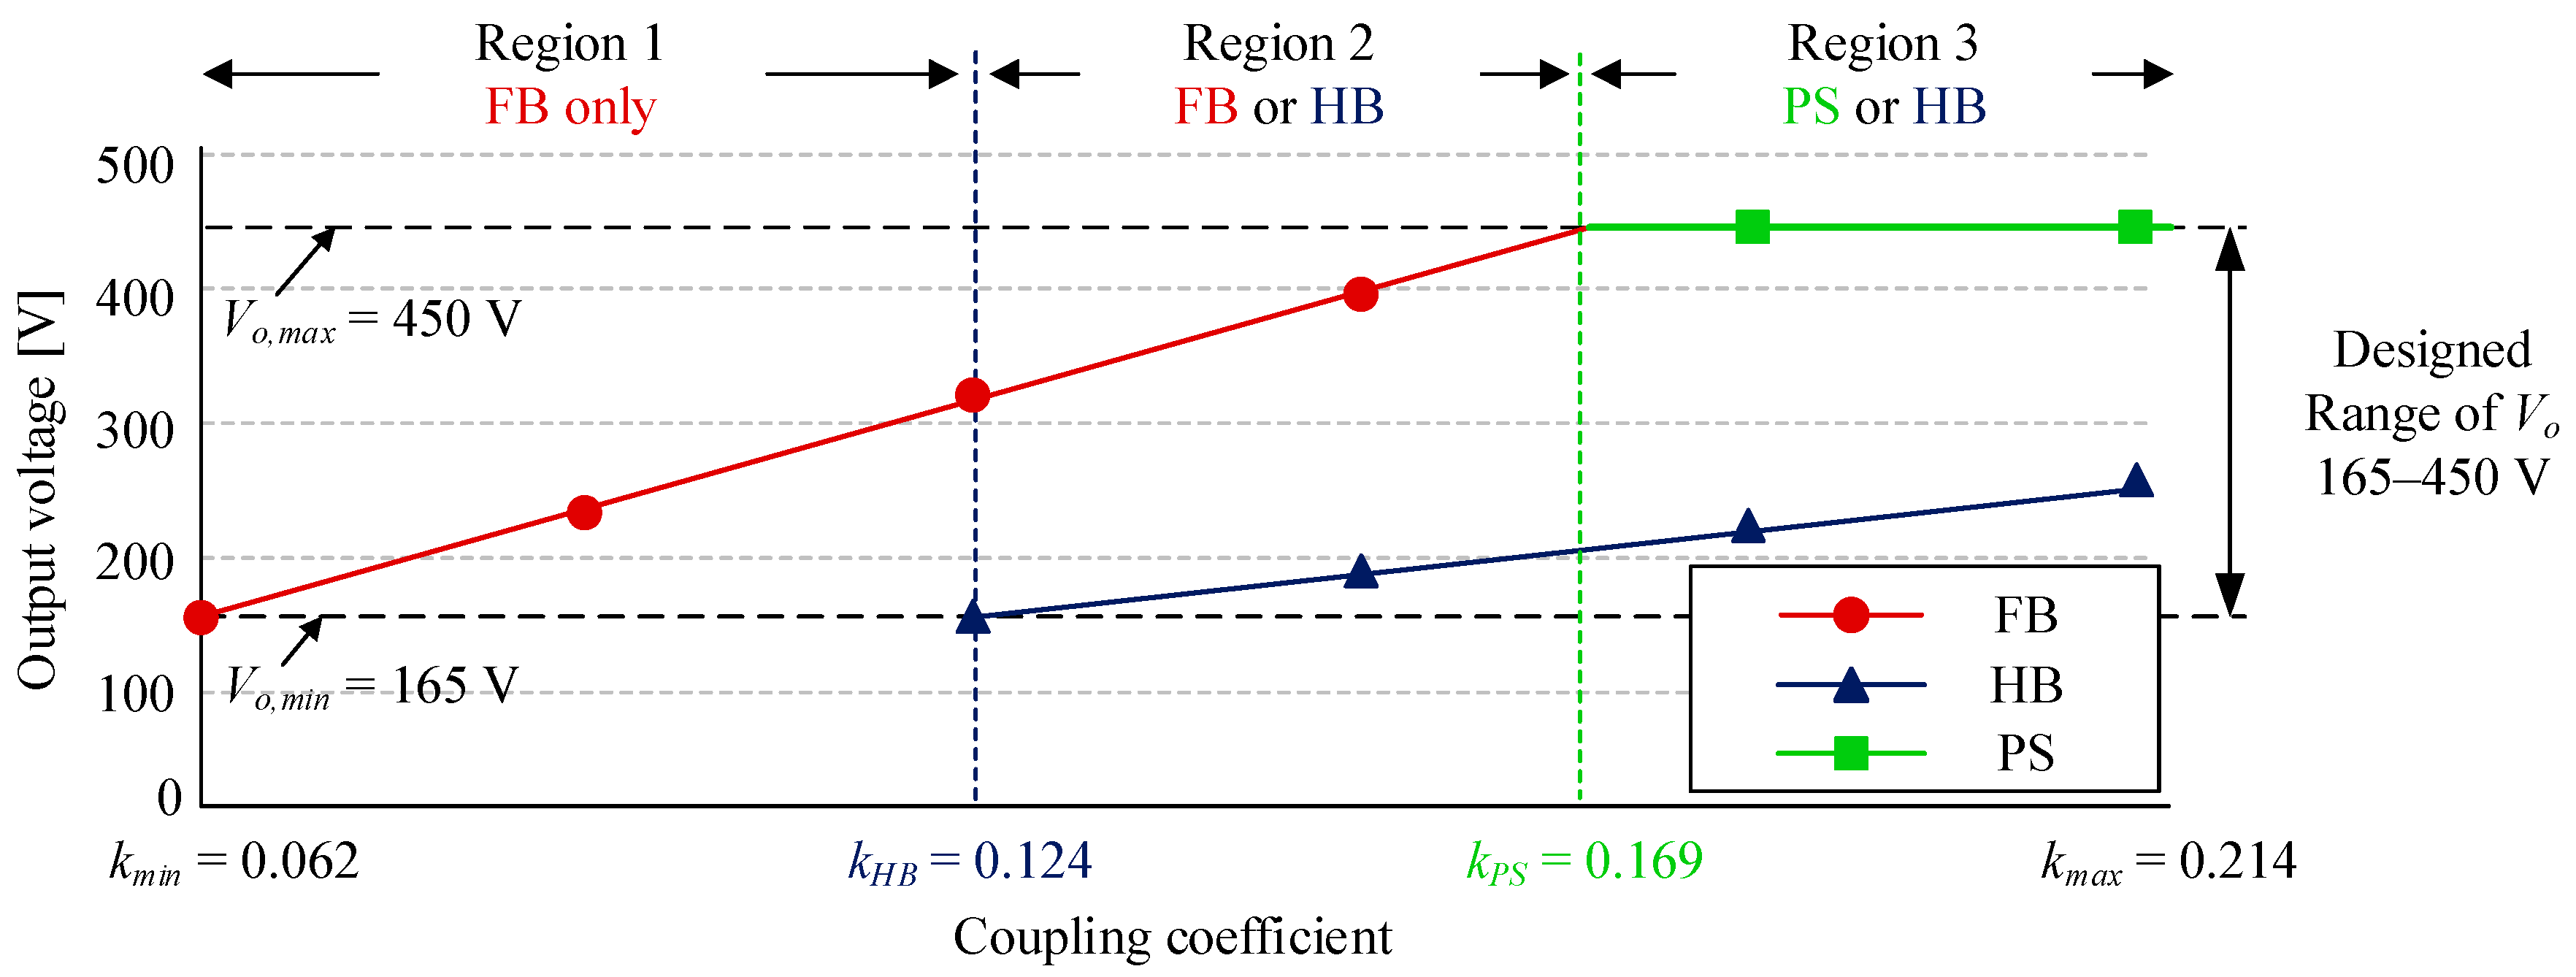
Because Vo is directly related to the variation of k, and Vo varies greatly depending on the control mode, Vo with respect to k and the control mode is analyzed first in order to select an appropriate control mode. Figure 3 presents a graph of Vo with respect to k and shows the applicable control mode in the corresponding k condition. Because the design range of Vo is 165–450 V, HB control cannot be applied when k is lower than kHB = 0.124. Therefore, region 1, which is applicable to FB control only, is selected from k = 0.062 to kHB. In region 2, where Vo is greater than 330 V and less than 450 V, FB control and HB control can be selectively applied, and the k range of region 2 is kHB to kPS = 0.169. As in region 3, PS control and HB control can be selectively applied in the case of kPS where Vo starts to exceed 450 V under FB control to kmax = 0.214 in the maximum-k condition.
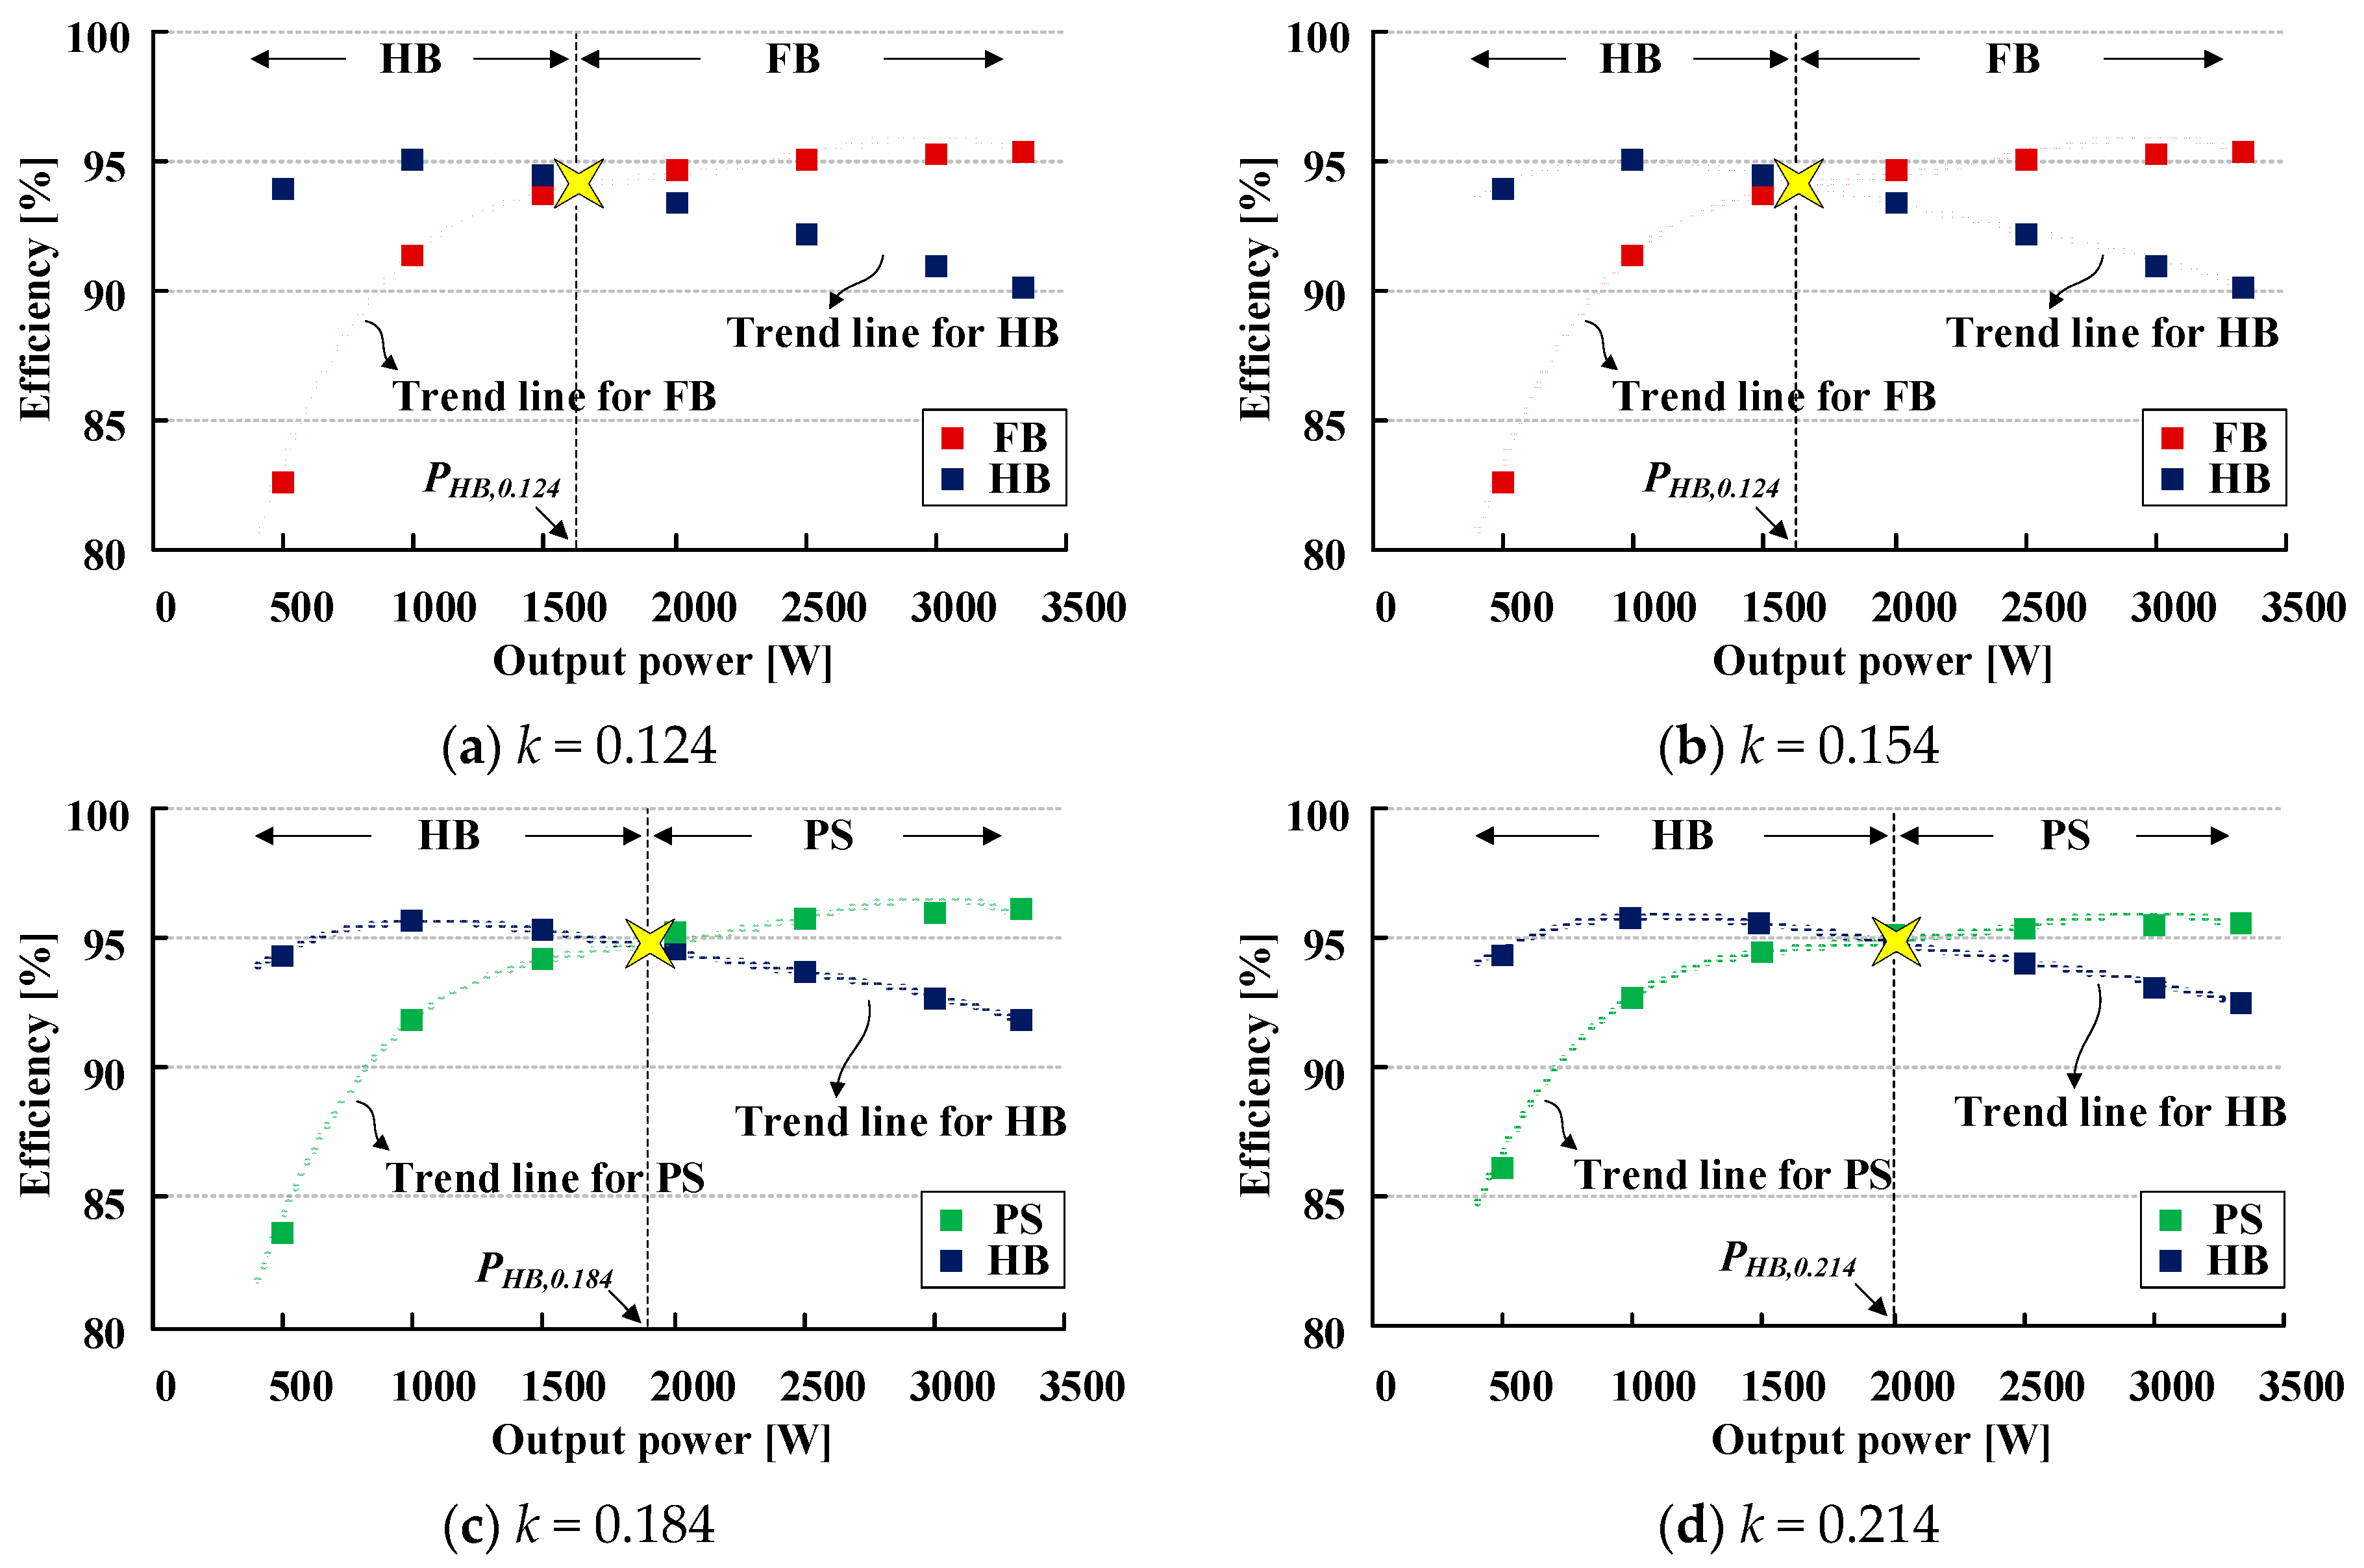
As analyzed in Section 2.2, it is expected that FB control and PS control under the heavy-load condition, and HB control under the light-load condition, are advantageous with regard to efficiency. Therefore, for high-efficiency operation under all output power conditions, it is necessary to select the efficiency crossing point through loss analysis with respect to the control mode employed. In the loss analysis, conduction and switching losses of power electronic devices are derived using parameters in datasheets and the PSIM simulation tool [20,21,22], and losses of the passive components in the resonant network are also considered [23,24]. However, ferrite and aluminum losses in the primary and secondary pads are not considered because of their non-linear properties with respect to the operating temperature and frequency. Figure 4 shows the numerical efficiency graphs obtained through loss analysis with respect to the control modes in each k condition (kHB to kmax) and the efficiency crossing point selection results at each k condition. The method of selecting the efficiency crossing point, PHB,k, is as follows.
- (1)
- Draw the efficiency graphs for each control mode in each k condition through numerical loss analysis.
- (2)
- Derive a trend line for each graph and its function using a graph analysis tool. As shown in Figure 4, the trend line for each efficiency graph is depicted as a dashed line by using the data points at 500 W intervals of the output power. In this study, the trend lines are derived as fourth-order functions to improve the accuracy of the efficiency crossing point prediction.
- (3)
- Calculate the intersection of the two derived functions using a function analysis tool.
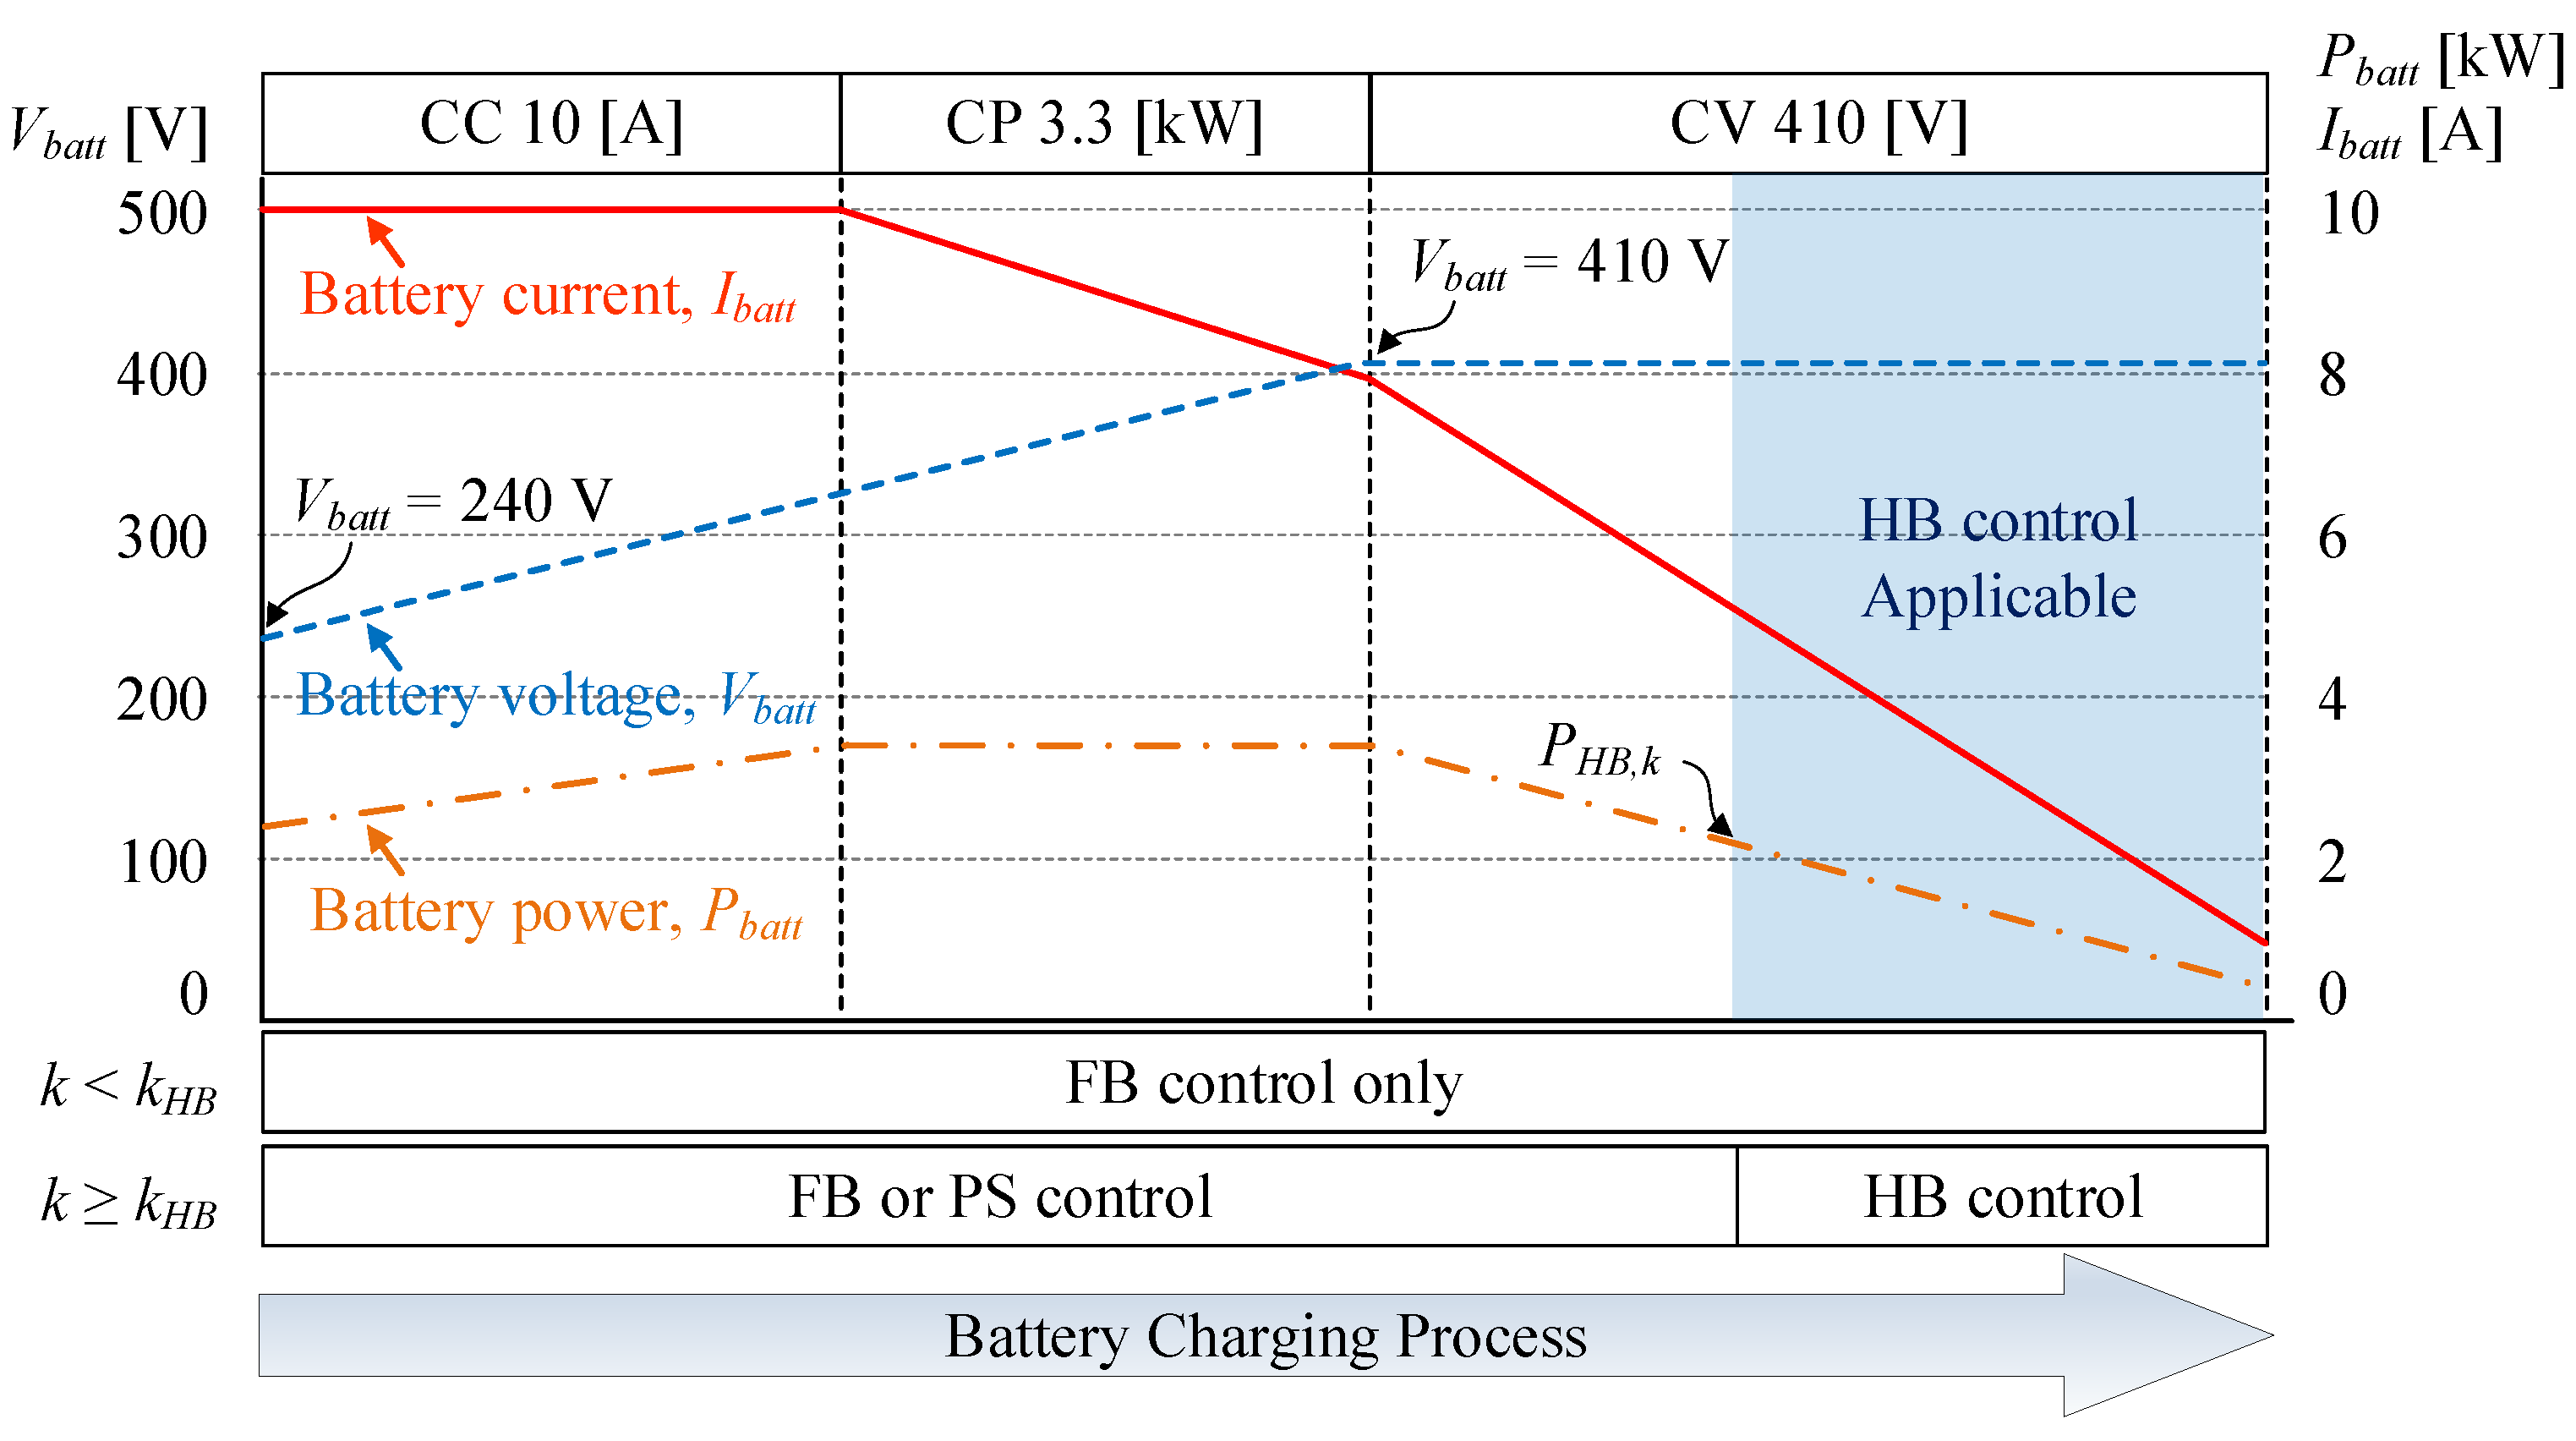
According to the PHB,k selection results, the final control mode of the proposed scheme is selected. As shown in Figure 4, HB control is applied in the region where the output power is lower than PHB,k, and FB control or PS control is applied in the region where the output power is higher. Figure 5 shows a charging profile of an EV battery pack which has 10 A constant current (CC) charging region, 3.3 kW constant power (CP) charging, and 410 V constant voltage (CV) charging region. As shown in Figure 5, since HB control can achieve a higher efficiency under lower output power conditions than the selected PHB,k, it can be applied in the shaded part of the CV region where the light-load region appears. As a result, the IPT system can operate with a high efficiency over the entire load region when the proposed control is applied at the higher k conditions.
3. Algorithm Implementation for Proposed Control
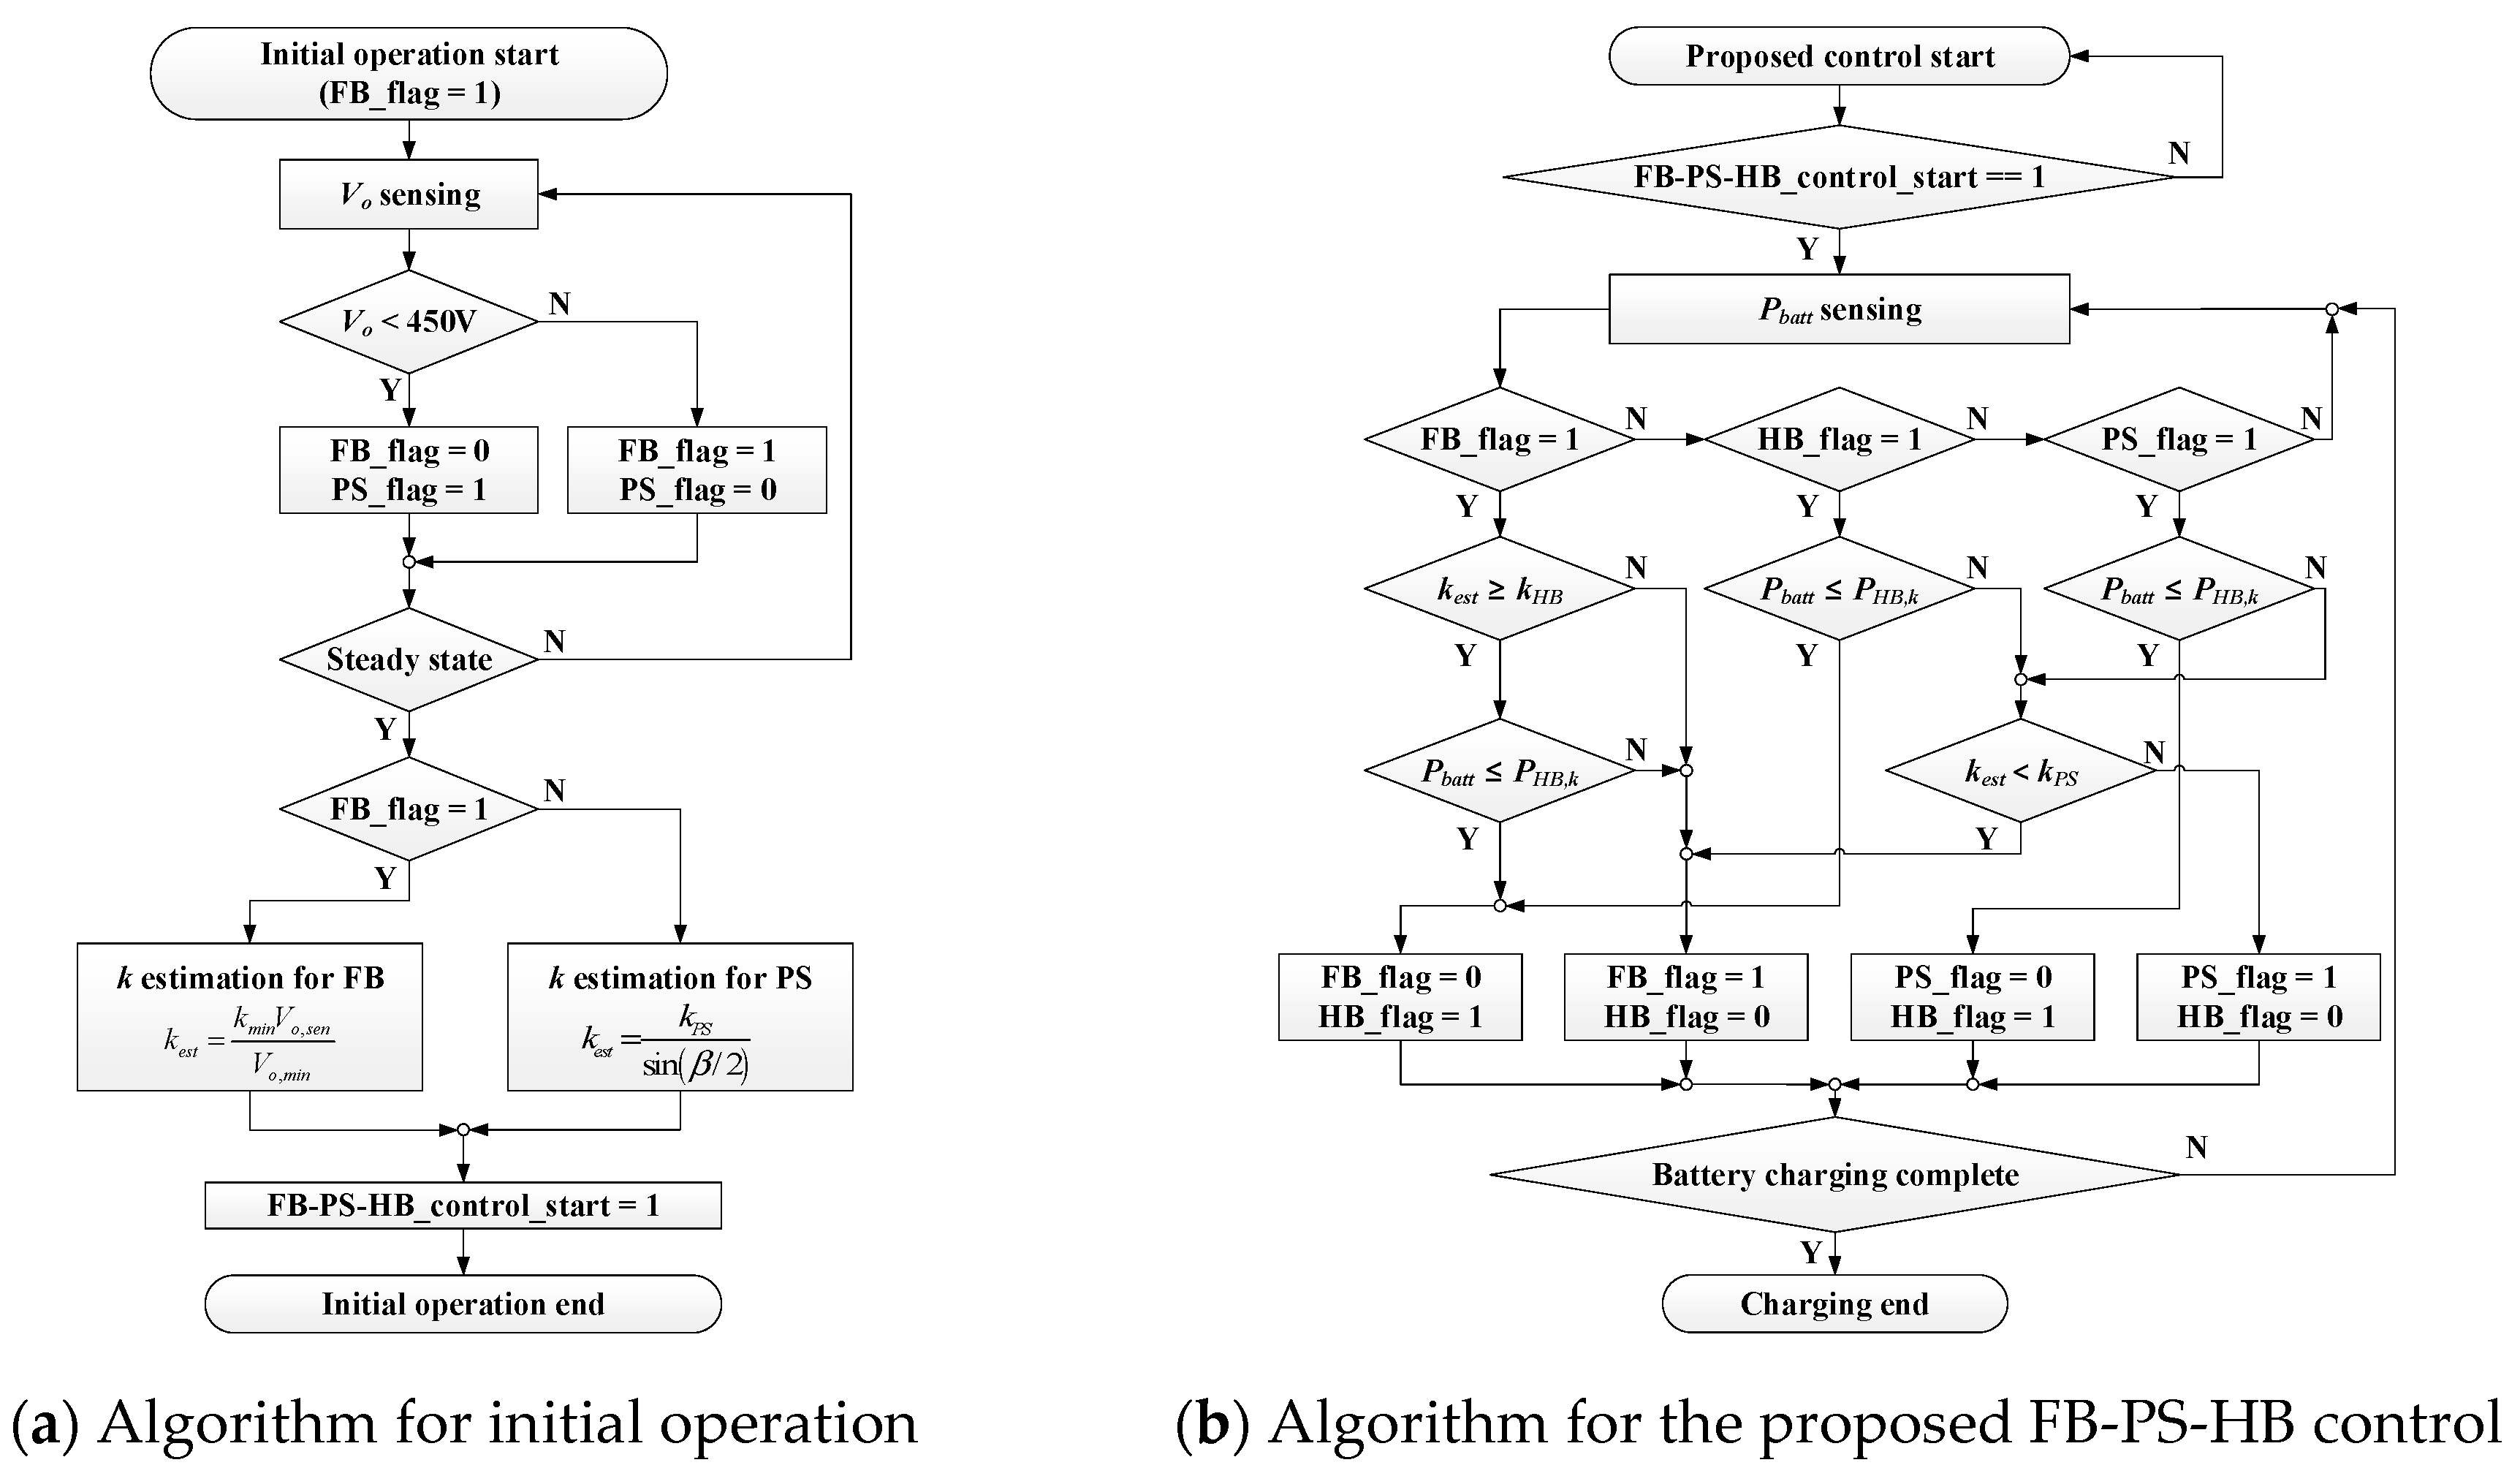
Figure 6 shows the proposed control algorithm, which is divided into two steps. The first step is the initial operating algorithm, as shown in Figure 6a, and requires two assumptions. First, after the EV is parked and charging is started, it is assumed that the EV does not move. That is, k does not change after charging begins. The second assumption is that the system always starts charging with FB control initially because the k and output power conditions are unknown. In the actual charging situation, because the output capacitor Co of the IPT converter is initially empty, Vo rises from zero in the transient state when charging begins with FB control. If Vo does not exceed 450 V in the steady state, the controller maintains FB control. Under the FB control, because of the constant output voltage characteristic of LCC-S network, k can be estimated with the sensed output voltage Vo,sen, the designed minimum output voltage Vo,min, and kmin, as shown in (3).
After the k estimation, the controller determines whether HB control with respect to the output power condition can be applied under the existing k condition. On the other hand, if Vo exceeds 450 V in the initial transient state, the controller switches from FB control to PS control, and a conduction angle β is controlled in order to limit Vo to 450 V as shown in Figure 2c. Under PS control, since the fundamental RMS value of Vin is changed by β of PS control [18,25], the PS-controlled input voltage Vin,PS is expressed using the FB-controlled input voltage Vin,FB, as shown in (4).
Then, the PS-controlled output voltage Vo,PS is derived using β and the output voltage Vo,FB (assuming that FB control is applied) as shown in (5).
Therefore, the equation for the k estimation is derived as (6).
As shown in Figure 6b, when the initial operation is completed, FB-PS-HB control starts. The controller selects the final operation mode using the estimated coupling coefficient, kest, and the sensed battery power, Pbatt. According to the analysis results in Section 2.3, when kest is smaller than kHB (kest < kHB), FB control is applied regardless of the output power condition. When kest is greater than or equal to kHB and less than kPS (kHB ≤ kest < kPS), HB control is applied if Pbatt is less than or equal to PHB,k (Pbatt ≤ PHB,k), and FB control is applied if Pbatt is greater than PHB,k (Pbatt > PHB,k). Similarly, when kest is greater than or equal to kPS (kest ≥ kPS), PS control or HB control is also applied depending on the output power condition.
4. Experimental Results
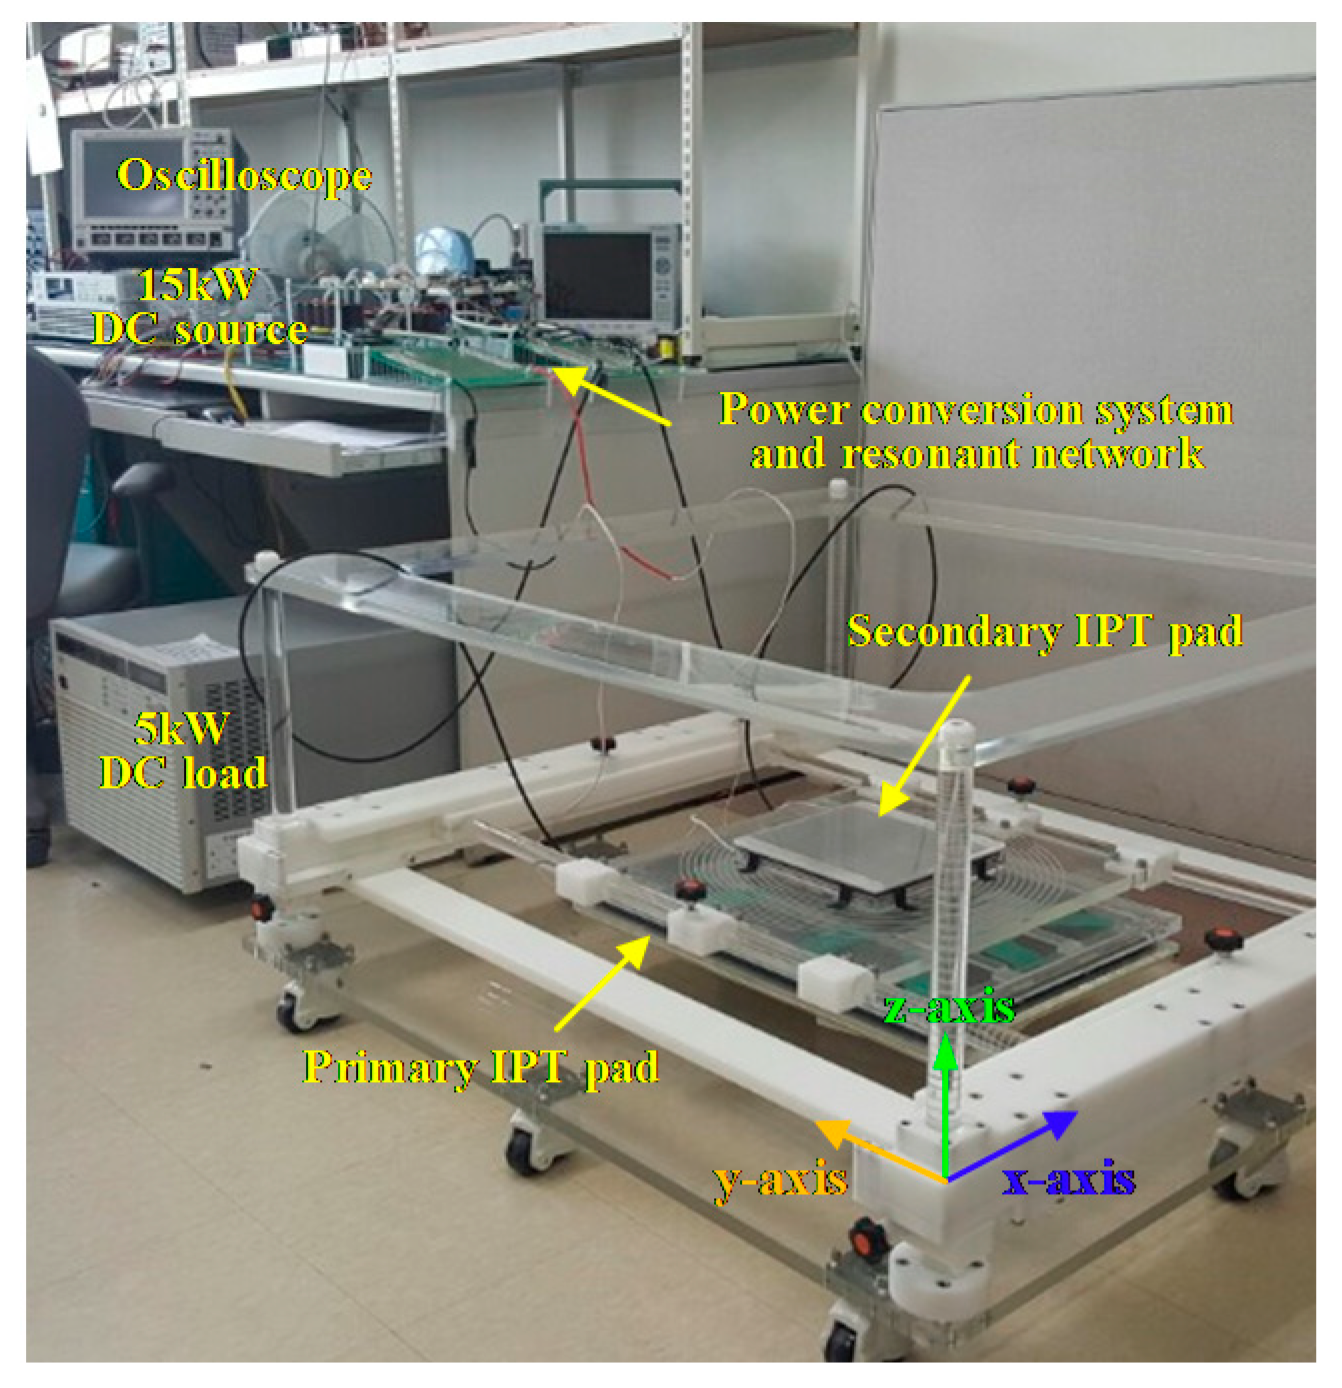
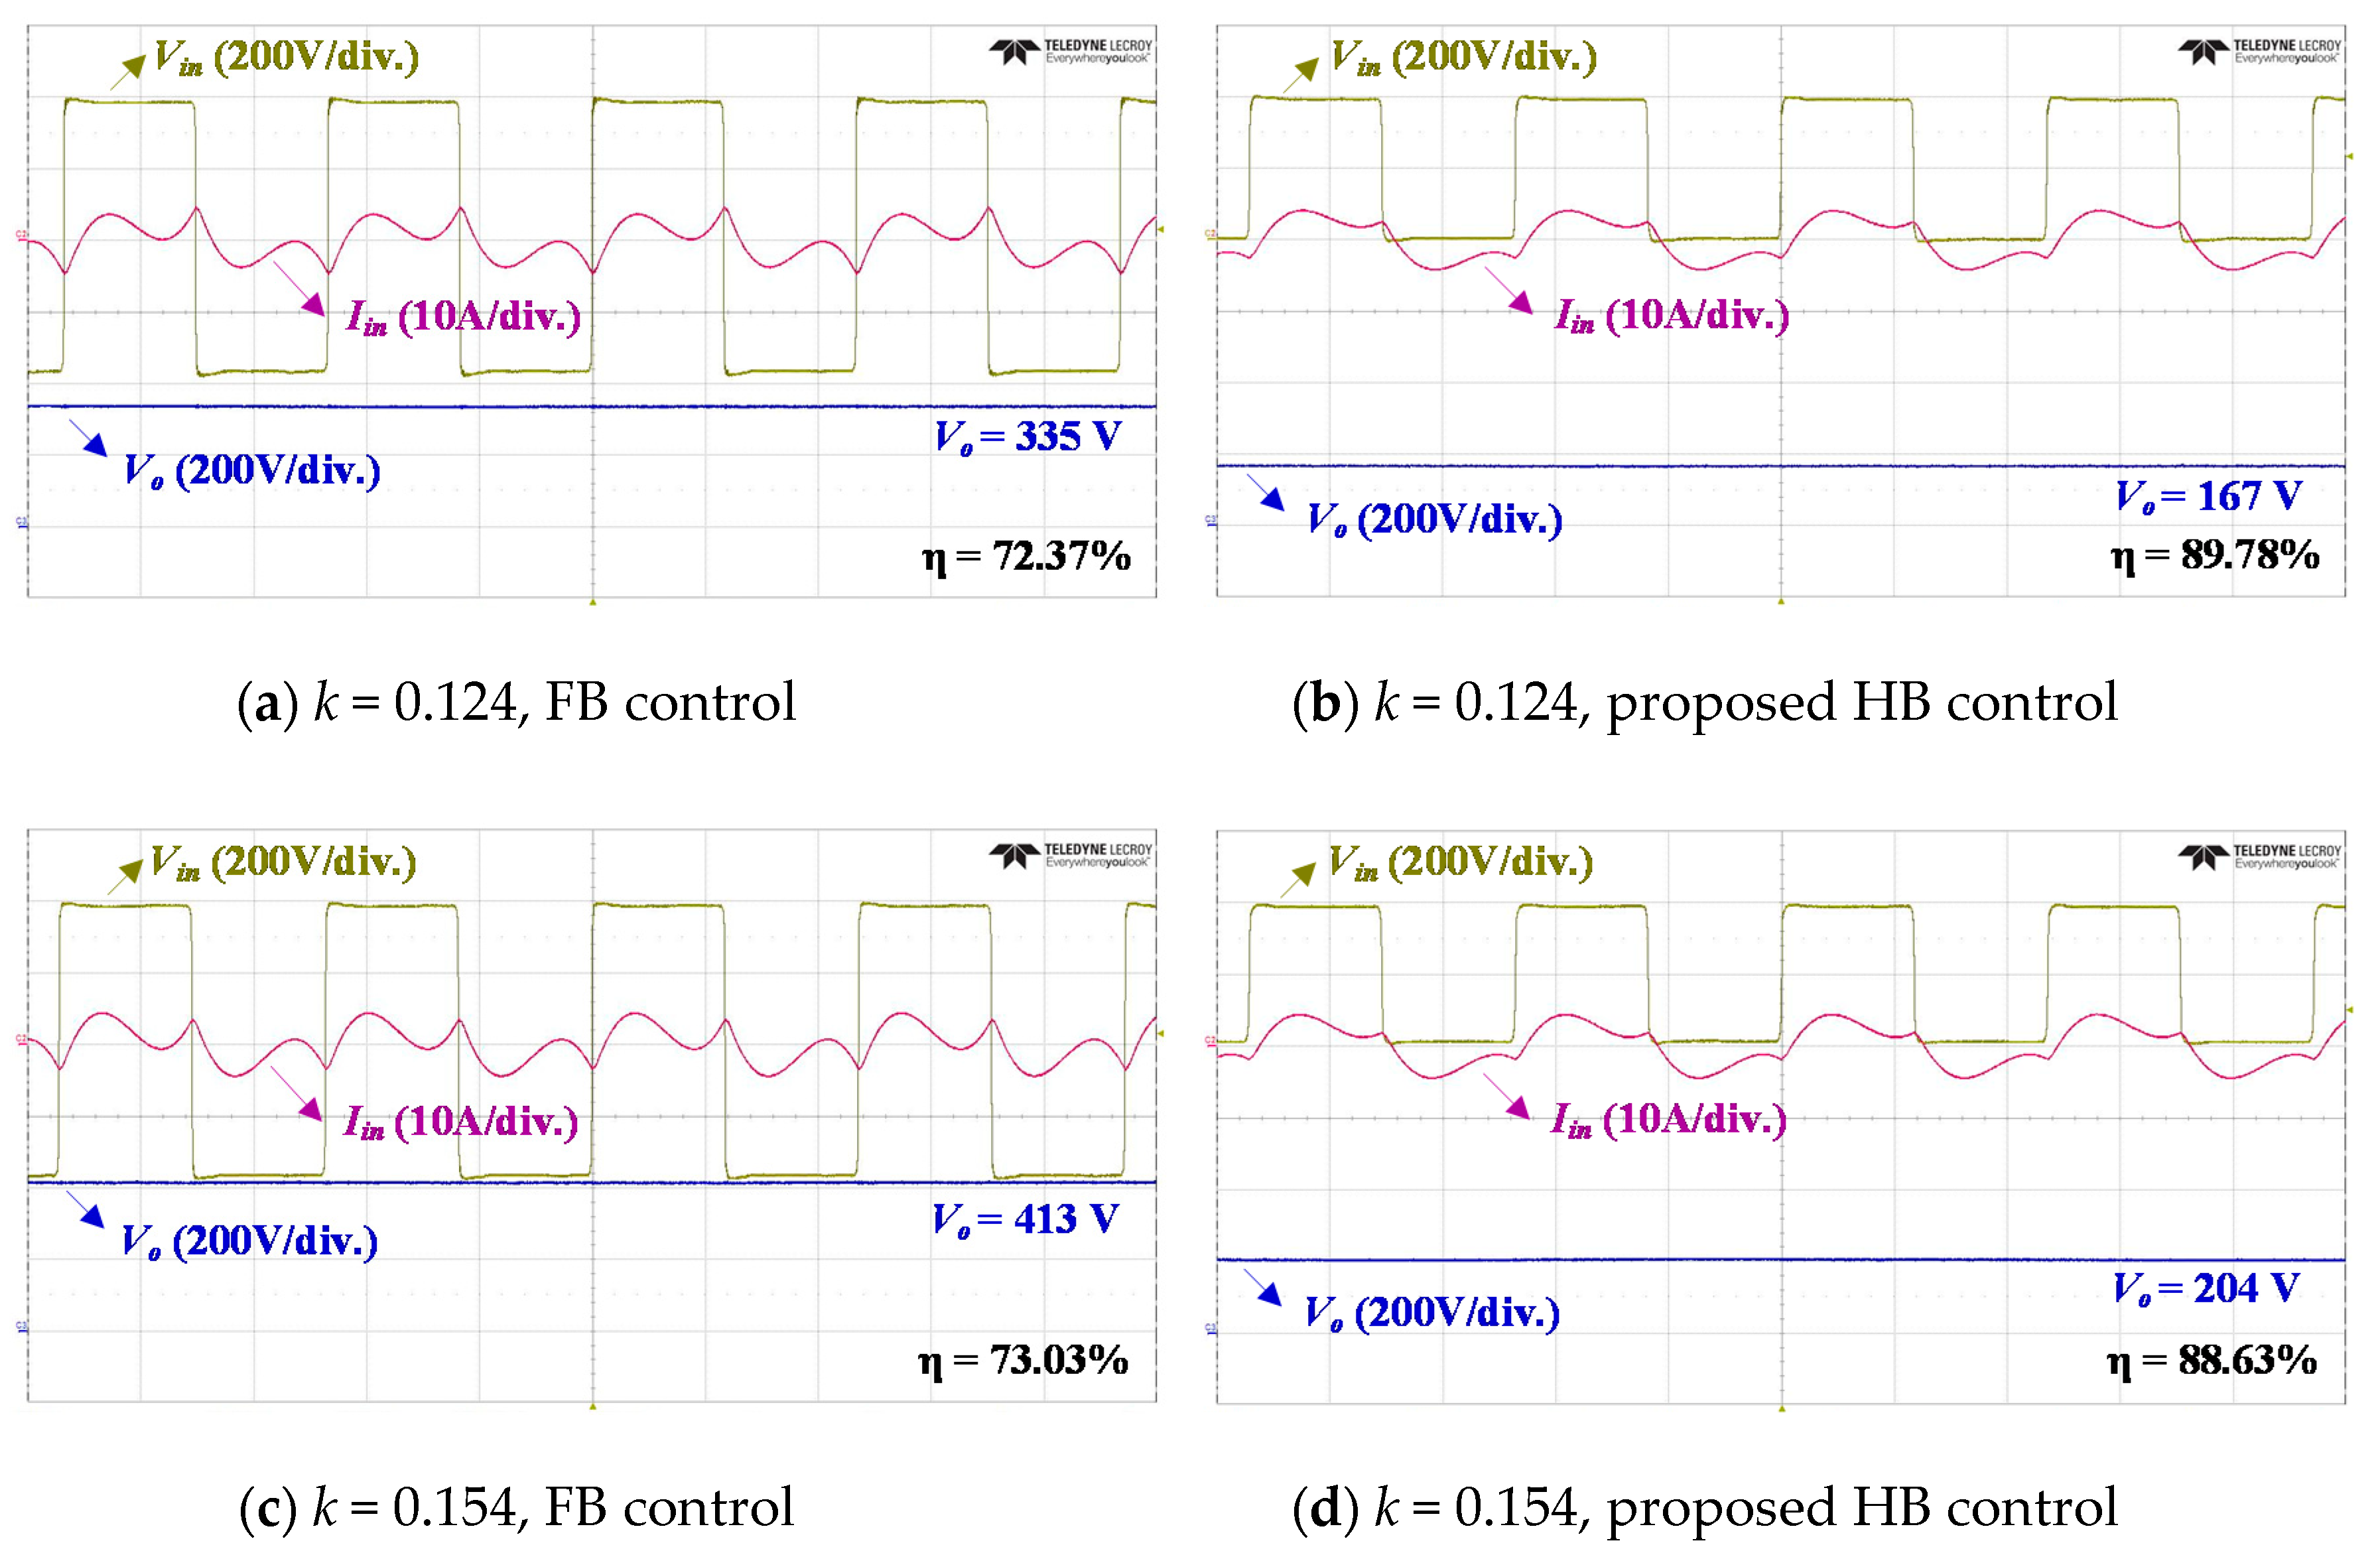
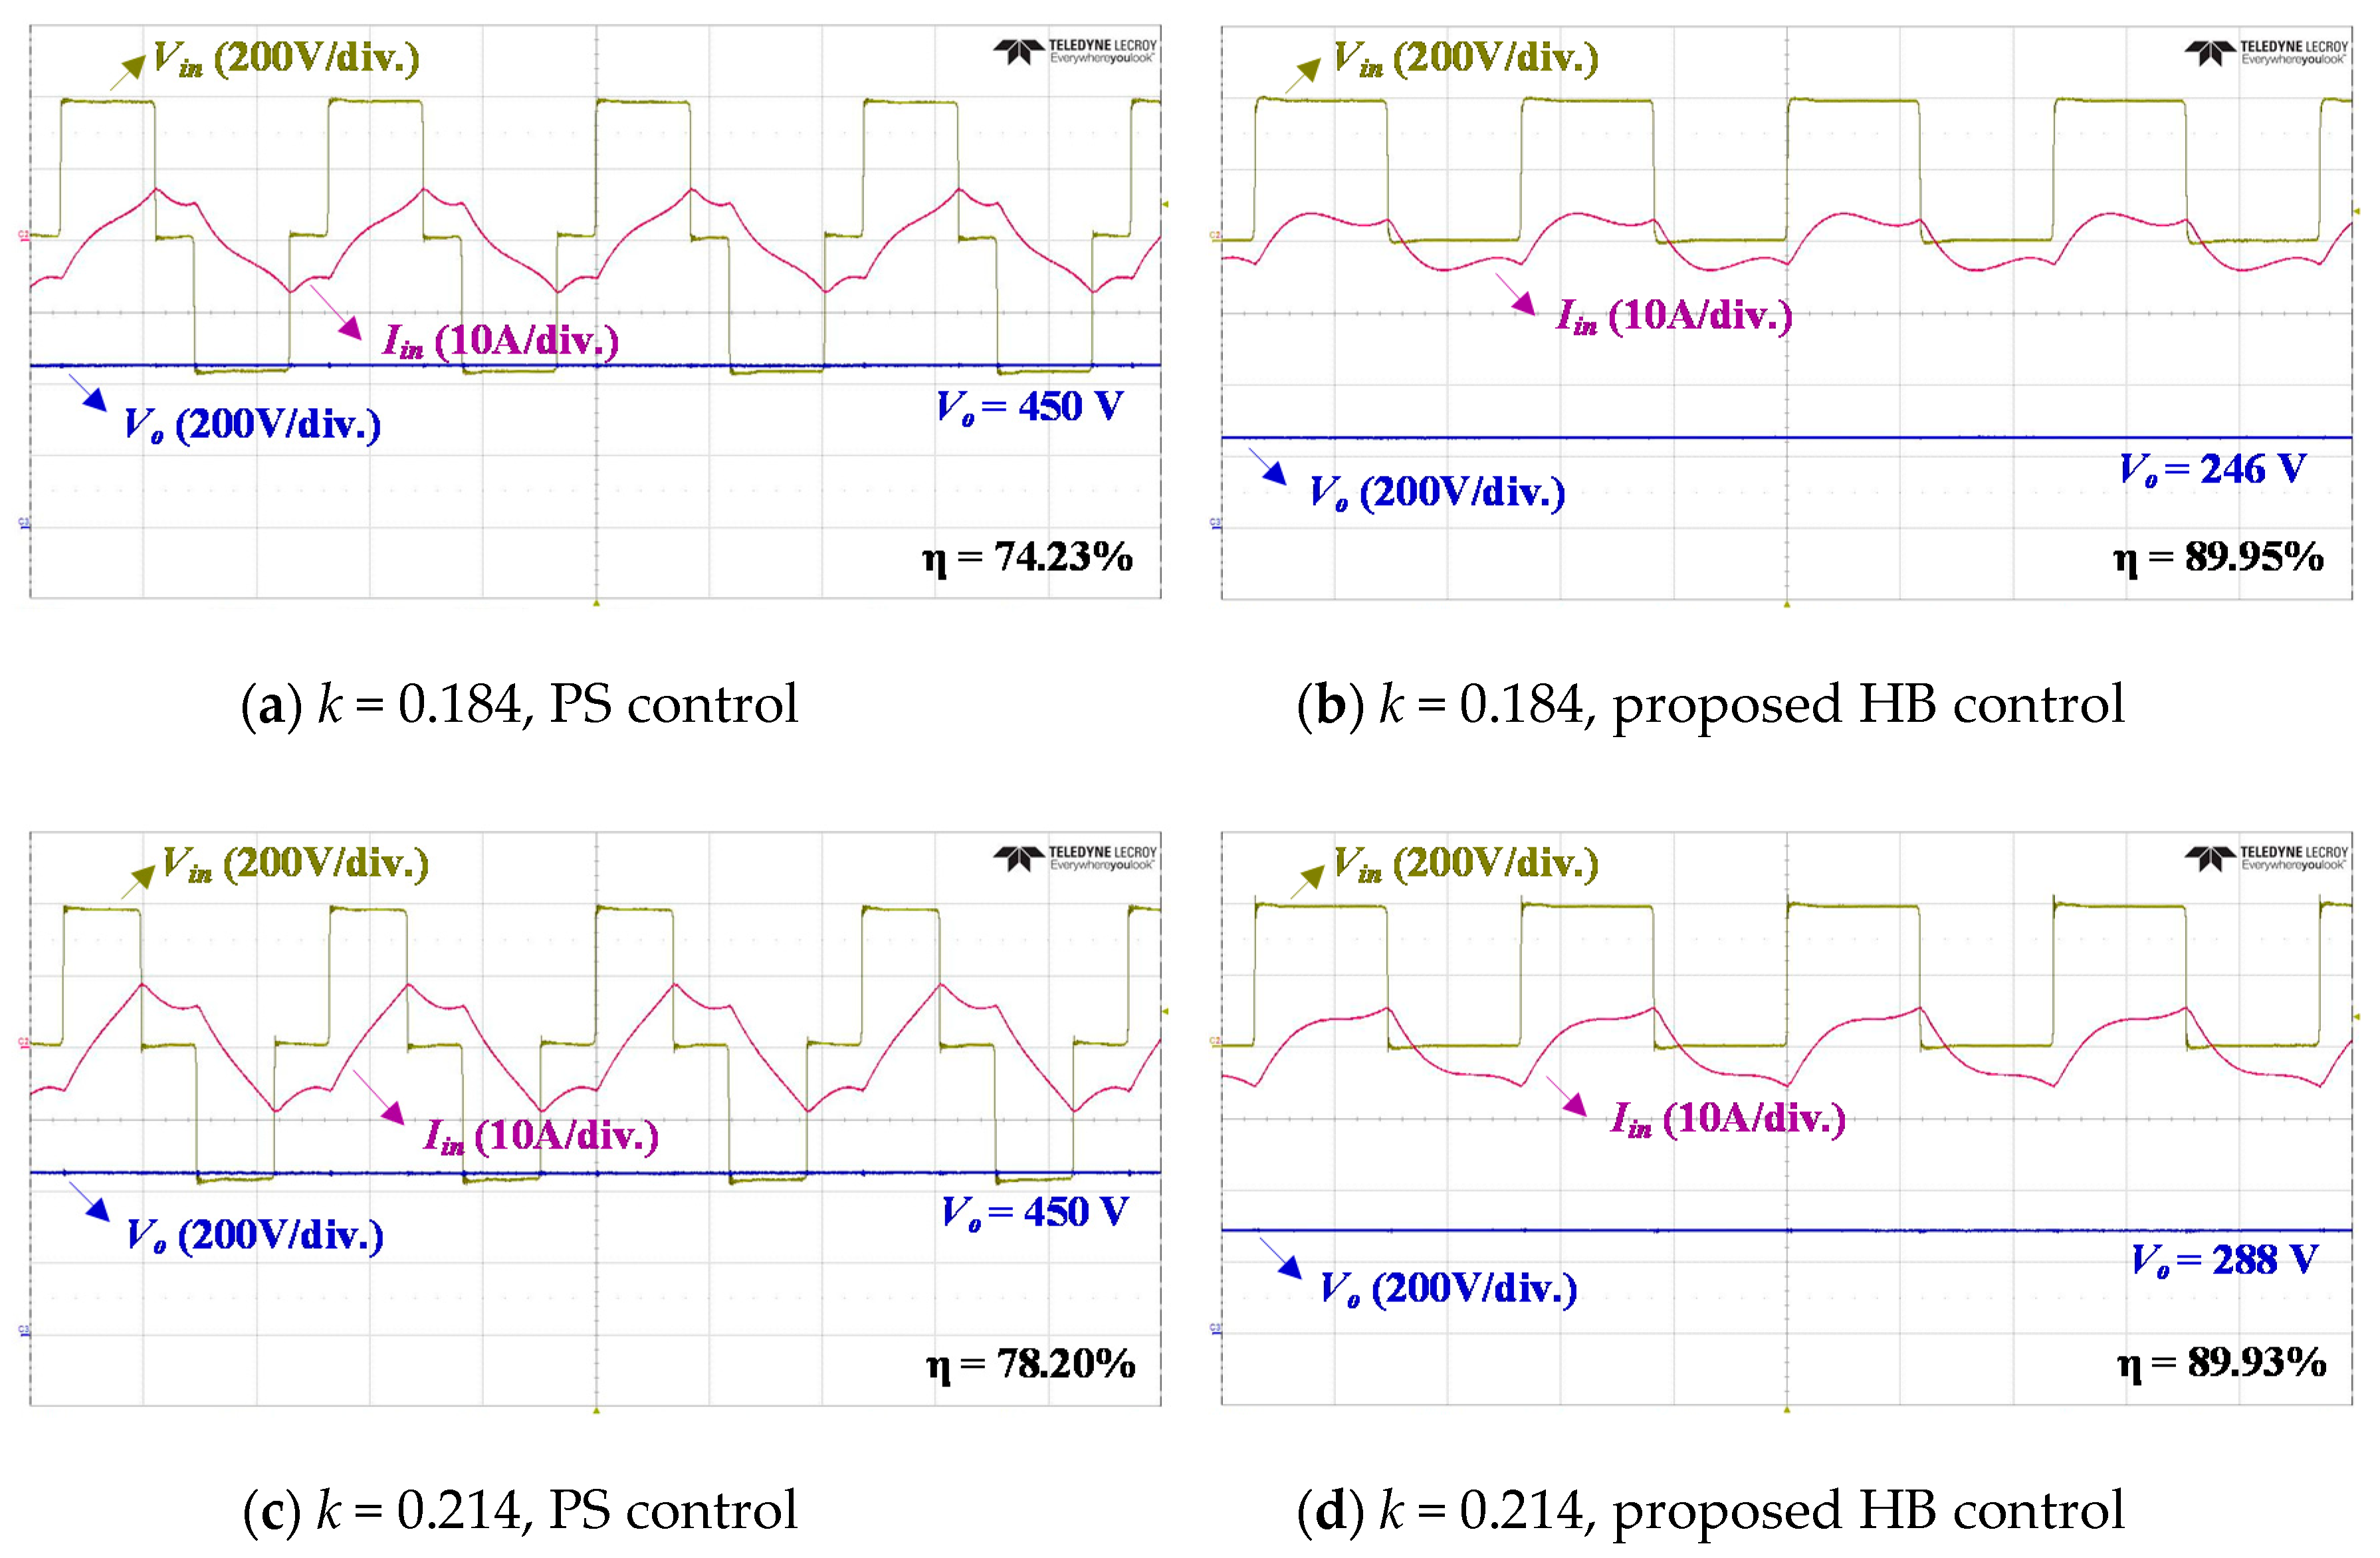
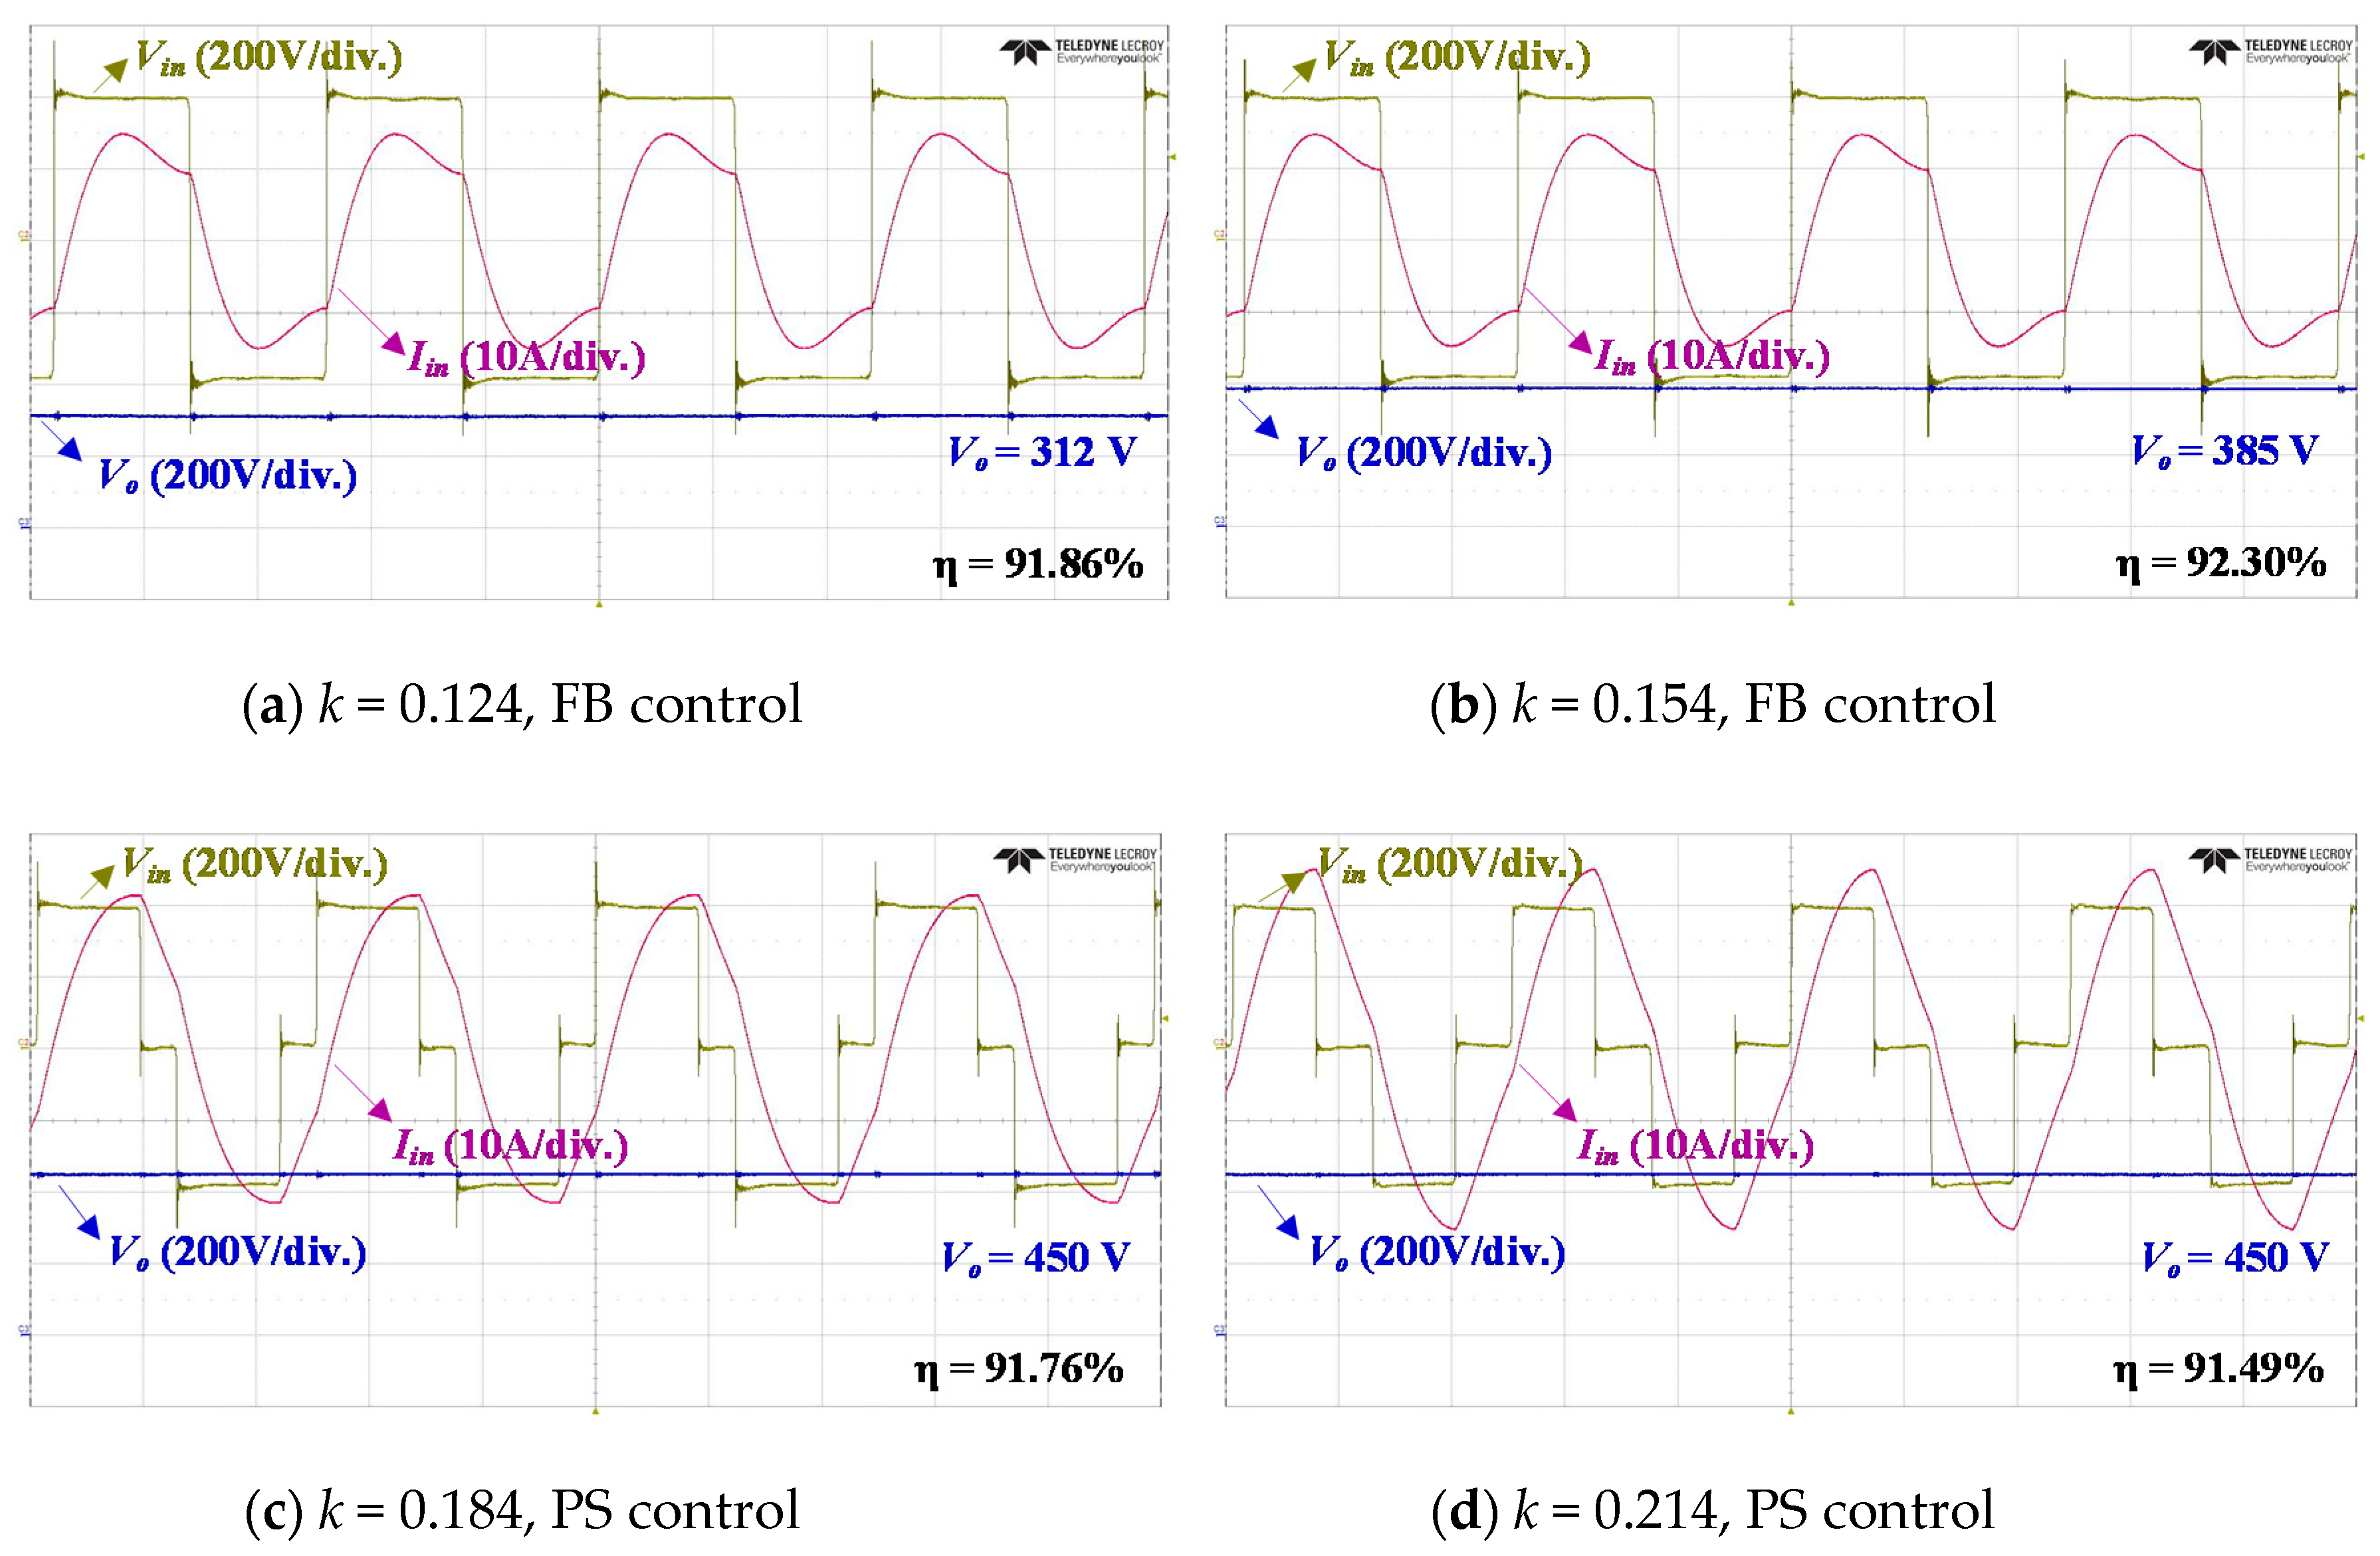
In order to compare the performances of the conventional FB-PS control and the proposed FB-PS-HB control, a 3.3 kW IPT converter testbed is configured, as shown in Figure 7. A DC power source is used to supply a constant DC-link voltage, and a DC electronic load is used instead of an actual battery pack. The efficiency of the IPT converter is measured from the DC power source to the DC electronic load. Specifications of the experimental setup are listed in Table 3 and Table 4. Figure 8 shows the experimental waveforms of the conventional FB control and the proposed HB control under the light-load condition of 400 W. As shown in Figure 8, it is confirmed that Vo under HB control appears as a half of Vo under FB control because the RMS value of Vin is reduced to half by HB control according to Table 2. Figure 9 shows the comparisons between the conventional PS control and HB control under the light-load condition of 400 W. Since PS control is applied in Figure 9a,c, Vo is maintained at 450 V despite the increase in k. When the proposed HB control is applied at these k conditions, output voltages of HB control become half of Vo,FB, and the efficiency is increased compared to the conventional control, as shown in Figure 9b,d. Figure 10 shows the experimental waveforms under the full-load condition of 3.3 kW. As analyzed in Section 2, under the full-load condition, FB or PS control is applied according to the k condition.
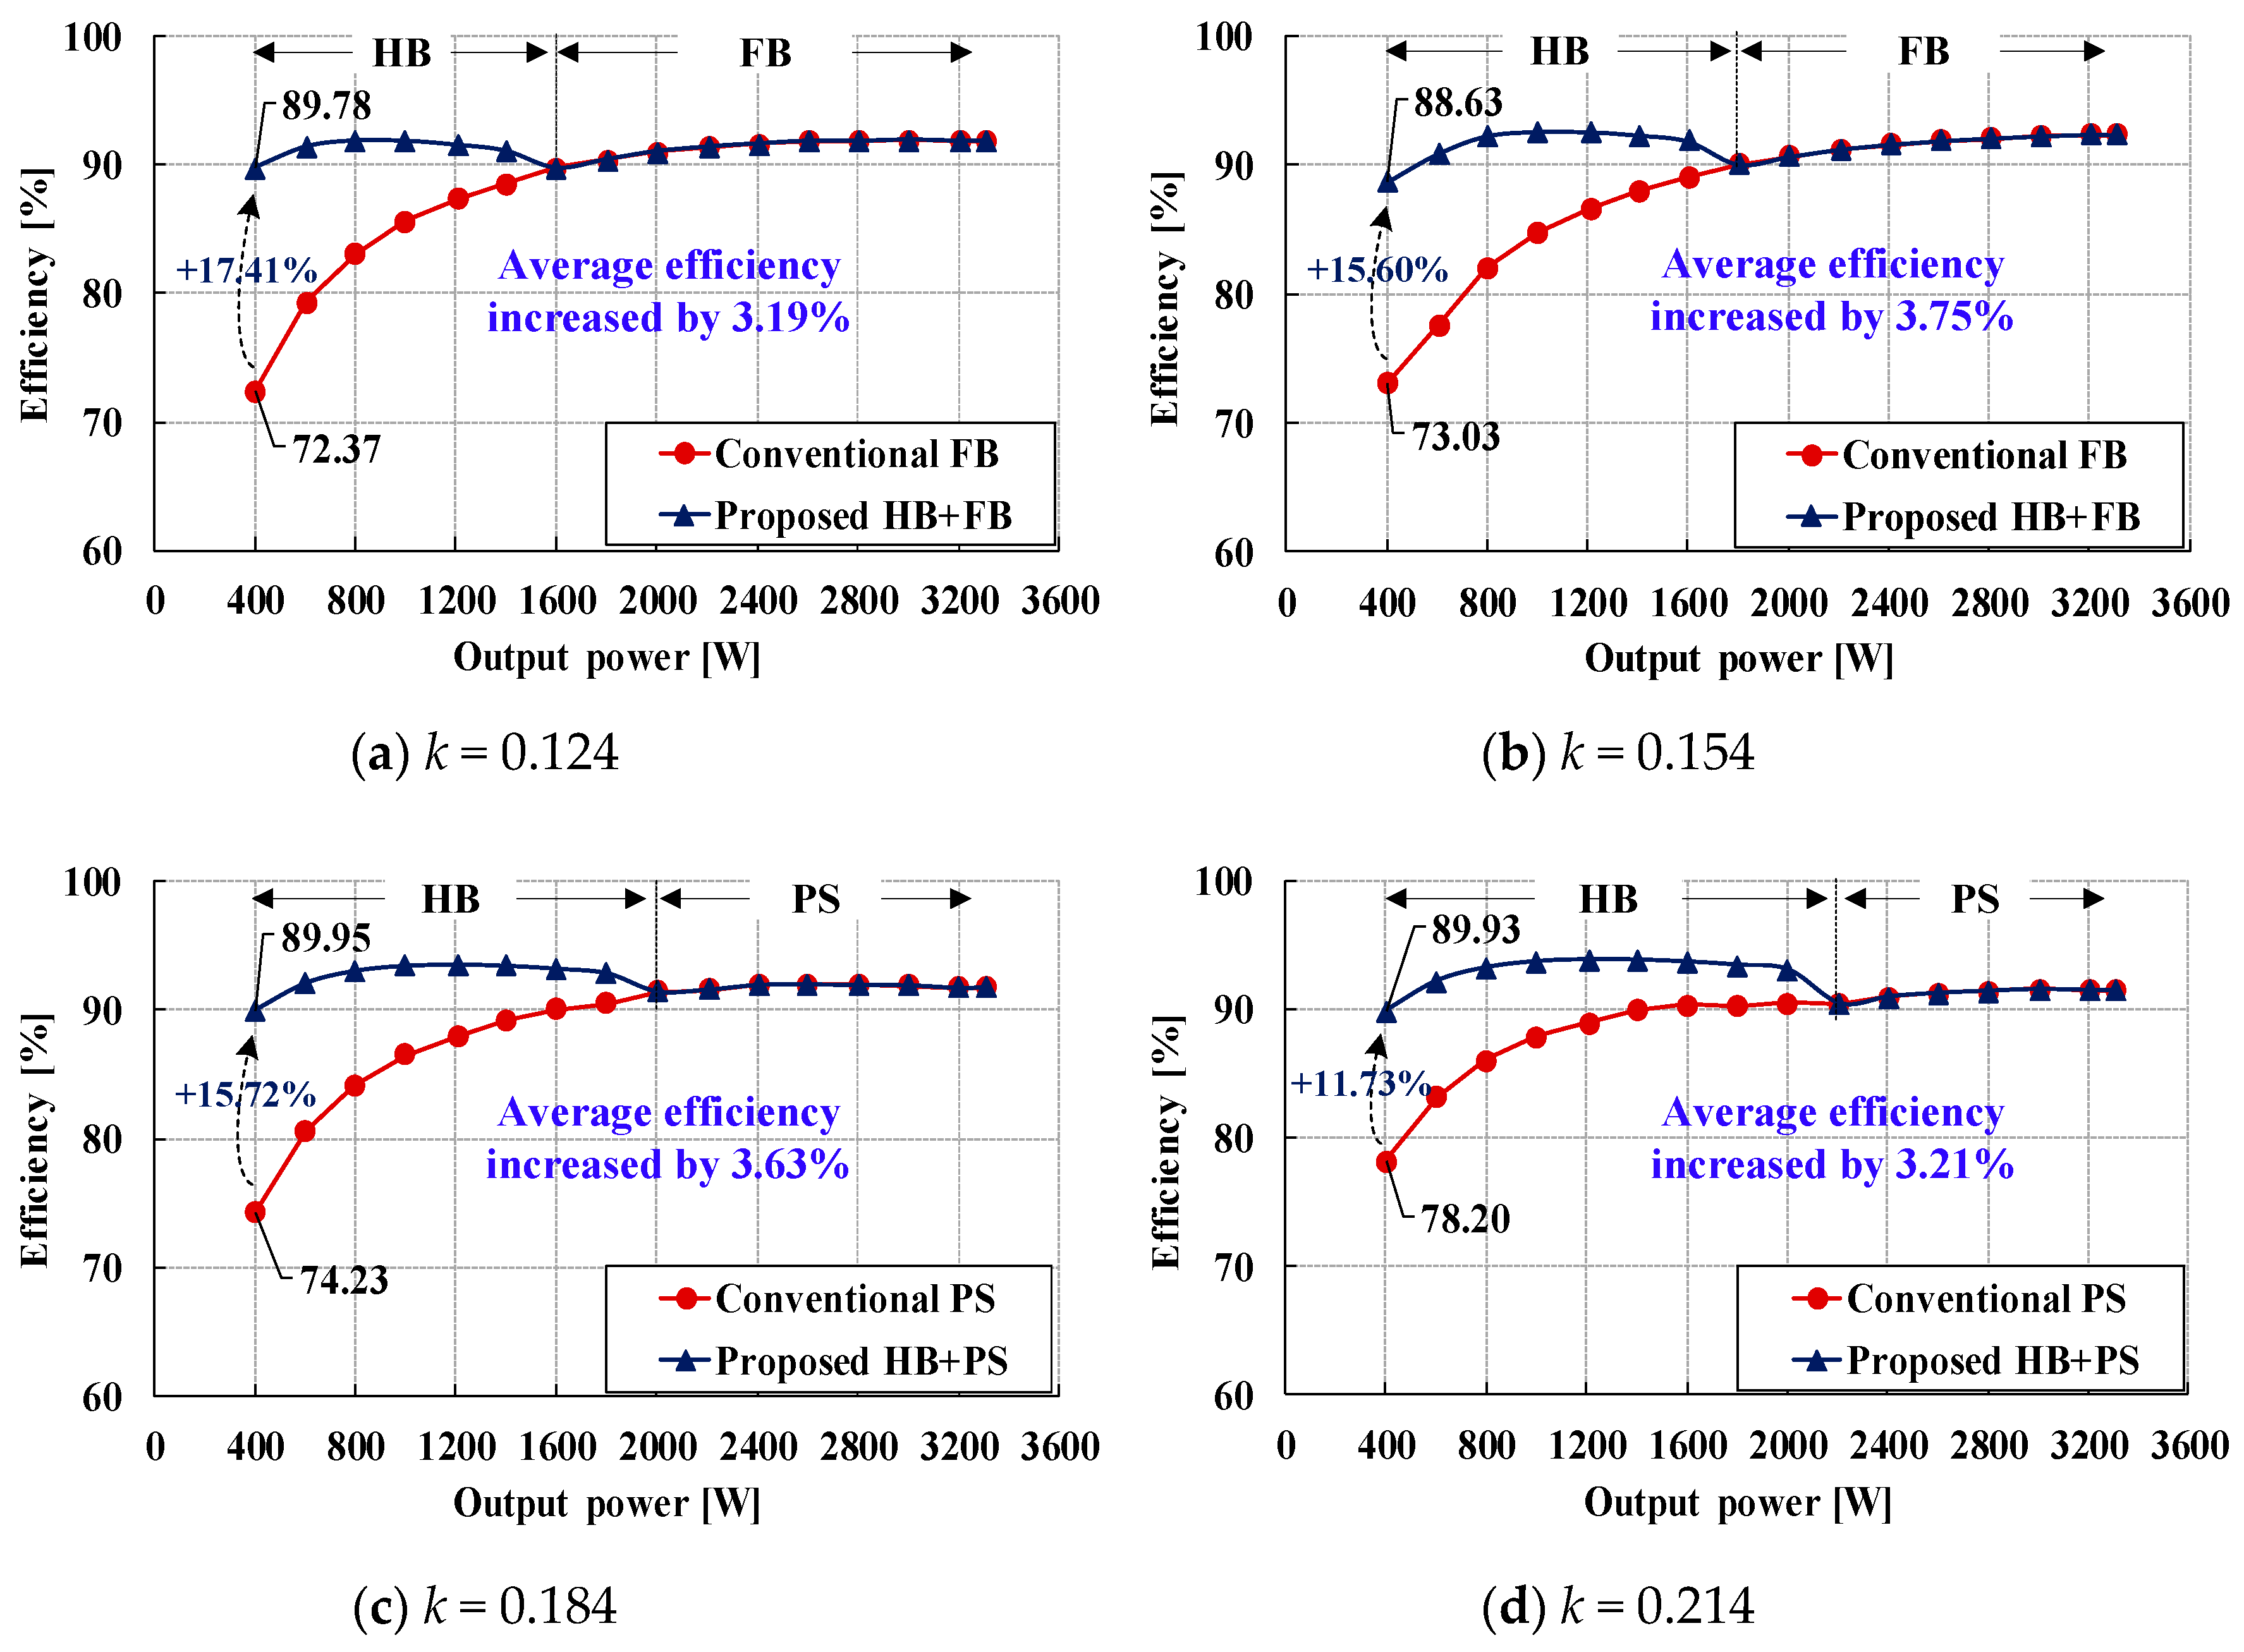
In order to verify the load-average efficiency improvement of the proposed control, efficiencies with respect to the output power conditions are measured. Figure 11 shows the results of the efficiency comparison between the conventional control and proposed control for each k condition. The experimental results show that the efficiency crossing points in Figure 11 are similar to PHB,k, which is calculated from the loss analysis. This means that even if the ferrite and aluminum losses of the IPT pads are not considered because of their non-linear properties, a relatively accurate PHB,k can be obtained from the loss analysis. Finally, as shown in Figure 11, it is experimentally verified that the light-load efficiency of the IPT converter is improved by up to 17.41% at k = 0.124 and Pbatt = 400 W, and the load-average efficiency of the IPT converter is improved by up to 3.75% at k = 0.154 with the proposed control. As mentioned in Section 1, the PFC and DC–DC converters of the IPT system have already achieved the high efficiency of 98–99%. Under this condition, the efficiency improvement of 3.75% on the IPT converter applying the proposed control algorithm could be regarded as a significant contribution.
5. Conclusions
In order to improve the load-average efficiency of the IPT system for EV applications with a primary-side LCC type resonant network, we propose an integrated control strategy that adds half-bridge control to the conventional full-bridge and phase-shift controls. In order to select the optimum operation mode among the three operation modes, the output voltage with respect to the coupling coefficient and the loss with respect to the output power for each coupling coefficient are theoretically analyzed. On the basis of the analysis results, the final operation mode is selected, and the proposed control algorithm is designed. In order to verify the performance of the proposed control, a laboratory prototype of a 3.3 kW IPT converter is established. It was experimentally verified that it is possible to achieve 17.41% of the light-load efficiency improvement at k = 0.124 and 3.75% of the load-average efficiency improvement at k = 0.154.
Author Contributions
Conceptualization, S.A. and W.-Y.L.; Data curation, S.A. and G.-Y.C.; Formal analysis, S.A.; Investigation, S.A.; Project administration, B.K.L.; Software, S.A.; Supervision, B.K.L.; Validation, S.A.; Visualization, S.A.; Writing—original draft, S.A. and B.K.L.; Writing—review & editing, S.A. and B.K.L.
Funding
This work was supported by “Human Resources Program in Energy Technology” of the Korea Institute of Energy Technology Evaluation and Planning (KETEP), granted financial resource from the Ministry of Trade, Industry & Energy, Korea. (No. 20184030202190); This work was supported by the Korea Institute of Energy Technology Evaluation and Planning (KETEP) and the Ministry of Trade, Industry & Energy(MOTIE) of the Korea. (No. 20168530050030).
Conflicts of Interest
The authors declare no conflicts of interest.
References
- Schrittwieser, L.; Kolar, J.W.; Soerio, T.B. 99% Efficient Three-Phase Buck-Type SiC MOSFET PFC Rectifier Minimizing Life Cycle Cost in DC Data Centers. CPSS Trans. Power Electron. Appl. 2017, 2, 47–58. [Google Scholar] [CrossRef]
- Xue, F.; Yu, R.; Huang, A.Q. A 98.3% Efficient GaN Isolated Bidirectional DC-DC Converter for DC Microgrid Energy Storage System Applications. IEEE Trans. Ind. Electron. 2017, 64, 9094–9103. [Google Scholar] [CrossRef]
- Ramachandran, R.; Nymand, M. Experimental Demonstration of a 98.8% Efficient Isolated DC-DC GaN Converter. IEEE Trans. Ind. Electron. 2017, 64, 9104–9113. [Google Scholar] [CrossRef]
- Cai, A.Q.; Siek, L. A 2-kW, 95% Efficiency Inductive Power Transfer System Using Gallium Nitride Gate Injection Transistors. IEEE J. Emerg. Sel. Top. Power Electron. 2017, 5, 458–468. [Google Scholar] [CrossRef]
- Huang, Z.; Wong, S.C.; Tse, C.K. Design of a Single-Stage Inductive-Power-Transfer Converter for Efficient EV Battery Charging. IEEE Trans. Veh. Technol. 2017, 66, 5808–5821. [Google Scholar] [CrossRef]
- Karakitsios, I.; Palaiogiannis, F.; Markou, A.; Hatziargyriou, N.D. Optimizing the Energy Transfer, With a High Efficiency in Dynamic Inductive Charging of EVs. IEEE Trans. Veh. Technol. 2018, 67, 4728–4742. [Google Scholar] [CrossRef]
- Vu, V.; Tran, D.; Choi, W. Implementation of the Constant Current and Constant Voltage Charge of Inductive Power Transfer Systems with the Double-Sided LLC Compensation Topology for Electric Vehicle Battery Charge Applications. IEEE Trans. Power Electron. 2018, 33, 7398–9410. [Google Scholar] [CrossRef]
- Li, S.; Li, W.; Deng, J.; Nguyen, T.D.; Mi, C.C. A Double-Sided LLC Compensation Network and Its Tuning Method for Wireless Power Transfer. IEEE Trans. Veh. Technol. 2015, 64, 2261–2273. [Google Scholar] [CrossRef]
- Li, S.; Mi, C.C. Wireless Power Transfer for Electric Vehicle Applications. IEEE J. Emerg. Sel. Top. Power Electron. 2015, 3, 4–17. [Google Scholar]
- Aditya, K.; Williamson, S.S. Design Considerations for Loosely Coupled Inductive Power Transfer (IPT) System for Electric Vehicle Battery Charging—A Comprehensive Review. In Proceedings of the 2014 IEEE Transportation Electrification Conference and Expo (ITEC), Dearborn, MI, USA, 15–18 June 2014; pp. 1–6. [Google Scholar]
- Bosshard, R.; Kolar, J.W. Inductive Power Transfer for Electric Vehicle Charging: Technical Challenges and Tradeoffs. IEEE Power Electron. Mag. 2016, 3, 22–30. [Google Scholar] [CrossRef]
- Colak, K.; Asa, E.; Bojarski, M.; Czarkowski, D.; Onar, O.C. A Novel Phase-shift Control of Semibridgeless Active Rectifier for Wireless Power Transfer. IEEE Trans. Power Electron. 2015, 30, 6288–6297. [Google Scholar] [CrossRef]
- Mishima, T.; Morita, E. High-Frequency Bridgeless Rectifier Based ZVS Multiresonant Converter for Inductive Power Transfer Featuring High-Voltage GaN-HFET. IEEE Trans. Ind. Electron. 2017, 64, 9155–9164. [Google Scholar] [CrossRef]
- Mai, R.; Yue, P.; Liu, Y.; Zhang, Y.; He, Z. A Dynamic Tuning Method Utilizing Inductor Paralleled with Load for Inductive Power Transfer. IEEE Trans. Power Electron. 2018, 33, 10924–10934. [Google Scholar] [CrossRef]
- Pantic, Z.; Bai, S.; Lukic, S.M. ZCS LCC-Compensated Resonant Inverter for Inductive-Power-Transfer Application. IEEE Trans. Ind. Electron. 2011, 58, 3500–3510. [Google Scholar] [CrossRef]
- Liu, C.; Ge, S.; Guo, Y.; Li, H.; Cai, G. Double-LCL resonant Compensation Network for Electric Vehicles Wireless Power Transfer: Experimental Study and Analysis. IET Power Electron. 2016, 9, 2262–2270. [Google Scholar] [CrossRef]
- Kim, M.; Joo, D.; Lee, B.K. Design and Control of Inductive Power Transfer System for Electric Vehicles Considering Wide Variation of Output Voltage and Coupling Coefficient. IEEE Trans. Power Electron. 2019, 34, 1197–1208. [Google Scholar] [CrossRef]
- Burdio, J.M.; Barragan, L.A.; Monterde, F.; Navarro, D.; Acero, J. Asymmetrical Voltage-Cancellation Control for Full-bridge Series Resonant Inverters. IEEE Trans. Power Electron. 2004, 19, 461–469. [Google Scholar] [CrossRef]
- Jovanovic, M.M.; Irving, B.T. On-the-Fly Topology-Morphing Control-Efficiency Optimization Method for LLC Resonant Converters Operating in Wide Input- and/or Output-Voltage Range. IEEE Trans. Power Electron. 2016, 31, 2596–2608. [Google Scholar] [CrossRef]
- Graovac, D.; Purschel, M.; Kieo, A. MOSFET Power Losses Calculation Using the Data-Sheet Parameters; Infineon Technologies: Dresden, Germany, 2006. [Google Scholar]
- STMicroelectronics. Calculation of Conduction Loss in a Power Rectifier. Available online: https://www.st.com/content/ccc/resource/technical/document/application_note/d6/8b/bb/1b/a8/b4/4d/c6/CD00003894.pdf/files/CD00003894.pdf/jcr:content/translations/en.CD00003894.pdf (accessed on 13 December 2018).
- Haaf, P.; Harper, J. Understanding Diode Reverse Recovery and Its Effect on Switching Losses; Fairchild Semiconductor: Sunnyvale, CA, USA, 2007. [Google Scholar]
- Changsung Corporation. Magnetic Powder Cores. Available online: http://www.mhw-intl.com/assets/CSC/CS C_Catalog.pdf (accessed on 13 December 2018).
- Rubycon Corporation. Technical Notes for Electrolytic Capacitor. Available online: http://rubycon.co.jp/en/pro ducts/alumi/technote3.html#3-2 (accessed on 13 December 2018).
- Ye, Z.; Jain, P.K.; Sen, P.C. A Full-Bridge Resonant Inverter with Modified Phase-Shift Modulation for High-Frequency AC Power Distribution Systems. IEEE Trans. Ind. Appl. 2007, 54, 2831–2845. [Google Scholar]
Figure 1.
Schematic of a 3.3 kW IPT system.

Figure 2.
Schematic and control modes of full-bridge inverter.

Figure 3.
Output voltage analysis and applicable control modes with respect to the coupling coefficient.
Figure 3.
Output voltage analysis and applicable control modes with respect to the coupling coefficient.

Figure 4.
Numerical efficiency graphs for the control modes and efficiency crossing points.

Figure 5.
Charging profile of an EV battery pack and control modes.

Figure 6.
Flow charts of the proposed control algorithm.

Figure 7.
Laboratory prototype of the 3.3 kW IPT converter.

Figure 8.
Experimental waveforms of the conventional FB control and the proposed control at Pbatt = 400 W.
Figure 8.
Experimental waveforms of the conventional FB control and the proposed control at Pbatt = 400 W.

Figure 9.
Experimental waveforms of the conventional PS control and the proposed control at Pbatt = 400 W.
Figure 9.
Experimental waveforms of the conventional PS control and the proposed control at Pbatt = 400 W.

Figure 10.
Experimental waveforms of the proposed control at Pbatt = 3.3 kW.

Figure 11.
Efficiencies of the 3.3 kW IPT converter with respect to Pbatt for each k.


Table 1.
Specifications of the IPT system.
| Parameter | Value | (Unit) |
|---|---|---|
| DC link voltage, Vdc | 380 | (V) |
| Output voltage, Vo | 165–450 | (V) |
| Battery voltage, Vbatt | 240–410 | (V) |
| Battery power, Pbatt | 400–3300 | (W) |
| Coupling coefficient, k | 0.062–0.214 | - |
Table 2.
Comparisons of voltages, currents, and their load dependency.
| 50% Duty FB Control | 50% Duty HB Control | Load Dependency |
|---|---|---|
| Vin | Vin/2 | Independent |
| Vo | Vo/2 | Independent |
| Ip | Ip/2 | Independent |
| Iin | 2Iin | Dependent |
| Io | 2Io | Dependent |
Table 3.
Specifications of the experimental setup.
| Parameter | Description |
|---|---|
| MOSFETs for FB inverter (Q1–Q4) | IPW65R080CFD (650 (V)/43.3 (A)) |
| Diodes for secondary rectifier (D1–D4) | APT15DQ100BCT (1000 (V)/15 (A)) |
| Digital signal processor | TMS320F28335 |
| Operation frequency | Variable in a range of 81.38–90 (kHz) (Tracking the primary-side zero-phase angle frequency [17]) |
| Range of vertical gap (coil-to-coil) | z = 55–165 (mm) |
| Horizontal misalignment | x/y = ±75/100 (mm) |
| Misalignment condition at k = 0.124 | x/y/z = 60/90/105 (mm) |
| Misalignment condition at k = 0.154 | x/y/z = 90/30/55 (mm) |
| Misalignment condition at k = 0.184 | x/y/z = 60/0/55 (mm) |
| Misalignment condition at k = 0.214 | x/y/z = 0/90/55 (mm) |
Table 4.
Specifications of IPT pads and resonant network.
| Parameter | Value | (Unit) |
|---|---|---|
| Input inductor, Lin | 48.41 | (μH) |
| Primary inductor, Lp (22 turns) | 506 | (μH) |
| Secondary inductor, Ls (23 turns) | 227 | (μH) |
| Primary compensation capacitor, Cp | 72.42 | (nF) |
| Primary filter capacitor, Cf | 7.67 | (nF) |
| Secondary series capacitor, Cs | 15.42 | (nF) |
© 2019 by the authors. Licensee MDPI, Basel, Switzerland. This article is an open access article distributed under the terms and conditions of the Creative Commons Attribution (CC BY) license (http://creativecommons.org/licenses/by/4.0/).
Share and Cite
MDPI and ACS Style
Ann, S.; Lee, W.-Y.; Choe, G.-Y.; Lee, B.K. Integrated Control Strategy for Inductive Power Transfer Systems with Primary-Side LCC Network for Load-Average Efficiency Improvement. Energies 2019, 12, 312. https://doi.org/10.3390/en12020312
AMA Style
Ann S, Lee W-Y, Choe G-Y, Lee BK. Integrated Control Strategy for Inductive Power Transfer Systems with Primary-Side LCC Network for Load-Average Efficiency Improvement. Energies. 2019; 12(2):312. https://doi.org/10.3390/en12020312
Chicago/Turabian StyleAnn, Sangjoon, Woo-Young Lee, Gyu-Yeong Choe, and Byoung Kuk Lee. 2019. "Integrated Control Strategy for Inductive Power Transfer Systems with Primary-Side LCC Network for Load-Average Efficiency Improvement" Energies 12, no. 2: 312. https://doi.org/10.3390/en12020312
Note that from the first issue of 2016, this journal uses article numbers instead of page numbers. See further details here.