Environmental Performance Measures to Assess Building Refurbishment from a Life Cycle Perspective


Department of Applied Physics and Electronics, Umeå University, 901 87 Umeå, Sweden
*
Author to whom correspondence should be addressed.
Energies 2019, 12(2), 299; https://doi.org/10.3390/en12020299
Submission received: 27 October 2018
/
Revised: 11 January 2019
/
Accepted: 16 January 2019
/
Published: 18 January 2019
Abstract
:Energy efficiency investments in existing buildings are an effective way of reducing the environmental impact of the building stock. Even though policies in the European Union and elsewhere promote a unilateral focus on operational energy reduction, scientific studies highlight the importance of applying a life cycle perspective to energy refurbishment. However, life cycle assessment is often perceived as being complicated and the results difficult to interpret by the construction sector. There is also a lack of guidelines regarding the sustainable ratio between the embodied and accumulated operational impact. The scope of this study is to introduce a life cycle assessment method for building refurbishment that utilizes familiar economic performance tools, namely return on investment and annual yield. The aim is to use the introduced method to analyze a case building with a sustainability profile. The building was refurbished in order to reduce its operational energy use. The introduced method is compatible with a theory of minimum sustainable environmental performance that may be developed through backcasting from defined energy and GHG emissions objectives. The proposed approach will hopefully allow development of sustainable refurbishment objectives that can support the choice of refurbishment investments.
1. Introduction
Reducing the environmental impact of existing building stock is essential [1,2] and can be effectively achieved through investing in energy-efficiency measures. For a long time the focus of energy-efficiency measures has been on reducing operational energy use, which reflects the existing building energy- and environmental policies in the European Union and elsewhere [3]. However, the unilateral focus on operational energy use in current design methods is questioned when scientific studies emphasize the significance of embodied energy [4,5,6,7,8,9], thus highlighting the importance of applying a life cycle perspective to the planning of energy efficiency refurbishment.
Building Refurbishment-Life Cycle Assessment (BR-LCA) includes operational energy use, which is the energy required to operate a building, including heat and electricity use, and embodied energy. Embodied energy is categorized as initial, recurring and demolition. Initial embodied energy includes energy use during production and construction of the building and recurring embodied energy includes energy use for maintenance and repairs. In theory, BR-LCA is a very useful tool for providing a holistic view of the impact of building refurbishment. However, the tool is rarely used by the construction industry because the BR-LCA process is often perceived as being complicated and the results difficult to interpret [10,11,12].
In scientific literature, the relationship between embodied energy and the reduction in operational energy use is often evaluated to make the BR-LCA method more accessible. Energy payback time (EPBT) is a performance measure frequently used to indicate this relationship [13,14]. There are also studies that use Energy Return on Investment (EROI) as a performance measure, particularly in the assessment of photovoltaics [15,16]. Review studies also acknowledge the need for more BR-LCA case studies, especially on multifamily buildings, in order to build references that can form the basis of the development of accessible BR-LCA tools [17,18]. Studies also show that policies and regulations are key elements influencing building refurbishment [19].
We will study a multifamily case building that was refurbished with energy-efficiency measures that were planned and implemented with the focus to reduce operational energy use. The energy-efficiency measures will be analyzed from a life cycle perspective, including both operational and embodied energy. The case building is situated in the million homes program area of Ålidhem in Umeå, Sweden, 455 km south of the Arctic Circle. The million homes program expresses the large-scale, intensely developed areas of uniform apartment blocks built in Sweden in the 1960–1970s to accommodate home seekers regardless of their income [20]. The case building is owned by the municipal housing company in Umeå and its refurbishment was financially supported by the Swedish government’s Delegation for Sustainable Cities [21].
A range of energy-efficiency measures was implemented in the case building, including energy recovery ventilation, new windows and additional roof and wall insulation. Measurements were made prior to and after refurbishment to validate improvements in the energy performance of the case building, giving access to a unique set of measured data on the annual reduction in operational energy for each refurbishment measure separately [22]. Furthermore, photovoltaics were installed on the roof of the case building to accommodate part of the electricity use. These refurbishment measures have been analyzed using EPBT and EROI as performance measures in a previous study conducted by the authors of the present study [23]. This forms the basis of this study.
The environmental performance of the case building refurbishment was assessed from a life cycle perspective to acquire experience and build references for the development of BR-LCA. The unique set of measured data on the case building refurbishment allowed separate analysis of the measures and enabled their relative comparison. However, in the environmental sustainability assessment of the case building refurbishment, we noted a lack of guidelines and standardized methods for assessing the sustainable ratio between the embodied and accumulated operational impact. Thus, we utilized traditional economic performance tools, namely Return on Investment (ROI) and Annual Yield (AY), to assess the environmental performance of the case building refurbishment from a life cycle perspective. This method is compatible with the theory of a minimum sustainable energy return on energy invested [24,25].
The scope of this study is to introduce a familiar BR-LCA approach to calculate and analyze the results and thus hopefully make the BR-LCA process more accessible and comprehensible to the construction industry. We propose an approach that combines ROI and AY as BR-LCA measures together with a developed theory for minimum sustainable environmental performance based on research in order to set policy and industry goals and assess the environmental sustainability of building refurbishment. The aim is to utilize ROI and AY as environmental performance measures to quantify the life cycle energy use (GJ) and greenhouse gas emissions (tonne CO2-eq) of the case building refurbishment measures.
Factors such as location, climate and fuel sources influence ROI and AY. Thus, the environmental profitability of the refurbishment measures and photovoltaics are analyzed as these parameters are varied. This has been achieved by theoretically moving the case building to two other European cities, Lund in Sweden and Warsaw in Poland, both of which have a different climate and fuel mix than the original Swedish location of Umeå. Different scenarios for heat and power have also been included in this sensitivity analysis in order to learn more about ROI and AY as environmental performance measures.
2. Method
A method is presented that views refurbishment measures as environmental investments and utilizes traditional economic performance tools to compare refurbishment investments based on a life cycle approach. The method aims to simplify the calculation and interpretation of the LCA results.
Return on investment expresses the economic performance of an investment as a ratio between the net income and cost of an investment, see Equation (1). The net income is the gross profit of the investment minus expenses over a set period of time.
In the translation of ROI into an Environmental Performance Measure (EPM) for building refurbishment, environmental impact variables are introduced. The variables are “environmental investment” expressed as the Added Embodied Impact (AEI) and “environmental gain” which is the annual change (Δ) in Operational Impact (OI) accumulated over a set investment horizon. The investment horizon is defined as the Technical Service Life (TSL) of the refurbishment measure. Environmental performance is measured in energy and Greenhouse gas emissions (GHGe) for refurbishment investments. ROI as an EPM is defined in Equation (2):
ROI has been chosen as an environmental performance measure for building refurbishment because it calculates the total environmental saving of the refurbishment measure, thus providing the basis for making long-term sustainable refurbishment investments. However, ROI has some limitations as an EPM when refurbishment investments with different TSL are compared to each other. This means that the investments are evaluated over different investment horizons which will influence the performance of the refurbishment measure. Thus, the annual environmental yield (AY) has been introduced as an additional EPM to provide information on the annual environmental yield of the refurbishment investments as a percentage.
The annual environmental yield is based on the economic performance measure Compound Annual Growth Rate (CAGR), see Equation (3). CAGR describes the mean annual growth rate of an investment over a specified period of time of more than one year:
For refurbishment measures, CAGR describes the investment yield on an annual compounded basis, because the energy return can be assumed to grow at the same rate every year over the investment horizon with adequate maintenance. The annual environmental yield of an investment over a specified period of time is defined in Equation (4):
The process of estimating EPMs for building refurbishment is shown in Figure 1. The process can be divided into two parts in which the first part determines the refurbishment measure (marked by a dashed line). The second part estimates the environmental impact variables of the measure, the added embodied impact and annual change in operational impact.
The first part of the process when planning building refurbishment is to decide on the refurbishment measures. Such decisions are influenced by the physical constraints of the building and the objective of the refurbishment. The physical constraints comprise the geographical location of the building, climate and original building design, i.e., frame and envelope design. These factors interact with each other since the geographical location directly affects the climate of the building area and the climate influence the original building design.
The influence of physical constraints on the choice of refurbishment measures is regulated by the refurbishment objectives. The objectives can be formulated as economic, environmental and social targets. This study will focus on environmental targets, such as a reduction in life cycle energy use (measured in Joule) and GHG emissions (measured in tonne CO2-eq).
The second part of the process is to estimate the added embodied impact and annual change in the operational impact of the considered refurbishment measure from the first part of the process. The added embodied impact is estimated over the technical service life of the measure. This is achieved through a life cycle energy inventory analysis in which the embodied energy is assessed according to the EN 15978:2011 standard [26].
The following LCA stages are included in the EN 15978:2011 standard:
- Production stage includes raw material supply, transport and manufacturing. Environmental Product Declarations (EPD) can be used to locate impact data.
- Construction stage includes transport and the construction installation process.
- Use stage includes the impact of maintenance, repair, operational use of energy and water.
- End-of-life stage includes the impact of deconstruction, reuse, transport and disposal.
The EN 15978:2011 standard does not credit benefits and loads beyond the system boundary, e.g., combined heat and power production from waste material.
The embodied GHG emissions of the refurbishment measure are estimated by defining the source of energy used throughout the life cycle and the emission factor of that source. This is achieved by using EPDs and making informed assumptions about energy sources.
For the case building in this study a unique set of measured data on the annual reduction in operational energy has been available [22]. An alternative to conducting measurements and estimating the reduction in operational energy would be to estimate the operational energy reduction by using building energy simulation software. To estimate the annual reduction in operational GHG emissions, information about the building heating system, local electricity grid and the emission factor of these has been collected.
The environmental performance of the refurbishment investment (ROI and AY) is estimated based on the AEI and ΔOI as environmental impact parameters. To assess the environmental performance, a feedback loop to the refurbishment objective should be performed. Depending on the fulfilment of the objective, a decision could be made to continue with the refurbishment measure, make changes to the measure or modify the objective.
Due to the inherent complexity of LCA, transparency is an important guiding principle in order to ensure a proper interpretation of the results. The life cycle energy inventory analysis includes allocation and system boundary choices that should be clearly stated.
3. Case Study
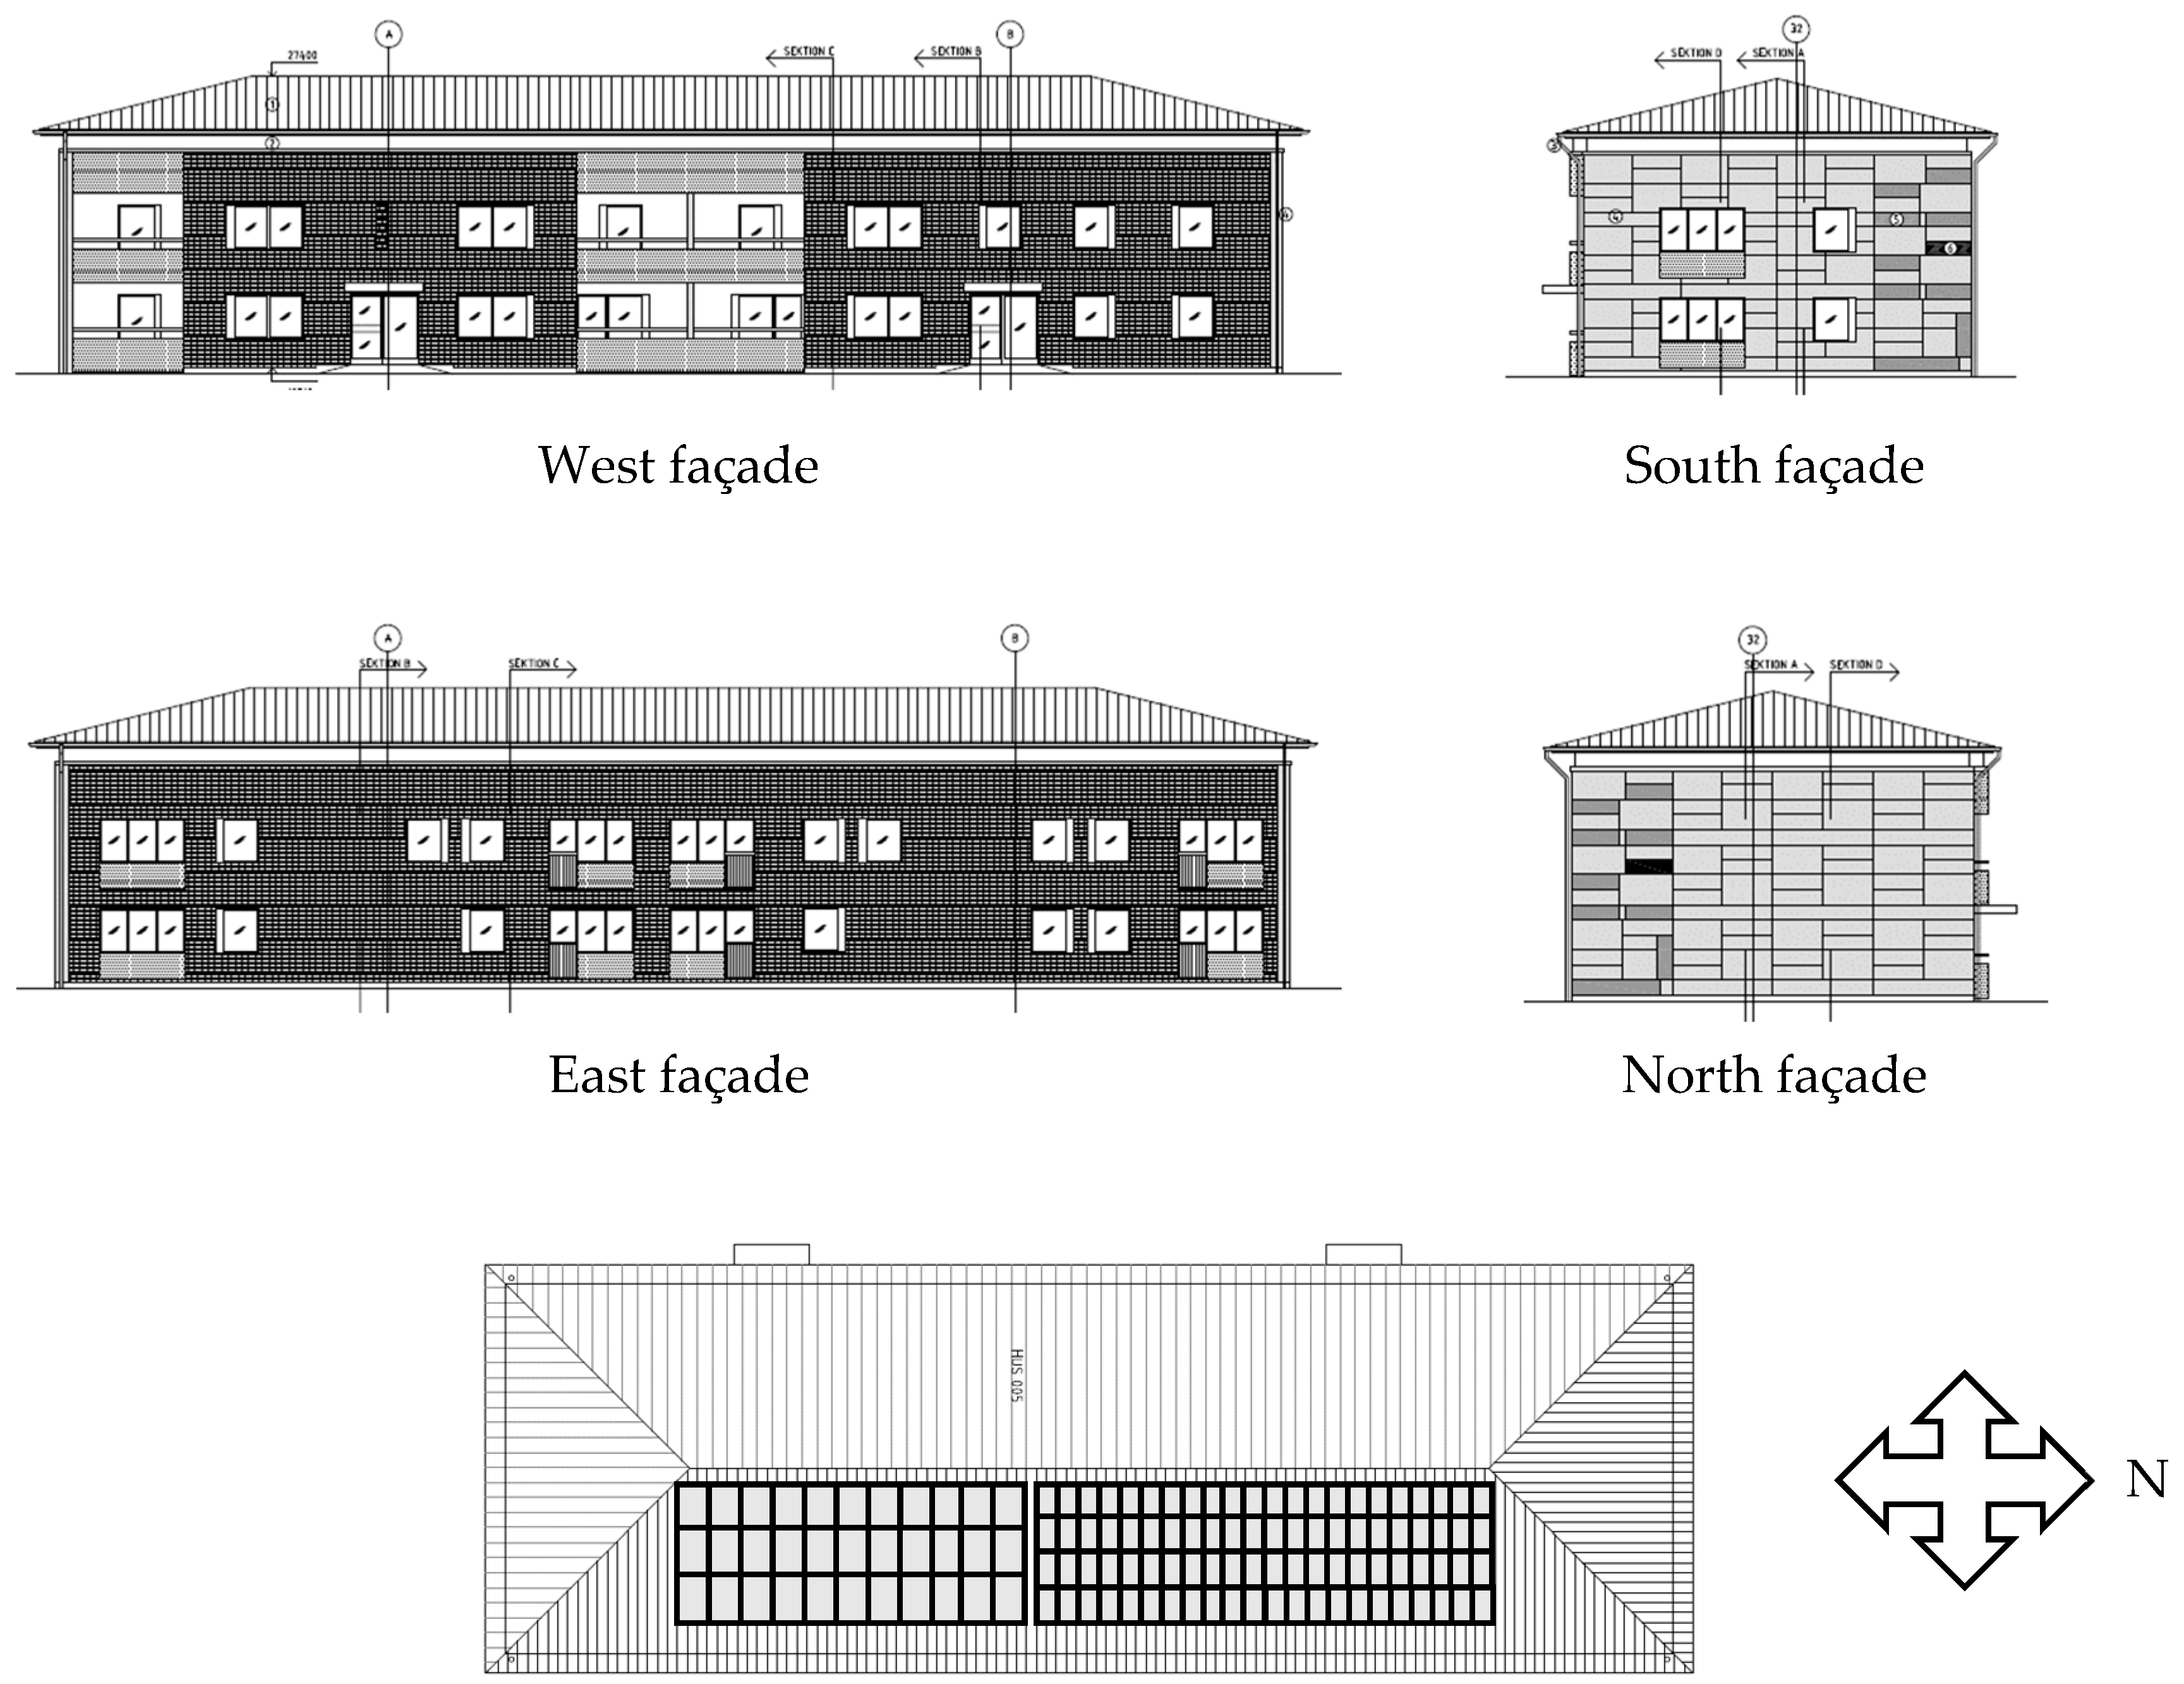
The case building is a two-story, multifamily building that was built during the million homes program (1965–1974) in Sweden [20] and its design is typical of the time. Building design, orientation and installed photovoltaics are shown in Figure 2. The geographical location of the building is in the city of Umeå, Sweden, located in a cold climate 455 km south of the Arctic Circle.
Table 1 show the properties of the case building prior to and after refurbishment together with the annual reduction in operational energy as a result of refurbishment. The Refurbishment Measures (RM) have been given acronyms that will be used throughout the study.
The case building was one of two similar buildings that first were evaluated to determine a common baseline. After this the case building were refurbished and both the case building and the untouched reference building were then monitored for one year [22]. Differences in indoor and outdoor temperatures, house hold and building electricity, heat losses from domestic hot water circulation and personal heat was considered when comparing the reference and case building. For the transmission losses, the reduced operational energy use was distributed between windows, roof and external walls with the help of a building energy simulation software, IDA-ICE.
Electricity production from the photovoltaics was continuously measured every hour. The change in operational energy reported in Table 1 is the mean production over the period 20112016. The produced electricity from the photovoltaics has been treated as a reduction in purchased operational electricity use by the case building.
3.1. Added Embodied Impact
The added environmental impact, i.e., environmental investment of the different refurbishment measures have been estimated based on an inventory analysis. The inventory analysis is based on information gathered from various scientific reports and is shown in Table 2. The specific added embodied energy and GHG emissions, TSL and weight or area unit of the refurbishment measures are shown in Table 3.
3.2. Change in Operational Impact
The change in operational energy, i.e., environmental gain of the case building refurbishment is known from measurements in the case building, see Table 1. To estimate the change in operational GHG emissions, information on the fuel mix for heat and electricity is required. Energy recovery ventilation, windows and insulation contribute to a change in operational heating, while the photovoltaics contribute to a change in purchased operational electricity.
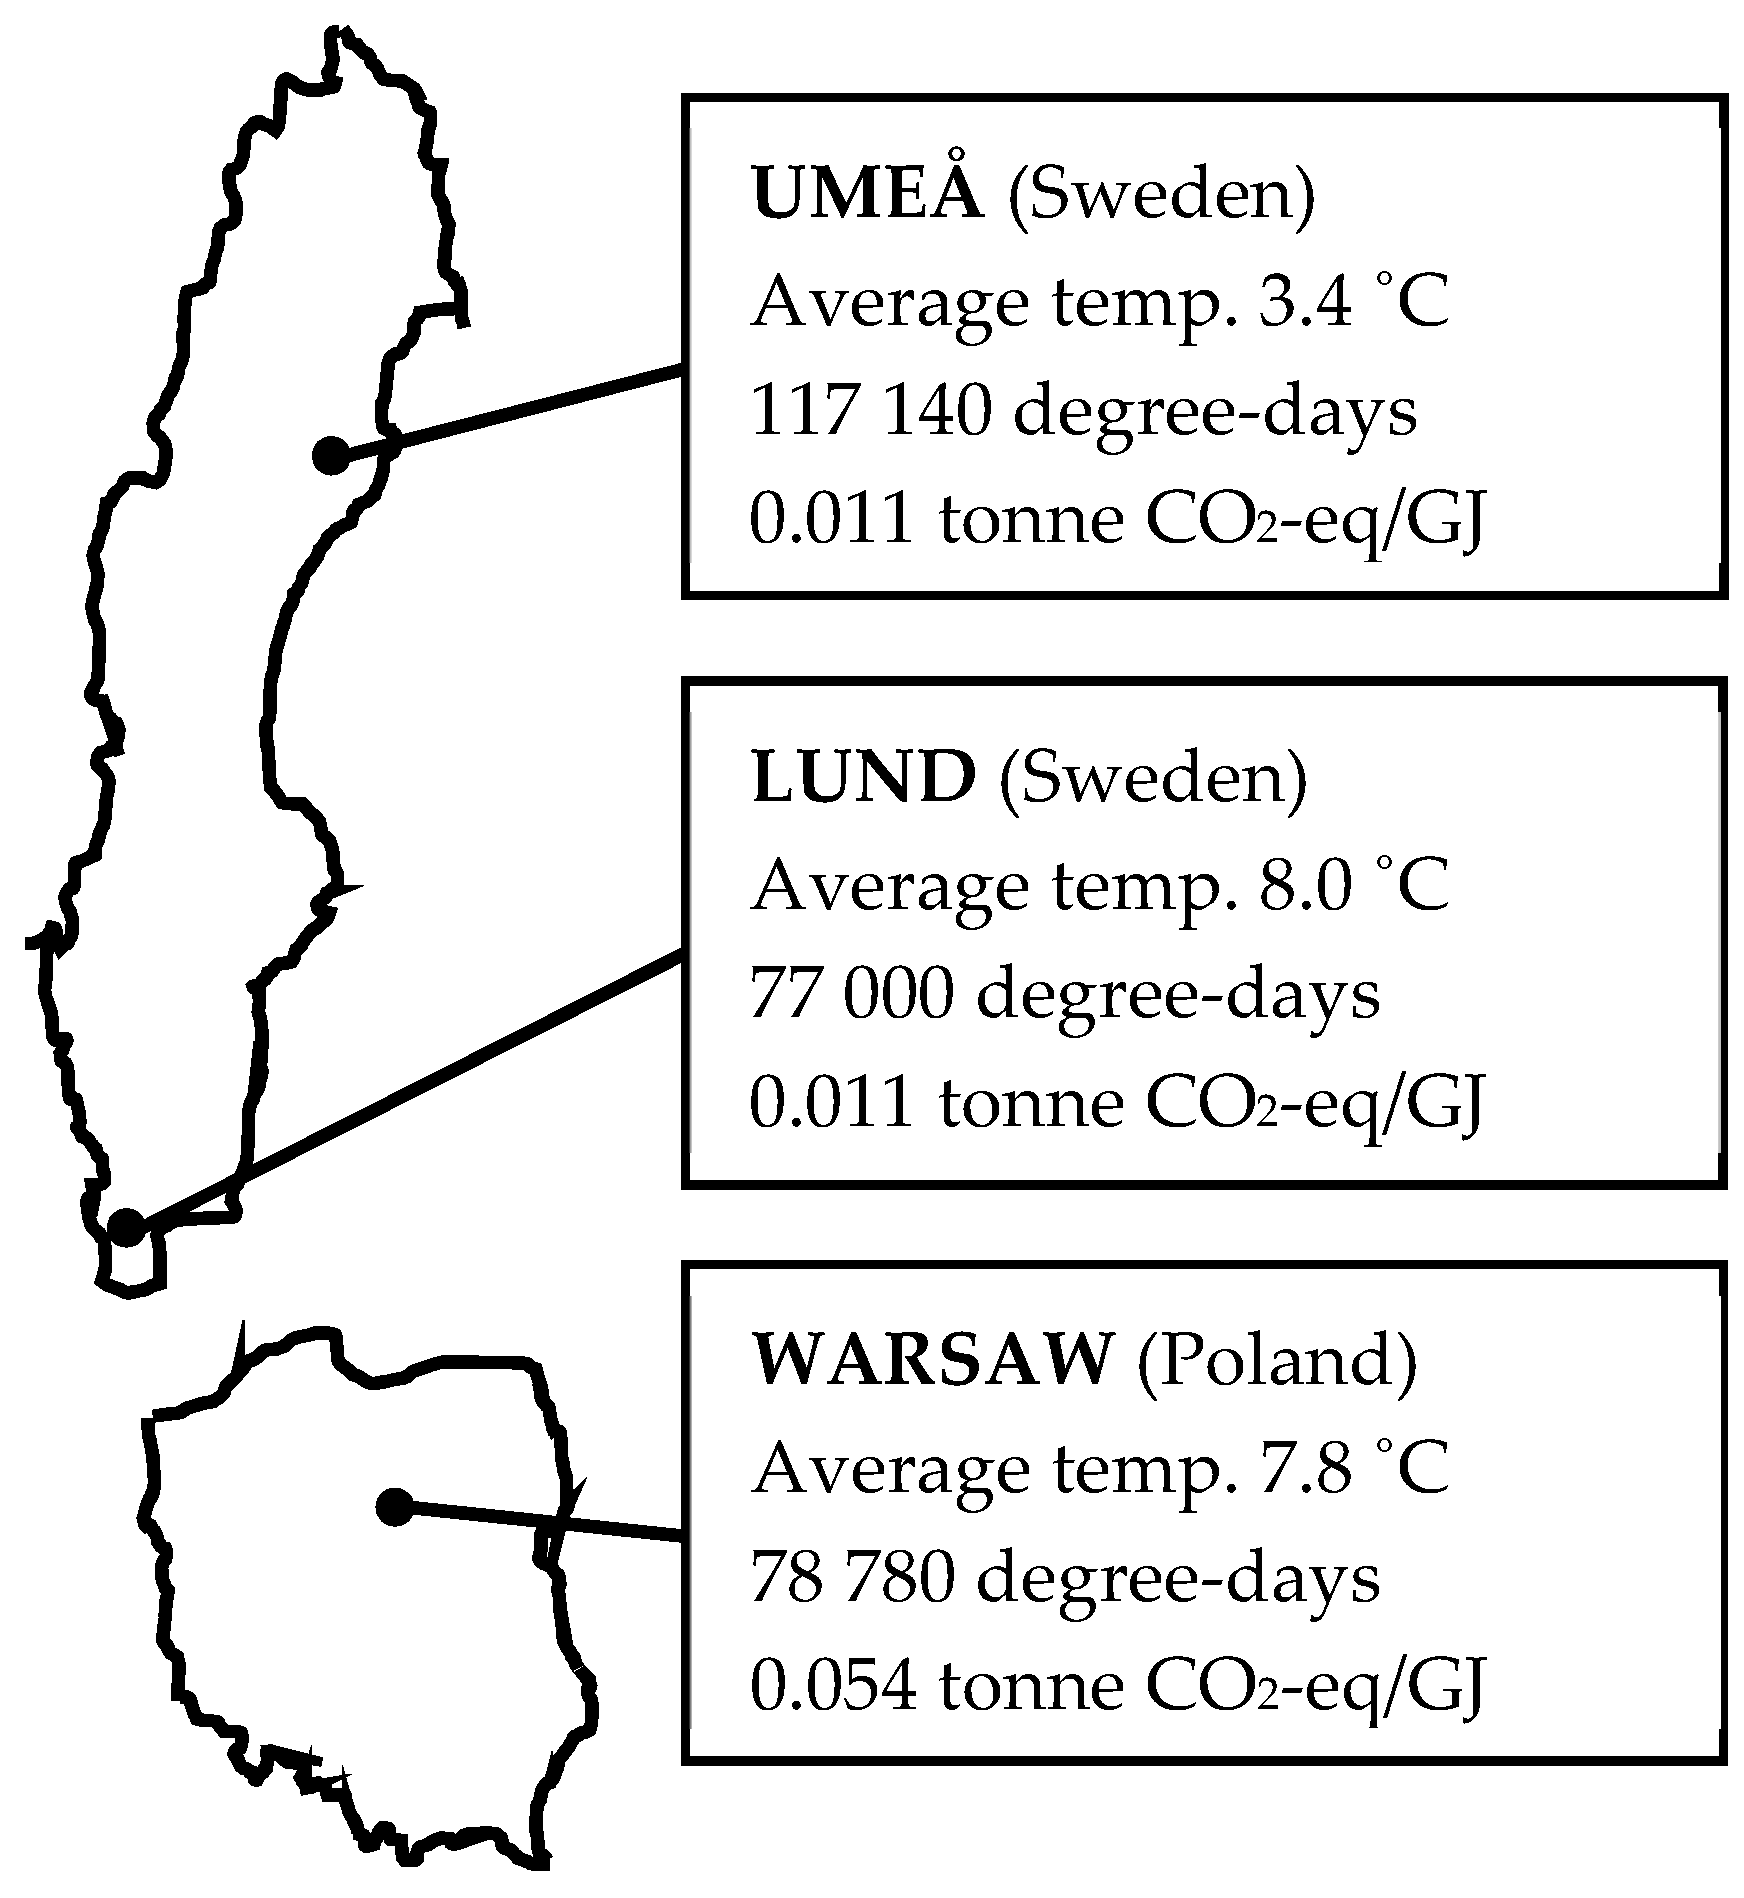
In Umeå, Sweden, the heat supply for space heating and domestic hot water comes from the centralized district heating grid. The combined heat and power (CHP) plant in Umeå runs on a low impact bio-based fuel with an emission factor of 0.011 tonne CO2-eq/GJ [33].
Parameters such as climate and heat sources influence the change in the impact of operational heating and ultimately the return and yield on the refurbishment investment. This is exemplified by theoretically compare climate and heat source for three different European locations, Umeå and Lund in Sweden and Warsaw in Poland. The design of the Umeå case building is directly transposed to Lund and Warsaw without considerations taken to differences in indigenous building design or local building refurbishment requirements. The degree-day method [34] is used to estimate the expected change in operational energy when relocating the case building to different European locations. For these reasons, the estimated EPMs for Lund and Warsaw is only theoretical and is used to analyze the influence of climate and heat source on the refurbishment performance.
In Figure 3 the average outdoor temperature, the calculated degree-days and the heat source emission factor for the European locations is shown. The Swedish locations, Umeå and Lund, has similar heat source emission factors but deviating amount of degree-days, while Lund in Sweden and Warsaw in Poland has similar amount of degree-days but deviating heat source emission factors. Thus, the influence of climate can be analyzed by comparing the Swedish cities of Umeå and Lund and the influence of heat source can be analyzed by comparing the Swedish city of Lund to the Polish city of Warsaw. The emissions factor for Umeå and Lund is assumed to be 0.011 tonne CO2-eq/GJ [33] and for Warsaw its assumed to be 0.054 tonne CO2-eq/GJ [35].
There are several different principles for estimating the environmental impact of electricity use [36]. Two common principles are average mix and marginal electricity. The average mix perspective is based on the view that a change in electricity demand affects all units in the system equally [37]. Thus, the impact of the average mix will differ significantly depending on which geographical region the calculations are based on.
The marginal electricity perspective is based on the view that a marginal change in electricity use influences the marginal generation unit, i.e., the electricity generation unit currently running at the highest marginal cost [38]. Traditionally, it is common to define either coal or natural gas condensing power as the marginal electricity mix [36,37]. However, there are studies arguing that electricity generation that runs at the highest marginal cost changes at different points in space and time and that the marginal electricity mix is likely to involve a mixture of different generation units [38,39].
Two average mix perspectives have been analyzed for two different geographical regions, the Nordic countries and Europe, and two traditional marginal electricity definitions have been used, coal and natural gas. The emission factors of the Nordic electricity mix (0.036 tonne CO2-eq/GJ [40]), the European electricity mix (0.175 tonne CO2-eq/GJ [41]) and marginal electricity defined as coal (0.319 tonne CO2-eq/GJ [33]) and natural gas (0.122 CO2-eq/GJ [42]) will be used to estimate changes in operational GHG emissions resulting of the installation of photovoltaics. The change in operational impact as a result of installing photovoltaics has only been analyzed for Umeå, Sweden as a geographical location.
4. Results and Discussion
ROIEnergy/GHGe and AYEnergy/GHGe have been estimated for the refurbishment measures conducted in the case building in order to compare the investments. The influence of climate and heat source will be studied by theoretically relocating the case building from Umeå, Sweden, to Lund, Sweden, and Warsaw, Poland. In addition, current and future heating scenarios for the geographical locations will be studied. Different principles for estimating the environmental impact of electricity will also be studied. The implemented energy-efficiency measures will be discussed together with the method.
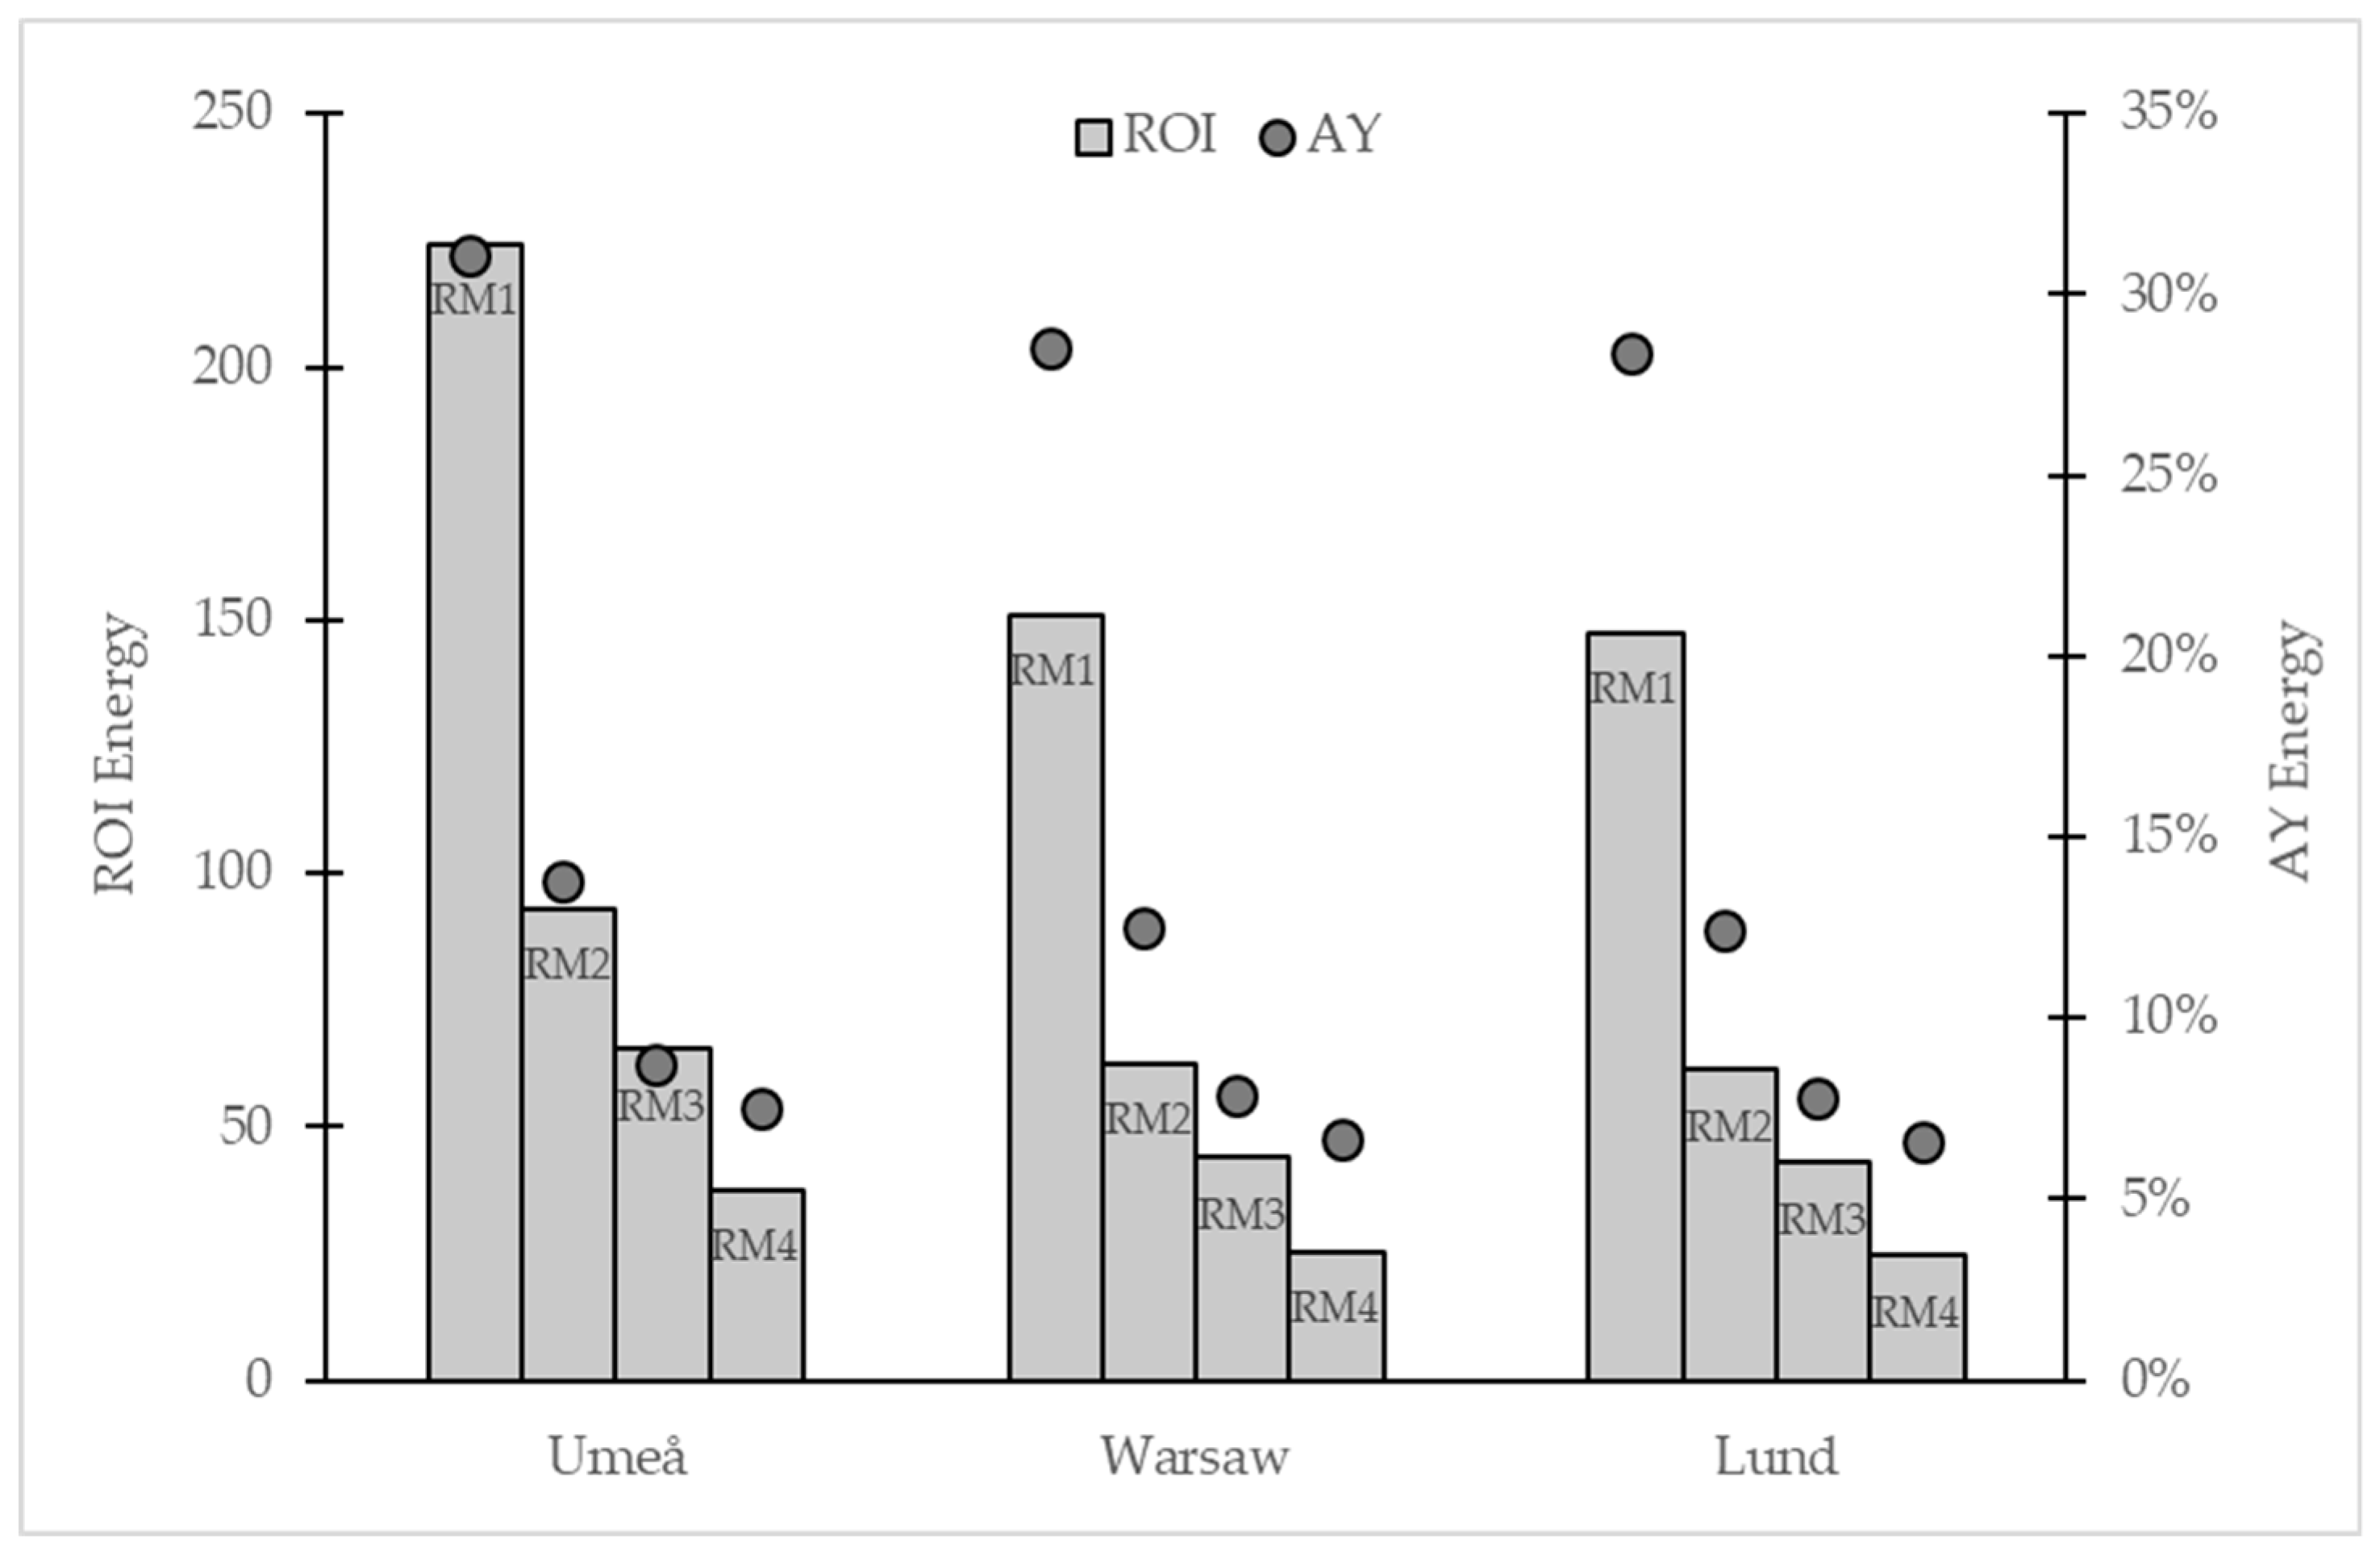
The refurbishment investments that contribute to a change in operational heating have been initially studied from an energy perspective, see Figure 4. An explanation of the acronyms used in Figure 4 can be found in Table 1.
Figure 4 shows that the energy return is greater in Umeå, Sweden, compared to the other geographical locations. This can be explained by the cold climate in Umeå. The difference between Lund and Warsaw is minimal due to similar average outdoor temperatures.
RM1 has the highest ROIEnergy and AYEnergy when compared with the refurbishment investments in the case building. For the measure RM1 in Umeå, ROIEnergy is 224 and AYEnergy is around 31%. This means that the energy gain is 224 times greater than the energy invested and the annual energy gain is around 31%.
Next, the change in operational GHG emissions as a result of reduced operational heating has been studied. In the analysis, of change in operational GHG emissions, two future scenarios for the European heat mix have been included [35]. The scenarios comprise the 2030 scenario, with an emission factor of 0.034 tonne CO2-eq/GJ and the 2050 scenario, with an emission factor of 0.006 tonne CO2-eq/GJ [35]. The present European heat mix includes around 12% District Heating (DH). The 2030 scenario is assumed to include 30% DH and the 2050 scenario includes 50% DH. The future scenarios are assumed to include an increased proportion of CHP heat supply with increased efficiency and higher amount of bio-based fuels. It is assumed that coal, oil and natural gas boilers will be replaced in both scenarios and in the 2050 scenario, a small proportion of large-scale heat pumps have been added to balance peak loads.
In Figure 5, the refurbishment investments can be studied from a GHG emissions perspective for the three geographical locations. ROIGHGe and AYGHGe have been estimated based on the environmental impact of the current heat mix of the geographical locations and for the future European scenarios. It is notable that only the European 2050 scenario has a lower emission factor than the present Swedish heat mix. Thus, only the 2050 scenario has been included for the Swedish locations of Umeå and Lund, in Figure 5.
An absolute minimum ROIGHGe required for a carbon neutral refurbishment investment is an ROI of one, which corresponds to an AYGHGe of zero percent. A negative AY means an ROI below one and a non-profitable investment. Installing new windows in Lund is a non-profitable investment taking into account the physical constraints of the case building. This means that the environmental cost of investing in windows in Lund is greater than the gain from installing them. With the 2050 scenario, investing in windows in any of the three geographical locations is unprofitable, unless the manufacturing of the windows had a reduced environmental impact.
The added embodied impact also affects the environmental performance of the refurbishment investment. Reducing AEI by reducing energy use and GHG emissions over the refurbishment life cycle will lead to increased environmental performance of the refurbishment measure. In the inventory analysis of the case building (see Table 2) no account has been taken of the impact of construction and end of life. This means that the AEI of the case study refurbishment measures have been advantageously estimated, resulting in an overestimated environmental performance. This does not affect the mutual comparison of the refurbishment measures of the case study since the same assumption has been made for all measures. To lower the AEI, the manufacturing process, construction process, maintenance and reuse of materials must continuously improve. Any progress on this front should be rewarded when choosing refurbishment measures. The method that is presented promotes this, since decreased AEI leads to increased EPMs.
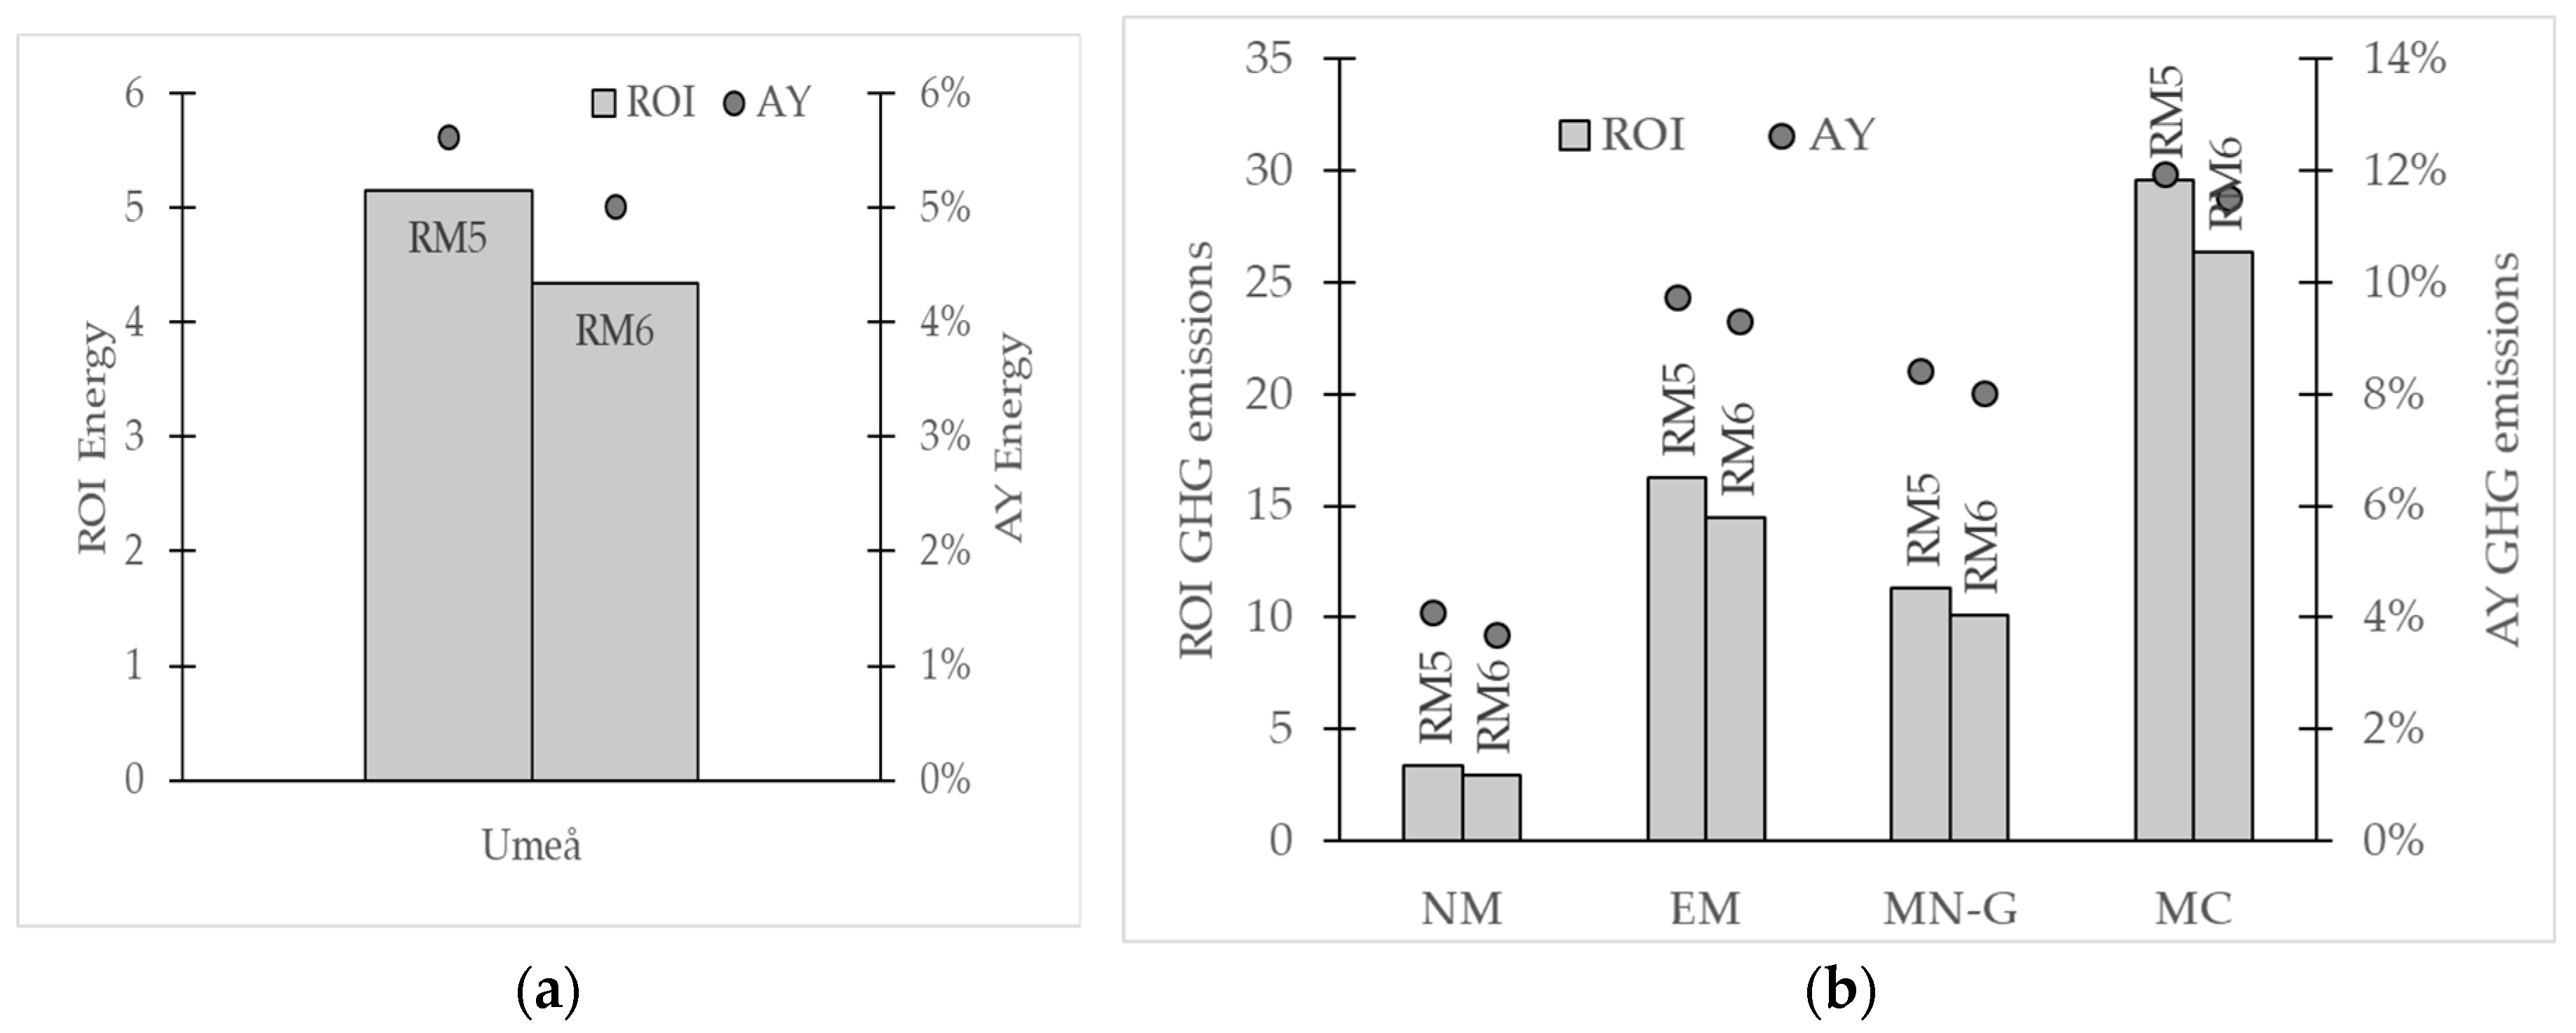
We will now study the refurbishment investments that contribute to a change in purchased operational electricity. Photovoltaics that produce electricity have been installed on the roof of the case building, see Table 1. PV have only been assessed for Umeå, Sweden, as a geographical location. The return on invested energy and GHG emissions and the annual energy and GHG emissions yield for photovoltaics are shown in Figure 6. In the figure, ROI is read on the left axis and is shown as columns, while AY is read on the right axis and is shown as circles in the figure.
When estimating ROIGHGe and AYGHGe, four different principles for assessing the environmental impact of the change in purchased operational electricity as a result of PV production have been analyzed. The Nordic and European average mix and marginal electricity are assumed to be fueled by natural gas and coal.
Energy return and annual energy yield for the investment in photovoltaics in Umeå, Sweden, are shown in Figure 6a. The results show that in comparison with the refurbishment measures that affect operational heat (see Figure 4) the photovoltaics have lower ROIEnergy and AYEnergy in Umeå. This means that on this occasion it was more advantageous from an energy perspective to invest in energy-efficiency measures affecting operational heat instead of photovoltaics.
From the results in Figure 6b we can conclude that the choice of environmental impact principle for purchased electricity has a significant influence on the result. The use of marginal electricity fueled by coal gives an 89% higher ROIGHGe compared to the Nordic average mix, which has the lowest environmental impact. According to the guidelines of the Swedish Environmental Research Institute, marginal electricity should be used when analyzing a change in electricity use and the average mix is appropriate for allocating liability for emissions [43]. If we are to follow this advice, we should use marginal electricity in the evaluation of photovoltaics on the case building in Umeå.
The objective of the refurbishment is of importance when assessing and comparing investments. The objective of the case building refurbishment in Umeå was to reduce operational energy use. Based on this objective, the three most optimal investment options (see Table 1) would be RM1, RM3 and RM2, respectively. These are also the refurbishment investments with the highest ROIEnergy and AYEnergy. However, when ROIGHGe and AYGHGe were studied, we see that RM2 has the lowest GHG emission performance among all the studied investments. This highlights the importance of refurbishment objectives for achieving governmental environmental objectives, since focusing on operational energy objectives alone when refurbishing a building can result in investments with low GHG emission performance. In the case of RM1, this investment has the highest energy and GHG emission performance, making the investment the most beneficial of the studied investments. Social and economic parameters, such as Life Cycle Cost (LCC), should be added to the environmental performance measures to further improve the assessment.
The question is, how should refurbishment objectives be formulated to ensure investments with as high an environmental performance as possible? Hall et al. introduce a minimum viable energy return on energy invested of three in a study on downstream energy use associated with refining, transporting and using oil and ethanol in the transport sector [24]. Hall et al’s theory is that the energy required to produce and use one unit of fuel is more extensive than the embodied energy of the fuel. Hall et al. argue that to compensate for the road infrastructure and equipment necessary to produce and use the fuel, a ROIEnergy larger than one needs to be achieved. The same theory has been used by Dutil et al. to suggest a minimum viable ROIEnergy of 10 for building insulation [25]. Estimating the minimum viable ROI and AY on investments is a relatively well-used theory for economic investments. We find the theory of a minimum viable EPM, i.e., minimum sustainable EPM, interesting and compatible with the method used.
Globally, most countries agree on the urge to reduce GHG emissions and that for a long time humankind has live beyond its natural resources [2]. Viewing refurbishment investments as a means of reducing GHG emissions may be a step towards coming to terms with decades of resource over use and rising temperatures. For a refurbishment investment to decrease GHG emissions, ROIGHGe must be greater than one and AYGHGe greater than zero percent. However, a reduction in GHG emissions is urgently required and the construction industry should be able to set reasonable objectives that contribute to a change. Thus, a sustainable EPM for building refurbishment must be substantially larger than one or zero percent for ROIGHGe and AYGHGe, respectively. In a previous study [23] that forms the basis of this study, we analyzed the refurbishment measures based on the assumption that the minimum sustainable ROI for energy and GHG emissions is three, with reference to the study by Hall et al. [24]. If the result in Figure 5 was to be analyzed based on this assumption it would only be sustainably justifiable to invest in RM2 (windows) in Warsaw with the present heat mix.
Guidelines on minimum sustainable EPMs should be developed with the aim of achieving national and international sustainability objectives. The European Union is working towards the objective of cutting emissions within the construction sector by 2050 by 90% compared to 1990 levels [44]. To reach this objective, several EU directives emphasize the importance of energy-efficient refurbishment to enhance building energy performance [45,46], preferably to near-zero energy levels [47]. A methodology for defining guidelines on minimum sustainable EPMs may be developed through backcasting from the defined energy and GHG emissions objectives. The backcasting should include mapping the number of buildings in need of refurbishment within the studied region and the time frame for the defined objectives. The classification of a building in need of refurbishment may vary between regions. Based on this information the necessary reduction in operational energy and GHG emissions can be estimated at a building level and guidelines for the minimum required EPM can be developed in order to achieve the set objectives. To avoid underestimating the required reduction, future construction must also be taken into account. The presented method together with developed guidelines on minimum sustainable EPMs can hopefully facilitate a familiar approach for the construction industry to assess the environmental performance of refurbishment measures from a life cycle perspective and based on defined objectives choose the most efficient investments.
5. Conclusions
The analysis of the case building refurbishment measures from a life cycle perspective showed that the most beneficial refurbishment measure was energy recovery ventilation (RM1). The analysis also showed that a measure with a considerable reduction in operational energy has a low environmental performance, e.g., change of windows (RM2). This confirms the significance of including all stages of the building life cycle when planning refurbishment investments, especially for buildings with a pronounced sustainability focus.
The method of using ROI and AY as performance measures for BR-LCA is suitable for the relative comparison and evaluation of refurbishment investments and allows multidimensional analysis. The versatility of the method has been shown by incorporating different climates, energy mixes and future energy scenarios. The climate of different geographical locations has been estimated by using the relatively simplistic degree-day method, which has provided an overall understanding of the impact of climate on the results. However, building energy simulation would allow more fine-tuned climate estimations and also permit simulation and life cycle assessment of a large variety of measures.
In order to set and achieve the desired environmental goals and make sustainable investment choices, the refurbishment objective is of significance. With the urgent need to reduce GHG emissions globally, there is an opportunity for the construction industry to view refurbishment investments as a tool for reducing GHG emissions. We would stress the significance of developing guidelines on minimum sustainable EPMs for building refurbishment based on research through backcasting from defined national and international energy and GHG emission objectives. Our proposed approach will hopefully allow the construction industry and policy makers to set sustainable refurbishment objectives that can support the choice of refurbishment investments.
Author Contributions
Conceptualization, H.N., S.A., A.P.Å. and T.O.; methodology, H.N., S.A., A.P.Å. and T.O.; formal analysis, H.N., S.A, A.P.Å. and T.O.; investigation, H.N.; data curation, H.N.; writing—original draft preparation, H.N.; writing—review and editing, H.N., S.A., A.P.Å. and T.O.; visualization, H.N.; supervision, T.O., S.A., A.P.Å.; project administration, T.O.; funding acquisition, T.O.
Funding
This research was funded by AB Bostaden, the Industrial Doctoral School at Umeå University and the European Union Regional Development Fund Interreg Botnia-Atlantic.
Conflicts of Interest
The authors declare no conflict of interest. The founding sponsors had no role in the design of the study; in the collection, analyses, or interpretation of data; in the writing of the manuscript, and in the decision to publish the results.
Abbreviations
| BR-LCA | Building Refurbishment-Life Cycle Assessment |
| EPBT | Energy Payback Time |
| EROI | Energy Return On Investment |
| ROI | Return On Investment |
| AY | Annual Yield |
| EPM | Environmental Performance Measure |
| TSL | Technical Service Life |
| GHGe | Greenhouse Gas emissions |
| CAGR | Compound Annual Growth Rate |
| EPD | Environmental Product Declarations |
| RM | Refurbishment Measures |
| CHP | Combined Heat- and Power |
| DH | District Heating |
| LCC | Life Cycle Cost |
References
- United Nations. UN Sustainable Development Goals. Available online: http://www.un.org/sustainabledevelopment/sustainable-development-goals/ (accessed on 4 December 2017).
- Intergovernmental Panel on Climate Change. Special Report on Global Warming of 1.5 °C; IPCC: Geneve, Swizerland, 2018. [Google Scholar]
- European Comission. European Union Climate Action. Available online: https://ec.europa.eu/clima/citizens/eu_en (accessed on 4 December 2017).
- Dixit, M.K.; Fernández-Solís, J.L.; Lavy, S.; Culp, C.H. Need for an embodied energy measurement protocol for buildings: A review paper. Renew. Sustain. Energy Rev. 2012, 16, 3730–3743. [Google Scholar] [CrossRef]
- Olsson, S.; Malmqvist, T.; Glaumann, M. An approach towards sustainable renovation—A tool for decision support in early project stages. Build. Environ. 2016, 106, 20–32. [Google Scholar] [CrossRef]
- Brown, N.W.O.; Olsson, S.; Malmqvist, T. Embodied greenhouse gas emissions from refurbishment of residential building stock to achieve a 50% operational energy reduction. Build. Environ. 2014, 79, 46–56. [Google Scholar] [CrossRef]
- Blengini, G.A.; Di Carlo, T. The changing role of life cycle phases, subsystems and materials in the LCA of low energy buildings. Energy Build. 2010, 42, 869–880. [Google Scholar] [CrossRef]
- Moschetti, R.; Mazzarella, L.; Nord, N. An overall methodology to define reference values for building sustainability parameters. Energy Build. 2015, 88, 413–427. [Google Scholar] [CrossRef]
- Rossi, B.; Marique, A.F.; Glaumann, M.; Reiter, S. Life-cycle assessment of residential buildings in three different European locations, basic tool. Build. Environ. 2012, 51, 395–401. [Google Scholar] [CrossRef]
- Boverket. Byggnaders Klimatpåverkan Utifrån Ett Livscykelperspektiv; Boverket-The Swedish National Board of Housing, Building and Planning: Stockholm, Sweden, 2015; p. 95.
- Olsson, S.; Liljenström, C.; Malmqvist, T. Miljöstyrning av Renoveringsprocessen: Intervjustudie Samt Litteratur-och Projektsammanställning; KTH Royal Institute of Technology: Stockohlm, Sweden, 2014. [Google Scholar]
- Saunders, C.; Landis, A.E.; Mecca, L.; Jones, A.; Schaefer, L.; Bilec, M.M. Analyzing the Practice of Life Cycle Assessment Focus on the Building Sector. J. Ind. Ecol. 2013, 17, 777–788. [Google Scholar] [CrossRef]
- Dutil, Y.; Rousse, D. Energy Costs of Energy Savings in Buildings: A Review. Sustainability 2012, 4, 1711–1732. [Google Scholar] [CrossRef] [Green Version]
- Sesana, M.M.; Salvalai, G. Overview on life cycle methodologies and economic feasibility for nZEBs. Build. Environ. 2013, 67, 211–216. [Google Scholar] [CrossRef]
- Matthews, T.; Treloar, G.J. Net energy analysis of double glazing for residential buildings in temperate climates. Struct. Surv. 2001, 19, 201–208. [Google Scholar] [CrossRef]
- Bhandari, K.P.; Collier, J.M.; Ellingson, R.J.; Apul, D.S. Energy payback time (EPBT) and energy return on energy invested (EROI) of solar photovoltaic systems: A systematic review and meta-analysis. Renew. Sustain. Energy Rev. 2015, 47, 133–141. [Google Scholar] [CrossRef]
- Vilches, A.; Garcia-Martinez, A.; Sanchez-Montañes, B. Life cycle assessment (LCA) of building refurbishment: A literature review. Energy Build. 2017, 135, 286–301. [Google Scholar] [CrossRef]
- Anand, C.K.; Amor, B. Recent developments, future challenges and new research directions in LCA of buildings: A critical review. Renew. Sustain. Energy Rev. 2017, 67, 408–416. [Google Scholar] [CrossRef] [Green Version]
- Ma, Z.; Cooper, P.; Daly, D.; Ledo, L. Existing building retrofits: Methodology and state-of-the-art. Energy Build. 2012, 55, 889–902. [Google Scholar] [CrossRef]
- Hall, T.; Vidén, S. The Million Homes Programme: A review of the great Swedish planning project. Plan. Perspect. 2005, 20, 301–328. [Google Scholar] [CrossRef]
- Boverket. Delegationen för Hållbara Städer; National Board of Housing, Building and Planning: Stockohlm, Sweden, 2017.
- Vesterberg, J.; Andersson, S.; Söderström, R. Validering lärande och utveckling av hållbarhetsmål i Hållbara Ålidhem-Slutrapport; Boverket (Swedish National Board of Housing, Building and Planning): Karlskrona, Sweden, 2017.
- Nydahl, H.; Andersson, S.; Åstrand, A.P.; Olofsson, T. Building Refurbishment from a Life Cycle Perspective—An Environmental Return on Investment Approach. In Proceedings of the Cold Climate HVAC, Kiruna, Sweden, 12–15 March 2018. [Google Scholar]
- Hall, C.; Balogh, S.; Murphy, D. What is the Minimum EROI that a Sustainable Society Must Have? Energies 2009, 2, 25–47. [Google Scholar] [CrossRef] [Green Version]
- Dutil, Y.; Rousse, D.; Quesada, G. Sustainable Buildings: An Ever Evolving Target. Sustainability 2011, 3, 443–464. [Google Scholar] [CrossRef] [Green Version]
- ISO EN 15978:2011. Sustainability of Construction Works—Assessment of Environmental Performance of Buildings—Calculation Method; Swedish Standards Institute: Stokholm, Sweden, 2011; p. 72. [Google Scholar]
- Nyman, M.; Simonson, C.J. Life-Cycle Assessment (LCA) of Air-Handling Units with and without Air-to-Air Energy Exchangers. ASHRAE Trans. 2004, 110, 399–409. [Google Scholar]
- Switala-Elmhurst, K. Life cycle assessment of residential windows: Analyzing the environmental impact of window restoration versus window replacement. In Partial Fulfillment of the Requirements for the Degree of Doctor of Philosophy; Udo-Inyang, B., Flamm, M., Henry, S., Serrano, S., Van Aken, B., Eds.; ProQuest Dissertations Publishing: Ann Arbor, MI, USA, 2014. [Google Scholar]
- Tettey, U.Y.A.; Dodoo, A.; Gustavsson, L. Effects of different insulation materials on primary energy and CO2 emission of a multi-storey residential building. Energy Build. 2014, 82, 369–377. [Google Scholar] [CrossRef]
- Gustavsson, L.; Sathre, R. Variability in energy and carbon dioxide balances of wood and concrete building materials. Build. Environ. 2006, 41, 940–951. [Google Scholar] [CrossRef]
- De Wild-Scholten, M.J. Energy payback time and carbon footprint of commercial photovoltaic systems. Sol. Energy Mater. Sol. Cells 2013, 119, 296–305. [Google Scholar] [CrossRef]
- Gaidajis, G.; Angelakoglou, K. Environmental performance of renewable energy systems with the application of life-cycle assessment: A multi-Si photovoltaic module case study. Civ. Eng. Environ. Syst. 2012, 29, 231–238. [Google Scholar] [CrossRef]
- Engström, R.; Gode, J.; Axelsson, U. Vägledning till Metodval vid Beräkning av Påverkan Från Förändrad Energianvändning på de Svenska Miljömålen; Framtagen med stöd av Miljömålsrådet, Energimyndigheten och Naturvårdsverket: Stockholm, Sweden, 2009; p. 76. [Google Scholar]
- VVS-tekniska föreningen. VVS Handboken; Förlags AB VVS: Stockholm, Sweden, 1974. [Google Scholar]
- Lund, H.; Werner, S.; Connolly, D.; Vad Mathiesen, B.; Alberg Østergaard, P.; Möller, B.; Nielsen, S.; Persson, U.; Nilsson, D.; Trier, D. Heat Roadmap Europe 2050; Alborg University: Alborg, Denmark, 2012; p. 99. [Google Scholar]
- Dotzauer, E. Greenhouse gas emissions from power generation and consumption in a nordic perspective. Energy Policy 2010, 38, 701–704. [Google Scholar] [CrossRef]
- Levihn, F. CO2 emissions accounting: Whether, how, and when different allocation methods should be used. Energy 2014, 68, 811–818. [Google Scholar] [CrossRef]
- Olkkonen, V.; Syri, S. Spatial and temporal variations of marginal electricity generation: The case of the Finnish, Nordic, and European energy systems up to 2030. J. Clean. Prod. 2016, 126, 515–525. [Google Scholar] [CrossRef]
- Lund, H.; Mathiesen, B.V.; Christensen, P.; Schmidt, J.H. Energy system analysis of marginal electricity supply in consequential LCA. Int. J. Life Cycle Assess. 2010, 15, 260–271. [Google Scholar] [CrossRef]
- Martinsson, F.; Gode, J.; Arnell, J.; Höglund, J. Emissionsfaktor för nordisk elmix, IVL; Swedish Environmental Research Institute: Stockholm, Sweden, 2012; p. 35. [Google Scholar]
- Schakenda, V.; Askham Nyland, C. CO2-Emissions Associated with Different Electricity Mixes; Ostfold Research: Krakeroy, Norway, 2010; p. 20. [Google Scholar]
- Spath, P.; Mann, M. Life Cycle Assessment of a Natural Gas Combined-Cycle Power Generation System; National Renewable Energy Laboratory: Golden, CO, USA, 2000; p. 56.
- Gode, J.; Byman, K.; Persson, A.; Trygg, L. Miljövärdering av el ur ett Systemperspektiv; IVL Swedish Environmental Research Institute: Stockholm, Sweden, 2009; p. 12. [Google Scholar]
- EU. A Roadmap for moving to a competitive low carbon economy in 2050. In European Capitals of Culture; European Commission: Brussels, Belgium, 2011; p. 15. [Google Scholar]
- Recast, E. Directive 2010/31/EU of the European Parliament and of the Council of 19 May 2010 on the energy performance of buildings. Off. J. Eur. Union 2010, 153, 13–35. [Google Scholar]
- The European Parliament and The Council of the European Union. Directive (EU) 2018/844 of the European Parliament and of the Council of 30 May 2018 amending Directive 2010/31/EU on the energy performance of buildings and Directive 2012/27/EU on energy efficiency (Text with EEA relevance), PE/4/2018/REV/1. Off. J. Eur. Union 2018, 156, 75–91. [Google Scholar]
- EU. EU Countries’ Nearly Zero-Energy Buildings National Plans; European Commission: Brussels, Belgium, 2018. [Google Scholar]
Figure 1.
Process of estimating EPMs for building refurbishment.
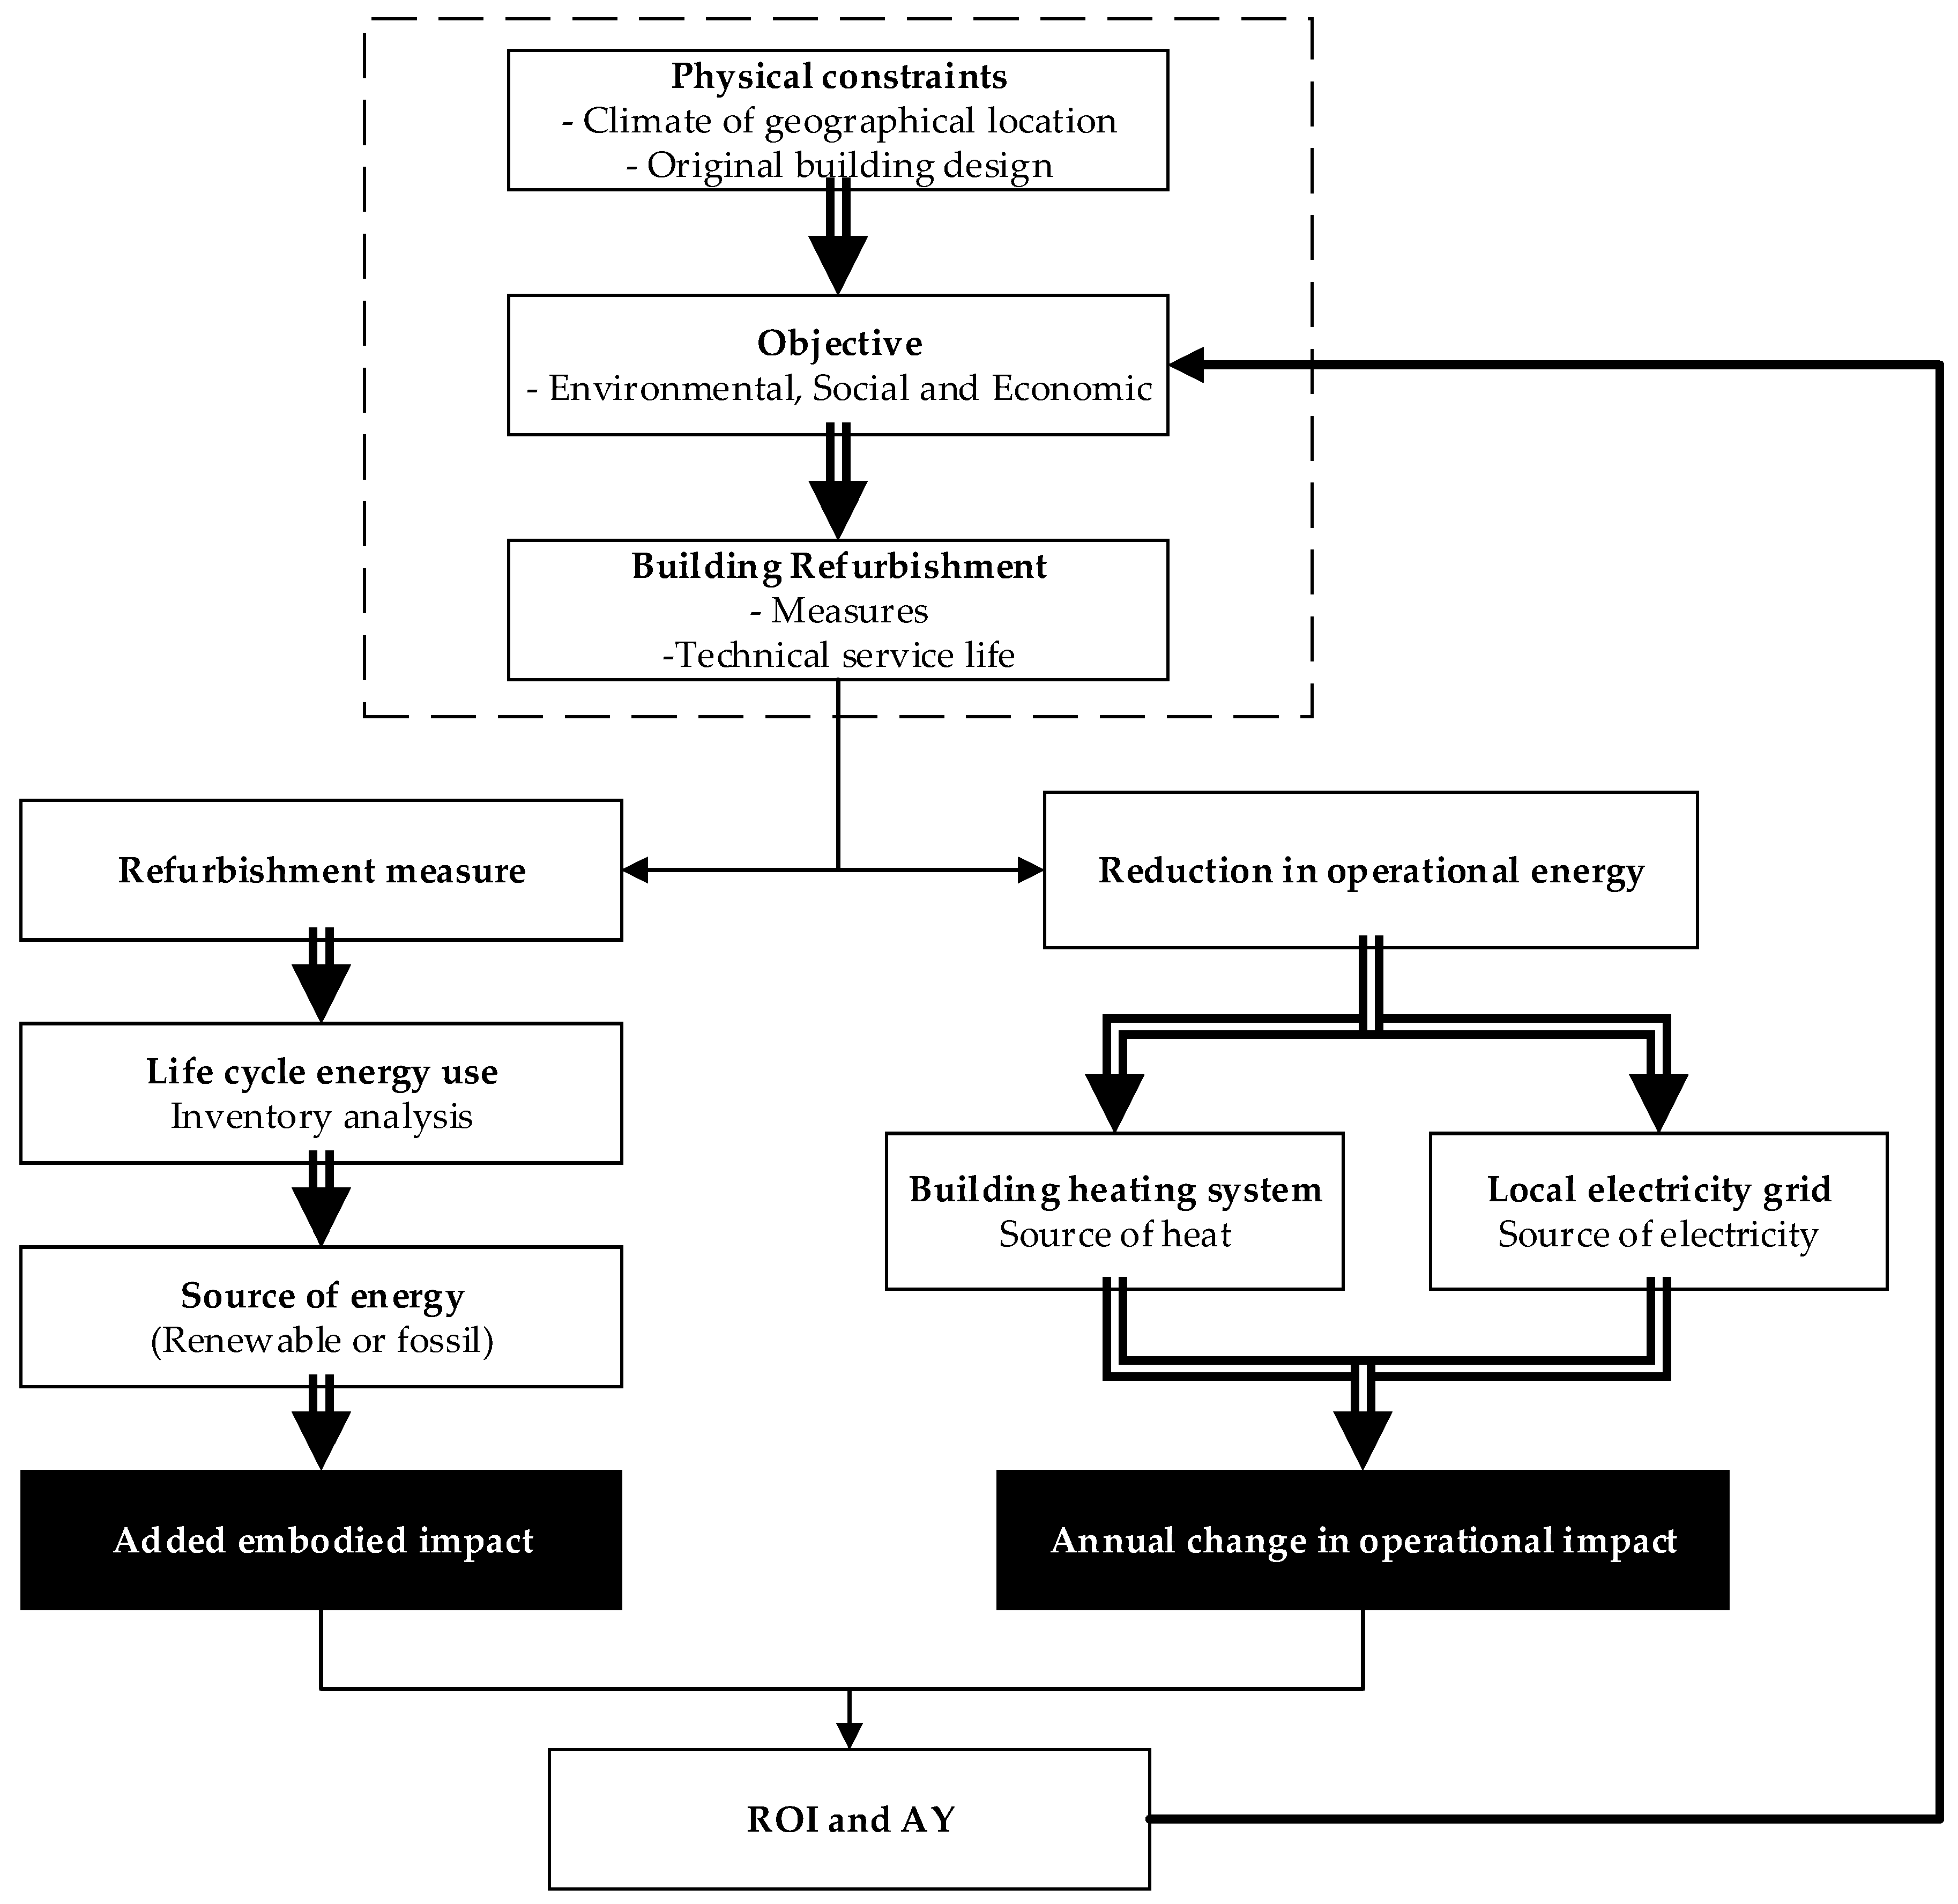
Figure 2.
Blue print showing the architectural design of the case building and geographical orientation of the building and photovoltaics.
Figure 2.
Blue print showing the architectural design of the case building and geographical orientation of the building and photovoltaics.

Figure 3.
Three geographical sites in Europe, Umeå and Lund in Sweden and Warsaw in Poland were used in order to study the influence of climate and heat source on ROIEnergy/GHGe and AYEnergy/GHGe. The degree-days has been calculated for an indoor heating requirement of 17 °C. The remaining heat requirement is assumed to be covered by internal loads.

Figure 4.
Comparison of refurbishment investments affecting operational heating. The measures have been assessed from an energy perspective using ROIEnergy and AYEnergy as EPMs for three geographical locations. ROIEnergy is read on the left axis (shown as columns) and AYEnergy on the right axis (shown as circles).

Figure 5.
Return on invested GHG emissions and annual GHG emissions yield for Umeå, Lund and Warsaw with the heat source emission factors for the respective locations. Future heating scenarios, for the 2030 and 2050 heat mix, are included for the geographical locations. ROIGHGe is read on the left axis (shown as columns) and AYGHGe on the right axis (shown as circles).

Figure 6.
Assessment of investments in photovoltaics in Umeå, Sweden that affect purchased operational electricity. ROI is read on the left axis (shown as columns) and AY is read on the right axis (shown as circles). (a) Return on invested energy and annual energy yield; (b) assessed from a GHG emissions perspective using ROIGHGe and AYGHGe as EPMs. To assess GHG emissions four different environmental impact principles for electricity have been used: Nordic electricity mix (NM), European electricity mix (EM), marginal electricity based on natural gas (MN-G) and marginal electricity based on coal (MC).


Table 1.
Properties of the case building before and after refurbishment.
| Before Refurbishment | Refurbishment Measures | Acronym | Annual Reduction in Operational Energy (GJ/year) |
|---|---|---|---|
| Balanced ventilation | Energy recovery ventilation | RM1 | 263 |
| 2-glass windows (U-value of 2.2 WK−1 m−2) | 3-glass windows (U-value of 1.1 WK−1 m−2) | RM2 | 37.8 |
| Roof insulation of 25 cm wood chips | Roof insulation of 50 cm loose glass wool | RM3 | 76.0 |
| Envelope wall insulation of 10 cm glass wool | Additional wall insulation. 2.8 cm glass wool on short sides and 9.0 cm on long sides | RM4 | 23.4 |
| - | 70 m2 of CIGS Photovoltaics | RM5 | 18.8 |
| - | 55 m2 Multi-Si Photovoltaics | RM6 | 18.1 |
Table 2.
Inventory analysis based on the EN 15978:2011 standard.
| Refurbishment Measure | Production Stage | Construction Stage | Use Stage | End-of-Life Stage |
|---|---|---|---|---|
| RM1 | European impact data. Resource-related impacts have been allocated the recyclability of the materials in the air-handling unit, 70% for steel, 90 % for copper and 75% for aluminum [27]. | No considerations given to transport and construction installation processes [27]. | Changing of filters every six months (40 used over the TSL) [27]. | No regards to environmental impact from deconstruction, reuse, transport or disposal [27]. |
| RM2 | European impact data. GaBi Software was used to estimate the AEI [28]. | No considerations given to transport and construction installation processes [28]. | No maintenance [28]. | No regards to environmental impact from deconstruction, reuse, transport or disposal [28]. |
| RM3 & RM4 | Northern Europe impact data. Primary energy use includes extraction, process, transport and assembly [29]. Emission factors, oil (0.022 tonne CO2-eq/GJ), fossil gas (0.018 tonne CO2-eq/GJ) and coal (0.03 tonne CO2-eq/GJ) [30]. | No considerations given to transport and construction installation processes [29]. | No maintenance [29]. | No regards to environmental impact from deconstruction, reuse, transport or disposal [29]. |
| RM5 & RM 6 | European impact data. Primary energy use include extraction, process, transport and assembly. Solar-grade poly-silicone is assumed to be produced by hydropower. The other components by the UCTE electricity mix [31]. | No considerations given to transport and construction installation processes [31]. | Maintenance requires water use for cleaning the PV, infrastructure and energy use for water treatment and transportation to end user. Transport impact by maintenance personnel, PV module-check performed three times annually [32]. | No regards to environmental impact from deconstruction, reuse, transport or disposal [31]. |
Table 3.
Information about the refurbishment measures made in the case building.
| Refurbishment Measure | Technical Service Life (years) | Weight/Area Unit | Specific Added Embodied Energy | Specific Added Embodied GHG Emissions |
|---|---|---|---|---|
| RM1 | 20 a | 0.69 tonne | 33.9 GJ/tonne | 1.90 tonne CO2-eq/tonne |
| RM2 | 35 b | 114 m2 | 0.13 GJ/m2 | 0.11 tonne CO2-eq/m2 |
| RM3 | 50 c | 3 tonne | 19.5 GJ/tonne | 0.62 tonne CO2-eq/tonne |
| RM4 | 50 c | 1.6 tonne | 19.5 GJ/tonne | 0.62 tonne CO2-eq/tonne |
| RM5 | 30 d | 70 m2 | 1.57 GJ/m2 | 0.09 tonne CO2-eq/m2 |
| RM6 | 30 d | 55 m2 | 2.28 GJ/m2 | 0.12 tonne CO2-eq/m2 |
© 2019 by the authors. Licensee MDPI, Basel, Switzerland. This article is an open access article distributed under the terms and conditions of the Creative Commons Attribution (CC BY) license (http://creativecommons.org/licenses/by/4.0/).
Share and Cite
MDPI and ACS Style
Nydahl, H.; Andersson, S.; Åstrand, A.P.; Olofsson, T. Environmental Performance Measures to Assess Building Refurbishment from a Life Cycle Perspective. Energies 2019, 12, 299. https://doi.org/10.3390/en12020299
AMA Style
Nydahl H, Andersson S, Åstrand AP, Olofsson T. Environmental Performance Measures to Assess Building Refurbishment from a Life Cycle Perspective. Energies. 2019; 12(2):299. https://doi.org/10.3390/en12020299
Chicago/Turabian StyleNydahl, Helena, Staffan Andersson, Anders P. Åstrand, and Thomas Olofsson. 2019. "Environmental Performance Measures to Assess Building Refurbishment from a Life Cycle Perspective" Energies 12, no. 2: 299. https://doi.org/10.3390/en12020299
Note that from the first issue of 2016, this journal uses article numbers instead of page numbers. See further details here.