A Prediction Model for Methane Adsorption Capacity in Shale Gas Reservoirs


Curtin WA School of Mines: Minerals, Energy and Chemical Engineering, Perth 6151, Australia
*
Authors to whom correspondence should be addressed.
Energies 2019, 12(2), 280; https://doi.org/10.3390/en12020280
Submission received: 5 December 2018
/
Revised: 4 January 2019
/
Accepted: 13 January 2019
/
Published: 16 January 2019
(This article belongs to the Special Issue Development of Unconventional Reservoirs)
Abstract
:Estimation of methane adsorption capacity is crucial for the characterization of shale gas reservoirs. The methane adsorption capacity in shales is measured using high-pressure methane adsorption to obtain the adsorption isotherms, which can be fitted by Langmuir model. The determined Langmuir parameters can provide the methane adsorption capacity under actual reservoir conditions. In this study, a prediction model for the methane adsorption in shales was constructed based on 66 samples from 6 basins in China and Western Australia. The model was established in four steps: a model of Langmuir volume at experimental temperature, the temperature dependence of Langmuir volume, a model of Langmuir pressure, the temperature dependence of Langmuir pressure. In the model of Langmuir volume at experimental temperature, total organic carbon (TOC) and clay content (Vsh) were considered. A positive relationship was observed between the TOC and the temperature effect on the Langmuir volume. As the Langmuir pressure is sensitive to various factors, the Langmuir pressure at experimental temperature shows no trend with the TOC, clay content and thermal maturity, but a positive trend with the Langmuir volume. The results of this study can help log analysts to quantify adsorbed gas from well-log data since TOC and Vsh, which are the measure inputs of the introduced models, can be obtained from well-log data as well.
1. Introduction
Shale gas contains not only free gas in pore volume but also a significant amount of adsorbed gas on the surface area of the pore wall [1]. The usual method for assessing the methane adsorption capacity in shale gas is high-pressure methane adsorption experiment to obtain adsorption isotherms. The high-pressure methane adsorption isotherms can be fitted by many models. The most popular model is the Langmuir model because of its simplicity and accuracy [2,3]. Langmuir parameters such as Langmuir volume and Langmuir pressure can be determined using Equation (1) to characterize the methane adsorption isotherms of shale samples [4].
where is the Langmuir volume, defined as the maximum gas content that can be adsorbed on shale at an infinite pressure; is the Langmuir pressure, defined as the pressure at which one-half of the Langmuir volume can be adsorbed; Vads is the adsorbed gas content and P is the experimental pressure.
With the Langmuir parameters, the methane adsorption capacity of shale sample at certain pressure can be predicted. Thus, it is necessary to have a quantitative model of the Langmuir parameters for evaluating the methane adsorption capacity in shales.
However, the Langmuir parameters are controlled by various factors [5]. It has been reported that the Langmuir volume is related to the compositional properties (total organic content, thermal maturity, and clay minerals content), pore structure properties (specific surface area and micropore volume) and reservoir conditions (pressure, temperature and moisture content) [6,7,8,9]. As for the Langmuir pressure, the most considered controlling factor is temperature, but it was also observed that the Langmuir pressure is related to composition and volume of small pores [6,10,11]. Furthermore, a power-law decrease trend was found between the Langmuir pressure and Vitrinite Reflectance [5]. Based on the controlling factors of the Langmuir parameters, the prediction model for the methane adsorption capacity in shale gas has been constructed by many scholars [11,12,13]. As listed in Table 1, however, the considered factors in the models are different: in terms of the Langmuir volume, TOC is the only considered factor for organic-rich shales by Zhang, Ellis [11]; apart from the TOC, Liu, Chen [13] also considered the clay content for low TOC shales. Li, Tian [12] used other parameters in the model to improve accuracy, such as the amount of residual hydrocarbon and temperature. For the Langmuir pressure, Zhang, Ellis [11] classified the shale samples by the thermal maturity and employed the temperature to model the Langmuir pressure; the temperature is the only considered factor in the model of the Langmuir pressure by Liu, Chen [13], while the content of clay minerals, illite, feldspar, and carbonate was used by Li, Tian [12]. However, some of the considered parameters are hard to obtain from well log, such as the content of residual hydrocarbon, illite, feldspar, and carbonate. Furthermore, the prediction models of methane adsorption capacity in previous studies were established on data from specific formations or basins. To assess the methane adsorption capacity in shales, it is required to establish a prediction model based on representative data and proper factors.
In this study, we analyzed the experiment results of high-pressure methane adsorption on shales using available published and our unpublished data. The experimental procedures of our unpublished data have been described in a previous work [14]. Given that the experimental temperatures are not constant among the related studies, the Langmuir parameters were modeled at experimental temperature first and then the temperature dependence of Langmuir parameters was explored. With various shale samples, the results can contribute to the evaluation of the methane adsorption in shales.
2. Materials
As the high-pressure methane adsorption experiments are intrinsically controlled by various factors [15], all the considered data must be obtained under similar experimental conditions (e.g., dry with the particle size of <250 µm) with available compositional and geochemical information. It is worth mentioning that data of wet shale samples were not employed because the moisturization level is not constant and the number of shale samples in wet condition is constrained. Meanwhile, the 60 mesh (<250 µm) was applied in this study, as it has been widely used in the related studies. In addition, 60-80 mesh was also carried out with close particle diameter to 60 mesh to involve as much data as possible. Under these conditions, a total of 66 samples from 6 Basins in China and Western Australia were studied [14,16,17,18,19]. The samples have a TOC range of 0.23 to 28.48 wt % and clay content range of 20.1 to 83.5. Thermal maturity of the samples directed measured by rock-eval in Tmax, ranges from 424 to 589 °C. Vitrinite Reflectance (Ro) is not used for the thermal maturity, because the convention from Tmax to Ro is not constant for different basins. The wide ranges of compositional and geochemical parameters indicate good representativeness of the studied shale samples. The detailed information about the studied samples is provided in an Appendix at the end of the paper.
3. Results and Discussion
Since the studied shale samples were measured at different temperatures and the amount of data at each high temperature is limited, a model of the Langmuir volume at experimental temperature (30 °C) was considered first. The experimental temperature in the range of 25–30 °C was regarded as the similar condition due to the little temperature difference. Secondly, the model was updated for the methane adsorption under actual reservoir conditions, at higher reservoir temperature.
3.1. Model of Langmuir Volume at Experimental Temperature
As the collected adsorption data of 10 samples are not available at experimental temperature, a total of 56 samples in 5 basins were studied for the model of Langmuir volume at experimental temperature. Figure 1 shows the positive relationship between the TOC and Langmuir volume at experimental temperature, with a coefficient of determination of 0.87, indicating the critical role of organic matter in methane adsorption in shales. However, more data is still required as the shale samples in the TOC range of 10 to 25 wt % is limited in Figure 1.
Comparing with the TOC, clay content appears to have a much less relationship with the Langmuir volume (Figure 2), demonstrating a limited contribution to the methane adsorption. However, it has been reported that the contribution of clay minerals to the methane adsorption is significant for low TOC shale samples [6,20]. To explore the effect of clay on methane adsorption in shales, the studied samples were classified into three groups of low (0–1.5%), medium (1.5–3%), and high (>3%) based on the TOC content.
As for the clay content, Figure 3 displays a good relationship between the clay content and Langmuir volume at experimental temperature for the low TOC samples but not for medium and high TOC samples. The phenomenon demonstrates that the clay content is the critical controlling factor of methane adsorption for low TOC shales, but its effect weakens in higher TOC samples due to the organic matter. This is because both organic matter and clay minerals can adsorb methane. Comparing with low TOC samples, high TOC samples have smaller proportion of methane adsorbed on clay content. Furthermore, the slopes of the relationship between the clay content and Langmuir volume at experimental temperature for the three groups of shales have no big difference, with the range of 1 to 1.73. The similarity of the slopes indicates that there is no remarkable difference between organic-poor and organic-rich shales with respect to the adsorption capacity of clay minerals. Note that the type of clay minerals was not specified for their relationship to Langmuir volume. The reason is that the content of each clay type is hard to obtain directly from well log and illite dominates the clay content for the applied data.
Apart from the TOC and clay content, thermal maturity is also believed to control the methane adsorption in shales. It has been reported that the relationship between the TOC-normalized maximum methane adsorption capacity (Langmuir volume divided by the TOC) and thermal maturity is positive for mature shales and negative for over mature shales [5,11]. However, the thermal maturity in the form of Tmax displays no relationship to the TOC-normalized Langmuir volume at experimental temperature for the collected data (Figure 4). The phenomenon can be explained in two aspects: 1. The TOC-normalized Langmuir volume can be influenced by clay content especially for the low TOC shale; 2. other factors such as kerogen type, thermal maturity levels, and depositional environment may have impacts on methane adsorption capacity. Therefore, the thermal maturity is not considered in the model of the Langmuir volume at experimental temperature.
According to the linear relationship of the Langmuir volume to TOC and clay content, a model for the Langmuir volume at experimental temperature is proposed in the form of the following equation:
where , and are the fitting coefficients, which can be determined using the 56 studied samples in by multiple linear regression. Thus, the prediction model is written as follows:
where VL is the Langmuir volume at experimental temperature, scf/ton; TOC is the total organic carbon, wt %; is the total clay content, %.
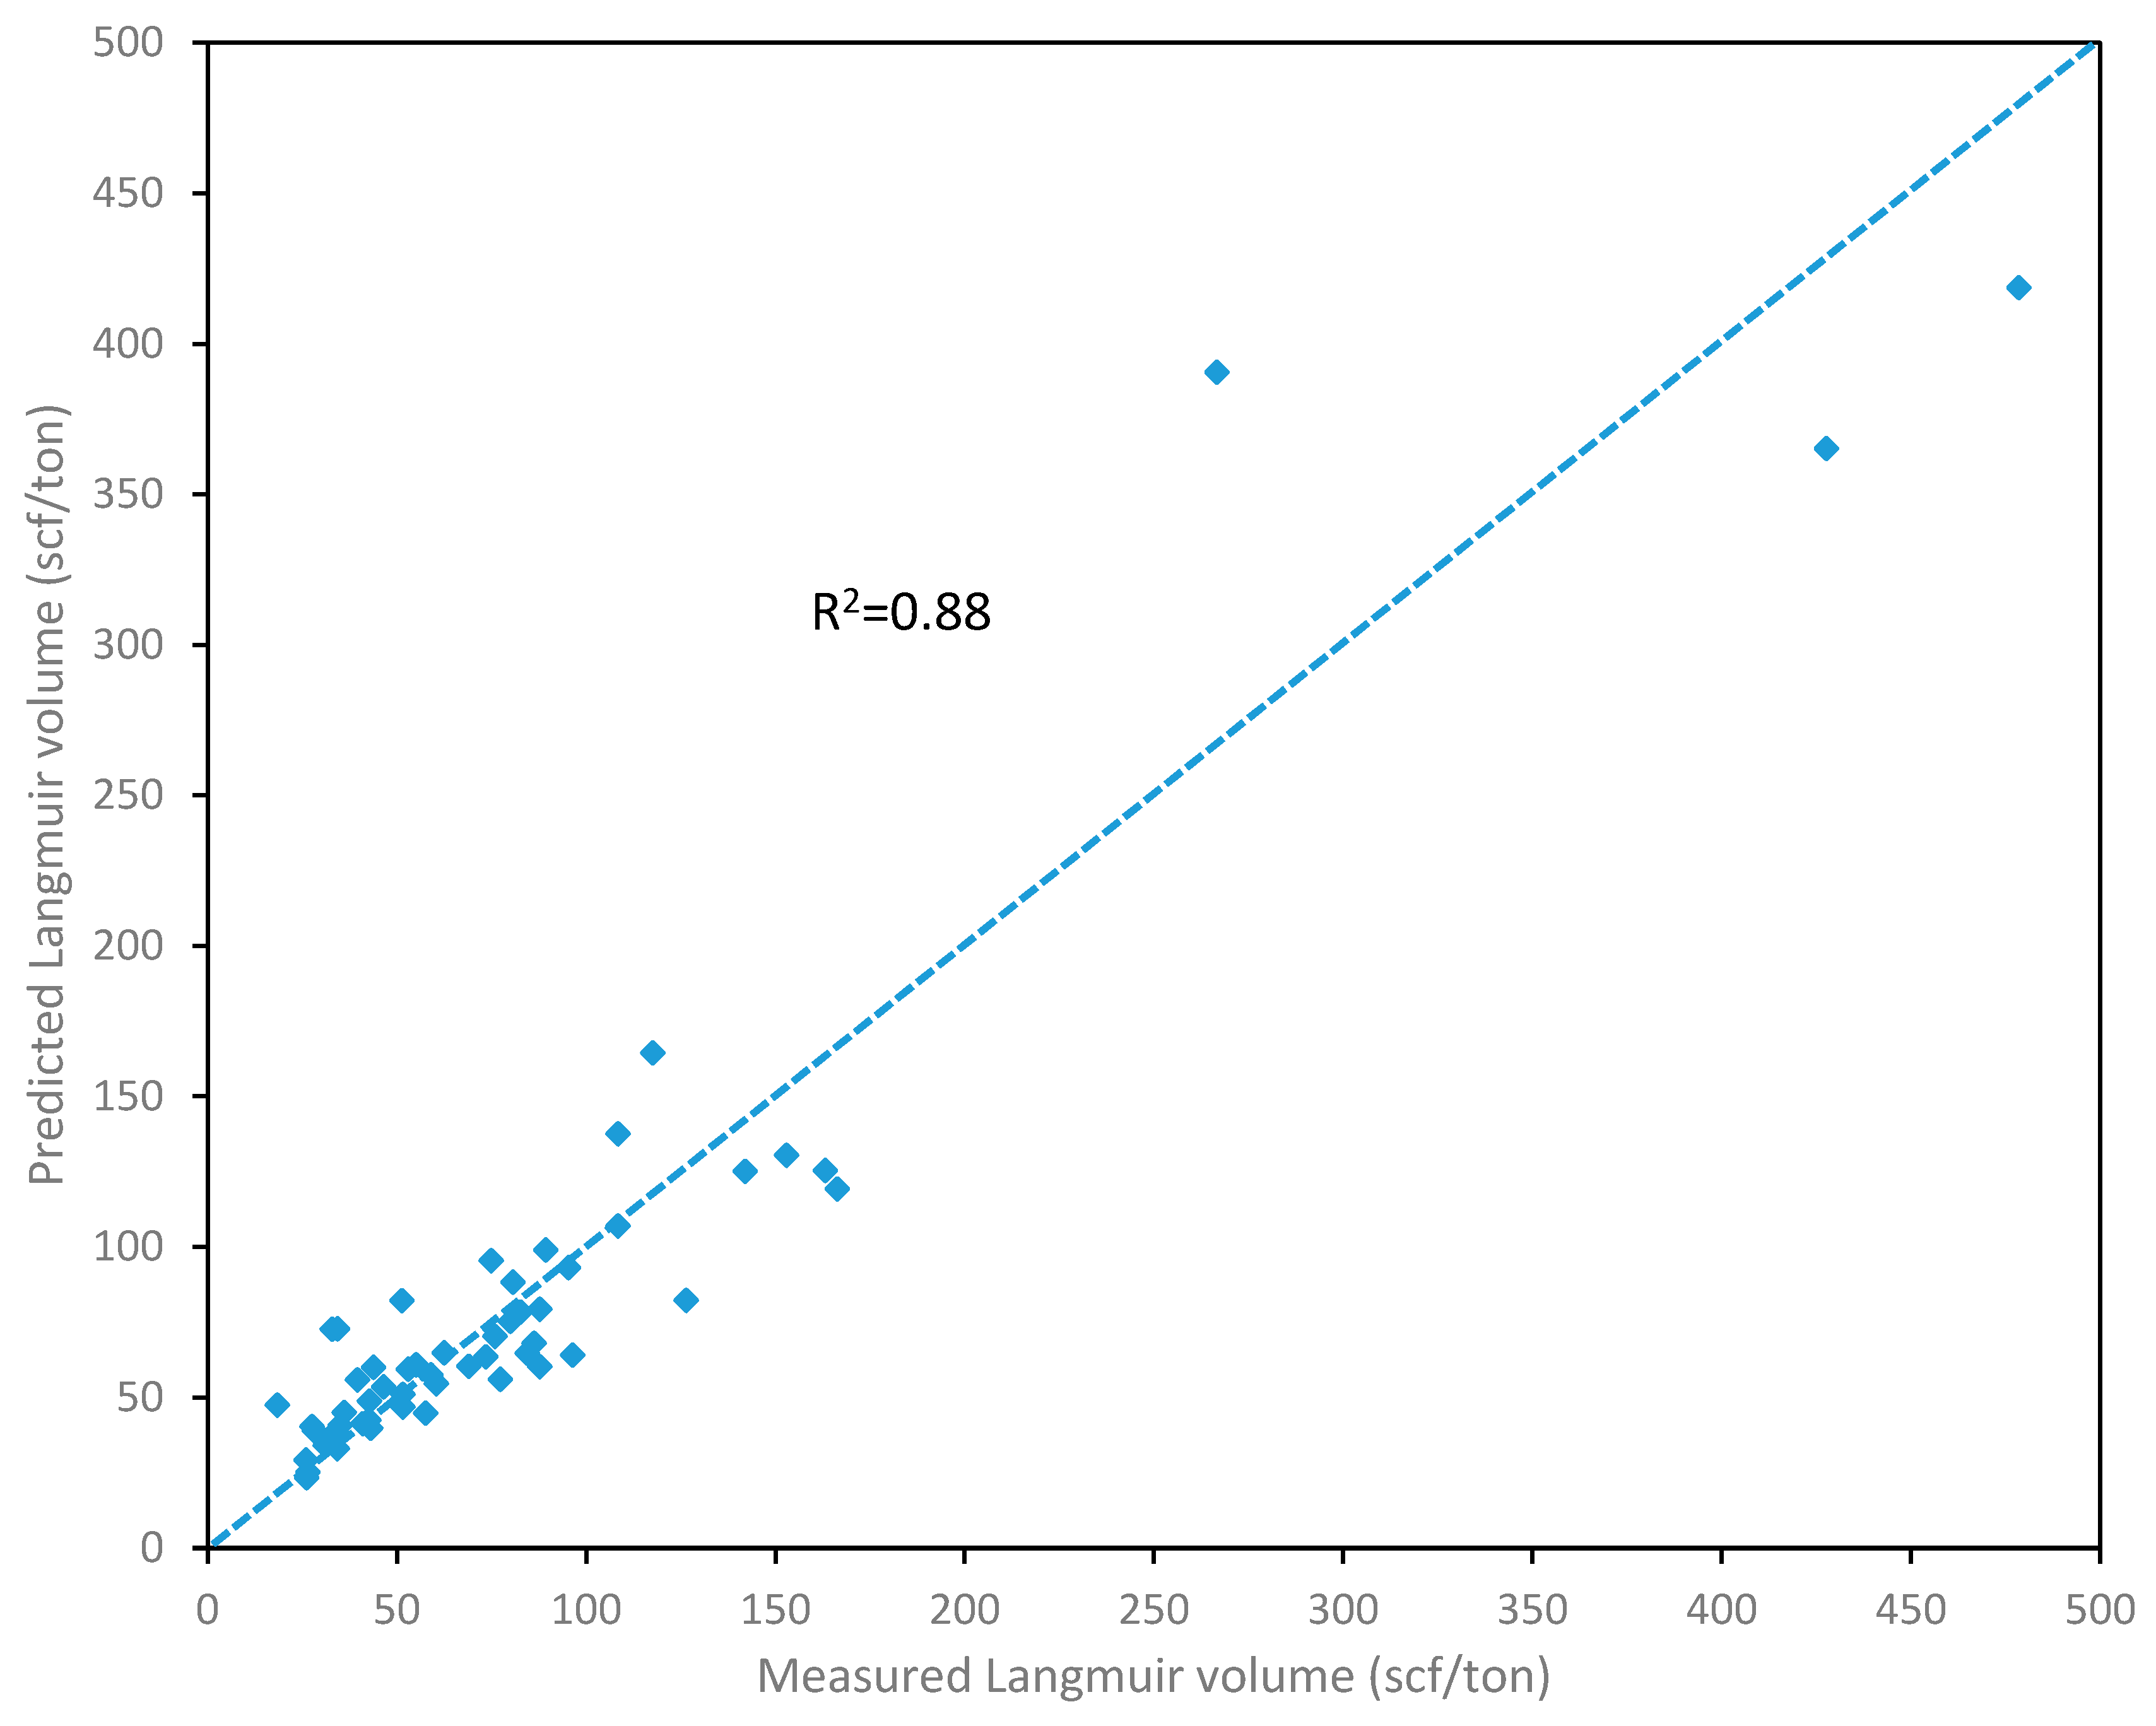
The predicted Langmuir volume and measured Langmuir volume at experimental temperature are plotted in Figure 5, with R-square 0.88.
3.2. Model of Langmuir Volume at Reservoir Temperature
As the methane adsorption in shale is an exothermic process, the methane adsorption capacity is reduced at a higher temperature. It has been observed that the Langmuir volume decreases with increasing temperature [7,17]. A linear negative correlation exists between the Langmuir volume and temperature, which can be written in the following equation:
where is the Langmuir volume at reservoir temperature, scf/ton; T is the reservoir temperature, °C; d and e are the fitting coefficients. The value of the trend-line slope, d, is described as the decrease rate of Langmuir volume with increasing temperature, which quantitatively describes the temperature effect on the Langmuir volume. It has been concluded that the methane adsorbed on the organic matter is more sensitive to the temperature than the methane adsorbed on the clay minerals [6]. The finding is also confirmed in Figure 6, which displays a positive relationship between the TOC and decrease rate of VL, with the R2 of 0.58. With this relationship, the decrease rate of VL (d) can be calculated based on the TOC using Equation (5):
Given that the Langmuir volume at experimental temperature discussed in last section, the Langmuir volume at reservoir temperatures can be estimated using the decrease rate of VL or the d value from Equation (5). Thus, the Langmuir volume at reservoir temperature can be written as:
By rearrangement:
where is the Langmuir volume at reservoir temperature, scf/ton; T is the reservoir temperature, °C; T0 is the experimental temperature, °C; TOC is the total organic carbon, wt %; Vsh is the total clay content, %.
As the available data for the temperature dependence of Langmuir volume has a TOC range of 0.23 to 5.15 wt %, the result here may not be reliable for shale with larger TOC. Moreover, the samples with the TOC range of 3.03 to 5.15 wt % have a larger variation on the relationship than low TOC samples. Therefore, more data is required for the shale samples with TOC larger than 3.03 wt % in terms of the temperature dependence of Langmuir volume.
3.3. Model of Langmuir Pressure at Experimental Temperature and Reservoir Temperature
Langmuir pressure is also required to calculate the methane adsorption capacity in actual reservoir conditions. The reciprocal of the Langmuir pressure represents the affinity of the gas for sorbent. It has been concluded that the adsorption affinity on the organic matter is stronger than that on clay minerals [6]. Thermal maturity and volume of small pores were also regarded as controlling factors of the Langmuir pressure [5,10]. Herein, the Langmuir pressure shows no trend with the thermal maturity, TOC or clay content, but a logarithmic-law trend exists to the Langmuir volume, with R2 of 0.31 (Figure 7). The low correlation might result from the sensitive and various controlling factors of the Langmuir pressure. The shale sample with a large Langmuir volume has a high Langmuir pressure, which represents a weak adsorption affinity of methane. As reported, the organic matter and small pore have stronger adsorption affinity of methane comparing to the clay and large pore, respectively. In this case, the adsorption affinity of methane in shale reflects the proportion of adsorbed methane in the small pore and organic matter. Thus, the weak adsorption affinity in the shale sample with a large Langmuir volume might infer that the proportion of adsorbed methane in the small pore and organic matter is low. Since the relationship between the Langmuir volume and Langmuir pressure is obtained from a large amount of data, the relationship can be informative. Therefore, the Langmuir pressure can be predicted using the following equation:
where PL and VL are the Langmuir pressure and Langmuir volume at experimental temperature in psi and scf/ton, respectively.
The temperature dependence of the Langmuir pressure has been described by the following equation [21]:
where m and n is the fitting coefficient, resulting from the thermal dynamic parameters: the heat of adsorption and the standard entropy of adsorption. These parameters have been compared between the organic matter and clay minerals, concluding that the methane adsorbed on the organic matter releases more heat than the methane adsorbed on clay. A linear relationship between the heat of adsorption and the standard entropy of adsorption has been proposed for different types of kerogen, clay and shale samples at different thermal maturity [5]. It might imply that the thermal dynamic parameters are related to the TOC. For each shale sample, the coefficient m and n are determined using linear fitting on and . In terms of the studied samples, the plot of m with TOC is listed in Figure 8 as the following equation:
Combined with the prediction model for the Langmuir pressure at experimental temperature, the Langmuir pressure at reservoir temperature (PL(T)) can be obtained using the following equations:
where m is the fitting coefficient in Equation 9; T0 is the experimental temperature, °C; T is the reservoir temperature, °C.
Therefore, the methane adsorption at certain pressure and temperature can be predicted by the Langmuir model, Equation (14):
where is the adsorbed gas content at certain temperature and pressure, scf/ton; is the Langmuir volume at reservoir temperature, scf/ton; is the Langmuir pressure at reservoir temperature, psi; P is the reservoir pore pressure, psi.
4. Conclusions
In this study, we proposed a prediction model for the methane adsorption capacity in shales based on the high-pressure methane adsorption experiment result. The methane adsorption capacity at certain pressure and temperature can be calculated using the Langmuir model with the Langmuir parameters. Herein, the prediction model for methane adsorption in shales was built in 4 steps: a model of the Langmuir volume at experimental temperature, the temperature dependence of the Langmuir volume, a model of the Langmuir pressure at experimental temperature, the temperature dependence of Langmuir pressure.
The model of the Langmuir volume at experimental temperature considers the TOC and clay content without the thermal maturity, which shows no relationship with the TOC-normalized Langmuir volume. The predicted Langmuir volume at experimental temperature was plotted against the measured results, showing a good R-square. However, more data is still required to improve the model, as the shale samples in the TOC range of 10 to 25 wt % is rarely measured.
For the other three steps, the relationships are informative but not precise enough to provide a reliable prediction. A positive relationship exists between the TOC and decrease rate of Langmuir volume with increasing temperature based on the published data, which requires more data for the shale samples with TOC larger than 3 wt %. As the Langmuir pressure is sensitive to too many factors, it is hard to estimate using the TOC and clay content. However, a logarithmic-law trend is observed between the Langmuir volume and Langmuir pressure at experimental temperature; the temperature dependence of Langmuir pressure is related to the TOC. Furthermore, as the high-pressure methane adsorption experiments on shales were measured under different conditions in the references, the amount of samples for the temperature dependence of the Langmuir parameters is insufficient, which constrains the accuracy of the related models.
Moisture was not considered in this study, which is also regarded as an important controlling factor on methane adsorption in shales [22,23,24]. The existing moisture in shales occupies pore volume or blocks pore throat to reduce the methane adsorption capacity. However, the moisture content employed in the references are various, which are not available to compare with each other or collect sufficient data. Moreover, it is very uncertain for the moisture content under in-situ conditions and its variation within a shale reservoir.
The major application of this study is that the well log data can calculate TOC and Vsh without any problem and therefore this study can help to calculate VL and PL at the reservoir condition for volumetric calculation of absorbed gas in shale reservoirs.
Author Contributions
Investigation and writing—original draft preparation, J.Z.; writing—review and editing and supervision, R.R.
Funding
This research was funded by China Scholarship Council, File No.201506440050.
Acknowledgments
The authors would like to thank the Unconventional Gas Research Group in Curtin University for providing support for the experimental work.
Conflicts of Interest
The authors declare no conflict of interest.
Appendix A

Table A1.
The detailed information about the studied shale samples in this paper.
| Source | TOC (wt %) | Clay (%) | T (°C) | Mesh | VL (scf/ton) | PL(psi) | Tmax (°C) | Decrease Rate of VL |
|---|---|---|---|---|---|---|---|---|
| Wang, Zhu [18] | 7.68 | 35.4 | 30 | 60 | 152.9 | 337.9 | N/A | N/A |
| 4.24 | 34.8 | 30 | 60 | 126.4 | 346.6 | N/A | N/A | |
| 2.18 | 37.8 | 30 | 60 | 77.3 | 378.5 | N/A | N/A | |
| 1.46 | 48.7 | 30 | 60 | 60.4 | 287.2 | N/A | N/A | |
| 5.23 | 34.1 | 30 | 60 | 74.9 | 688.9 | N/A | N/A | |
| 4.82 | 38.5 | 30 | 60 | 95.3 | 455.4 | N/A | N/A | |
| 1.76 | 36.1 | 30 | 60 | 42.7 | 507.6 | N/A | N/A | |
| 8.54 | 29.3 | 30 | 60 | 108.4 | 632.4 | N/A | N/A | |
| 10.02 | 37.4 | 30 | 60 | 117.6 | 551.1 | N/A | N/A | |
| 2.17 | 27.2 | 30 | 60 | 18.4 | 103.0 | N/A | N/A | |
| 4.4 | 20.1 | 30 | 60 | 34.3 | 101.5 | N/A | N/A | |
| 3.9 | 28.7 | 30 | 60 | 32.8 | 210.3 | N/A | N/A | |
| Our unpublished data | 0.28 | 76.58 | 25 | 60 | 87.7 | 296.1 | 442 | N/A |
| 0.52 | N/A | 25 | 60 | 40.0 | 281.9 | 453 | N/A | |
| 1.26 | 83.49 | 25 | 60 | 87.7 | 331.3 | 454 | N/A | |
| 3.2 | 74.28 | 25 | 60 | 89.3 | 372.4 | 454 | N/A | |
| 2.82 | 67.52 | 25 | 60 | 80.6 | 338.2 | 456 | N/A | |
| 2.6 | 54.90 | 25 | 60 | 80.0 | 420.2 | 453 | N/A | |
| 2.11 | 54.22 | 25 | 60 | 86.2 | 458.3 | 441 | N/A | |
| 1.24 | 37.10 | 25 | 60 | 42.6 | 317.1 | 453 | N/A | |
| 2.76 | 55.97 | 25 | 60 | 82.6 | 455.6 | 448 | N/A | |
| 0.75 | 68.44 | 25 | 60 | 69.0 | 372.5 | 458 | N/A | |
| Guo, Lü [19] | 0.5 | 26 | 30 | 60-80 | 26.1 | 233.5 | 589 | N/A |
| 0.95 | 40 | 30 | 60-80 | 35.0 | 313.3 | 475 | N/A | |
| 0.81 | 42 | 30 | 60-80 | 27.5 | 358.2 | 533 | N/A | |
| 0.76 | 41 | 30 | 60-80 | 28.3 | 243.7 | 477 | N/A | |
| 1.05 | 46 | 30 | 60-80 | 51.6 | 407.6 | 444 | N/A | |
| 0.7 | 42 | 30 | 60-80 | 33.9 | 384.4 | 424 | N/A | |
| 0.98 | 45 | 30 | 60-80 | 36.0 | 522.1 | 574 | N/A | |
| 1.3 | 47 | 30 | 60-80 | 51.6 | 384.4 | 460 | N/A | |
| 5.76 | 55 | 30 | 60-80 | 166.3 | 742.6 | 458 | N/A | |
| 1.55 | 60 | 30 | 60-80 | 84.4 | 509.1 | 455 | N/A | |
| 0.87 | 33 | 30 | 60-80 | 31.1 | 298.8 | 494 | N/A | |
| 2.24 | 48 | 30 | 60-80 | 62.5 | 375.6 | 442 | N/A | |
| 2.57 | 49 | 30 | 60-80 | 75.9 | 265.4 | 442 | N/A | |
| 1.22 | 36 | 30 | 60-80 | 41.0 | 264.0 | 474 | N/A | |
| 2.42 | 43 | 30 | 60-80 | 73.5 | 340.8 | 441 | N/A | |
| 2.47 | 43 | 30 | 60-80 | 96.4 | 385.8 | 463 | N/A | |
| 5.35 | 70 | 30 | 60-80 | 163.1 | 481.5 | 447 | N/A | |
| 5.33 | 70 | 30 | 60-80 | 142.0 | 465.6 | 453 | N/A | |
| 4.59 | 60 | 30 | 60-80 | 108.4 | 319.1 | 452 | N/A | |
| 1.55 | 55 | 30 | 60-80 | 55.1 | 295.9 | 469 | N/A | |
| 1.48 | 36 | 30 | 60-80 | 57.6 | 446.7 | 462 | N/A | |
| 25.31 | 23 | 30 | 60-80 | 427.6 | 467.0 | 501 | N/A | |
| 2.39 | 36 | 30 | 60-80 | 59.0 | 423.5 | 460 | N/A | |
| 24.58 | 68 | 30 | 60-80 | 266.6 | 480.1 | 424 | N/A | |
| 1.02 | 58 | 30 | 60-80 | 39.6 | 319.1 | 571 | N/A | |
| 1.17 | 35 | 30 | 60-80 | 43.1 | 449.6 | 434 | N/A | |
| 1.38 | 57 | 30 | 60-80 | 43.8 | 224.8 | 492 | N/A | |
| 1.62 | 52 | 30 | 60-80 | 53.0 | 239.3 | 444 | N/A | |
| 28.48 | 35 | 30 | 60-80 | 478.5 | 564.2 | 436 | N/A | |
| [16,17] | 1.41 | N/A | 20 | 60 | 93.9 | 195.8 | N/A | 0.3778 |
| N/A | 40 | 60 | 85.5 | 220.5 | N/A | |||
| N/A | 60 | 60 | 84.0 | 380.0 | N/A | |||
| N/A | 80 | 60 | 73.5 | 433.7 | N/A | |||
| N/A | 100 | 60 | 62.2 | 475.7 | N/A | |||
| 4.13 | N/A | 20 | 60 | 135.6 | 207.4 | N/A | 0.452 | |
| N/A | 40 | 60 | 128.9 | 220.5 | N/A | |||
| N/A | 60 | 60 | 119.7 | 382.9 | N/A | |||
| N/A | 80 | 60 | 109.8 | 422.1 | N/A | |||
| N/A | 100 | 60 | 99.9 | 464.1 | N/A | |||
| 0.45 | N/A | 20 | 60 | 59.7 | 192.9 | N/A | 0.2066 | |
| N/A | 40 | 60 | 54.4 | 223.4 | N/A | |||
| N/A | 60 | 60 | 51.9 | 381.5 | N/A | |||
| N/A | 80 | 60 | 47.0 | 427.9 | N/A | |||
| N/A | 100 | 60 | 42.7 | 469.9 | N/A | |||
| 0.87 | N/A | 20 | 60 | 77.3 | 197.3 | N/A | 0.3337 | |
| N/A | 40 | 60 | 71.7 | 224.8 | N/A | |||
| N/A | 60 | 60 | 68.9 | 393.1 | N/A | |||
| N/A | 80 | 60 | 57.9 | 420.6 | N/A | |||
| N/A | 100 | 60 | 50.9 | 471.4 | N/A | |||
| 0.8 | N/A | 20 | 60 | 74.5 | 185.7 | N/A | 0.2966 | |
| N/A | 40 | 60 | 71.0 | 221.9 | N/A | |||
| N/A | 60 | 60 | 68.9 | 382.9 | N/A | |||
| N/A | 80 | 60 | 61.8 | 435.1 | N/A | |||
| N/A | 100 | 60 | 49.4 | 464.1 | N/A | |||
| 1.49 | N/A | 20 | 60 | 100.6 | 191.5 | N/A | 0.5279 | |
| N/A | 40 | 60 | 98.2 | 227.7 | N/A | |||
| N/A | 60 | 60 | 92.5 | 387.3 | N/A | |||
| N/A | 80 | 60 | 74.5 | 438.0 | N/A | |||
| N/A | 100 | 60 | 59.7 | 468.5 | N/A | |||
| 0.62 | N/A | 20 | 60 | 71.7 | 198.7 | N/A | 0.3655 | |
| N/A | 40 | 60 | 66.4 | 219.0 | N/A | |||
| N/A | 60 | 60 | 60.0 | 384.4 | N/A | |||
| N/A | 80 | 60 | 54.0 | 436.6 | N/A | |||
| N/A | 100 | 60 | 41.3 | 468.5 | N/A | |||
| 1.35 | N/A | 20 | 60 | 85.8 | 195.8 | N/A | 0.4379 | |
| N/A | 40 | 60 | 80.5 | 217.6 | N/A | |||
| N/A | 60 | 60 | 74.2 | 381.5 | N/A | |||
| N/A | 80 | 60 | 64.3 | 427.9 | N/A | |||
| N/A | 100 | 60 | 50.1 | 449.6 | N/A | |||
| 5.15 | N/A | 30 | 60 | 216.8 | 207.4 | N/A | 1.8362 | |
| N/A | 40 | 60 | 202.7 | 216.1 | N/A | |||
| N/A | 50 | 60 | 184.7 | 307.5 | N/A | |||
| N/A | 60 | 60 | 159.6 | 388.7 | N/A | |||
| N/A | 70 | 60 | 146.6 | 419.2 | N/A | |||
| 4.76 | N/A | 30 | 60 | 205.9 | 206.0 | N/A | 2.8497 | |
| N/A | 40 | 60 | 184.7 | 214.7 | N/A | |||
| N/A | 50 | 60 | 140.9 | 248.0 | N/A | |||
| N/A | 60 | 60 | 111.6 | 298.8 | N/A | |||
| N/A | 70 | 60 | 99.9 | 320.5 | N/A | |||
| [14] | 3.03 | 51.3 | 25 | 60 | 51.3 | 218.9 | 459 | 0.3135 |
| 45 | 60 | 46.3 | 277.8 | |||||
| 60 | 60 | 40.2 | 346.9 | |||||
| 80 | 60 | 37.6 | 433.8 | |||||
| 0.64 | 26 | 25 | 60 | 26.0 | 256.1 | 458 | 0.1538 | |
| 45 | 60 | 23.1 | 306.7 | |||||
| 60 | 60 | 20.6 | 322.5 | |||||
| 80 | 60 | 19.8 | 429.2 | |||||
| 1.82 | 46.5 | 25 | 60 | 46.5 | 263.8 | 460 | 0.5846 | |
| 45 | 60 | 35.2 | 352.3 | |||||
| 60 | 60 | 26.0 | 492.2 | |||||
| 80 | 60 | N/A | N/A | |||||
| 1.08 | 34.2 | 25 | 60 | 34.2 | 422.1 | 465 | 0.337 | |
| 45 | 60 | 29.5 | 544.6 | |||||
| 60 | 60 | 22.2 | 562.0 | |||||
| 80 | 60 | 20.5 | 729.7 | |||||
| 0.23 | 26.5 | 25 | 60 | 26.5 | 383.5 | N/A | 0.1257 | |
| 45 | 60 | 24.0 | 398.3 | |||||
| 60 | 60 | 22.1 | 445.3 | |||||
| 80 | 60 | 20.7 | 505.4 | |||||
| 3.07 | 76 | 25 | 60 | 80.6 | 338.2 | 452 | 0.8646 | |
| 45 | 60 | 63.7 | 371.7 | |||||
| 60 | 60 | 50.3 | 481.4 | |||||
| 80 | 60 | N/A | N/A |
References
- Curtis, J.B. Fractured Shale-Gas Systems. AAPG Bull. 2002, 86, 1921–1938. [Google Scholar]
- Chalmers, G.R.L.; Bustin, R.M. The organic matter distribution and methane capacity of the Lower Cretaceous strata of Northeastern British Columbia, Canada. Int. J. Coal Geol. 2007, 70, 223–239. [Google Scholar] [CrossRef]
- Ross, D.J.K.; Bustin, R. The importance of shale composition and pore structure upon gas storage potential of shale gas reservoirs. Mar. Pet. Geol. 2009, 26, 916–927. [Google Scholar] [CrossRef]
- Langmuir, I. The evaporation, condensation and reflection of molecules and the mechanism of adsorption. J. Frankl. Inst. 1917, 183, 101–102. [Google Scholar] [CrossRef]
- Gasparik, M.; Bertier, P.; Gensterblum, Y.; Ghanizadeh, A.; Krooss, B.M.; Littke, R. Geological controls on the methane storage capacity in organic-rich shales. Int. J. Coal Geol. 2014, 123, 34–51. [Google Scholar] [CrossRef]
- Ji, L.; Zhang, T.; Milliken, K.L.; Qu, J.; Zhang, X. Experimental investigation of main controls to methane adsorption in clay-rich rocks. Appl. Geochem. 2012, 27, 2533–2545. [Google Scholar] [CrossRef]
- Guo, S. Experimental study on isothermal adsorption of methane gas on three shale samples from Upper Paleozoic strata of the Ordos Basin. J. Pet. Sci. Eng. 2013, 110, 132–138. [Google Scholar] [CrossRef]
- Zhang, T.; Ellis, G.S.; Ruppel, S.C.; Milliken, K.; Lewan, M.; Sun, X. Effect of Organic Matter Properties, Clay Mineral Type and Thermal Maturity on Gas Adsorption in Organic-Rich Shale Systems. In Proceedings of the Unconventional Resources Technology Conference, Denver, CO, USA, 12–14 August 2013. [Google Scholar]
- Dang, W.; Zhang, J.; Wei, X.; Tang, X.; Chen, Q.; Li, Z.; Zhang, M.; Liu, J. Geological controls on methane adsorption capacity of Lower Permian transitional black shales in the Southern North China Basin, Central China: Experimental results and geological implications. J. Pet. Sci. Eng. 2017, 152, 456–470. [Google Scholar] [CrossRef]
- Myers, A.L. Characterization of nanopores by standard enthalpy and entropy of adsorption of probe molecules. Colloids Surfaces A Physicochem. Eng. Asp. 2004, 241, 9–14. [Google Scholar] [CrossRef]
- Zhang, T.; Ellis, G.S.; Ruppel, S.C.; Milliken, K.; Yang, R. Effect of organic-matter type and thermal maturity on methane adsorption in shale-gas systems. Org. Geochem. 2012, 47, 120–131. [Google Scholar] [CrossRef]
- Li, T.; Tian, H.; Xiao, X.; Cheng, P.; Zhou, Q.; Wei, Q. Geochemical characterization and methane adsorption capacity of overmature organic-rich Lower Cambrian shales in northeast Guizhou region, southwest China. Mar. Pet. Geol. 2017, 86, 858–873. [Google Scholar] [CrossRef]
- Liu, Y.C.; Chen, D.X.; Qiu, N.S.; Wang, Y.; Fu, J.; Huyan, Y.; Jia, J.K.; Wu, H. Reservoir characteristics and methane adsorption capacity of the Upper Triassic continental shale in Western Sichuan Depression, China. Aust. J. Earth Sci. 2017, 64, 807–823. [Google Scholar] [CrossRef]
- Zou, J.; Rezaee, R.; Liu, K. The effect of temperature on methane adsorption in shale gas reservoirs. Energy Fuels 2017. [Google Scholar] [CrossRef]
- Gasparik, M.; Rexer, T.F.T.; Aplin, A.C.; Billemont, P.; De Weireld, G.; Gensterblum, Y.; Henry, M.; Krooss, B.M.; Liu, S.; Ma, X.; et al. First international inter-laboratory comparison of high-pressure CH4, CO2 and C2H6 sorption isotherms on carbonaceous shales. Int. J. Coal Geol. 2014, 132, 131–146. [Google Scholar] [CrossRef]
- Ji, W.; Song, Y.; Jiang, Z.; Wang, X.; Bai, Y.; Xing, J. Geological controls and estimation algorithms of lacustrine shale gas adsorption capacity: A case study of the Triassic strata in the southeastern Ordos Basin, China. Int. J. Coal Geol. 2014, 134–135, 61–73. [Google Scholar] [CrossRef]
- Ji, W.; Song, Y.; Jiang, Z.; Chen, L.; Li, Z.; Yang, X.; Meng, M. Estimation of marine shale methane adsorption capacity based on experimental investigations of Lower Silurian Longmaxi formation in the Upper Yangtze Platform, south China. Mar. Pet. Geol. 2015, 68, Part A. 94–106. [Google Scholar] [CrossRef]
- Wang, Y.; Zhu, Y.; Liu, S.; Zhang, R. Methane adsorption measurements and modeling for organic-rich marine shale samples. Fuel 2016, 172, 301–309. [Google Scholar] [CrossRef] [Green Version]
- Guo, S.; Lü, X.; Song, X.; Liu, Y. Methane adsorption characteristics and influence factors of Mesozoic shales in the Kuqa Depression, Tarim Basin, China. J. Pet. Sci. Eng. 2017, 157, 187–195. [Google Scholar] [CrossRef]
- Fan, E.; Tang, S.; Zhang, C.; Guo, Q.; Sun, C. Methane sorption capacity of organics and clays in high-over matured shale-gas systems. Energy Explor. Exploit. 2015, 32, 16. [Google Scholar] [CrossRef]
- Xia, X.; Litvinov, S.; Muhler, M. Consistent Approach to Adsorption Thermodynamics on Heterogeneous Surfaces Using Different Empirical Energy Distribution Models. Langmuir 2006, 22, 8063–8070. [Google Scholar] [CrossRef]
- Li, J.; Li, X.; Wang, X.; Li, Y.; Wu, K.; Shi, J.; Yang, L.; Feng, D.; Zhang, T.; Yu, P. Water distribution characteristic and effect on methane adsorption capacity in shale clay. Int. J. Coal Geol. 2016, 159, 135–154. [Google Scholar] [CrossRef]
- Wang, L.; Yu, Q. The effect of moisture on the methane adsorption capacity of shales: A study case in the eastern Qaidam Basin in China. J. Hydrol. 2016, 542, 487–505. [Google Scholar] [CrossRef]
- Zou, J.; Rezaee, R.; Xie, Q.; You, L.; Liu, K.; Saeedi, A. Investigation of moisture effect on methane adsorption capacity of shale samples. Fuel 2018, 232, 323–332. [Google Scholar] [CrossRef]
Figure 1.
The relationship between the TOC and Langmuir volume at experimental temperature (30 °C) for the studied shale samples.
Figure 1.
The relationship between the TOC and Langmuir volume at experimental temperature (30 °C) for the studied shale samples.

Figure 2.
A weak relationship exists between the clay content and Langmuir volume at experimental temperature (30 °C) for the studied shale samples.
Figure 2.
A weak relationship exists between the clay content and Langmuir volume at experimental temperature (30 °C) for the studied shale samples.

Figure 3.
The relationship between the clay content and Langmuir volume at experimental temperature for low, medium and high TOC shale samples.
Figure 3.
The relationship between the clay content and Langmuir volume at experimental temperature for low, medium and high TOC shale samples.

Figure 4.
There is no meaningful relationship between the TOC-normalized Langmuir volume at experimental temperature and Tmax for the studied shale samples.
Figure 4.
There is no meaningful relationship between the TOC-normalized Langmuir volume at experimental temperature and Tmax for the studied shale samples.

Figure 5.
The relationship between the measured and predicted Langmuir volume at experimental temperature.
Figure 5.
The relationship between the measured and predicted Langmuir volume at experimental temperature.

Figure 6.
The relationship between the TOC and decrease rate of Langmuir volume with increasing temperature.
Figure 6.
The relationship between the TOC and decrease rate of Langmuir volume with increasing temperature.

Figure 7.
The relationship between the Langmuir pressure and Langmuir volume at experimental temperature for the studied samples.
Figure 7.
The relationship between the Langmuir pressure and Langmuir volume at experimental temperature for the studied samples.

Figure 8.
The relationship of the TOC to the fitting coefficient m.

Table 1.
Considered factors of the prediction model for Langmuir parameters in previous studies.
| References | Considered Factors of Langmuir Volume | Considered Factors of Langmuir Pressure |
|---|---|---|
| Zhang, Ellis [11] | TOC | temperature and thermal maturity |
| Liu, Chen [13] | TOC and clay content | temperature |
| Li, Tian [12] | TOC, clay content, temperature and residual of hydrocarbon (s1) | the content of clay minerals, illite, feldspar, and carbonate minerals |
© 2019 by the authors. Licensee MDPI, Basel, Switzerland. This article is an open access article distributed under the terms and conditions of the Creative Commons Attribution (CC BY) license (http://creativecommons.org/licenses/by/4.0/).
Share and Cite
MDPI and ACS Style
Zou, J.; Rezaee, R. A Prediction Model for Methane Adsorption Capacity in Shale Gas Reservoirs. Energies 2019, 12, 280. https://doi.org/10.3390/en12020280
AMA Style
Zou J, Rezaee R. A Prediction Model for Methane Adsorption Capacity in Shale Gas Reservoirs. Energies. 2019; 12(2):280. https://doi.org/10.3390/en12020280
Chicago/Turabian StyleZou, Jie, and Reza Rezaee. 2019. "A Prediction Model for Methane Adsorption Capacity in Shale Gas Reservoirs" Energies 12, no. 2: 280. https://doi.org/10.3390/en12020280
Note that from the first issue of 2016, this journal uses article numbers instead of page numbers. See further details here.