Numerical Analysis of Nozzle Flow and Spray Characteristics from Different Nozzles Using Diesel and Biofuel Blends

 ,
, 
Abstract
:1. Introduction
2. Mathematical Model
2.1. Injector Flow Phase
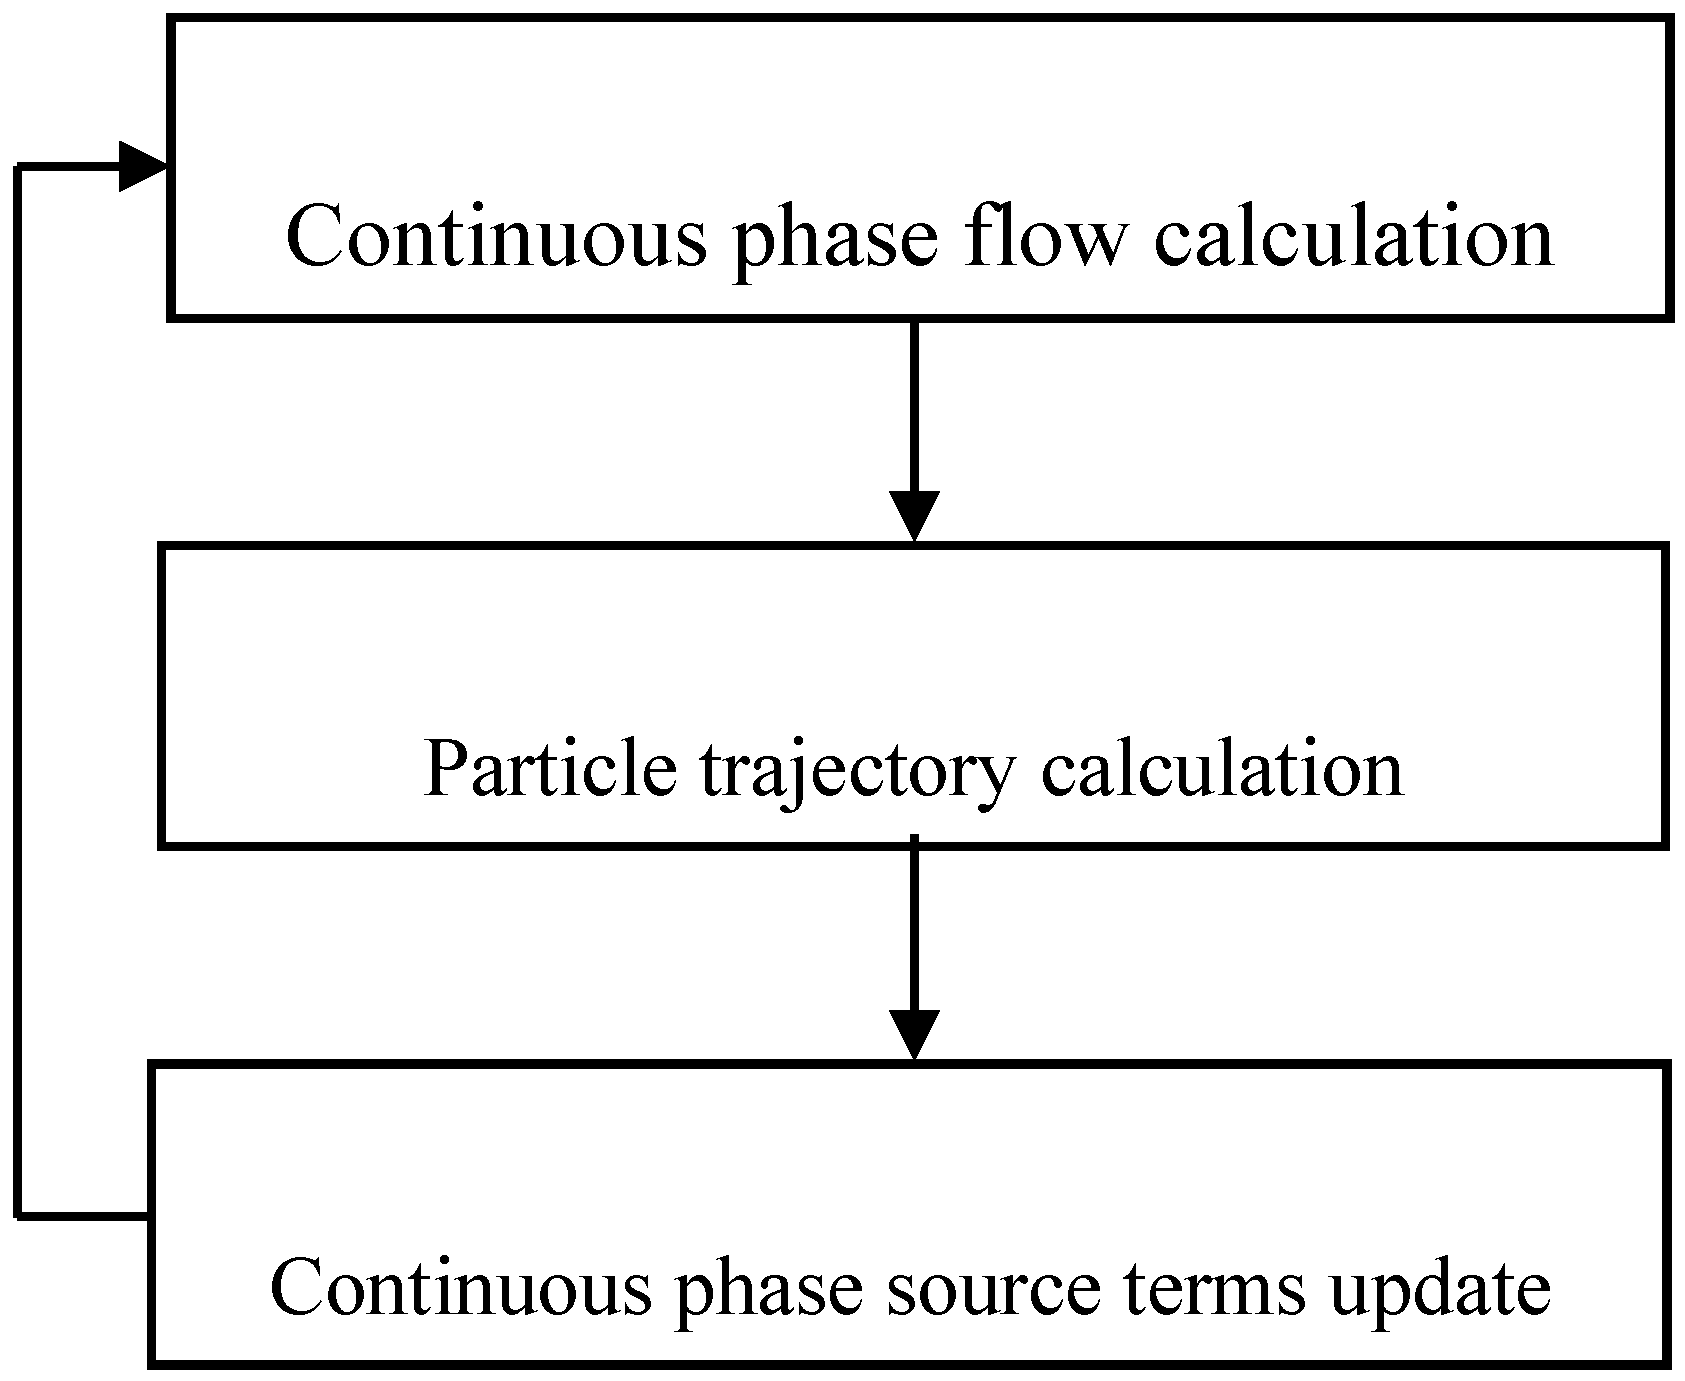
2.2. Discrete Particle Phase
2.3. Spray Simulations
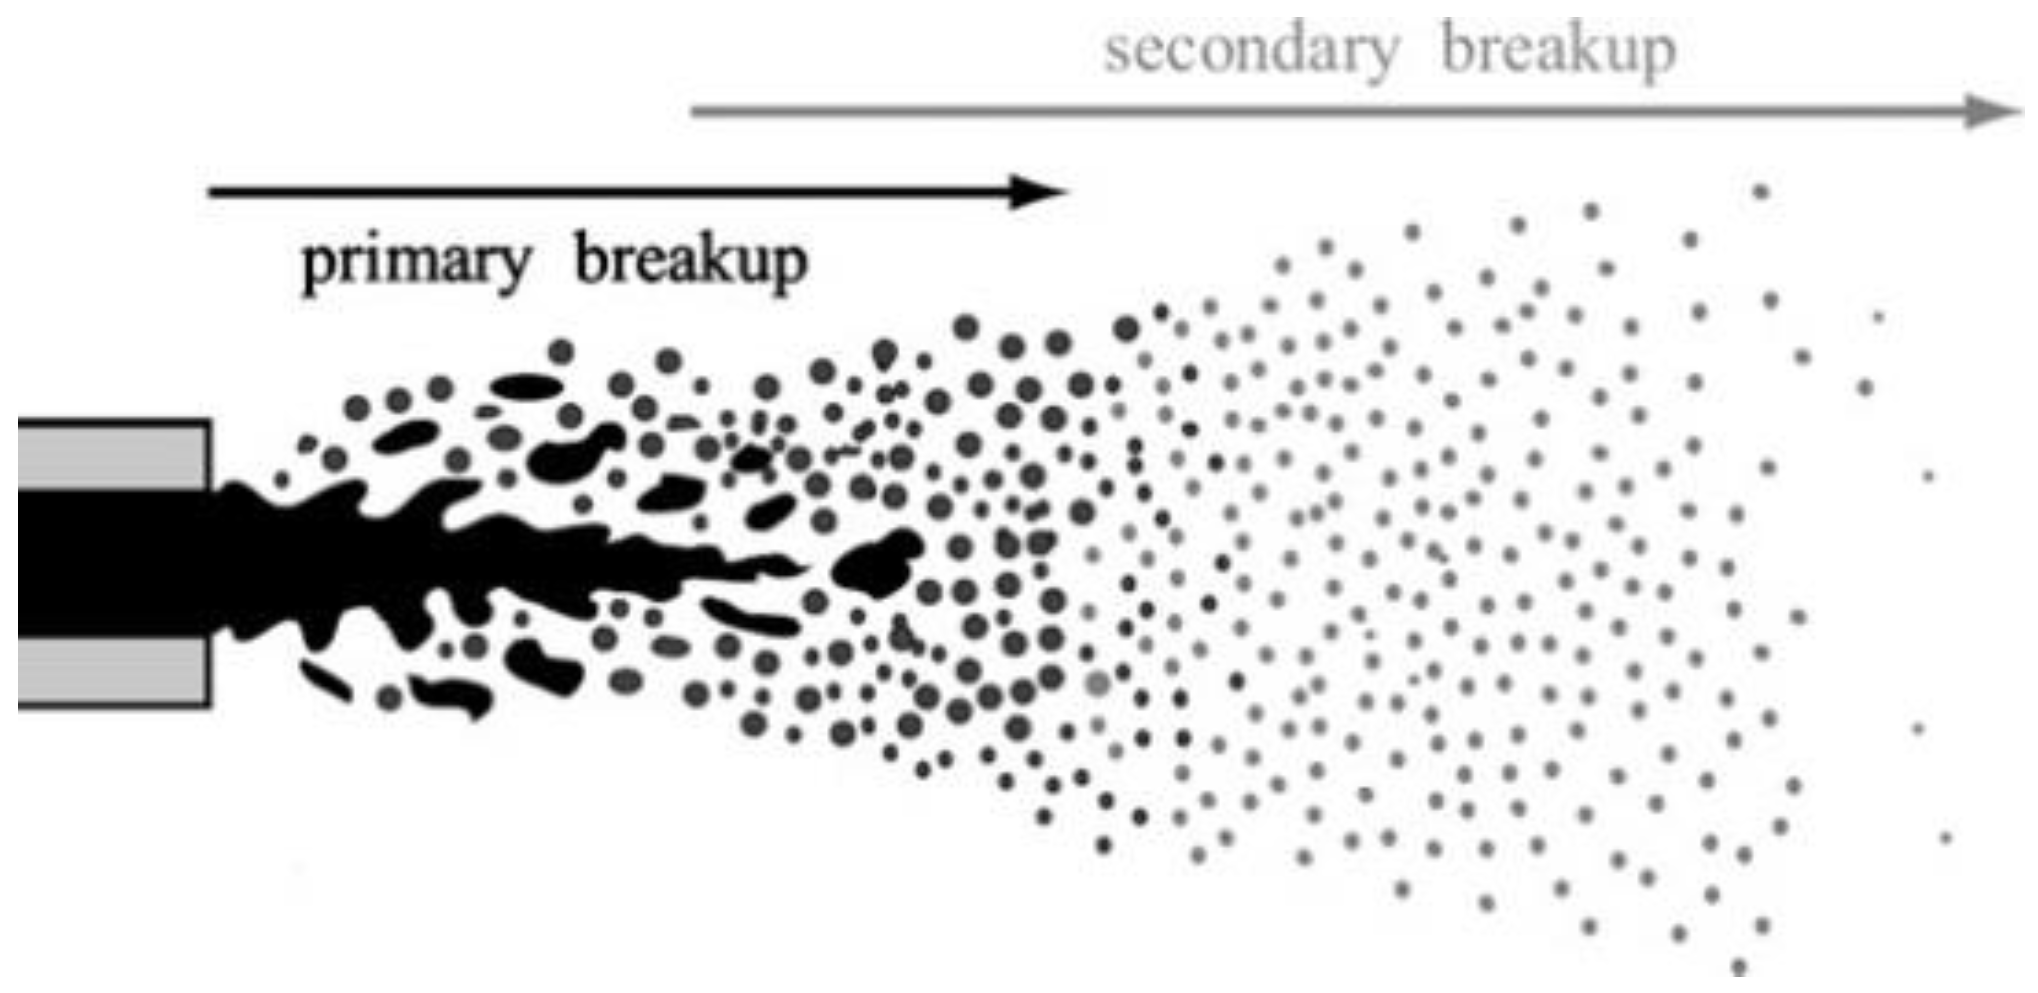
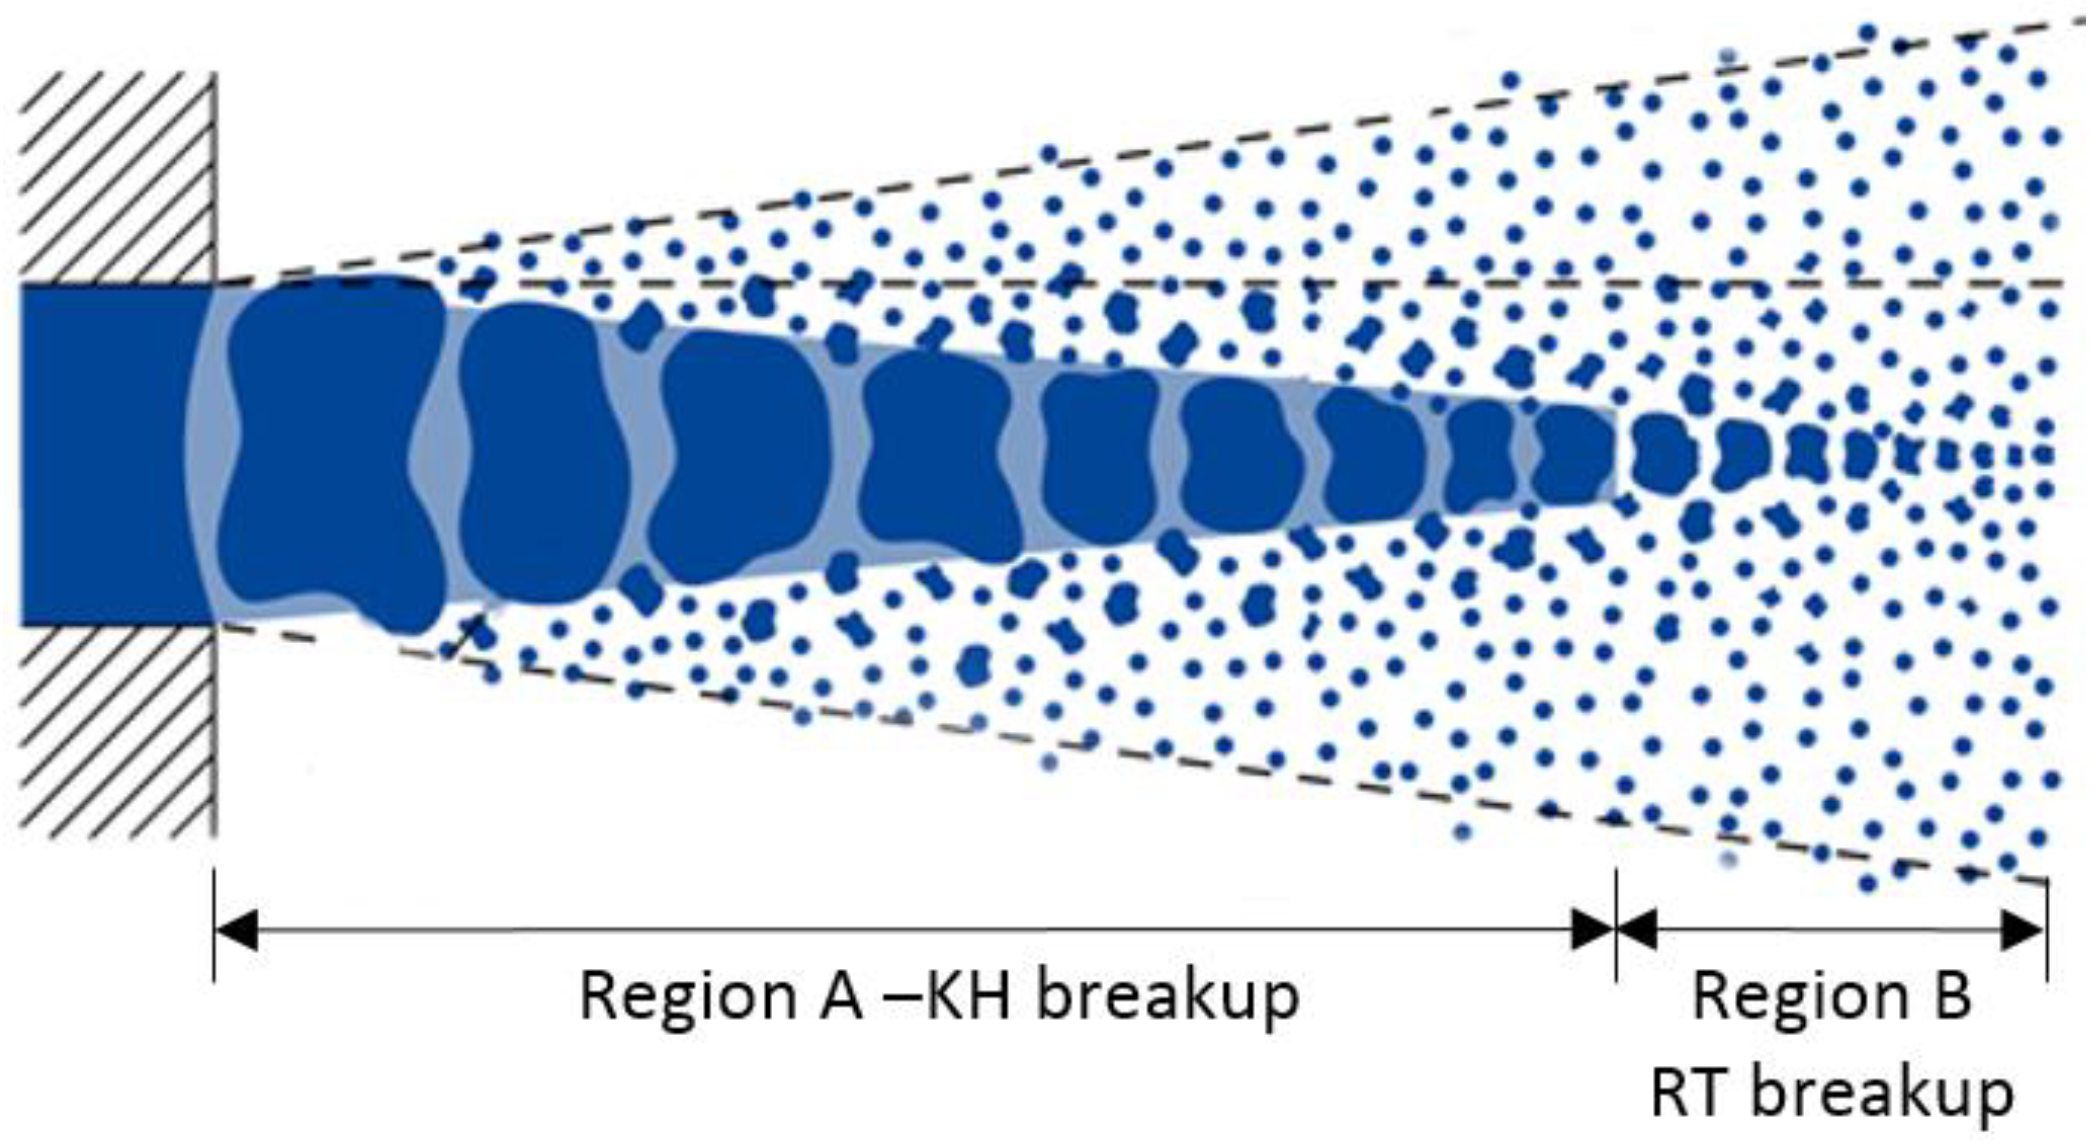
2.3.1. Primary Breakup Modeling
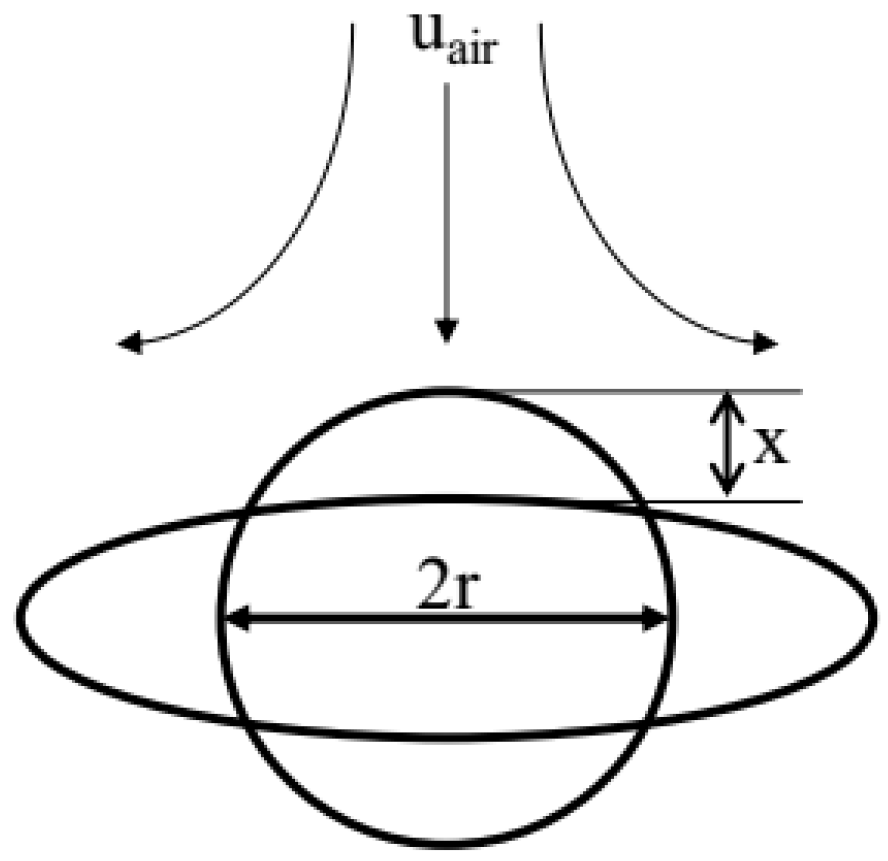
2.3.2. Secondary Breakup Modeling
3. Experimental Procedures
3.1. Fuel Preparation
3.2. Fuel Properties
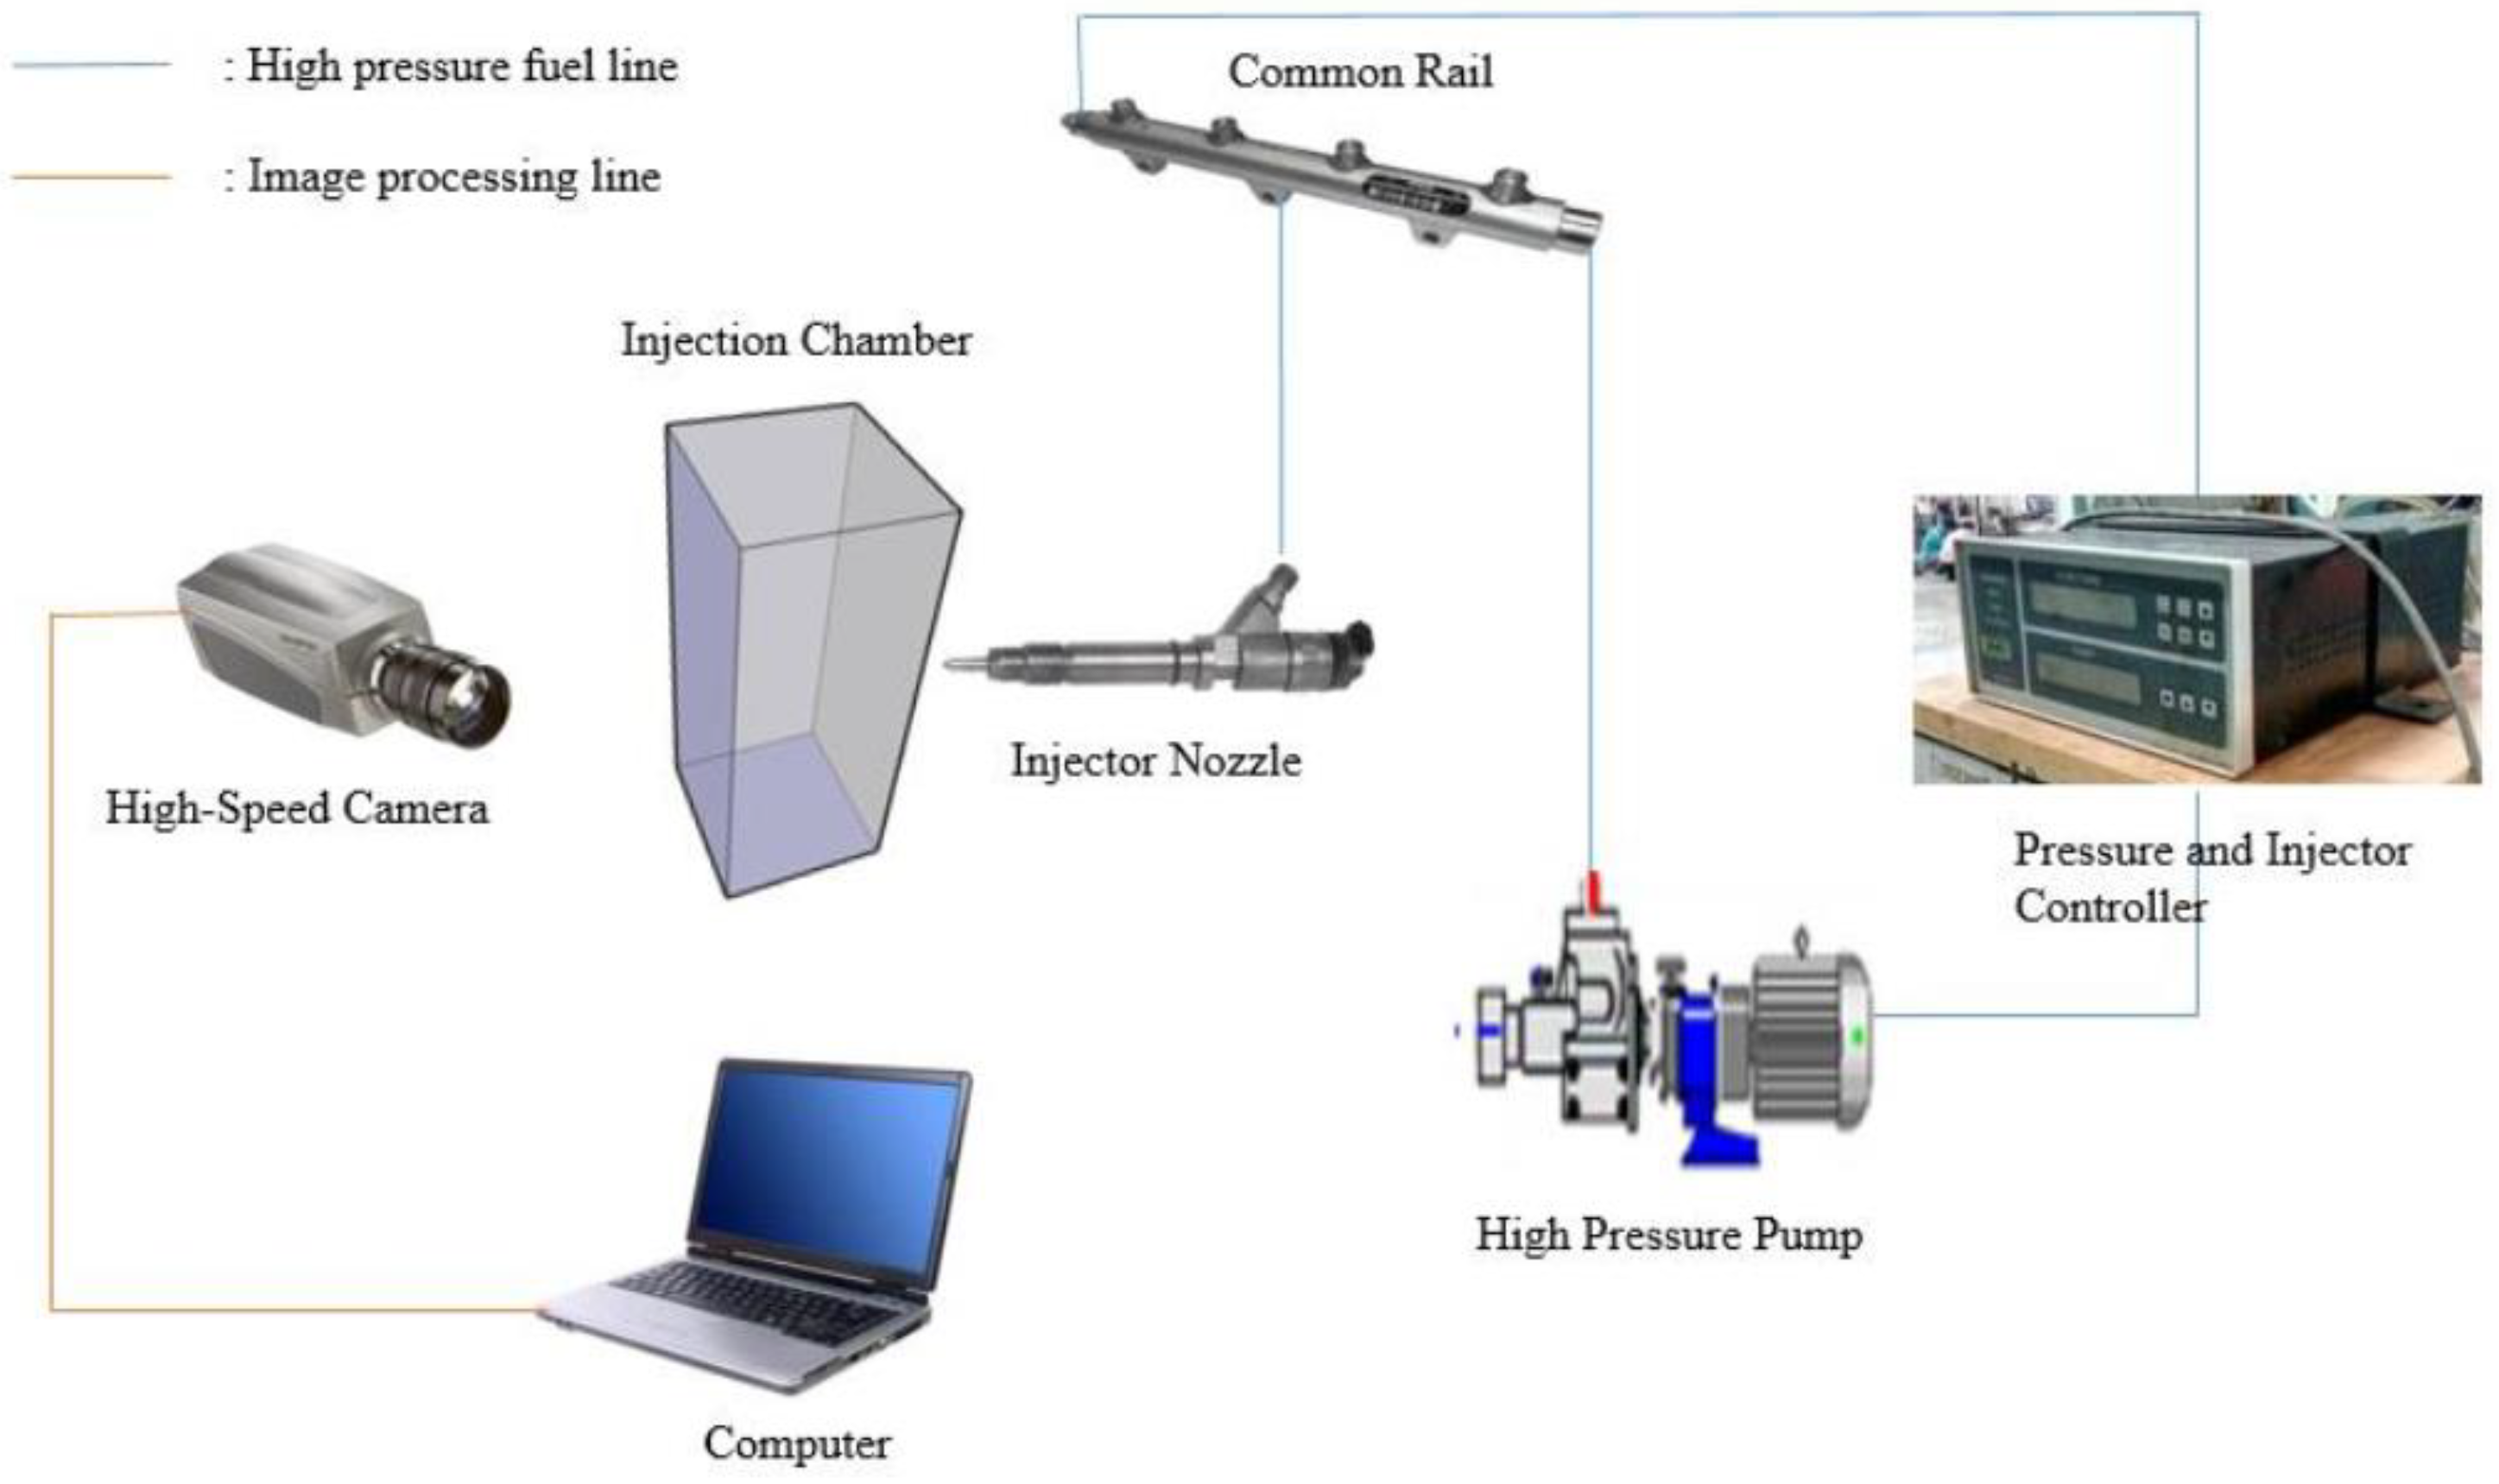
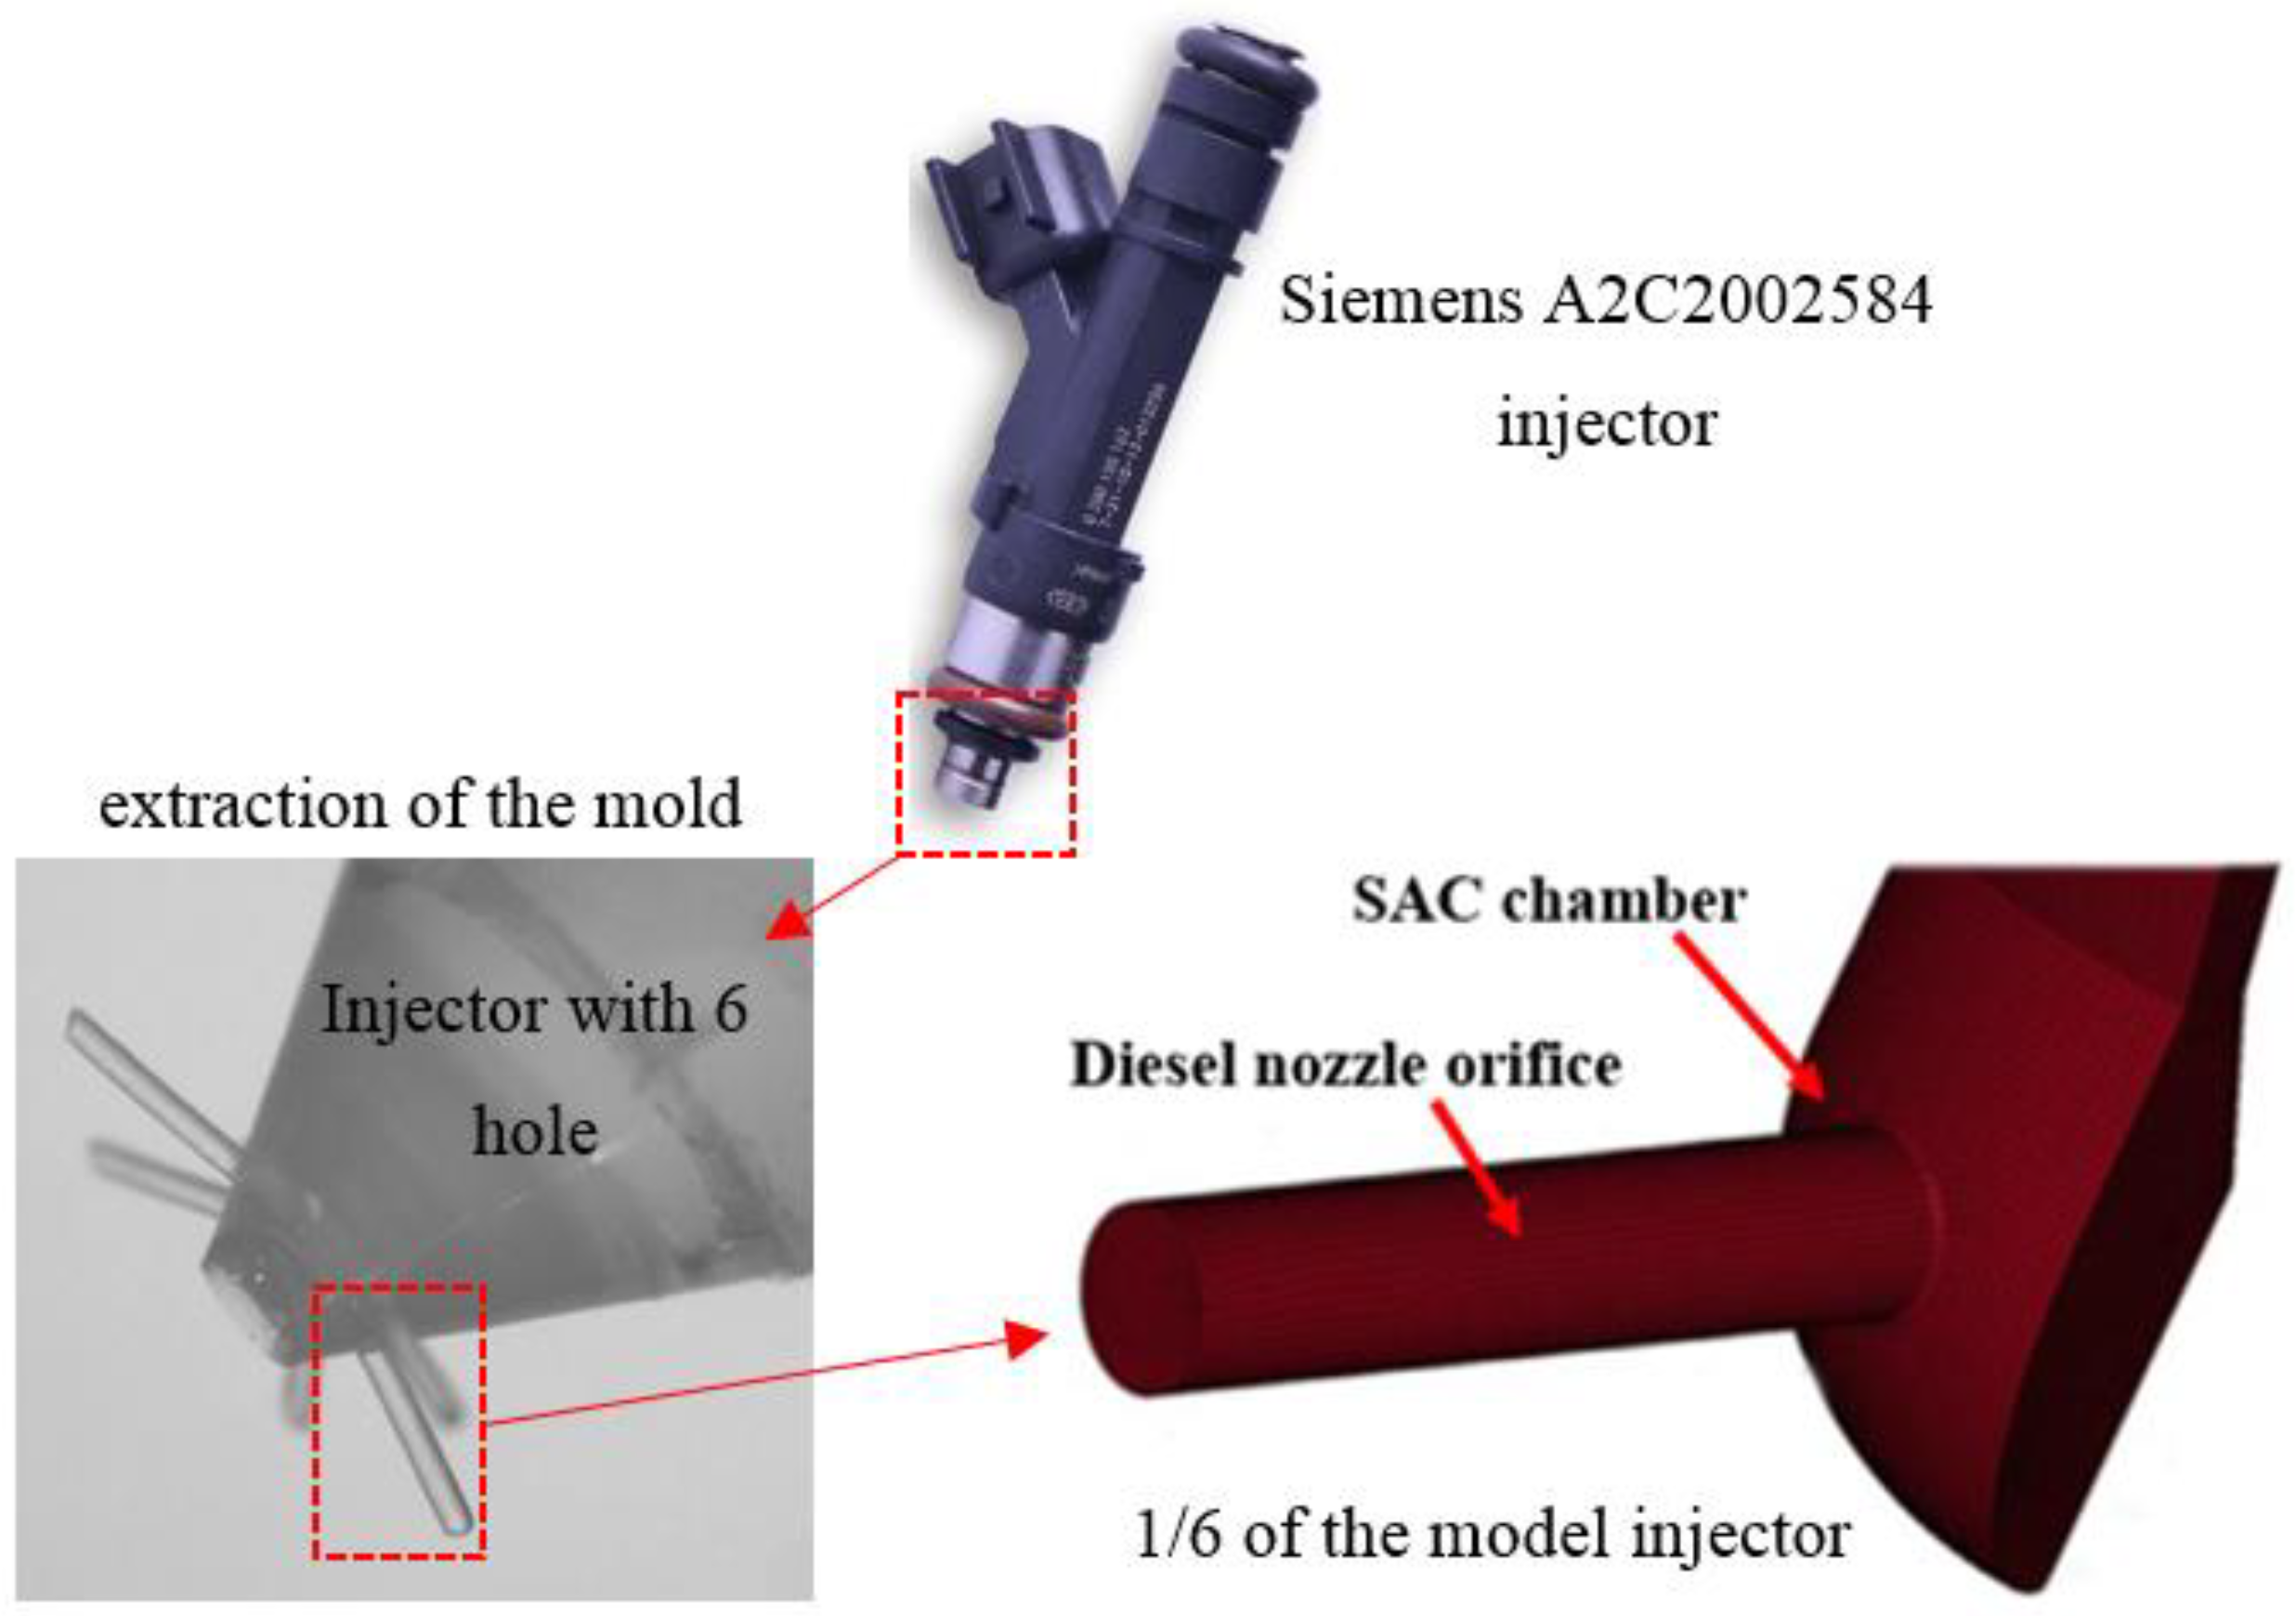
3.3. Experiment Setup
4. Simulation Methodology
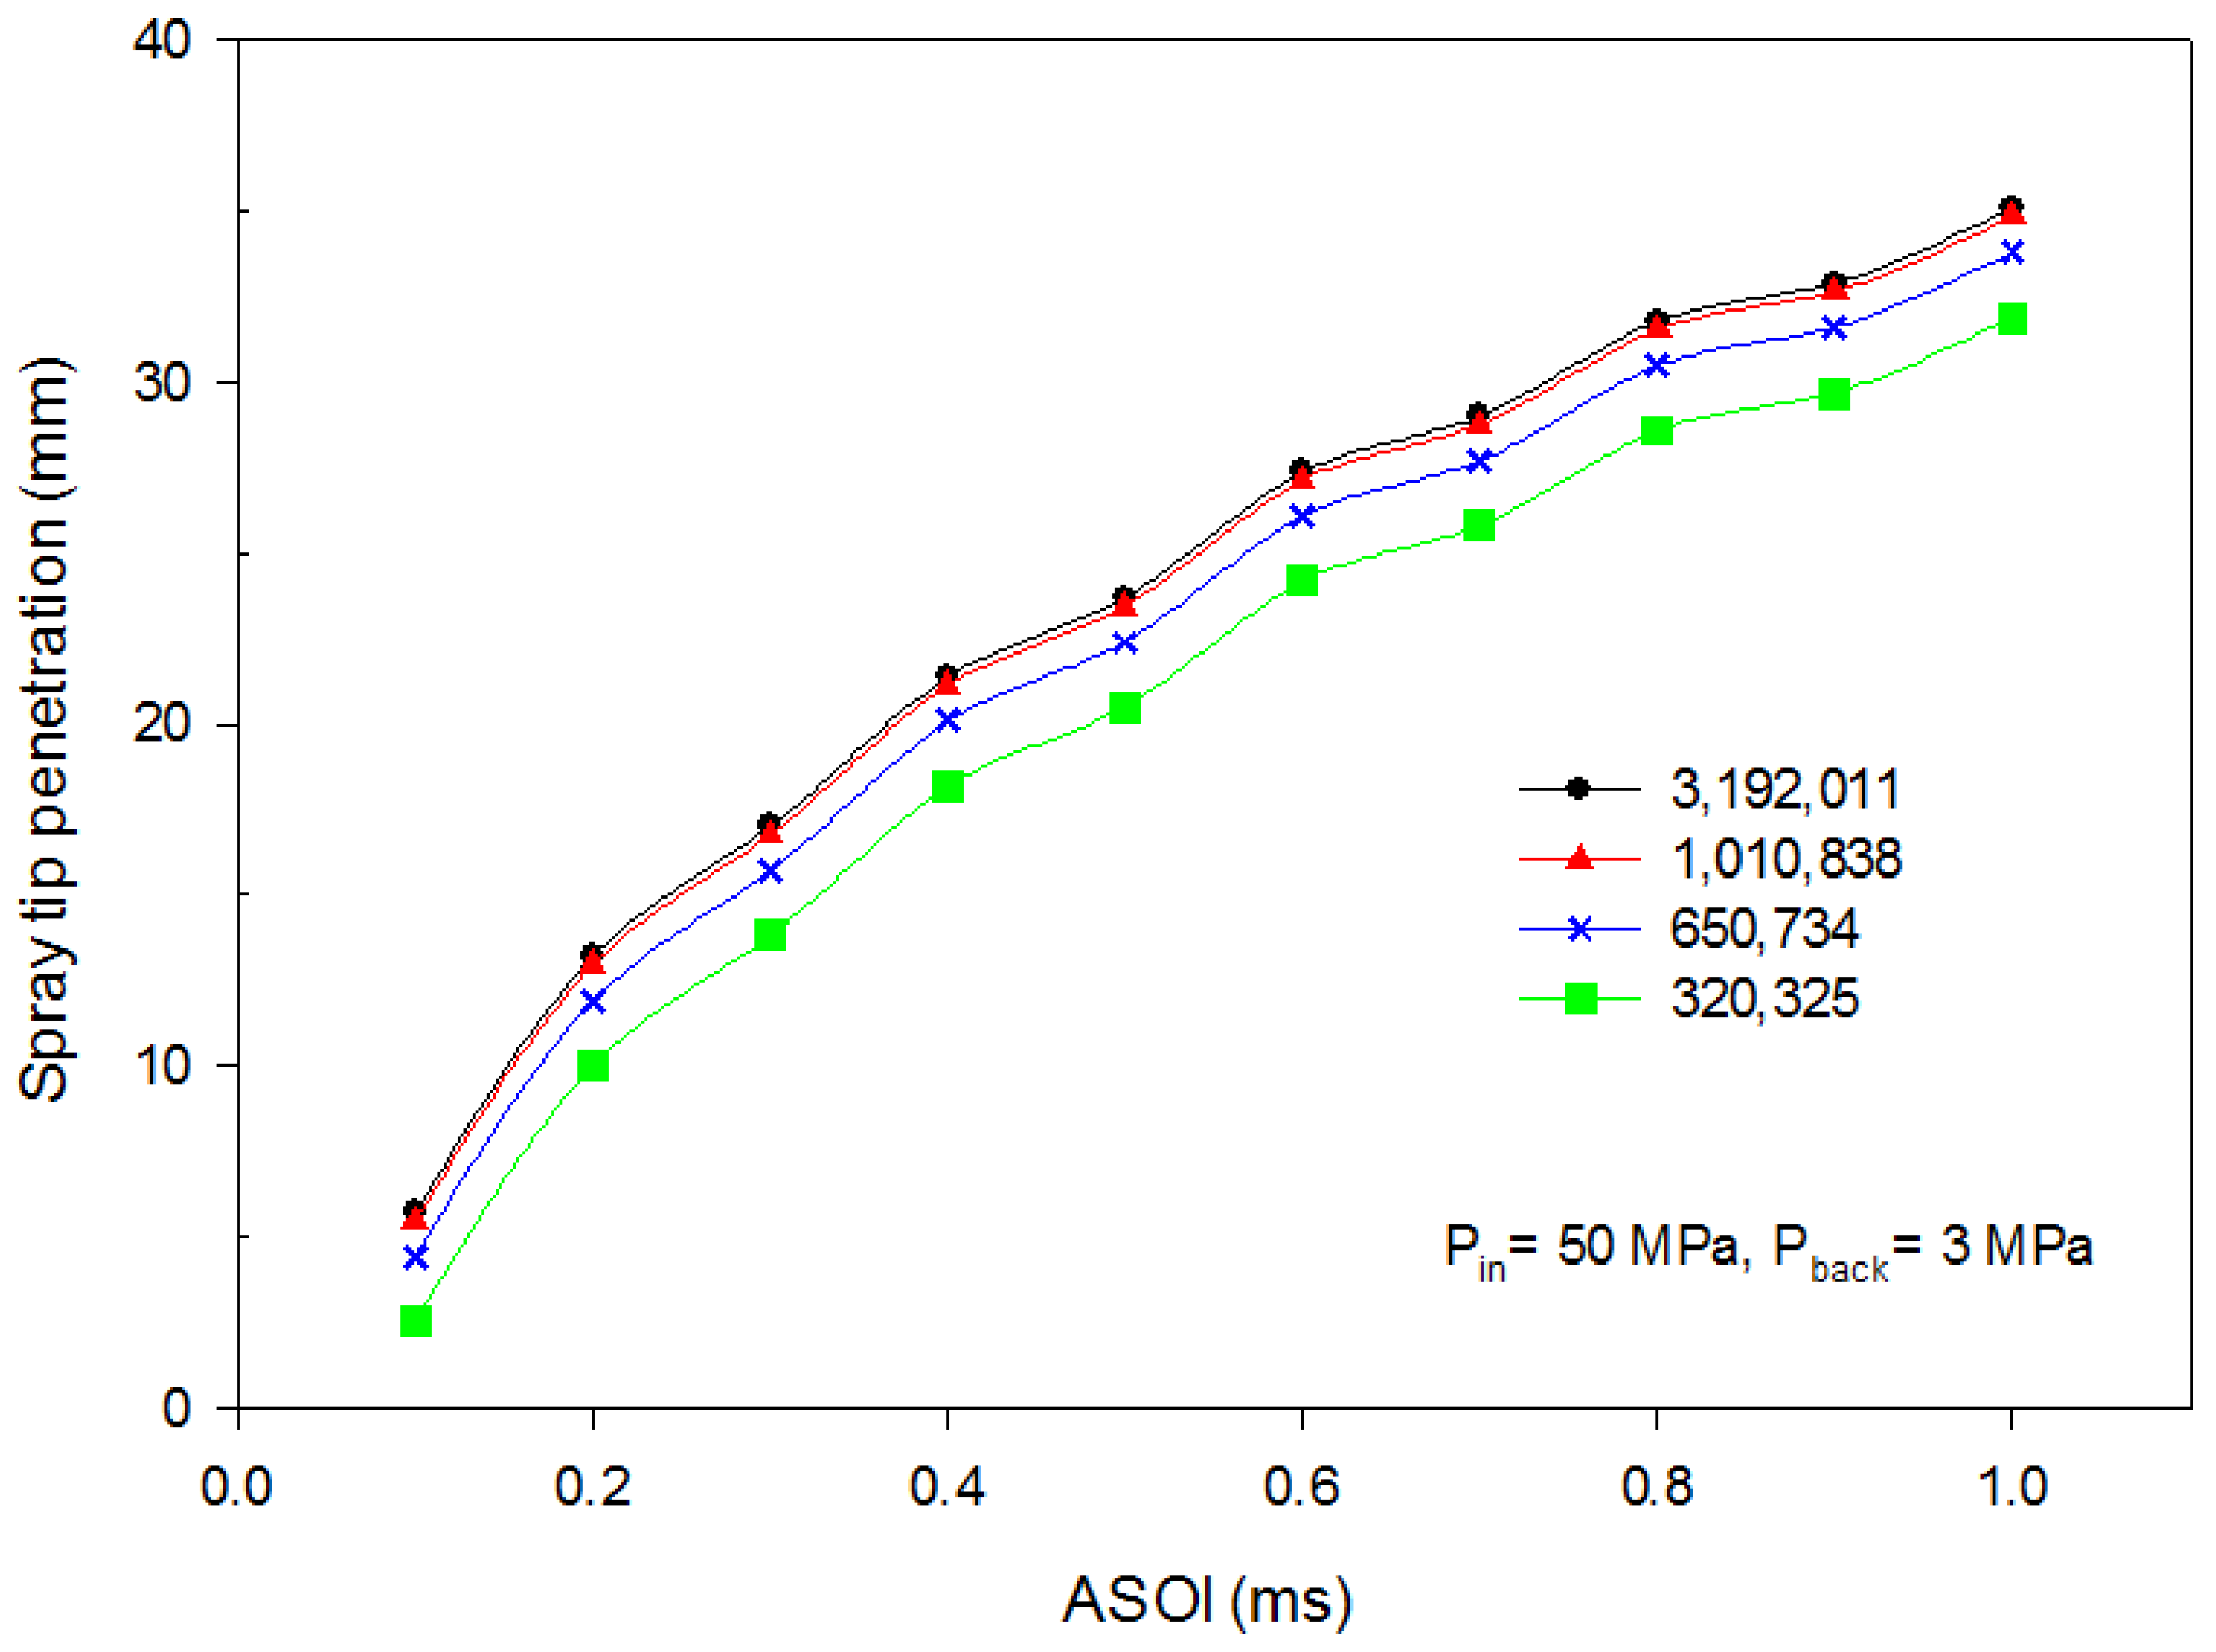
Grid Independence Tests
5. Result and Discussion
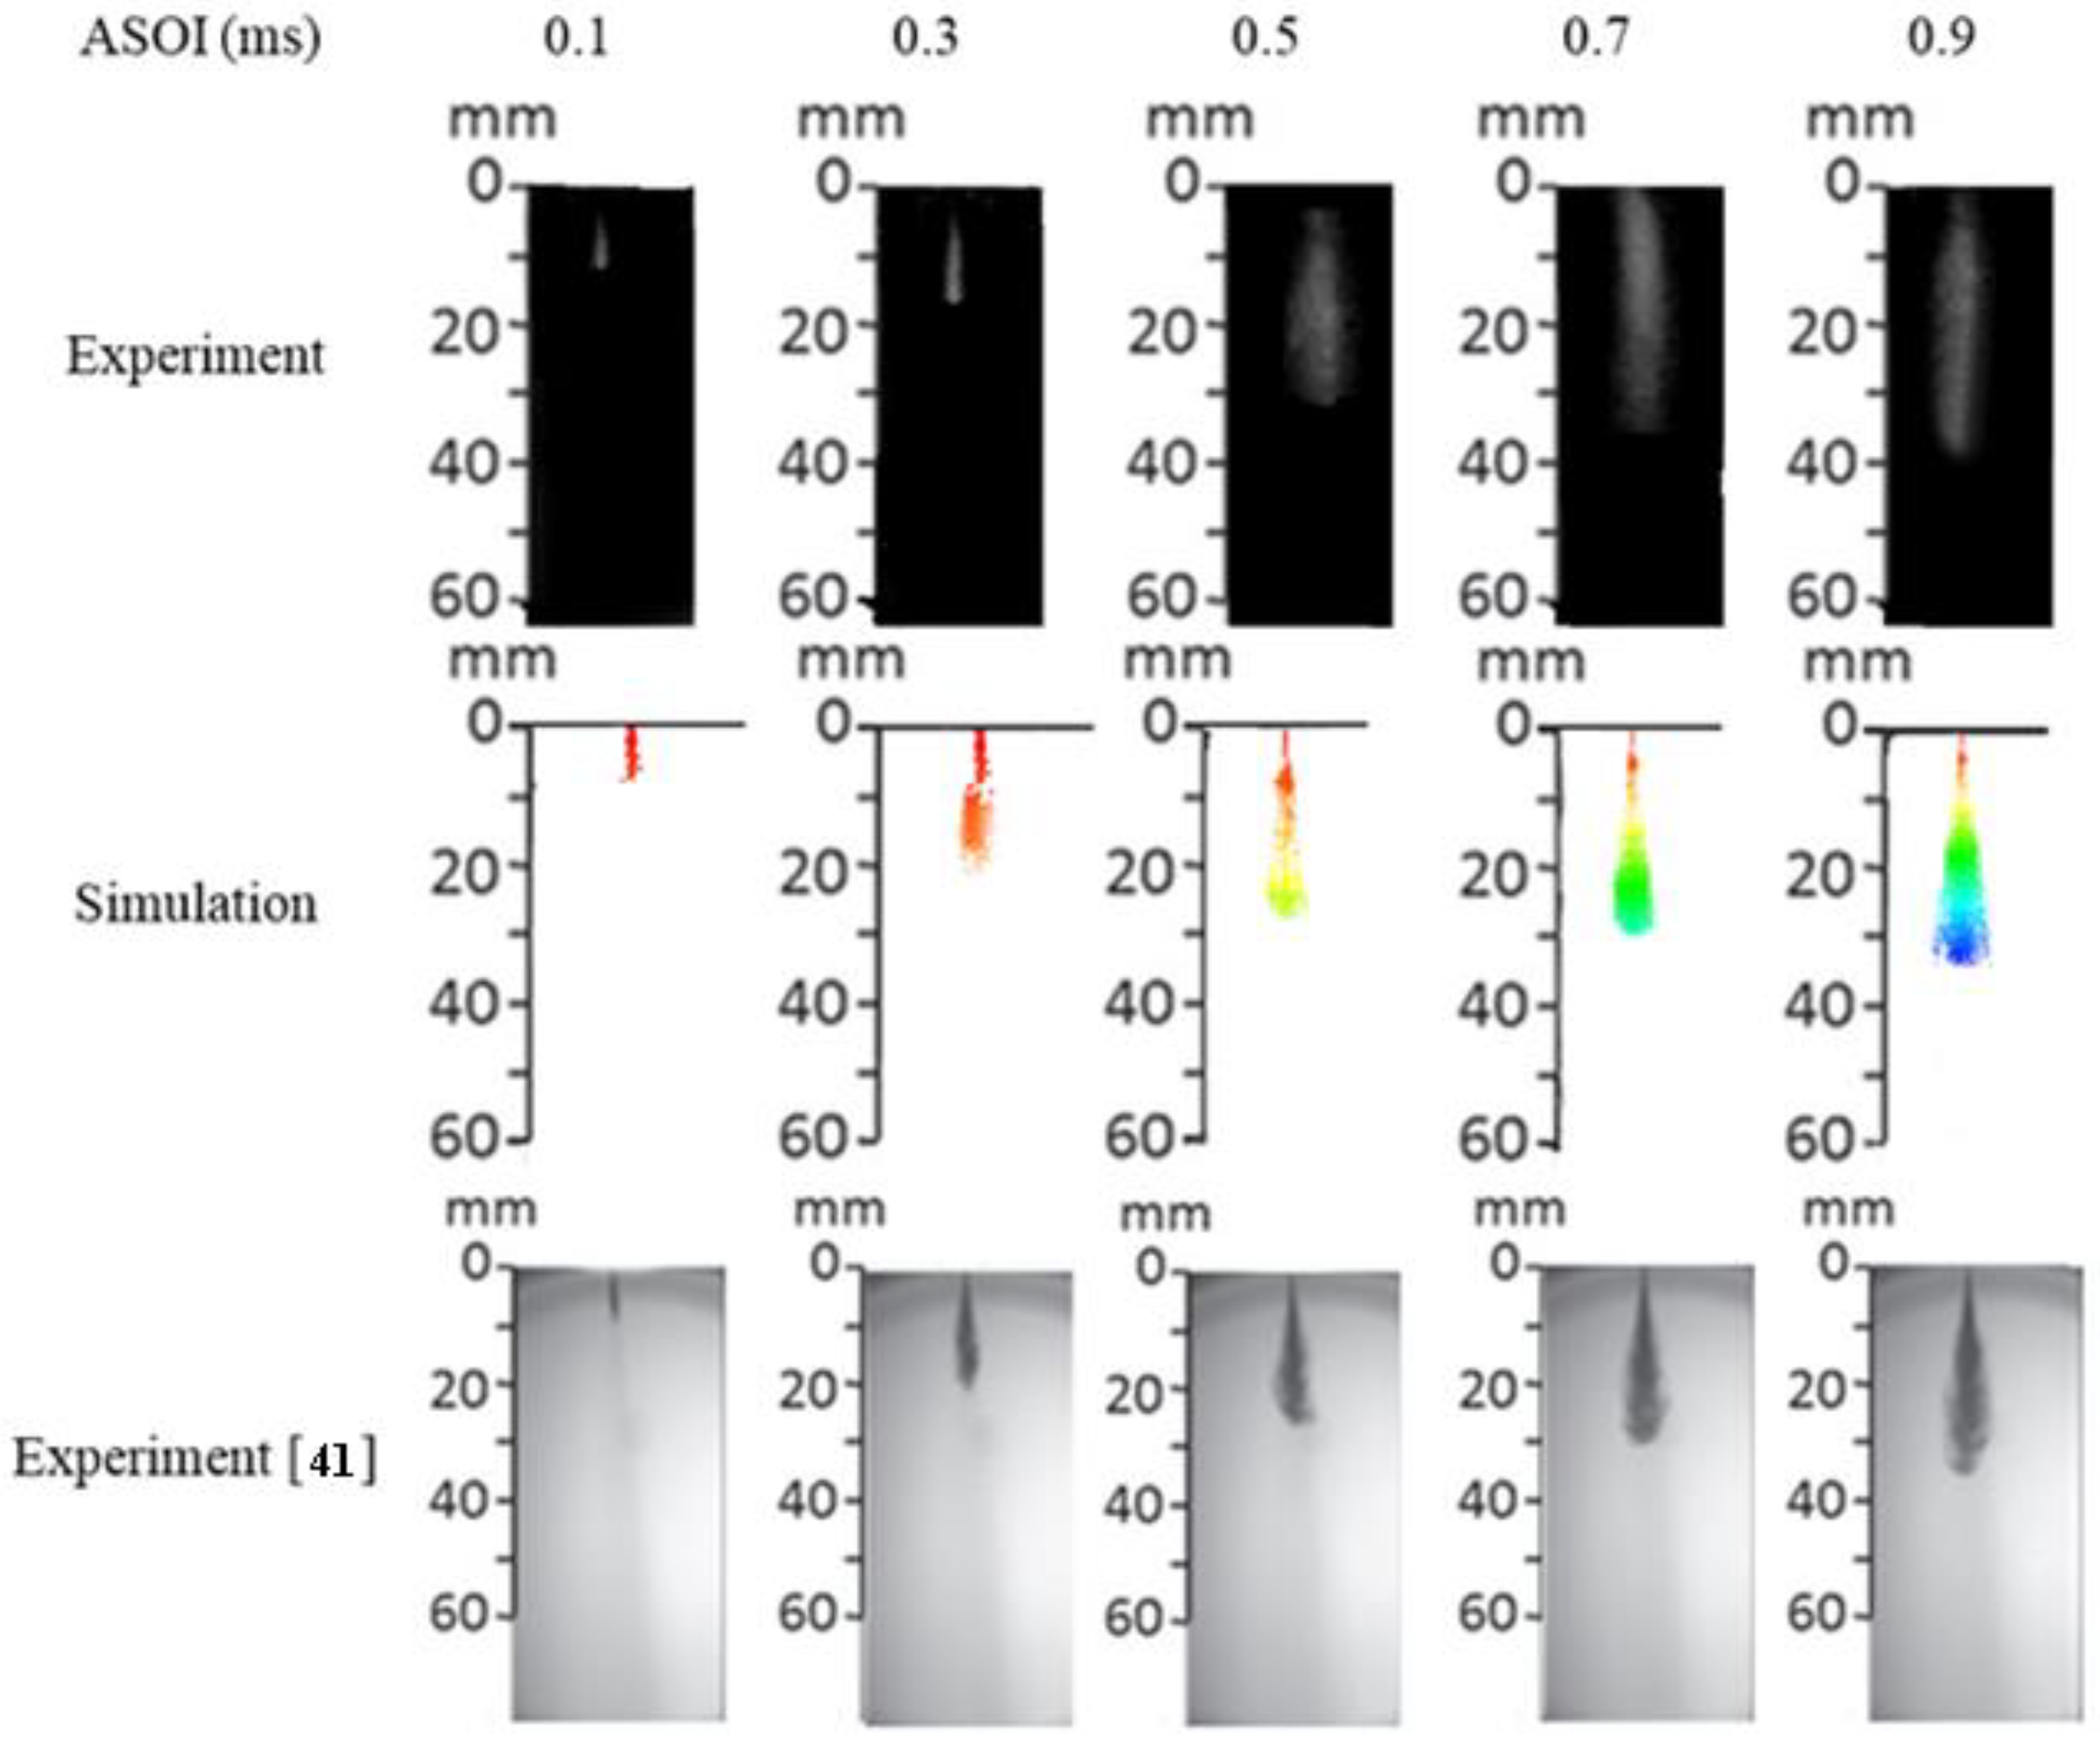
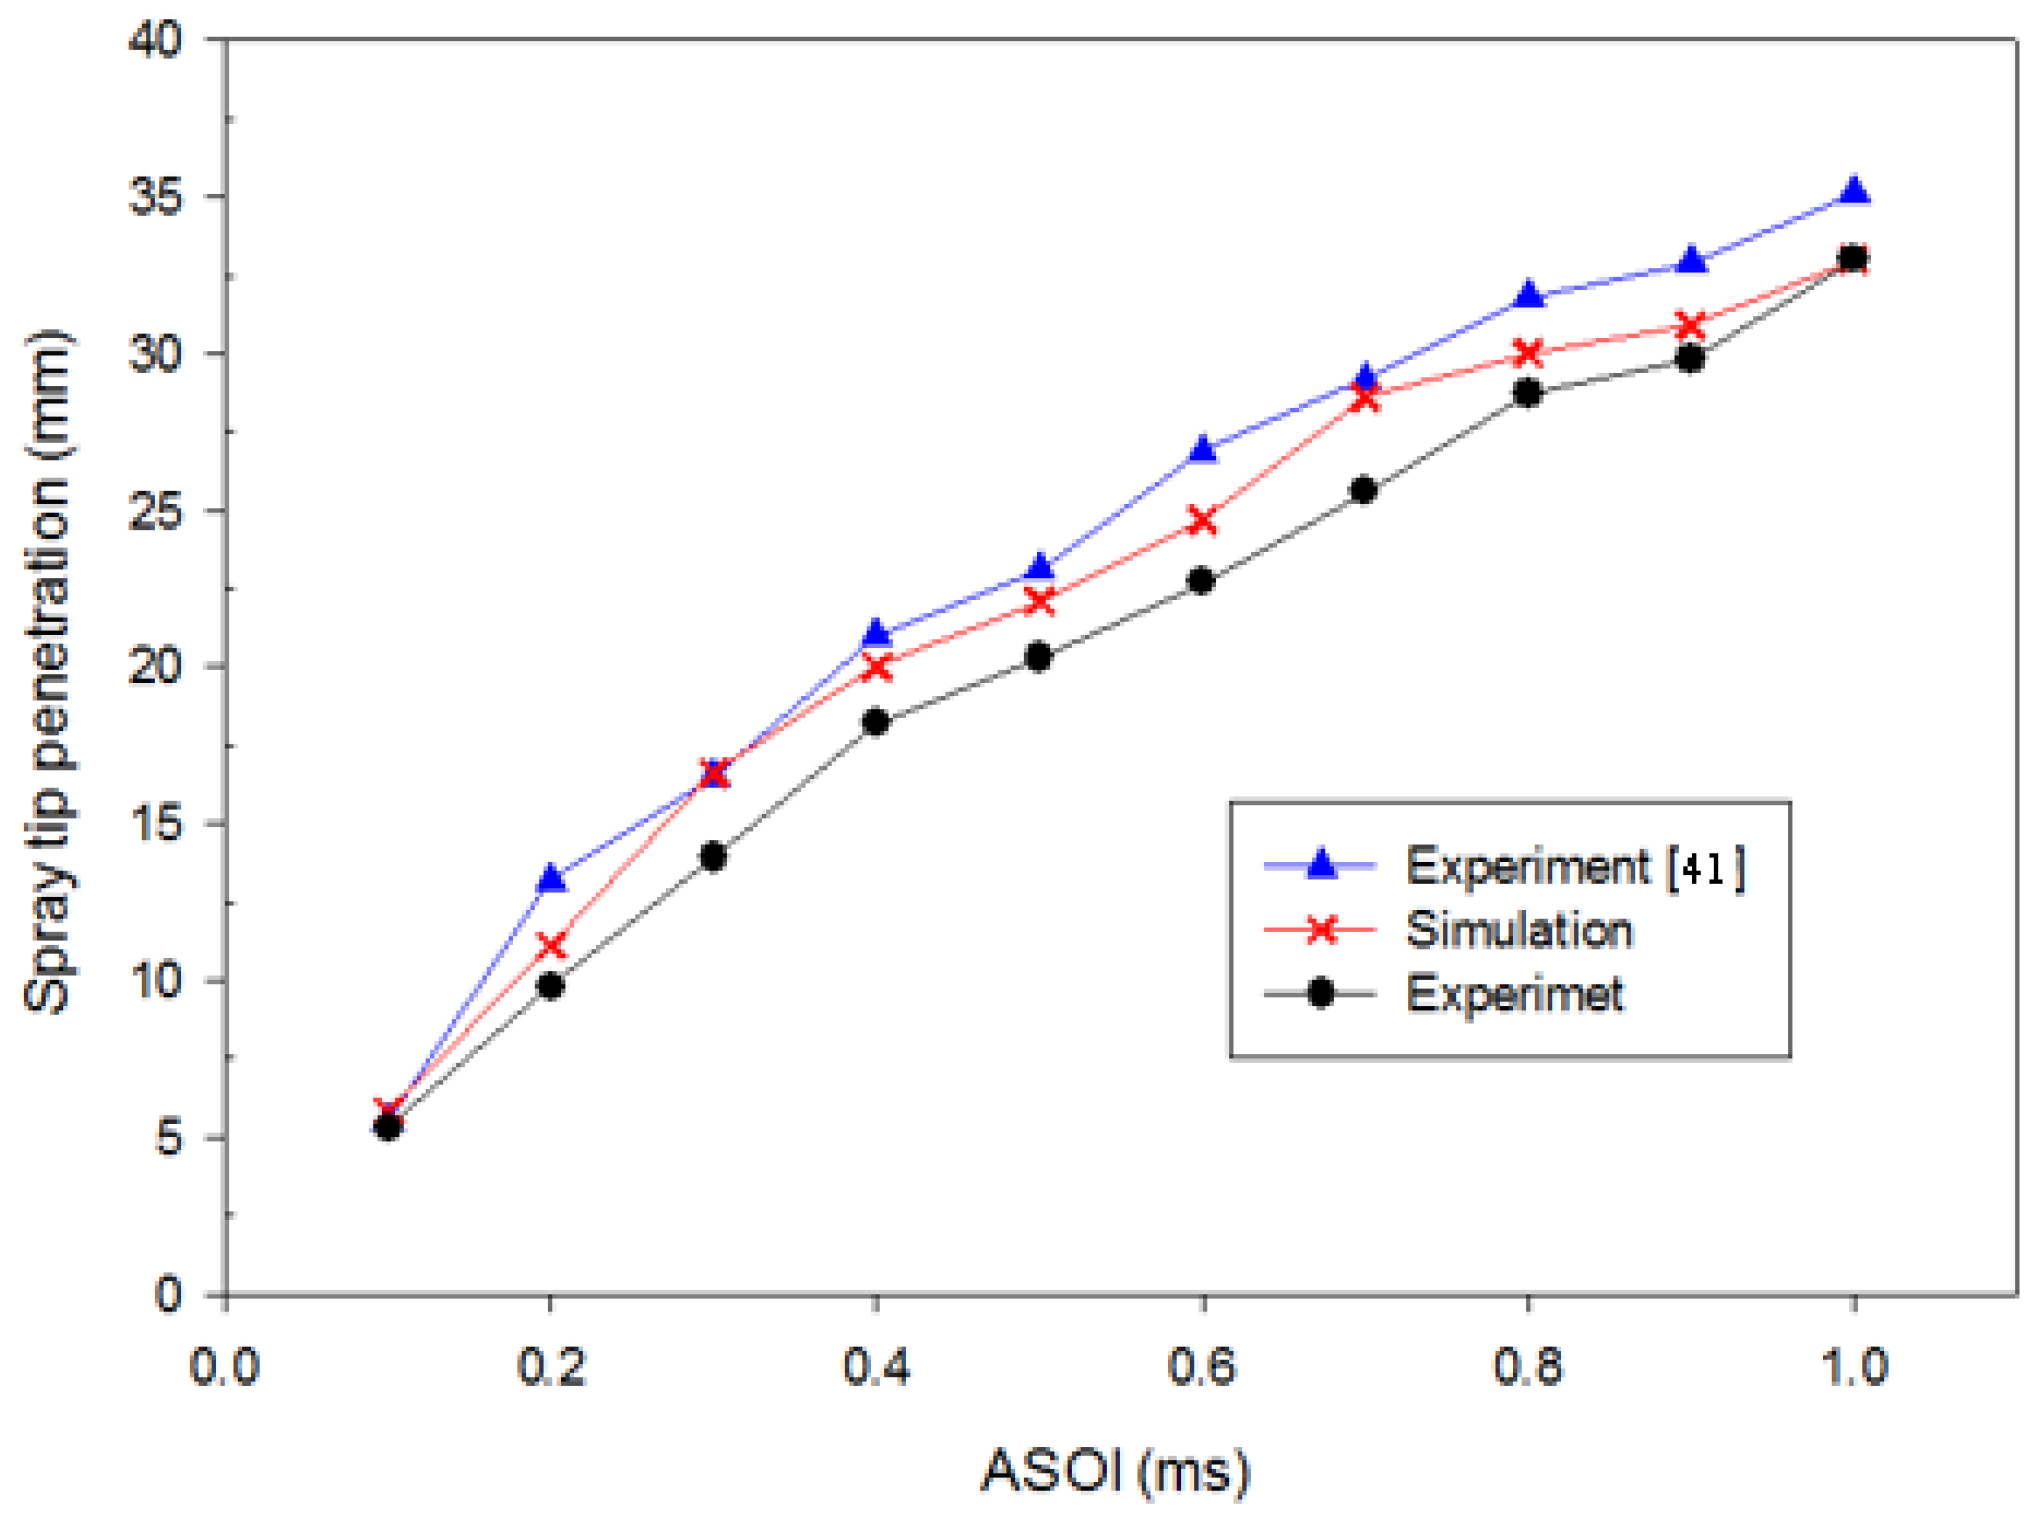
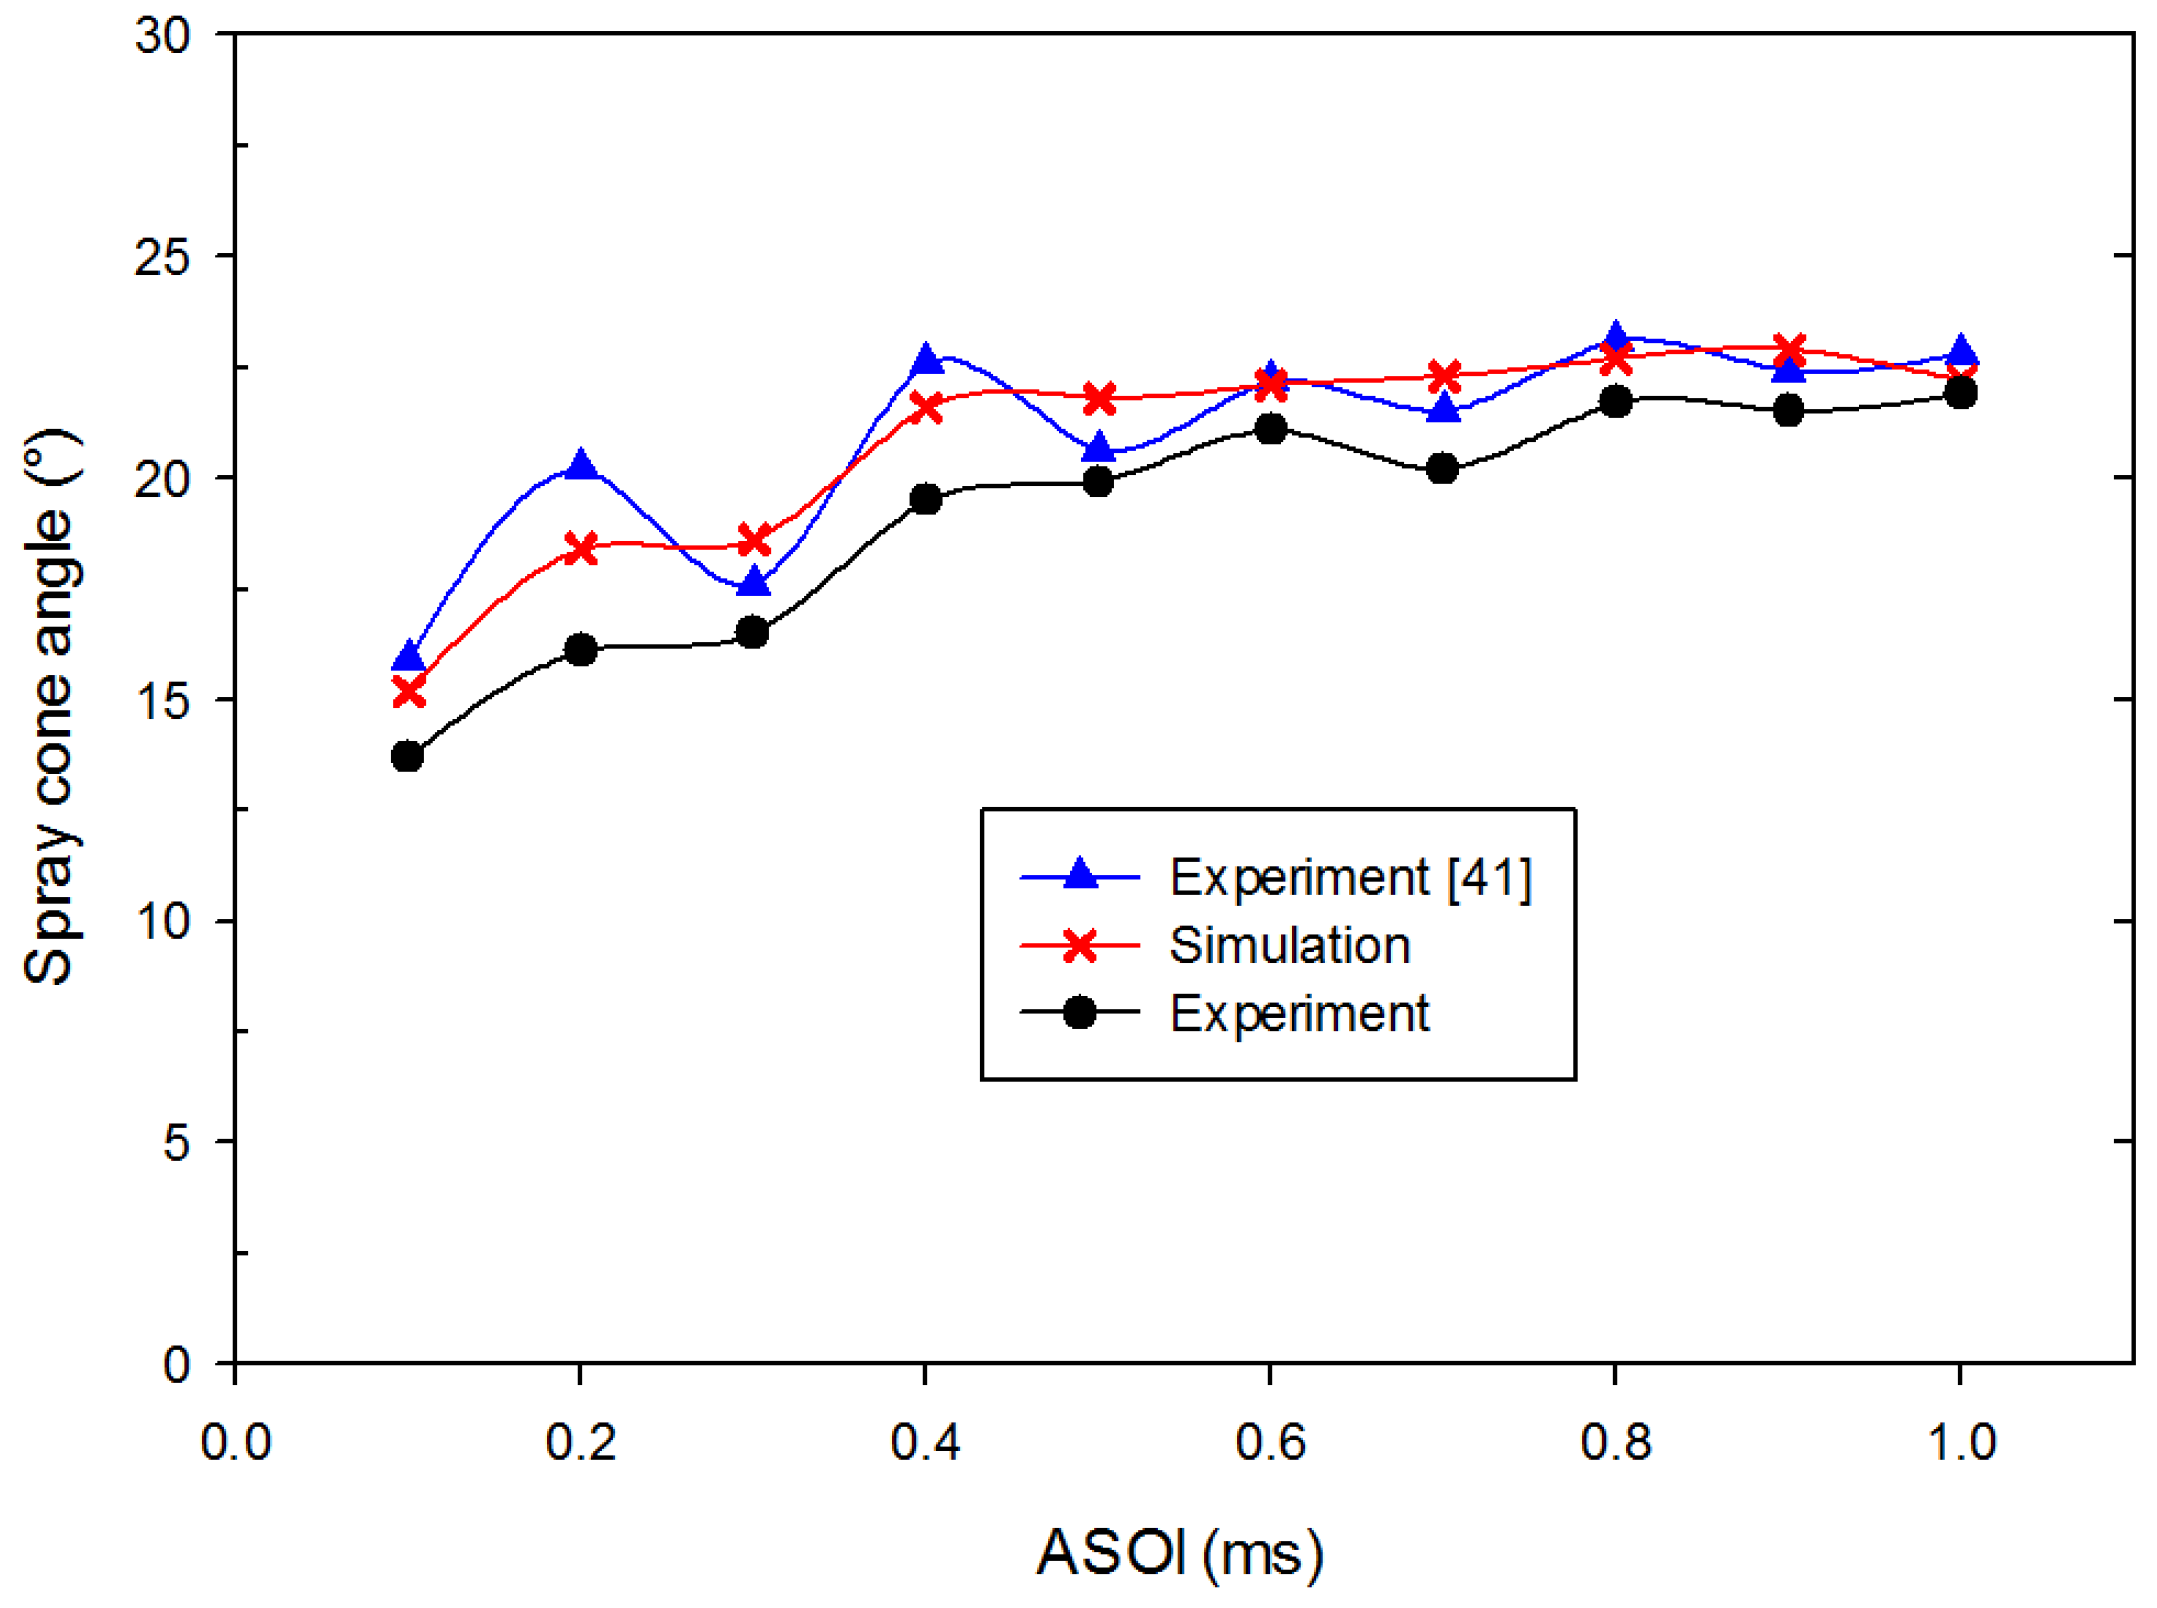
5.1. Model Validation
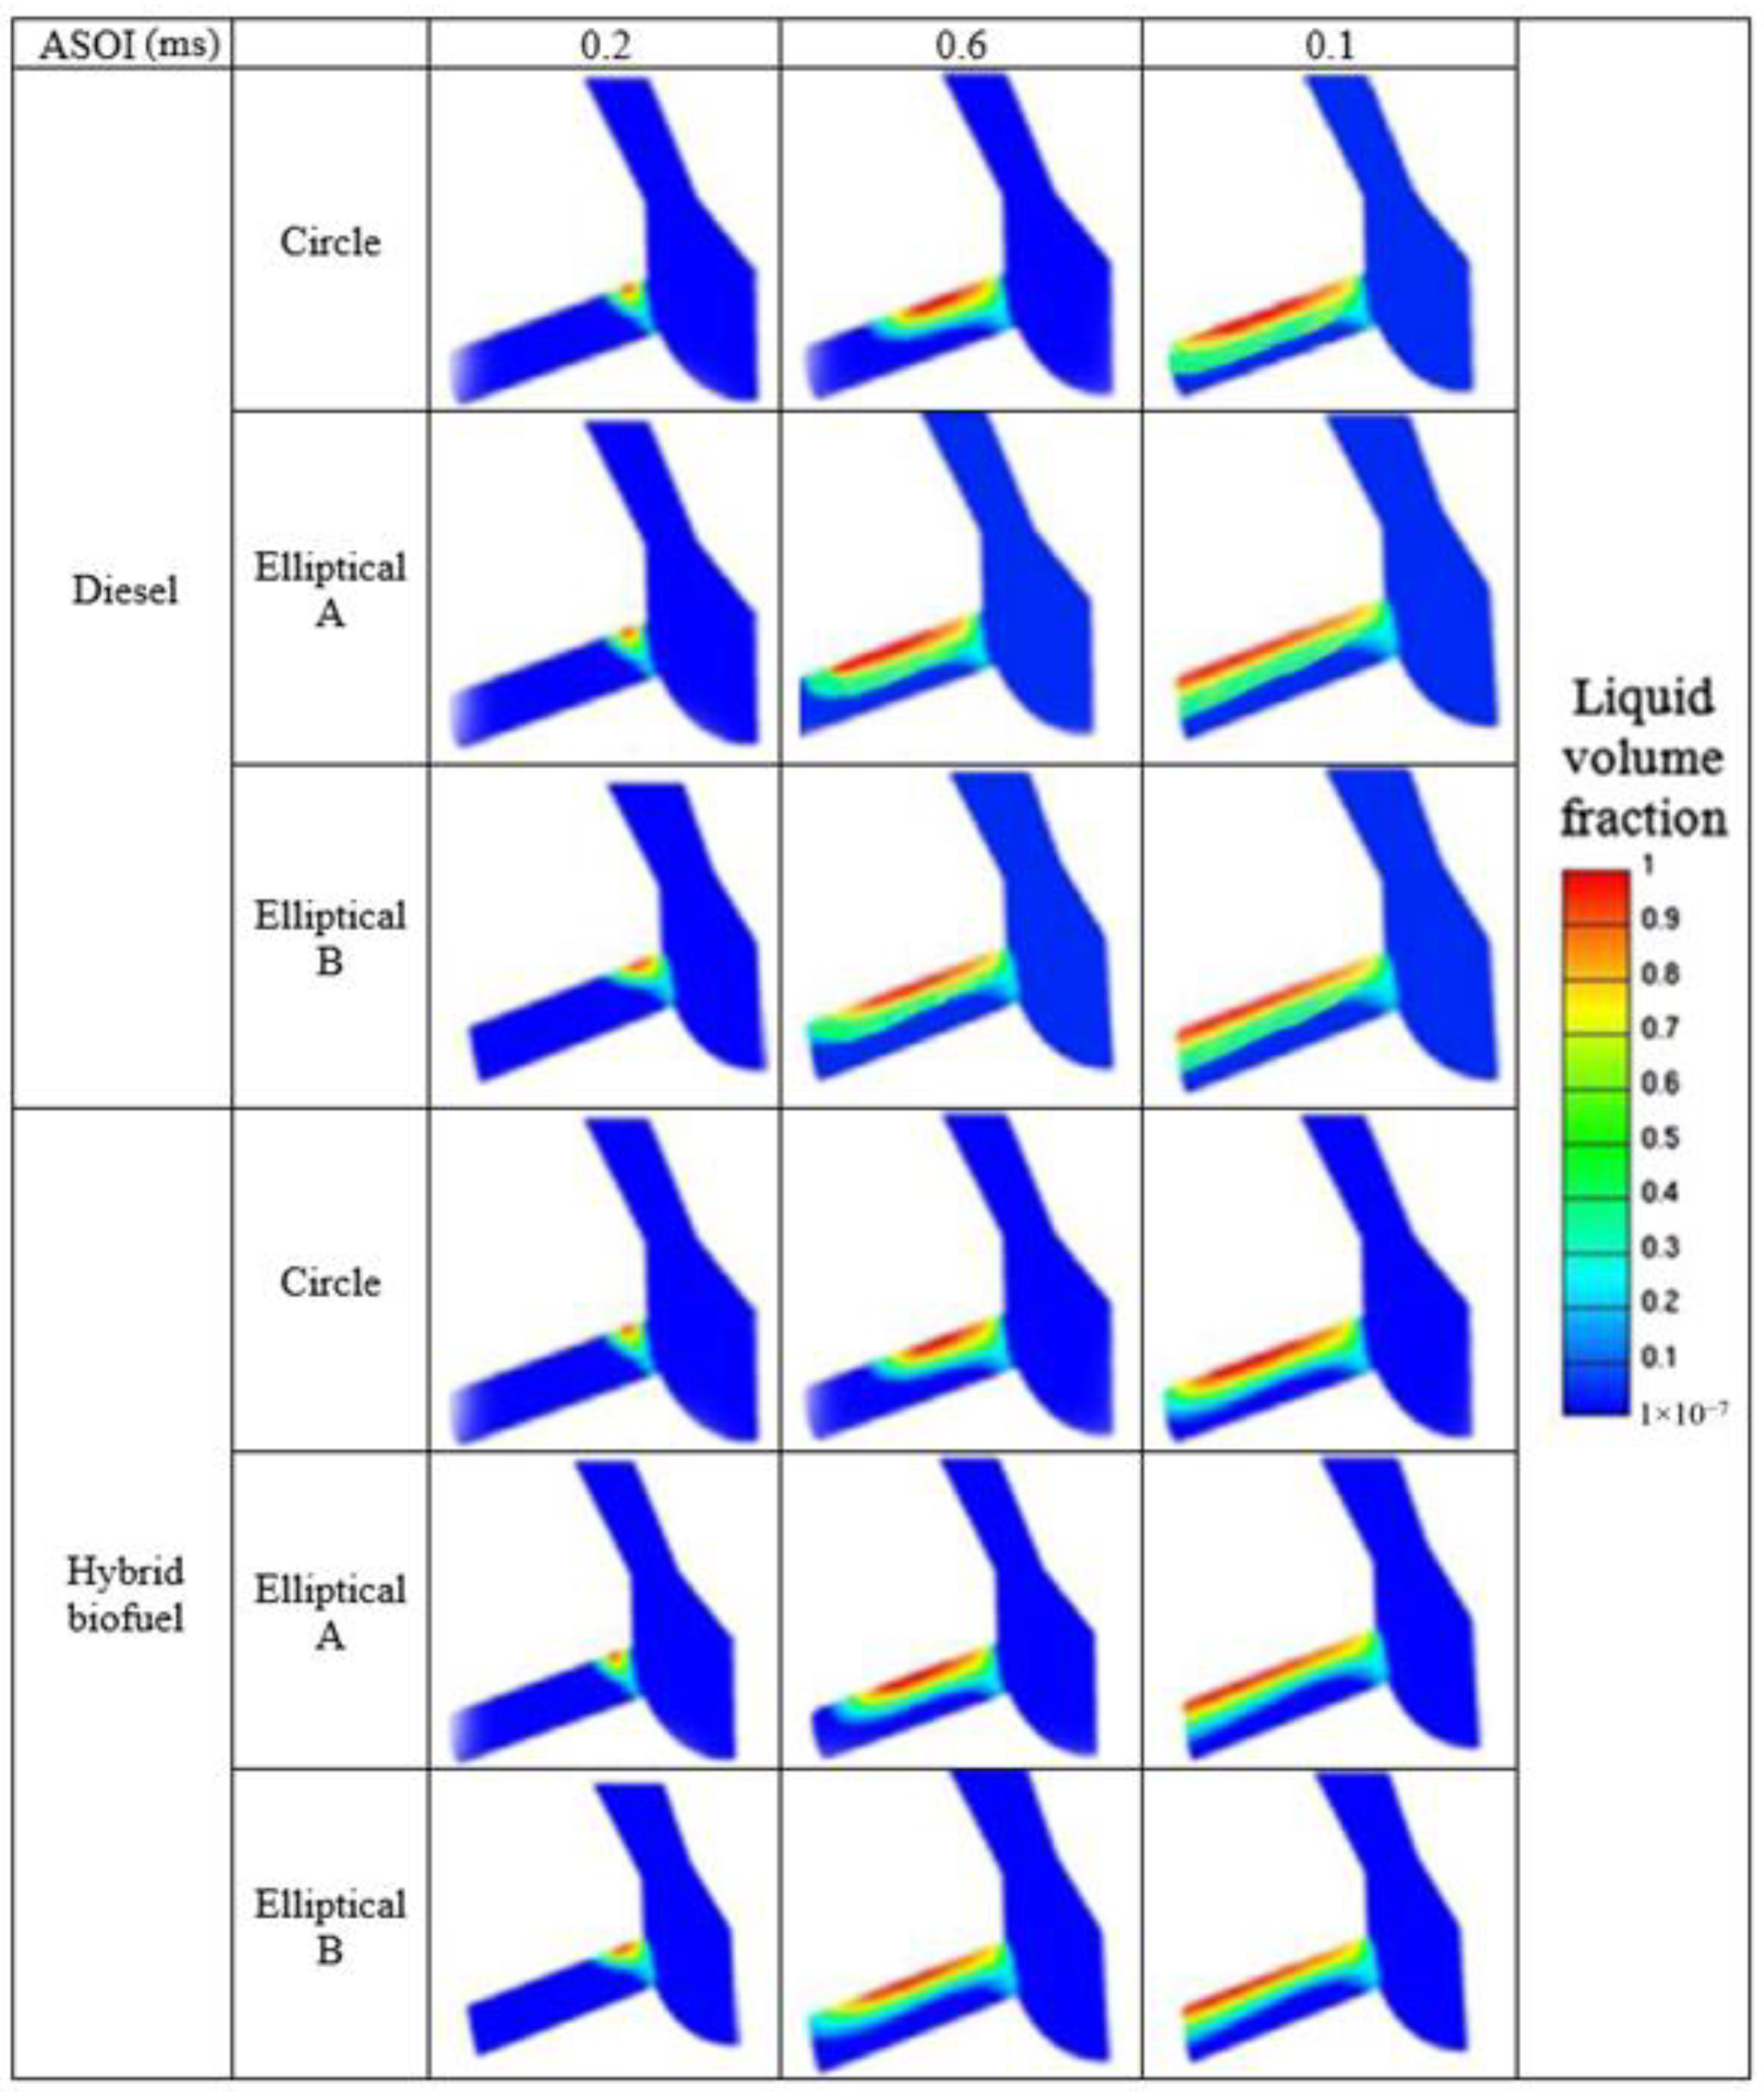
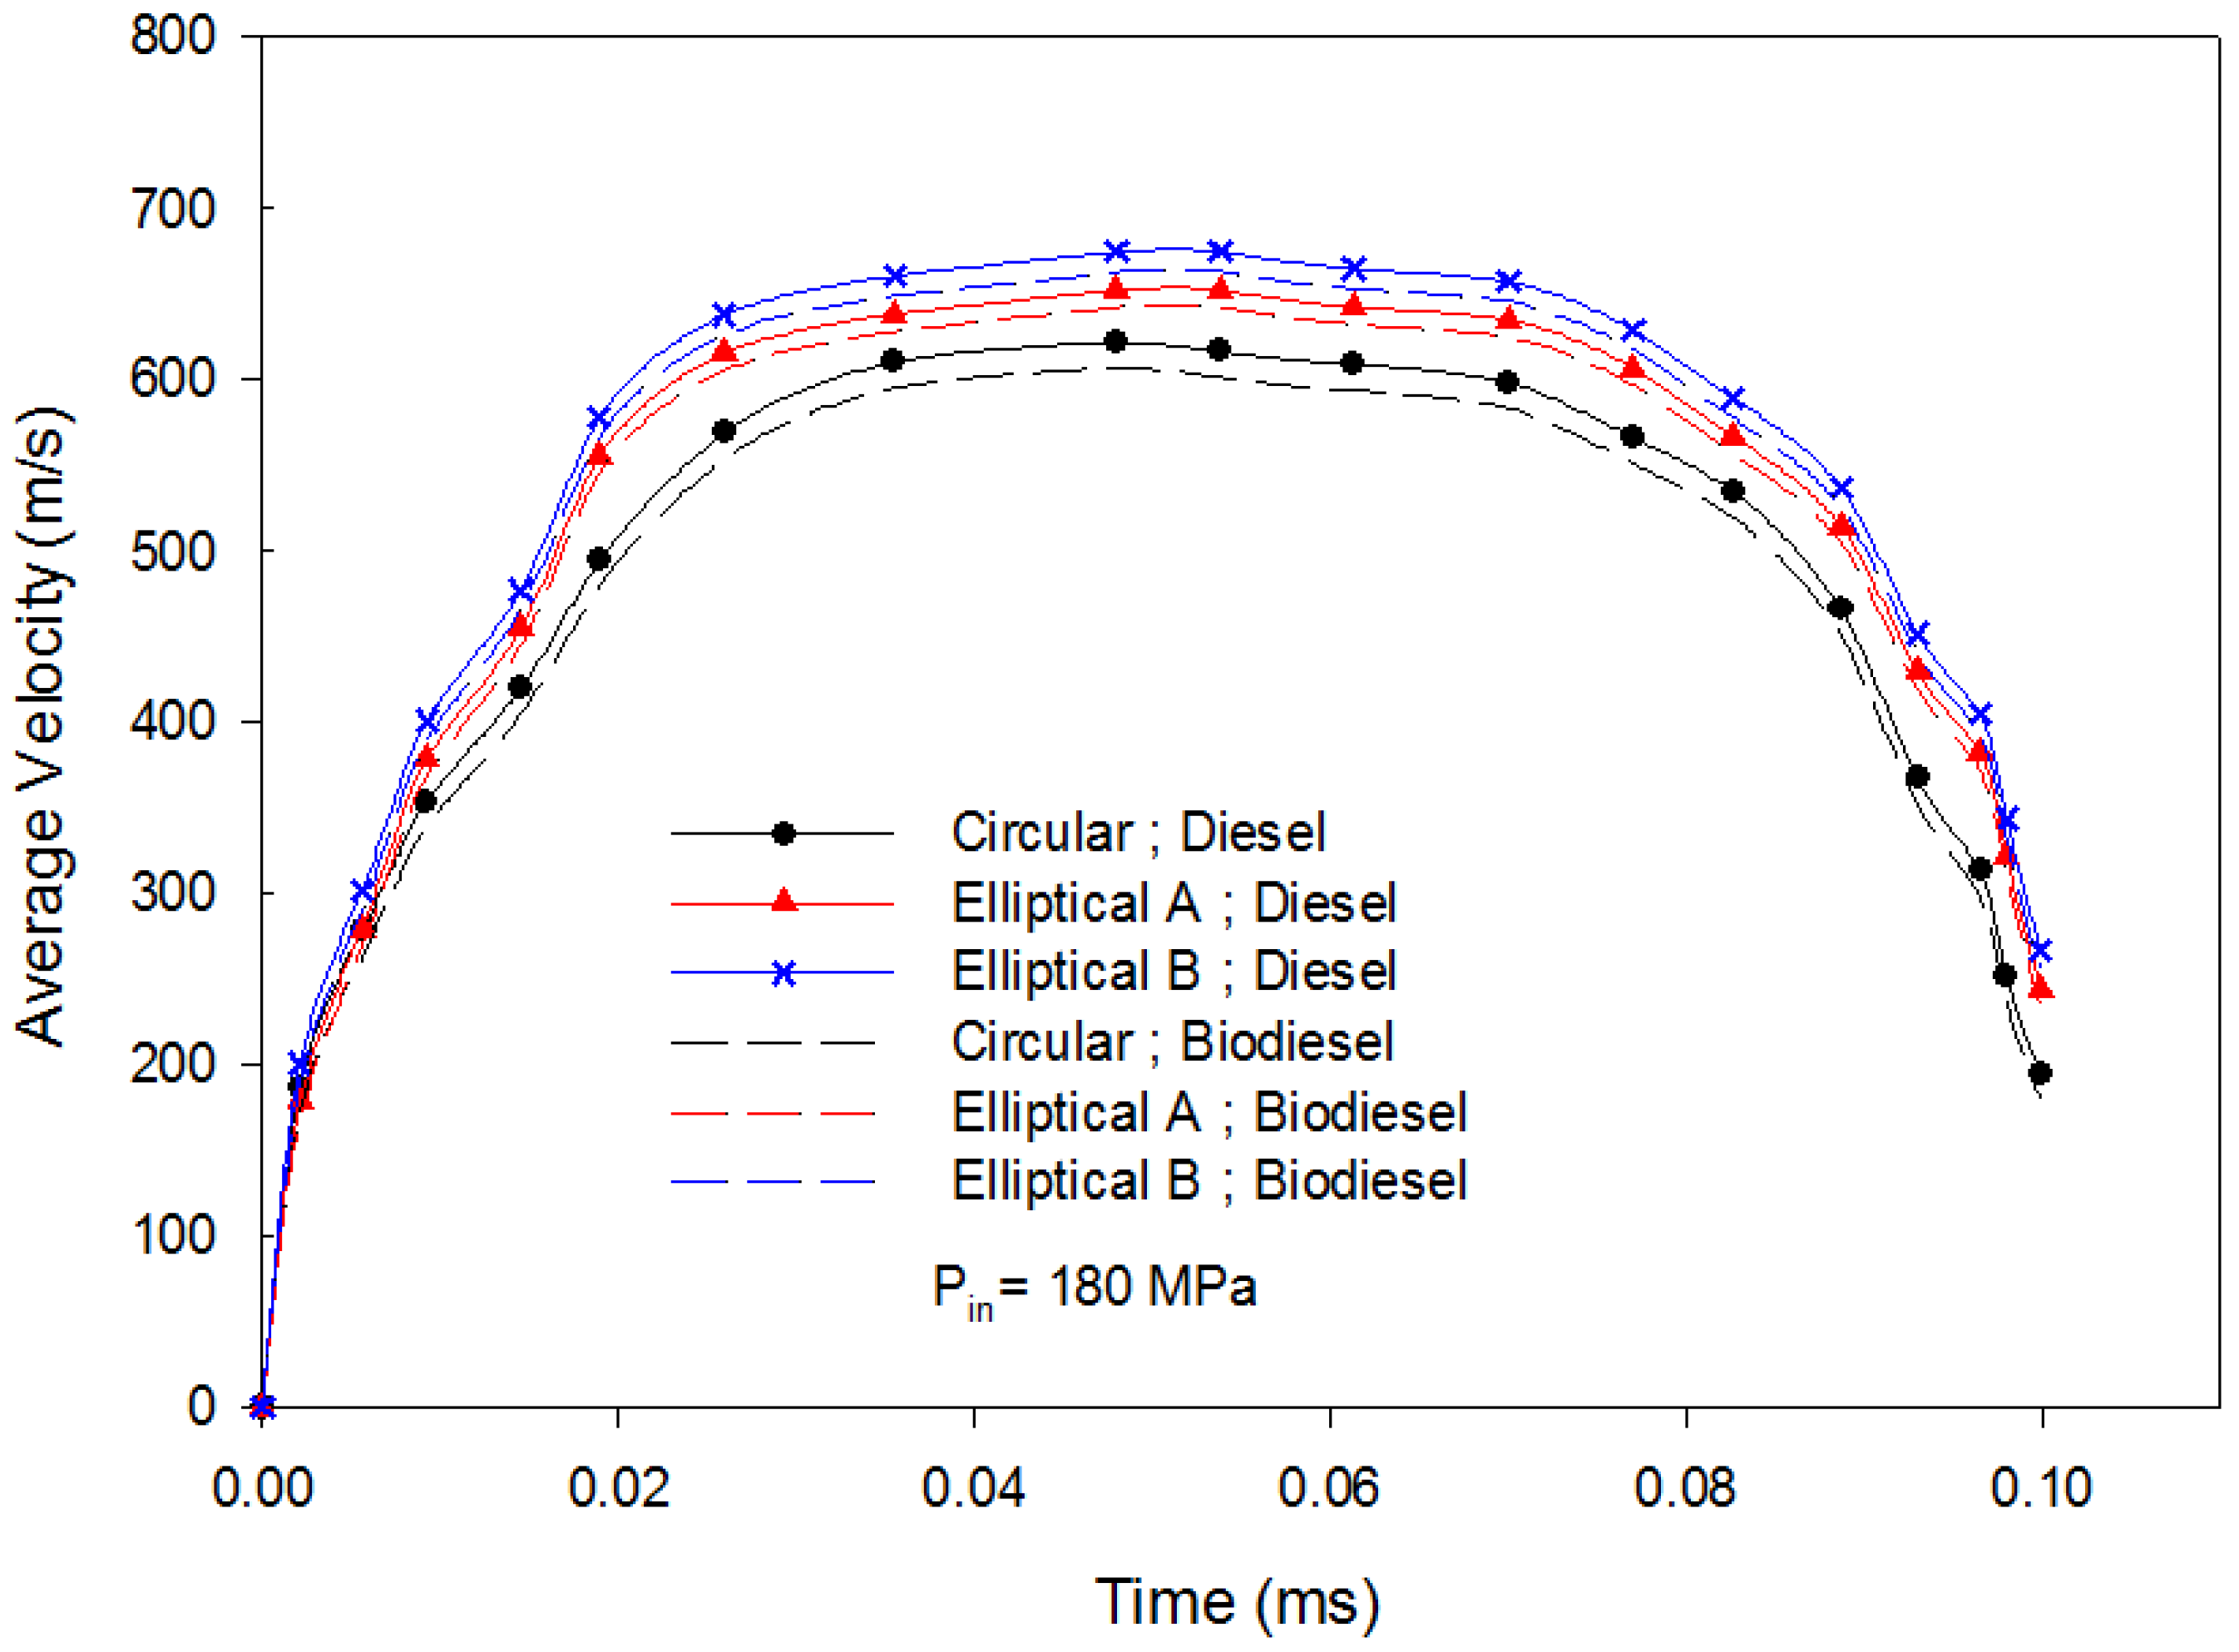
5.2. Nozzle Flow Simulations
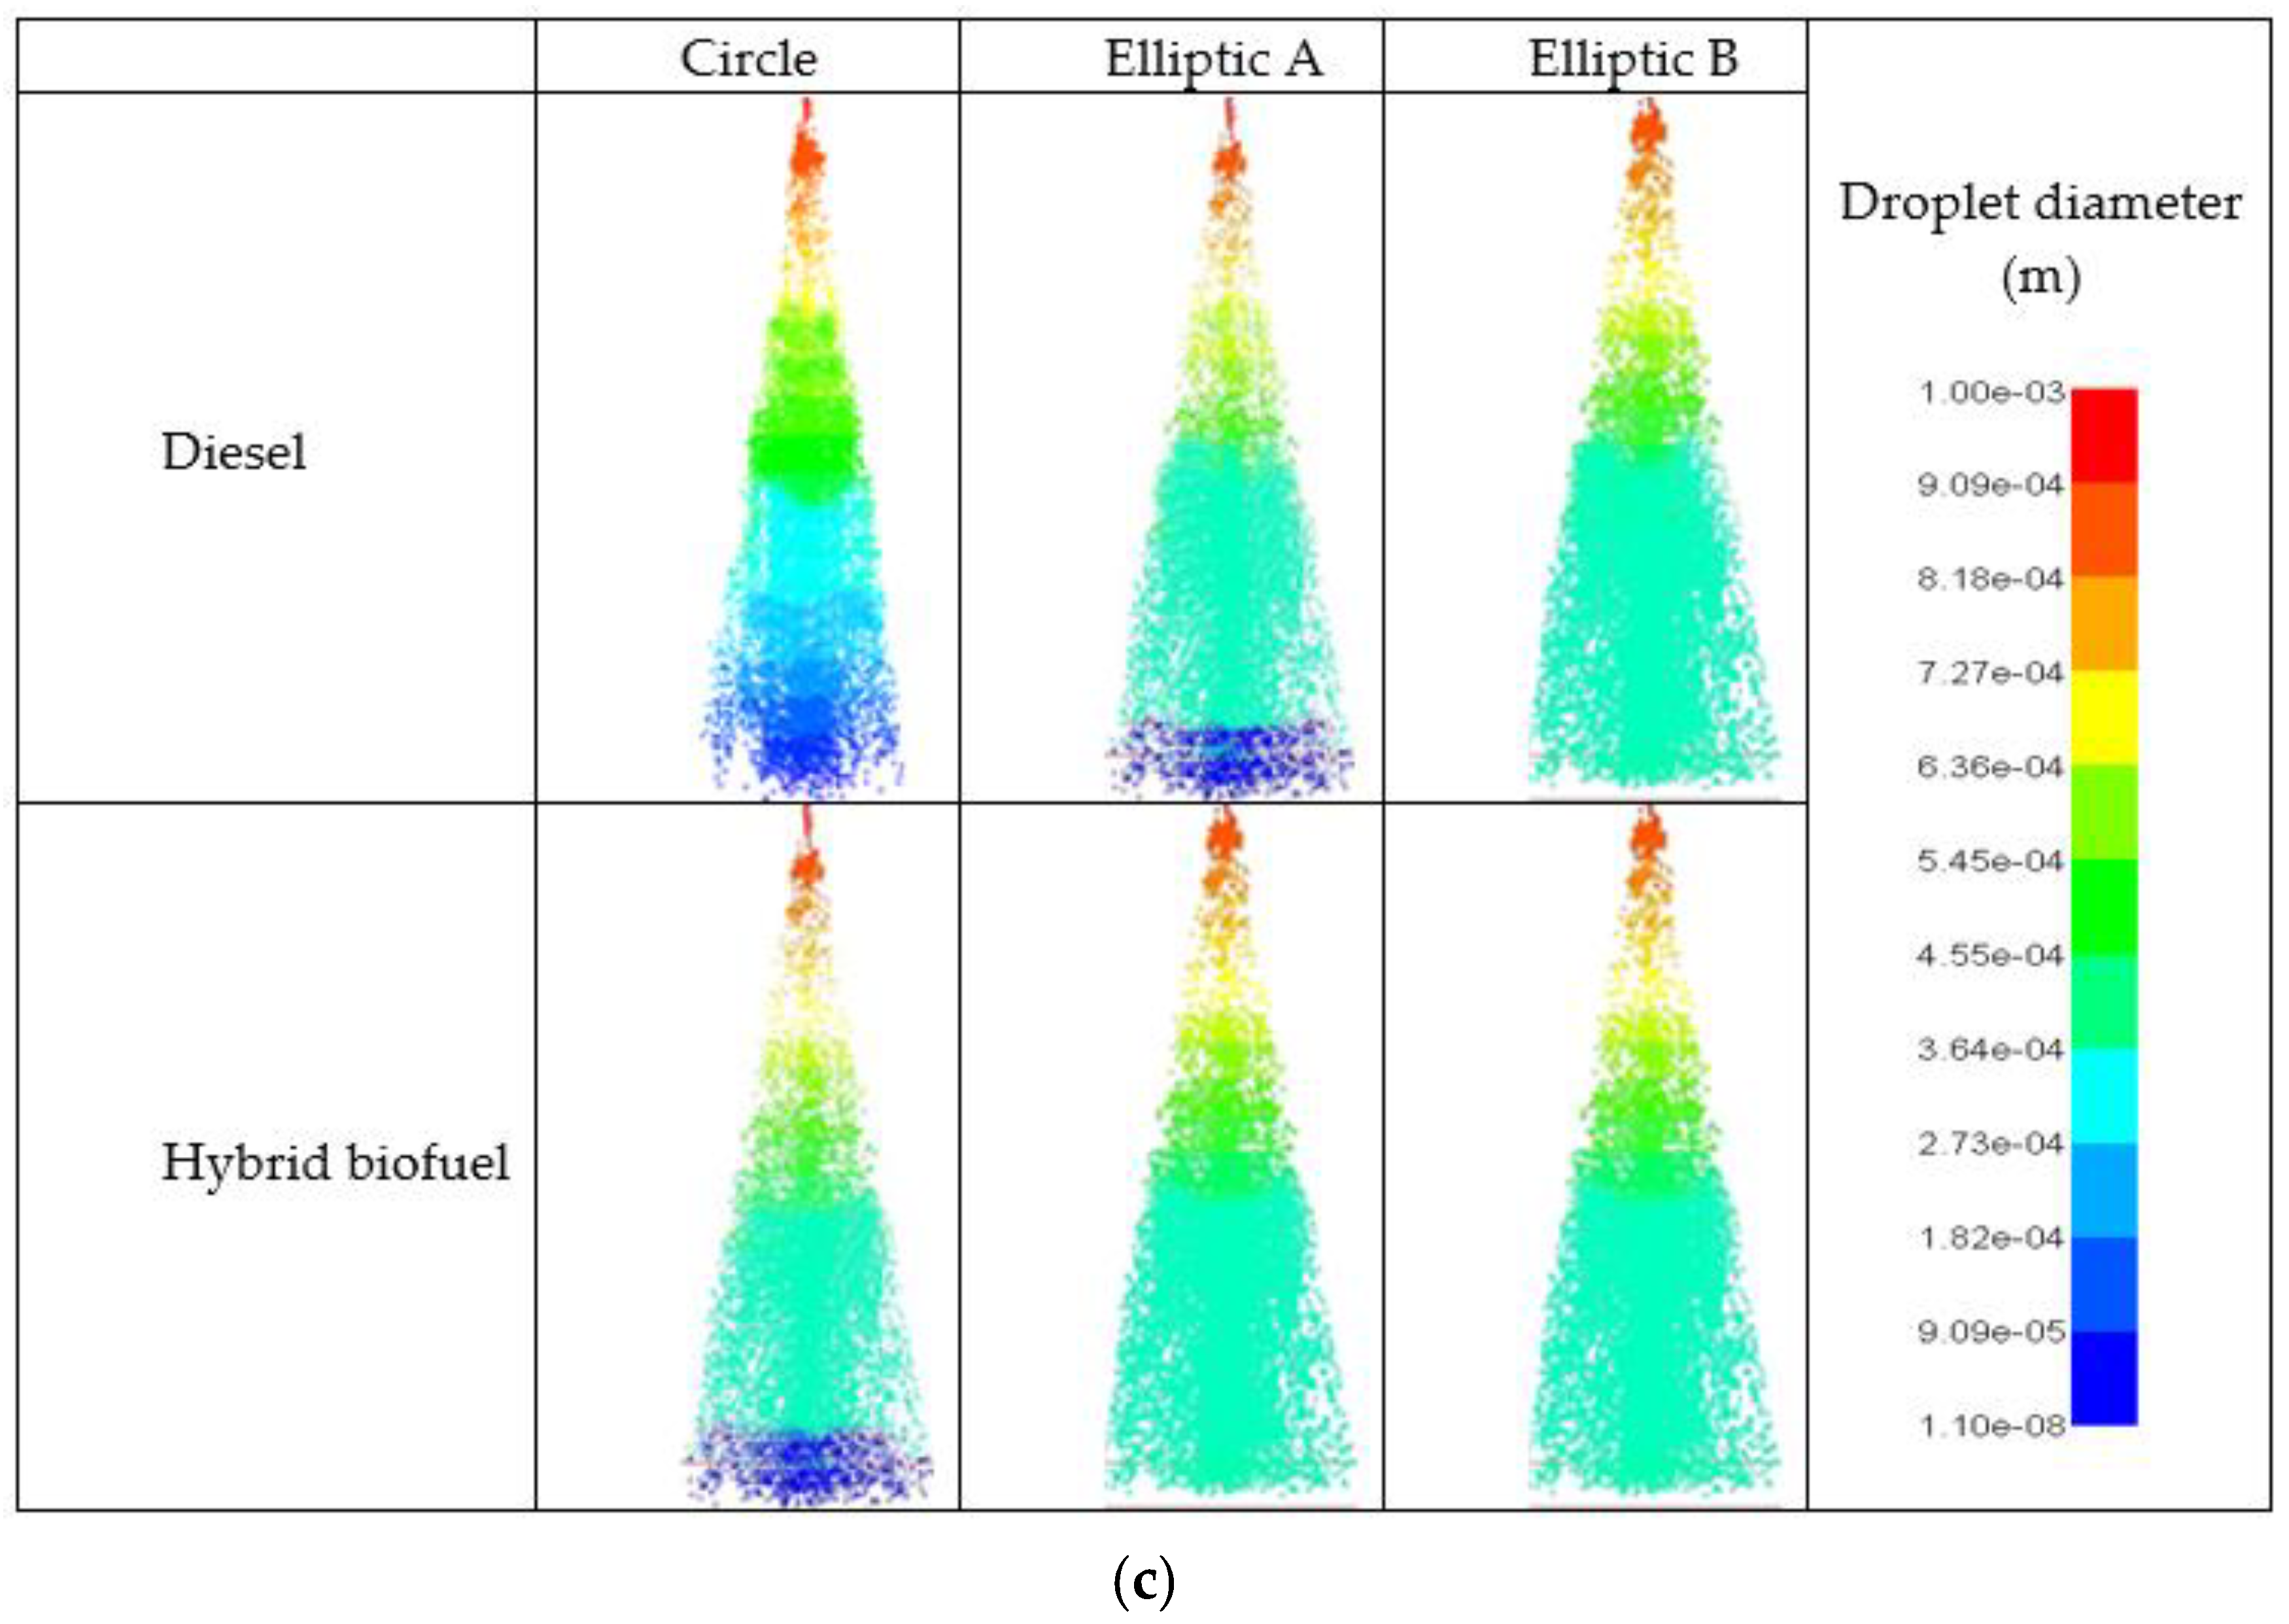
5.3. Spray Simulation Results
5.3.1. Spray Images Growth
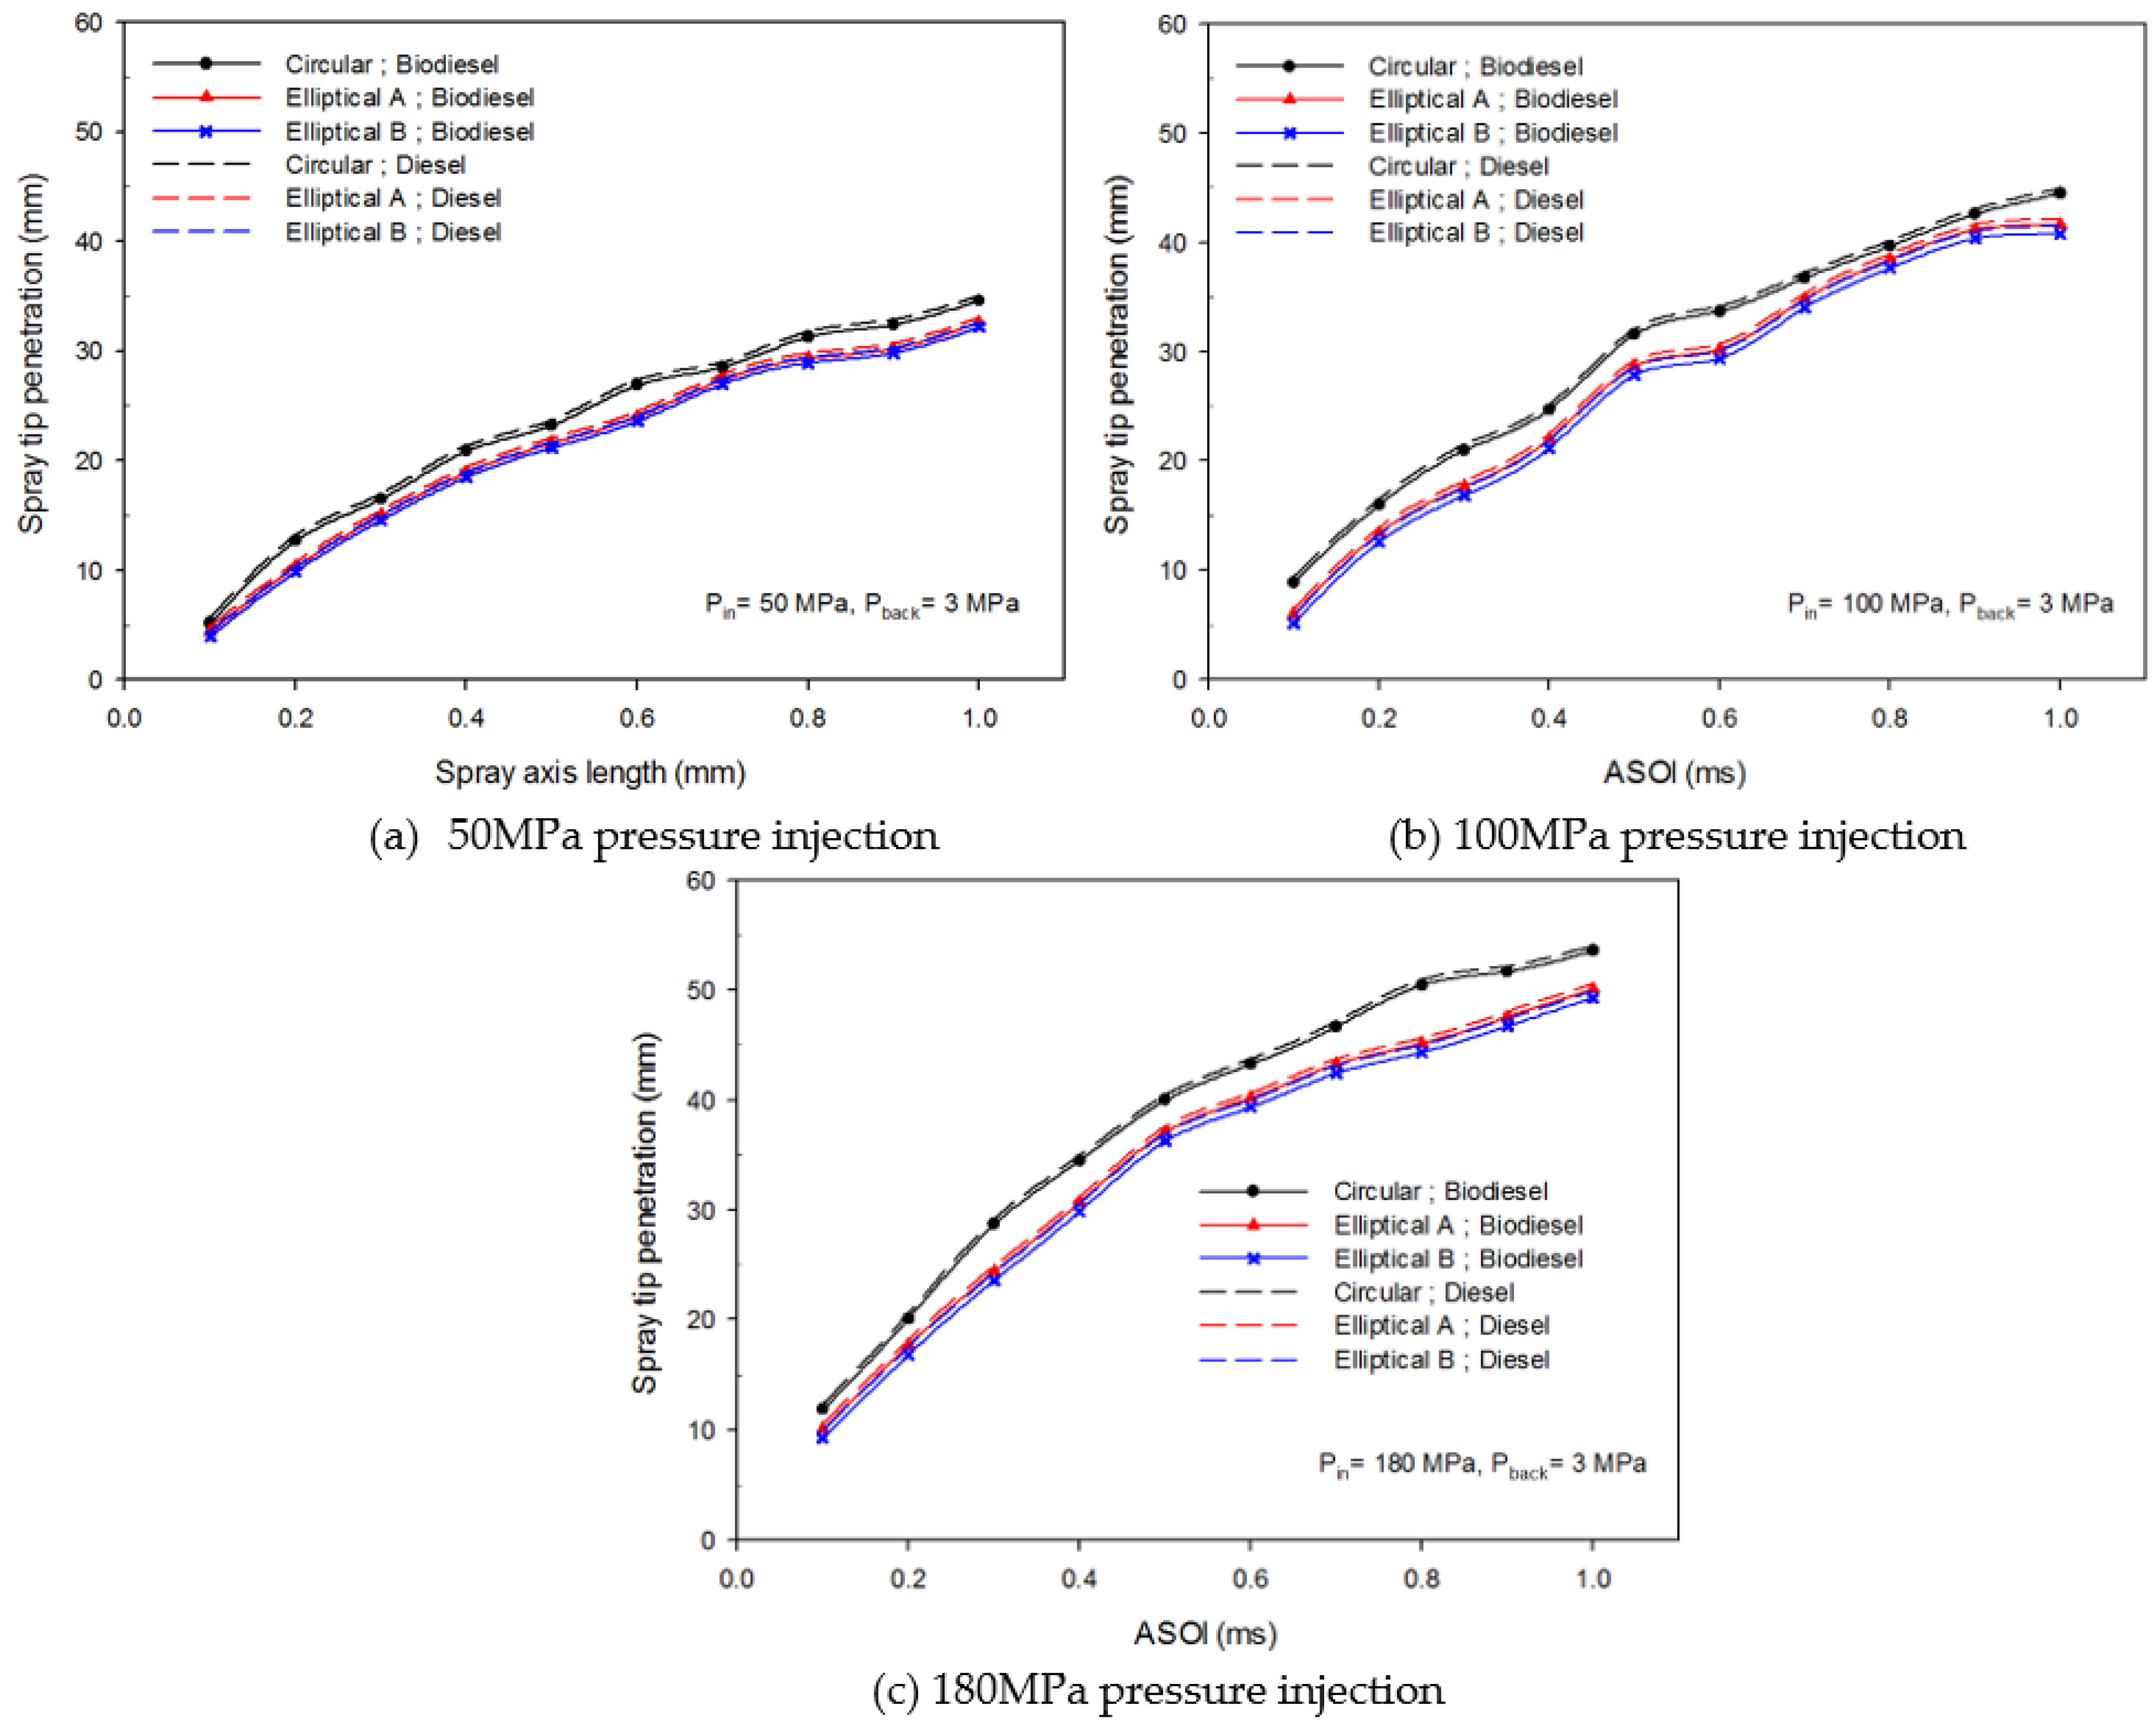
5.3.2. Spray Tip Penetration
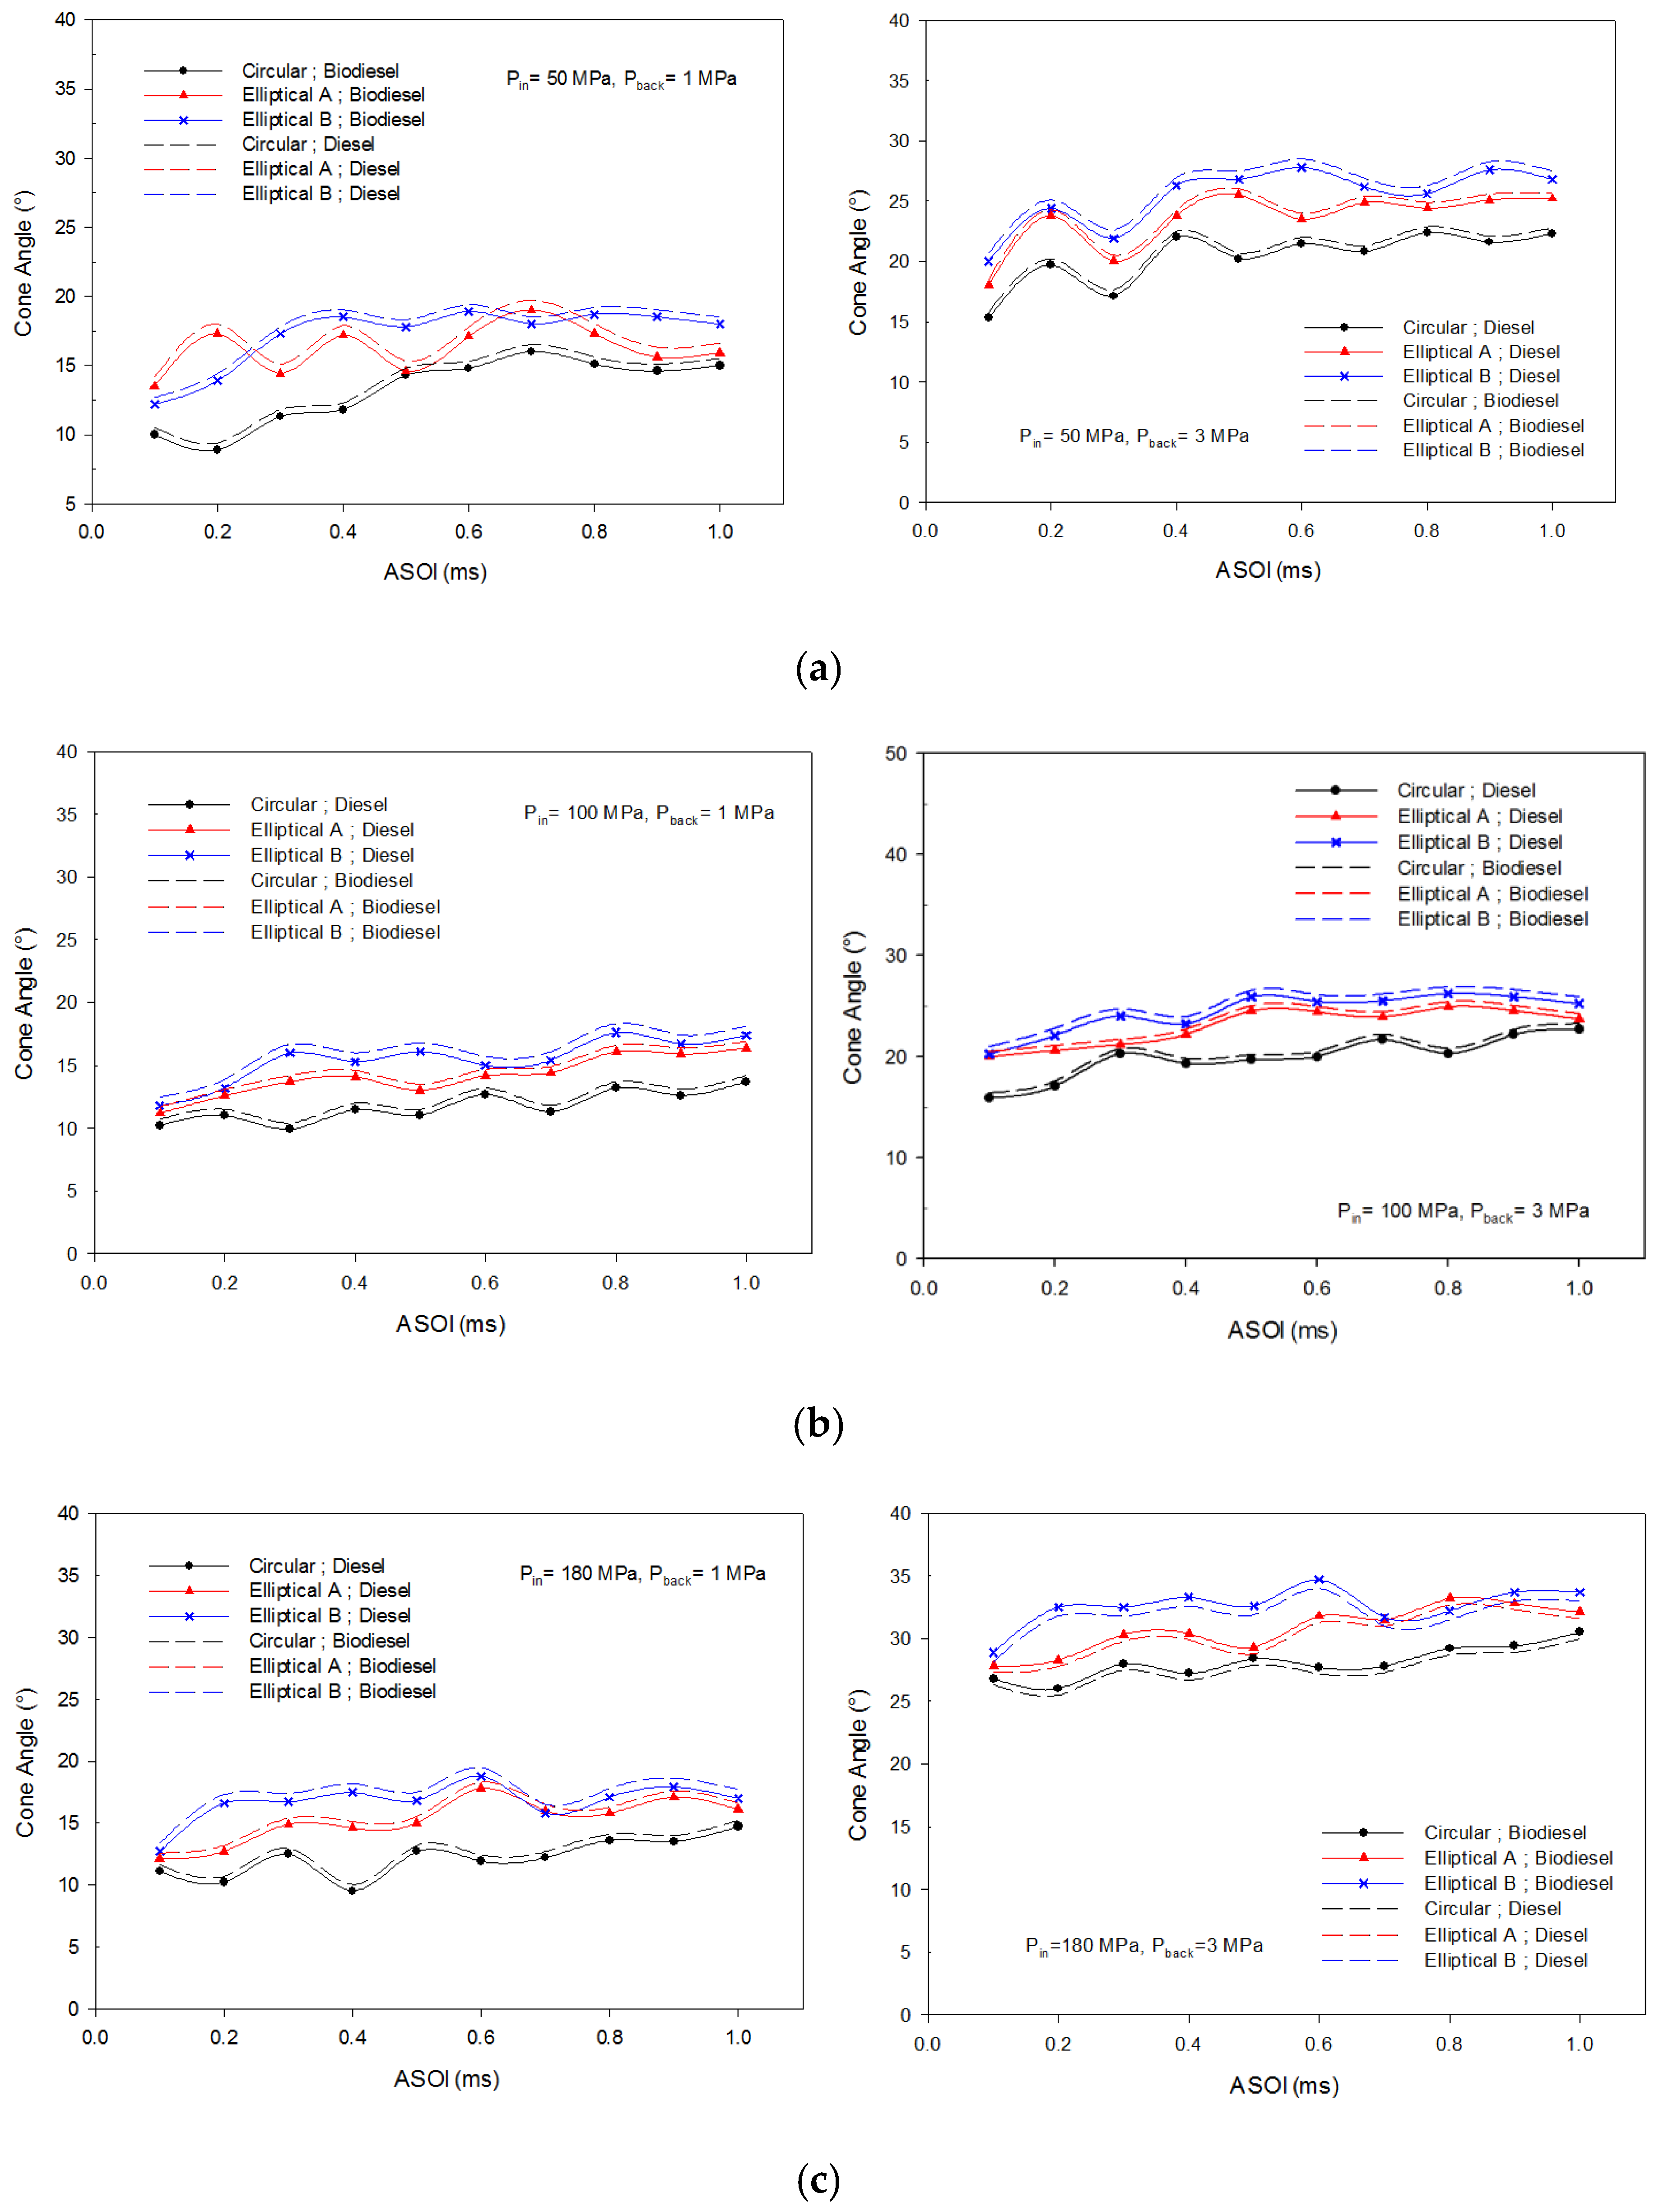
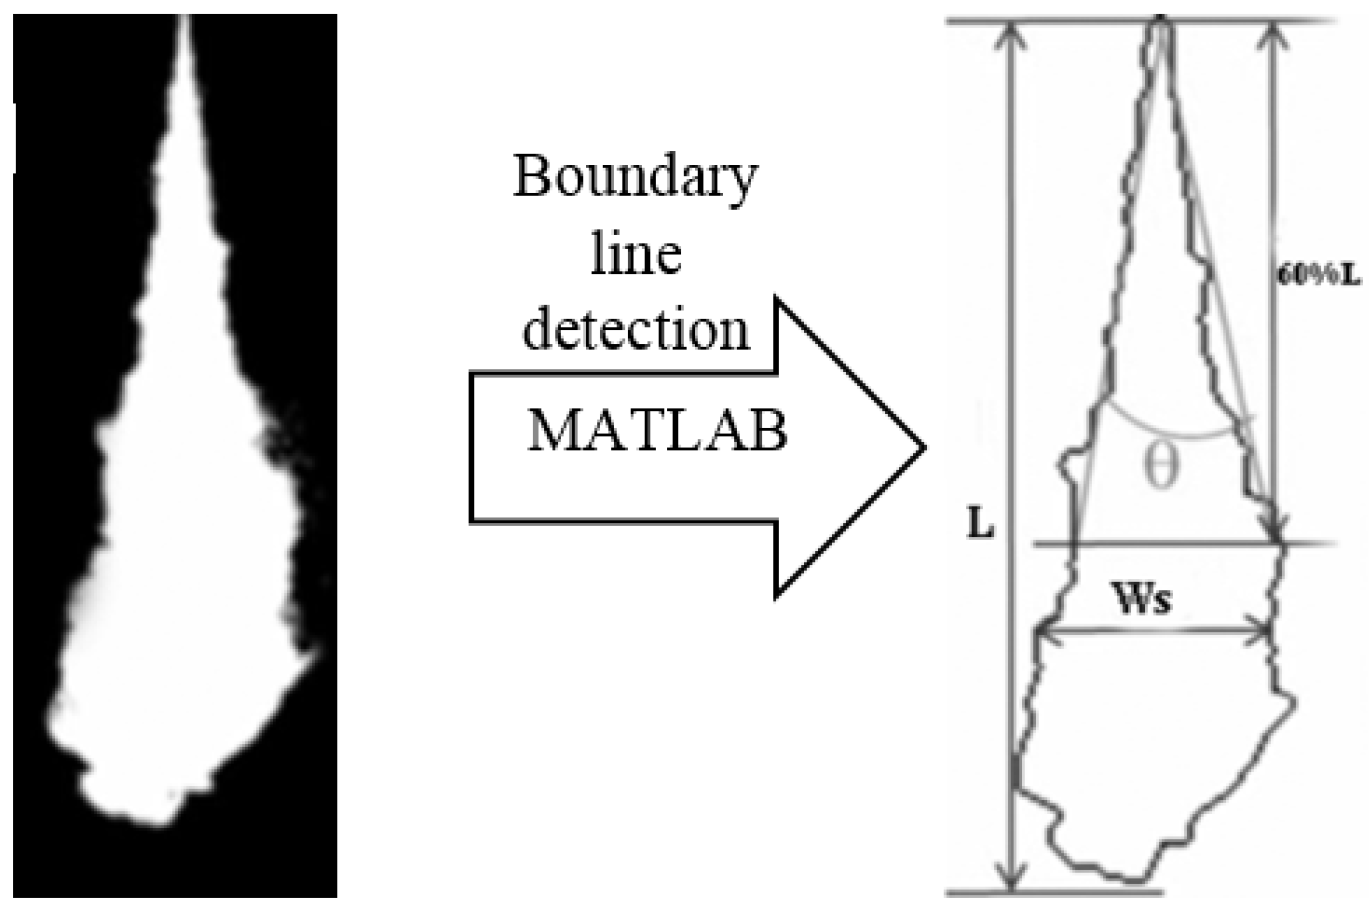
5.3.3. Spray Cone Angle
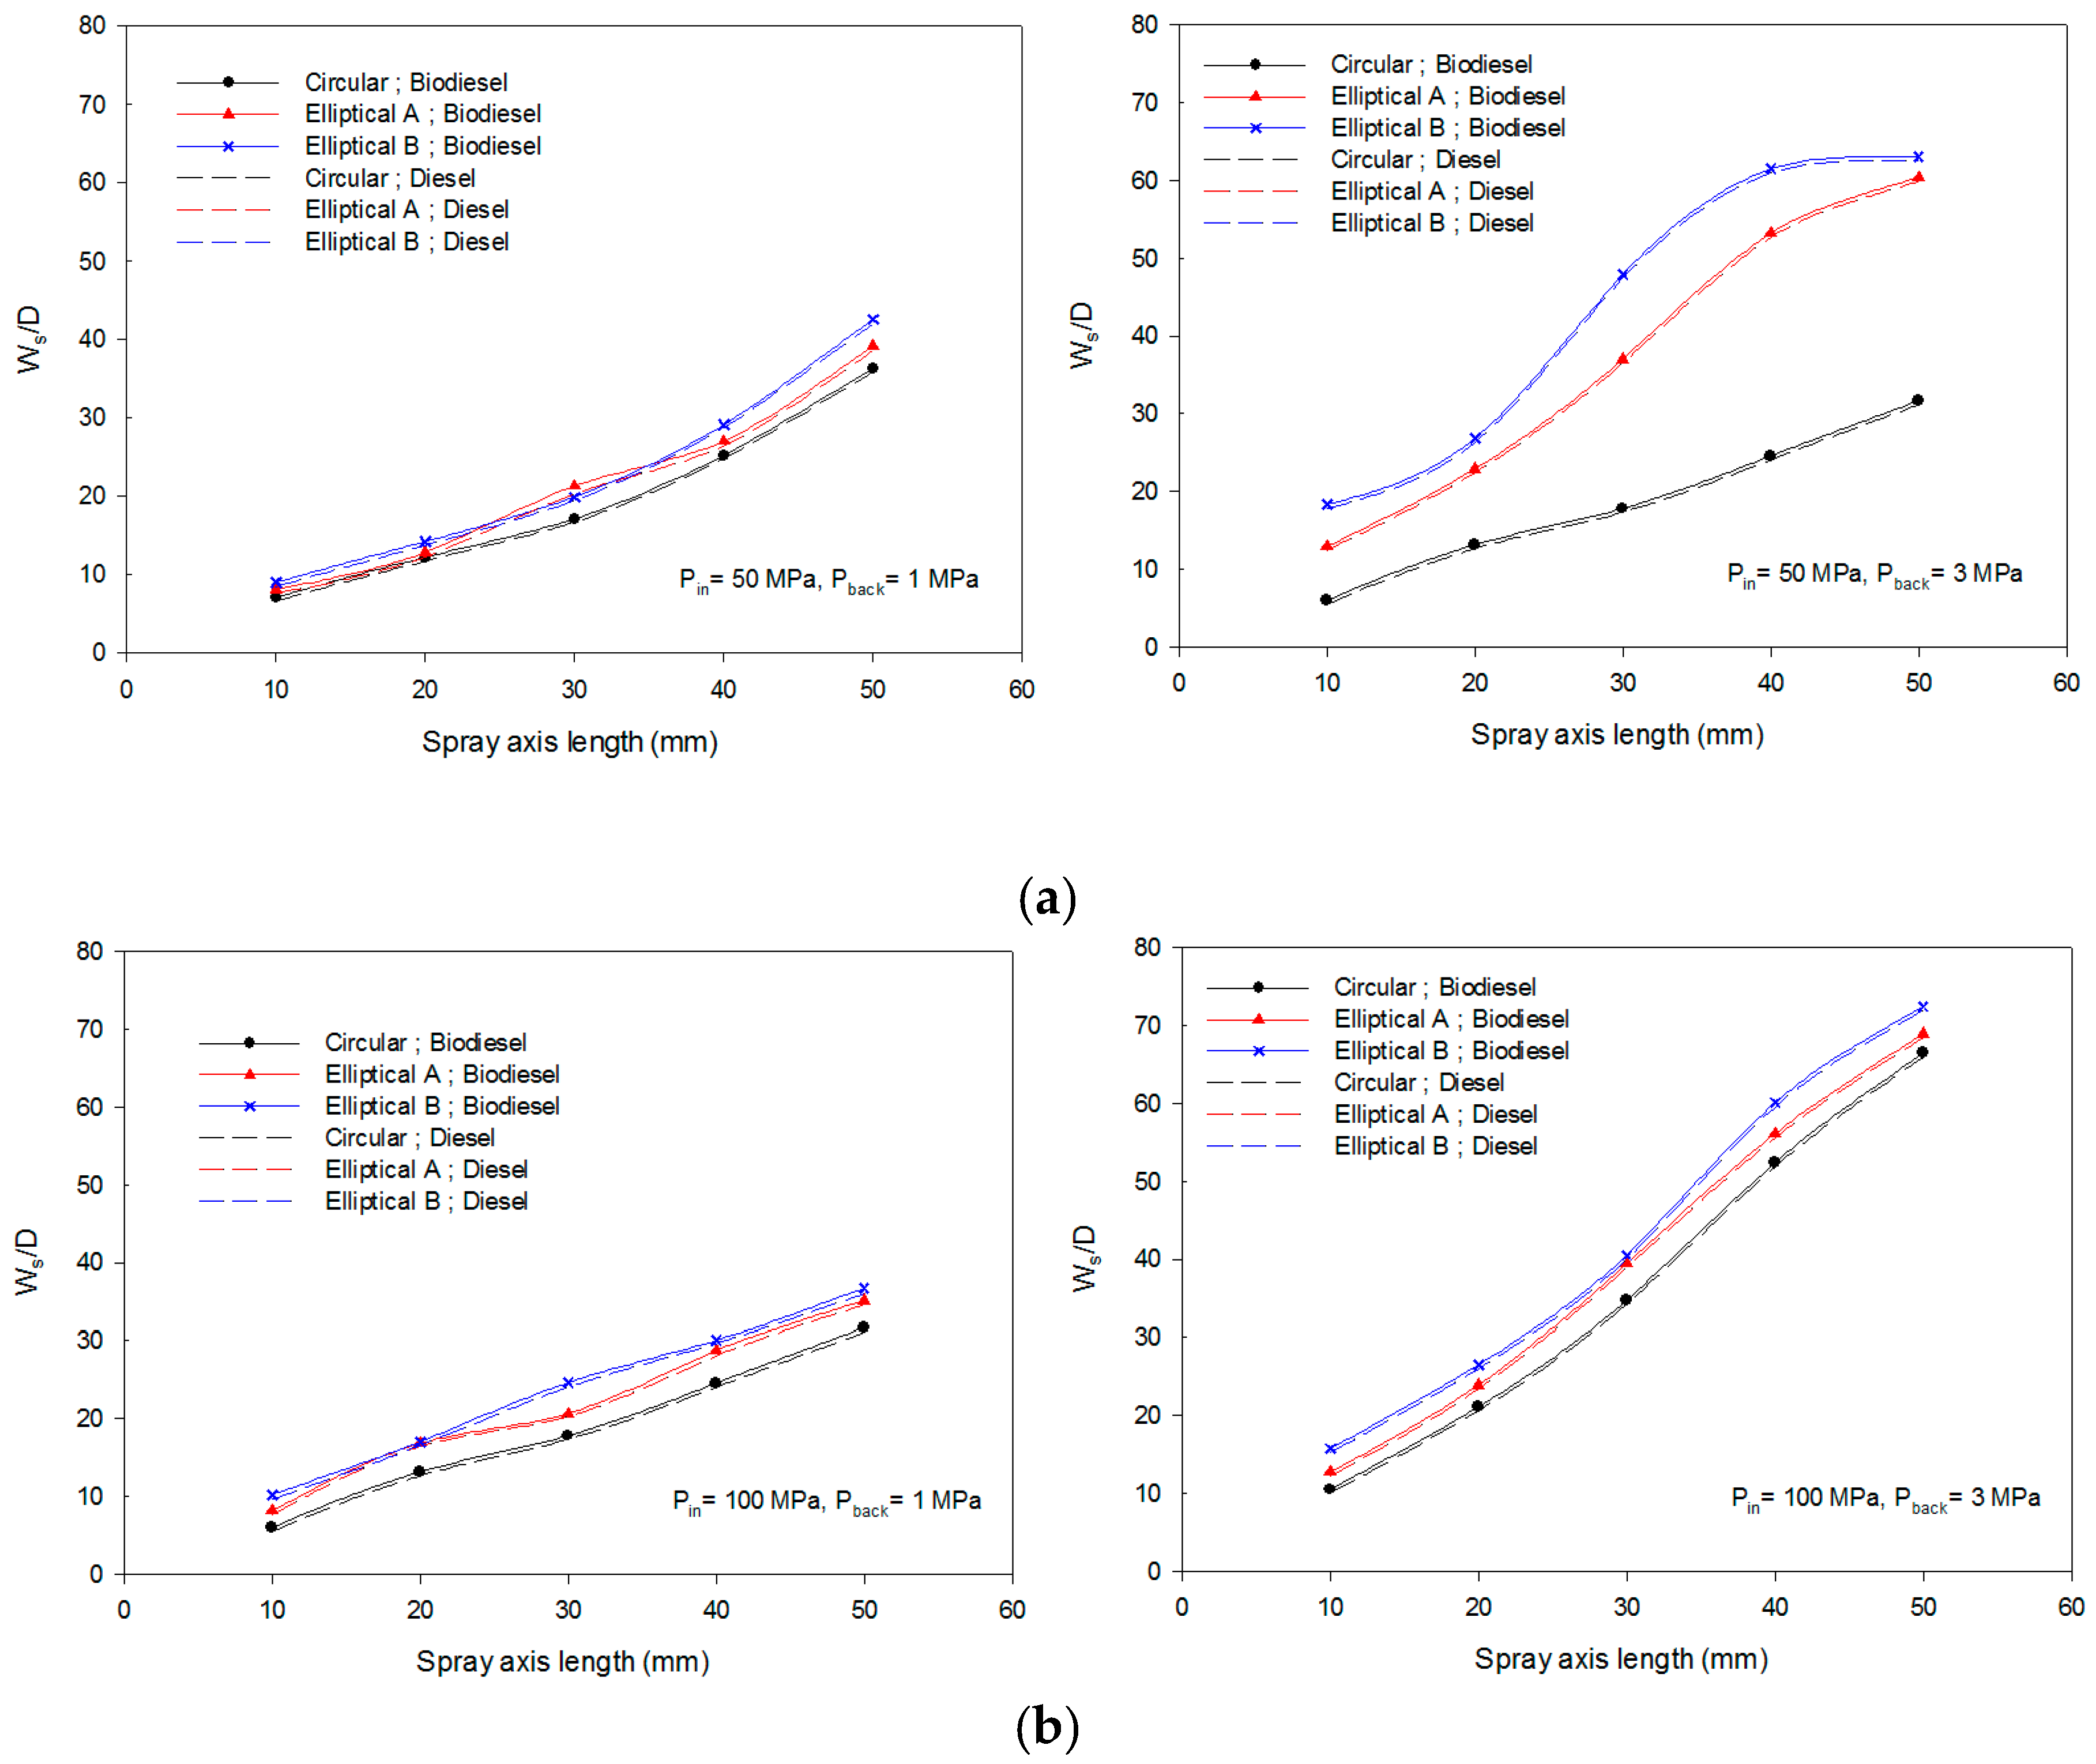
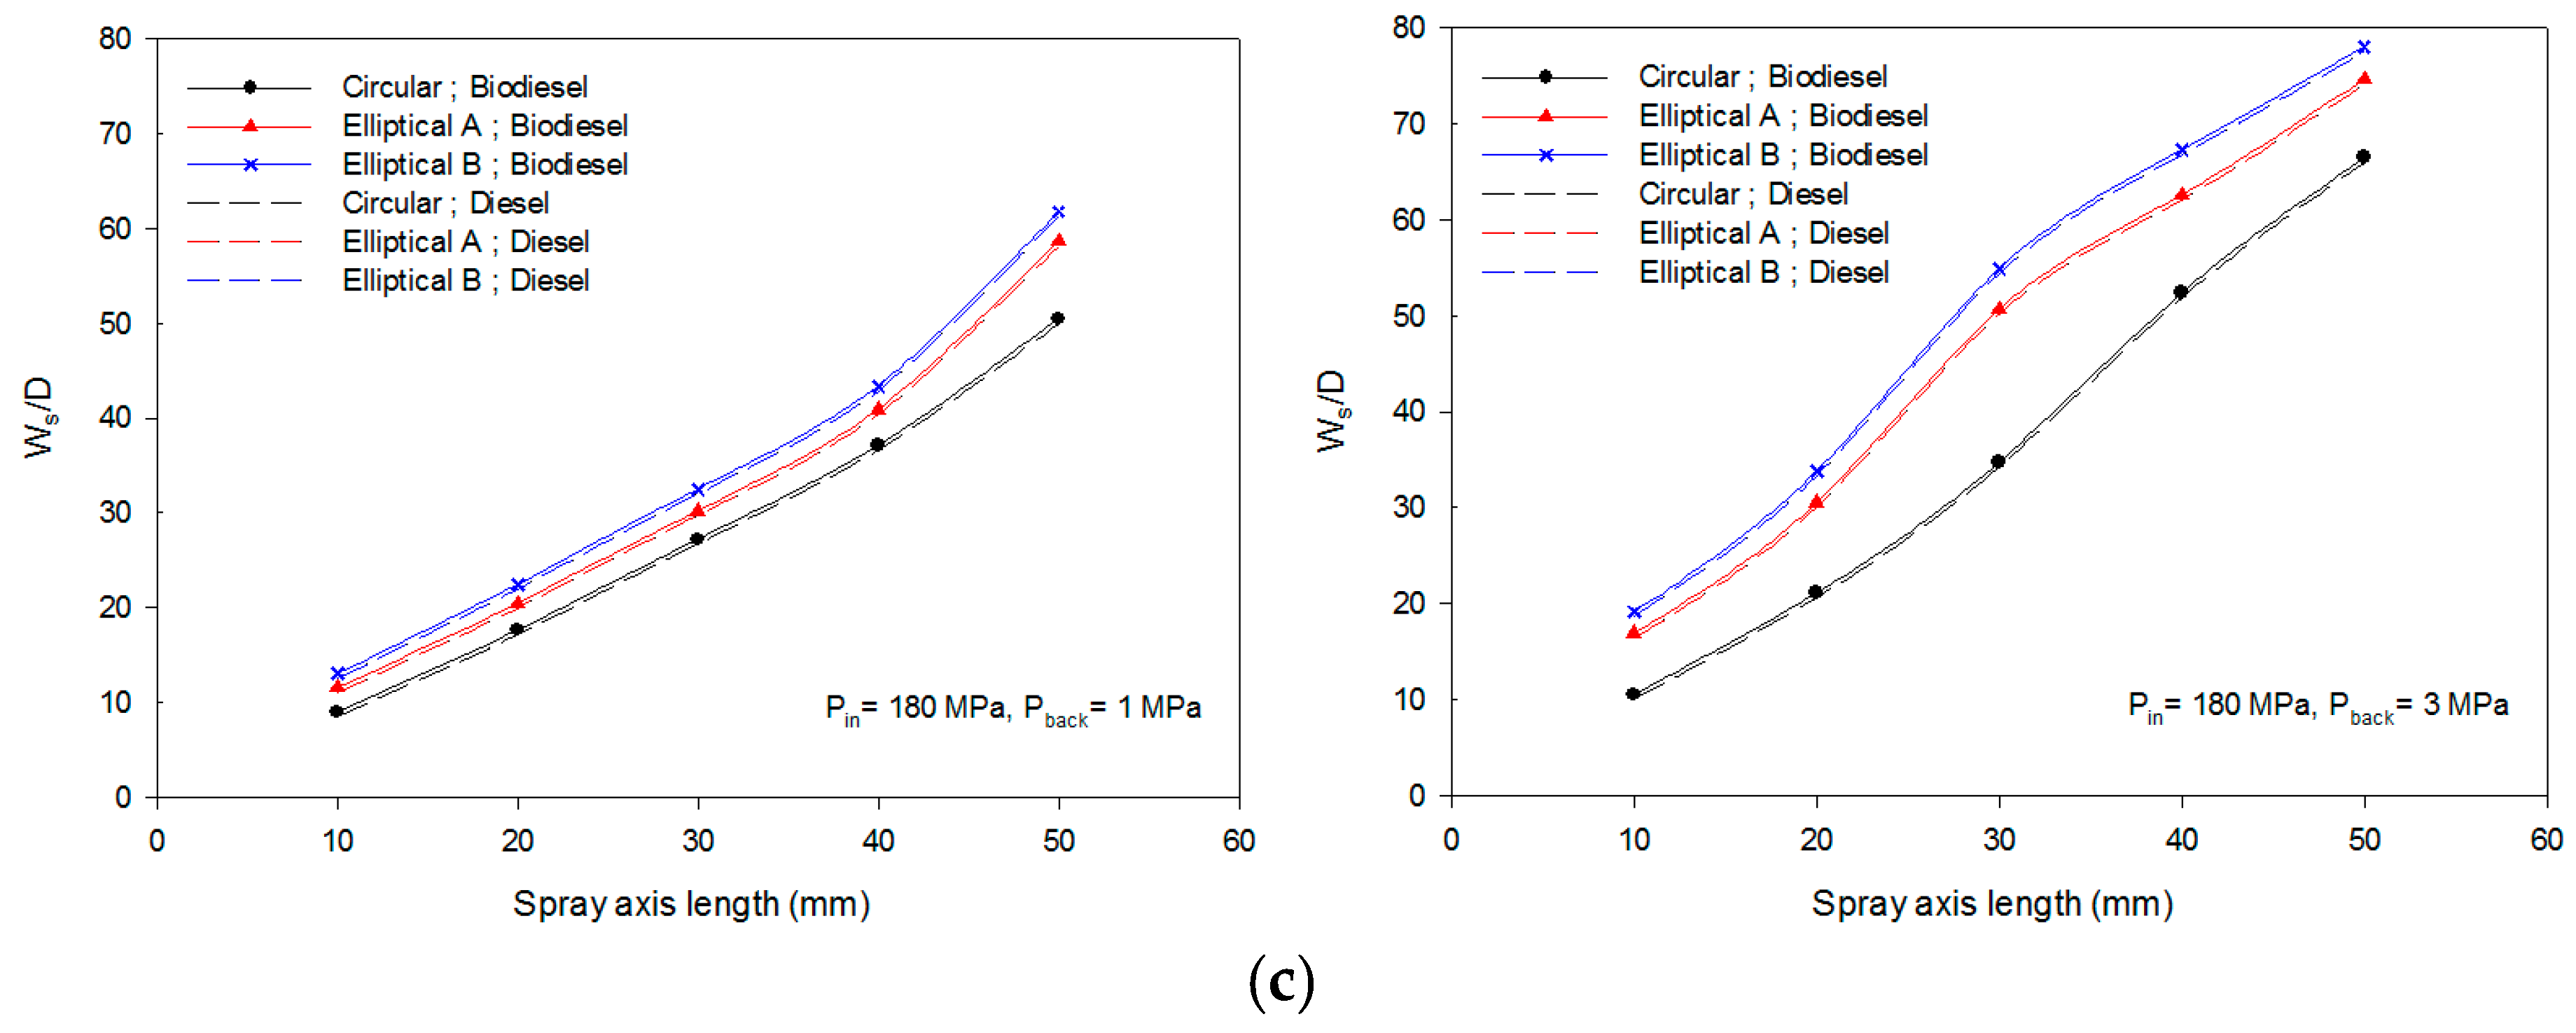
5.3.4. Spray Width
6. Conclusions
- The nozzle flow simulation results indicated that the fuel type had little effect on the cavitation area and it is dependence on the nozzle spray shape. The diesel delivered slightly a higher average velocity than hybrid biofuel under high injection pressure (180 MPa). These behaviors were generally caused by viscosity and density properties. The cavitations intensity was more intensive for elliptical A and elliptical B as compared to the circle nozzle shape for the same injection time. The aspect ratio of the elliptical nozzle shape was found to affect the cavitations flow, where the elliptical B cavitations intensity was more intensive than the elliptical A nozzle shape.
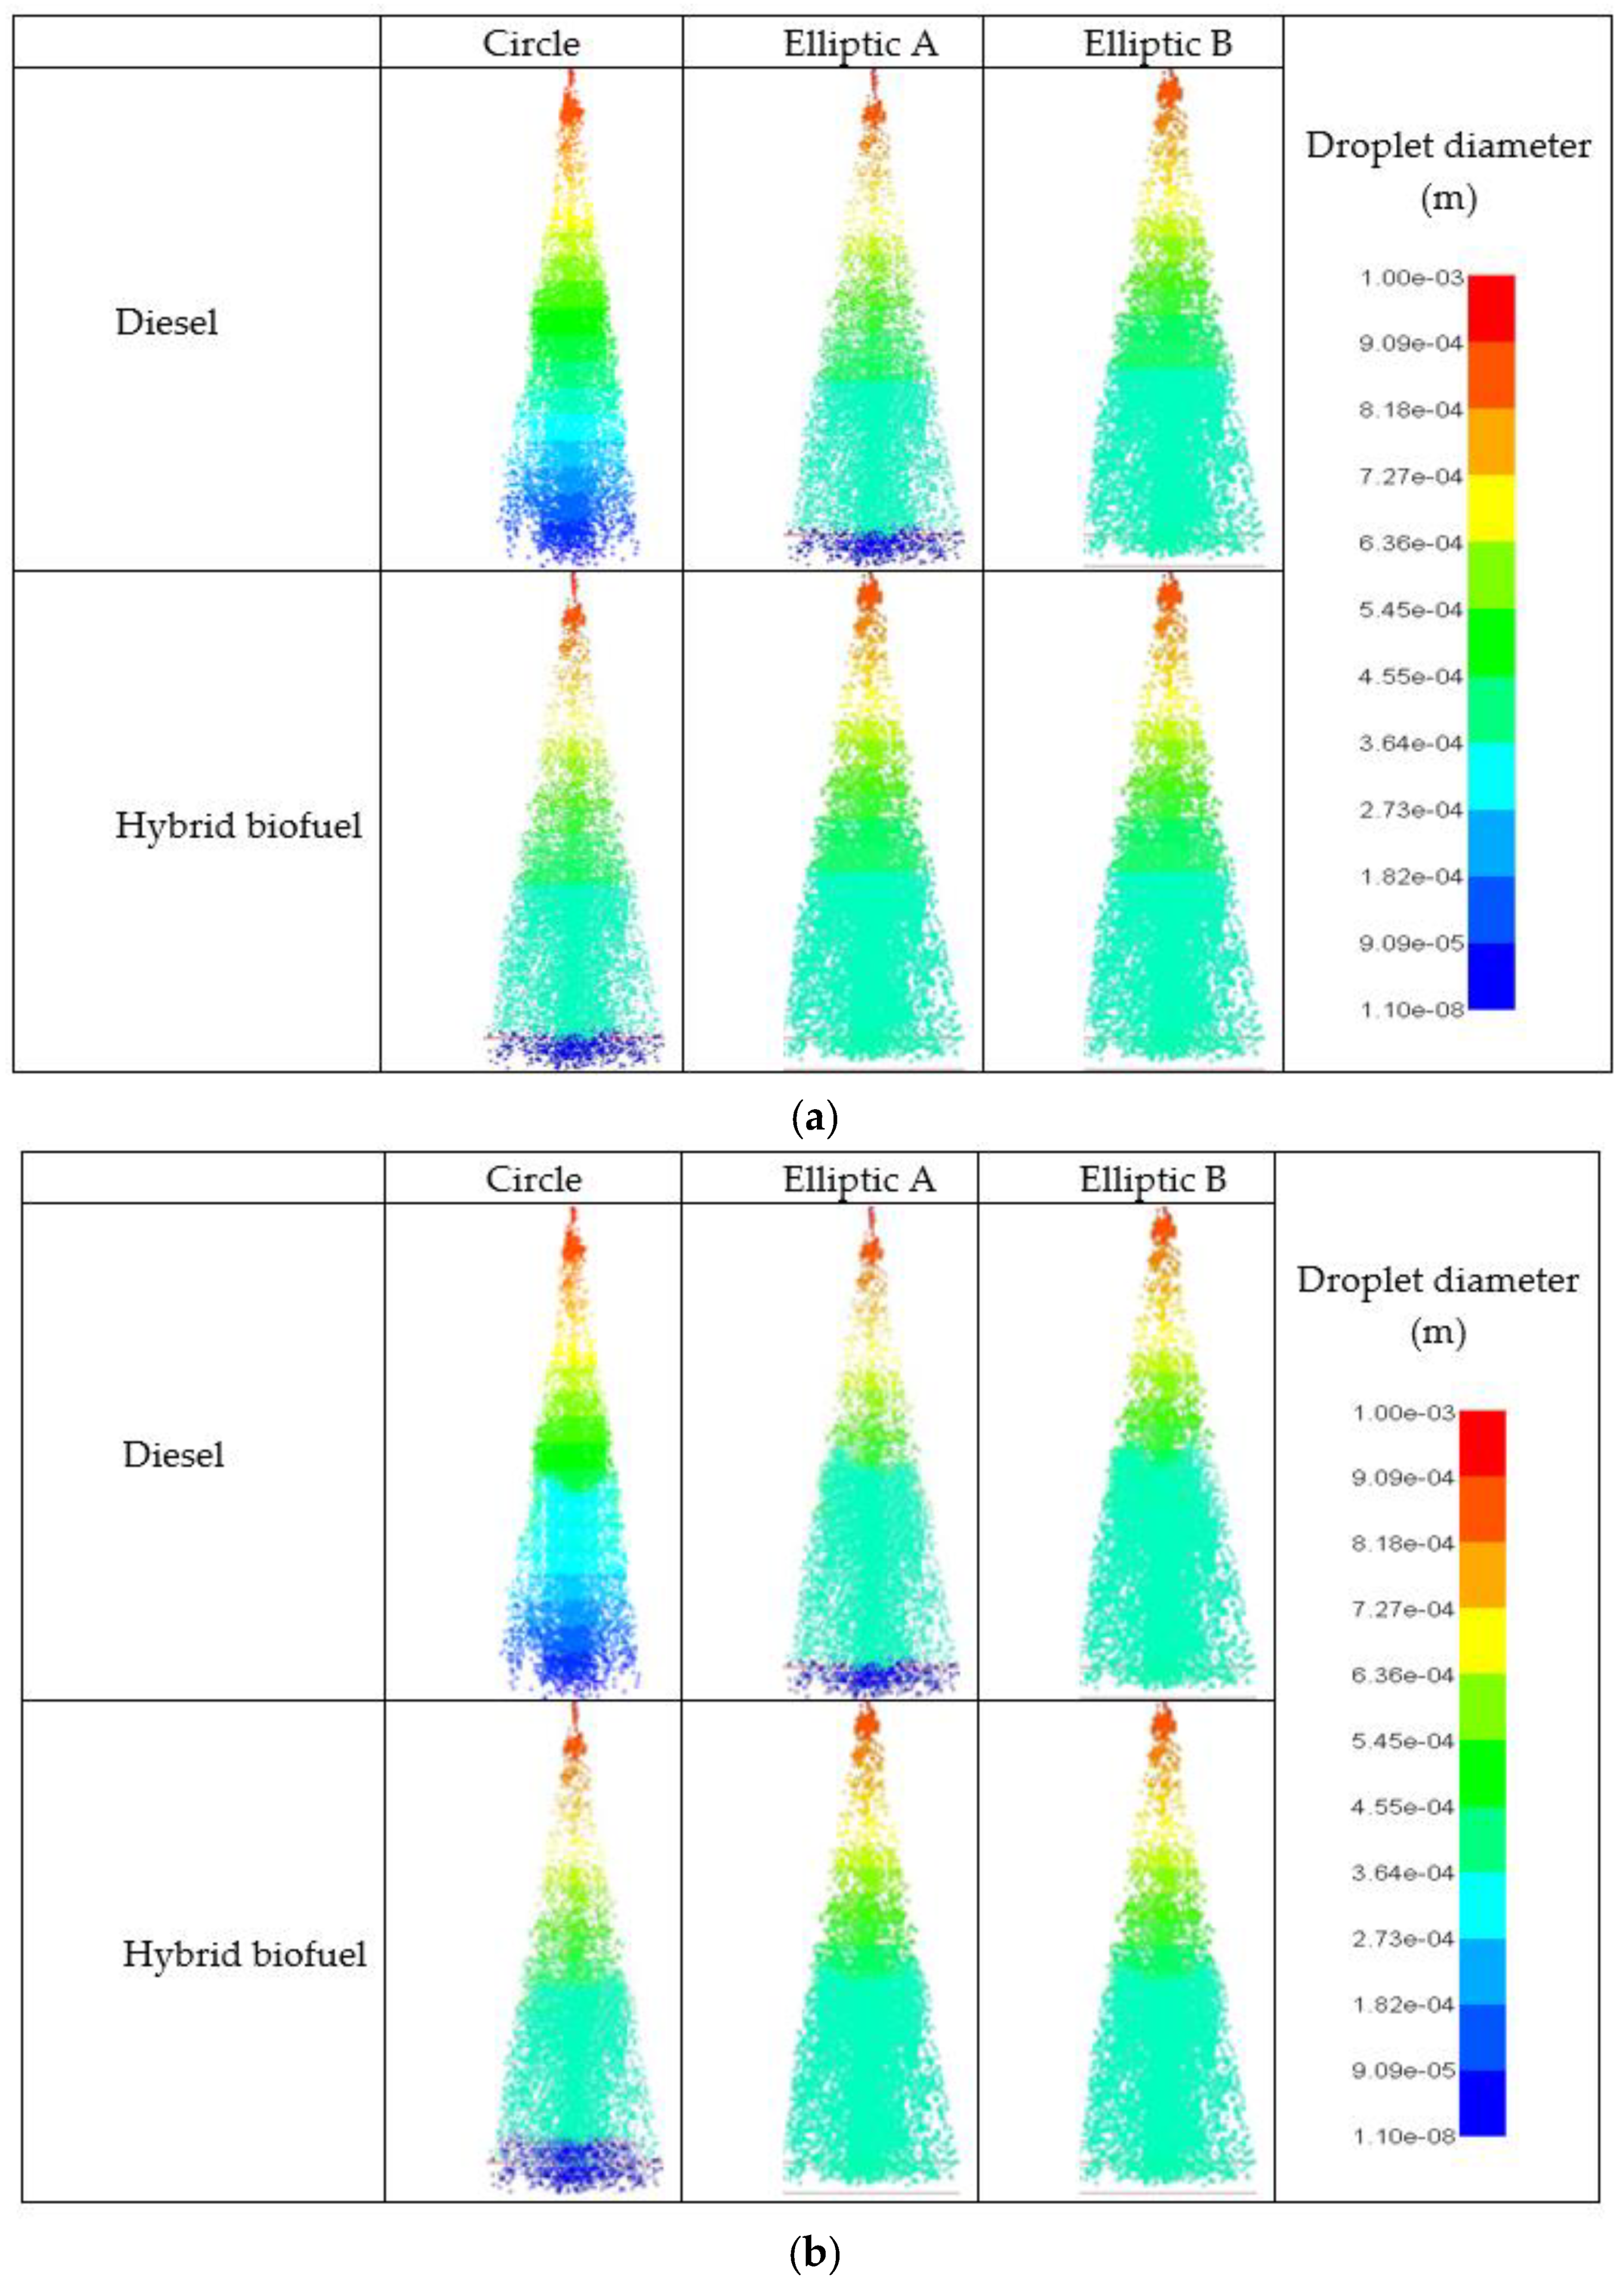
- The droplet size of the elliptical nozzle shape was smaller compared to the circular shape due to higher aerodynamic effects found in the elliptical nozzle shape that could reduce the droplets size, and thus leading to a bigger cloud formation after the secondary breakup. The evidence from this study suggests that the droplet size became smaller when the pressure was increased for both diesel and hybrid biofuel
- The spray tip penetration of the elliptical nozzle shape was smaller than the circular nozzle shape. This was due to the circular nozzle having smaller spray widths and cone angles. Further analysis showed that the type of fuel on the different nozzle shape had a small effect towards the spray tip penetration, although diesel fuel gave a slightly higher spray tip penetration compared to hybrid biofuel blends. In addition, the spray tip penetration was affected by the aspect ratio of the elliptical nozzle shape.
- The elliptical nozzle shape was larger compared to the circular nozzle shape in terms of spray cone angles. The spray cone angle for elliptical B was found to be much higher than that of elliptical A. This indicated that the aspect ratio of the elliptical nozzle shape was found to affect the spray cone angles. Moreover, the type of fuel on the different nozzle shape had a minor influence to the spray cone angles. The results show that diesel produced smaller cone angles compared to the biofuel blend.
- The spray widths of the circular nozzle shape were smaller than those of the elliptical A and elliptical B under all injection pressures and backpressures. However, the fuel type had little effect on the spray widths for all the nozzle shape. Furthermore, the aspect ratio of the elliptical nozzle shape was found to affect the spray width.
Author Contributions
Funding
Acknowledgments
Conflicts of Interest
References
- Shervani-Tabar, M.T.; Sheykhvazayefi, M.; Ghorbani, M. Numerical study on the effect of the injection pressure on spray penetration length. Appl. Math. Model. 2013, 37, 7778–7788. [Google Scholar] [CrossRef]
- Sidibé, S.S.; Blin, J.; Vaitilingom, G.; Azoumah, Y. Use of crude filtered vegetable oil as a fuel in diesel engines state of the art: Literature review. Renew. Sustain. Energy Rev. 2010, 14, 2748–2759. [Google Scholar] [CrossRef]
- Qian, D.; Liao, R. A Nonisothermal Fluid-Structure Interaction Analysis on the Piston/Cylinder Interface Leakage of High-Pressure Fuel Pump. J. Tribol. 2014, 136, 21704–21708. [Google Scholar] [CrossRef]
- Hussain, F.; Husain, H.S. Elliptic jets. Part 1. Characteristics of unexcited and excited jets. J. Fluid Mech. 1989, 208, 257–320. [Google Scholar] [CrossRef]
- Ge, C.J.; Yoon, K.S.; Choi, J.N. Using Canola Oil Biodiesel as an Alternative Fuel in Diesel Engines: A Review. Appl. Sci. 2017, 7, 881. [Google Scholar] [CrossRef]
- Suresh, M.; Jawahar, C.P.; Richard, A. A review on biodiesel production, combustion, performance, and emission characteristics of non-edible oils in variable compression ratio diesel engine using biodiesel and its blends. Renew. Sustain. Energy Rev. 2018, 92, 38–49. [Google Scholar] [CrossRef]
- Shi, S.; Valle-Rodríguez, J.O.; Siewers, V.; Nielsen, J. Prospects for microbial biodiesel production. Biotechnol. J. 2011, 6, 277–285. [Google Scholar] [CrossRef] [PubMed] [Green Version]
- Rahman, Z.; Nawab, J.; Sung, H.B.; Kim, C.S. A Critical Analysis of Bio-Hydrocarbon Production in Bacteria: Current Challenges and Future Directions. Energies 2018, 11, 2663. [Google Scholar] [CrossRef]
- Yellapu, S.K.; Bharti; Kaur, R.; Kumar, L.R.; Tiwari, B.; Zhang, X.; Tyagi, R.D. Recent developments of downstream processing for microbial lipids and conversion to biodiesel. Bioresour. Technol. 2018, 256, 515–528. [Google Scholar] [CrossRef] [PubMed]
- Zhang, M.; Wu, H. Effect of major impurities in crude glycerol on solubility and properties of glycerol/methanol/bio-oil blends. Fuel 2015, 159, 118–127. [Google Scholar] [CrossRef]
- Meher, L.C.; Vidya Sagar, D.; Naik, S.N. Technical aspects of biodiesel production by transesterification—A review. Renew. Sustain. Energy Rev. 2006, 10, 248–268. [Google Scholar] [CrossRef]
- Rakopoulos, C.D.; Antonopoulos, K.A.; Rakopoulos, D.C.; Hountalas, D.T.; Giakoumis, E.G. Comparative performance and emissions study of a direct injection Diesel engine using blends of Diesel fuel with vegetable oils or bio-diesels of various origins. Energy Convers. Manag. 2006, 47, 3272–3287. [Google Scholar] [CrossRef]
- Channapattana, S.V.; Kantharaj, C.; Shinde, V.S.; Pawar, A.A.; Kamble, P.G. Emissions and Performance Evaluation of DI CI—VCR Engine Fuelled with Honne oil Methyl Ester/Diesel Blends. Energy Procedia 2015, 74, 281–288. [Google Scholar] [CrossRef]
- Desantes, J.M.; Payri, R.; Salvador, F.J.; Manin, J. Influence on Diesel Injection Characteristics and Behavior Using Biodiesel Fuels; SAE International: Warrendale, PA, USA, 2009. [Google Scholar]
- Priesching, P.; Pavlovic, Z.; Ertl, P.; Del Giacomo, N.; Beatrice, C.; Mancaruso, E.; Vaglieco, B.M. Numerical and Experimental Investigation of the Influence of Bio-Diesel Blends on the Mixture Formation, Combustion and Emission Behavior of a Modern HSDI Diesel Engine; SAE International: Warrendale, PA, USA, 2009. [Google Scholar]
- Allocca, L.; Mancaruso, E.; Montanaro, A.; Vaglieco, B.M.; Vassallo, A. Renewable Biodiesel/Reference Diesel Fuel Mixtures Distribution in Non-Evaporating and Evaporating Conditions for Diesel Engines; SAE International: Warrendale, PA, USA, 2009. [Google Scholar]
- Sem, T.R. Investigation of Injector Tip Deposits on Transport Refrigeration Units Running on Biodiesel Fuel; SAE International: Warrendale, PA, USA, 2004. [Google Scholar]
- Ramadhas, A.S.; Jayaraj, S.; Muraleedharan, C. Characterization and effect of using rubber seed oil as fuel in the compression ignition engines. Renew. Energy 2005, 30, 795–803. [Google Scholar] [CrossRef]
- Mohan, B.; Yang, W.; Yu, W.; Tay, K.L.; Chou, S.K. Numerical Simulation on Spray Characteristics of Ether Fuels. Energy Procedia 2015, 75, 919–924. [Google Scholar] [CrossRef] [Green Version]
- Lee, Y.; Huh, K.Y. Numerical study on spray and combustion characteristics of diesel and soy-based biodiesel in a CI engine. Fuel 2013, 113, 537–545. [Google Scholar] [CrossRef]
- Som, S.; Ramirez, A.I.; Longman, D.E.; Aggarwal, S.K. Effect of nozzle orifice geometry on spray, combustion, and emission characteristics under diesel engine conditions. Fuel 2011, 90, 1267–1276. [Google Scholar] [CrossRef]
- Mohan, B.; Yang, W.; Yu, W.; Tay, K.L. Numerical analysis of spray characteristics of dimethyl ether and diethyl ether fuel. Appl. Energy 2017, 185, 1403–1410. [Google Scholar] [CrossRef]
- Zhou, Z.-F.; Lu, G.-Y.; Chen, B. Numerical study on the spray and thermal characteristics of R404A flashing spray using OpenFOAM. Int. J. Heat Mass Transf. 2018, 117, 1312–1321. [Google Scholar] [CrossRef]
- Kegl, B.; Lešnik, L. Modeling of macroscopic mineral diesel and biodiesel spray characteristics. Fuel 2018, 222, 810–820. [Google Scholar] [CrossRef]
- Pairan, M.R.; Asmuin, N.; Isa, N.M.; Sies, F. Characteristic study of flat spray nozzle by using particle image velocimetry (PIV) and ANSYS simulation method. AIP Conf. Proc. 2017, 1831, 20009. [Google Scholar] [CrossRef]
- Kuleshov, A.S. Use of Multi-Zone DI Diesel Spray Combustion Model for Simulation and Optimization of Performance and Emissions of Engines with Multiple Injection; SAE Technical Paper; SAE International: Warrendale, PA, USA, 2006; Volume 1385. [Google Scholar]
- Battistoni, M.; Grimaldi, C.N. Numerical analysis of injector flow and spray characteristics from diesel injectors using fossil and biodiesel fuels. Appl. Energy 2012, 97, 656–666. [Google Scholar] [CrossRef]
- Lin, S.; Ding, L.; Zhou, Z.; Yu, G. Discrete model for simulation of char particle gasification with structure evolution. Fuel 2016, 186, 656–664. [Google Scholar] [CrossRef]
- Rashidi, S.; Bovand, M.; Abolfazli Esfahani, J.; Ahmadi, G. Discrete particle model for convective AL2O3–water nanofluid around a triangular obstacle. Appl. Therm. Eng. 2016, 100, 39–54. [Google Scholar] [CrossRef]
- Thiruvengadam, M.; Zheng, Y.; Tien, J.C. DPM simulation in an underground entry: Comparison between particle and species models. Int. J. Min. Sci. Technol. 2016, 26, 487–494. [Google Scholar] [CrossRef]
- Di Sarli, V.; Russo, P.; Sanchirico, R.; Di Benedetto, A. CFD simulations of the effect of dust diameter on the dispersion in the 20L bomb. Chem. Eng. Trans. 2013, 31, 727–732. [Google Scholar]
- Song, X.; Park, Y.C. Numerical Analysis of Butterfly Valve-Prediction of Flow Coefficient and Hydrodynamic Torque Coefficient. In Proceedings of the World Congress on Engineering and Computer Science, San Francisco, CA, USA, 24–26 October 2007; pp. 2–6, ISBN 978-988-98671-6-4. [Google Scholar]
- Talbot, L.; Cheng, R.K.; Schefer, R.W.; Willis, D.R. Thermophoresis of particles in a heated boundary layer. J. Fluid Mech. 1980, 101, 737–758. [Google Scholar] [CrossRef]
- Turner, M.R.; Sazhin, S.S.; Healey, J.J.; Crua, C.; Martynov, S.B. A breakup model for transient Diesel fuel sprays. Fuel 2012, 97, 288–305. [Google Scholar] [CrossRef] [Green Version]
- Reitz, R.D.; Beale, J.C. Modeling Spray Atomization with The Kelvin-Helmholtzrayleigh-Taylor Hybrid Model. At. Sprays 1996, 9, 623–650. [Google Scholar] [CrossRef]
- Reitz, R. Modeling atomization processes in high-pressure vaporizing sprays. At. Spray Technol. 1987, 3, 309–337. [Google Scholar]
- Taylor, G.I. The shape and acceleration of a drop in a high speed air stream. Sci. Pap. G I Taylor 1963, 3, 457–464. [Google Scholar]
- O’Rourke, P.J.; Amsden, A.A. The Tab Method for Numerical Calculation of Spray Droplet Breakup; SAE International: Warrendale, PA, USA, 1987. [Google Scholar]
- Lee, S.-J.; Baek, S.-J. The effect of aspect ratio on the near-field turbulent structure of elliptic jets. Flow Meas. Instrum. 1994, 5, 170–180. [Google Scholar] [CrossRef]
- Salvador, F.J.; Gimeno, J.; Pastor, J.M.; Martí-Aldaraví, P. Effect of turbulence model and inlet boundary condition on the Diesel spray behavior simulated by an Eulerian Spray Atomization (ESA) model. Int. J. Multiph. Flow 2014, 65, 108–116. [Google Scholar] [CrossRef] [Green Version]
- Yu, S.; Yin, B.; Deng, W.; Jia, H.; Ye, Z.; Xu, B.; Xu, H. Experimental study on the spray characteristics discharging from elliptical diesel nozzle at typical diesel engine conditions. Fuel 2018, 221, 28–34. [Google Scholar] [CrossRef]
- Pastor, J.V.; Arrègle, J.; Palomares, A. Diesel spray image segmentation with a likelihood ratio test. Appl. Opt. 2001, 40, 2876–2885. [Google Scholar] [CrossRef] [PubMed]
- Chen, N.; Yu, H. Mechanism of axis switching in low aspect-ratio rectangular jets. Comput. Math. Appl. 2014, 67, 437–444. [Google Scholar] [CrossRef]
- Abramovich, G.N. On the deformation of the rectangular turbulent jet cross-section. Int. J. Heat Mass Transf. 1982, 25, 1885–1894. [Google Scholar] [CrossRef]


| Types of Fuel | Density (kg/m3) | Surface Tension (N/m) | Dynamic Viscosity (mPas) | Kinematic Viscosity (mm2/s) (40 °C) | Vapor Pressure |
|---|---|---|---|---|---|
| Diesel | 830 | 0.0273 | 2.7 | 2.57 | 0.1 kPa at 40 °C |
| RP032MC068 (hybrid biofuel) | 882 | 0.032 | 5.2 | 5.9 | 1 hPa at 133 °C |
| Nozzle Type |  Circle | 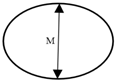 Elliptical A |  Elliptical B |
|---|---|---|---|
| Major Axis (M) (mm) | 0.160 | 0.170 | 0.189 |
| Minor Axis (m) (mm) | 0.160 | 0.142 | 0.135 |
| Aspect ratio (M/m) | 1 | 1.2 | 1.4 |
| Area (mm2) | 0.02 | 0.019 | 0.02 |
| Orifice length (mm) | 1.23 | 1.23 | 1.23 |
| Engine Type | 2.2-L Turbocharged DI Diesel Engine | In-line, Turbocharged, Intercooled |
|---|---|---|
| Cylinder number-Bore × Stroke (mm) | 4-86 × 94.6 | 6-110 × 115 |
| Rated Power/Speed (kW/r/min) | 155/3800 | 155/2300 |
| Maximum Torque/Speed (N·m/r/min) | 360/1500 | 680/1400 |
| Minimum brake specific fuel consumption BSFC (g/kW·h) | 222 | 205 |
| The nozzle hole diameter of injectors (mm) | 0.12 | 0.17 |
| Boundary | Boundary Conditions |
|---|---|
| Injection pressure | 50 MPa, 100 MPa, 180 MPa |
| Backpressure | 1 MPa, 3 MPa |
| Ambient air temperature | T = 300 K |
| After start of injection (ASOI) | 0–1 ms |
© 2019 by the authors. Licensee MDPI, Basel, Switzerland. This article is an open access article distributed under the terms and conditions of the Creative Commons Attribution (CC BY) license (http://creativecommons.org/licenses/by/4.0/).
Share and Cite
Ishak, M.H.H.; Ismail, F.; Che Mat, S.; Abdullah, M.Z.; Abdul Aziz, M.S.; Idroas, M.Y. Numerical Analysis of Nozzle Flow and Spray Characteristics from Different Nozzles Using Diesel and Biofuel Blends. Energies 2019, 12, 281. https://doi.org/10.3390/en12020281
Ishak MHH, Ismail F, Che Mat S, Abdullah MZ, Abdul Aziz MS, Idroas MY. Numerical Analysis of Nozzle Flow and Spray Characteristics from Different Nozzles Using Diesel and Biofuel Blends. Energies. 2019; 12(2):281. https://doi.org/10.3390/en12020281
Chicago/Turabian StyleIshak, M.H.H., Farzad Ismail, Sharzali Che Mat, M.Z. Abdullah, M.S. Abdul Aziz, and M.Y. Idroas. 2019. "Numerical Analysis of Nozzle Flow and Spray Characteristics from Different Nozzles Using Diesel and Biofuel Blends" Energies 12, no. 2: 281. https://doi.org/10.3390/en12020281