1. Introduction
Research in renewable energy has recently received great attention. Especially for photovoltaic (PV) technology, renewable energy has gained popularity as one of the potential avenues due to unlimited power resources and unpolluted operation [
1]. To enhance the efficiency of PV, the effect of weather conditions must be considered. According to research by Patel and Agarwal [
2], there are two main parameters which affect the PV-generated power, irradiation and temperature; where PV technology is installed, the generated power varies from location to location. It is apparent that we cannot control the two aforementioned parameters; therefore, the problem of “PV mismatch” can occur.
PV mismatch is defined as the difference between the expected and actual output power from a PV module, causing difficulties in PV technology generating power. Classified according to its source, mismatch can be internal or external. If PV power degradation occurs due to the quality of the panel, such as aging and impurities in the Silicon crystal, the mismatch is considered internal as it stems from the material’s properties, and product replacement can solve the issue. However, if degradation occurs due to an environmental factor, mainly shading from PV alignment and the surroundings, the mismatch is considered external. The effect from shading has also been pointed out by Femia et al. [
3] and Gao et al. [
4] who considered shaded PV panel a significant obstacle in the rapid growth of solar PV systems. The study by Eftichios et al. [
5] offers a practical case study through PV rooftop systems in Germany, where 41% of the installed panels had been affected by shading, with energy losses up to 10%. Hence, remarkable reduction of power generated was observed. In the same manner, Daraban et al. [
6] presented a case study of 13 different PV power tracking systems operating under a shading condition, where the result showed up to 70% of power was a loss due to not detecting the actual maximum power.
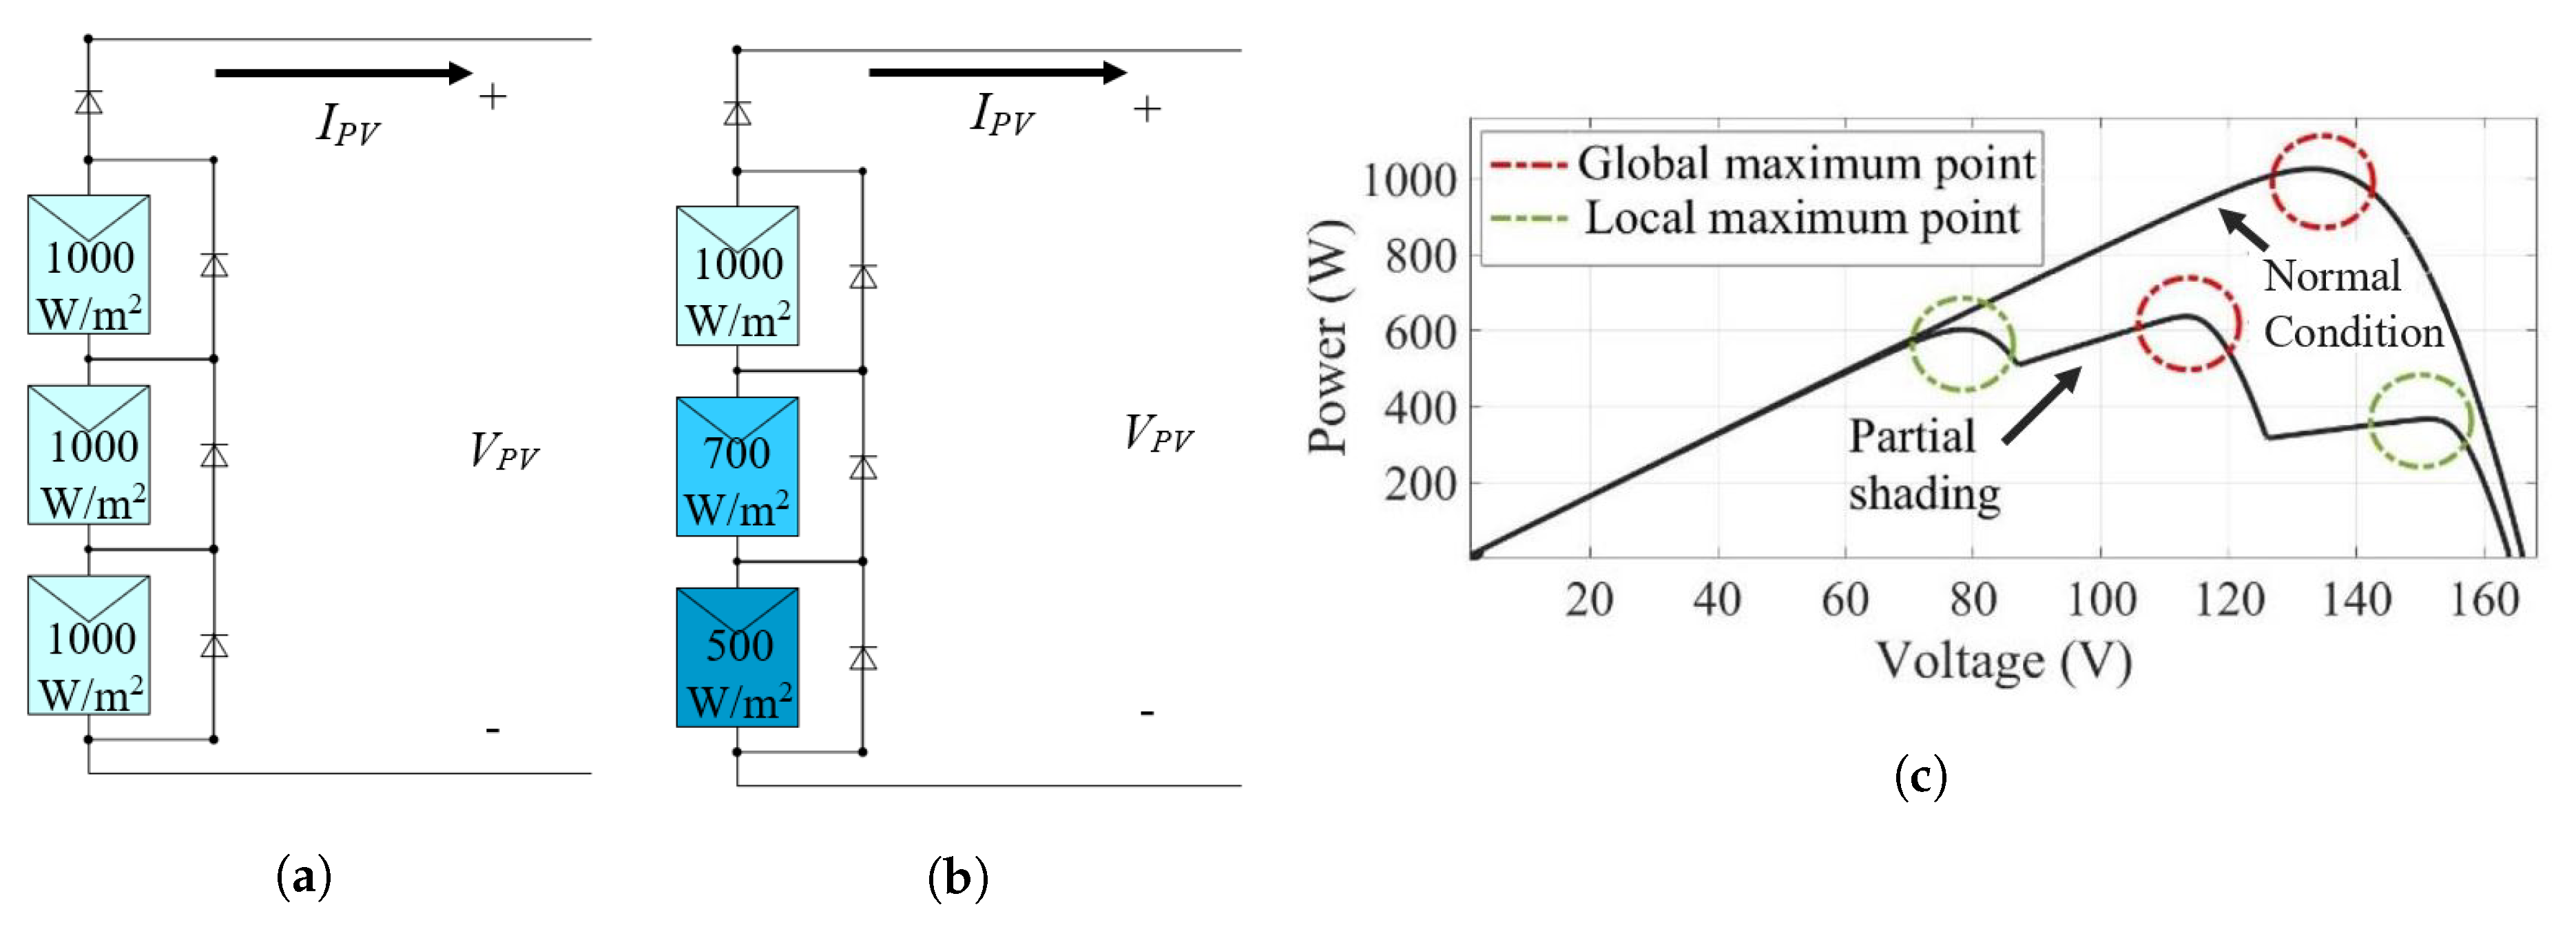
In electrical engineering, PV operating current and voltage form a non-linear relationship, demonstrated as the current-voltage (I-V) and power-voltage (P-V) characteristic curve.
Figure 1a,b presents the series-connected PV array operated at a normal condition and with partial shading. Here, the bypass diodes were installed on each panel and a blocking diode was installed on each PV branch to reduce the effect of shading [
2,
7,
8]. The I-V and P-V characteristic curves corresponding to each condition are shown in
Figure 1c. Here, we can observe the significant difference between the two conditions is that shading exhibits multiple local peaks, while the normal condition shows only a single peak. Naming each peak as the local power peak with the highest among all points as the global power peak increases the challenge for the maximum power point tracking (MPPT) system to locate the correct global power peak point [
2,
9,
10,
11].
Under shading conditions, it has been confirmed by previous research that conventional MPPT methods fail to ensure successful and precise tracking of the global power peak [
6,
9,
10,
11,
12]. Consequently, the difficulties in implementing MPPT include the complexity of the algorithm, cost, and failure while operating in shading conditions [
5]. Studies of global power peak identification under shading conditions have been done, especially in the past five years; each study presented a tracking method with a variation of complexity, cost, operating speed, and range of effectiveness [
12]. These variations should be taken into consideration when designing an effective MPPT system [
4].
Mainly, previous MPPT techniques can be distinguished into two categories, differentiated based on the method of implementation. The first category originates from the improvement of the existing conventional tracking method; these include the well-known MPPT techniques but with further modification (for instance, perturb and observe (P&O) and incremental conductance (InC) [
13]). Research in References [
14,
15,
16,
17] confirms the effectiveness of the conventional methods that can locate the correct global power peak. The second category istopologies based on the intelligence computing method. Since 2015, these intelligence methods have been used to solve the maximum power point (MPP) tracking problem under the shading situation. Examples include the fuzzy logic-based MPPT, artificial neural networks (ANN), and the artificial bee colony presented by Bidyadhar et al. [
18] and Kinattigal et al. [
19].
Focusing on the conventional method, Reference [
14] guarantees that scanning could locate the global power peak, and the region the local power peak should be established between 75% to 80% of PV total open circuit voltage
. By setting the scan point as the multiple of 75% of the PV module open-circuit voltage, the global power peak can be obtained. However, the disadvantage is the requirement of samples and the tracking time consumption. Studies have continued to investigate other tracking methods without scanning the whole P-V characteristic curve, for example: The presented work by Eftichios et al. [
5] shows how the global MPPT methods work by distributing PV load lines on the characteristic curve and reference points are indicated along these lines. The result shows the complete tracking results with higher efficiency compared with the PV scanning and particle swarm optimization (PSO), which is one of the optimization methods that can be a solution for the optimization problem using the concept modeled after bird folk’s behavior. Nonetheless, the work does not provide the time response result, and the implementation requires additional switching circuits, such as a flip-flop and a comparator.
The research performed by Hiren [
20] shows the remarkable tracking algorithm by setting the threshold to detect changes of power when shading happens and using the change of power concerning the voltage
to determine the tracking direction. The tracking algorithm was confirmed to be effective, but the simulation showed the result only in short-term, with the practical long-term result for more than 30 seconds not indicated. A similar prospect presented in Reference [
4] also used the slope calculation trend of the P-V curve to indicate the peaks for small-scale PV devices. The result confirmed the success in tracking after tests lasting up to one hour during a rapid change of irradiation; however, this study does not present the analysis for medium to large scale PV systems with a capacity more than 1 kW.
The proposed method by Jubaer [
21] discussed the disadvantage of P&O algorithm due to its oscillating response when operating in rapid irradiation change. The paper also proposed equations to detect power deviation, which are used together with the tracking algorithm; however, the computation contains many checking parameters which complicate programming, and the paper does not focus on the long-term operation principle. Further research by Korey [
22] presents global MPPT tracking based on P&O, experimented with three PV panels connected in series. The results showed successful tracking, but oscillation still existed, and the quantity of the power generated was not analyzed. Research by Alik et al. [
14] used the concept of P&O with an additional checking algorithm to track the global MPP. The simulation was tested for the short-term changes om irradiation; however, it did not mention the changes in temperature and practical experiments. Additionally, the proposed variable step perturb and observe (PO) and global scanning method (VSPO&GS) method by Duan et al. [
16] contributed more tracking speed and accuracy. The drawback is that the simulation result was not compared with other conventional or global MPP methods; as a result, its efficiency could not be determined. The research by Başoğlu [
17] proposed an excellent concept for improving, scanning, which included the “full scanning” and “large scanning” methods. Both methods limit the scanning interval, shortening it, and can guarantee the effectiveness of the algorithm, but similar to other reviewed papers, long-term testing was not presented, except for Reference [
20], which supports the ineffectiveness of the conventional tracking method, which cannot guarantee the accuracy of MPPT during shading conditions. The algorithm proclaims the first tracked peak as the global MPP until the change of irradiation and temperature happen, causing the tracking error in the system.
In order to simplify the complicated tracking system, there is a number of previous studies that present interesting aspects. Developed by Kobayashi et al. [
23] and Irisawa et al. [
24], two-stage maximum power point tracking control is proposed. In the first stage, the optimum operating point of the PV system is controlled to converge the MPP; afterward, the second stage operates to move closer to the real MPP. The work still faces the same problem when operating under some non-uniform irradiation conditions. Moreover, an additional control circuit is also required. Alternatively, Bekker [
25] presents the optimal MPPT method using the open-circuit voltage sweep along the P-V curve, but the loss from tracking is still present. The method by Nguyen [
26] shows the adaptive reconfiguration scheme to reduce the effect of shading; consequently, the switching matrix is connected to the adaptive solar bank. The result confirms the real-time operation; however, this requires additional switches and sensors in proportion to the size of the PV array. Reference [
27] proposes control topology for the bidirectional DC-DC converter implemented in parallel connection, where the objective is to reduce the effect of shading on the other PV modules. However, the drawbacks are the requirement of extra hardware and additional cost. Finally, Uno [
28] presents the current-sensorless and
V-controlled optimization in order to reduce the number of switches and sensors in the system. Only the additional control system for the gate driving system is necessary.
As for other intelligence tracking methods proposed in many research papers, they show the guarantee for tracking MPPT in shading conditions. Nonetheless, the significant disadvantages of the intelligence technique are the requirement of additional circuits, the added complexity, and high implementation cost [
4]. Research by Yuan [
29] proposes adaptive inertial weight particle swarm optimization (AWIPSO) based on the original PSO method. The method has the flexibility to adjust weight coefficient parameters, which can increase the speed of tracking. The algorithm was confirmed using the simulation; however, the experimental results were not included. In References [
30,
31,
32], MPPT from a PSO approach was also demonstrated, which shows the accuracy from the simulation and experimental results. Nonetheless, the work by Miyatake et al. [
30] requires a separate converter per one module, causing the extra cost. Additionally, using PSO, the first difficulties are the calculation for the related variables, precision in setting, and the requirement of cooperative agents and learning factors [
10,
32]. Apart from PSO, Alajmi et al. [
33] present how a modified fuzzy-logic controller can be implemented. Correspondingly, the design is based on a diode model equation of the PV panel, combining with the modified fuzzy-logic from the hill-climbing method. However, the system requires thirty-two fuzzy control rules, which add more complexity to the system.
In practice, most of the commercial PV inverters used in PV installation used the scanning, P&O and InC algorithm to track the maximum power point [
10]. From the technical specification of PV inverters, scanning is set to be every 15 min of the time interval [
34,
35]. The problem with this topology is that it is difficult to predict the irradiation and temperature changes in a day. The scanning interval might not match the weather conditions. By choosing a long scanning interval on the day with the rapid change of weather, tracking error may occur due to the mismatch of the selected interval. Additionally, by choosing a short scanning interval on the day with a steady change of irradiation and temperature, power loss from the unnecessary tracking is achieved. Similarly, the scanning requires tracking time, which leads to more power loss [
36]. As a result, the main properties established to implement successful MPPT in shading conditions should include high efficiency and simple implementation [
19]. Previously reviewed research presents the analysis of conventional scanning for commercial inverters and its weakness when the setup does not match the weather conditions. Although the system includes the blocking and bypass diodes to prevent heating and damage, the considerable decrease of power from shading still occurs.
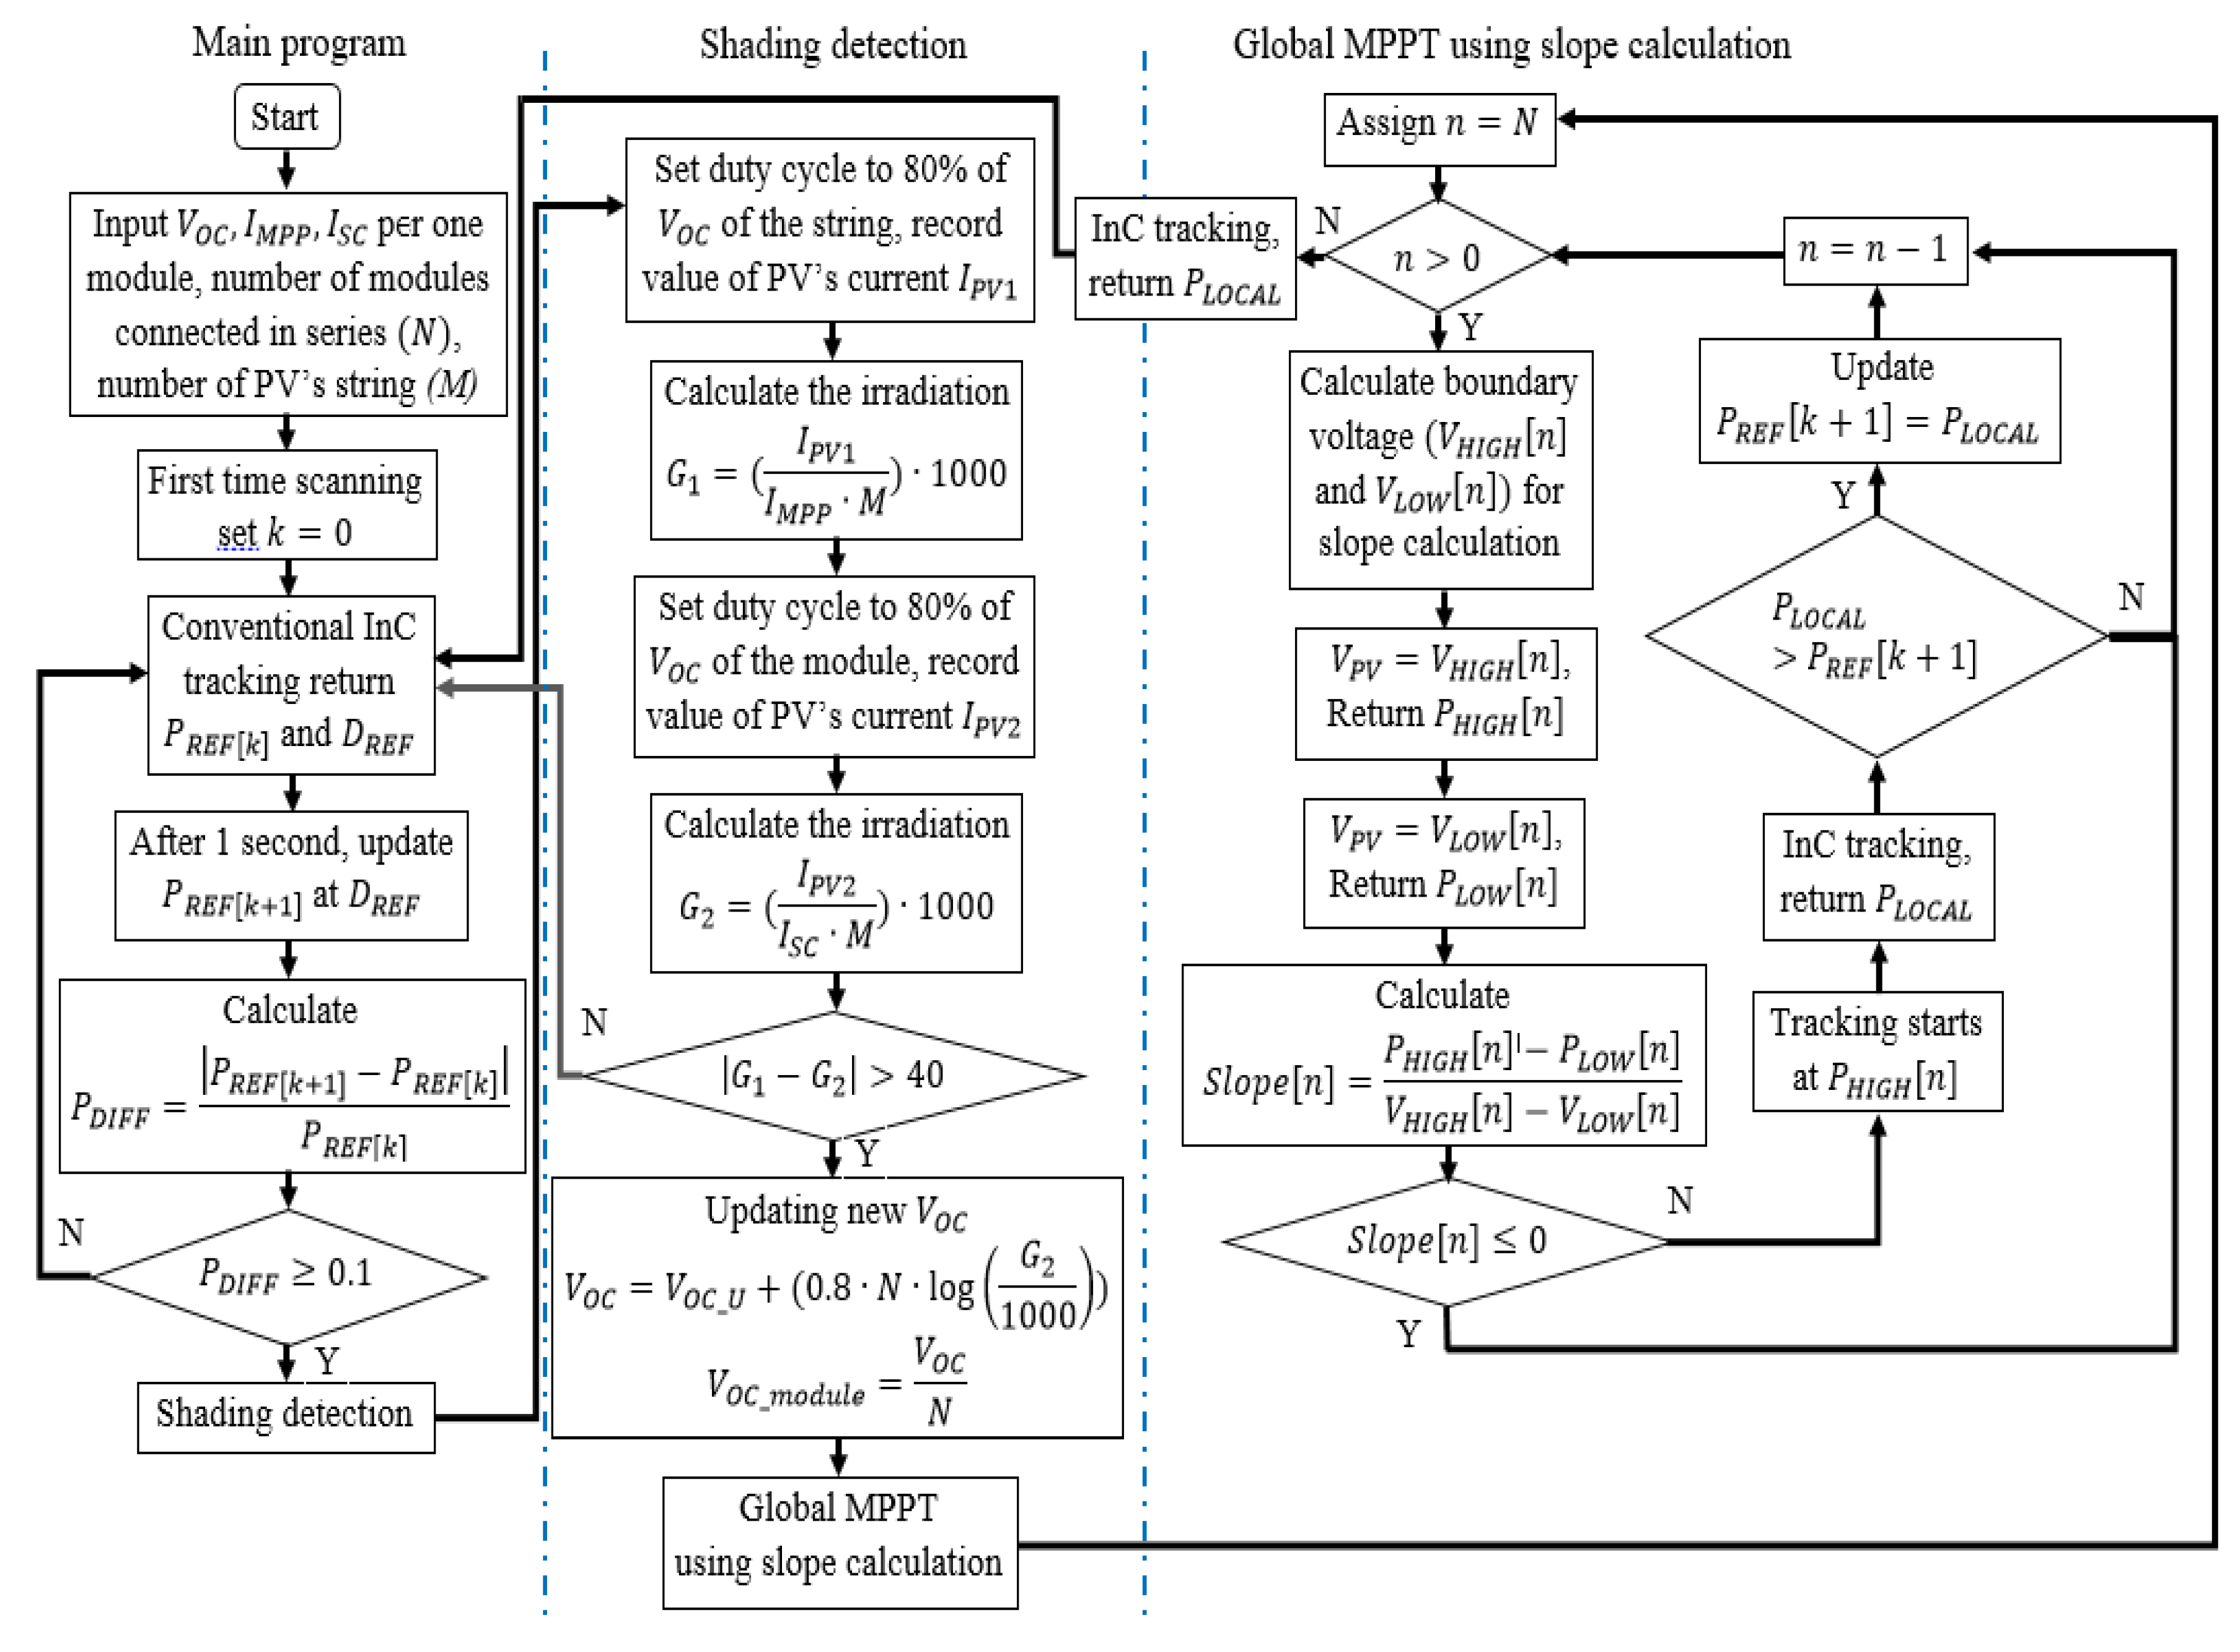
This paper presents the original idea of studying the patterns of the P-V characteristic curve to design the new tracking method. Studies of I-V and P-V characteristic curves from several PV panels are simulated. The I-V curves are used to study the relationship between the irradiation and PV current in order to design the shading detection algorithm (the full explanation of the methods is in
Section 3.2.2), whereas the P-V curves are used to design the MPP tracking (explained in
Section 3.2.4). Although these patterns vary due to many factors from different PV module specifications, the typical pattern among the curves was found. The proposed algorithm uses the simple concept of mountain climbing to search the mountain’s peak, in order to locate the local and global power peaks without scanning the whole curves. This idea is new and not shown in other papers. Moreover, in order to evaluate the performance of the tracking algorithm, it is suggested by Miyatake et al. [
30] to use the real measured data and test for several hours. Since most of the papers on MPPT show only the short-term response and focus on the time used for tracking, in this case, the author uses real weather data from the author’s institution to perform a long-term case study [
37]. In conclusion, this paper’s contribution includes the following advantages:
The accuracy of global MPP tracking;
the fast-tracking time with less tracking power loss compared to the conventional scanning method;
the ability to operate at dynamic changes of shading and weather conditions;
no irradiation and temperature sensors required;
no additional control circuits required;
simple switching control using the centralized converter;
simple control topology compared to the intelligence tracking methods .
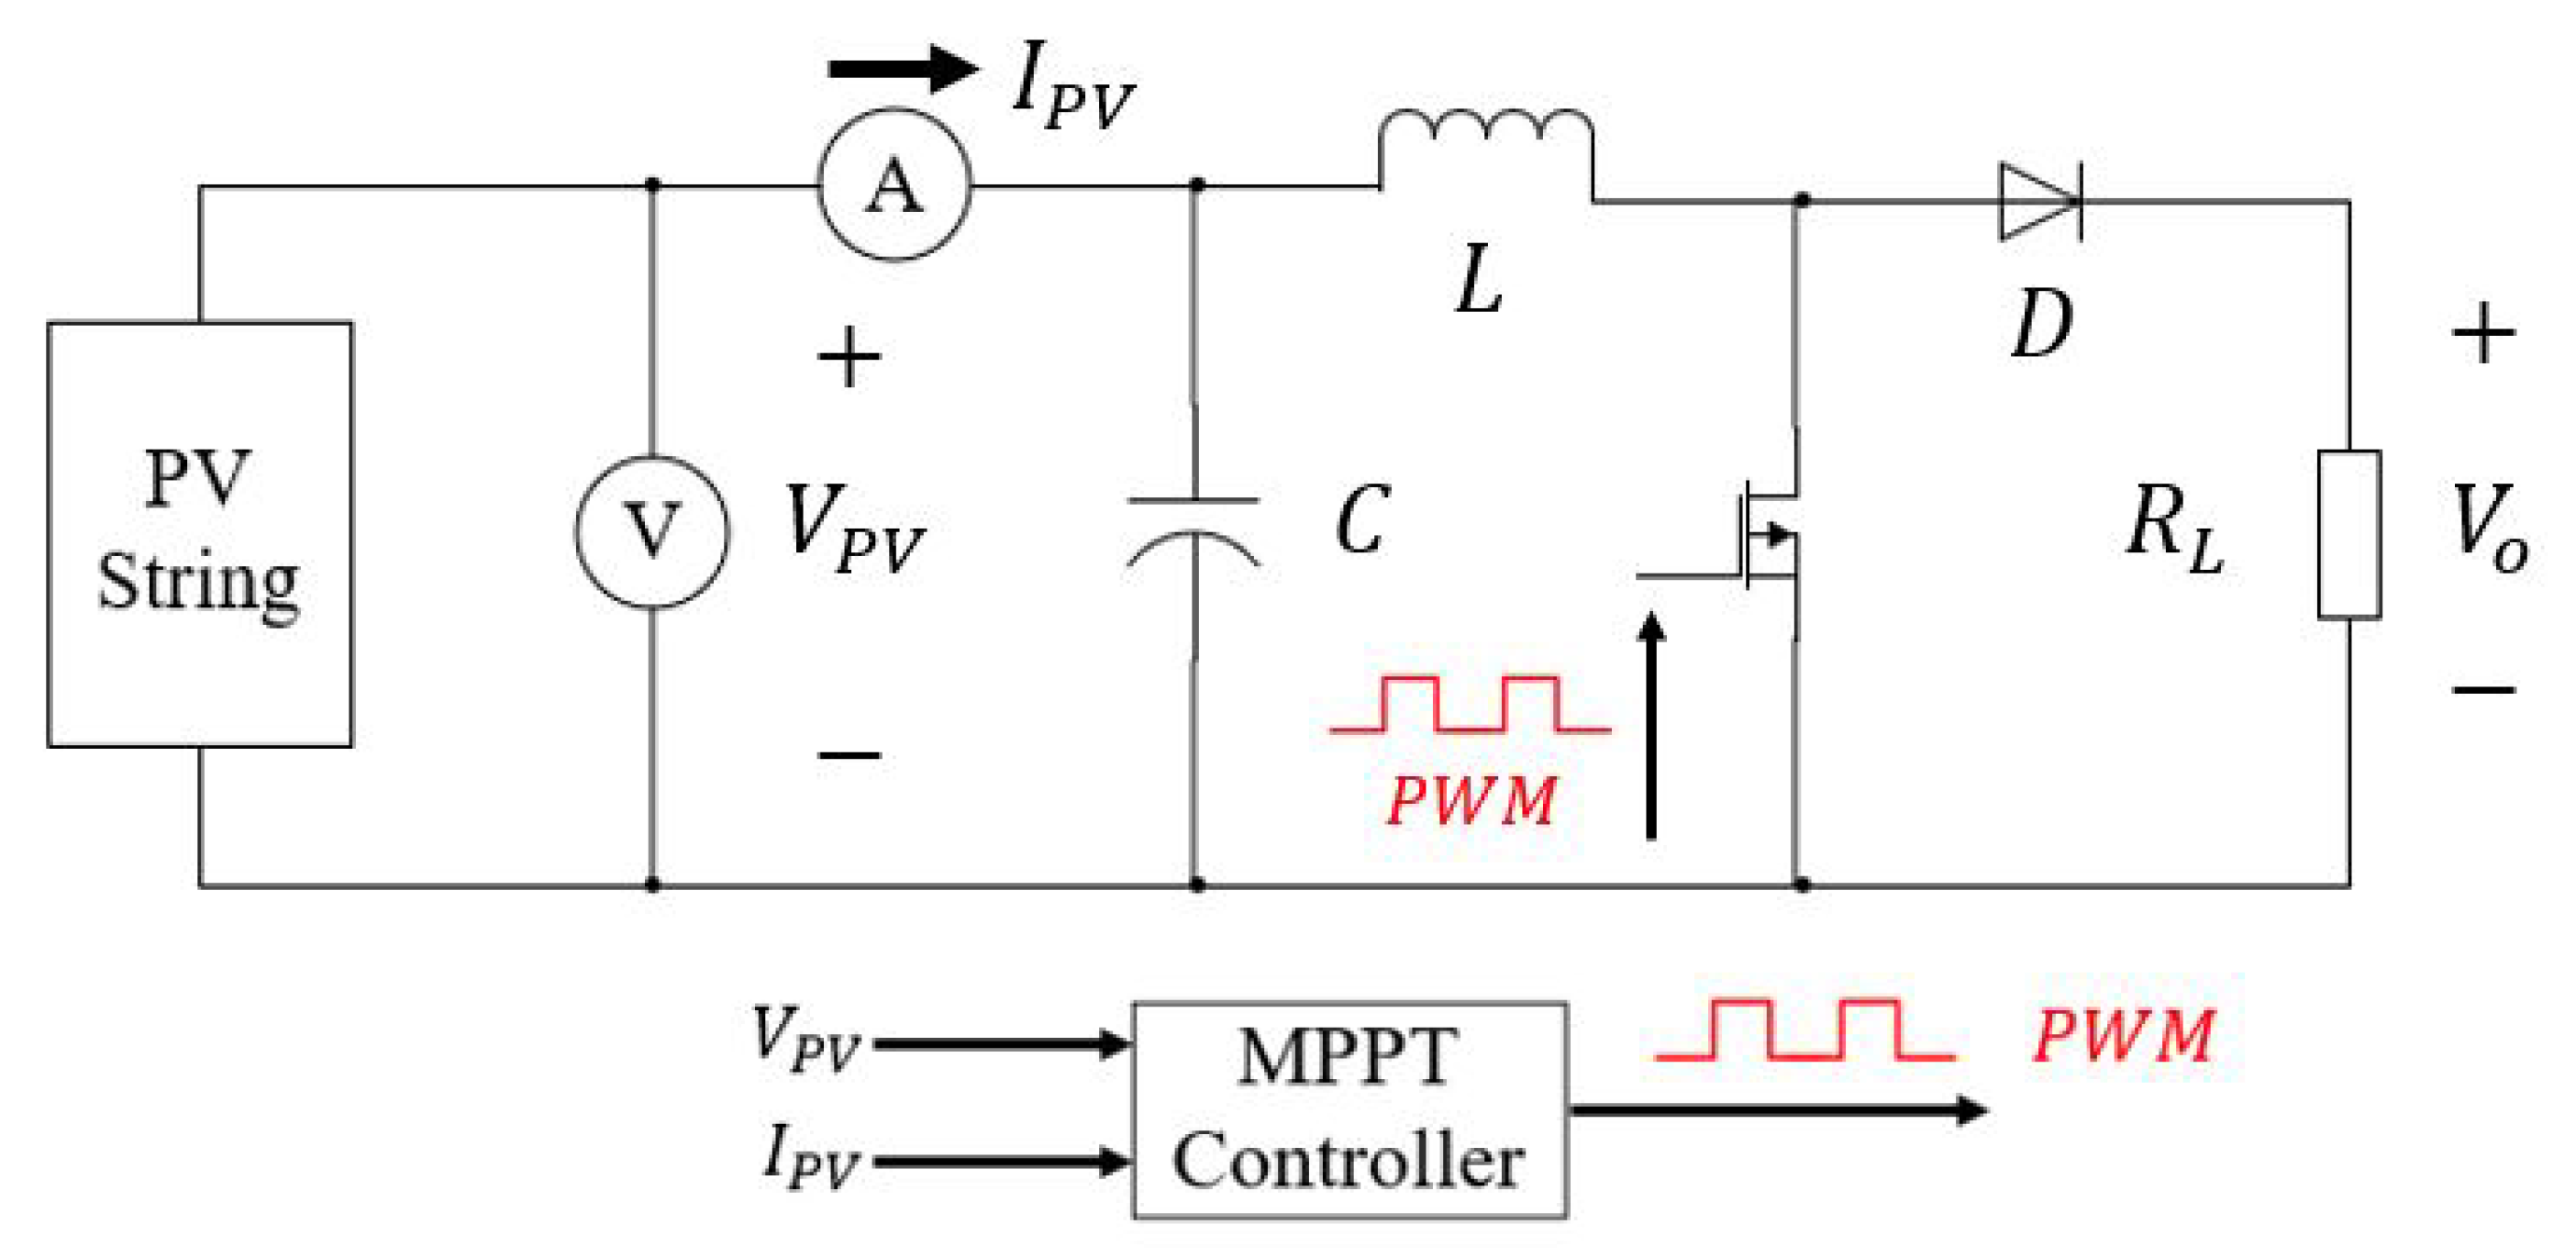
The usefulness of this research is that the proposed algorithm can be used to track the PV power in both ordinary and partial shading conditions. Additionally, the implementation can be done with the conventional DC-DC boost converter, meaning it can be used in practice for small- to medium-scale PV array. The proposed algorithm is described using mathematical equations with flowcharts and examples for better understanding.
2. Partial Shading Condition for PV Systems
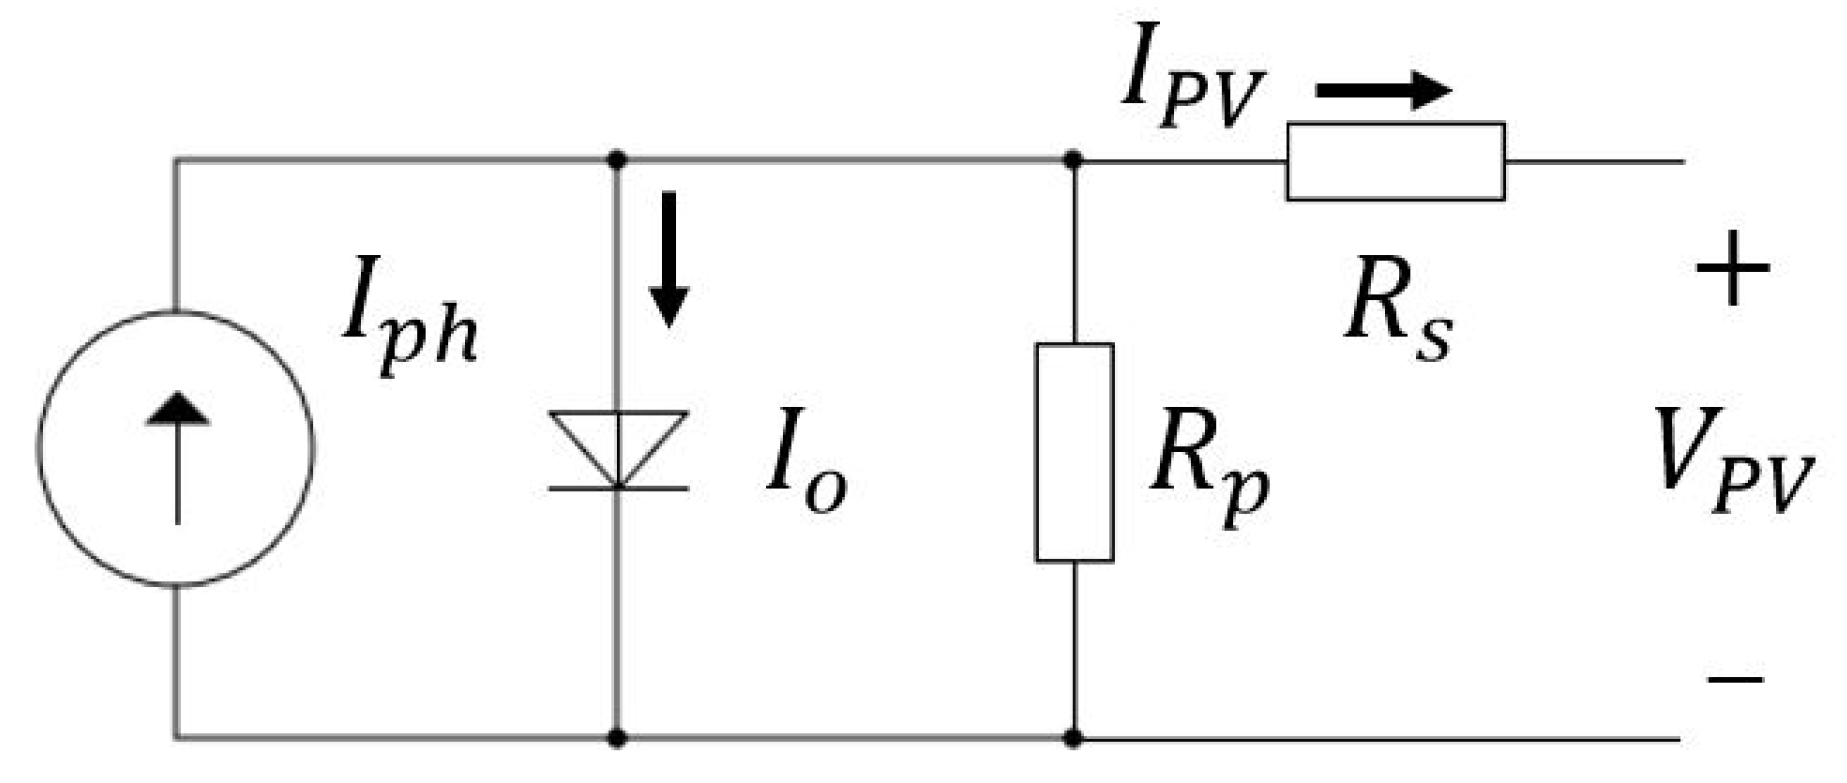
An ideal PV module can be modelled as a single diode equivalent circuit [
38]. Equation (
1) represents the mathematical relationship between the PV module current
and other related parameters [
39].
Figure 2 shows the single diode equivalent circuit, including a current source
connected antiparallel with a diode, including series resistor
and parallel resistor
.
From Equation (
1),
is the PV’s current of the module in standard test conditions (STC),
is the temperature coefficient of current,
G is the solar irradiation measured in
and
is the nominal solar irradiation (1000
). From the equation, we can observe the directly proportional relationship between
G and
in that the higher the irradiation, the more PV current is measured. However, when irradiation decreases due to shading, the current reduces. In addition, Equation (
2) represents the calculation of the PV module’s open-circuit voltage
[
20]:
where
is the PV module’s open-circuit voltage,
is the temperature coefficient of voltage,
T represents temperature and
is the temperature at STC (25 °C). Additionally,
a is the diode ideality constant and
is voltage constant. It is shown in the equation that open-circuit voltage varies with both irradiation and temperature; by assuming the last term of Equation (
2) to be very small, the temperature level is the primary cause for the variation of PV’s open-circuit voltage value. Likewise, it is shown from Equations (1) and (2) that the operation of PV varies with irradiation and temperature [
40].
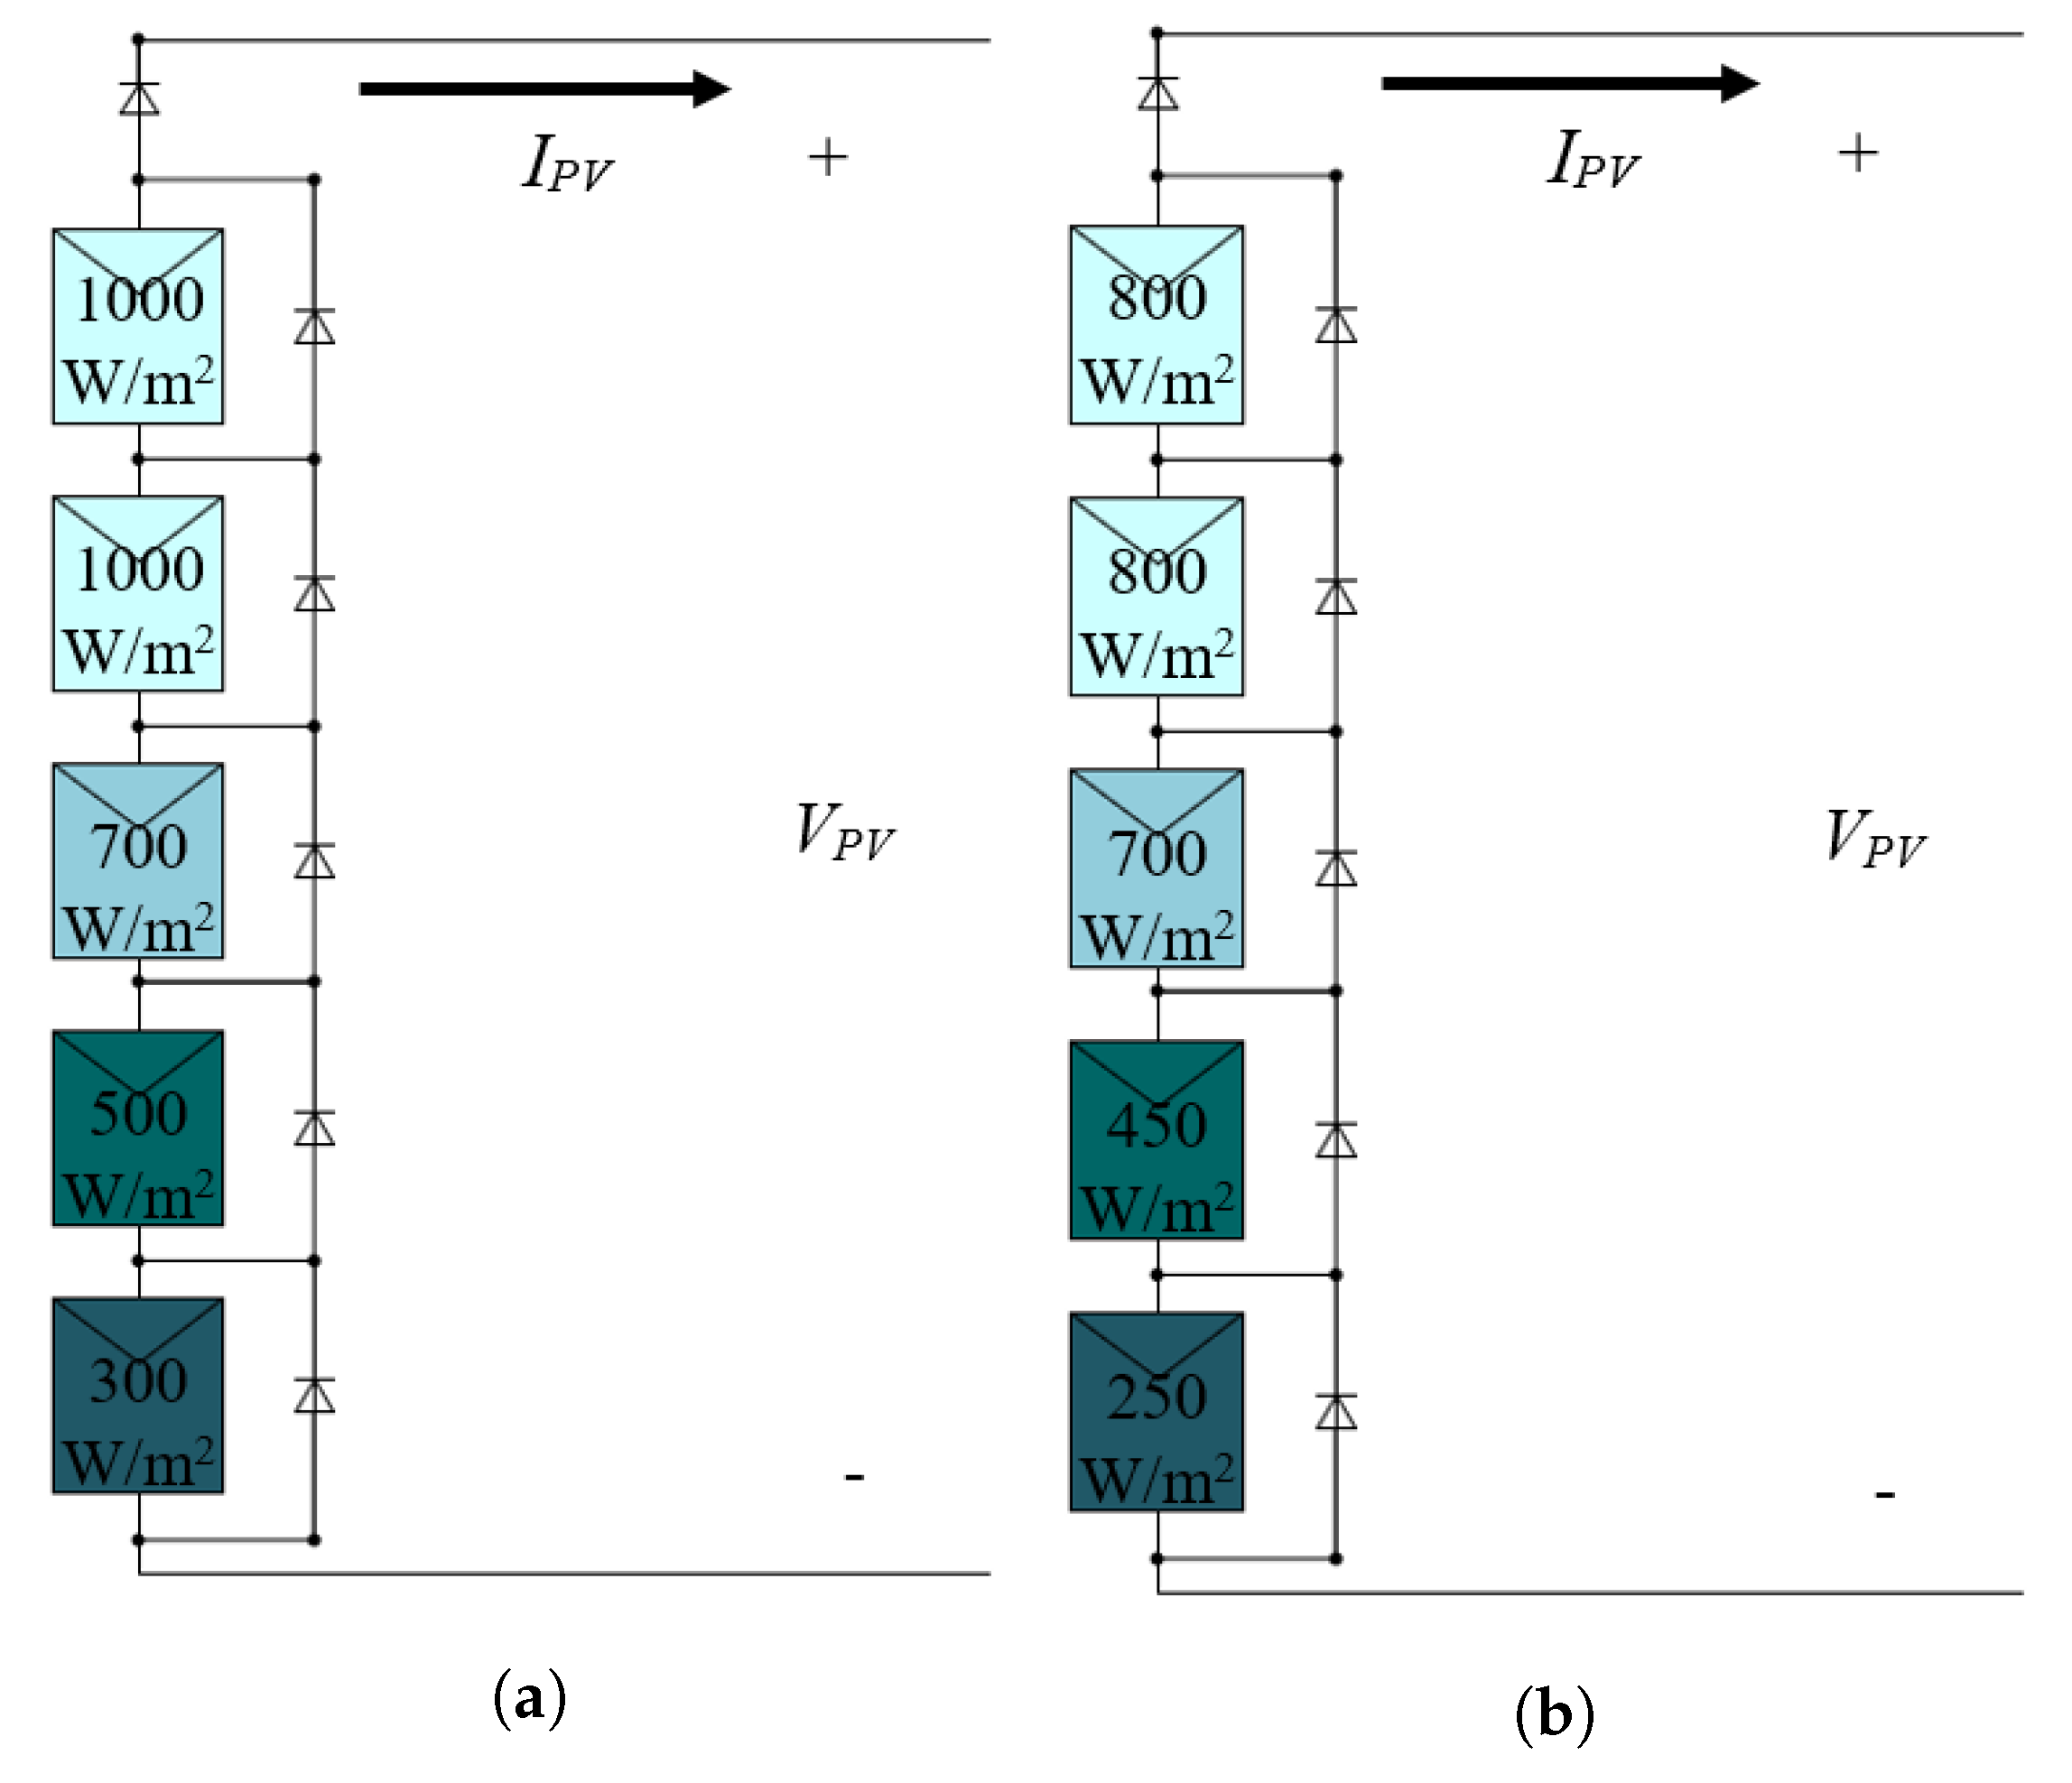
In order to design an effective MPPT algorithm, more than 20 samples of P–V characteristic curves were analyzed.
Figure 3 shows series-connected PV modules with different patterns of irradiation and temperature, specified as pattern A and B, where the temperature for each pattern is 25 °C and 30 °C, respectively.
Regarding the review states in the introduction, conventional MPPT algorithms cannot distinguish the local and global maximum point existing on the P-V characteristic curve; this contributes to the complexity in tracking the correct maximum point. Additionally, a variation in PV current and voltage happens to the system when there is partial shading, causing the conventional MPPT not to be able to detect the changes. The interesting information obtained from the samples is that although the P-V curve has more than one maximum power point, each power peak, including local and global maximum points, exists at multiples of 70% to 85% of the PV module’s open-circuit voltage except for two rightmost sections of the curve, where the peak exists between 75% and 95%. We varied the PV module’s specifications from the manufacturer (Canadian Solar Cs5C-90M, Guelph, ON, Canada; Trina Solar TSM-170D, Changzhou, China and Jinko Solar JKM310M-72, Shanghai, China) using pattern A and B in
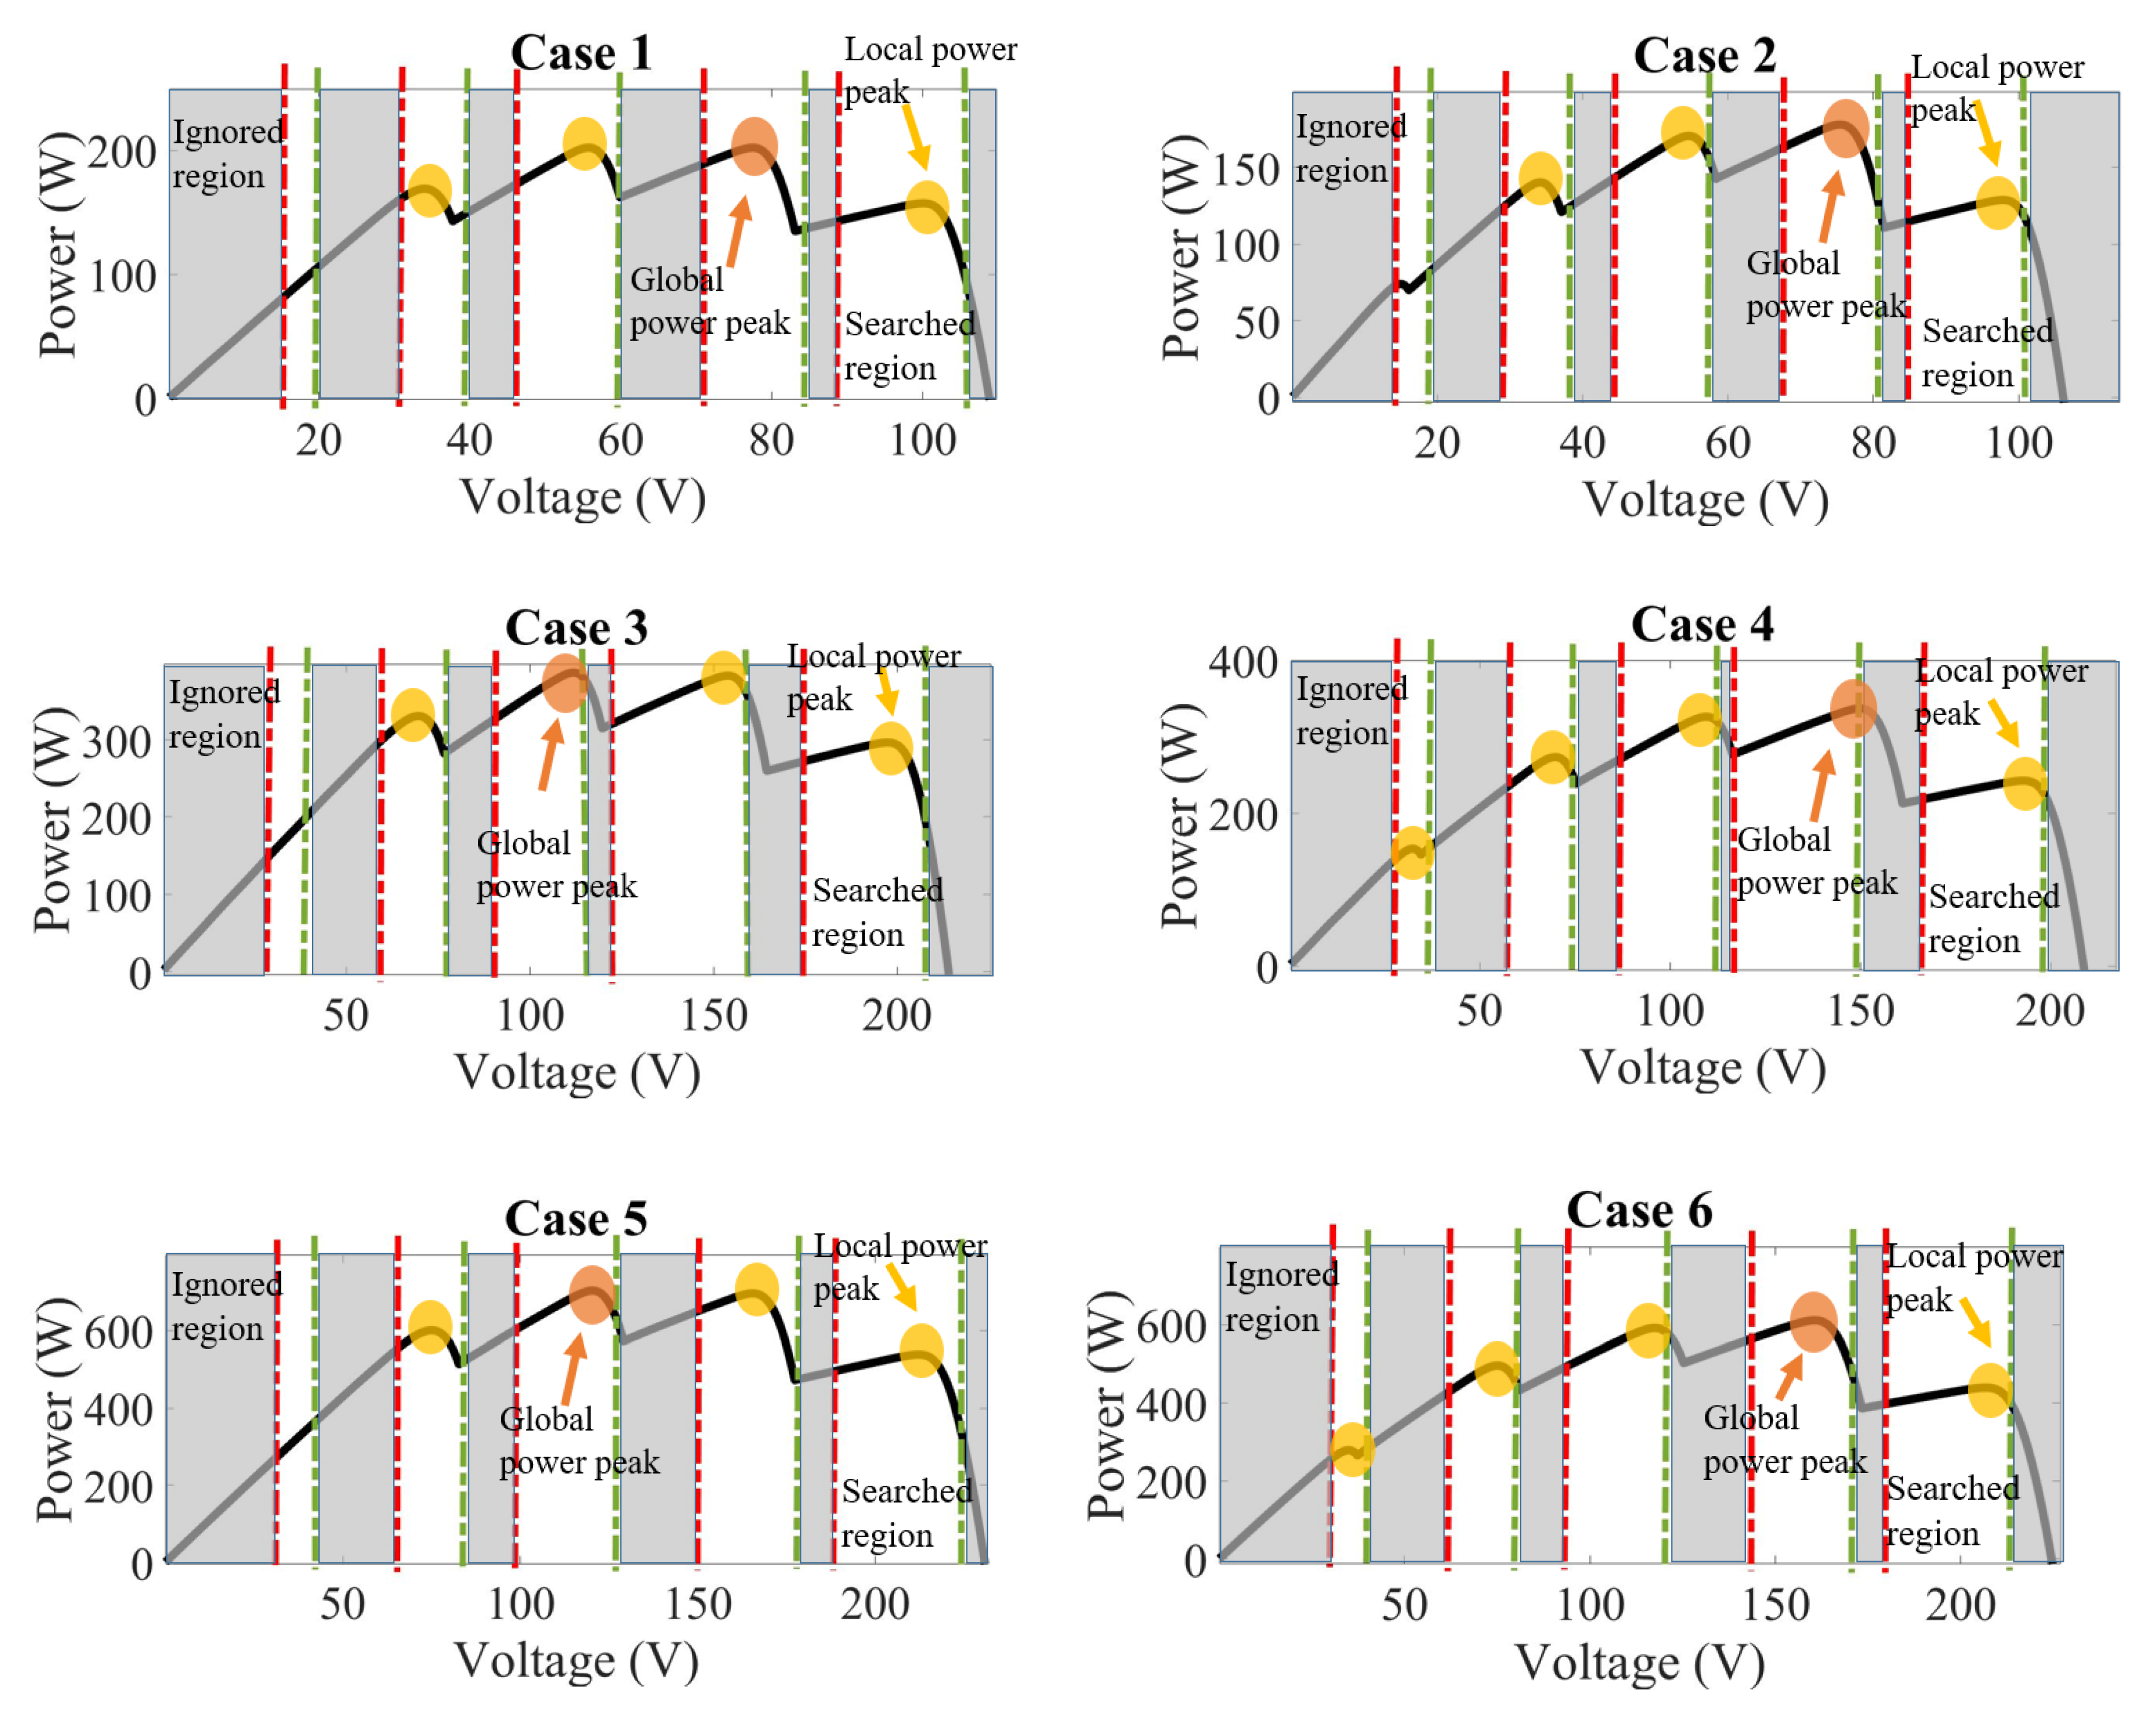
Figure 3, because studies can distinguish to six cases. P-V characteristic curves of all cases, including power peaks, are shown in
Figure 4, and the summarized information is shown in
Table 1.
Figure 4 presents tests with three different PV modules, varying the irradiation and temperature; the power peak, including local and global, exists in the explained highlighted searched regions. We can also observe from
Table 1. that the increase of temperature brings less measured
, which verifies the P-V characteristics explained in Reference [
13]. We can observe that although the location of global power peak varies in each pattern, the peaks still exist within the searched region. Thus, it is not necessary to search the whole regions of the P-V characteristic curves; the scanning area can be limited.


